Goal Objective - Brick Township Municipal Utilities Authority
30
Table 1-1 Final Goals and Objectives for the Development of a Metedeconk River Watershed Protection Restoration Plan Goal Objective Improve natural freshwater flows 1 Provide a sustainable water supply to the human population while maintaining natural water regimes Promote water conservation and implement water re‐use demonstration projects (i.e., fully functioning with educational components) on public properties (e.g., golf courses and other public facilities) Reduce stormwater flow via implementation of projects on public facilities and redevelopment projects Reduce nitrogen, phosphorus, pathogens, tds and tss Implement TMDLs (reference existing 303d list and develop priority implementation schedule with NJDEP and USEPA) Prevent habitat loss and support habitat restoration within riparian buffers to preserve and improve regional biodiversity Address data gaps for groundwater and tributary water quality within the Metedeconk River watershed Protect and restore critical wildlife habitat and natural lands identified by NJDEP, Trust for Public Land, Rutgers University, Ocean County Natural Lands Trust and others (e.g. riparian areas, forested areas, etc.) Minimize health risks to recreational contact water users from pathogens (i.e., make pathogen‐impaired waters a priority for TMDL implementation) Improve soil health for biological, chemical, and physical function; implement demonstration projects on public and/or priority properties 2 Ensure no degradation in water quality (i.e. maintain the Category One designation) and eliminate water quality impairments Identify multiple sources of funding for implementation of the plan Reduce nitrogen, phosphorus, pathogens and tss Reduce stormwater runoff to the bay Improve passive recreational access 3 Support the health of the Barnegat Bay Protect natural shoreline buffers and open space; implement buffer setback Reduce pathogen and phosphorus inputs 4 Improve the water quality of watershed lakes Address invasive plant species (e.g., identify priority species and develop management plans) and sediment accumulation (e.g., reduce stormwater runoff and protect shoreline buffers) Enlist involvement and support of all levels of government, specifically municipal and/or county planning and zoning boards and environmental commissions, stormwater coordinators, DPWs, etc., for sustained effectiveness in managing watershed resources Identify and encourage Low Impact Development standards appropriate for the Metedeconk basin Promote cooperation among the development community, such as board of realtors, shore builders assoc., etc., involved in watershed development Promote cooperation among various regulatory agencies involved in watershed resources and development Support Smart Growth standards and promote municipal participation in Sustainable NJ Support open space planning and preservation (work with towns and Green Acres to develop a plan for headwater protection) Work in concert with the Barnegat Bay Partnership and other organizations involved in education and outreach to: (1) expand the public’s understanding of the watershed, (2) encourage public participation and support of improving watershed health, and (3) promote public involvement in restoration activities Increase public understanding of the Metedeconk watershed and the role the public plays in its health 5 Promote education and outreach regarding watershed impacts from growth Involve stakeholders in defining problems, objectives and solutions
Transcript of Goal Objective - Brick Township Municipal Utilities Authority

Table 1-1 Final Goals and Objectives for the Development of a Metedeconk River Watershed Protection Restoration Plan
Goal Objective
Improve natural freshwater flows
1
Provide a sustainable water supply to the human population while maintaining natural water regimes
Promote water conservation and implement water re‐use demonstration projects (i.e., fully functioning with educational components) on public properties (e.g., golf courses and other public facilities)
Reduce stormwater flow via implementation of projects on public facilities and redevelopment projects
Reduce nitrogen, phosphorus, pathogens, tds and tss
Implement TMDLs (reference existing 303d list and develop priority implementation schedule with NJDEP and USEPA)
Prevent habitat loss and support habitat restoration within riparian buffers to preserve and improve regional biodiversity
Address data gaps for groundwater and tributary water quality within the Metedeconk River watershed
Protect and restore critical wildlife habitat and natural lands identified by NJDEP, Trust for Public Land, Rutgers University, Ocean County Natural Lands Trust and others (e.g. riparian areas, forested areas, etc.)
Minimize health risks to recreational contact water users from pathogens (i.e., make pathogen‐impaired waters a priority for TMDL implementation)
Improve soil health for biological, chemical, and physical function; implement demonstration projects on public and/or priority properties
2
Ensure no degradation in water quality (i.e. maintain the Category One designation) and eliminate water quality impairments
Identify multiple sources of funding for implementation of the plan
Reduce nitrogen, phosphorus, pathogens and tss
Reduce stormwater runoff to the bay
Improve passive recreational access 3
Support the health of the Barnegat Bay
Protect natural shoreline buffers and open space; implement buffer setback
Reduce pathogen and phosphorus inputs
4 Improve the water quality of watershed lakes Address invasive plant species (e.g., identify priority species and develop management plans)
and sediment accumulation (e.g., reduce stormwater runoff and protect shoreline buffers)
Enlist involvement and support of all levels of government, specifically municipal and/or county planning and zoning boards and environmental commissions, stormwater coordinators, DPWs, etc., for sustained effectiveness in managing watershed resources
Identify and encourage Low Impact Development standards appropriate for the Metedeconk basin
Promote cooperation among the development community, such as board of realtors, shore builders assoc., etc., involved in watershed development
Promote cooperation among various regulatory agencies involved in watershed resources and development
Support Smart Growth standards and promote municipal participation in Sustainable NJ
Support open space planning and preservation (work with towns and Green Acres to develop a plan for headwater protection)
Work in concert with the Barnegat Bay Partnership and other organizations involved in education and outreach to: (1) expand the public’s understanding of the watershed, (2) encourage public participation and support of improving watershed health, and (3) promote public involvement in restoration activities
Increase public understanding of the Metedeconk watershed and the role the public plays in its health
5
Promote education and outreach regarding watershed impacts from growth
Involve stakeholders in defining problems, objectives and solutions

Table 2-1Major Soil Types within the Metedeconk River Watershed
Soil Symbol Soil Name Runoff Class Drainage Class Hydrologic Group Taxonomic Class Order Erosion Potential Area within Watershed (acres)AtsA Atsion sand, 0 to 2 percent slopes Very high Poorly drained A/D Sandy, siliceous, mesic Aeric Alaquods Spodosols Low 8538.347834LasB Lakewood sand, 0 to 5 percent slopes Very low Excessively drained A Mesic, coated Spodic Quartzipsamments Entisols Low 7843.78903LakB Lakehurst sand, 0 to 5 percent slopes Very high Moderately well drained A Mesic, coated Aquodic Quartzipsamments Entisols Low 5995.469982EveB Evesboro sand, 0 to 5 percent slopes Very low Excessively drained A Mesic, coated Lamellic Quartzipsamments Entisols Low 5336.668902DocB Downer loamy sand, 0 to 5 percent slopes Very low Well drained B Coarse-loamy, siliceous, semiactive, mesic Typic Hapludults Ultisols Moderate 4688.176734KkgB Klej loamy sand, 0 to 5 percent slopes Very high Somewhat poorly drained B Mesic, coated Aquic Quartzipsamments Entisols Low 2510.212275BerAt Berryland sand, 0 to 2 percent slopes, frequently flooded Very low Very poorly drained B/D Sandy, siliceous, mesic Typic Alaquods Spodosols Low 2093.215248MakAt Manahawkin muck, 0 to 2 percent slopes, frequently flooded Negligible Very poorly drained D Sandy or sandy-skeletal, siliceous, dysic, mesic Terric Haplosaprists Histosols Low 1274.805901LasC Lakewood sand, 5 to 10 percent slopes Low Excessively drained A Mesic, coated Spodic Quartzipsamments Entisols Low 957.0471445GamB Galloway loamy sand, 0 to 5 percent slopes Very low Somewhat poorly drained A/D Mesic, coated Aquic Quartzipsamments Entisols Low 951.0009901BerAr Berryland sand, 0 to 2 percent slopes, rarely flooded Negligible Very poorly drained B/D Sandy, siliceous, mesic Typic Alaquods Spodosols Low 939.7269545EveC Evesboro sand, 5 to 10 percent slopes Low Excessively drained A Mesic, coated Lamellic Quartzipsamments Entisols Low 819.0344575DoeA Downer sandy loam, 0 to 2 percent slopes Very low Well drained B Coarse-loamy, siliceous, semiactive, mesic Typic Hapludults Ultisols Moderate 811.8644717UR Urban land 680.1344099EvuB Evesboro-Urban land complex, 0 to 5 percent slopes Very low Excessively drained A Mesic, coated Lamellic Quartzipsamments Entisols Low 614.3812EveD Evesboro sand, 10 to 15 percent slopes Low Excessively drained A Mesic, coated Lamellic Quartzipsamments Entisols Low 576.4911525DoeB Downer sandy loam, 2 to 5 percent slopes Very low Well drained B Coarse-loamy, siliceous, semiactive, mesic Typic Hapludults Ultisols Moderate 569.8421627UdauB Udorthents-Urban land complex, 0 to 8 percent slopes Medium Well drained D Udorthents Entisols Moderate 467.1582848DofgB Downer gravelly sandy loam, gravelly substratum, 2 to 5 percent slopes Very low Well drained B Coarse-loamy, siliceous, semiactive, mesic Typic Hapludults Ultisols Moderate 358.9580497PssA Psamments, 0 to 3 percent slopes Very low Well drained A Mesic Psamments Entisols Low 324.3162221

Table 2-2Soil Types by HUC14 within North Branch Watershed
HUC Symbol Soil Name Runoff Class Drainage Class Hydrologic Group Erosion Potential Acres % of Soil in HUC14AtsA Atsion sand, 0 to 2 percent slopes Very high Poorly drained A/D Low 1991.2 36%LakB Lakehurst sand, 0 to 5 percent slopes Very high Moderately well drained A Low 1120.8 20%LasB Lakewood sand, 0 to 5 percent slopes Very low Excessively drained A Low 796.3 15%EveB Evesboro sand, 0 to 5 percent slopes Very low Excessively drained A Low 336.9 6%KkgB Klej loamy sand, 0 to 5 percent slopes Very high Somewhat poorly drained B Low 281.8 5%HumAt Humaquepts, 0 to 3 percent slopes, frequently flooded Negligible Poorly drained D Moderate 186.4 3%LasC Lakewood sand, 5 to 10 percent slopes Low Excessively drained A Low 110.4 2%EveD Evesboro sand, 10 to 15 percent slopes Low Excessively drained A Low 92.0 2%ThgB Tinton loamy sand, 0 to 5 percent slopes Very low Well drained A Moderate 90.1 2%CoeAs Colemantown loam, 0 to 2 percent slopes, occasionally flooded Negligible Poorly drained C/D Moderate 77.3 1%EveC Evesboro sand, 5 to 10 percent slopes Low Excessively drained A Low 68.4 1%DoeB Downer sandy loam, 2 to 5 percent slopes Very low Well drained B Moderate 67.3 1%LasB Lakewood sand, 0 to 5 percent slopes Very low Excessively drained A Low 1043.2 15%EveB Evesboro sand, 0 to 5 percent slopes Very low Excessively drained A Low 990.5 14%KkgB Klej loamy sand, 0 to 5 percent slopes Very high Somewhat poorly drained B Low 952.2 14%AtsA Atsion sand, 0 to 2 percent slopes Very high Poorly drained A/D Low 932.1 13%LakB Lakehurst sand, 0 to 5 percent slopes Very high Moderately well drained A Low 534.9 8%BerAt Berryland sand, 0 to 2 percent slopes, frequently flooded Very low Very poorly drained B/D Low 462.0 7%DocB Downer loamy sand, 0 to 5 percent slopes Very low Well drained B Moderate 435.8 6%LasC Lakewood sand, 5 to 10 percent slopes Low Excessively drained A Low 313.6 5%EvuB Evesboro-Urban land complex, 0 to 5 percent slopes Very low Excessively drained A Low 297.5 4%UdauB Udorthents-Urban land complex, 0 to 8 percent slopes Medium Well drained D Moderate 179.1 3%EveC Evesboro sand, 5 to 10 percent slopes Low Excessively drained A Low 143.9 2%HboA Hammonton sandy loam, 0 to 2 percent slopes Very high Moderately well drained B Moderate 84.7 1%GamB Galloway loamy sand, 0 to 5 percent slopes Very low Somewhat poorly drained A/D Low 69.8 1%EveD Evesboro sand, 10 to 15 percent slopes Low Excessively drained A Low 60.0 1%PssA Psamments, 0 to 3 percent slopes Very low Well drained A Low 47.0 1%DoeB Downer sandy loam, 2 to 5 percent slopes Very low Well drained B Moderate 46.7 1%AtsA Atsion sand, 0 to 2 percent slopes Very high Poorly drained A/D Low 1234.6 32%KkgB Klej loamy sand, 0 to 5 percent slopes Very high Somewhat poorly drained B Low 707.6 18%LasB Lakewood sand, 0 to 5 percent slopes Very low Excessively drained A Low 410.8 11%LakB Lakehurst sand, 0 to 5 percent slopes Very high Moderately well drained A Low 319.6 8%EvuB Evesboro-Urban land complex, 0 to 5 percent slopes Very low Excessively drained A Low 316.8 8%UdauB Udorthents-Urban land complex, 0 to 8 percent slopes Medium Well drained D Moderate 288.1 7%EveB Evesboro sand, 0 to 5 percent slopes Very low Excessively drained A Low 242.0 6%BerAt Berryland sand, 0 to 2 percent slopes, frequently flooded Very low Very poorly drained B/D Low 163.7 4%EveD Evesboro sand, 10 to 15 percent slopes Low Excessively drained A Low 66.2 2%LasB Lakewood sand, 0 to 5 percent slopes Very low Excessively drained A Low 715.6 23%AtsA Atsion sand, 0 to 2 percent slopes Very high Poorly drained A/D Low 709.4 23%EveB Evesboro sand, 0 to 5 percent slopes Very low Excessively drained A Low 472.4 15%LakB Lakehurst sand, 0 to 5 percent slopes Very high Moderately well drained A Low 462.6 15%KkgB Klej loamy sand, 0 to 5 percent slopes Very high Somewhat poorly drained B Low 274.3 9%DoeB Downer sandy loam, 2 to 5 percent slopes Very low Well drained B Moderate 143.9 5%BerAt Berryland sand, 0 to 2 percent slopes, frequently flooded Very low Very poorly drained B/D Low 83.8 3%WogA Woodstown loam, 0 to 2 percent slopes Low Moderately well drained C Moderate 69.8 2%EveB Evesboro sand, 0 to 5 percent slopes Very low Excessively drained A Low 1218.4 24%DocB Downer loamy sand, 0 to 5 percent slopes Very low Well drained B Moderate 1033.0 20%BerAt Berryland sand, 0 to 2 percent slopes, frequently flooded Very low Very poorly drained B/D Low 512.5 10%LasB Lakewood sand, 0 to 5 percent slopes Very low Excessively drained A Low 282.0 6%AtsA Atsion sand, 0 to 2 percent slopes Very high Poorly drained A/D Low 275.9 5%LakB Lakehurst sand, 0 to 5 percent slopes Very high Moderately well drained A Low 266.5 5%KkgB Klej loamy sand, 0 to 5 percent slopes Very high Somewhat poorly drained B Low 245.7 5%DoeA Downer sandy loam, 0 to 2 percent slopes Very low Well drained B Moderate 225.7 4%MakAt Manahawkin muck, 0 to 2 percent slopes, frequently flooded Negligible Very poorly drained D Low 199.1 4%DouB Downer-Urban land complex, 0 to 5 percent slopes Very low Well drained B Moderate 141.2 3%EveC Evesboro sand, 5 to 10 percent slopes Low Excessively drained A Low 131.9 3%BerAr Berryland sand, 0 to 2 percent slopes, rarely flooded Negligible Very poorly drained B/D Low 112.2 2%UR Urban land #N/A 110.4 2%DoeB Downer sandy loam, 2 to 5 percent slopes Very low Well drained B Moderate 85.0 2%LasB Lakewood sand, 0 to 5 percent slopes Very low Excessively drained A Low 2079.1 44%LakB Lakehurst sand, 0 to 5 percent slopes Very high Moderately well drained A Low 696.5 15%DocB Downer loamy sand, 0 to 5 percent slopes Very low Well drained B Moderate 315.3 7%UR Urban land 314.2 7%AtsA Atsion sand, 0 to 2 percent slopes Very high Poorly drained A/D Low 267.6 6%AptAv Appoquinimink-Transquaking-Mispillion complex, 0 to 1 percent slopes, very frequently flooded Negligible Very poorly drained D High 220.4 5%MakAt Manahawkin muck, 0 to 2 percent slopes, frequently flooded Negligible Very poorly drained D Low 215.3 5%PstAt Psammaquents, sulfidic substratum, 0 to 3 percent slopes, frequently flooded Negligible Very poorly drained A Low 134.3 3%BerAt Berryland sand, 0 to 2 percent slopes, frequently flooded Very low Very poorly drained B/D Low 128.0 3%EveB Evesboro sand, 0 to 5 percent slopes Very low Excessively drained A Low 127.4 3%
CFL1
NB1
NB2
NB3
NB4
NB5

Table 2-2 (cont'd)Soil Types by HUC14 within the South Brach Watershed
HUC Symbol Soil Name Runoff Class Drainage Class Hydrologic Group Erosion Potential Acres % of Soil in HUC14AtsA Atsion sand, 0 to 2 percent slopes Very high Poorly drained A/D Low 931.5 29%LasB Lakewood sand, 0 to 5 percent slopes Very low Excessively drained A Low 657.7 21%LakB Lakehurst sand, 0 to 5 percent slopes Very high Moderately well drained A Low 537.2 17%BerAr Berryland sand, 0 to 2 percent slopes, rarely flooded Negligible Very poorly drained B/D Low 499.9 16%LasC Lakewood sand, 5 to 10 percent slopes Low Excessively drained A Low 145.2 5%BerAt Berryland sand, 0 to 2 percent slopes, frequently flooded Very low Very poorly drained B/D Low 106.1 3%PhbB Phalanx loamy sand, 2 to 5 percent slopes Very low Well drained B Moderate 52.7 2%KkgB Klej loamy sand, 0 to 5 percent slopes Very high Somewhat poorly drained B Low 48.6 2%LakkB Lakehurst sand, clayey substratum, 0 to 5 percent slopes Very high Moderately well drained A Moderate 36.5 1%PHG Pits, sand and gravel Well drained 34.7 1%AtsA Atsion sand, 0 to 2 percent slopes Very high Poorly drained A/D Low 891.3 25%BerAr Berryland sand, 0 to 2 percent slopes, rarely flooded Negligible Very poorly drained B/D Low 88.6 2%BerAt Berryland sand, 0 to 2 percent slopes, frequently flooded Very low Very poorly drained B/D Low 93.0 3%DocB Downer loamy sand, 0 to 5 percent slopes Very low Well drained B Moderate 69.0 2%DoeB Downer sandy loam, 2 to 5 percent slopes Very low Well drained B Moderate 18.5 1%EveB Evesboro sand, 0 to 5 percent slopes Very low Excessively drained A Low 333.6 9%
GamB Galloway loamy sand, 0 to 5 percent slopes Very low Somewhat poorly drained A/D Low 202.0 6%KemA Keyport sandy loam, 0 to 2 percent slopes Medium Moderately well drained C High 10.9 0%LakB Lakehurst sand, 0 to 5 percent slopes Very high Moderately well drained A Low 1031.4 29%LasB Lakewood sand, 0 to 5 percent slopes Very low Excessively drained A Low 700.5 20%LasB Lakewood sand, 0 to 5 percent slopes Very low Excessively drained A Low 784.0 16%AtsA Atsion sand, 0 to 2 percent slopes Very high Poorly drained A/D Low 712.8 15%LakB Lakehurst sand, 0 to 5 percent slopes Very high Moderately well drained A Low 606.2 13%DocB Downer loamy sand, 0 to 5 percent slopes Very low Well drained B Moderate 561.7 12%GamB Galloway loamy sand, 0 to 5 percent slopes Very low Somewhat poorly drained A/D Low 434.0 9%DoeA Downer sandy loam, 0 to 2 percent slopes Very low Well drained B Moderate 387.3 8%
MakAt Manahawkin muck, 0 to 2 percent slopes, frequently flooded Negligible Very poorly drained D Low 273.2 6%BerAt Berryland sand, 0 to 2 percent slopes, frequently flooded Very low Very poorly drained B/D Low 196.7 4%LasC Lakewood sand, 5 to 10 percent slopes Low Excessively drained A Low 176.7 4%EveB Evesboro sand, 0 to 5 percent slopes Very low Excessively drained A Low 170.3 4%DoeB Downer sandy loam, 2 to 5 percent slopes Very low Well drained B Moderate 137.6 3%HbmB Hammonton loamy sand, 0 to 5 percent slopes Very high Moderately well drained B Moderate 117.2 2%DocB Downer loamy sand, 0 to 5 percent slopes Very low Well drained B Moderate 1577.6 32%EveB Evesboro sand, 0 to 5 percent slopes Very low Excessively drained A Low 952.7 19%AtsA Atsion sand, 0 to 2 percent slopes Very high Poorly drained A/D Low 311.0 6%EveD Evesboro sand, 10 to 15 percent slopes Low Excessively drained A Low 300.4 6%EveC Evesboro sand, 5 to 10 percent slopes Low Excessively drained A Low 281.5 6%BerAt Berryland sand, 0 to 2 percent slopes, frequently flooded Very low Very poorly drained B/D Low 259.7 5%DofgB Downer gravelly sandy loam, gravelly substratum, 2 to 5 percent slopes Very low Well drained B Moderate 182.2 4%LakB Lakehurst sand, 0 to 5 percent slopes Very high Moderately well drained A Low 171.6 3%PssA Psamments, 0 to 3 percent slopes Very low Well drained A Low 126.8 3%PHG Pits, sand and gravel Well drained #N/A 87.3 2%SacB Sassafras sandy loam, 2 to 5 percent slopes Low Well drained B Moderate 86.0 2%LasB Lakewood sand, 0 to 5 percent slopes Very low Excessively drained A Low 78.2 2%
BerAr Berryland sand, 0 to 2 percent slopes, rarely flooded Negligible Very poorly drained B/D Low 68.2 1%MakAt Manahawkin muck, 0 to 2 percent slopes, frequently flooded Negligible Very poorly drained D Low 61.9 1%DoeB Downer sandy loam, 2 to 5 percent slopes Very low Well drained B Moderate 54.8 1%LasC Lakewood sand, 5 to 10 percent slopes Low Excessively drained A Low 50.7 1%
KemA Keyport sandy loam, 0 to 2 percent slopes Medium Moderately well drained C High 49.7 1%DocB Downer loamy sand, 0 to 5 percent slopes Very low Well drained B Moderate 693.3 23%EveB Evesboro sand, 0 to 5 percent slopes Very low Excessively drained A Low 482.3 16%LasB Lakewood sand, 0 to 5 percent slopes Very low Excessively drained A Low 296.3 10%AtsA Atsion sand, 0 to 2 percent slopes Very high Poorly drained A/D Low 281.0 9%
MakAt Manahawkin muck, 0 to 2 percent slopes, frequently flooded Negligible Very poorly drained D Low 263.9 9%LakB Lakehurst sand, 0 to 5 percent slopes Very high Moderately well drained A Low 248.2 8%UR Urban land #N/A 164.4 5%
GamB Galloway loamy sand, 0 to 5 percent slopes Very low Somewhat poorly drained A/D Low 144.1 5%DoeA Downer sandy loam, 0 to 2 percent slopes Very low Well drained B Moderate 99.4 3%EveC Evesboro sand, 5 to 10 percent slopes Low Excessively drained A Low 75.2 2%PssA Psamments, 0 to 3 percent slopes Very low Well drained A Low 66.8 2%BerAt Berryland sand, 0 to 2 percent slopes, frequently flooded Very low Very poorly drained B/D Low 54.1 2%LasC Lakewood sand, 5 to 10 percent slopes Low Excessively drained A Low 50.7 2%
SB1
SB2
SB3
SB4
SB5

MunicipalitySum of Acres
2010 Population
2010 No. of Housing
Units
Housing Density (persons per household)
Brick Township 5,125.77 18,677 8,105 2.3
Freehold Township 6,687.69 1,295 452 2.86
Howell Township 13,124.76 31,768 10,446 3.04
Jackson Township 13,744.31 30,191 11,085 2.72
Lakewood Township 11,108.10 73,226 15,967 4.59
Millstone Township 110.51 57 29 1.98
Wall Township 217.95 224 91 2.47
Grand Total 50,119 155,439 46,175 3.19 (weighted avg)
HUCSum of Acres
2010 Population
2010 No. of Housing
Units
Housing Density (persons per household)
CFL1 5,910.78 15,121 6,387 2.37NB1 5,475.83 1,999 754 2.65NB2 6,948.68 24,647 7,449 3.31NB3 3,916.07 10,338 3,339 3.1NB4 3,082.06 3,282 974 3.37NB5 5,064.64 36,390 9,507 3.83SB1 3,203.00 348 120 2.91SB2 3,603.59 2,436 1,088 2.24SB3 4,835.66 11,301 4,031 2.8SB4 5,001.00 27,142 7,414 3.66SB5 3,077.78 22,434 5,114 4.39
Grand Total 50,119 155,439 46,175 3.12 (weighted avg)
Table 2-3Population by Municipality within the Metedeconk River Watershed (Study Area)
Table 2-4Population by HUC14 within the Metedeconk River Watershed (Study Area)

Table 2-5Demographics for Major Townships within the Metedeconk River Watershed
TownshipBrick
TownshipFreehold Township
Howell Township
Jackson Township
Lakewood Township
Total Population 75,072 36,184 51,075 54,856 92,843
Total 33,677 13,140 17,979 20,342 26,337
Occupied 29,842 12,577 17,260 19,417 24,283
Owner-occupied 24,863 10,368 15,386 16,925 12,570
Population in owner-occupied( number of individuals )
Renter-occupied 4,979 2,209 1,874 2,492 11,713
Population in renter-occupied( number of individuals )
Vacant 3,835 563 719 925 2,054
Vacant: for rent 379 260 130 223 584
Vacant: for sale 431 108 235 230 431Vacant: for seasonal/recreational/occasional use
89 33 93 81 69
Male 35,770 17,903 25,061 26,656 46,115
Female 39,302 18,281 26,014 28,200 46,728
Under 18 15,547 8,797 13,451 13,531 38,842
18 & over 59,525 27,387 37,624 41,325 54,001
20 - 24 4,020 1,843 2,983 2,737 7,372
25 - 34 7,966 3,613 4,812 5,073 15,272
35 - 49 16,161 8,835 12,578 13,130 10,244
50 - 64 16,194 7,545 10,815 10,924 7,634
65 & over 13,468 4,698 5,105 8,123 11,286
Hispanic or Latino 5,301 2,808 4,153 4,295 16,062
Non Hispanic or Latino 69,771 33,376 46,922 50,561 76,781
White 69,856 30,509 45,100 48,765 78,290
African American 1,502 1,931 1,865 2,664 5,898
Asian 1,173 2,544 2,309 1,616 777American Indian and Alaska Native 104 47 79 57 276
Native Hawaiian and Pacific Islander 27 7 23 18 14
Other 1,350 531 822 696 6,199
Identified by two or more 1,060 615 877 1,040 1,389
Housing Status
( in housing units unless noted )
63,038 29,768 46,322 48,632 41,765
Population by Ethnicity
Population by Race
11,335 4,781 4,637 5,792 48,718
Population by Sex/Age
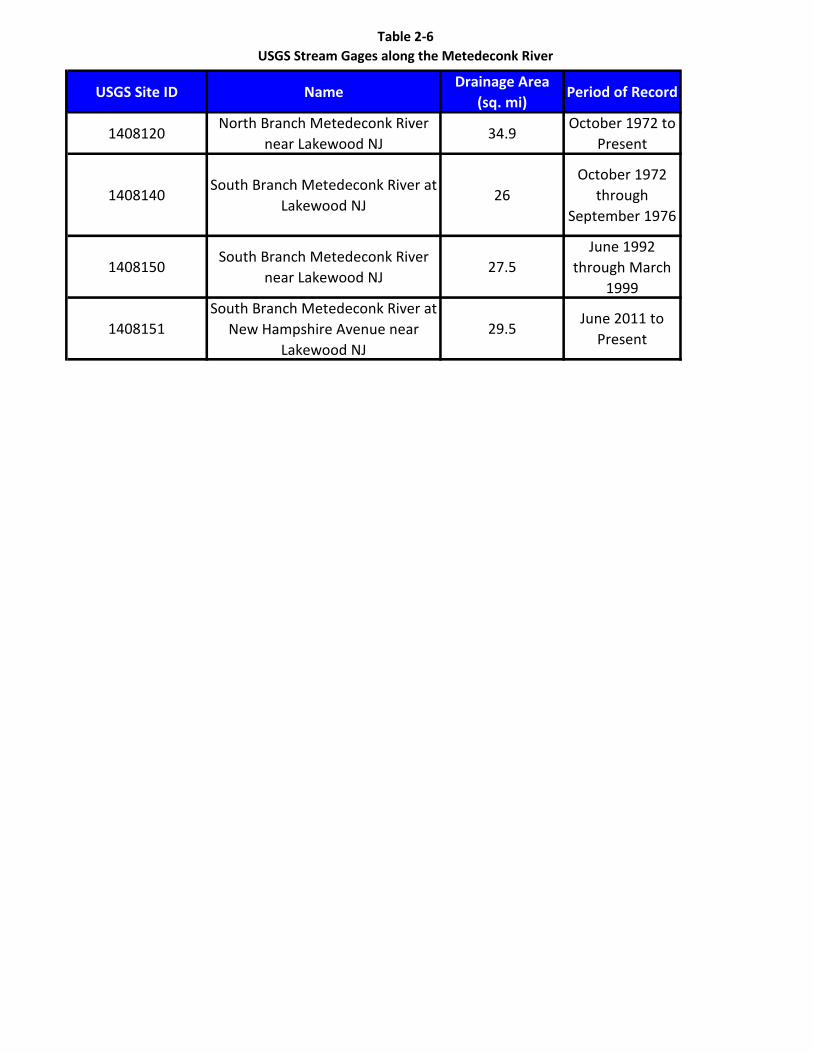
Table 2-6USGS Stream Gages along the Metedeconk River
USGS Site ID NameDrainage Area
(sq. mi)Period of Record
1408120North Branch Metedeconk River
near Lakewood NJ34.9
October 1972 to Present
1408140South Branch Metedeconk River at
Lakewood NJ26
October 1972 through
September 1976
1408150South Branch Metedeconk River
near Lakewood NJ27.5
June 1992 through March
1999
1408151South Branch Metedeconk River at
New Hampshire Avenue near Lakewood NJ
29.5June 2011 to
Present

Agriculture Forest Commercial Industrial Mixed UrbanHigh
Residential
Medium Residenti
al
Low Residential
Trans/Comm/Utility Urban Open Water Wetlands
Brick Township 2% (8.49) (145.03) 46.83 (3.77) 2.26 (26.39) 59.07 3.32 64.99 1.07 47.70 (41.55)Freehold Township 0% 20.58 (146.04) (0.59) 1.98 4.57 0.00 (0.04) 140.54 (2.59) 18.01 3.99 (40.34)Howell Township 2% (119.66) (535.26) 179.42 8.37 (42.88) 1.27 363.67 194.86 79.51 111.01 21.43 (261.67)Jackson Township 4% (266.88) (1426.99) 115.44 43.13 63.42 99.13 501.70 701.30 19.84 324.81 29.35 (204.25)Lakewood Township 4% (44.76) (952.04) 150.93 104.47 122.30 226.65 247.27 (12.43) 127.54 93.47 36.97 (100.34)Millstone Township 2% (0.55) (7.01) 1.68 0.76 (4.31) 0.00 0.11 5.98 3.67 0.00 0.45 (0.77)Wall Township 3% 7.23 (34.27) 0.00 0.00 (2.57) 0.00 11.23 8.44 (0.11) 10.06 0.00 0.00
Grand Total 5% (412.53) (3246.66) 493.70 154.94 142.79 300.67 1183.00 1042.01 292.86 558.42 139.89 (648.92)
Agriculture Forest Commercial Industrial Mixed Urban
High Residential
Medium Residential
Low Residential
Trans/Comm/Utility
Urban Open Water Wetlands Grand
Total
02040301020010 NB1 Metedeconk River NB 4% 374.54 1,261.96 58.19 12.87 54.61 15.69 47.02 624.02 58.26 85.42 18.75 2,864.52 5,475.84 02040301020020 NB2 Metedeconk River NB 19% 265.96 1,169.15 319.03 16.01 140.80 62.57 1,985.57 1,210.04 218.88 148.35 18.95 1,393.37 6,948.69 02040301020030 NB3 Metedeconk River NB 14% 169.52 614.01 144.36 27.92 54.90 59.06 955.03 506.00 51.20 62.03 27.37 1,244.70 3,916.08 02040301020040 NB4 Metedeconk River NB 7% 310.28 994.28 27.14 36.42 56.08 11.82 257.65 282.86 63.63 216.29 11.11 814.51 3,082.08 02040301020050 NB5 Metedeconk River NB 22% 123.78 1,007.46 239.82 51.99 172.21 492.52 1,319.83 314.78 203.65 403.15 44.93 690.52 5,064.63
14% 1,244.08 5,046.86 788.54 145.22 478.59 641.67 4,565.09 2,937.70 595.63 915.24 121.11 7,007.62 24,487.33
02040301030010 SB1 Metedeconk River SB 3% 182.79 1,092.24 13.63 32.86 25.22 134.96 42.66 21.26 15.42 1,641.94 3,202.99 02040301030020 SB2 Metedeconk River SB 7% 94.57 1,303.70 5.66 26.29 66.07 20.76 171.09 419.77 80.01 316.97 42.78 1,055.93 3,603.60 02040301030030 SB3 Metedeconk River SB 13% 130.70 1,113.65 123.62 25.47 89.54 103.74 579.04 1,142.21 41.99 210.39 44.54 1,230.77 4,835.66 02040301030040 SB4 Metedeconk River SB 19% 41.34 1,220.50 175.23 151.98 117.68 343.32 1,114.14 773.04 69.81 281.01 101.69 611.26 5,001.01 02040301030050 SB5 Metedeconk River SB 26% 2.10 750.80 336.02 204.84 165.72 217.78 467.95 69.00 93.90 198.21 74.38 497.09 3,077.78
14% 451.50 5,480.89 654.16 441.45 464.23 685.60 2,332.22 2,538.97 328.38 1,027.84 278.81 5,036.98 19,721.04
02040301040020 CNFL1 Metedeconk River 23% 925.44 515.85 223.91 265.35 290.73 1,068.11 134.12 253.76 266.99 1,226.55 739.98 5,910.79 Grand Total Grand Total 15% 1,695.58 11,453.19 1,958.55 810.58 1,208.17 1,618.00 7,965.42 5,610.80 1,177.76 2,210.07 1,626.47 12,784.58 50,119.16
Agriculture Forest Commercial Industrial Mixed Urban
High Residential
Medium Residential
Low Residential
Trans/Comm/Utility
Urban Open Water Wetlands
02040301020010 NB1 Metedeconk River NB 1% 24.58 (164.21) 13.22 1.32 10.27 2.68 17.54 130.87 6.52 18.03 6.51 (67.30) 02040301020020 NB2 Metedeconk River NB 2% 2.73 (338.23) 71.22 (0.70) (41.35) 3.65 79.03 302.67 42.92 33.79 6.55 (162.27) 02040301020030 NB3 Metedeconk River NB 2% 3.12 (134.91) 97.92 (2.21) (16.75) (4.11) 37.91 85.58 17.50 (22.36) 1.90 (63.57) 02040301020040 NB4 Metedeconk River NB 3% (86.87) (282.25) 15.60 5.61 22.38 (0.28) 243.02 39.58 5.42 98.42 4.25 (64.84) 02040301020050 NB5 Metedeconk River NB 2% (76.44) (278.24) 23.81 (3.26) 12.36 47.55 192.40 23.00 32.73 64.34 25.81 (64.09) Sub Total Metedeconk River NB (132.88) (1,197.84) 221.77 0.77 (13.09) 49.49 569.90 581.70 105.10 192.22 45.03 (422.08)
02040301030010 SB1 Metedeconk River SB 1% 2.36 (45.11) 7.48 16.02 (0.08) - (1.14) 37.66 7.17 (5.75) 2.62 (21.21) 02040301030020 SB2 Metedeconk River SB 3% (51.81) (331.67) (0.88) 10.62 12.87 13.62 158.30 27.05 25.70 166.47 13.48 (43.77) 02040301030030 SB3 Metedeconk River SB 5% (222.69) (641.91) 71.06 18.29 37.64 32.85 309.72 292.49 5.16 146.51 10.84 (59.95) 02040301030040 SB4 Metedeconk River SB 3% 2.47 (406.55) 48.12 71.03 24.20 88.84 70.14 112.29 9.32 1.91 1.51 (23.29) 02040301030050 SB5 Metedeconk River SB 6% (1.49) (350.45) 73.34 9.64 20.59 131.06 34.30 (31.94) 56.40 77.67 17.68 (36.78) Sub Total Metedeconk River SB (271.16) (1,775.69) 199.11 125.61 95.22 266.37 571.33 437.54 103.74 386.82 46.13 (185.01)
02040301040020 Metedeconk River 3% (8.49) (273.14) 75.79 28.57 60.65 (15.19) 41.76 19.76 84.01 (20.61) 48.73 (41.84) Grand Total 3% (412.53) (3,246.66) 496.68 154.94 142.79 300.66 1,183.00 1,039.01 292.85 558.42 139.88 (648.93)
- - - - - - - - - - - - -
Change in Land Use/Land Cover from 1995 to 2007
HUC14 Alternate ID BranchPercent Impervio
us
Acres
Sub Total Metedeconk River NB
Sub Total Metedeconk River SB
Table 2-9
Table 2-8Summary of 2007 Land Use / Land Cover by HUC14 within the Metedeconk River Watershed
HUC14 Alternate ID BranchPercent Impervio
us
Acres
Table 2-7Change in Land Use/Land Cover from 1995 to 2007
Municipality Percent Impervious
Acres

Table 3-1Identified Water Quality Impairments
Subbasin HUC14 Area (mi2) Subwatershed Name TMDL 2010 Integrated List (Priority Ranking)
NB-1 02040301020010 8.6Metedeconk R NB
(above I-195)Phosphorus, Stream
Fecal Coliform
Dissolved Oxygen (M)**, Arsenic (L), DDD(L), DDT(L), DDE(L), Chlordane in Fish Tissue(L),
Mercury in Fish Tissue(L), PCB in Fish Tissue(L), Turbidity*, Lead*
NB-2 02040301020020 10.9Metedeconk R NB (Rt 9 to
I-195)Stream Fecal Coliform
Dissolved Oxygen(M)**, Temperature(M), Arsenic(L), Turbidity*
NB-3 02040301020030 6.1 Haystack Brook Stream Fecal Coliform Cause Unknown(M)
NB-4 02040301020040 4.8 Muddy Ford Brook Stream Fecal ColiformTP(M), TSS(M), Arsenic(L)**, Mercury in Water
Column(L)
NB-5 02040301020050 7.9Metedeconk R NB
(confluence to Rt 9)Stream Fecal Coliform Temperature(M), Arsenic(L)**, Lead*
SB-1 02040301030010 5Metedeconk R SB
(above I-195 exit 21 rd)Stream Fecal Coliform Dissolved Oxygen (M)**, Arsenic (L), Lead*
SB-2 02040301030020 5.6Metedeconk R SB
(74d19m15s to I-195 X21)Stream Fecal Coliform Turbidity*
SB-3 02040301030030 7.6Metedeconk R SB (Bennetts Pd to
74d19m15s)Stream Fecal Coliform
Cause Unknown (M), Polychlorinated biphenyls(L), Mercury in Fish Tissue(L),
Chlordane in Fish Tissue(L)
SB-4 02040301030040 7.8Metedeconk R SB (Rt 9 to
Bennetts Pond)
Stream Fecal Coliform, Lake Fecal
ColiformArsenic(L)**
SB-5 02040301030050 4.8Metedeconk R SB
(confluence to Rt 9)Stream Fecal Coliform Arsenic(L)**, Lead*
CNFL-1 02040301040020 9.2Metedeconk R
(Beaverdam Ck to confl)
Stream Fecal Coliform, Lake Fecal,
Total ColiformArsenic(L)**, Cause Unknown(M)
* = listed on draft 2012 303(d) list** = listed on 2010 303(d) List, but NOT included on draft 2012 303(d) list

Table 3-2Surface Water Quality Standards Pertinent to the Metedeconk River for Non-Toxic Parameters
Parameter SWQS Relevant Classification Notes35/100 geometric mean
104/100 maximum single sample126/100 geometric mean235/100 maximum single sample
6 24 hour average5 Any time5 24 hour average4 Any time
Floating, colloidal, color and settleable solids; petroleum hydrocarbons and other oils and grease
None noticible in the water or deposited in quantites detrimental to natural biota. None which would render the water unsuitable for designated uses.
All
Nutrients
Concentrations cannot render waters unsuitable for existing or designated uses (objectionable algal densities, nuisance aquatic vegetation,, diurnal fluctuations in DO, or other indicators of impairments caused by nutrients.
All
0.1 Non tidal streams0.05 Lakes
pH 4.5 - 7.5 FW225 FW2-TP40 FW2-NT
Total Dissolved Solids (mg/L)No increase in background which would interfere
with designated or existing uses or 500 mg/L, whichever is more stringent.
FW2
Sulfate (mg/L) 250 FW2Taste and Odor None offensive to humans. All
25 daily maximum23 7 day average31 daily maximum28 7 day average
29.4 SE1 Summer seasonal average
None in such concentratons to affect humans or be detrimental to natural aquatic biota or which would
render the waters unsuitable for designated uses.All See Appendix 3
None which would cause drinking water standards to be exceeded after appropriate treatment
FW2 See Appendix 3
15 30 day average50 Any sample
Ammonia (mg NH3-N/L) based on analytical equations FW2 see SWQS
Toxic Substances (general)
Turbidity (NTU) FW2
Phosphorus (mg/L) FW2
Total Suspended Solids (mg/L)
Temperature (Celsius)
FW2-TM
FW2-NT
Enterococci (counts/100 mL) SE1
E-Coli (counts/100 mL) All FW2
Dissolved Oxygen (mg/L)FW2-TM
FW2-NT, SE1

Table 3-3Summary of SVA Ranking
Subbasin No. SVA Sites Score Average RankingNB-1 8 7.1 4NB-2 9 6.8 7NB-3 6 5.5 11NB-4 6 6.4 9NB-5 16 7 6SB-1 2 7.8 1SB-2 5 7.8 2SB-3 10 7.1 5SB-4 12 6.6 8SB-5 11 7.3 3
CNFL-1 3 5.6 10

Table 3-4Sites Identified in Stream Visual Assessment as Possible Candidates for Restoration
Subbasin Site Score / Rank Description RestorationBMP to address parking lot runoff and/or streambank restoration project, upstream detention basin near Joe Parker Rd may also be a possible retrofit to reduce flows.BMP for upstream nursery and expansion of riparian buffer upstream.The drainage area of this reach is a possible source of nonsource point pollution, reduction of stormwater volumes onsite or a BMP at the beginning of reach.Possible riparian buffer restoration.
The drainage area of this reach is a source of nonsource point pollution and high flows of stormwater runoff, restoration of this site would be in partner with upstream stormwater controls and streambank restoration at site CBB-1.
Possible opportunity for basin retrofit and improvements in housekeeping and stormwater infrastructure maintenance at adjacent shopping center(s).
CFL1 CBB-3 3.3/ PoorReach runs through a large commercial area near the Brick Plaza, banks are unstable and there is a lot of sediment, this site is downstream of the BTMUA intake
While this tributary meets the Metedeconk River downstream of the BTMUA, there are most likely water quality impacts on the Barnegat Bay, it appears there is very little treatment of stormwater from the shopping centers which are a large source of NPS. Possible opportunity for channel improvements and retrofit of parking lot islands, pervious pavers and catch basins. Signage to inform public of stormwater mitigation measures.
SB4 CP-3 3.9/Poor
Reach runs through a residential area near Forest Dr in Lakewood, erosion along stream banks, riparian buffer is narrow, and outfalls discharge directly to stream, there is an upstream lake and wooden dams and bulkheads have been constructed along the reach to prevent erosion
Reach is a possible site for streambank restoration to address erosion and restore riparian area, high stormwater flows or flow from the lake seems to be an issue, also could also be a candidate for on-site stormwater management such as rain gardens
Possible BMP demonstration site to address runoff from apartment complex .Possibility of reestablishing some riparian buffer area; dumping occurring along reach – fencing would be beneficial.
NB3 DB-1Agricultural BMPs may be beneficial at the herb farm adjacent to the reach. May also be an opportunity to improve riparian buffers.
NB3 GH1 5.5/Poor
Unstable banks and signs of high stormwater flows observed in VAPP, tributary begins in a residential area, waterfowl present in upstream ponds and algae in stream may indicate nutrients from fertilizer
Possible retrofits of the detention basin(s) in the area, particularly one found in disrepair adjacent reach. SVA indicates reach is along fire dept property, this may be a candidate for stream/riparian buffer restoration and/or installation of a BMP.
NB5 GR2 5.7/PoorStream is fed by stormwater from residential development at Newton’s Corner Rd, Howell, habitat scores are low and algae was observed
Potential bio-retention area and installation of decentralized BMPs throughout the catchment neighborhood.
NB5 GR4 8.2/GoodReach is downstream of GR2, there are signs of high stormwater flows and sediment in reach near outfalls from detention basins
Restoration of this site may be achieved through restoration of BMPs at the upstream reach GR2, retrofits to the detention basins along the reach are also a possibility.
NB3 HS6 4.7/PoorStream may have been re-routed during bridge construction, low channel scores, reach receives runoff from residential area, sediment in stream
Possible retrofits to upstream detention basins or on-site stormwater management on residential lots, e.g. rain gardens.
Headwater stream crossing Co Rd 547, Howell, culvert under Reach is adjacent to a horse farm, possible site for agricultural BMP.
road is above elevation of stream reach, stream appears to have been straightened Potential to improve riparian buffer area.
NB5 NA
Immediately upstream of BTMUA intake. Direct stormwater discharge from roadway. Stormwater runoff from the development to the north also discharges upstream of the reach.
BMP at the Garden State Parkway median just upstream of the reach.
Restoration would need to address runoff from Rt 9 and businesses along Rt 9 such as parking lot BMPs.Potential for restoration of riparian area (lawn and unused parking lot area).Possible BMP to address runoff from apt complex and parking lot adjacent to stream.
Major storm outfall warrants additional study for potential BMPs to reduce runoff volumes from catchment area, improve water quality, identify illicit connections, etc.; also potential for some restoration of riparian area (lawn and unused parking lot area). Potential for offline treatment.
NB2 NK 5.6/Poor
Reach crosses Hulses Corner Rd, Jackson, very turbid water observed, agriculture upstream along Farmingdale Rd, low habitat scores, unstable banks and possible nutrient enrichment
Turbid water appearance may suggest NPS from agriculture, possible site for agriculture BMPs
NB1 NQ 5.8/PoorHeadwater to the North Branch crosses Co Rd 537, Millstone, reach begins downstream of pond in which there is a buffer only on 25% of shoreline
Restoration of shoreline buffer around pond may deter waterfowl and filter nutrients from stormwater runoff.Possible BMP for the parking lot runoff at Echo Lake.
Echo Lake shoreline restoration/management and waterfowl control would likely be beneficial.
NB3 PB2 6.7/FairReach connects Echo Lake and downstream lake, habitat scores are low and there is a spillway from the lake at the start of the reach
NB4 MF3 6.2/Poor
NB2 NF 6.6/Fair Reach receives runoff from commercial area along Rt 9 in Lakewood, low channel and habitat scores
NB5 NF14 6.4/Fair
Reach receives runoff from commercial area via a major outfall – possibly from Kennedy Blvd and an apartment complex, sediment in stream, there is a parking lot very close to the stream
CFL1 CBB-1 7.0/FairReach located in a large commercial area, downstream of CCB-3, unstable banks, this site is downstream of the BTMUA intake
NB5 CVS-1 8.5/GoodWhile this site scored good in the VAPP, there was a lot of litter in the reach and outfalls are silted in, runoff from the apartment complex is discharged directly to the stream
NB5 CB1 6.9/ FairReceives runoff from bowling alley parking lot, banks are eroding and attempts have been made at stabilization, high flows may be coming from upstream sources
NB5 CB5 6.2/ FairThe tributary is a headwater stream fed by stormwater from a very urbanized area of Lakewood, no BMPs observed, litter present
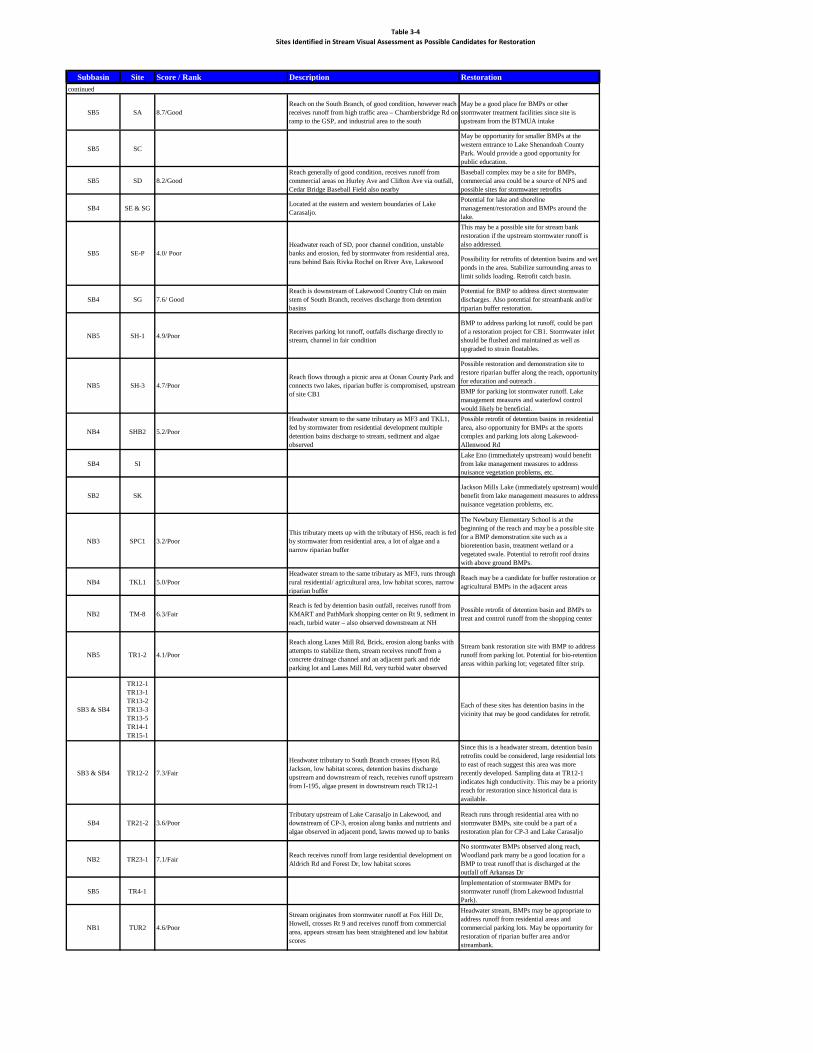
Table 3-4Sites Identified in Stream Visual Assessment as Possible Candidates for Restoration
Subbasin Site Score / Rank Description Restoration
continued
SB5 SA 8.7/GoodReach on the South Branch, of good condition, however reach receives runoff from high traffic area – Chambersbridge Rd on-ramp to the GSP, and industrial area to the south
May be a good place for BMPs or other stormwater treatment facilities since site is upstream from the BTMUA intake
SB5 SC
May be opportunity for smaller BMPs at the western entrance to Lake Shenandoah County Park. Would provide a good opportunity for public education.
SB5 SD 8.2/GoodReach generally of good condition, receives runoff from commercial areas on Hurley Ave and Clifton Ave via outfall, Cedar Bridge Baseball Field also nearby
Baseball complex may be a site for BMPs, commercial area could be a source of NPS and possible sites for stormwater retrofits
SB4 SE & SG Located at the eastern and western boundaries of Lake Carasaljo.
Potential for lake and shoreline management/restoration and BMPs around the lake.This may be a possible site for stream bank restoration if the upstream stormwater runoff is also addressed.
Possibility for retrofits of detention basins and wet ponds in the area. Stabilize surrounding areas to limit solids loading. Retrofit catch basin.
SB4 SG 7.6/ GoodReach is downstream of Lakewood Country Club on main stem of South Branch, receives discharge from detention basins
Potential for BMP to address direct stormwater discharges. Also potential for streambank and/or riparian buffer restoration.
NB5 SH-1 4.9/Poor Receives parking lot runoff, outfalls discharge directly to stream, channel in fair condition
BMP to address parking lot runoff, could be part of a restoration project for CB1. Stormwater inlet should be flushed and maintained as well as upgraded to strain floatables.
Possible restoration and demonstration site to restore riparian buffer along the reach, opportunity for education and outreach .BMP for parking lot stormwater runoff. Lake management measures and waterfowl control would likely be beneficial.
NB4 SHB2 5.2/Poor
Headwater stream to the same tributary as MF3 and TKL1, fed by stormwater from residential development multiple detention bains discharge to stream, sediment and algae observed
Possible retrofit of detention basins in residential area, also opportunity for BMPs at the sports complex and parking lots along Lakewood-Allenwood Rd
SB4 SILake Eno (immediately upstream) would benefit from lake management measures to address nuisance vegetation problems, etc.
SB2 SKJackson Mills Lake (immediately upstream) would benefit from lake management measures to address nuisance vegetation problems, etc.
NB3 SPC1 3.2/PoorThis tributary meets up with the tributary of HS6, reach is fed by stormwater from residential area, a lot of algae and a narrow riparian buffer
The Newbury Elementary School is at the beginning of the reach and may be a possible site for a BMP demonstration site such as a bioretention basin, treatment wetland or a vegetated swale. Potential to retrofit roof drains with above ground BMPs.
NB4 TKL1 5.0/PoorHeadwater stream to the same tributary as MF3, runs through rural residential/ agricultural area, low habitat scores, narrow riparian buffer
Reach may be a candidate for buffer restoration or agricultural BMPs in the adjacent areas
NB2 TM-8 6.3/FairReach is fed by detention basin outfall, receives runoff from KMART and PathMark shopping center on Rt 9, sediment in reach, turbid water – also observed downstream at NH
Possible retrofit of detention basin and BMPs to treat and control runoff from the shopping center
NB5 TR1-2 4.1/Poor
Reach along Lanes Mill Rd, Brick, erosion along banks with attempts to stabilize them, stream receives runoff from a concrete drainage channel and an adjacent park and ride parking lot and Lanes Mill Rd, very turbid water observed
Stream bank restoration site with BMP to address runoff from parking lot. Potential for bio-retention areas within parking lot; vegetated filter strip.
SB3 & SB4
TR12-1 TR13-1 TR13-2 TR13-3 TR13-5 TR14-1 TR15-1
Each of these sites has detention basins in the vicinity that may be good candidates for retrofit.
SB3 & SB4 TR12-2 7.3/Fair
Headwater tributary to South Branch crosses Hyson Rd, Jackson, low habitat scores, detention basins discharge upstream and downstream of reach, receives runoff upstream from I-195, algae present in downstream reach TR12-1
Since this is a headwater stream, detention basin retrofits could be considered, large residential lots to east of reach suggest this area was more recently developed. Sampling data at TR12-1 indicates high conductivity. This may be a priority reach for restoration since historical data is available.
SB4 TR21-2 3.6/PoorTributary upstream of Lake Carasaljo in Lakewood, and downstream of CP-3, erosion along banks and nutrients and algae observed in adjacent pond, lawns mowed up to banks
Reach runs through residential area with no stormwater BMPs, site could be a part of a restoration plan for CP-3 and Lake Carasaljo
NB2 TR23-1 7.1/Fair Reach receives runoff from large residential development on Aldrich Rd and Forest Dr, low habitat scores
No stormwater BMPs observed along reach, Woodland park many be a good location for a BMP to treat runoff that is discharged at the outfall off Arkansas Dr
SB5 TR4-1Implementation of stormwater BMPs for stormwater runoff (from Lakewood Industrial Park).
NB1 TUR2 4.6/Poor
Stream originates from stormwater runoff at Fox Hill Dr, Howell, crosses Rt 9 and receives runoff from commercial area, appears stream has been straightened and low habitat scores
Headwater stream, BMPs may be appropriate to address runoff from residential areas and commercial parking lots. May be opportunity for restoration of riparian buffer area and/or streambank.
SB5 SE-P 4.0/ PoorHeadwater reach of SD, poor channel condition, unstable banks and erosion, fed by stormwater from residential area, runs behind Bais Rivka Rochel on River Ave, Lakewood
NB5 SH-3 4.7/PoorReach flows through a picnic area at Ocean County Park and connects two lakes, riparian buffer is compromised, upstream of site CB1

Table 3-5Loading Rate by Land Use Type
TN TSS TPAGRICULTURAL WETLANDS (MODIFIED) 3 40 0.1AIRPORT FACILITIES 10 120 1ALTERED LANDS 5 60 0.5ARTIFICIAL LAKES 3 40 0.1ATHLETIC FIELDS (SCHOOLS) 10 120 1ATLANTIC WHITE CEDAR WETLANDS 3 40 0.1BEACHES 5 60 0.5BRIDGE OVER WATER 3 40 0.1CEMETERY 10 120 1COMMERCIAL/SERVICES 22 200 2.1CONFINED FEEDING OPERATIONS 10 300 1.3CONIFEROUS BRUSH/SHRUBLAND 3 40 0.1CONIFEROUS FOREST (>50% CROWN CLOSURE) 3 40 0.1CONIFEROUS FOREST (10-50% CROWN CLOSURE) 3 40 0.1CONIFEROUS SCRUB/SHRUB WETLANDS 3 40 0.1CONIFEROUS WOODED WETLANDS 3 40 0.1CROPLAND AND PASTURELAND 10 300 1.3DECIDUOUS BRUSH/SHRUBLAND 3 40 0.1DECIDUOUS FOREST (>50% CROWN CLOSURE) 3 40 0.1DECIDUOUS FOREST (10-50% CROWN CLOSURE) 3 40 0.1DECIDUOUS SCRUB/SHRUB WETLANDS 3 40 0.1DECIDUOUS WOODED WETLANDS 3 40 0.1DISTURBED WETLANDS (MODIFIED) 3 40 0.1DREDGED LAGOON 3 40 0.1EXTRACTIVE MINING 5 60 0.5FORMER AGRICULTURAL WETLAND (BECOMING SHRUBBY, NOT BUILT-UP) 3 40 0.1HERBACEOUS WETLANDS 3 40 0.1INDUSTRIAL 16 200 1.5MAJOR ROADWAY 10 120 1MANAGED WETLAND IN BUILT-UP MAINTAINED REC AREA 3 40 0.1MANAGED WETLAND IN MAINTAINED LAWN GREENSPACE 3 40 0.1MIXED DECIDUOUS/CONIFEROUS BRUSH/SHRUBLAND 3 40 0.1MIXED FOREST (>50% CONIFEROUS WITH >50% CROWN CLOSURE) 3 40 0.1MIXED FOREST (>50% CONIFEROUS WITH 10-50% CROWN CLOSURE) 3 40 0.1MIXED FOREST (>50% DECIDUOUS WITH >50% CROWN CLOSURE) 3 40 0.1MIXED FOREST (>50% DECIDUOUS WITH 10-50% CROWN CLOSURE) 3 40 0.1MIXED SCRUB/SHRUB WETLANDS (CONIFEROUS DOM.) 3 40 0.1MIXED SCRUB/SHRUB WETLANDS (DECIDUOUS DOM.) 3 40 0.1MIXED TRANSPORTATION CORRIDOR OVERLAP AREA 10 120 1MIXED URBAN OR BUILT-UP LAND 10 120 1MIXED WOODED WETLANDS (CONIFEROUS DOM.) 3 40 0.1MIXED WOODED WETLANDS (DECIDUOUS DOM.) 3 40 0.1NATURAL LAKES 3 40 0.1OLD FIELD (< 25% BRUSH COVERED) 3 40 0.1ORCHARDS/VINEYARDS/NURSERIES/HORTICULTURAL AREAS 10 300 1.3OTHER AGRICULTURE 10 300 1.3OTHER URBAN OR BUILT-UP LAND 10 120 1PHRAGMITES DOMINATE COASTAL WETLANDS 3 40 0.1PHRAGMITES DOMINATE INTERIOR WETLANDS 3 40 0.1PLANTATION 3 40 0.1RAILROADS 10 120 1RECREATIONAL LAND 10 120 1RESIDENTIAL, HIGH DENSITY OR MULTIPLE DWELLING 15 140 1.4RESIDENTIAL, RURAL, SINGLE UNIT 5 100 0.6RESIDENTIAL, SINGLE UNIT, LOW DENSITY 5 100 0.6RESIDENTIAL, SINGLE UNIT, MEDIUM DENSITY 15 140 1.4SALINE MARSH (HIGH MARSH) 3 40 0.1SALINE MARSH (LOW MARSH) 3 40 0.1STADIUM, THEATERS, CULTURAL CENTERS AND ZOOS 10 120 1STORMWATER BASIN 10 120 1STREAMS AND CANALS 3 40 0.1TIDAL RIVERS, INLAND BAYS, AND OTHER TIDAL WATERS 3 40 0.1TRANSITIONAL AREAS 5 60 0.5TRANSPORTATION/COMMUNICATION/UTILITIES 10 120 1UNDIFFERENTIATED BARREN LANDS 5 60 0.5UPLAND RIGHTS-OF-WAY DEVELOPED 10 120 1UPLAND RIGHTS-OF-WAY UNDEVELOPED 10 120 1WETLAND RIGHTS-OF-WAY 3 40 0.1
Load (lbs/ac/yr)2007 Land Use Category

Sub-basin AcresTotal Nitrogen Load (lbs/yr)
Areal Weighted Nitrogen Loading (lbs/acre/yr)
% of Total Nitrogen Load
SB1 3,203 12,378 3.86 3%SB2 3,604 17,583 4.88 5%NB4 3,082 17,987 5.84 5%NB1 5,476 23,530 4.3 6%SB3 4,836 30,368 6.28 8%NB3 3,916 30,368 7.75 8%SB5 3,078 29,190 9.48 8%SB4 5,001 42,656 8.53 12%NB5 5,065 48,868 9.65 13%CFL1 5,911 52,146 8.82 14%NB2 6,949 59,351 8.54 16%Total 50,119 364,424 7.27 100%
Sub-basin AcresTotal Phosphorus
Load (lbs/yr)
Areal Weighted Phosphorus Loading
(lbs/acre/yr)
% of Total Phosphorus
LoadSB1 3203 752 0.23 2%SB2 3604 1326 0.37 4%NB4 3082 1523 0.49 5%NB1 5476 1686 0.31 5%SB5 3078 2543 0.83 8%SB3 4836 2629 0.54 8%NB3 3916 2642 0.67 8%SB4 5001 3790 0.76 12%NB5 5065 4396 0.87 14%CFL1 5911 4440 0.75 14%NB2 6949 5381 0.77 17%Total 50,119 31,108 0.6 100%
Sub-basin AcresTotal TSS load
(lbs/yr)Areal weighted TSS load
(lbs/acre/yr)% of Total TSS
loadSB1 3,203 197,227 62 4%SB2 3,604 246,588 68 5%NB4 3,082 278,066 90 6%SB5 3,078 313,500 102 7%NB3 3,916 373,133 95 8%NB1 5,476 385,306 70 9%SB3 4,836 408,165 84 9%SB4 5,001 489,883 98 11%NB5 5,065 540,836 107 12%CFL1 5,911 557,104 94 12%NB2 6,949 716,598 103 16%Total 50,119 4,506,406 90 100%
Calculated Total Suspended Solids Load
Table 3-6Calculated Nitrogen Load
Table 3-7Calculated Phosphorus Load
Table 3-8

Table 3-9Summary of Calculated Loads by Sub-Basin
OverallAnnual
LoadAnnual Load
RateAnnual
LoadAnnual Load
RateAnnual
LoadAnnual Load
Rate(acres) (lbs/yr) (lbs/ac/yr) (lbs/yr) (lbs/ac/yr) (lbs/yr) (lbs/ac/yr)
NB1 5,476 1,686 0.31 10 23,530 4 10 385,306 70 9 10NB2 6,949 5,381 0.77 3 59,351 9 4 716,598 103 3 3NB3 3,916 2,642 0.67 6 30,368 8 6 373,133 95 5 6NB4 3,082 1,523 0.49 8 17,987 6 8 278,066 90 7 8NB5 5,065 4,396 0.87 1 48,868 10 1 540,836 107 1 1SB1 3,203 752 0.23 11 12,378 4 11 197,227 62 11 11SB2 3,604 1,326 0.37 9 17,583 5 9 246,588 68 10 9SB3 4,836 2,629 0.54 7 30,368 6 7 408,165 84 8 7SB4 5,001 3,790 0.76 4 42,656 9 5 489,883 98 4 4SB5 3,078 2,543 0.83 2 29,190 9 2 313,500 102 2 2CFL1 5,911 4,440 0.75 5 52,146 9 3 557,104 94 6 5Total 50,119 31,108 364,424 4,506,406
0.6 7.09 88.57
HUC-14 Subbasin
Average
Phosphorus Nitrogen TSS
RankRank (avg)
RankRank
Drainage Area
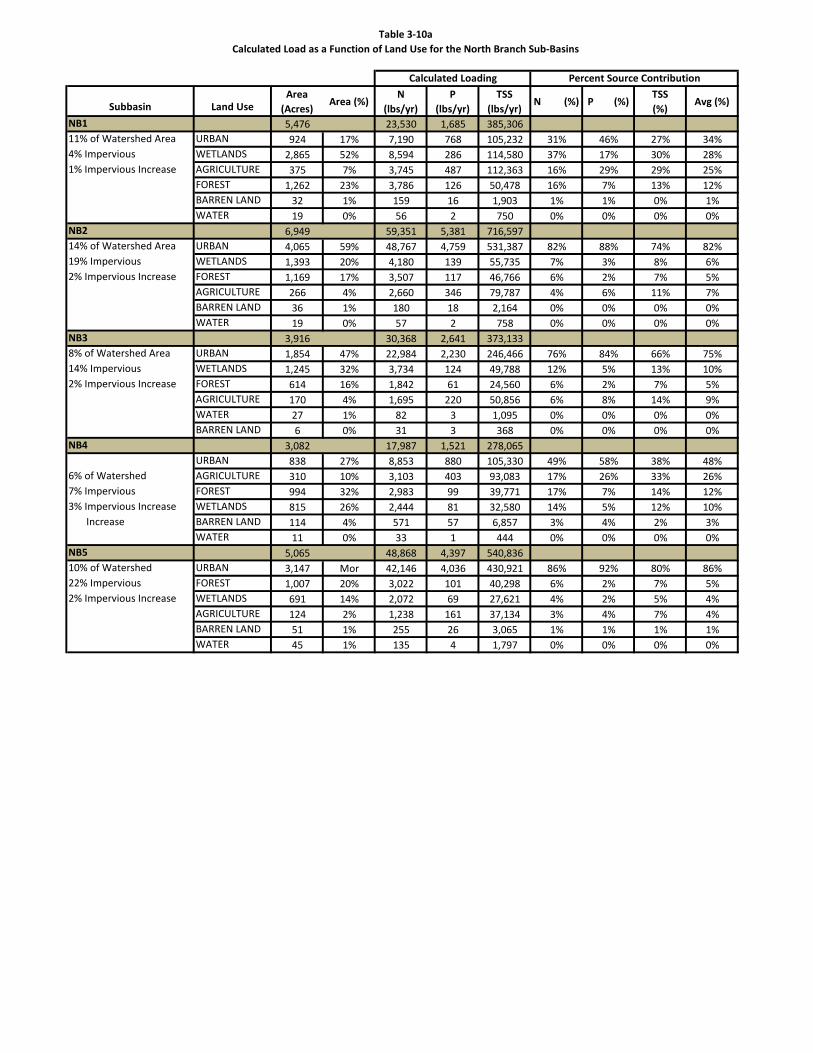
Table 3-10aCalculated Load as a Function of Land Use for the North Branch Sub-Basins
Subbasin Land UseArea
(Acres)Area (%)
N (lbs/yr)
P (lbs/yr)
TSS (lbs/yr)
N (%) P (%)TSS (%)
Avg (%)
NB1 5,476 23,530 1,685 385,30611% of Watershed Area URBAN 924 17% 7,190 768 105,232 31% 46% 27% 34%4% Impervious WETLANDS 2,865 52% 8,594 286 114,580 37% 17% 30% 28%1% Impervious Increase AGRICULTURE 375 7% 3,745 487 112,363 16% 29% 29% 25%
FOREST 1,262 23% 3,786 126 50,478 16% 7% 13% 12%BARREN LAND 32 1% 159 16 1,903 1% 1% 0% 1%WATER 19 0% 56 2 750 0% 0% 0% 0%
NB2 6,949 59,351 5,381 716,59714% of Watershed Area URBAN 4,065 59% 48,767 4,759 531,387 82% 88% 74% 82%19% Impervious WETLANDS 1,393 20% 4,180 139 55,735 7% 3% 8% 6%2% Impervious Increase FOREST 1,169 17% 3,507 117 46,766 6% 2% 7% 5%
AGRICULTURE 266 4% 2,660 346 79,787 4% 6% 11% 7%BARREN LAND 36 1% 180 18 2,164 0% 0% 0% 0%WATER 19 0% 57 2 758 0% 0% 0% 0%
NB3 3,916 30,368 2,641 373,1338% of Watershed Area URBAN 1,854 47% 22,984 2,230 246,466 76% 84% 66% 75%14% Impervious WETLANDS 1,245 32% 3,734 124 49,788 12% 5% 13% 10%2% Impervious Increase FOREST 614 16% 1,842 61 24,560 6% 2% 7% 5%
AGRICULTURE 170 4% 1,695 220 50,856 6% 8% 14% 9%WATER 27 1% 82 3 1,095 0% 0% 0% 0%BARREN LAND 6 0% 31 3 368 0% 0% 0% 0%
NB4 3,082 17,987 1,521 278,065URBAN 838 27% 8,853 880 105,330 49% 58% 38% 48%
6% of Watershed AGRICULTURE 310 10% 3,103 403 93,083 17% 26% 33% 26%7% Impervious FOREST 994 32% 2,983 99 39,771 17% 7% 14% 12%3% Impervious Increase WETLANDS 815 26% 2,444 81 32,580 14% 5% 12% 10% Increase BARREN LAND 114 4% 571 57 6,857 3% 4% 2% 3%
WATER 11 0% 33 1 444 0% 0% 0% 0%NB5 5,065 48,868 4,397 540,83610% of Watershed URBAN 3,147 Mor 42,146 4,036 430,921 86% 92% 80% 86%22% Impervious FOREST 1,007 20% 3,022 101 40,298 6% 2% 7% 5%2% Impervious Increase WETLANDS 691 14% 2,072 69 27,621 4% 2% 5% 4% AGRICULTURE 124 2% 1,238 161 37,134 3% 4% 7% 4%
BARREN LAND 51 1% 255 26 3,065 1% 1% 1% 1%WATER 45 1% 135 4 1,797 0% 0% 0% 0%
Calculated Loading Percent Source Contribution

Table 3-10bCalculated Load as a Function of Land Use for the South Branch Sub-Basins
Subbasin Land UseArea
(Acres) Area (%)N
(lbs/yr)P
(lbs/yr) TSS (lbs/yr)N
(%) P (%)TSS (%)
Average (%)
SB1 3,203 12,379 752 197,2276% of Watershed Area WETLANDS 1,642 51% 4,926 164 65,677 40% 22% 33% 32%3% Impervious FOREST 1,092 34% 3,277 109 43,690 26% 15% 22% 21%1% Impervious Increase URBAN 252 8% 2,211 230 31,317 18% 31% 16% 21%
AGRICULTURE 183 6% 1,828 238 54,839 15% 32% 28% 25%BARREN LAND 18 1% 91 9 1,087 1% 1% 1% 1%WATER 15 0% 46 2 617 0% 0% 0% 0%
SB2 3,604 17,455 1,321 244,877URBAN 962 27% 8,707 890 113,450 50% 67% 46% 54%
7% of Watershed Area FOREST 1,304 36% 3,911 130 52,148 22% 10% 21% 18%7% Impervious WETLANDS 1,056 29% 3,168 106 42,237 18% 8% 17% 14%3% Impervious Increase AGRICULTURE 95 3% 946 123 28,371 5% 9% 12% 9% BARREN LAND 145 4% 723 72 8,671 4% 5% 4% 4%
WATER 43 1% 128 4 1,711 1% 0% 1% 1%SB3 4,836 30,234 2,625 406,38410% of Watershed Area URBAN 2,195 45% 21,289 2,160 266,134 70% 82% 65% 72%13% Impervious WETLANDS 1,231 25% 3,692 123 49,231 12% 5% 12% 10%5% Impervious Increase FOREST 1,114 23% 3,341 111 44,546 11% 4% 11% 9% AGRICULTURE 131 3% 1,307 170 39,211 4% 6% 10% 7%
BARREN LAND 121 3% 605 61 7,262 2% 2% 2% 2%WATER 45 1% 134 4 1,782 0% 0% 0% 0%
SB4 5,001 42,656 3,791 489,88310% of Watershed Area URBAN 2,983 60% 36,226 3,522 397,546 85% 93% 81% 86%19% Impervious FOREST 1,220 24% 3,661 122 48,820 9% 3% 10% 7%3% Impervious Increase WETLANDS 611 12% 1,834 61 24,450 4% 2% 5% 4%
AGRICULTURE 41 1% 413 54 12,401 1% 1% 3% 2%WATER 102 2% 305 10 4,068 1% 0% 1% 1%BARREN LAND 43 1% 217 22 2,598 1% 1% 1% 1%
SB5 3,078 29,188 2,542 313,5016% of Watershed Area URBAN 1,697 55% 24,917 2,379 256,568 85% 94% 82% 87%26% Impervious FOREST 751 24% 2,252 75 30,032 8% 3% 10% 7%6% Impervious Increase WETLANDS 497 16% 1,491 50 19,884 5% 2% 6% 4%
BARREN LAND 57 2% 284 28 3,413 1% 1% 1% 1%WATER 74 2% 223 7 2,975 1% 0% 1% 1%AGRICULTURE 2 0% 21 3 629 0% 0% 0% 0%
Calculated Pollutant Loading Percent Contribution

Table 3-10cCalculated Load as a Function of Land Use for the Confluence Sub-Basin
Subbasin Land UseArea
(Acres) Area (%)N
(lbs/yr) P (lbs/yr)TSS
(lbs/yr) N (%) P (%)TSS (%)
Average (%)
CFL1 5,911 52,146 4,441 557,10412% of Watershed Area URBAN 2,944 50% 43,094 4,113 436,919 83% 93% 78% 85%23% Impervious WATER 1,227 21% 3,680 123 49,062 7% 3% 9% 6%3% Impervious Increase FOREST 925 16% 2,776 93 37,018 5% 2% 7% 5%
WETLANDS 740 13% 2,220 74 29,599 4% 2% 5% 4%BARREN LAND 75 1% 376 38 4,506 1% 1% 1% 1%
Calculated Pollutant Loading Percent Contribution

Table 3-11Summary of Water Quality and Stream Visual Assessment Data for the North Branch
WQ sampling station
(Main Stem)NQ Poor 5.8
NP NP NP Fair 6.6 0.03 0.28 0.08 122.32 188 560 51.5 5.27
NO NO NO Good 8.5 0.45 121.14 187 266 51.8 5.2
NN NN NN Good 8.3 0.29 86.23 133 943 52.1 5.03
NM NM NM Good 8.9 0.25 75.72 117 219 51.9 5.68
NL NL NL Good 8.2 0.2 81.16 125 262 51.9 5.99
TUR2 Poor 4.6NK NK Poor 5.6 0.08 0.25 0.05 86.5 133 1070 51 6.28
NJ NJ NJ Good 7.9 0.24 99.08 152 498 51.4 6.46
STM1 STM1 Fair 6.3 0.38 150 229 54.5 5.27
NI NI Good 7.7 0.3 117.68 181 944 53.4 6.44
TR23-1 Fair 7.1
TM-8 Fair 6.3
NH NH Fair 7.4 0.28 114.21 176 989 51.5 6.38NG NG NG Fair 6.3 0.41 0.29 0.04 110.71 171 2050 52.1 6.39
NF NF NF Fair 6.6 0.31 131.61 203 586 51.3 6.47
NF14 NF14 Fair 6.4 0.39 220 203 401 58.4 5.81
CVS-1 Good 8.5
NE NE Good 8 0.33 127.85 194 876 52 6.4ND ND ND Good 8.1 0.58 0.002 0.31 0.03 115.53 178 685 52.7 6.3
NC NC NC Good 7.9 0.31 125.63 193 1193 52.1 6.37
HS-5 HS6 Poor 4.7 0.33 144 221 951 52.9 6.27
HS-5 SPC1 Poor 3.2 0.33 144 221 951 52.9 6.27
GH1 Poor 5.5
PB2 Fair 6.7
DB5 Poor 5.3DB1 Good 7.5
MF-3 MF3 Fair 6.2 0.12 58 90 4761 52 5.3
TKL1 Poor 5
MF-2 MF2 Fair 7 0.6 69 106 3502 53.8 5.92
SHB-2 SHB2 Poor 5.2 0.46 435 269 5218 53.5 6.02
SHB-1 SHB1 Fair 6.6 0.52 105 165 1479 54 6.24MF-1 MF1 Good 8.5 0.66 0.004 0.36 0.03 104 160 1093 51.7
GR2 Poor 5.7
GR4 Good 8.2
NBC Good 8.5
TR1-2 Poor 4.1
NB NB Good 8.8 0.31 107.62 165 339 53.5 6.18
CB-5 CB5 Fair 6.2 1.2 363 557 58.5 6.45
SH-3 Poor 4.7
SH-1 Poor 4.9
CB1 Fair 6.9NA NA Good 8.3 0.97 0.003 0.36 0.04 115.45 178 610 53.8 6.25
Note: Orange shading indicates notable change in one or more water quality parameters from upstream station(s).
NB
WQ sampling station
SVA site RankingHUC 14
NB3
NE
MF-1* ( NB)
NB4 MF-1* (NB)NB5
NA
pH
NB1
NK
NB2
NI
NH
Fecal Coliform
(counts/1
Temp (deg F)
Nitrate-N (mg/L)
NH3 (mg/L)
Total Phosphorus
(mg/L)
TDS (mg/L)
Conductance (uS/cm)
SVA score
Nitrite (mg/L)

Table 3-12Summary of Water Quality and Stream Visual Assessment Data for the South Branch
WQ sampling station
(Main Stem)SP
SO 0.21 166.1 256 120 51.9 3.77
SN 0.03 0.17 0.03 62.57 96 174 51.9 5.52
SM SM SM Good 7.7 0.18 41.63 64 306 52.6 5.42
SL SL SL Good 7.8 0.19 54.68 84 114 51.6 5.74
TR26-1 Good 7.8
TR27-2 Good 8.6
SK SK Fair 6.7 0.06 0.003 0.24 0.03 69.73 107 294 53.9 5.98
TR10-1 Good 7.9
TR7-1 Good 7.7
SJ SJ Good 7.5 0.2 73.67 113 146 52.8 6.39
TR12-2 TR12-2 Fair 7.3 0.42 231 336 51.9 5.83
TR12-1 TR12-1 Fair 6.8 0.37 205 315 52.5 6.42
TR13-5 Good 8.3
TR13-1 TR13-1 Fair 6.5 0.4 118 181 54.8 6.32
TR13-3 TR13-3 Fair 6.3 0.55 158 243 55.9 6.16
TR13-2 TR13-2 Fair 6.9 0.32 96 148 54.7 6.5
TR14-1 Fair 6.3
SI SI Good 7.8 0.25 89.28 137 184 55.8 6.41
TR15-1 Poor 6
SH SH Good 8.4 0.25 92.67 142 702 53.8 6.33
TR16-1 Fair 6.5
TR17-1 Fair 6.4
SG SG Fair 7.6 0.49 0.25 0.04 90.36 140 752 53 6.32
WP3 Good 7.3
WP1 Good 7.9
SF SF Fair 7.1 0.31 84.29 130 8098 52.9 5.93
CP-3 Poor 3.9
TR21-2 Poor 3.6
SE-P Poor 4
SE SE Fair 6.9 0.27 98.69 152 115 56 6.51
SD SD SD Good 8.2 0.44 0.004 0.26 0.03 97.55 147 198 56.5 6.35
SC SC SC Fair 6.9 0.29 104.46 161 189 56.1 6.4
SB1 SB1 SB1 Good 7.8 0.26 100.45 154 77 57.8 6.49
CTB-2 CTB-2 Fair 6.4 0.17 71 110 64 52 5.41
CTB-1 CTB-1 Good 7.5 0.3 95 146 178 52.8 6.27
TR4-1 Poor 5.3
SA-DEN Excellent 9.5
SA SA Good 8.7 0.52 0.002 0.27 0.03 98.02 151 215 57 6.39
POND6 Good 8.7BTMUA INTAKE
0.59 0.004 0.45 0.03 241.71 372 533 55.8 6.31
CBB-1 Fair 7 0.61 0.027 0.36 0.03 88 135 213 53.8 5.93
CBB-3 Poor 3.3 1.2 363 557 58.5 6.45
CBB-5 Fair 6.5
Note: Orange shading indicates notable change in one or more water quality parameters from upstream station(s).
SB3
SJ
SI
Nitrite (mg/L)
NH3 (mg/L)
HUC 14WQ
sampling station
VAPP site Ranking VAPP score
Nitrate-N (mg/L)
Temp (deg F)
pH
SB1
SB2 SK
Total Phosphorus (mg/L)
TDS (mg/L)
Conductance
(uS/cm)
Fecal Coliform (counts/1
CFL1
BTMUA INTAKE
Downstream of intake
SB4
SH
SG
SF
SE
SB5
SA

Table 3-13Summary of Pollutants of Concern by Sub-Basin
Subbasin Subwatershed Name Pollutant of Concern Documentation SourcesLand Uses with Highest
Loadings
Phosphorus TMDL Fertilizer, ManureAgriculture, Low Density
Residential,
PathogensTMDL (Fecal
Coliform)Manure, Wildlife
Agriculture, Low Density Residential,
Dissolved Oxygen 303d Wetlands Wetlands
Arsenic 303dNatural, orchards
(potentially)DDT, DDD, DDE 303d Pesticides; Agricultural
Turbidity 303d (draft 2012) Urban RunoffLead 303d (draft 2012) Urban runoff, industrial
PathogensTMDL (Fecal
Coliform)
Urban runoff, pet waste, waterfowl, wildlife, sewer
leaks and overflowsMedium Density Residential
Dissolved Oxygen 303d Upstream wetlandsWetlands, Medium Density
Residential
Temperature 303dImpoundments, cleared
bufferMedium Density Residential
Arsenic 303dNatural, orchards
(potentially)Medium Density Residential
Nitrogen, Conductivity, TDS
Other* Urban runoff Medium Density Residential
Turbidity 303d (draft 2012) Urban runoff
PathogensTMDL (Fecal
Coliform)
Urban runoff, pet waste, waterfowl, wildlife, sewer
leaks and overflows
Medium Density Residential Runoff
Biological 303d Unknown
Conductivity Other*Impervious Areas, Road
Deicing SaltMajor Roadways I-195, Rte 9
Runoff Volume Other* Urban runoff Urban Runoff
PathogensTMDL (Fecal
Coliform)Agriculture, Septics
Agriculture, Low Density Residential,
Phosphorus 303d Fertilizer, Manure, SepticsAgriculture, Low Density
Residential,
TSS 303d Row crops and animal farms Agriculture
Arsenic 303d Naturally occurring Medium Density Residential
Mercury 303d Unknown Atmospheric?
Temperature 303dImpoundments, cleared
bufferArsenic 303d Naturally occurring
Lead 303d (draft 2012) Urban runoff
Pathogens TMDL Manure, Septics, Wildlife Medium Density Residential
Arsenic 303d Naturally occurring
Dissolved Oxygen 303d Upstream wetlandsWetlands, Medium Density
ResidentialLead 303d (draft 2012) Urban runoff
Pathogens TMDLUrban runoff, pet waste,
waterfowl, wildlife, sewer leaks and overflows
Medium Density Residential
Turbidity 303d (draft 2012) Urban runoff
Pathogens TMDLUrban runoff, pet waste,
waterfowl, wildlife, sewer leaks and overflows
Medium Density Residential
Conductivity, TDS Other*Runoff Volume Other* Urban runoff
Stream and Lake Coliform Pathogens
TMDLUrban runoff, pet waste,
waterfowl, wildlife, sewer leaks and overflows
Medium Density Residential
Arsenic 303d Naturally occurring UrbanRunoff Volume Other* Urban runoff
Pathogens TMDLUrban runoff, pet waste,
waterfowl, wildlife, sewer leaks and overflows
Arsenic 303d Naturally occurring UrbanMercury 303d
Runoff Volume Other* Urban runoff UrbanLead 303d (draft 2012) Urban runoff
FloatablesBiological 303d
Enterococcus 303dArsenic 303d Naturally occurring
Runoff Volume Other* Urban runoff Urban
* Other pollutants of concern include Nitrogen, Phosphorus, and TSS to the Barnegat Bay; Conductivity, Nitrate, and TDS from monitoring results; and runoff volume impacting stream conditions from the visual assessment
NB3
NB4
NB1
NB2
NB5
SB1
SB2
SB3
SB4
CNFL1
SB5
Metedeconk R NB (above I-195)
Metedeconk R NB (Rt 9 to I-195)
Haystack Brook
Muddy Ford Brook
Metedeconk R SB (confluence to Rt 9)
Metedeconk R (Beaverdam Ck to confl)
Metedeconk R NB (confluence to Rt 9)
Metedeconk R SB (above I-195 exit 21 rd)
Metedeconk R SB (74d19m15s to I-195 X21)
Metedeconk R SB (Bennetts Pd to 74d19m15s)
Metedeconk R SB (Rt 9 to Bennetts Pond)

Table 4-1Summary of TMDLs within the Metedeconk River Watershed
TMDL Total Coliform Phosphorus
Segment N. Branch S. Branch Lake
Carasaljo Ocean County
Park Lake N. Branch (NB1)
Standard
NSSP: single sample 330
cfu/100ml and mean 70
cfu/100ml
SWQS: 0.1 mg/l
Percent Reduction
90% (overall)
90% (overall)
99% (overall)
96% (overall) 87% (overall)
89% (urban, ag, & marinas)
49.8% (overall) 84.9% (urban and ag)
Nitrogen Phosphorus TSSNB1 5,358 1,067 158,844NB2 25,199 4,339 446,157NB3 12,093 2,083 217,045NB4 5,858 1,091 144,841NB5 21,258 3,567 341,680SB1 1,979 398 62,894SB2 4,730 861 103,529SB3 11,072 1,981 222,902SB4 17,953 3,040 299,261SB5 12,220 2,025 187,754CNFL1 21,116 3,496 318,951
Stream Fecal Lake Fecal Coliform
SWQS: 10% of samples during 30 day period not to
exceed 400 cfu/100 ml; nor average 200
cfu/100 ml
HD: single sample 235 cfu/100ml
HUCLoad Reduction (lb/yr)
Table 4-2Estimated Load Reductions by HUC

Table 4-3Watershed Management Strategies Pertinent to the Metedeconk River Watershed
Relative SAC Ranking Best Management Practice
Reduce Stormwater Peak Flow
Improve Infiltration (Volume Control)
Promote Water Conservation & Reuse
Reduce Nutrient Loads
Reduce Sediment
Loads
Reduce Pathogen Loads
Improve Habitat
Potential for Public Involvement
General WQ Cost Effectiveness
1 Resource Conservation/Protection 3 3 2 3 3 3 3 2 2.3
2*Urban Green Stormwater Infrastructure
(UGSI)3 3 1 3 3 3 2 3 1.7
3 Infiltration Basin 3 3 1 3 3 3 2 2 2.0t4 Constructed Stormwater Wetland 3 2 1 3 3 2 3 2 3.0
t4 Constructed Stormwater Gravel Wetland 3 2 1 3 3 2 3 2 3.0
6 Upland Reforestation 3 3 0 3 3 3 3 2 1.37 Private Property BMPs 3 3 3 2 2 1 2 3 1.78 Bioretention Basin 3 2 0 3 3 3 2 2 2.79 Retrofit Existing Stormwater Basin 3 3 1 2 2 2 2 2 2.3
10 Vegetated Filter Strip 2 2 1 3 3 2 2 2 3.011 Agricultural BMPs 2 1 2 3 3 3 1 2 2.012 Removal of Impervious Surface 3 3 1 2 2 2 3 1 1.013 Buffer Restoration 2 2 0 2 3 2 3 3 1.014 Wet Pond 3 0 1 2 3 1 2 1 3.015 Improve/Repair Septic Systems 1 1 2 3 1 3 2 2 1.716 Grassed Swale 2 3 1 1 2 1 2 2 1.717 Sand Filter 2 2 1 3 3 2 1 1 1.7
18 Rainwater Harvesting (non-residential) 3 2 3 1 1 1 1 3 1.0
19 Stream Restoration 2 1 0 2 3 1 3 3 1.320 Extended Detention Basin 3 2 1 2 2 1 1 1 2.0
21Source Control (pet waste, fertilizer,
geese management))0 0 1 3 1 3 2 2 2.0
22 Dry Well 2 3 1 1 1 1 1 2 2.023 Off-line Regional Treatment 3 1 0 2 3 1 2 2 1.0
24Pervious Paving (porous asphalt,
concrete)2 3 1 1 1 1 1 3 1.0
25 Runoff Redirection 2 3 1 1 1 1 1 1 2.026 Green Roof (non-residential) 3 1 2 1 1 1 1 2 1.027 Improved Street Sweeping 1 1 0 2 2 2 1 1 2.028 Manufactured Devices 2 1 1 1 3 1 1 1 1.3
Notes:1. Scoring: 3 (high), 2 (average), 1 (low), 0 (not applicable)2. Stormwater bumpouts overall rank 2, but infiltration trenches and stormwater planters rank 6.

Table 5-1Subbasin Priority
Sub-BasinPriority Ranking Based on 303(d)
Rank Based on Impervious
Cover
Rank Based on Urban
Acres
Priority Ranking Based on Runoff
ReductionAverage
Overall Priority Ranking
NB2 1 5 3 4 2.50 1NB5 3 3 1 2 2.50 2SB5 3 1 4 2.5 2.75 3CFL1 6 2 5 3.5 4.75 4NB4 3 8 8 8 5.50 5NB1 2 10 10 10 6.00 6NB3 7 6 6 6 6.50 7SB4 10 4 2 3 6.50 8SB2 7 9 9 9 8.00 9SB3 10 7 7 7 8.50 10SB1 7 11 11 11 9.00 11

Table 5-2Prioritized Management Strategies by Subbasin
Watershed Priority
Subbasin Priority
Subbasin Location Priority Reason Source Conditions Land Use Type BMPs Potential Opportunity
1 AllStream Fecal TMDL Total Fecal Coliform TMDL
Urban Runoff, OSDSs, Sewer leaks and overflows, wildlife (waterfowl)
AllUrban Runoff Management, Goose control programs, OSDS Management, Sanitary Sewer Inspection
1 AllImplement Education and Outreach Program
All
2 1 NB1Multiple Row Crop Farms Along Ridge
Creek
Phosphorus TMDL, turbidity impairment
Agriculture - Row Crops and LivestockAgriculture, Low Density Residential
Agricultural; Fertilizer management
3 2 NB1Fertilizer from Low Density Residential;
Manure
Phosphorus TMDL, Stream Fecal TMDL, Total Fecal Coliform TMDL
Runoff from fertilizer and animal wasteLow Density Residential, Agriculture
Enforcement of Statewide Fertilizer Law; Geese management, Agricultural BMPs
4 1 SB4 Lake Carasajlo Lake Pathogens TMDLUnbuffered Pond Shorelines - Geese populations
ResidentialBuffer Restoration, Naturalized Shorelines; identify areas for installation of structural runoff controls
5 1 NB5Ocean County Park
LakeLake Pathogens TMDL
Unbuffered Pond Shorelines - Geese populations
Recreational Buffer Restoration, Naturalized Shorelines
6 1 NB2Residential
Subdivisions & Schools
Urban RunoffExisting stormwater basins, where existing, may not be providing highest level of treatment
Medium Density Residential
Stormwater Basins Retrofit, Structural Outfall BMPs, Source Control
High Visibility Demonstration Project
7 2 NB5 Route 9 (Lakewood) Urban RunoffVery large outfall (84") discharging directly to the North Branch
Residential, Commercial
Source control, Structural Outfall BMPsReduce water quality impact from significant source
8 1 CFL1 / SB5Lakewood Industrial
ParkUrban Runoff Loadings and Stream Degradation
Large Untreated Impervious Areas Directly Draining to River
IndustrialStormwater Basins Retrofit, Structural Outfall BMPs
9 1 NB4 Horse FarmsPhosphorus Impairment, Stream Fecal TMDL, Total Fecal Coliform TMDL
Runoff contacting manure Agriculture Agricultural BMPs
10 1 NB3 Open Space Total Fecal Coliform TMDLUnbuffered Pond Shorelines - Geese populations
Open Space Vegetative buffer for geese management
11 1 SB4, SB5Lakewood Industrial
ParkUrban Runoff Loadings and Stream Degradation
Large Untreated Impervious Areas Directly Draining to River
IndustrialStormwater Basins Retrofit, Structural Outfall BMPs, Source Control
Upgrade Existing SW Basins to Extended Detention
12 1 SB2Few Agricultural
ParcelsHigh Nutrient and TSS Loadings
Row crops Agricultural Agricultural BMPs
13 1 SB2 Jackson Mills Lake Nuisance Vegetation Prevalence of nuisance vegetationWetlands, Forest, Residential
Lake management strategies (continue winter lake level drawdown); Evaluate options for more comprehensive lake management.
14 1 SB3Residential
Subdivisions & Schools
Urban RunoffMostly untreated runoff directly connected to stream
Low, Medium, and High Density Residential
Stormwater Basins Retrofit, Structural Outfall BMPs, Source Control
Upgrade Existing SW Basins to Extended Detention
15 1 SB3 Lake EnnoNuisance Vegetation, Stream Fecal TMDL, Total Fecal Coliform TMDL
Prevalence of nuisance vegetationWetlands, Forest, Residential
Lake management strategies (continue winter lake level drawdown); Evaluate options for more comprehensive lake management.
16 1 SB1Agricultural Tract - Ely Harmony Road
High Nutrient and TSS Loadings
Row crops Agricultural Agricultural BMPs and Buffer Restoration

Table 5-2Prioritized Management Strategies by Subbasin
Watershed Priority
Subbasin Priority
Subbasin Location Priority Reason Source Conditions Land Use Type BMPs Potential Opportunity
17 2 NB2 Agricultural Parcels Nutrient and TSS Loadings Various Agricultural Agricultural BMPs
18 2 SB5Downtown Lakewood
Loading Hot Spot Commercial Structural BMPs Built in to Infrastructure
19 2 CFL1 Brick Plaza Loading Hot SpotExtensive Continuous Untreated Impervious Area Directly Draining to River
CommercialStructural BMPs Built into Infrastructure; Install educational signage at Cedar Bridge Branch crossings
High Visibility Demonstration Project
20 2 NB4 Agricultural Parcels
Phosphorus and TSS Impairment, Stream Fecal TMDL, Total Fecal Coliform TMDL
Agriculture - Row Crops and Livestock, Moderate Soil Erosion Potential
Agricultural, Residential
Agricultural BMPs, Streambank and Soil Stabilization
21 2 NB3Residential
Subdivisions & Schools
Urban RunoffExisting stormwater basins, where existing, may not be providing highest level of treatment
Medium Density Residential
Upgrade Existing Stormwater Basins, Structural Outfall BMPs, Source Control
22 2 SB4Lakewood Country
ClubColiform, Temperature Open Pond Shorelines Recreational Buffer Restoration, Naturalized Shorelines
Upgrade Existing SW Basins to Extended Detention
23 2 SB2Metedeconk National Golf
CourseColiform, Temperature
Unbuffered Pond Shorelines - Geese populations
Recreational Buffer Restoration, Naturalized Shorelines
24 2 SB3Few Agricultural
ParcelsHigh Nutrient and TSS Loadings
Row crops Agricultural Agricultural BMPsUpgrade Existing SW Basins to Extended Detention
25 2 SB1 Interstate I-195 Conductivity, Metals Untreated runoff Transportation Urban Runoff BMPs
26 3 NB2Commercial
Corridor Route 9Urban Runoff
Existing stormwater basins, where existing, may not be providing highest level of treatment
CommercialStormwater Basins Retrofit, Structural Outfall BMPs, Source Control
High Visibility Demonstration Project
27 3 NB5Woodlake Country
ClubTemperature Impairment, Coliform
Unbuffered Pond Shorelines - Geese populations
Recreational Buffer Restoration, Naturalized ShorelinesUpgrade Existing SW Basins to Extended Detention
28 3 SB5Residential
Subdivisions & Schools
Urban RunoffExisting stormwater basins, where existing, may not be providing highest level of treatment
Medium Density Residential
Stormwater Basins Retrofit, Structural Outfall BMPs, Source Control
Upgrade Existing SW Basins to Extended Detention
29 3 CFL1Residential
Subdivisions & Schools
Stream DegradationRelatively few existing stormwater basins
Medium and High Density Residential Development
Stormwater Basins Retrofit, Structural Outfall BMPs, Source Control
High Visibility Demonstration Project
30 3 NB4Residential
Subdivisions & Schools
Urban RunoffExisting stormwater basins may not be providing highest level of treatment
Medium Density Residential
Upgrade Existing Stormwater Basins, Source Control
31 3 NB1Utility Easements,
Agricultural ParcelsWater quality
Various areas identified as restoration priorities by UMASS
Wetlands, Agriculture, Residential
Buffer Restoration
32 3 NB3 Commercial Area Urban RunoffExisting stormwater basins, where existing, may not be providing highest level of treatment
Medium Density Residential
Stormwater Basins Retrofit, Structural Outfall BMPs, Source Control
33 3 SB4Lakewood Country
ClubNutrient Loadings Fertilizer Application for Turf Recreational Fertilizer Management
Upgrade Existing SW Basins to Extended Detention

Table 5-2Prioritized Management Strategies by Subbasin
Watershed Priority
Subbasin Priority
Subbasin Location Priority Reason Source Conditions Land Use Type BMPs Potential Opportunity
34 3 SB2Metedeconk National Golf
CourseNutrient Loadings Fertilizer Application for Turf Recreational Fertilizer Management
Upgrade Existing SW Basins to Extended Detention
35 4 NB2 Aldrich LakeTSS Loadings, Stream Fecal TMDL, Total Fecal Coliform TMDL, Nuisance Vegetation
Excessive TSS Loading, Geese populations, nuisance vegetation
ResidentialDredging, Geese management, lake management strategies
36 4 NB5 Agricultural TractHigh Nutrient and TSS Loadings
Row crops Agricultural Agricultural BMPs
37 4 SB5 Lake ShenandoahNuisance Vegetation, Total Fecal Coliform TMDL
Excessive nuisance vegetation, geese population
RecreationalLake management strategies, Buffer Restoration
38 4 NB4 Tributaries Water qualityVarious areas identified as restoration priorities by UMASS
Wetlands, Residential
Buffer Restoration
39 4 NB3 0TSS Loadings, Stream Fecal TMDL, Total Fecal Coliform TMDL
TSS build-up; Geese ResidentialDredging, Geese management, lake management strategies
40 4 SB4Residential
Subdivisions & Schools
Urban RunoffExisting stormwater basins, where existing, may not be providing highest level of treatment
ResidentialStormwater Basins Retrofit, Structural Outfall BMPs, Source Control
Upgrade Existing SW Basins to Extended Detention
41 4 SB2Residential Subdivision
Urban RunoffExisting stormwater basins, where existing, may not be providing highest level of treatment
Medium Density Residential
Stormwater Basins Retrofit, Structural Outfall BMPs, Source Control
Upgrade Existing SW Basins to Extended Detention
42 4 SB3South Branch &
TributariesConservation Large parcels identified by TPL Wetlands Land Acquisition
43 4 SB3South Branch &
TributariesWater quality
Various areas identified as restoration priorities by UMASS
Wetlands, Residential
Buffer Restoration
44 5 NB2 Interstate I-195 Transportation RunoffDecicing salt and vehicle related pollutants
Transporation Urban Runoff BMPsHigh Visibility Demonstration Project
45 5 NB5Woodlake Country
ClubNutrient Loadings Fertilizer Application for Turf Recreational Fertilizer Management
46 5 SB5South Branch &
TributariesWater quality
Various areas identified as restoration priorities by UMASS
Wetlands, Residential
Buffer Restoration
47 5 NB3 Tributaries Water qualityVarious areas identified as restoration priorities by UMASS
Wetlands, Residential
Buffer Restoration
48 5 SB4South Branch &
TributariesWater quality
Various areas identified as restoration priorities by UMASS
Wetlands, Residential
Buffer Restoration
49 5 SB2South Branch &
TributariesWater quality
Various areas identified as restoration priorities by UMASS
Wetlands, Residential
Buffer Restoration
50 6 NB2North Branch and
TributariesWater quality
Various areas identified as restoration priorities by UMASS
Wetlands, Residential
Buffer Restoration
51 6 NB5 0 Urban RunoffExisting stormwater basins may not be providing highest level of treatment
Medium Density Residential
Upgrade Existing Stormwater Basins, Source Control
Upgrade Existing SW Basins to Extended Detention
52 7 NB5Garden State
ParkwayTransportation Runoff
Decicing Salt and vehicle related pollutants
Transportation Urban Runoff BMPs
53 8 NB5North Branch and
TributariesWater quality
Various areas identified as restoration priorities by UMASS
Wetlands, Residential
Buffer Restoration

Table 5-3Potential Projects at Prioritized Stream Visual Assessments and Other Sites Identified by Stakeholders
Project Site Potential Strategies Rank HUC
TR23-1• Potential BMPs to manage parking lot itself, prevent erosion at parking lot edge leading to buffer area.• BMP at end of Woodlane Road• Source control within neighborhood
1 NB2
GR2
• Potential vegetated bumpout in front of fire hydrant where parking is restricted anyway. May require moving hydrant into bumpout depending on Fire Department’s preferences.• Space available directly at outfall behind chain link fence for bioretention and nicely visible.• Decentralized stormwater management practices (SMPs) throughout catchment neighborhood for source control.
1 NB5
GR4 Possible basin retrofit. 1 NB5
NF14• Some space directly upstream of large outfall could provide potential offline storage opportunity but likely would require extensive excavation/removal which can be costly.
1 NB5
SE-P
• Upstream side of bridge/culvert has space for potential offline storage/improvements.• Downstream side of bridge/culvert has some space for roadside bioretention upgrade of inlet that drops directly into culvert, leaving that inlet to handle bypass flow. Also, space directly next to inlet that drops into culvert could be used for bioretention as well.• Extensive sand eroding from surrounding properties. Stabilizing these areas is imperative to reduce sediment loads. • Extensive traffic and nearby school (Bais Rivka) provide high visibility site. Also, students of Bais Rivka could be potential partners/stewards of site. May be worth knowing if any transportation improvements (desperately needed) would impact this area and SMPs could piggy back on those improvements at future date.
1 SB5
CBB-3• Good opportunity to break up large area of impervious cover and provide education and outreach. • Possible opportunity for some channel improvements within the somewhat natural channel that runs through parking lot.
1 CFL1
SHB2 Possible basin retrofit. 1 NB4
GH1
• Possible retrofit on fire department property. • Identified as a restoration priority parcel byt the Trust for Public Land. • Meadow establishment on fire department property to curb geese/fecal• Enhancements to what already appears to be linear bioretention system along roadway.
1 NB3
SPC1
• Seemingly shallow groundwater conditions (reported by school administrator and apparent baseflow in channel when not raining).• High groundwater conditions could limit infiltration potential of site bioretention, but site topography could accommodate underdrains directed to channel.• Many exposed roof downspouts provide opportunity for above ground SMPs (i.e. downspout flow-through planters, rain barrels, cisterns) which could also be posed as rainwater harvesting opportunity.• In channel restoration (grading, planting, stabilization) directly in the channel on school property is an option.• Significant algae growth in short section of channel on school property could be mitigated.• Staff parking on grass is problematic and causes erosion. School administrator says it’s a problem. Grass pavers or pervious pavers may be an option for stabilizing, increasing parking, but not increasing impervious cover.
1 NB3
SG
• Possible basin retrofit of existing wet pond on northeast side of bridge.• Two direct discharge pipes into open area on southeast side of bridge are very accessible and could be rerouted through treatment SMPs in park area. Consider developing site as “stormwater park” with high visibility from roadway looking down to site. Site topography also could allow an attractive cascading pool affect.
1 SB4
TR12-1 Possible basin retrofit. 1 SB3
TR4-1 and surrounding area Lakewood industrial park; basin retrofits and runoff control 1 SB5Jackson Mills Lake (Jackson Twp) Lake restoration/dredging 2 SB2Lake Enno (Jackson Twp) Lake restoration/dredging 2 SB3Woodland Park (Jackson Twp) New BMP 2 NB2Claridge Dr and Ashford Rd (Jackson Twp) New BMP/basin where Jackson Twp added stabilization 2 NB2Cook & Hyson Rds (Jackson Twp) basin retrofits 2 SB3Weston Ct outfall (Jackson Twp) New BMP/basin 2 NB2Brookwood Pkwy outfall (Jackson Twp) New BMP/basin (various outfalls in cul-de-sac; stream restoration at Alaska Ave) 2 NB2Sherrybrooke Dr basin (Howell Twp) basin retrofits 2 NB2Concord Circle outfall (Howell Twp) New BMP 2 NB2Oak Street Core (Lakewood Twp) New regional stormwater BMP to handle growth area 2 CFL1
James & Prospect Streets Industrial Park (Lakewood Twp) Stormwater BMPs for redevelopment 2 SB4
MLK Blvd & Pine St. (Lakewood Twp) Stormwater management system improvements/BMPs 2 SB5County Line Rd, Aboretum Pkwy & Tanglewood Dr (Lakewood Twp)
Stormwater management system improvements/BMPs 2 NB2
Albert Avenue (Lakewood Twp) Stormwater management system improvements/BMPs 2 CFL1S. Lake Drive (along Lake Carasaljo) (Lakewood Twp) Stormwater management system improvements/BMPs 2 SB4
Coventry Square Condominium Assoc. (Lakewood Twp) Stormwater BMPs and river corridor protection/restoration 2 NB5
Lakewood Gardens Section 2 Outfall System (Brick Twp) Stormwater management system improvements/BMPs 2 CFL1
Hampshire Hills (Jackson Twp) basin retrofits 3 SB3Darien Rd outfall (Howell Twp) New BMP/basin 3 NB3Forge Pond Development (Brick Twp) Stormwater management system improvements/BMPs 3 CFL1Winding Ways (Jackson Twp) basin retrofits 4 SB460 Acres development (Jackson Twp) basin retrofits 4 SB4Meadowood Rd basin (Jackson Twp) basin retrofits 4 SB3Sun Hollow Rd detention basin (Howell Twp) basin retrofits 4 NB3Candlewood development (Howell Twp) New BMPs (numerous outfalls, currently unmapped) 4 NB3Lakewood Airport/Church & Dwight storm basin (Lakewood Twp)
Basin relocation/improvement 4 CFL1
14th Street (Lakewood Twp) Stormwater management system improvements/BMPs 4 NB2Cedar Bridge Manor (Brick Twp) Stormwater management system improvements/BMPs 4 CFL1Four Seasons at Metedeconk Lakes (Jackson Twp) retention basin/landscape maintenance 5 SB2Hedgewood Rd detention basin (Howell Twp) basin retrofits 5 NB3Brent Drive detention basin (Howell Twp) basin retrofits 5 NB3
Mount Rainier Dr. Basin (Ramtown; Block 42.06 Lot 17) Basin retrofit. Identified by Howell Township as candidate for constructed gravel wetland. 5 NB4

Table 5-3Potential Projects at Prioritized Stream Visual Assessments and Other Sites Identified by Stakeholders
Project Site Potential Strategies Rank HUCW Shenendoah Dr. Basin (Ramtown; Block 42.06 Lot 79.68)
Basin retrofit. Identified by Howell Township as candidate for constructed gravel wetland. 5 NB4
Iroquois Trail Pond (Jackson Twp) 5 SB4Brewers Bridge Road @ South Branch (Jackson Twp) County and municipal outfalls 5 SB4
Stormwater BMPs at Georgian Court University Stormwater BMPs, turf maintenance, runoff reduction, others 5 SB4
Estuarine areas Source control BMPs (GSI, decentralized SMPs); land acquisition and conservation 7 CFL1
Jackson Twp/Block: 52 Lot 1 SWMPT Site - Retrofit Basin (Crawford Rodriguez Elementary School) 8 NB2
Lakewood Twp/Block: 172 Lot 6&13 SWMPT Site - Retrofit Basin; Improve soil health to promote infiltration (W P Homeowners Association) 8 NB5
Brick Twp/Block: 1210 Lot 18 SWMPT Site - Retrofit Basin (Sovereign Bank) 8 NB5
Lakewood Twp/Block: 189.17 Lot 133 SWMPT Site - Retrofit Basin (Woodlake Greens) 8 NB5
Lakewood Twp/Block: 1051 Lot: 29 SWMPT Site - Retrofit Basin; Improve soil health to promote infiltration 8 SB5
Lakewood Twp/Block: 1603 Lot 2.01 SWMPT Site - Retrofit Basin 8 SB5
Lakewood Twp/Block: 1160 Lot: 246 SWMPT Site - Retrofit Basin; Lakewood Airport runway improvements and taxiway relocation 8 CFL1
Lakewood Twp/Block: 1600 Lot: 5 SWMPT Site - Retrofit Basin 8 CFL1
Lakewood Twp/Block: 345 Lot 9 SWMPT Site - Retrofit Basin on James Street; Improve soil health to promote infiltration (W P Homeowners Association) 8 SB4
Jackson Twp/Block: 75.01 Lot 1.04 SWMPT Site - Retrofit Basin in Bennetts Mills Plaza. 8 SB4
Jackson Twp/Block: 128.01 Lot 29 SWMPT Site - Retrofit Basin (Laurel Woods) 8 SB3
Jackson Twp/Block: 109.01 Lot: 53.08 SWMPT Site - Retrofit Basin (Albert Lee Subdivision) 8 SB3
Jackson Twp/Block: 135.11 Lot 32 SWMPT Site - Retrofit Basin (Hampshire Hills) 8 SB3
TR21-2Reach runs through residential area with no stormwater BMPs, site could be a part of a restoration plan for CP-3 and Lake Carasaljo
9 SB4
CP-3Reach is a possible site for streambank restoration to address erosion and restore riparian area, high stormwater flows or flow from the lake seems to be an issue, also could also be a candidate for on-site stormwater management such as rain gardens
10 SB4
TUR2Headwater stream, BMPs may be appropriate to address runoff from residential areas and commercial parking lots. May be opportunity for restoration of riparian buffer area and/or streambank.
11 NB1
SH-3Possible restoration and demonstration site to restore riparian buffer along the reach, opportunity for education and outreach. BMP for parking lot stormwater runoff. Lake management measures and waterfowl control would likely be beneficial. 12 NB5
HS6 Possible retrofits to upstream detention basins or on-site stormwater management on residential lots, e.g. rain gardens. 13 NB3
SH-1BMP to address parking lot runoff, could be part of a restoration project for CB1. Stormwater inlet should be flushed and maintained as well as upgraded to strain floatables.
14 NB5
TKL1 Reach may be a candidate for buffer restoration or agricultural BMPs in the adjacent areas 15 NB4NK Turbid water appearance may suggest NPS from agriculture, possible site for agriculture BMPs 16 NB2NQ Restoration of shoreline buffer around pond may deter waterfowl and filter nutrients from stormwater runoff. 17 NB1TR13-1 18 SB3TR13-2 18 SB3TR13-3 18 SB3TR13-5 18 SB3TR14-1 18 SB3TR15-1 18 SB4MF3 Reach is adjacent to a horse farm, possible site for agricultural BMP. Potential to improve the riparian area. 19 NB4
CB5The drainage area of this reach is a possible source of nonsource point pollution, reduction of stormwater volumes onsite or a BMP at the beginning of reach. Possible riparian buffer restoration.
20 NB5
TM-8 Possible retrofit of detention basin and BMPs to treat and control runoff from the shopping center 21 NB2
NFRestoration would need to address runoff from Rt 9 and businesses along Rt 9 such as parking lot BMPs. Potential for restoration of riparian area (lawn and unused parking lot area).
22 NB2
PB2Possible BMP for the parking lot runoff at Echo Lake. Echo Lake shoreline restoration/management and waterfowl control would likely be beneficial.
23 NB3
SKJackson Mills Lake (immediately upstream) would benefit from lake management measures to address nuisance vegetation problems, etc.
24 SB2
CB1BMP to address parking lot runoff and/or streambank restoration project, upstream detention basin near Joe Parker Rd may also be a possible retrofit to reduce flows. BMP for upstream nursery and expansion of riparian buffer upstream.
25 NB5
SCMay be opportunity for smaller BMPs at the western entrance to Lake Shenandoah County Park. Would provide a good opportunity for public education.
26 SB5
CBB-1The drainage area of this reach is a source of nonsource point pollution and high flows of stormwater runoff, restoration of this site would be in partner with upstream stormwater controls and streambank restoration at site CBB-1. Possible opportunity for basin retrofit and improvements in housekeeping and stormwater infrastructure maintenance at adjacent shopping center(s).
27 CFL1
TR12-2Since this is a headwater stream, detention basin retrofits could be considered, large residential lots to east of reach suggest this area was more recently developed. Sampling data at TR12-1 indicates high conductivity. This may be a priority reach for restoration since historical data is available.
28 SB3
DB-1Agricultural BMPs may be beneficial at the herb farm adjacent to the reach. May also be an opportunity to improve riparian buffers.
29 NB3
SI Lake Eno (immediately upstream) would benefit from lake management measures to address nuisance vegetation problems, etc. 30 SB4
SD Baseball complex may be a site for BMPs, commercial area could be a source of NPS and possible sites for stormwater retrofits 31 SB5
CVS-1Possible BMP demonstration site to address runoff from apartment complex. Possibility of reestablishing some riparian buffer area; dumping occurring along reach – fencing would be beneficial.
32 NB5
SA May be a good place for BMPs or other stormwater treatment facilities since site is upstream from the BTMUA intake 33 SB5NA BMP at the Garden State Parkway median just upstream of the reach. 34 NB5
All SitesRetrofit catch basins - adding inlet plates (e.g. Campbell-ERS “Grate Plate”) to open throat portions of inlets to help reduce trash deposition either within the catchment of the site or directly at the site (minimum) depending on further review of each site’s catchment.
Each of these sites has detention basins in the vicinity that may be good candidates for retrofit. Basin TR15-1 has lowest SVA score and is classified as "Poor"