Goa Economy in Figures 2015
21
Goa Economy in Figures-2015 1 DIRECTORATE OF PLANNING, STATISTICS & EVALUATION PANDIT DEENADAYAL UPADYAY BHAVAN, ALTO PORVORIM Web site: goadpse.gov.in Phone No: 0832 2417443/2417439 Fax No. 0832-2417437 Swatch Bharath- Nital Goen
-
Upload
gilbert-rozario -
Category
Documents
-
view
218 -
download
0
description
Goa Economy
Transcript of Goa Economy in Figures 2015

Goa Economy in Figures-2015
1
DIRECTORATE OF PLANNING, STATISTICS & EVALUATION PANDIT DEENADAYAL UPADYAY BHAVAN, ALTO PORVORIM
Web site: goadpse.gov.in Phone No: 0832 2417443/2417439 Fax No. 0832-2417437
Swatch Bharath- Nital Goen

Goa Economy in Figures-2015
2
FOREWORD
It is of immense pleasure to release this small brochure containing
“Goa Economy in figures - 2015 " which gives important Statistical indicators as at the time of
Statehood in 1987 and those for the years 2013-14 & 2014-15. The vide array of Socio- Economic
Indicators presented in the brochure will enable readers to comprehend at a glance the impressive
progress registered by the State since it attained Statehood.
The valuable cooperation extended by the various Departments of the State Government, Local
Bodies, Government of India and other organizations in making available the requisite data to bring
out this publication in time is gratefully acknowledged.
The hard work put in by staff of the Publication Division in bringing out this brochure is also
acknowledged.
Constructive suggestions to improve the brochure in future are always welcome.
(Anand Sherkhane)
Director
Place: Panaji – Goa.
Date: 30 /05/2015.

Goa Economy in Figures-2015
3
GOVERNMENT OF GOA GOA ECONOMY IN FIGURES 2014
Item
At the time
Unit of attaining 2013-14 2014-15
Statehood
(1987-88)
1 2 3 4 5
I. Administrative structure
1. Geographical area Sq.Kms 3,702 3,702 3,702 2. Districts No. 2 2 2
3. Talukas " 11 12 12 4. Towns No. 15 70 70
a) Municipal Towns " 9 14 14
b) Census Towns " 6 56 56
5. Villages No. 407 334 334
a) Inhabited revenue villages " 398 320 320
b) Uninhabited revenue villages " 9 9 9
c) Sub-merged revenue villages " - 5 5
6.Villages included in
Urban Agglomeration " 12 7 7
7. Village Panchayats " 186 189 190

Goa Economy in Figures-2015
4
Item
At the time
Unit of attaining 2013-14 2014-15
Statehood
(1987-88)
1 2 3 4 5
I. Administrative structure (Concld.)
8. Blocks No. 10 12 12 9. Members of Parliament
i) Lok Sabha No. 2 2 2
ii) Rajya Sabha " 1 1 1
10. Members of Legislative Assembly " 28 40 40
II. Population#
1. Total Lakh 10.08 14.59 14.59
i) Males " 5.10 7.39 7.39
ii) Females " 4.98 7.20 7.20
2. Rural " 6.85 5.52 5.52
i) Males " 3.41 2.76 2.76
ii) Females " 3.44 2.76 2.76
3. Urban " 3.23 9.07 9.07
i) Males " 1.69 4.64 4.64
ii) Females " 1.54 4.43 4.43
4. Sex-ratio (Females per 000' males) Ratio 975 973 973
5. Scheduled Castes No. 20,619 25,449 25,449
6. Scheduled Tribes No. 690 1,49,275 1,49,275
# Column no. (3),is as per Population Census 1981,Column no. (4) & Column no. (5) are as per Population Census 2011.

Goa Economy in Figures-2015
5
Item At the time
Unit of attaining 2013-14 2014-15
Statehood
(1987-88)
1 2 3 4 5
II. Population (Concld.)#
7. Total workers Lakh 3.56 5.77 5.77
8. Percentage of total workers to
total population. Percent 35.35 39.58 39.58
9. Density Persons/Sq.km 272 394 394
10. Average household size No. 5.10 4.24 4.24
11. Decennial growth of population Percent 26.74 8.23 8.23
12. Literacy rate Percent 57.25 88.70 88.70
i) Male " 65.99 92.65 92.65
ii) Female " 48.29 84.66 84.66
13. Rural " 53.56 86.65 86.65
i) Male " 63.06 91.71 91.71
ii) Female " 44.15 81.63 81.63
14. Urban " 65.08 89.95 89.95
i) Male " 71.88 93.21 93.21
ii) Female " 57.57 86.56 86.56
# Column no. (3), is as per Population Census 1981, Column no. (4) & Column no. (5) are as per Population Census 2011.

Goa Economy in Figures-2015
6
Item At the time
Unit of attaining 2013-14 2014-15
Statehood
(1987-88)
1 2 3 4 5
III. State Income 1. Net State Domestic Product i) At current prices Rs.in Crore 670.48 42563.82(Q) NA ii) At constant prices " 393.13 26092.41(Q) NA 2. Per Capita Income i) At current prices Rs. 5,696 224138(Q) NA ii) At constant prices " 3,340 137401(Q) NA
IV. Budget RE BE 1. Tax revenue Rs.in Crore 54.07 4530.88 5092.58 2. Non-tax revenue " 42.15 1782.56 2380.51 3. Development expenditure " i) Revenue Account " 117.18 5069.36 5811.16 4. Non-development expenditure " i) Revenue Account " 53.84 2022.85 2288.30 5. Capital receipts* " 63.77 19992.48 20811.93 6. Capital disbursement* " 94.78 20431.51 21030.61
Q: Quick figures, RE: Revised Estimates, BE: Budget Estimates, NA: Not Available * : includes public account

Goa Economy in Figures-2015
7
Item
At the time
Unit of attaining 2013-14 2014-15
Statehood
(1987-88)
1 2 3 4 5
V. Taxes 1. Net Customs Revenue collected Rs.in Crore 25.08 914.92 847.71 2. Net Central Excise Revenue " 84.80 392.68 376.58 3. Commercial Tax / VAT (Net total) ‘’ 45.07 1708.05 1870.50(P) i) Local (VAT/ST) " 41.10 1623.22 1775.58(P) ii) Central Sales Tax " 3.97 84.83 94.92(P) 4. Entertainment Tax collected " 0.77 109.59 122.95(P)
VI. Annual Plan # 1. Agriculture and allied services Rs.in Crore 5.59 157.67 341.08 2. Rural Development " 0.66 67.19 128.79 3. Irrigation and flood control " 16.10 170.90 238.51 4. Energy " 5.63 177.26 248.81 5. Industries and Minerals " 4.94 92.93 253.72 6. Transport " 11.79 249.53 412.29 7. Science, Tech.& Environment " 0.18 76.96 111.78 8. Social Services " 31.99 1356.25 2336.28 9. General Economic Services " 1.61 146.27 199.65 10. General Services " 11.09 35.83 268.15 11. Special Area Dev. Programme " - 5.99 11.50 Total " 89.58 2536.78 4550.56
P: Provisional # : Figures for the year 2013-14 are actual expenditure and for 2014-15 is approved annual plan out lay
Goa Economy in Figures-2015
8
Item
At the time Unit of attaining 2013-14 2014-15
Statehood (A) (P)
(1987-88)
1 2 3 4 5
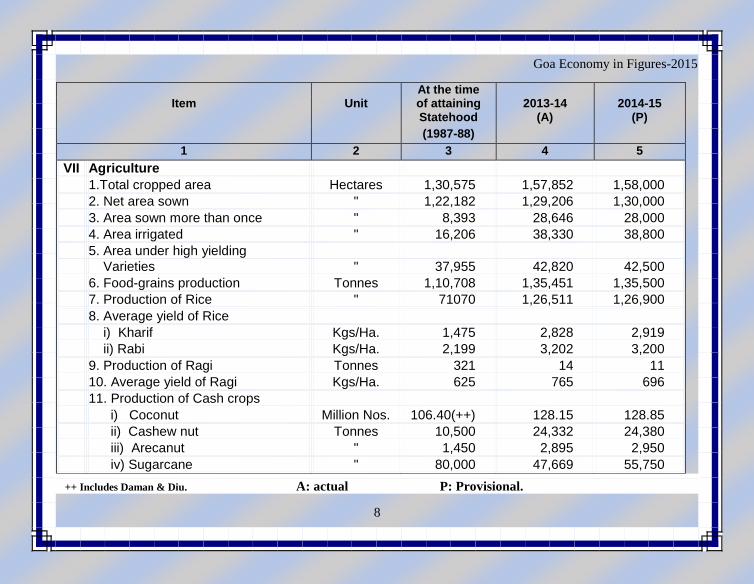
VII Agriculture
1.Total cropped area Hectares 1,30,575 1,57,852 1,58,000
2. Net area sown " 1,22,182 1,29,206 1,30,000
3. Area sown more than once " 8,393 28,646 28,000
4. Area irrigated " 16,206 38,330 38,800
5. Area under high yielding
Varieties " 37,955 42,820 42,500
6. Food-grains production Tonnes 1,10,708 1,35,451 1,35,500
7. Production of Rice " 71070 1,26,511 1,26,900
8. Average yield of Rice
i) Kharif Kgs/Ha. 1,475 2,828 2,919
ii) Rabi Kgs/Ha. 2,199 3,202 3,200
9. Production of Ragi Tonnes 321 14 11
10. Average yield of Ragi Kgs/Ha. 625 765 696
11. Production of Cash crops
i) Coconut Million Nos. 106.40(++) 128.15 128.85
ii) Cashew nut Tonnes 10,500 24,332 24,380
iii) Arecanut " 1,450 2,895 2,950
iv) Sugarcane " 80,000 47,669 55,750
++ Includes Daman & Diu. A: actual P: Provisional.

Goa Economy in Figures-2015
9
Item
At the time Unit of attaining 2013-14 2014-15
Statehood (1987-88)
1 2 3 4 5
VIII Animal Husbandry
1. Production of milk Tonnes 25,000 67.909 66.600
2. Production of eggs Lakhs. 80 59.67 74.52
IX. Livestock
1. Livestock No. 3,16,193 1,98,424 1,98,424
a. Cattle No. 1,12,016 57,480 57,480
b. Buffaloes " 40,812 31,798 31,798
c. Pigs " 85,955 43,567 43,567
d. Others " 77,410 65,579 65,579
2. Poultry ,, 6,08,135 2,92,08 2,92,028
X. Fisheries
1. Marine fish catch
i) Quantity Tonne 27,210 1,09,574 1,14,700
ii) Value Rs. in lakh 1,052 1,18,125 97,844
2. Inland fish catch
i) Quantity Tonne 1,430 4,485 3,276
ii) Value Rs. in lakh 161 6,066 4,999
Source: Livestock Census -2012

Goa Economy in Figures-2015
10
Item
At the time
Unit of attaining 2013-14 2014-15
Statehood (1987-88)
1 2 3 4 5
XI. Electricity
1. Towns electrified No. 15 Fully Electrified Fully Electrified
2. Villages electrified " 377 Fully Electrified Fully Electrified
3. Electricity consumed M. Kwh 376.2 2962 3114
4. Domestic consumption " 94.4 808 737
5. Commercial consumption " 27.8 291 268
6. Industrial consumption " 170.5 1518 1699
7. Consumption for irrigation Purposes " 6.3 21 31
8. Other purposes " 77.2 315 342 9. Per capita consumption Kwh 368 1974 2076
XII. Cooperation
1. Cooperative Societies/ Banks No. 690 4046 4245(P)
2. Members " 2,65,110 1098359 1230018(P)
3. Share Capital Rs. in crores 18.49 261.1454 291.344(P)
4. Working Capital " 171.54 11457.9083 12458.353(P)
5. Deposits " 109.25 4956.1309 4911.8883(P)
6. Loans Advanced " 61.78 2790.6310 2797.6054(P)
7. Loans Outstanding " 93.72 2967.6738 3015.389(P)
8. Sales " 53.95 11585.9386 11159.1453(P)
9. Profit " 2.23 125.9573 250.84398(P)
10.Loss " 0.72 77.0464 318.8351(P)
P Provisional.

Goa Economy in Figures-2015
11
Item At the time Unit of attaining 2013-14 2014-15
Statehood (1987-88)
1 2 3 4 5
XIII Banking
1. Banking Offices No. 300 761 N.A
2. Deposits Rs. in crores 1,059.91 48553.03 N.A
3. Credits " 368.10 16089.89 N.A
4. Average population served per
Banking Office No. 3,966 2426 N.A
XIV Industries
1. Micro, Small and Medium No
Enterprises. No. 3,900* 7807 7967
2. Large Scale Industries. No. 37** 188 192
3. No. of Factories registered
under Factories Act, 1948
and in operation " 240 678 737
XV Minerals
1. Mineral production Lakh Tonnes 136.40 4.44 2.685
a. Iron Ore “ 136.01 Nil Nil
b. Manganese Ore “ 0.04 Nil Nil
c. Ferro-Manganese Ore “ 0.29 Nil Nil
d. Bauxite “ 0.06 4.44 2.685
N.A Not Available; * Small scale industrial units; * * Large and medium industrial units. There was no production of iron and manganese ore during 2014-15 due to ban on production.
Goa Economy in Figures-2015
12
Item
At the time Unit of attaining 2013-14 2014-15
Statehood (1987-88)
1 2 3 4 5
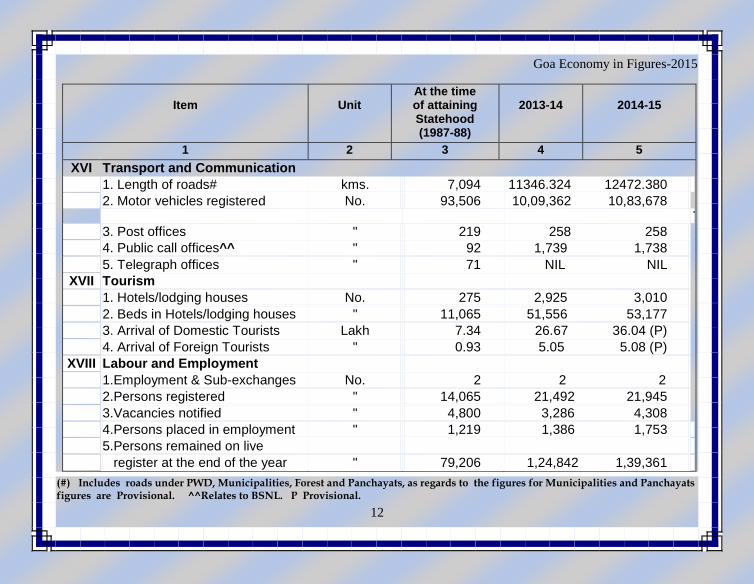
XVI Transport and Communication
1. Length of roads# kms. 7,094 11346.324 12472.380
2. Motor vehicles registered No. 93,506 10,09,362 10,83,678 9,38,37
3. Post offices " 219 258 258
4. Public call offices^^ " 92 1,739 1,738 17
5. Telegraph offices " 71 NIL NIL
XVII Tourism
1. Hotels/lodging houses No. 275 2,925 3,010 2925
2. Beds in Hotels/lodging houses " 11,065 51,556 53,177
3. Arrival of Domestic Tourists Lakh 7.34 26.67 36.04 (P)
4. Arrival of Foreign Tourists " 0.93 5.05 5.08 (P)
XVIII Labour and Employment
1.Employment & Sub-exchanges No. 2 2 2
2.Persons registered " 14,065 21,492 21,945
3.Vacancies notified " 4,800 3,286 4,308
4.Persons placed in employment " 1,219 1,386 1,753
5.Persons remained on live
register at the end of the year " 79,206 1,24,842 1,39,361
(#) Includes roads under PWD, Municipalities, Forest and Panchayats, as regards to the figures for Municipalities and Panchayats figures are Provisional. ^^Relates to BSNL. P Provisional.

Goa Economy in Figures-2015
13
Item
At the time Unit of attaining 2013-14 2014-15
Statehood
(1987-88)
1 2 3 4 5
XIX. State Govt. Employees **
1. Regular No. N.A. 51,860 51,860
2. Adhoc " N.A. 493 493
3. Work charged 4. Others
". N.A. N.A.
2,766 2,889
2,766 2,889
Total " N.A. 58,008 58,008
XX. Education
1. No. of Educational Institutions
a. Primary Level No. 1,240 1234 1210
b. Middle Level ". 419 441 460
c. Secondary Level " 311 395 400
d. Higher secondary Level " 27 92 103
e. Vocational and Professional “ 31 31 30
(School and Post Matric level)
f. Teachers Training Institutes " 2 5 5
g. University & Colleges for
General Education " 12 25 25 h. University & Colleges for
Professional Education " 12 27 27
** The figures in col.4and5 are as per “A Report on the Census of Government Employees 2013”. The date of reference is 31- 03-2013 and
includes Employees in State Government, Public Sector undertakings & Grant in Aid Institutions. N. A. Not Available;

Goa Economy in Figures-2015
14
Item
At the time
Unit of attaining 2013-14 2014-15
Statehood
(1987-88)
1 2 3 4 5
XX. Education ( concluded) 2. Enrolment a. Primary Level No. 1,14,915 98,724 96,139
b. Middle Level " 84,492 72,529 72,121
c. Secondary Level " 62,598 73,529 74,641
d. Higher Secondary Level " 14,513 30,465 34,036
e. Vocational and Professional 5,713 8,641 8,861
(School Level & Post Matric Level) "
f. Teachers Training Institutes " 627 641 625
( Diploma and Degree Level;)
g. University Colleges for General
Education " 8,886 18,931 19,304
h. University Colleges for
Professional Education No. 2,476 10,183 10,836
3. Out-turn
a. Matriculates Passed " 9,231 16,727 N.A
b. Graduates/Post Graduates Passed ‘’ 2,169 7,926 N.A
N.A Not Available.

Goa Economy in Figures-2015
15
Item
At the time Unit of attaining 2013-14 2014-15
Statehood (1987-88)
1 2 3 4 5
XXI. Medical and Health Services 1. Government Hospitals No. 31 41* 41* 2. Private Hospitals " 82 121(P) 123(P) 3. Beds in Govt. Hospitals " 2,371 3,160 3,118 4. Beds in Private Hospitals " 1,312 2,732(P) 2,796(P) 5. Health Centers: a. Community Health Centres " 3 4 4 b. Primary Health Centres " 14 21 21 c. Urban Health Centres " 5 5 5 d. Rural Medical Dispensaries " 29 31 31 e. Sub Centres " 166 207 207 f. Dental Clinics " 17 28 28 g. Medical Dispensary " - 1 1 6. Sterilisations performed " 4,457 3,785 3,483 7. Intra Uterine Device inserted " 3,162 2,229 2,051 8. Contraceptive users
(C.C.U. + O.P Users) " 11,033 13,652 13,352
9. Doctor population ratio Ratio 1:882 1:716 1:795 10.Bed population ratio " 1:316 1:266 1:273
*: State and Central Government Hospitals and all PHCs with/without beds. . P Provisional.

Goa Economy in Figures-2015
16
Item At the time
Unit of attaining 2013-14 2014-15
Statehood
(1987-88)
1 2 3 4 5
XXI Vital Statistics 3
1. Registered Marriages No. 5,540 2,229* 11,919**
2. Birth rate per '000' population " 18.24 14.7 14.6
3. Death rate per '000' population " 6.72 8.26 8.5
*: For the Calendar year 2013 **: For the calendar year 2014

Goa Economy in Figures-2015
17
XXIII
TWENTY POINT PROGRAMME (TPP) – 2006 for quarter ending March 2015
Item Code
Item Name/Sub item Name Unit Achievement
1 2 3 4
01 A – Employment generation under the NREG Scheme
01A01 No. of job cards issued No. 1,175 01A02 Employment generated No.of
Mandays 1,73,732
01A03 Wages given Rs. In lakhs 293.47
01B-Swaranjayanti Gram Swarojgar Yojana (SGSY)
01B01 Individual swarojgaries assisted No. - 01B02 Individual SC swarojgaries assisted " - 01B03 Individual ST swarojgaries assisted " - 01B04 Individual women swarojgaries assisted " - 01B05 Individual disabled swarojgaries assisted " -
01E-Self Help Groups(SHG)
01E01 Formed under SGSY No. - 01E02 To whom income generating activities
provided " -
03E Distribution of waste land to the landless
03E01 Total land distributed Hectare - 03E02 Land distributed to SC " - 03E03 Land distributed to ST " - 03E04 Land distributed to others " -

Goa Economy in Figures-2015
18
XXIII
TWENTY POINT PROGRAMME (TPP) – 2006
Item Code
Item Name/Sub item Name Unit Achievement
1 2 3 4
06A-Rural Housing-Indira Awaas Yojana
06A01 Houses constructed No. 1606
06B- EWS/LIG Houses in Urban Areas
06B01 Houses constructed No. 22
07A – Rural Area National Rural Drinking Water Programme (NRDWP)
07A03 Habitations covered(Partially covered & slipped back) No. - 07A04 Coverage of water quality affected habitations " -
08E- Institutional Delivery
08E01 Delivery institutions No. 15,138
10A- Scheduled Caste (SC) Families Assisted
10A01 SC families assisted No. -
10A 02 SC Families assisted under NSDC for loan/grant No.
-
10A 03 SC Families assisted under NSFDC for skill Development training programme
No -
10A 04 SC students assisted under post- matric scholarship No 352
12A- Universalization of Integrated Child Development Scheme (ICDS)
12A01 ICDS Block Operational(Cumulative) No. 12

Goa Economy in Figures-2015
19
XXIII
TWENTY POINT PROGRAMME (TPP) - 2006
Item Code
Item Name/Sub item Name Unit Achievement
1 2 3 4
12B - Functional anganwadis
12B01 Anganwadis Functional(Cumulative) No. 1,262
14A- No. of urban poor families assisted under Seven Point Chapter
14A01 Poor families assited -
15A-Aforestation (Public and Forest Lands)
15A01 Area covered under plantation Hectares 345.75 15A02 Seedlings planted No. 4,50,000
17-Rural Roads-PMGSY
17A01 Length of road constructed kms -
18B-Rajiv Gandhi Grameen Vidyutikaran Yojana
18B01 Villages electrified No. -
18D –Energising pump sets
18D01 Pumps sets energized No. 259
Goa Economy in Figures-2015
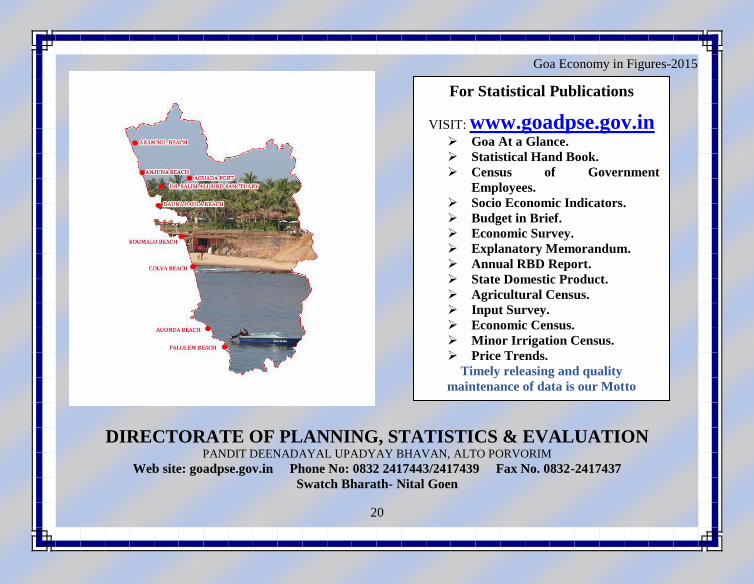
20
DIRECTORATE OF PLANNING, STATISTICS & EVALUATION PANDIT DEENADAYAL UPADYAY BHAVAN, ALTO PORVORIM
Web site: goadpse.gov.in Phone No: 0832 2417443/2417439 Fax No. 0832-2417437
Swatch Bharath- Nital Goen
For Statistical Publications
VISIT: www.goadpse.gov.in Goa At a Glance.
Statistical Hand Book.
Census of Government
Employees.
Socio Economic Indicators.
Budget in Brief.
Economic Survey.
Explanatory Memorandum.
Annual RBD Report.
State Domestic Product.
Agricultural Census.
Input Survey.
Economic Census.
Minor Irrigation Census.
Price Trends.
Timely releasing and quality
maintenance of data is our Motto
Goa Economy in Figures-2015
21