Gnocchi v3
42
Gnocchi v3
-
Upload
gordon-chung -
Category
Technology
-
view
504 -
download
0
Transcript of Gnocchi v3

Gnocchi v3

Optimisation opportunities
▹ Improve coordination▸ A lot of contention for same job
among workers resulting in wasted operations
▹ Performance degradation in large series▸ Larger file == slower read▸ Larger file == slower write

Coordinated SchedulingMinimising contentions
metricdmetricdworker
worker
worker
worker
worker
worker
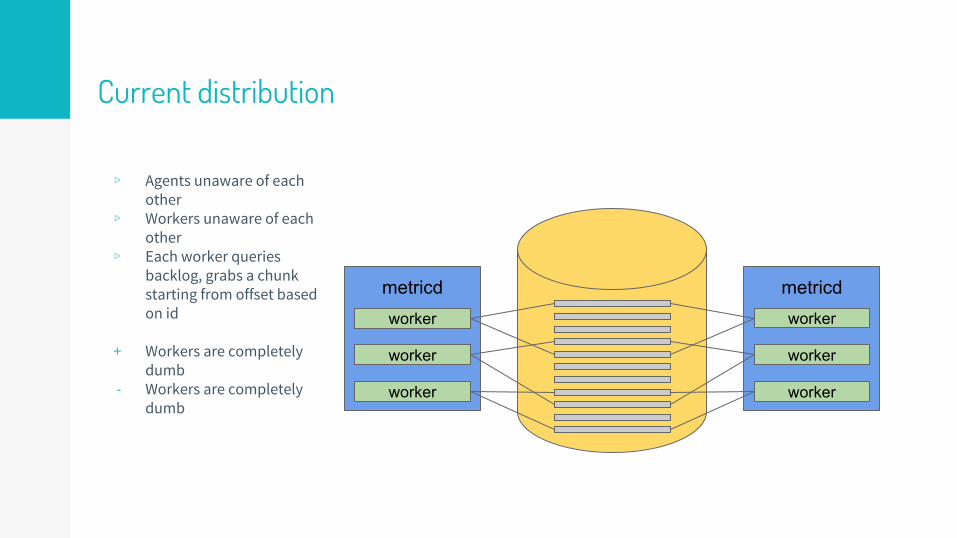
Current distribution
▹ Agents unaware of each other
▹ Workers unaware of each other
▹ Each worker queries backlog, grabs a chunk starting from offset based on id
+ Workers are completely dumb
- Workers are completely dumb
metricdscheduler
wor
ker
wor
ker
wor
ker
metricdscheduler
wor
ker
wor
ker
wor
ker
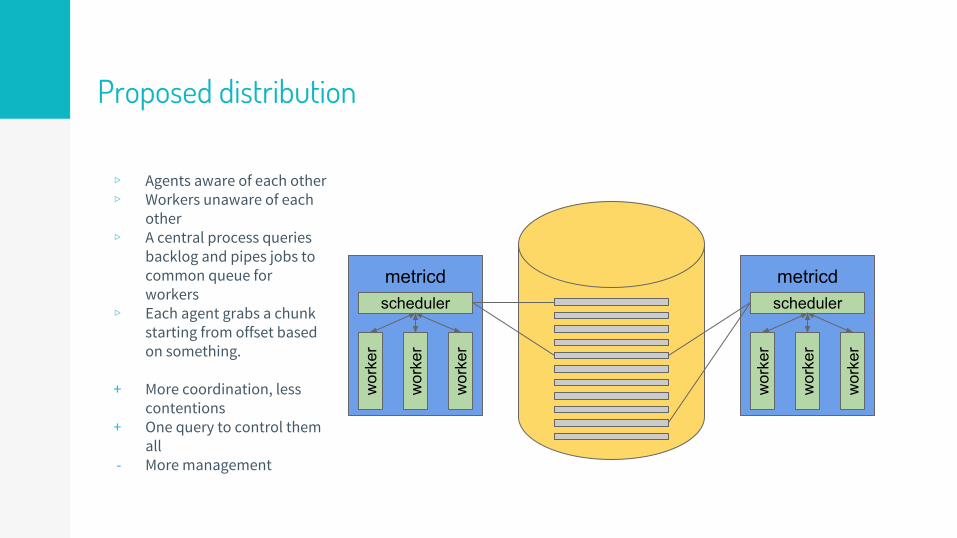
Proposed distribution
▹ Agents aware of each other▹ Workers unaware of each
other▹ A central process queries
backlog and pipes jobs to common queue for workers
▹ Each agent grabs a chunk starting from offset based on something.
+ More coordination, less contentions
+ One query to control them all
- More management

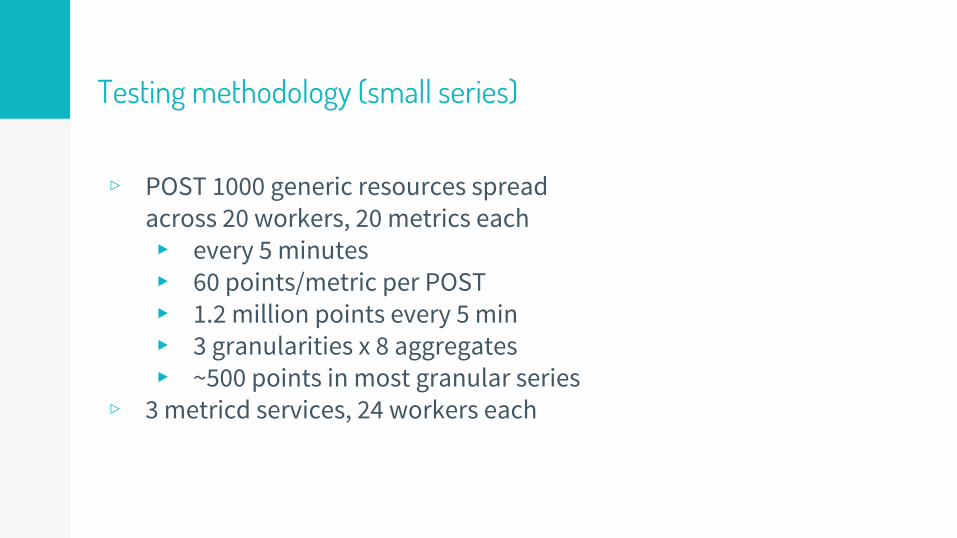
Testing methodology (small series)
▹ POST 1000 generic resources spread across 20 workers, 20 metrics each▸ every 5 minutes▸ 60 points/metric per POST▸ 1.2 million points every 5 min▸ 3 granularities x 8 aggregates▸ ~500 points in most granular series
▹ 3 metricd services, 24 workers each

Processing time
~4% to ~23% improvement.

Minimising operations
Writing with Offsets
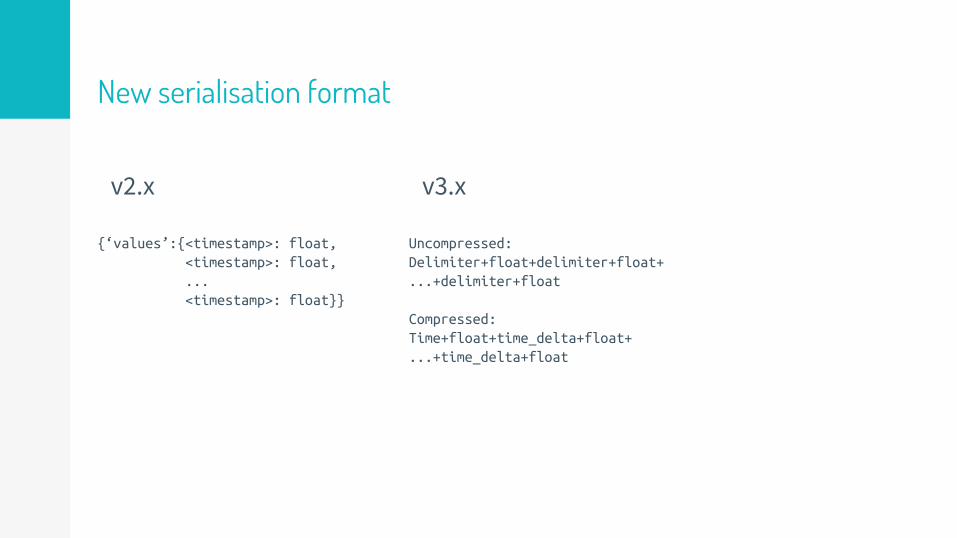
v2.x
{‘values’:{<timestamp>: float, <timestamp>: float, ... <timestamp>: float}}
New serialisation format
v3.x
Uncompressed:Delimiter+float+delimiter+float+...+delimiter+float
Compressed:Time+float+time_delta+float+...+time_delta+float
Testing methodology (small series)
▹ POST 1000 generic resources spread across 20 workers, 20 metrics each▸ every 5 minutes▸ 60 points/metric per POST▸ 1.2 million points every 5 min▸ 3 granularities x 8 aggregates▸ ~500 points in most granular series
▹ 3 metricd services, 24 workers each

Amount of time required to compute 1.2M points into 20K metrics of 24 different aggregations.

Testing methodology (medium series)
▹ POST 500 generic resources spread across 20 workers, 20 metrics each▸ every 5 minutes▸ 720 points/metric per POST▸ 7.2 million points every 5 min▸ 3 granularities x 8 aggregates▸ ~7000 points in most granular series
▹ 3 metricd services, 24 workers each

Time to compute 720 data points into 24 different aggregates and store data

Total metrics processed. 10K metrics sent periodically.A higher slope represents faster processing rate

Gnocchi v2.1.4 vs Gnocchi v3.0
Old vs New

Release notes v3
▹ New storage format for new, back window and aggregated series (msgpacks vs struct serialisation)
▹ Storage compression▹ No-read append writes (Ceph only)▹ Dynamic resource configuration▹ Coordinated task scheduling▹ Performance related changes to aggregation logic▹ Grafana 3.0 support
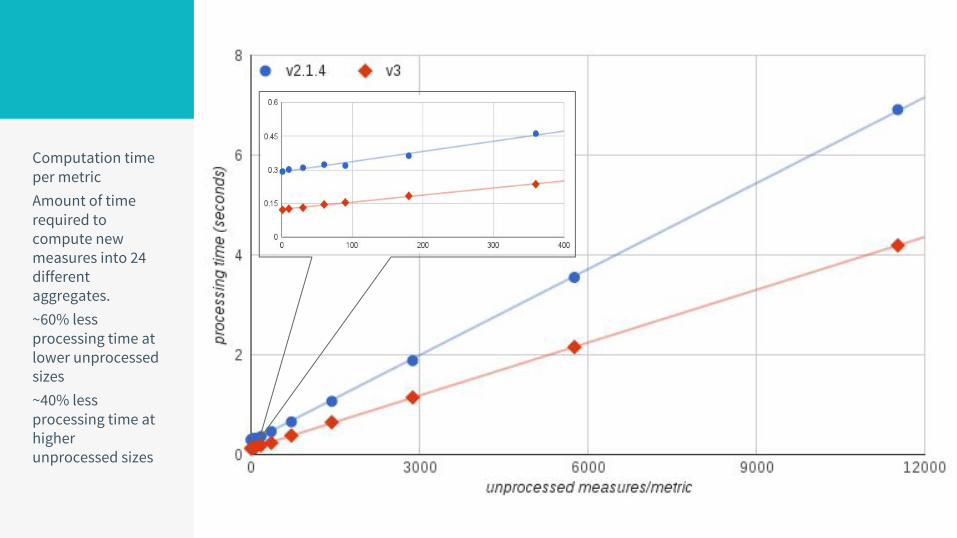
Computation time per metricAmount of time required to compute new measures into 24 different aggregates.~60% less processing time at lower unprocessed sizes~40% less processing time at higher unprocessed sizes

Write throughputData generated using benchmark tool in client. 32 single-threaded api server processes, 4x12threads client.Gnocchi writes to disk but will be enhanced to write to memory (for Ceph)
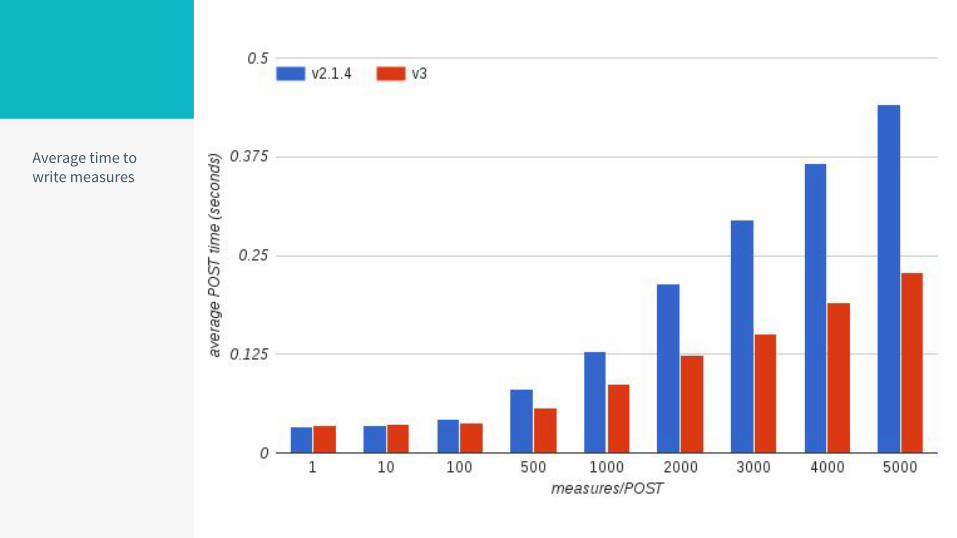
Average time to write measures

POST per secondThe number of metrics that can be pushed to 32 API workers.

Response time.Majority of time taken by client side processing and formatting.
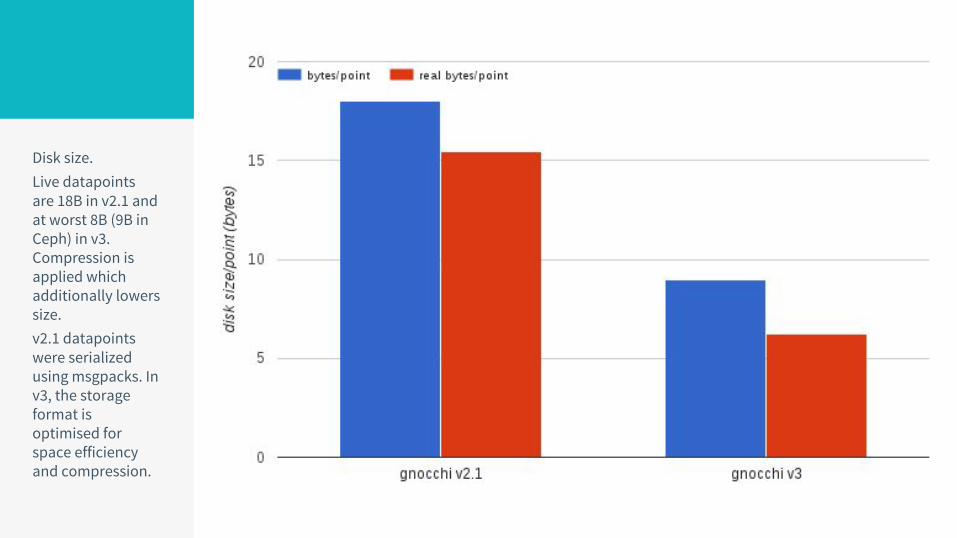
Disk size.Live datapoints are 18B in v2.1 and at worst 8B (9B in Ceph) in v3. Compression is applied which additionally lowers size.v2.1 datapoints were serialized using msgpacks. In v3, the storage format is optimised for space efficiency and compression.

Testing methodology (short series)
▹ POST 1000 generic resources spread across 20 workers, 20 metrics each▸ every 5 minutes▸ 60 points/metric per POST▸ 1.2 million points every 5 min▸ 3 granularities x 8 aggregates▸ ~500 points in most granular series
▹ 3 metricd services, 24 workers each
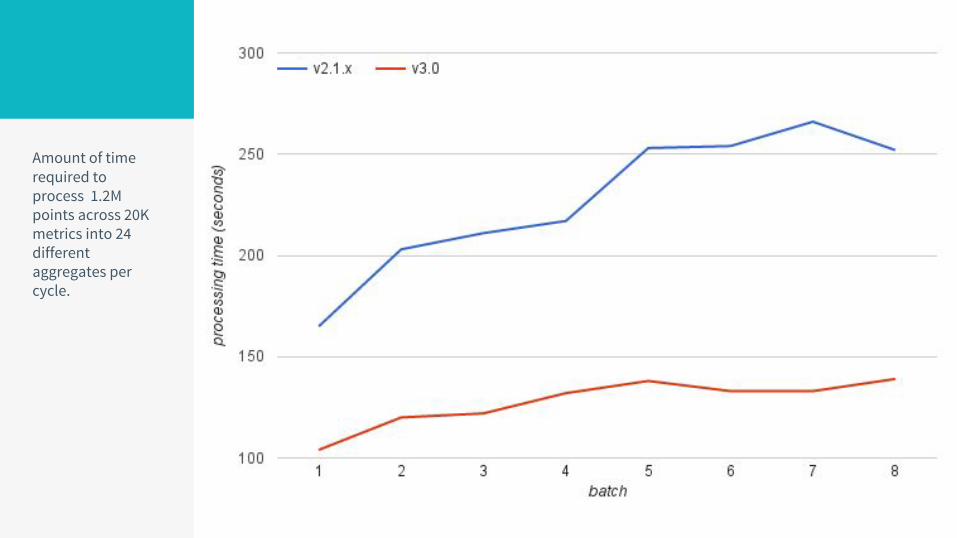
Amount of time required to process 1.2M points across 20K metrics into 24 different aggregates per cycle.
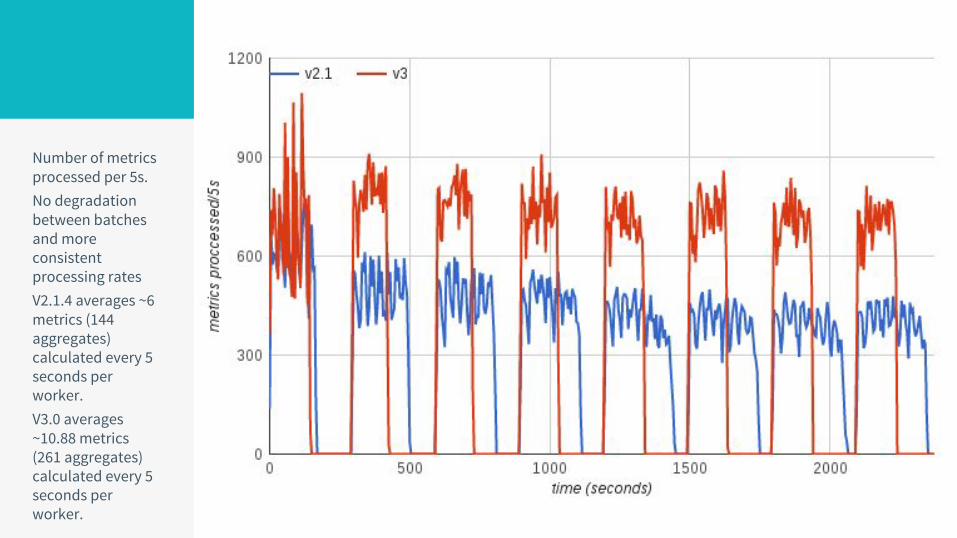
Number of metrics processed per 5s.No degradation between batches and more consistent processing ratesV2.1.4 averages ~6 metrics (144 aggregates) calculated every 5 seconds per worker.V3.0 averages ~10.88 metrics (261 aggregates) calculated every 5 seconds per worker.

Amount of Ceph IOPs required to process 1.2M points across 20K metrics into 24 different aggregates per cycle.Less operations/s represents lower hardware requirements
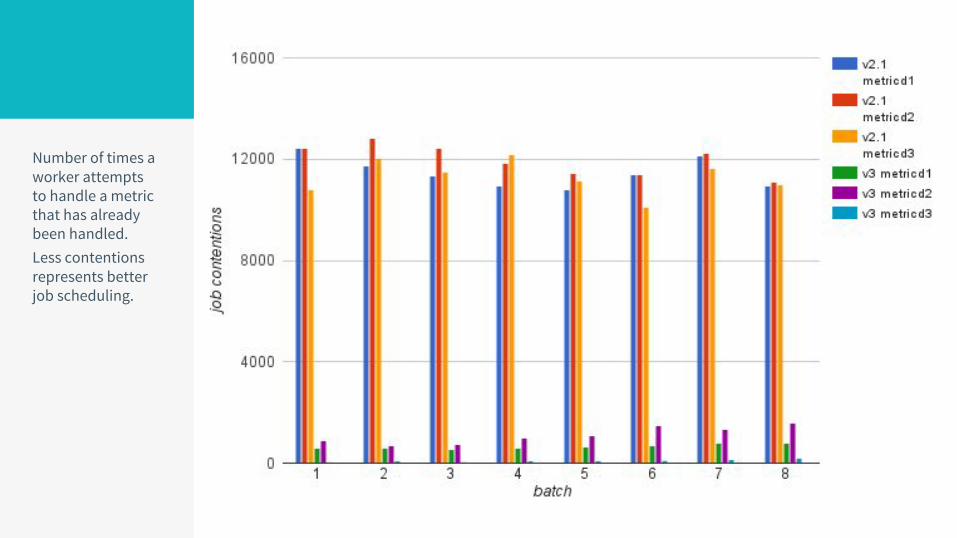
Number of times a worker attempts to handle a metric that has already been handled.Less contentions represents better job scheduling.

Time required to POST 1.2M points across 20K metrics under load.20 workers making 50 POSTs of 20 metrics, 60 points per metric.

Testing methodology (medium series)
▹ POST 500 generic resources spread across 20 workers, 20 metrics each▸ every 5 minutes▸ 720 points/metric per POST▸ 7.2 million points every 5 min▸ 3 granularities x 8 aggregates▸ ~5760 points in most granular series
▹ 3 metricd services, 24 workers each

Amount of time required to process 7.2M points across 10K metrics into 24 different aggregates per cycle.

More insights
Gnocchi v3

Threading enabled.Python threading only works when I/O heavy (see: GIL). CPU usage has been minimised and now threading works54 metricd with 8 threads has roughly same performance as 72 single-threaded metricd.

Effect of number of aggregates on processing time.Less aggregates/metric, less time to process. More aggregates/metric, more time.Note: spike at batch 5 is due to compression logic that is triggered by dataset.
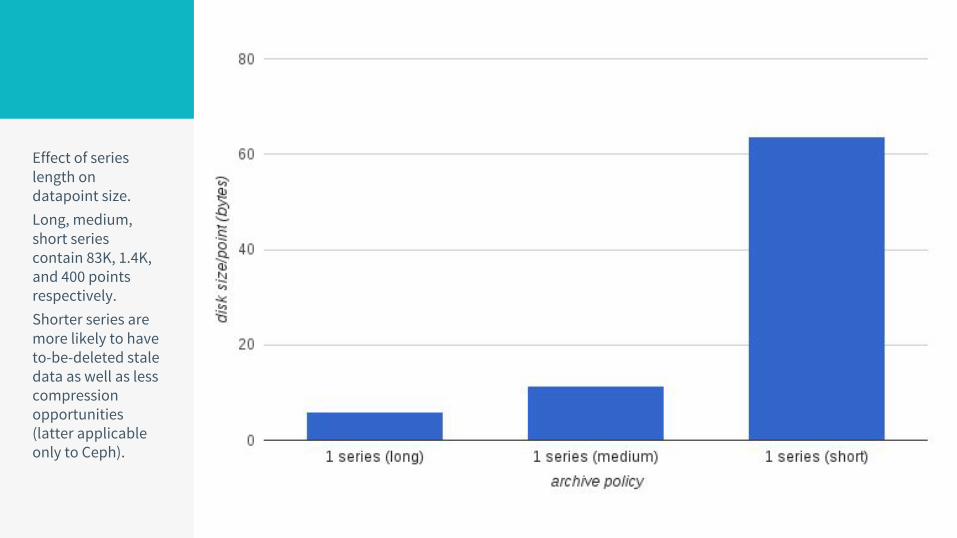
Effect of series length on datapoint size.Long, medium, short series contain 83K, 1.4K, and 400 points respectively.Shorter series are more likely to have to-be-deleted stale data as well as less compression opportunities (latter applicable only to Ceph).

Effect of series length on datapoint size.Shorter series tend to have higher granularity and thus larger back window requirements.

Future Dreams

Potential future work
▹ Dynamic re-aggregation▹ Python3.5 AsyncIO threading
support▹ Rolling upgrades▹ Ceph asynchronous writes▹ In-memory storage to improve
write performance

Appendix

Test Configuration

Hardware configuration
▹ 4 physical hosts▸ CentOS 7.2.1511▸ 24 physical cores (hyperthreaded), 256 GB
memory▸ 25 - 1TB disks, 10K RPM
▹ 1Gb network

Host configuration
▹ Host1▸ OpenStack Controller Node▸ Ceph Monitoring service
▹ Host2▸ OpenStack Compute Node (idle)▸ Ceph OSD node (10 OSDs + SSD Journal)
▹ Host3▸ Ceph OSD node (10 OSDs + SSD Journal)▸ Gnocchi API (32 workers)
▹ Host4▸ OpenStack Compute Node (~idle)▸ Ceph OSD node (10 OSDs + SSD Journal)▸ PostgreSQL

Services
▹ PostgreSQL 9.2.15 (single node)▸ Default everything, except 300 connections
vs 100(default)▹ Ceph 10.2.2 (4 nodes, 1 monitoring, 3 OSD)
▸ 30 OSDs (1 TB disk), Journals share SSD, 2 replica, 2048 placement groups
▹ Gnocchi MetricD▸ 3 nodes, shared with Ceph OSDs▸ 24 workers per service