GMC GWALIOR M C Revised Final Report Volume I...
228
4/1/2011 With Technical Support from Mehta and Associates, Indore Urban Planners GMC SLUM FREE CITY PLAN FOR GWALIOR CITY PREPARED BY GWALIOR MUNICIPAL CORPORATION Revised Draft Final Report – Volume I – Report and Appendices May 2013
Transcript of GMC GWALIOR M C Revised Final Report Volume I...
4/1/2011
With Technical Support from Mehta and Associates, Indore
Urban Planners
GMC
SLUM FREE CITY PLAN FOR GWALIOR CITY PREPARED BY
GWALIOR MUNICIPAL CORPORATIONRevised Draft Final Report – Volume I –
Report and Appendices
May 2013
April 1, 2011
SLUM FREE CITY PLAN FOR GWALIOR CITY PREPARED BY GWALIOR MUNICIPAL CORPORATION
With Technical Support from. Mehta and Associates Indore,
Urban Planners 2
Revised Draft Final Report Volume I – Report and Appendices
Urban India is undergoing a transition in terms of physical form, demographic profile and socio‐economic diversity. The important role of cities in national economic process and their global linkages demand more attention for their development, than being hitherto given. Cities are expected to perform efficiently in keeping with emerging demands for employment, commerce, trade, industry and other services. Cities have to attract investments for improving their efficiencies by way of up to date infrastructure, improved governance and affordable housing/living with modern amenities. Urban renewal of Indian cities has been initiated to achieve the objectives.
According to census of India, the urban population in the country as 2011 was 377 million. This constituted 31.16% of the total population of 1210 millions. The net addition of population in urban areas during the decade 2001‐2011 was about 91 million The slum census, 2001 in towns with more than 50,000 population, numbering 607, reported 40.606 million slum dwellers which amounted to 22.76% of the population living in those 607 towns/cities. This implies, nearly one out of every four persons reside in slums in our cities & towns. Slums generally lack basic infrastructure, housing, social amenities and this has implications on health and productivity of the people living in such areas. This also has serious implications for future generatuion of people residing in such areas.
“Socially slum is a way of life, a special character which has its own set of norms and values reflected in poor sanitation, health values, health practices, deviant behavior and social isolation.” (Planning Commission)
Slums and Squatters, as observed by the Working Group on Slums and Squatters which submitted its report to the Planning Commission in May 1998, are known by different names in different cities — katras or juggi jhompri in Delhi, jhompadpatti or chawls in Mumbai, basti in Calcutta, cheris in Chennai and keris in Bangalore. “[But their basic characteristics remain the same i.e. dilapidated and infirm housing structures, acute overcrowding, faulty alignment of streets, poor ventilation, inadequate lighting, paucity of drinking water, water‐logging during rains, absence of toilet facilities and non availability of basic physical and social services].
Slums and Squatters form about 23% of population of Gwalior. Though staying in such informal settlements they contribute significantly to the economic, social, political and cultural characteristics of the city.
These settlements have emerged as manifestations of poverty and inequality. In spite of the pro‐poor policies of Government of Madhya Pradesh, these settlements are growing faster than population growth rate of Gwalior. Despite various policies, which have been pronounced by the central government such as VAMBAY, BSUP JNNURM and Ayodhya Basti
Preface
April 1, 2011
SLUM FREE CITY PLAN FOR GWALIOR CITY PREPARED BY GWALIOR MUNICIPAL CORPORATION
With Technical Support from. Mehta and Associates Indore,
Urban Planners 3
Revised Draft Final Report Volume I – Report and Appendices
by State Government from time to time and implemented by the local agencies, population in Slums and Squatter settlements continues to swell.
City Specific Strategic Interventions to make cities Slum Free are of Significance. With the same objective Government of India has Launched Rajeev Awas Yojana (RAY) envisaging “Slum Free India” through encouraging States and Union Territories to tackle the problems in Slums in definitive Manner. The Programme envisages that each State will prepare a Slum Free State Plan of Action identifying Priority Cities Intended to be covered under RAY in First Five Years for Preparation Slum Free City Plan. It is expected to commit for a “Whole City” and “Whole Slum” Approach in preparing Slum Free City Plans.
Government of Madhya Pradesh has Identified Indore, Bhopal, Gwalior, Jabalpur, Ujjain and Sagar as Priority City and Initiated actions to prepare Slum Free City Plans.
It is in this context the Consultancy assignment for the support in preparation of Slum Free City Plan of Gwalior has been entrusted to Mehta and Associates Indore by the Gwalior Municipal Corporation. Mehta and Associates is group of Urban Planners and Technocrats and also are one of the Consultants empanelled by Ministry of Urban Development (MoUD) and Ministry of Housing and Urban Poverty Alleviation (MoHUPA), Government of India for preparation of City Development Plans under Jawaharlal Nehru National Urban Renewal Mission.
This is Draft Final Report of Slum Free City Plan for Gwalior.
April 1, 2011
SLUM FREE CITY PLAN FOR GWALIOR CITY PREPARED BY GWALIOR MUNICIPAL CORPORATION
With Technical Support from. Mehta and Associates Indore,
Urban Planners 4
Revised Draft Final Report Volume I – Report and Appendices
The Consulting Team Acknowledges the Support of Officers of Gwalior Municipal Corporation, Urban Administration and Development Department Government of Madhya Pradesh, MPUSP and District Administration Gwalior the Preparation of Slum Free City Plan for Gwalior.
Planning Team
Mehta and Associates, Indore
Acknowledgement
April 1, 2011
SLUM FREE CITY PLAN FOR GWALIOR CITY PREPARED BY GWALIOR MUNICIPAL CORPORATION
With Technical Support from. Mehta and Associates Indore,
Urban Planners 5
Revised Draft Final Report Volume I – Report and Appendices
Planning Team
April 1, 2011
SLUM FREE CITY PLAN FOR GWALIOR CITY PREPARED BY GWALIOR MUNICIPAL CORPORATION
With Technical Support from. Mehta and Associates Indore,
Urban Planners 6
Revised Draft Final Report Volume I – Report and Appendices
Preface ............................................................................................................................... 2
Acknowledgement ............................................................................................................. 4
Planning Team .................................................................................................................... 5
Table of Contents ............................................................................................................... 6
List of Tables..................................................................................................................... 11
List of Figures ................................................................................................................... 13
List of Appendices ............................................................................................................ 15
Abbreviations ................................................................................................................... 16
Introduction – Chapter – 1 ................................................................................................ 19
1.1 Background ........................................................................................................................ 21
1.1.1 Definition of Slum (Census, Slum Act and Dr. Pranab Sen Committee) .......... 21
1.2 Growth of Slums in Urban Areas .................................................................................... 22
1.3 Slum Development Initiatives in India ......................................................................... 22
1.3.1 National Slum Development Programme (NSDP) ............................................... 22
1.3.2 VAMBAY ...................................................................................................................... 23
1.3.3 JNNURM and IHSDP ................................................................................................... 24
1.4 Rajiv Awas Yojana (RAY) ................................................................................................. 24
1.4.1 Planning Methodology ............................................................................................. 25
1.5 Approach and Methodology ............................................................................................ 28
1.5.1 Preparatory Phase .................................................................................................... 28
1.5.2 Slum Free City Planning Stage ................................................................................ 32
1.6 Community Participation & Public Consultation ........................................................ 34
1.7 Structure of the Report .................................................................................................... 35
City Profile – Chapter – 2 .................................................................................................. 37
2.1 Introduction ....................................................................................................................... 38
2.2 Historical Background ..................................................................................................... 38
2.3 Physical Growth and Regional Setting .......................................................................... 39
Table of Contents
April 1, 2011
SLUM FREE CITY PLAN FOR GWALIOR CITY PREPARED BY GWALIOR MUNICIPAL CORPORATION
With Technical Support from. Mehta and Associates Indore,
Urban Planners 7
Revised Draft Final Report Volume I – Report and Appendices
2.3.1 Location and Linkages .............................................................................................. 39
2.3.2 Regional Setting ......................................................................................................... 41
2.3.3 Physical Setting .......................................................................................................... 42
2.4 Demographic and Socioeconomic Profile ................................................................... 43
2.4.1 Demography ............................................................................................................... 43
2.4.2 Social Profile .............................................................................................................. 44
2.4.3 Economic Base ........................................................................................................... 45
2.5 Population Forecast .......................................................................................................... 47
2.6 Urban Land Use and Spatial Growth .............................................................................. 49
2.6.1 Urban Land and Physical Growth of Gwalior ....................................................... 49
2.6.2 Gwalior Development Plan 2005 ........................................................................... 51
2.7 Urban Infrastructure ........................................................................................................ 54
2.7.1 Water Supply .............................................................................................................. 55
2.7.2 Storm Water Drainage system ................................................................................ 58
2.7.3 Sewerage System ....................................................................................................... 59
2.7.4 Solid Waste Management ........................................................................................ 61
2.7.5 Urban Transport ....................................................................................................... 64
2.8 Urban Development & Governance Framework and Regulations .......................... 65
2.8.1 Overview ..................................................................................................................... 65
2.8.2 Institutions and Organizations ............................................................................... 66
2.8.3 Urban Planning, Development and Governance Legislations .......................... 68
2.9 Strengths and Weakness of Gwalior .............................................................................. 70
2.9.1 Strengths of Gwalior ................................................................................................. 70
2.9.2 Weakness of Gwalior ................................................................................................ 70
Housing and Urban Poverty– Chapter – 3 ......................................................................... 72
3.1 Housing ............................................................................................................................... 73
3.1.1 Housing Sub Systems in Gwalior ............................................................................ 73
3.1.2 Household Profile ..................................................................................................... 74
3.1.3 Housing Need Supply and Shortage ....................................................................... 75
3.1.4 Population and Housing Demand Projections .................................................... 75
3.2 Urban Poverty .................................................................................................................... 77
3.2.1 Definitions of Poverty .............................................................................................. 77
3.2.2 Urban Poverty in Gwalior ........................................................................................ 78
April 1, 2011
SLUM FREE CITY PLAN FOR GWALIOR CITY PREPARED BY GWALIOR MUNICIPAL CORPORATION
With Technical Support from. Mehta and Associates Indore,
Urban Planners 8
Revised Draft Final Report Volume I – Report and Appendices
3.3 Slums and Squatters ......................................................................................................... 78
1.7.1 Definition of Slums (Census, Slum Act and Dr. Pranab Sen Committee) ........ 79
3.3.1 Slums in Gwalior ........................................................................................................ 80
3.3.2 Socioeconomic and Service Level Survey of Slums ........................................... 80
3.3.3 Demographic Profile................................................................................................. 80
3.3.4 Socioeconomic Profile ............................................................................................. 81
3.3.5 Housing Condition ..................................................................................................... 84
3.3.6 Basic Services Level .................................................................................................. 85
Categorization of Slums – Chapter – 4 .............................................................................. 91
3.4 Tenability Analysis ........................................................................................................... 92
3.4.1 UnTenable Slums ..................................................................................................... 92
3.4.2 SemiTenable Slums ................................................................................................. 93
3.4.3 Tenable Slums ............................................................................................................ 93
3.4.4 Partially Tenable or SemiTenable Slums ............................................................ 93
3.4.5 Results of Tenability Analysis ................................................................................. 93
3.5 Tenure Status of Slum Households ................................................................................ 94
3.6 Land Ownership of Slums ................................................................................................ 96
3.7 Residential Density of Slums .......................................................................................... 97
3.8 Land Value of Slum Pockets ............................................................................................ 98
3.9 3X3X3 Matrix Analysis for Assessment of Slum Condition ....................................... 99
3.9.1 Basis for 3X3X3 Matrix Analysis .......................................................................... 100
3.9.2 Key Indicators .......................................................................................................... 100
3.9.3 Range Code and Weightage for Key Indicators ................................................. 103
3.9.4 Assigning Final Range Code as per Weightage .................................................. 124
3.9.5 Results of 3 X 3 X 3 Matrix ..................................................................................... 127
3.9.6 3 X 3 X 3 Matrix Resulting Interventions ............................................................ 130
Development of Strategies and Prioritization – Chapter – 5 ........................................... 132
5.1 Development of Strategies ............................................................................................ 133
5.1.1 Goal ............................................................................................................................ 133
5.1.2 Objectives ................................................................................................................. 133
5.1.3 Strategies Identified ............................................................................................... 134
5.2 Proposed Strategies ........................................................................................................ 134
April 1, 2011
SLUM FREE CITY PLAN FOR GWALIOR CITY PREPARED BY GWALIOR MUNICIPAL CORPORATION
With Technical Support from. Mehta and Associates Indore,
Urban Planners 9
Revised Draft Final Report Volume I – Report and Appendices
5.2.1 Relocation Strategy ................................................................................................. 136
5.2.2 In Situ Up gradation and Improvement Strategy .............................................. 136
5.2.3 InSitu Redevelopment Strategy .......................................................................... 136
5.2.4 Prevention Strategy ................................................................................................ 136
5.3 Development of Options ................................................................................................ 137
5.3.1 Options identified under Relocation Strategy ................................................... 139
5.3.2 Options identified under In Situ Upgradation and Improvement Strategy . 140
5.3.3 Options identified under In Situ Redevelopment Strategy ............................. 142
5.3.4 Options identified under Prevention Strategy .................................................. 145
5.4 Prioritization of Slums ................................................................................................... 146
5.4.1 Criteria’s for Prioritization of Slums ................................................................... 146
5.5 Reforms ............................................................................................................................. 148
5.6 MP has Patta Act since 1984 and on the same line the beneficiaries under RAY will be provided with Property Rights ........................................................................................................ 148
Proposed Investment Plan and Phasing – Chapter – 6 .................................................... 149
6.1 Proposed Investment Plan for Existing Slums .......................................................... 150
6.1.1 Relocation of Slums ................................................................................................. 150
6.1.2 In Situ up gradation and Improvement of Slums .............................................. 150
6.1.3 InSitu Redevelopment of Slums .......................................................................... 150
6.2 Investment on Preventive Strategy ............................................................................. 150
6.2.1 Creation of Affordable Housing for LIG and EWS category ............................. 150
6.2.2 Creation of Rental Housing EWS category .......................................................... 150
6.3 Phasing of Investment as per the Priority .................................................................. 150
6.3.1 Phasing of Investment on Existing Slums ........................................................... 151
6.3.2 Phasing of Investment on Relocation of Slums ................................................. 151
6.3.3 Phasing of Investment on in situ up gradation and improvement of slums 152
6.3.4 Phasing of Investment on in situ Redevelopment of slums ............................ 152
6.3.5 Phasing of Investment on Preventive Strategy in Gwalior ............................. 153
Financing Strategies for Slum Free City Plan ......................................................................... 155
7.1 Summary of Investment ................................................................................................. 155
7.2 Phasing of Investment .................................................................................................... 156
7.3 Financing Strategies ....................................................................................................... 157
7.3.1 Funding Sources ...................................................................................................... 158
April 1, 2011
SLUM FREE CITY PLAN FOR GWALIOR CITY PREPARED BY GWALIOR MUNICIPAL CORPORATION
With Technical Support from. Mehta and Associates Indore,
Urban Planners 10
Revised Draft Final Report Volume I – Report and Appendices
7.3.2 Fund Mobilization ................................................................................................... 159
7.3.3 Credit Plan ................................................................................................................ 160
7.4 Implementation Framework ........................................................................................ 161
7.4.1 Role of GMC and Parastatal Agencies .................................................................. 161
7.5 Linkage with City Development Plan .......................................................................... 161
Appendices ..................................................................................................................... 162
SFCPoA Format – Appendix – A ...................................................................................... 163
Household Survey Format – Appendix – A ...................................................................... 214
Filled up Survey Format – Appendix – B .......................................................................... 222
Drawings‐ Appendix – C .................................................................................................. 228
April 1, 2011
SLUM FREE CITY PLAN FOR GWALIOR CITY PREPARED BY GWALIOR MUNICIPAL CORPORATION
With Technical Support from. Mehta and Associates Indore,
Urban Planners 11
Revised Draft Final Report Volume I – Report and Appendices
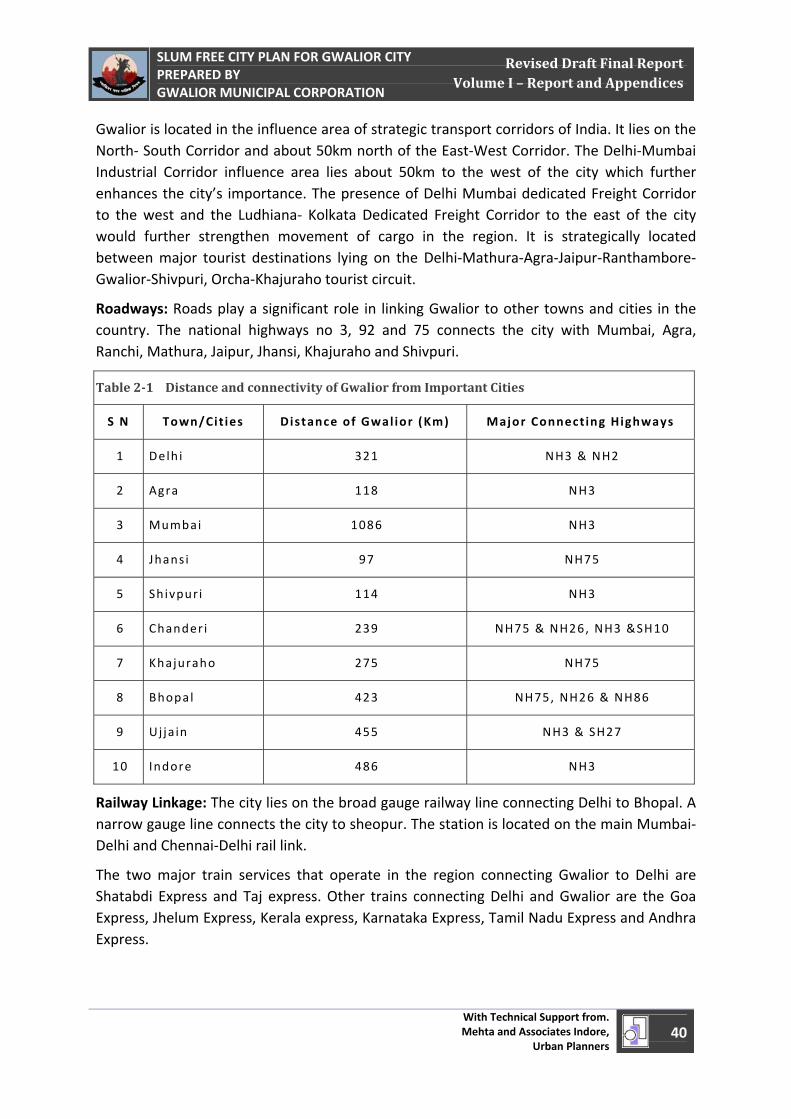
Table 2‐1 Distance and connectivity of Gwalior from Important Cities ....................................... 40 Table 2‐2 Population of Gwalior Municipal Area during last 5 decades ...................................... 43 Table 2‐3 Comparison of Literacy Rates ......................................................................................... 44 Table 2‐4 Comparison of Work Force Participation Rate ............................................................. 46 Table 2‐5 Occupation Structure ....................................................................................................... 46 Table 2‐6 Physical Growth of Gwalior Urban Area and Outgrowths ............................................ 49 Table 2‐7 Proposed Developed Area GDP 2005 ............................................................................. 52 Table 2‐8 Planning Area Land Use .................................................................................................. 52 Table 2‐9 Source of Water and its Installed Capacity for Gwalior ................................................ 55 Table 2‐10 Details of Installations – Water Supply ........................................................................ 56 Table 2‐11 Projected Water Requirement ...................................................................................... 57 Table 2‐12 Projected water Requirement ...................................................................................... 60 Table 3‐13 Housing Need, Supply and Shortage in Lakh Units ...................................................... 75 Table 3‐14 Projected Housing Demand ........................................................................................... 76 Table 3‐15 Projected Housing Demand for EWS ............................................................................ 76 Table 4‐16 Results of the Tenability Analysis of Slums ................................................................. 94 Table 4‐17 Results of the Tenure Status of Slum Households Study ............................................ 95 Table 4‐18 Results of the Land Ownership Study of Slums........................................................... 96 Table 4‐19 Results of the Residential Density Study of Slums ...................................................... 97 Table 4‐20 Results of the Land Value Study of Slums .................................................................... 99 Table 4‐21 Surveyed Indicators for Housing Condition .............................................................. 100 Table 4‐22 Surveyed Indicators for Infrastructure/Service Level ............................................. 100 Table 4‐23 Surveyed Indicators for Socio‐economic Condition ................................................. 102 Table 4‐24 Range Code for various Figures of Key Indicators and Weightage for Various Key Indicators in Assessment of Housing Condition ............................................................................. 104 Table 4‐25 Range Code for various Figures of Key Indicators and Weightage for Various Key Indicators in Assessment of Infrastructure/Service Level ............................................................ 108 Table 4‐26 Range Code for various Figures of Key Indicators and Weightage for Various Key Indicators in Assessment of Socio‐economic Condition ................................................................ 116 Table 4‐27 Results of the Housing Condition Assessment in 3X3X3 Matrix Analysis............... 125 Table 4‐28 Results of the Infrastructure Service Level Assessment in 3X3X3 Matrix Analysis ............................................................................................................................................................ 126 Table 4‐29 Results of the Socio‐economic Condition Assessment in 3X3X3 Matrix Analysis .. 127 Table 4‐30 Results of 3X3X3 Matrix Analysis for Assessment of Housing, Infrastructure and Socio‐economic Condition of Slums ................................................................................................. 128 Table 5‐31 Assignment of Strategies for slums in Gwalior ......................................................... 135 Table 5‐32 Proposed Options under Relocation Strategy ........................................................... 139 Table 5‐33 Proposed Options under In Situ Upgradation and Improvement Strategy ............ 140 Table 5‐34 Proposed Options under In Situ Upgradation and Improvement Strategy ............ 141 Table 5‐35 Proposed Options under In Situ Redevelopment Strategy ...................................... 142 Table 5‐36 Proposed Options under In Situ Redevelopment Strategy ...................................... 144
List of Tables
April 1, 2011
SLUM FREE CITY PLAN FOR GWALIOR CITY PREPARED BY GWALIOR MUNICIPAL CORPORATION
With Technical Support from. Mehta and Associates Indore,
Urban Planners 12
Revised Draft Final Report Volume I – Report and Appendices
Table 5‐37 Proposed Options under Prevention Strategy .......................................................... 145 Table 6‐38 Phasing of Capital Investment under the Slum Free City Plan for Gwalior ............ 151 Table 6‐39 Phasing of Capital Investment on Existing Slums of Gwalior................................... 151 Table 6‐40 Phasing of Capital Investment on Relocation of Slums of Gwalior .......................... 151 Table 6‐41 Phasing of Capital Investment on in situ Up gradation and Improvement of Slums of Gwalior ............................................................................................................................................... 152 Table 6‐42 Phasing of Capital Investment on in situ Redevelopment of Slums of Gwalior ...... 152 Table 6‐43 Phasing of Capital Investment on Preventive Strategy under the Slum Free City Plan for Gwalior ......................................................................................................................................... 153 Table 6‐44 Phasing of Capital Investment on Creation of Affordable Housing for LIG and EWS Category under the Slum Free City Plan for Gwalior ..................................................................... 153 Table 6‐45 Phasing of Capital Investment on Creation of Rental Housing for EWS Category under the Slum Free City Plan for Gwalior ...................................................................................... 154 Table 7‐46 : Strategy wise Summary of Investments ..................................................................... 155 Table 7‐47 : Component wise Summary of Investments .................................................................... 156 Table 7‐48 : Phasing of Investment ..................................................................................................... 157 Table 7‐49 : Sources of Funds for Various Components ..................................................................... 158 Table 7‐50 : Summary of Strategy wise Funding Source .................................................................... 159 Table 7‐51 : Roles of various Implementing Agencies ........................................................................ 161
April 1, 2011
SLUM FREE CITY PLAN FOR GWALIOR CITY PREPARED BY GWALIOR MUNICIPAL CORPORATION
With Technical Support from. Mehta and Associates Indore,
Urban Planners 13
Revised Draft Final Report Volume I – Report and Appendices
Figure 1‐1 Conceptual Framework of Methodology for Preparation of Slum Free City Plan as per Rajeev Awas Yojana Guidelines ................................................................................................... 26 Figure 1‐2 Approach and Methodology for Preparation of Slum Free City Plan for Gwalior City .............................................................................................................................................................. 29 Figure 1‐3 Approach and Methodology for Preparation of Slum Free City Plan Gwalior City – Preparatory Phase ............................................................................................................................... 29 Figure 1‐4 Snapshot View of Geo‐referenced City Base Map ........................................................ 30 Figure 1‐5 Snapshot View of Slum Mapping on Geo‐referenced City Base Map.......................... 31 Figure 1‐6 Socio‐economic Survey Data Base Design and MIS ..................................................... 31 Figure 1‐7 Approach and Methodology for Preparation of Slum Free City Plan Gwalior City – Development of Strategies .................................................................................................................. 32 Figure 1‐8 Approach and Methodology for Preparation of Slum Free City Plan Gwalior City – Development of Options under various Strategies ........................................................................... 33 Figure 1‐9 Approach and Methodology for Preparation of Slum Free City Plan for Gwalior City – Prioritization of Slums under various Strategies and Options ..................................................... 34 Figure 2‐10 Gwalior Fort .................................................................................................................. 38 Figure 2‐11 Location of Gwalior ....................................................................................................... 39 Figure 2‐12 Location, Linkages and Regional Setting of Gwalior .................................................. 41 Figure 2‐13 Annual Rainfall in Gwalior over last decade ............................................................... 42 Figure 2‐14 Population of Gwalior Planning Area during last 4 decades ..................................... 43 Figure 2‐15 Occupational Structure ................................................................................................. 46 Figure 2‐16 Spatial Growth of Gwalior ............................................................................................ 50 Figure 2‐17 Developed Area and Land Use of Developed Area ..................................................... 52 Figure 2‐18 Gwalior Development Plan Proposed Land Use 2005 ............................................... 54 Figure 2‐19 Existing Water Treatment Facility in Gwalior ............................................................ 55 Figure 2‐20 Status of Solid waste Management near Hospital nallah, Gwalior ............................ 61 Figure 2‐21 Integrated Municipal Solid Waste Processing Plant and Fuel Plant at the Processing Plant ...................................................................................................................................................... 62 Figure 3‐22 Distribution of Households in Various Housing Subsystems in Gwalior ................. 73 Figure 3‐23 Trends in Household Size in last four decades in Gwalior ........................................ 74 Figure 3‐24 Income Group Distribution in Gwalior ........................................................................ 74 Figure 3‐25 Trends in Housing Demand and Supply ...................................................................... 75 Figure 3‐26 Zone Wise Households and Population ....................................................................... 81 Figure 3‐27 Zone Wise Caste of Slum Households .......................................................................... 82 Figure 3‐28 Zone Wise Highest Education Pursued by Slum Population ..................................... 82 Figure 3‐29 Zone Wise Occupation of Slum Population ................................................................. 83 Figure 3‐30 Zone Wise Monthly Income of Slum Households ....................................................... 84 Figure 3‐31 Zone Wise Poverty Profile of Slum Households ......................................................... 84 Figure 3‐32 Zone Wise Tenure Status of Slum Households ........................................................... 84 Figure 3‐33 Zone Wise Type of Structure of Slum Dwelling Units ................................................ 85 Figure 3‐34 Zone Wise Primary Source of Water Supply to Slum Households ............................ 86
List of Figures
April 1, 2011
SLUM FREE CITY PLAN FOR GWALIOR CITY PREPARED BY GWALIOR MUNICIPAL CORPORATION
With Technical Support from. Mehta and Associates Indore,
Urban Planners 14
Revised Draft Final Report Volume I – Report and Appendices
Figure 3‐35 Zone Wise Slum Households with or without Toilet ................................................. 87 Figure 3‐36 Condition of Drains in Slum Pockets ........................................................................... 87 Figure 3‐37 Connectivity of Slum Pockets to Municipal Sewers ................................................... 88 Figure 3‐38 Type of Solid Waste Management in Slum Pockets .................................................... 88 Figure 3‐39 Frequency of Solid Waste Collection in Slum Pockets ............................................... 89 Figure 3‐40 Roads and Streets Facility in Slum Pockets ................................................................ 90 Figure 3‐41 Street Lighting Facility in Slum Pockets ...................................................................... 90 Figure 4‐42 Sample Tenability Analysis .......................................................................................... 94 Figure 4‐43 Sample Tenure Status of Slum Households Study ...................................................... 95 Figure 4‐44 Sample Land Ownership of Slums Study .................................................................... 96 Figure 4‐45 Sample Residential Density of Slums Study ................................................................ 98 Figure 4‐46 Sample Land Value of Slums Study .............................................................................. 99 Figure 4‐47 Sample Housing Condition Assessment in 3X3X3 Matrix Analysis ........................ 124 Figure 4‐48 Sample Infrastructure Service Level Assessment in 3X3X3 Matrix Analysis ......... 125 Figure 4‐49 Sample Socio‐economic Condition Assessment in 3X3X3 Matrix Analysis ............ 126 Figure 4‐50 Sample Results of 3X3X3 Matrix Analysis ................................................................. 129 Figure 4‐51 Results of 3X3X3 Matrix Analysis for Assessment of Housing, Infrastructure and Socio‐economic Condition of Slums ................................................................................................. 130 Figure 4‐52 Sample 3X3X3 Matrix Resulting Interventions Needed for Existing Slums ........... 131 Figure 5‐53 Sample Assignment of Strategies to slums in Gwalior ............................................. 135 Figure 5‐54 Sample Identification of Options under Various Strategies for slums in Gwalior . 137
April 1, 2011
SLUM FREE CITY PLAN FOR GWALIOR CITY PREPARED BY GWALIOR MUNICIPAL CORPORATION
With Technical Support from. Mehta and Associates Indore,
Urban Planners 15
Revised Draft Final Report Volume I – Report and Appendices
Appendix A – SFCPoA Format – Tables
Appendix B – Household Survey Format
Appendix C – Filled up Survey Format
Appendix D – Drawings
List of Appendices
April 1, 2011
SLUM FREE CITY PLAN FOR GWALIOR CITY PREPARED BY GWALIOR MUNICIPAL CORPORATION
With Technical Support from. Mehta and Associates Indore,
Urban Planners 16
Revised Draft Final Report Volume I – Report and Appendices
APL – Above Poverty Line
BPL – Below Poverty Line
CBD – Central Business District
CBO – Community Based Organisation
CDP – City Development Plan
CIP – City Investment Plan
CAA – Constitutional Amendment Act
DFID – Department for the International Development, Government of United Kingdom
DGPS – Differential Global Positioning System
DPR – Detailed Project Report
EWS – Economically Weaker Section
FAR – Floor Area Ratio
FGD – Focused Group Discussion
FOP – Financial Operating Plan
ft – Feet
GDP – Gwalior Development Plan
GDA – Gwalior Development Authority
GDP – Gross Domestic Product
GIS – Geographical Information System
GMC – Gwalior Municipal Corporation
GoI – Government of India
GoMP – Government of Madhya Pradesh
Govt – Government
GPS – Global Positioning System
ha – Hectare
HH – Household
HIG – Higher Income Group
IHSDP – Integrated Housing and Slum Development Programme
JnNURM – Jawaharlal Nehru National Urban Renewal Mission
Abbreviations
April 1, 2011
SLUM FREE CITY PLAN FOR GWALIOR CITY PREPARED BY GWALIOR MUNICIPAL CORPORATION
With Technical Support from. Mehta and Associates Indore,
Urban Planners 17
Revised Draft Final Report Volume I – Report and Appendices
Km – Kilo Meter
LIG – Lower Income Group
LPCD – Litres Per Capita per Day
MIC – Mayor in Council
MIG – Middle Income Group
MIS – Management Information System
MLD – Mil l ion Litres per Day
MoUD – Ministry of Urban Development
MoHUPA – Ministry of Housing and Urban Poverty Alleviation
MP – Madhya Pradesh
MPHB – Madhya Pradesh Housing Board
MPPWD – Madhya Pradesh Public Works Department
MPUSP – Madhya Pradesh Urban Services for Poor
NGO – Non‐Governmental Organisation
NSDP – National Slum Development Programme
NSS – National Sample Survey
OBC – Other Backward Class
PHED – Public Health and Engineering Department
PPHA – Persons Per Hectare
PPP – Public Private Partnership
PSP – Private Semi‐public
PUF – Private Util it ies and Facil it ies
RAY – Rajeev Awas Yojana
RCC – Re‐inforced Cement Concrete
Rs – Rupees or Indian National Rupees
SC – Scheduled Caste
SEZ – Special Economic Zone
Sqkm – Square Kilo Meter
SQL – Structured Query Language
ST – Scheduled Tribe
STP – Sewage Treatment Plant
SWM – Solid Waste Management
April 1, 2011
SLUM FREE CITY PLAN FOR GWALIOR CITY PREPARED BY GWALIOR MUNICIPAL CORPORATION
With Technical Support from. Mehta and Associates Indore,
Urban Planners 18
Revised Draft Final Report Volume I – Report and Appendices
TCP – Town and Country Planning Department
TPD – Tonnes Per Day
UDPFI – Urban Development Plan Formulation and Implementation Guidelines
ULB – Urban Local Body
ULC – Urban Land Ceil ing Act
UT – Union Territory
VAMBAY – Valimiki Ambedkar Awas Yojana
WFPR – Work Force Particpation Rate
April 1, 2011
SLUM FREE CITY PLAN FOR GWALIOR CITY PREPARED BY GWALIOR MUNICIPAL CORPORATION
With Technical Support from. Mehta and Associates Indore,
Urban Planners 19
Revised Draft Final Report Volume I – Report and Appendices
Introduction – Chapter – 1 1

April 1, 2011
SLUM FREE CITY PLAN FOR GWALIOR CITY PREPARED BY GWALIOR MUNICIPAL CORPORATION
With Technical Support from. Mehta and Associates Indore,
Urban Planners 20
Revised Draft Final Report Volume I – Report and Appendices
April 1, 2011
SLUM FREE CITY PLAN FOR GWALIOR CITY PREPARED BY GWALIOR MUNICIPAL CORPORATION
With Technical Support from. Mehta and Associates Indore,
Urban Planners 21
Revised Draft Final Report Volume I – Report and Appendices
1.1 Background
According to census of India, the urban population in the country as on 1st March 2001 was 286 million. This constituted 27.8% of the total population of 1028 millions. The net addition of population in urban areas during the decade 1991‐2001 was about 68 million. The slum census, 2001 in towns with more than 50,000 population, numbering 607, reported 40.606 million slum dwellers which amounted to 22.76% of the population living in those 607 towns/cities. This implies, nearly one out of every four persons reside in slums in our cities & towns. Slums generally lack basic infrastructure, housing, social amenities and this has implications on health and productivity of the people living in such areas. This also has serious implications for future generation of people residing in such areas.
“Socially slum is a way of life, a special character which has its own set of norms and values reflected in poor sanitation, health values, health practices, deviant behavior and social isolation.” (Planning Commission)
Slums and Squatters, as observed by the Working Group on Slums and Squatters which submitted its report to the Planning Commission in May 1998, are known by different names in different cities — katras or juggi jhompri in Delhi, jhompadpatti or chawls in Mumbai, basti in Calcutta, cheris in Chennai and keris in Bangalore. “[But their basic characteristics remain the same i.e. dilapidated and infirm housing structures, acute overcrowding, faulty alignment of streets, poor ventilation, inadequate lighting, paucity of drinking water, water‐logging during rains, absence of toilet facilities and non availability of basic physical and social services].
1.1.1 Definition of Slum (Census, Slum Act and Dr. Pranab Sen Committee)
Slums Definition: 'Slums' have been defined under Section 3 of the Slums Areas (Improvement and Clearance) Act, 1976 as areas where buildings
o Are in any respect unfit for human habitation or
o Are by reason of dilapidation, overcrowding, faulty arrangement and design of such buildings, narrowness or faulty arrangement of streets, lack of ventilation, light, sanitation facilities or any combination of these factors which are detrimental to safety, health and morals.
Census of India 2001 has adopted the definition of 'Slum' areas as:
o All areas notified as 'Slum' by State/Local Govt. and UT Administration under any Act;
Introduction Chapter 1
April 1, 2011
SLUM FREE CITY PLAN FOR GWALIOR CITY PREPARED BY GWALIOR MUNICIPAL CORPORATION
With Technical Support from. Mehta and Associates Indore,
Urban Planners 22
Revised Draft Final Report Volume I – Report and Appendices
o All areas recognized as 'Slum' by State/Local Government and UT Administration, which have not been formally notified as slum under any Act;
o A compact area of at least 300 populations or about 60‐70 households of poorly built congested tenements, in unhygienic environment usually with inadequate infrastructure and lacking in proper sanitary and drinking water facilities.
Dr. Pranab Sen Committee define ‘Slum’ as:
o It has defined a slum as “a compact settlement of at least 20 households with a collection of poorly built tenements, mostly of temporary nature, crowded together usually with inadequate sanitary and drinking water facilities in unhygienic conditions”.
1.2 Growth of Slums in Urban Areas
After independence in 1947, commercial and industrial activity resulted in demand for labour in the cities. In order to meet this demand people from rural areas were encouraged to move to the cities and work. This migrant work force later brought their relatives, friends and rest of the families to the cities. Unable to find cheap housing, they built their shelter closer to work places. Gradually the number of shelters grew and resulted in a ‘slum’. Over a period of time Governments provided electricity and drinking water. Thus began the vicious cycle of urban population growth, opportunities in the cities, migration from rural areas, poverty with low incomes, tendency to be closer to work hence occupying any land in the vicinity etc.
For the First time in Census of India, 2001 has provided the Slum information in respect of the cities having urban population of 50,000 or more. As per National Sample Survey (NSS) the total numbers of households living in slums have increased from 5.93 million in 1993 to 8.23 million in 2002.
1.3 Slum Development Initiatives in India
1.3.1 National Slum Development Programme (NSDP)
To improve the situation of lack of improvement activities in urban slums under EIUS, Government of India introduced the National Slum Development Programme as an additional Central assistance scheme with the objective to upgrade urban slums. Major components/activities under NSDP include:
(i) Provision of physical amenities like water supply, storm water drains, community bath, widening and paving of existing lanes, sewers, community latrines, street lights, etc.
(ii) Community Infrastructure: Provision of Community centers to be used for preschool education, non‐formal education, adult education, recreational activities etc.
April 1, 2011
SLUM FREE CITY PLAN FOR GWALIOR CITY PREPARED BY GWALIOR MUNICIPAL CORPORATION
With Technical Support from. Mehta and Associates Indore,
Urban Planners 23
Revised Draft Final Report Volume I – Report and Appendices
(iii) Community Primary Health Care Centre Buildings: With support of Registered Medical Practitioners/Government Doctors in the State/NGOs/CBO/Philanthropic Associations to man these centers.
(iv) Social Amenities: Pre‐school education, non‐formal education, adult education, maternity, child health and Primary health care including immunization etc.
(v) Provision for Shelter: Not less than 10% of the allocation to States under this assistance to be utilized for construction and/or up gradation of houses for the urban poor.
Under this component, States were required to work out their specific schemes for housing construction/up‐gradation which shall not be an entirely subsidy based scheme but the funding shall contain a loan component as well. It was also expected that the scheme would make adequate provision for achieving convergence between different Sectoral and departmental programmes so as to achieve the social sector goals similar to those envisaged in this scheme.
Since inception in 1996‐97 up to 2004‐05, the amounts allocated and released to the States and UTs under this programme were 3494.90 Cr and 3089.63 Cr Respectively. Out of the total funds of Rs.3089.63 Cr released by the Central Government, an amount of Rs. 2466.34 crores has been spent and about 4.58 crores of slum dwellers have benefited from this programme.
The scheme did not have much emphasis on housing component even though it included provision for housing up gradation. In the absence of well‐defined scheme structure for recovering cost of infrastructure provisions under the scheme, the agencies who have implemented this scheme operated it more as a total subsidy scheme. Other major shortcomings observed include ‐ funds not reaching the local bodies and targeted poor meagre budget allocations vis‐à‐vis slum population, institutional weaknesses to bring about convergence of resources and efforts envisaged in the scheme.
1.3.2 VAMBAY
Government of India launched Valmiki Ambedkar Awas Yojana (VAMBAY) Scheme as a centrally supported scheme with inbuilt subsidy for undertaking construction of dwelling units and sanitation units specially focused for slum dwellers, which are economically below the poverty line and belong to socially disadvantaged group.
Since inception in 2001‐02 up to 2005‐06, the amounts allocated and released to the States and UTs under this programme were 1093.93 Cr and 933.63 Cr Respectively benefiting 4.42 Lakhs Households
In terms of the scheme structure, VAMBAY scheme proved to be better than previous initiatives since it had a grant component of 50%, thus making houses affordable to the poor. The advantages are also in terms of targeting the urban poor and EWS as the major urban housing shortage is in EWS and LIG categories. With the launching of JNNURM, the

April 1, 2011
SLUM FREE CITY PLAN FOR GWALIOR CITY PREPARED BY GWALIOR MUNICIPAL CORPORATION
With Technical Support from. Mehta and Associates Indore,
Urban Planners 24
Revised Draft Final Report Volume I – Report and Appendices
VAMBAY scheme has been discontinued. However, the elements of this scheme have been incorporated in JNNURM.
1.3.3 JNNURM and IHSDP
The Jawaharlal Nehru National Urban Renewal Mission (JNNURM) has been launched by Government of India from December, 2005 for an initial period of seven years with a central outlay of Rupees 50,000 crores. 63 cities including 35 cities with Million + population are designated to be eligible for investment under this Mission based on the priorities indicated by the State Governments. All the State Capitals of North Eastern States and other cities including cities of religious and tourist importance have been included in the overall list of 63 cities. The City of Gwalior narrowly missed to be included in the JnNURM due to not being million plus city. The Non‐JnNURM Cities were continued to be included in the IHSDP Programme.
The Mission aims to provide incentives to the cities included in this Mission for undertaking institutional, structural and fiscal reforms, necessary to improve service delivery systems that are sustainable, enhance local economic performance, and bring about transparency and accountability in the functioning of municipal governments.
The Mission comprises two sub‐missions namely: Sub‐Mission for Urban Infrastructure and Governance; and Sub‐Mission for Basic Services to the Urban Poor.
Sub‐mission Basic Services for Urban Poor of JNNURM focuses on integrated development of slums through projects that provide shelter, basic services and other related civic amenities to the urban poor. To compliment this activity in smaller non‐mission towns, the centrally supported scheme of Integrated Housing and Slum Development Programme (IHSDP) has been launched. This scheme will replaced the earlier launched schemes of Valmiki Ambedkar Awas Yojana (VAMBAY) and National Slum Development Programme (NSDP).
The target Group under the scheme is slum dwellers from all sections of the community through a cluster approach and allocation of funds will be on the basis of States’ urban slum population to total urban population in the country. States in turn may allocate to Town’s/Cities basing on similar formula. However, funds will be provided only those towns and cities where elections to local bodies have been held and elected bodies are in position. The State Governments may prioritize the towns and cities on the basis of their felt‐need by taking into account existing infrastructure, cities with concentration with slum population and such other criteria.
1.4 Rajiv Awas Yojana (RAY)
Government of India announced Rajiv Awas Yojana (RAY) for the slum dwellers and the urban poor on 6th August, 2009 with a vision of “Slum Free India”. The Scheme is aimed at providing support to states that are willing to provide property rights to slum dwellers
April 1, 2011
SLUM FREE CITY PLAN FOR GWALIOR CITY PREPARED BY GWALIOR MUNICIPAL CORPORATION
With Technical Support from. Mehta and Associates Indore,
Urban Planners 25
Revised Draft Final Report Volume I – Report and Appendices
The Programme envisages that each State will prepare a Slum Free State Plan of Action identifying Priority Cities Intended to be covered under RAY in First Five Years for Preparation Slum Free City Plan. It is expected to commit for a “Whole City” and “Whole Slum” Approach in preparing Slum Free City Plans.
The Programme calls for a multi‐pronged approach focusing on:
Bringing existing slums within the formal system and enabling them to avail of the same level of basic amenities as the rest of the town;
Redressing the failures of the formal system that lie behind the creation of slums; and
Tackling the shortages of urban land and housing that keep shelter out of reach of the urban poor and force them to resort to extra‐legal solutions in a bid to retain their sources of livelihood and employment.
1.4.1 Planning Methodology
The Figure 1‐1 Describes the Conceptual Framework of Methodology for Preparation of Slum Free City Plan. As per the RAY guidelines, the process of preparation of Slum‐free City Plan will broadly involve Slum Redevelopment / Rehabilitation Plans based on
(a) Survey of all slums – notified and non‐notified
During this stage, delineation of the areas under slums will be undertaken along with demographic and social profiling of the slum dwellers. The most important information gathered during this stage of the study would be the type of housing in the slums (Katcha or Pucca). The survey would also include data gathering about several important parameters like land ownership pattern (patta or encroachment), Land use and FSI pattern, Adequacy of physical infrastructure facilities like water supply, sewerage, drainage, solid waste management system, roads, electricity etc. Yet another important parameter that would emerge from this survey is the tenurial pattern of the dwellers. Lastly, the social infrastructural facilities like education, health, banking, community hall, livelihood centers would be covered in the survey.
(b) Mapping of slums using the state‐of‐art technology
All the slums are to be mapped using GIS technology with detail filling through total station survey. Satellite images will be used, as appropriate in order to generate the base map of the city/slum under consideration.
(c) Integration of geo‐spatial and socio‐economic data
In this stage the data collection in steps (a) and (b) above is integrated in to a single entity using GIS platform. This will enable ushering of greater accessibility and transparency thereby making the entire exercise responsive to public needs.
April 1, 2011
SLUM FREE CITY PLAN FOR GWALIOR CITY PREPARED BY GWALIOR MUNICIPAL CORPORATION
With Technical Support from. Mehta and Associates Indore,
Urban Planners 26
Revised Draft Final Report Volume I – Report and Appendices
(d) Identification of development model proposed for each slum
At this stage the selection of development model for the slums is to be taken up. The choice of the model may be Public‐Public Partnership model or public‐private partnership model.
(e) Implementation strategy
The implementation strategy consists of three components: Prioritization, phasing and measures for preventing future growth of slums. The first two components are important because the scheme extends for a period of five years and the total slums in the city have to be taken up under the scheme for development in a phased manner.
Figure 11 Conceptual Framework of Methodology for Preparation of Slum Free City Plan as per Rajeev Awas Yojana Guidelines
April 1, 2011
SLUM FREE CITY PLAN FOR GWALIOR CITY PREPARED BY GWALIOR MUNICIPAL CORPORATION
With Technical Support from. Mehta and Associates Indore,
Urban Planners 27
Revised Draft Final Report Volume I – Report and Appendices
April 1, 2011
SLUM FREE CITY PLAN FOR GWALIOR CITY PREPARED BY GWALIOR MUNICIPAL CORPORATION
With Technical Support from. Mehta and Associates Indore,
Urban Planners 28
Revised Draft Final Report Volume I – Report and Appendices
(f) Preparation of Detailed Project Report
The Detailed Project Report is to be prepared by encompassing all the components of Slum‐Free City Plan. The DPR would include detailed designs and drawing along with detailed costing of the project.
Capacity building and training will be critical for the preparation and implementation of slum‐free city action plan. This will need to cover both institutional and HR capacity needs. The Slum‐free City Plan will specifically include the Plan for Capacity Building which will be supported by the Centre under the scheme following the guidelines and scales approved under the Toolkit .
Slum Free City Plan for Gwalior City
Gwalior Municipal Corporation Initiated the Task for Preparation of Slum Free City Plan for Gwalior. The Preparation of Slum Free City Plan was helped by already carried out GIS mapping of the City and 100% Socio‐economic Survey of Slums under MPUSP Technical Assistance.
The Consultancy assignment for the support in preparation of Slum Free City Plan of Gwalior City has been entrusted to Mehta and Associates Indore by the Gwalior Municipal Corporation. Mehta and Associates is group of Urban Planners and Technocrats and also are one of the Consultants empanelled by Ministry of Urban Development (MoUD) and Ministry of Housing and Urban Poverty Alleviation (MoHUPA), Government of India for preparation of City Development Plans under Jawaharlal Nehru National Urban Renewal Mission.
1.5 Approach and Methodology
The Approach and Methodology for Preparation of Slum Free City Plan for Gwalior City has been divided in two stages namely
Preparatory Phase
Slum Free City Planning Phase
1.5.1 Preparatory Phase
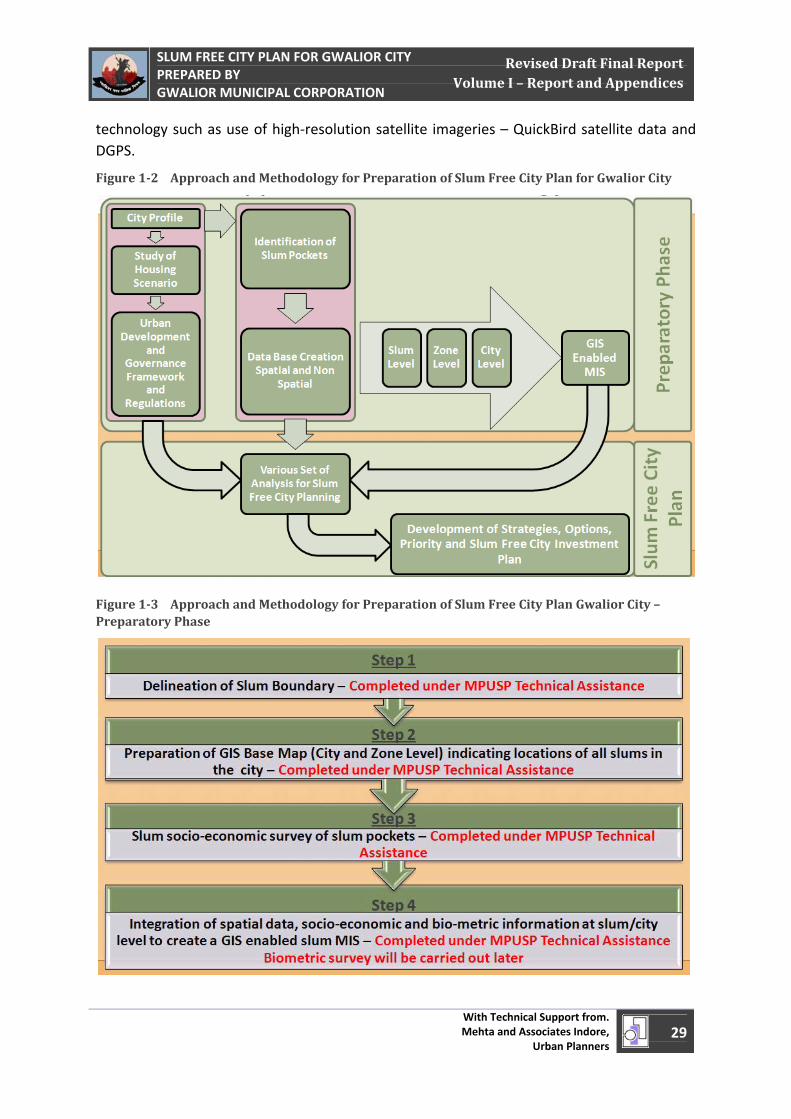
The various Tasks under the Preparatory Phase have been presented in the Figure 1‐3 and the same has been broadly categorized as
Geo‐Referenced City Base map and Slum Mapping
Slum Socio‐economic Survey & Preparation of GIS Enabled Slum MIS
Preparation of Geo‐referenced City Base Map and Mapping of Slums
The Preparation of the Geo‐referenced City Base Map for Gwalior City has been completed under MPUSP Technical Assistance. The City Base map has been prepared using latest
April 1, 2011
SLUM FREE CITY PLAN FOR GWALIOR CITY PREPARED BY GWALIOR MUNICIPAL CORPORATION
With Technical Support from. Mehta and Associates Indore,
Urban Planners 29
Revised Draft Final Report Volume I – Report and Appendices
technology such as use of high‐resolution satellite imageries – QuickBird satellite data and DGPS.
Figure 12 Approach and Methodology for Preparation of Slum Free City Plan for Gwalior City
Figure 13 Approach and Methodology for Preparation of Slum Free City Plan Gwalior City – Preparatory Phase
April 1, 2011
SLUM FREE CITY PLAN FOR GWALIOR CITY PREPARED BY GWALIOR MUNICIPAL CORPORATION
With Technical Support from. Mehta and Associates Indore,
Urban Planners 30
Revised Draft Final Report Volume I – Report and Appendices
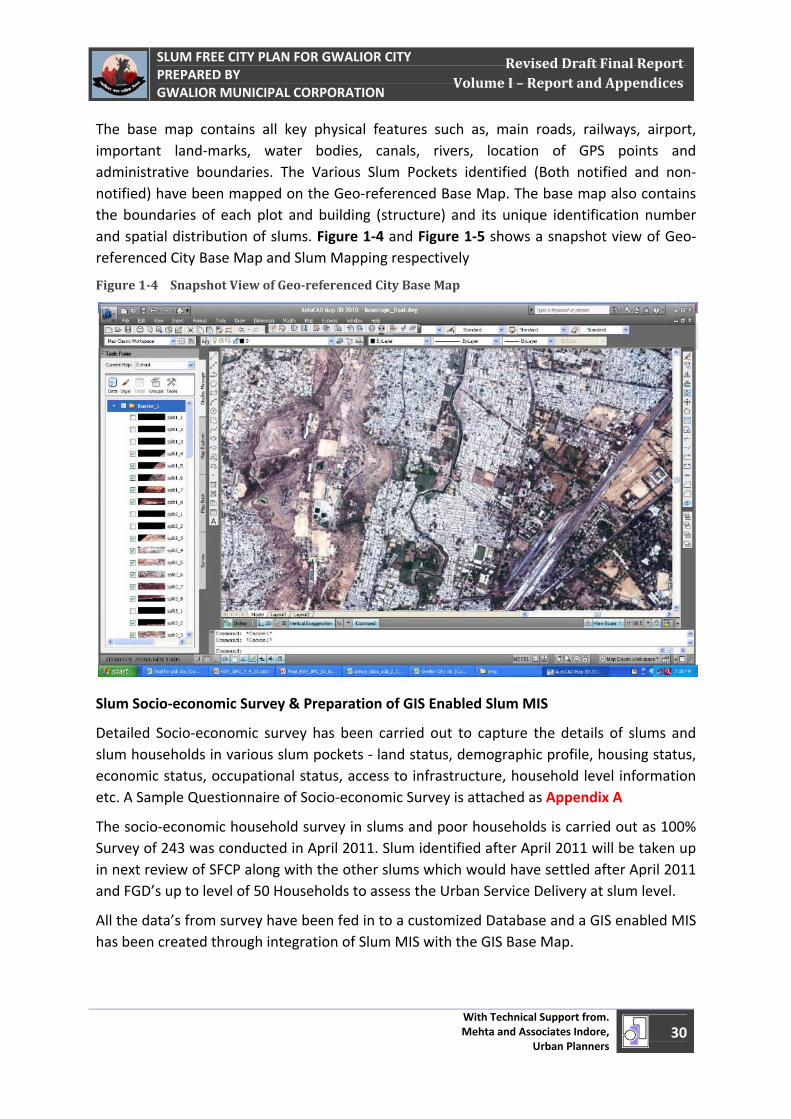
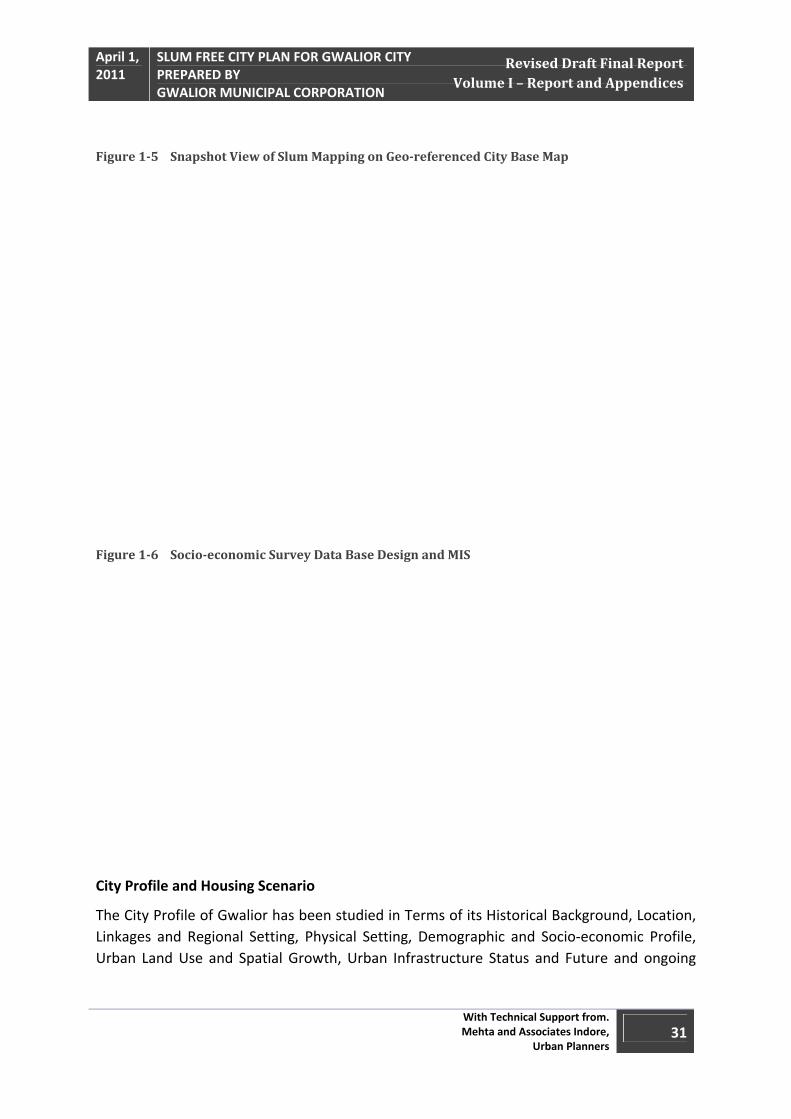
The base map contains all key physical features such as, main roads, railways, airport, important land‐marks, water bodies, canals, rivers, location of GPS points and administrative boundaries. The Various Slum Pockets identified (Both notified and non‐notified) have been mapped on the Geo‐referenced Base Map. The base map also contains the boundaries of each plot and building (structure) and its unique identification number and spatial distribution of slums. Figure 1‐4 and Figure 1‐5 shows a snapshot view of Geo‐referenced City Base Map and Slum Mapping respectively
Figure 14 Snapshot View of Georeferenced City Base Map
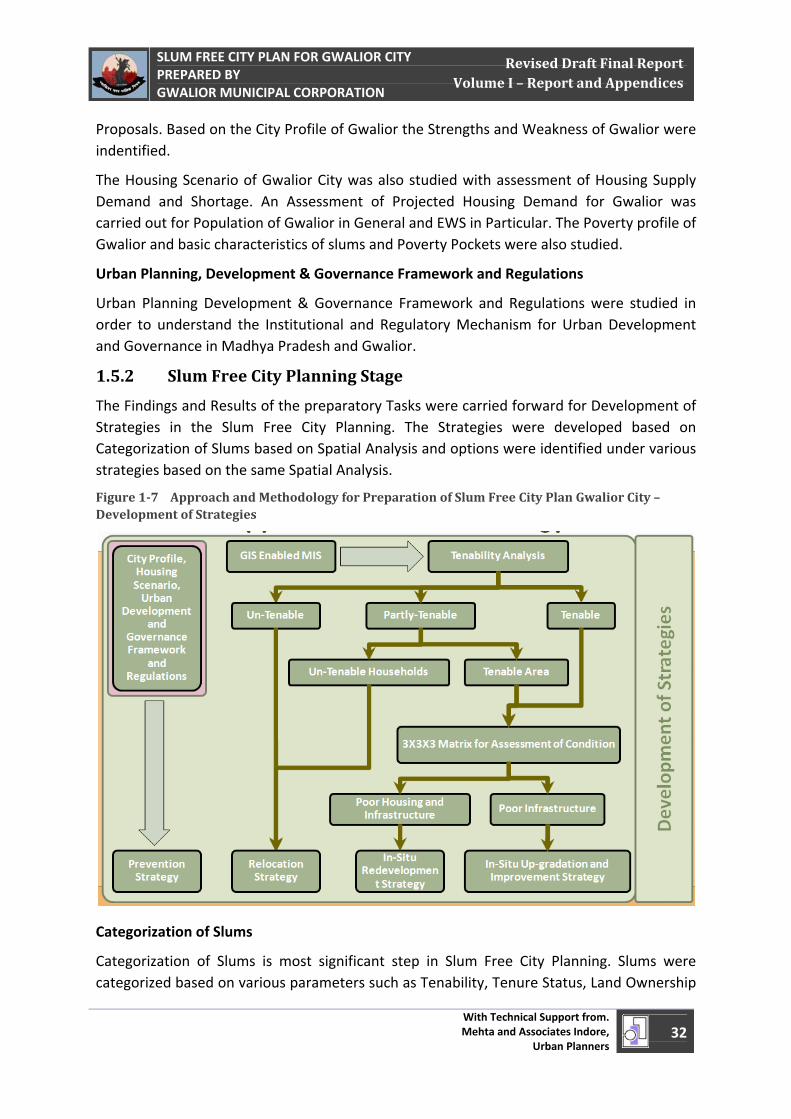
Slum Socio‐economic Survey & Preparation of GIS Enabled Slum MIS
Detailed Socio‐economic survey has been carried out to capture the details of slums and slum households in various slum pockets ‐ land status, demographic profile, housing status, economic status, occupational status, access to infrastructure, household level information etc. A Sample Questionnaire of Socio‐economic Survey is attached as Appendix A
The socio‐economic household survey in slums and poor households is carried out as 100% Survey of 243 was conducted in April 2011. Slum identified after April 2011 will be taken up in next review of SFCP along with the other slums which would have settled after April 2011 and FGD’s up to level of 50 Households to assess the Urban Service Delivery at slum level.
All the data’s from survey have been fed in to a customized Database and a GIS enabled MIS has been created through integration of Slum MIS with the GIS Base Map.
April 1, 2011
SLUM FREE CITY PLAN FOR GWALIOR CITY PREPARED BY GWALIOR MUNICIPAL CORPORATION
With Technical Support from. Mehta and Associates Indore,
Urban Planners 31
Revised Draft Final Report Volume I – Report and Appendices
Figure 15 Snapshot View of Slum Mapping on Georeferenced City Base Map
Figure 16 Socioeconomic Survey Data Base Design and MIS
City Profile and Housing Scenario
The City Profile of Gwalior has been studied in Terms of its Historical Background, Location, Linkages and Regional Setting, Physical Setting, Demographic and Socio‐economic Profile, Urban Land Use and Spatial Growth, Urban Infrastructure Status and Future and ongoing
April 1, 2011
SLUM FREE CITY PLAN FOR GWALIOR CITY PREPARED BY GWALIOR MUNICIPAL CORPORATION
With Technical Support from. Mehta and Associates Indore,
Urban Planners 32
Revised Draft Final Report Volume I – Report and Appendices
Proposals. Based on the City Profile of Gwalior the Strengths and Weakness of Gwalior were indentified.
The Housing Scenario of Gwalior City was also studied with assessment of Housing Supply Demand and Shortage. An Assessment of Projected Housing Demand for Gwalior was carried out for Population of Gwalior in General and EWS in Particular. The Poverty profile of Gwalior and basic characteristics of slums and Poverty Pockets were also studied.
Urban Planning, Development & Governance Framework and Regulations
Urban Planning Development & Governance Framework and Regulations were studied in order to understand the Institutional and Regulatory Mechanism for Urban Development and Governance in Madhya Pradesh and Gwalior.
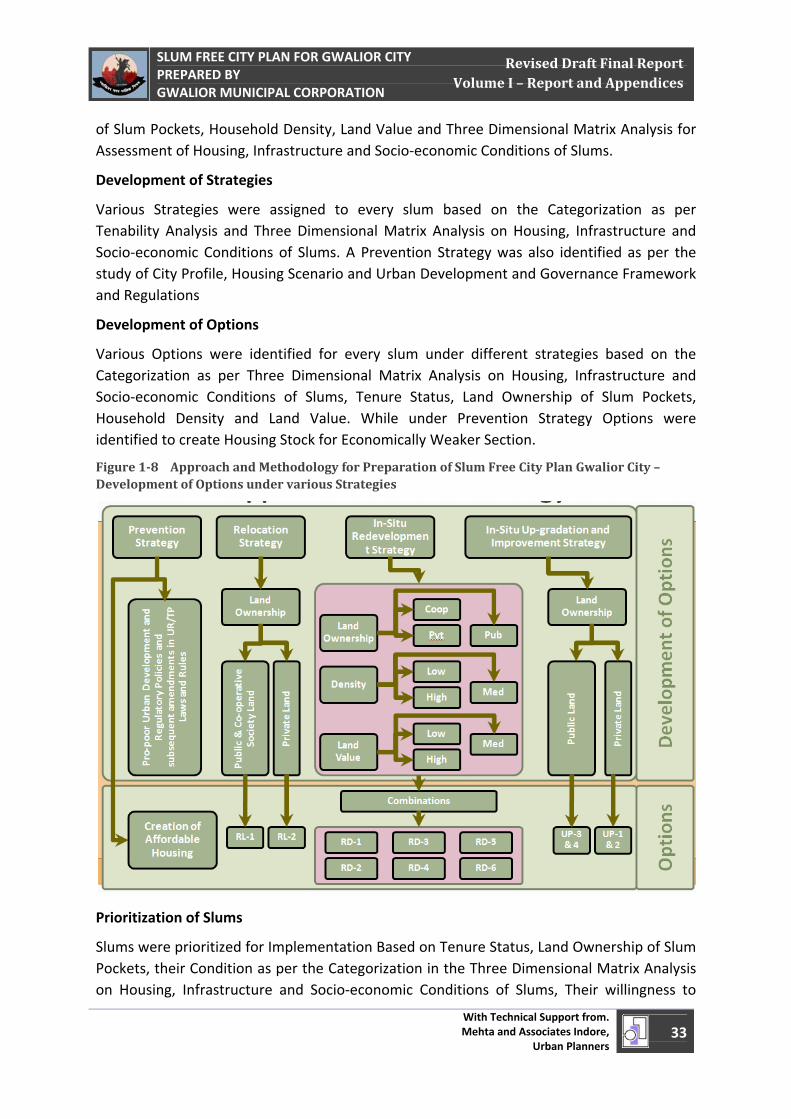
1.5.2 Slum Free City Planning Stage
The Findings and Results of the preparatory Tasks were carried forward for Development of Strategies in the Slum Free City Planning. The Strategies were developed based on Categorization of Slums based on Spatial Analysis and options were identified under various strategies based on the same Spatial Analysis.
Figure 17 Approach and Methodology for Preparation of Slum Free City Plan Gwalior City – Development of Strategies
Categorization of Slums
Categorization of Slums is most significant step in Slum Free City Planning. Slums were categorized based on various parameters such as Tenability, Tenure Status, Land Ownership
April 1, 2011
SLUM FREE CITY PLAN FOR GWALIOR CITY PREPARED BY GWALIOR MUNICIPAL CORPORATION
With Technical Support from. Mehta and Associates Indore,
Urban Planners 33
Revised Draft Final Report Volume I – Report and Appendices
of Slum Pockets, Household Density, Land Value and Three Dimensional Matrix Analysis for Assessment of Housing, Infrastructure and Socio‐economic Conditions of Slums.
Development of Strategies
Various Strategies were assigned to every slum based on the Categorization as per Tenability Analysis and Three Dimensional Matrix Analysis on Housing, Infrastructure and Socio‐economic Conditions of Slums. A Prevention Strategy was also identified as per the study of City Profile, Housing Scenario and Urban Development and Governance Framework and Regulations
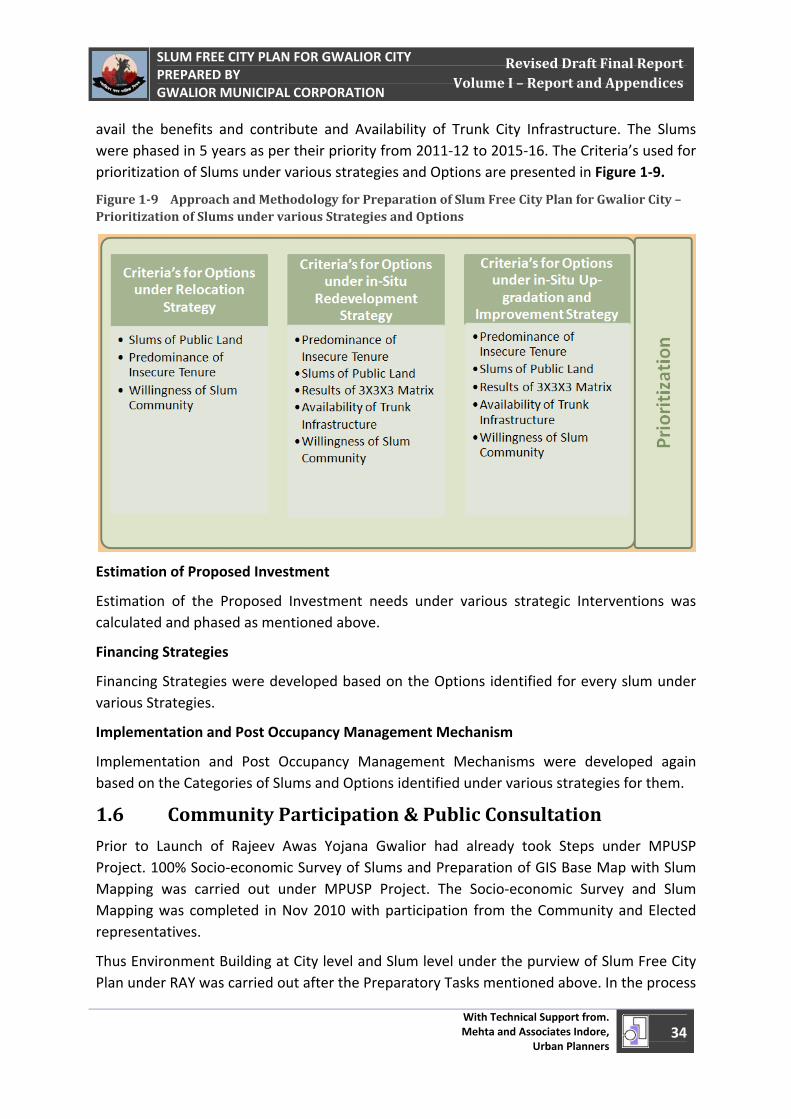
Development of Options
Various Options were identified for every slum under different strategies based on the Categorization as per Three Dimensional Matrix Analysis on Housing, Infrastructure and Socio‐economic Conditions of Slums, Tenure Status, Land Ownership of Slum Pockets, Household Density and Land Value. While under Prevention Strategy Options were identified to create Housing Stock for Economically Weaker Section.
Figure 18 Approach and Methodology for Preparation of Slum Free City Plan Gwalior City – Development of Options under various Strategies
Prioritization of Slums
Slums were prioritized for Implementation Based on Tenure Status, Land Ownership of Slum Pockets, their Condition as per the Categorization in the Three Dimensional Matrix Analysis on Housing, Infrastructure and Socio‐economic Conditions of Slums, Their willingness to
April 1, 2011
SLUM FREE CITY PLAN FOR GWALIOR CITY PREPARED BY GWALIOR MUNICIPAL CORPORATION
With Technical Support from. Mehta and Associates Indore,
Urban Planners 34
Revised Draft Final Report Volume I – Report and Appendices
avail the benefits and contribute and Availability of Trunk City Infrastructure. The Slums were phased in 5 years as per their priority from 2011‐12 to 2015‐16. The Criteria’s used for prioritization of Slums under various strategies and Options are presented in Figure 1‐9.
Figure 19 Approach and Methodology for Preparation of Slum Free City Plan for Gwalior City – Prioritization of Slums under various Strategies and Options
Estimation of Proposed Investment
Estimation of the Proposed Investment needs under various strategic Interventions was calculated and phased as mentioned above.
Financing Strategies
Financing Strategies were developed based on the Options identified for every slum under various Strategies.
Implementation and Post Occupancy Management Mechanism
Implementation and Post Occupancy Management Mechanisms were developed again based on the Categories of Slums and Options identified under various strategies for them.
1.6 Community Participation & Public Consultation
Prior to Launch of Rajeev Awas Yojana Gwalior had already took Steps under MPUSP Project. 100% Socio‐economic Survey of Slums and Preparation of GIS Base Map with Slum Mapping was carried out under MPUSP Project. The Socio‐economic Survey and Slum Mapping was completed in Nov 2010 with participation from the Community and Elected representatives.
Thus Environment Building at City level and Slum level under the purview of Slum Free City Plan under RAY was carried out after the Preparatory Tasks mentioned above. In the process
April 1, 2011
SLUM FREE CITY PLAN FOR GWALIOR CITY PREPARED BY GWALIOR MUNICIPAL CORPORATION
With Technical Support from. Mehta and Associates Indore,
Urban Planners 35
Revised Draft Final Report Volume I – Report and Appendices
of Environment Building for Slum Free Gwalior, consensus among various Stakeholders was developed through briefing of programme Objectives, Methodology and the roles and responsibilities of State government, ULB, NGOs and slum communities for SFCPoA preparation at various stages, including planning, implementation, monitoring, evaluation and social audit.
Identification, demarcation of slum areas on the Geo‐referenced City Base Map with the help of Urban Poverty Alleviation (UPA) Cell and Community Development Officers (CDOs). In Later Stages Participatory process with Political & Community representatives was conducted for Prioritization of Strategies & Development option for all the Slums.
Community Participation in form of Focused Group Discussion (FGD) in Micro planning during preparation of DPR was also carried out, which includes
• Preparation and orientation for micro‐planning or environment building • Review of Infrastructure related issues in the participatory problem analysis • Identification of slum level infrastructure to be rehabilitated and additional
infrastructure if and when required • Community feedback and agreement and finalization of the dwelling units and
settlement plan and the environmental infrastructure plans. • Consent and Endorsement for the Slum Development proposals • Identification and listing of beneficiaries.
1.7 Structure of the Report
The Draft Final Report has been presented in 6 chapters. Following are the contents of the Report
Chapter 1 introduces to the Overview of various Intervention related Slums and Squatters, Slum Free City Planning, Its Approach, Methodology and Process adopted for Slum Free City Planning for Gwalior City and structure of the Draft Final Report.
Chapter 2 presents an Overview of the city in Terms of its Historical Background, Location, Linkages and Regional Setting, Physical Setting, Demographic and Socio‐economic Profile, Urban Land Use and Spatial Growth, Urban Infrastructure Status and Future and ongoing Proposals, Urban Planning Development & Governance Framework and Regulations and It finally concludes to City’s Strengths and Weakness.
Chapter 3 deals with Housing and Urban Poverty Profile of the City. It puts light of existing Housing Subsystems, Household Profile, Housing Shortage and Future Demand and Demand for EWS Housing. It describes poverty Profile of Gwalior and Slum Profile of Gwalior. It also briefly analyses the findings from socio‐economic Surveys and FGDs.
Chapter 4 Presents the various analysis of Slums and Squatters in Gwalior for Categorization of Slums such as, Tenability Analysis, Tenure Status of Slum
April 1, 2011
SLUM FREE CITY PLAN FOR GWALIOR CITY PREPARED BY GWALIOR MUNICIPAL CORPORATION
With Technical Support from. Mehta and Associates Indore,
Urban Planners 36
Revised Draft Final Report Volume I – Report and Appendices
Households, Density of Slums, Land Value of Slums, 3X3X3 Matrix Analysis for assessment of Housing, Infrastructure and Socio‐economic Conditions.
Chapter 5 discusses the various strategies developed for various categories of Slums and their Details. It also describes the Options identified under various categories and Prioritization Criteria’s and establishes prioritization of Slums in Five phases.
Chapter 6 Provides the Proposed Investment plan for Slum Free Gwalior and phasing of Investment.
Chapter 7 Financing Strategies, Implementation and Post Occupancy Management Mechanisms for the Slums.

April 1, 2011
SLUM FREE CITY PLAN FOR GWALIOR CITY PREPARED BY GWALIOR MUNICIPAL CORPORATION
With Technical Support from. Mehta and Associates Indore,
Urban Planners 37
Revised Draft Final Report Volume I – Report and Appendices
City Profile – Chapter – 2 2
April 1, 2011
SLUM FREE CITY PLAN FOR GWALIOR CITY PREPARED BY GWALIOR MUNICIPAL CORPORATION
With Technical Support from. Mehta and Associates Indore,
Urban Planners 38
Revised Draft Final Report Volume I – Report and Appendices
2.1 Introduction
Gwalior is one of the important cities in Madhya Pradesh. It was a former state, in pre‐independent India, now it is a part of Madhya Pradesh state. Its capital was Lashkar and Gwalior was one of the five chief Indian states, which were dominated by the Sindhia family of Marathas. It has larger part between Rajputana on West and United Provinces and Central India on East, with Chambal River forming its North and Northwest boundary; other smaller sections in Southwest Central India. Gwalior occupies a strategic location in the “Gird” region of North India, and the city and its fortress have served as the center of several of North India's historic kingdoms. Gwalior is the administrative headquarters of Gwalior District and Gwalior Division. Rich tradition and history of Gwalior have made city full of palaces and other masterpieces of architecture.
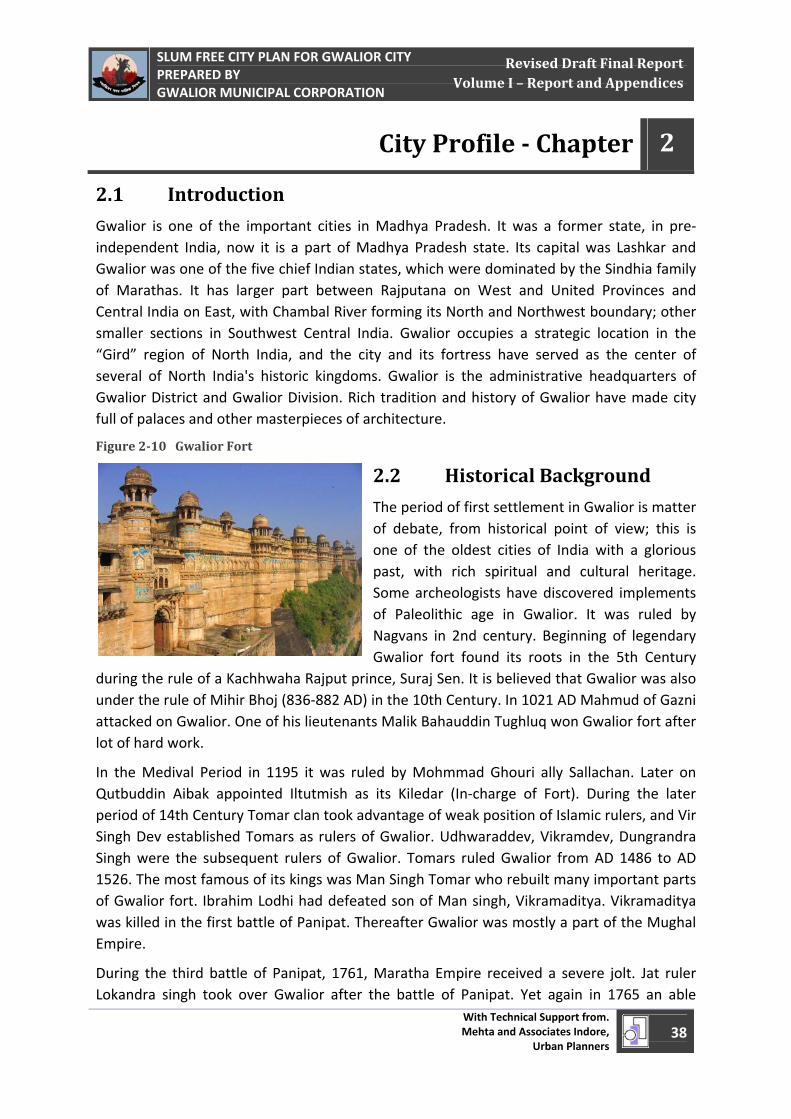
Figure 210 Gwalior Fort
2.2 Historical Background
The period of first settlement in Gwalior is matter of debate, from historical point of view; this is one of the oldest cities of India with a glorious past, with rich spiritual and cultural heritage. Some archeologists have discovered implements of Paleolithic age in Gwalior. It was ruled by Nagvans in 2nd century. Beginning of legendary Gwalior fort found its roots in the 5th Century
during the rule of a Kachhwaha Rajput prince, Suraj Sen. It is believed that Gwalior was also under the rule of Mihir Bhoj (836‐882 AD) in the 10th Century. In 1021 AD Mahmud of Gazni attacked on Gwalior. One of his lieutenants Malik Bahauddin Tughluq won Gwalior fort after lot of hard work.
In the Medival Period in 1195 it was ruled by Mohmmad Ghouri ally Sallachan. Later on Qutbuddin Aibak appointed Iltutmish as its Kiledar (In‐charge of Fort). During the later period of 14th Century Tomar clan took advantage of weak position of Islamic rulers, and Vir Singh Dev established Tomars as rulers of Gwalior. Udhwaraddev, Vikramdev, Dungrandra Singh were the subsequent rulers of Gwalior. Tomars ruled Gwalior from AD 1486 to AD 1526. The most famous of its kings was Man Singh Tomar who rebuilt many important parts of Gwalior fort. Ibrahim Lodhi had defeated son of Man singh, Vikramaditya. Vikramaditya was killed in the first battle of Panipat. Thereafter Gwalior was mostly a part of the Mughal Empire.
During the third battle of Panipat, 1761, Maratha Empire received a severe jolt. Jat ruler Lokandra singh took over Gwalior after the battle of Panipat. Yet again in 1765 an able
City Profile Chapter 2
April 1, 2011
SLUM FREE CITY PLAN FOR GWALIOR CITY PREPARED BY GWALIOR MUNICIPAL CORPORATION
With Technical Support from. Mehta and Associates Indore,
Urban Planners 39
Revised Draft Final Report Volume I – Report and Appendices
Scindhia ruler Mahadji scindhia regained Gwalior. Soldiers of Morar cantonment took part in the first freedom struggle of India on 14th June 1857 soldiers cut off the communication between Gwalior and Shivpuri. Frightened Maharaja Scindhia sent British and his family members to Agra.
In the Post Independence Period after merging Gwalior, Indore, Malwa and other small states, Madhya Bharat State was formed in April 1948, during the meeting of rulers of Madhya Bharat in Delhi. On May 28, 1948 Pt. J.L.Nehru inaugurated this State and Jiwaji Rao Scindia took oath as the chief of the State.
2.3 Physical Growth and Regional Setting
2.3.1 Location and Linkages
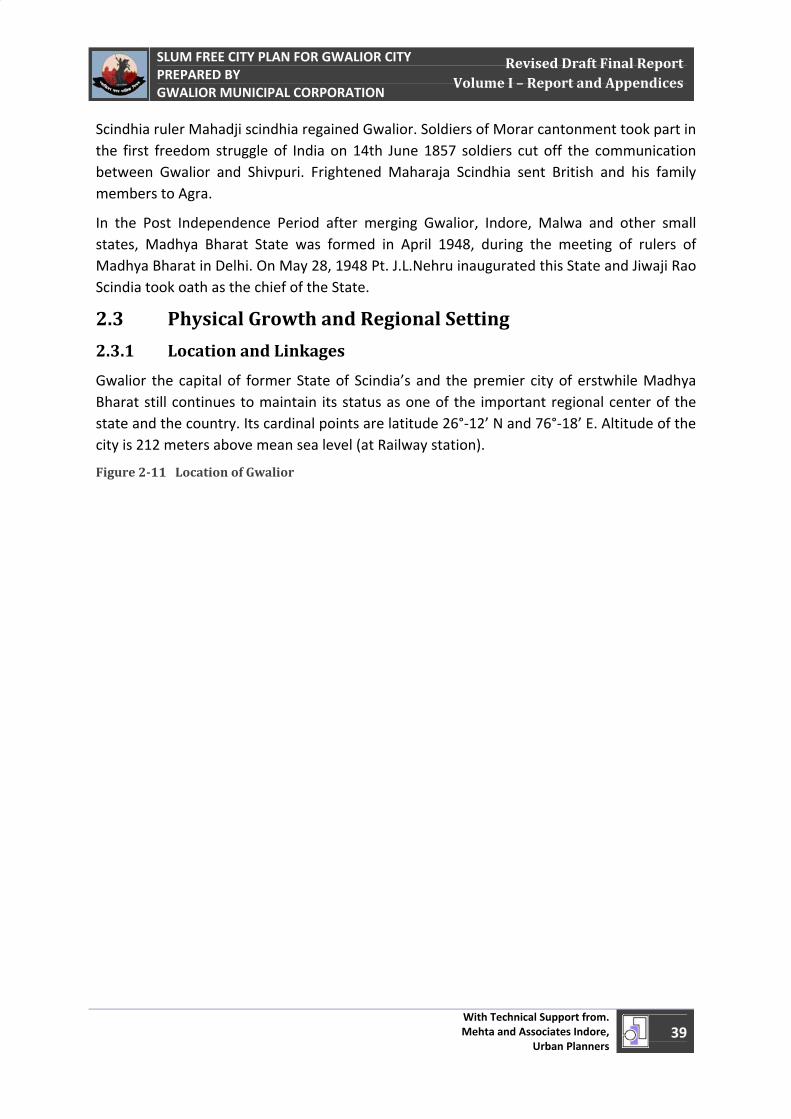
Gwalior the capital of former State of Scindia’s and the premier city of erstwhile Madhya Bharat still continues to maintain its status as one of the important regional center of the state and the country. Its cardinal points are latitude 26°‐12’ N and 76°‐18’ E. Altitude of the city is 212 meters above mean sea level (at Railway station).
Figure 211 Location of Gwalior
April 1, 2011
SLUM FREE CITY PLAN FOR GWALIOR CITY PREPARED BY GWALIOR MUNICIPAL CORPORATION
With Technical Support from. Mehta and Associates Indore,
Urban Planners 40
Revised Draft Final Report Volume I – Report and Appendices
Gwalior is located in the influence area of strategic transport corridors of India. It lies on the North‐ South Corridor and about 50km north of the East‐West Corridor. The Delhi‐Mumbai Industrial Corridor influence area lies about 50km to the west of the city which further enhances the city’s importance. The presence of Delhi Mumbai dedicated Freight Corridor to the west and the Ludhiana‐ Kolkata Dedicated Freight Corridor to the east of the city would further strengthen movement of cargo in the region. It is strategically located between major tourist destinations lying on the Delhi‐Mathura‐Agra‐Jaipur‐Ranthambore‐Gwalior‐Shivpuri, Orcha‐Khajuraho tourist circuit.
Roadways: Roads play a significant role in linking Gwalior to other towns and cities in the country. The national highways no 3, 92 and 75 connects the city with Mumbai, Agra, Ranchi, Mathura, Jaipur, Jhansi, Khajuraho and Shivpuri.
Table 21 Distance and connectivity of Gwalior from Important Cities
S N Town/Cit ies Distance of Gwalior (Km) Major Connecting Highways
1 Delh i 321 NH3 & NH2
2 Agra 118 NH3
3 Mumbai 1086 NH3
4 Jhans i 97 NH75
5 Shivpuri 114 NH3
6 Chander i 239 NH75 & NH26, NH3 &SH10
7 Khajuraho 275 NH75
8 Bhopal 423 NH75, NH26 & NH86
9 Ujja in 455 NH3 & SH27
10 Indore 486 NH3
Railway Linkage: The city lies on the broad gauge railway line connecting Delhi to Bhopal. A narrow gauge line connects the city to sheopur. The station is located on the main Mumbai‐Delhi and Chennai‐Delhi rail link.
The two major train services that operate in the region connecting Gwalior to Delhi are Shatabdi Express and Taj express. Other trains connecting Delhi and Gwalior are the Goa Express, Jhelum Express, Kerala express, Karnataka Express, Tamil Nadu Express and Andhra Express.
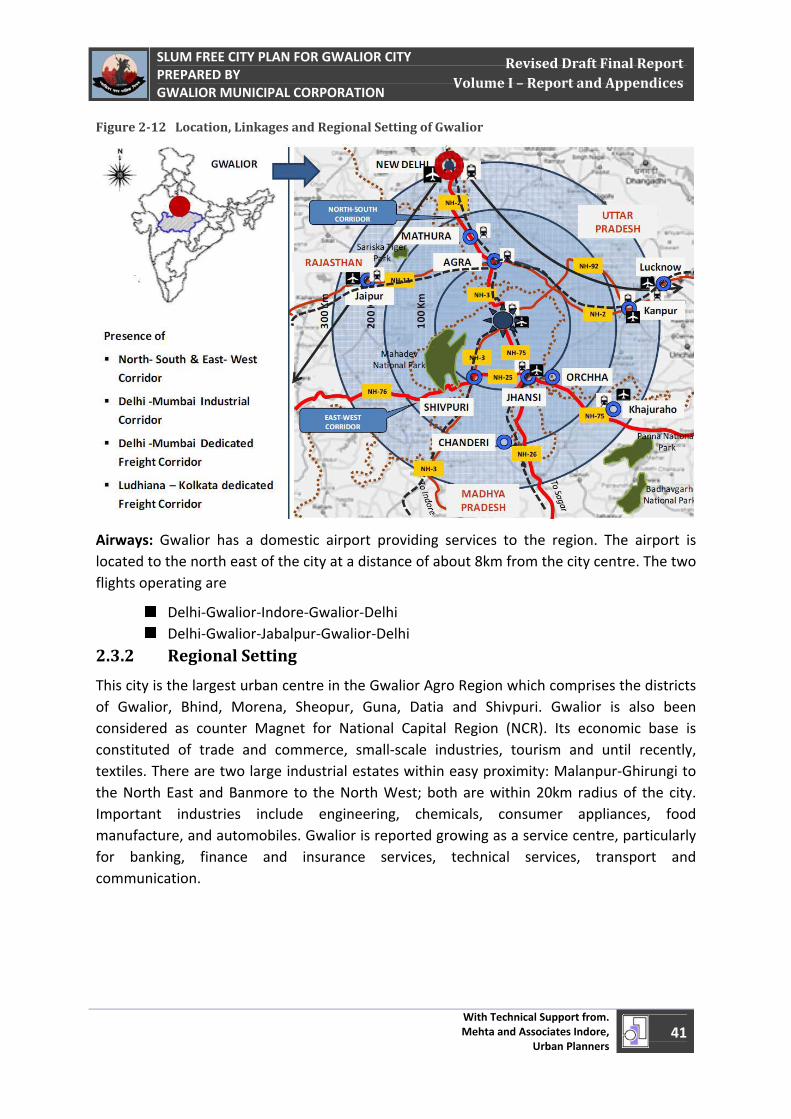
April 1, 2011
SLUM FREE CITY PLAN FOR GWALIOR CITY PREPARED BY GWALIOR MUNICIPAL CORPORATION
With Technical Support from. Mehta and Associates Indore,
Urban Planners 41
Revised Draft Final Report Volume I – Report and Appendices
Figure 212 Location, Linkages and Regional Setting of Gwalior
Airways: Gwalior has a domestic airport providing services to the region. The airport is located to the north east of the city at a distance of about 8km from the city centre. The two flights operating are
Delhi‐Gwalior‐Indore‐Gwalior‐Delhi Delhi‐Gwalior‐Jabalpur‐Gwalior‐Delhi
2.3.2 Regional Setting
This city is the largest urban centre in the Gwalior Agro Region which comprises the districts of Gwalior, Bhind, Morena, Sheopur, Guna, Datia and Shivpuri. Gwalior is also been considered as counter Magnet for National Capital Region (NCR). Its economic base is constituted of trade and commerce, small‐scale industries, tourism and until recently, textiles. There are two large industrial estates within easy proximity: Malanpur‐Ghirungi to the North East and Banmore to the North West; both are within 20km radius of the city. Important industries include engineering, chemicals, consumer appliances, food manufacture, and automobiles. Gwalior is reported growing as a service centre, particularly for banking, finance and insurance services, technical services, transport and communication.
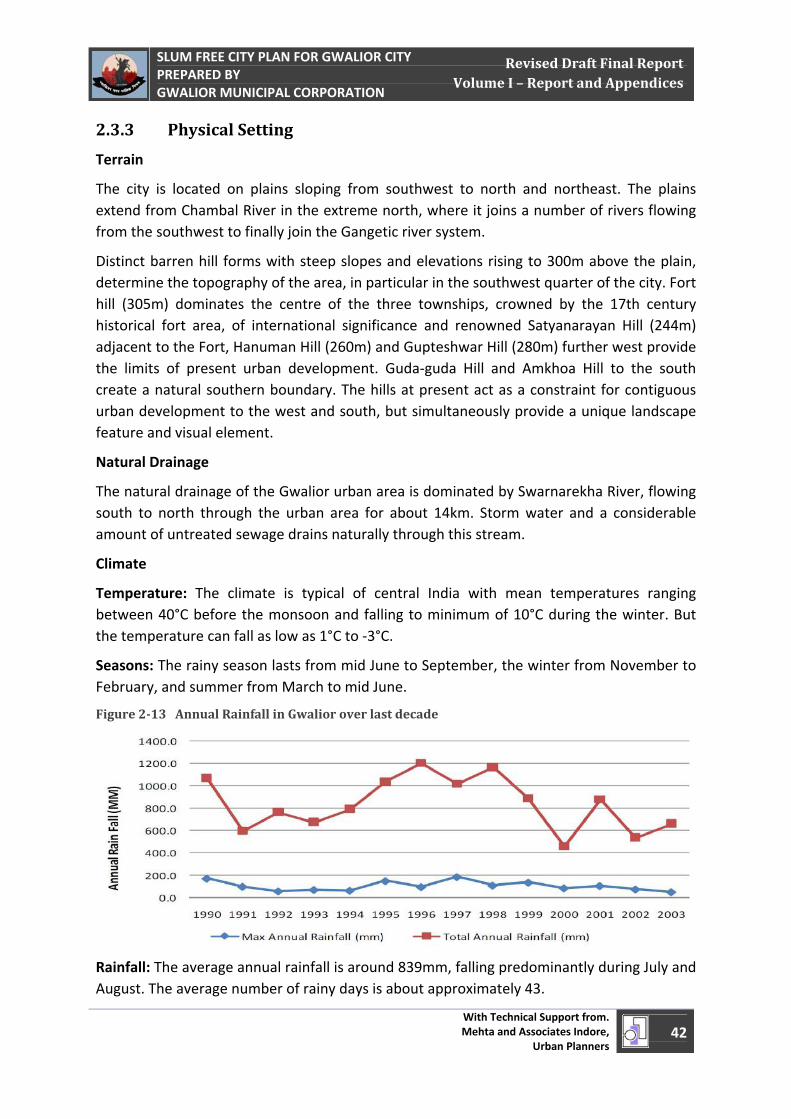
April 1, 2011
SLUM FREE CITY PLAN FOR GWALIOR CITY PREPARED BY GWALIOR MUNICIPAL CORPORATION
With Technical Support from. Mehta and Associates Indore,
Urban Planners 42
Revised Draft Final Report Volume I – Report and Appendices
2.3.3 Physical Setting
Terrain
The city is located on plains sloping from southwest to north and northeast. The plains extend from Chambal River in the extreme north, where it joins a number of rivers flowing from the southwest to finally join the Gangetic river system.
Distinct barren hill forms with steep slopes and elevations rising to 300m above the plain, determine the topography of the area, in particular in the southwest quarter of the city. Fort hill (305m) dominates the centre of the three townships, crowned by the 17th century historical fort area, of international significance and renowned Satyanarayan Hill (244m) adjacent to the Fort, Hanuman Hill (260m) and Gupteshwar Hill (280m) further west provide the limits of present urban development. Guda‐guda Hill and Amkhoa Hill to the south create a natural southern boundary. The hills at present act as a constraint for contiguous urban development to the west and south, but simultaneously provide a unique landscape feature and visual element.
Natural Drainage
The natural drainage of the Gwalior urban area is dominated by Swarnarekha River, flowing south to north through the urban area for about 14km. Storm water and a considerable amount of untreated sewage drains naturally through this stream.
Climate
Temperature: The climate is typical of central India with mean temperatures ranging between 40°C before the monsoon and falling to minimum of 10°C during the winter. But the temperature can fall as low as 1°C to ‐3°C.
Seasons: The rainy season lasts from mid June to September, the winter from November to February, and summer from March to mid June.
Figure 213 Annual Rainfall in Gwalior over last decade
Rainfall: The average annual rainfall is around 839mm, falling predominantly during July and August. The average number of rainy days is about approximately 43.
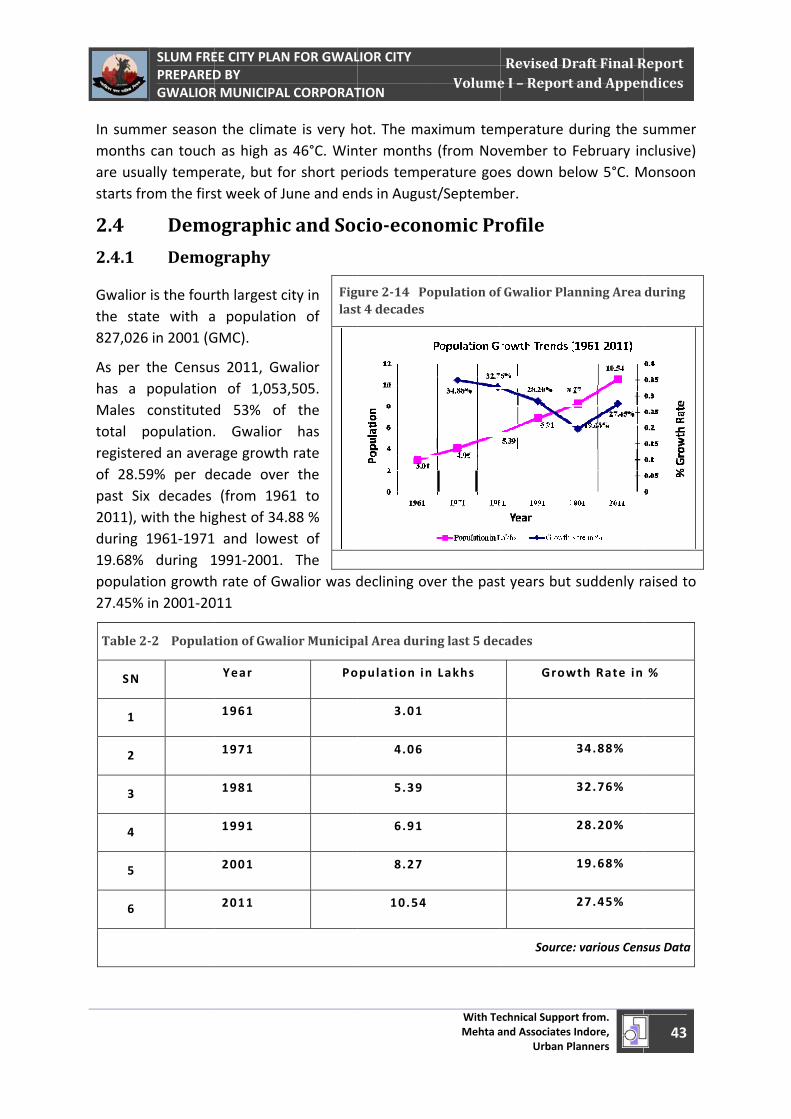
April 1, 2011
In summmonthsare usustarts fr
2.4 2.4.1
Gwaliorthe sta827,026
As per has a Males total pregisterof 28.5past Si2011), wduring 19.68%populat27.45%
Table 2
SN
1
2
3
4
5
6
SLUM FREPREPAREDGWALIOR
mer seasons can touchually temperom the firs
Demo
Demo
r is the fourate with a6 in 2001 (G
the Censuspopulationconstitutedpopulation.red an aver59% per dex decades with the hig1961‐1971 during 1tion growth in 2001‐20
22 Populat
EE CITY PLAND BY R MUNICIPAL
n the climath as high asrate, but fost week of J
ographic
graphy
rth largest ca populatioGMC).
s 2011, Gwn of 1,053d 53% of . Gwalior rage growthecade over(from 196
ghest of 34. and lowe1991‐2001. h rate of Gw011
tion of Gwal
Year
1961
1971
1981
1991
2001
2011
N FOR GWAL L CORPORAT
te is very hs 46°C. Winor short peune and en
c and Soc
city in on of
walior 3,505. f the
has h rate r the 61 to .88 % est of
The walior was d
lior Municip
Po
Figlast
LIOR CITY TION
ot. The mater monthsriods tempds in Augus
cioecon
declining ov
al Area duri
pulat ion in
3.01
4.06
5.39
6.91
8.27
10.54
ure 214 Pot 4 decades
With TeMehta a
Volume
aximum tems (from Noverature goest/Septemb
nomic Pr
ver the past
ng last 5 dec
n Lakhs
opulation of
echnical Supporand Associates
Urban P
Revised De I – Report
mperature dvember to es down beber.
rofile
t years but
cades
Grow
Source
f Gwalior Pla
rt from. Indore,
Planners
raft Final Rt and Appen
during the sFebruary inelow 5°C. M
suddenly r
wth Rate in
34.88%
32.76%
28.20%
19.68%
27.45%
e: various Cens
anning Area
43
Report ndices
summer nclusive) Monsoon
raised to
%
sus Data
during
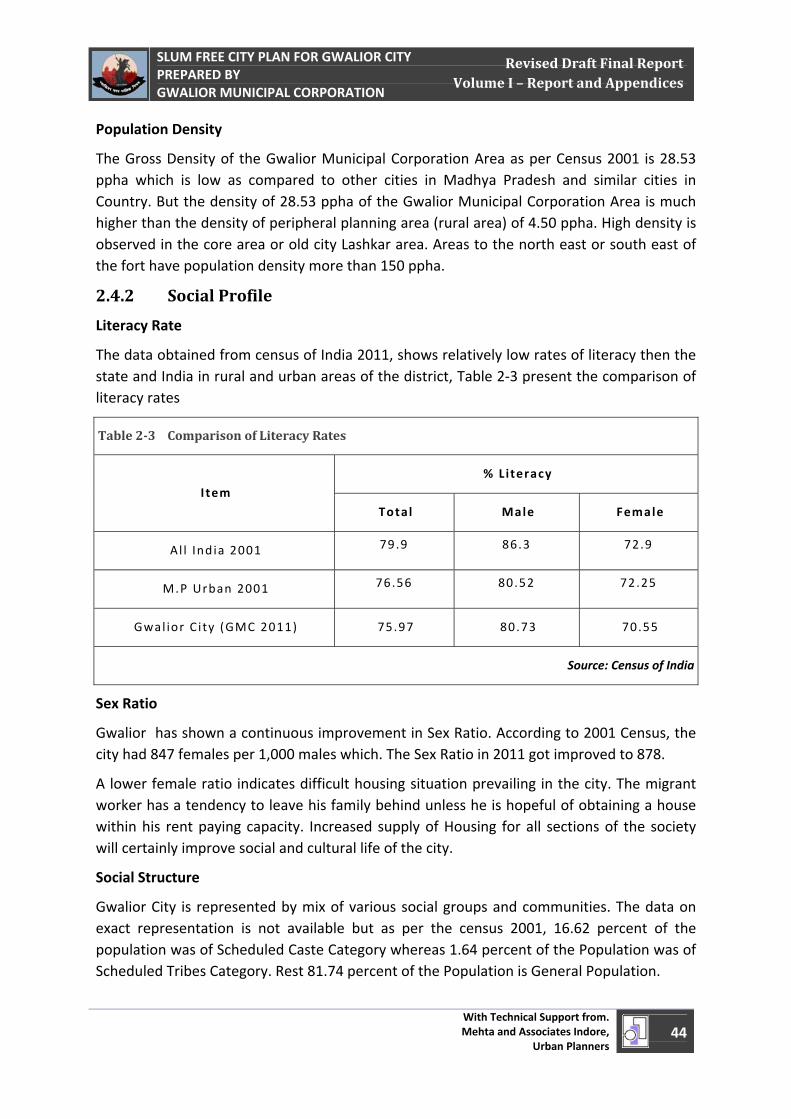
April 1, 2011
SLUM FREE CITY PLAN FOR GWALIOR CITY PREPARED BY GWALIOR MUNICIPAL CORPORATION
With Technical Support from. Mehta and Associates Indore,
Urban Planners 44
Revised Draft Final Report Volume I – Report and Appendices
Population Density
The Gross Density of the Gwalior Municipal Corporation Area as per Census 2001 is 28.53 ppha which is low as compared to other cities in Madhya Pradesh and similar cities in Country. But the density of 28.53 ppha of the Gwalior Municipal Corporation Area is much higher than the density of peripheral planning area (rural area) of 4.50 ppha. High density is observed in the core area or old city Lashkar area. Areas to the north east or south east of the fort have population density more than 150 ppha.
2.4.2 Social Profile
Literacy Rate
The data obtained from census of India 2011, shows relatively low rates of literacy then the state and India in rural and urban areas of the district, Table 2‐3 present the comparison of literacy rates
Table 23 Comparison of Literacy Rates
I tem
% Literacy
Total Male Female
Al l Ind ia 2001 79.9 86.3 72.9
M.P Urban 2001 76.56 80.52 72.25
Gwal ior City (GMC 2011) 75.97 80.73 70.55
Source: Census of India
Sex Ratio
Gwalior has shown a continuous improvement in Sex Ratio. According to 2001 Census, the city had 847 females per 1,000 males which. The Sex Ratio in 2011 got improved to 878.
A lower female ratio indicates difficult housing situation prevailing in the city. The migrant worker has a tendency to leave his family behind unless he is hopeful of obtaining a house within his rent paying capacity. Increased supply of Housing for all sections of the society will certainly improve social and cultural life of the city.
Social Structure
Gwalior City is represented by mix of various social groups and communities. The data on exact representation is not available but as per the census 2001, 16.62 percent of the population was of Scheduled Caste Category whereas 1.64 percent of the Population was of Scheduled Tribes Category. Rest 81.74 percent of the Population is General Population.
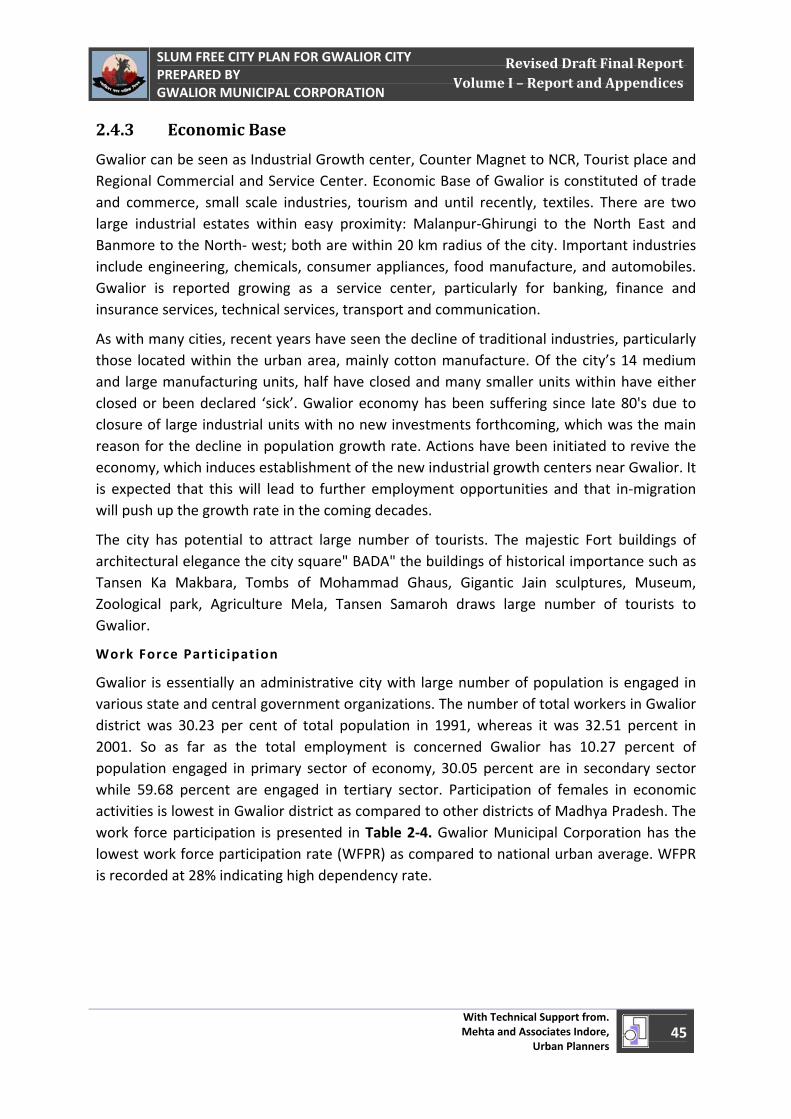
April 1, 2011
SLUM FREE CITY PLAN FOR GWALIOR CITY PREPARED BY GWALIOR MUNICIPAL CORPORATION
With Technical Support from. Mehta and Associates Indore,
Urban Planners 45
Revised Draft Final Report Volume I – Report and Appendices
2.4.3 Economic Base
Gwalior can be seen as Industrial Growth center, Counter Magnet to NCR, Tourist place and Regional Commercial and Service Center. Economic Base of Gwalior is constituted of trade and commerce, small scale industries, tourism and until recently, textiles. There are two large industrial estates within easy proximity: Malanpur‐Ghirungi to the North East and Banmore to the North‐ west; both are within 20 km radius of the city. Important industries include engineering, chemicals, consumer appliances, food manufacture, and automobiles. Gwalior is reported growing as a service center, particularly for banking, finance and insurance services, technical services, transport and communication.
As with many cities, recent years have seen the decline of traditional industries, particularly those located within the urban area, mainly cotton manufacture. Of the city’s 14 medium and large manufacturing units, half have closed and many smaller units within have either closed or been declared ‘sick’. Gwalior economy has been suffering since late 80's due to closure of large industrial units with no new investments forthcoming, which was the main reason for the decline in population growth rate. Actions have been initiated to revive the economy, which induces establishment of the new industrial growth centers near Gwalior. It is expected that this will lead to further employment opportunities and that in‐migration will push up the growth rate in the coming decades.
The city has potential to attract large number of tourists. The majestic Fort buildings of architectural elegance the city square" BADA" the buildings of historical importance such as Tansen Ka Makbara, Tombs of Mohammad Ghaus, Gigantic Jain sculptures, Museum, Zoological park, Agriculture Mela, Tansen Samaroh draws large number of tourists to Gwalior.
Work Force Partic ipation
Gwalior is essentially an administrative city with large number of population is engaged in various state and central government organizations. The number of total workers in Gwalior district was 30.23 per cent of total population in 1991, whereas it was 32.51 percent in 2001. So as far as the total employment is concerned Gwalior has 10.27 percent of population engaged in primary sector of economy, 30.05 percent are in secondary sector while 59.68 percent are engaged in tertiary sector. Participation of females in economic activities is lowest in Gwalior district as compared to other districts of Madhya Pradesh. The work force participation is presented in Table 2‐4. Gwalior Municipal Corporation has the lowest work force participation rate (WFPR) as compared to national urban average. WFPR is recorded at 28% indicating high dependency rate.
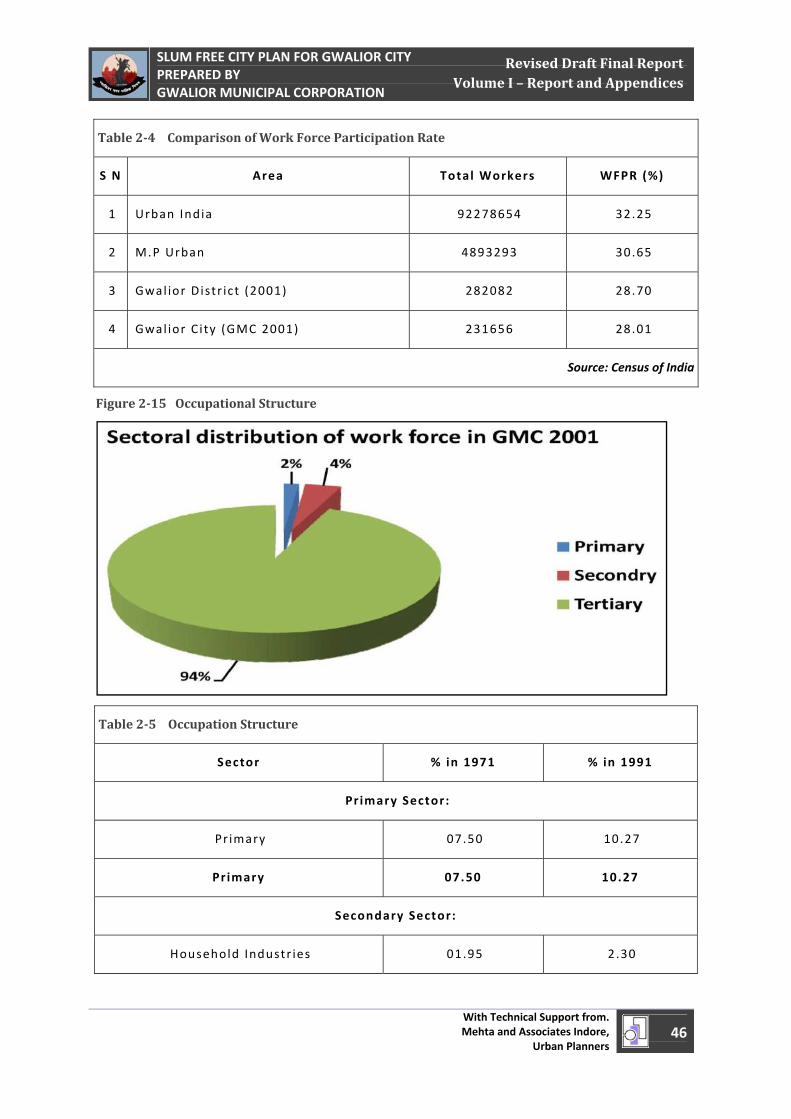
April 1, 2011
SLUM FREE CITY PLAN FOR GWALIOR CITY PREPARED BY GWALIOR MUNICIPAL CORPORATION
With Technical Support from. Mehta and Associates Indore,
Urban Planners 46
Revised Draft Final Report Volume I – Report and Appendices
Table 24 Comparison of Work Force Participation Rate
S N Area Total Workers WFPR (%)
1 Urban India 92278654 32.25
2 M.P Urban 4893293 30.65
3 Gwal ior Distr ict (2001) 282082 28.70
4 Gwal ior City (GMC 2001) 231656 28.01
Source: Census of India
Figure 215 Occupational Structure
Table 25 Occupation Structure
Sector % in 1971 % in 1991
Primary Sector:
Pr imary 07.50 10.27
Primary 07.50 10.27
Secondary Sector:
Household Industr ies 01.95 2.30
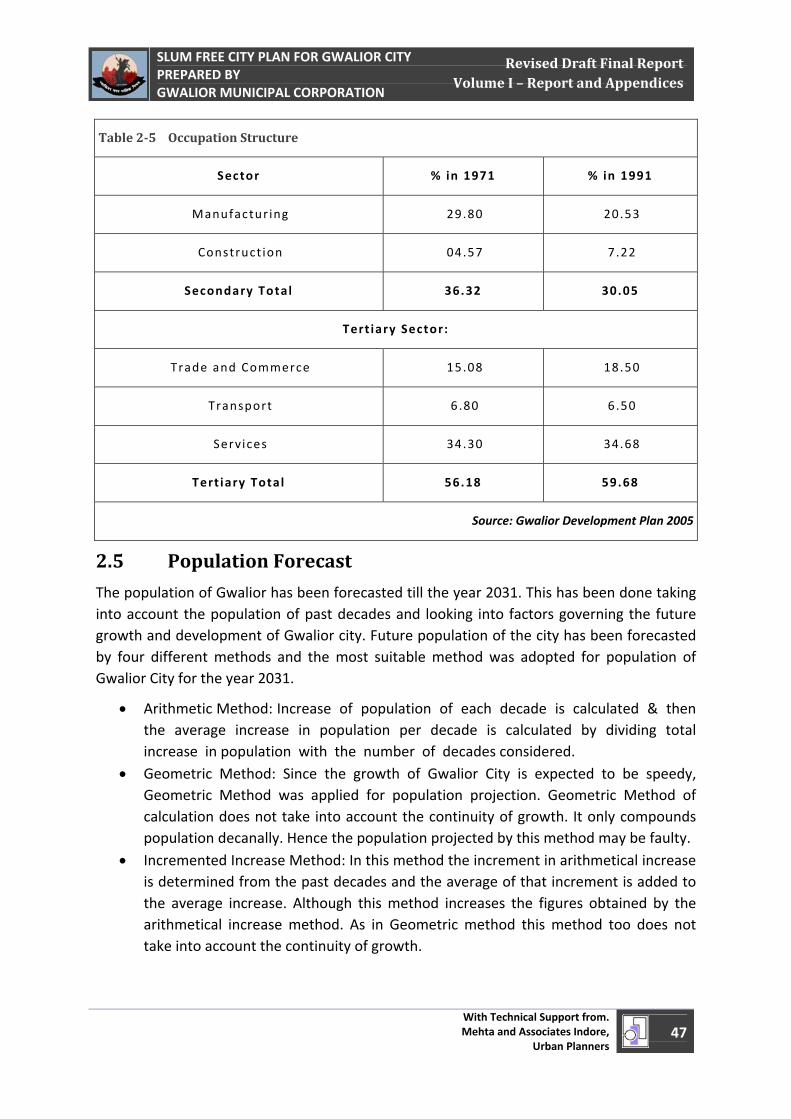
April 1, 2011
SLUM FREE CITY PLAN FOR GWALIOR CITY PREPARED BY GWALIOR MUNICIPAL CORPORATION
With Technical Support from. Mehta and Associates Indore,
Urban Planners 47
Revised Draft Final Report Volume I – Report and Appendices
Table 25 Occupation Structure
Sector % in 1971 % in 1991
Manufactur ing 29.80 20.53
Construct ion 04.57 7.22
Secondary Total 36.32 30.05
Tert iary Sector:
Trade and Commerce 15.08 18.50
Transport 6.80 6.50
Services 34.30 34.68
Tert iary Total 56.18 59.68
Source: Gwalior Development Plan 2005
2.5 Population Forecast
The population of Gwalior has been forecasted till the year 2031. This has been done taking into account the population of past decades and looking into factors governing the future growth and development of Gwalior city. Future population of the city has been forecasted by four different methods and the most suitable method was adopted for population of Gwalior City for the year 2031.
• Arithmetic Method: Increase of population of each decade is calculated & then the average increase in population per decade is calculated by dividing total increase in population with the number of decades considered.
• Geometric Method: Since the growth of Gwalior City is expected to be speedy, Geometric Method was applied for population projection. Geometric Method of calculation does not take into account the continuity of growth. It only compounds population decanally. Hence the population projected by this method may be faulty.
• Incremented Increase Method: In this method the increment in arithmetical increase is determined from the past decades and the average of that increment is added to the average increase. Although this method increases the figures obtained by the arithmetical increase method. As in Geometric method this method too does not take into account the continuity of growth.
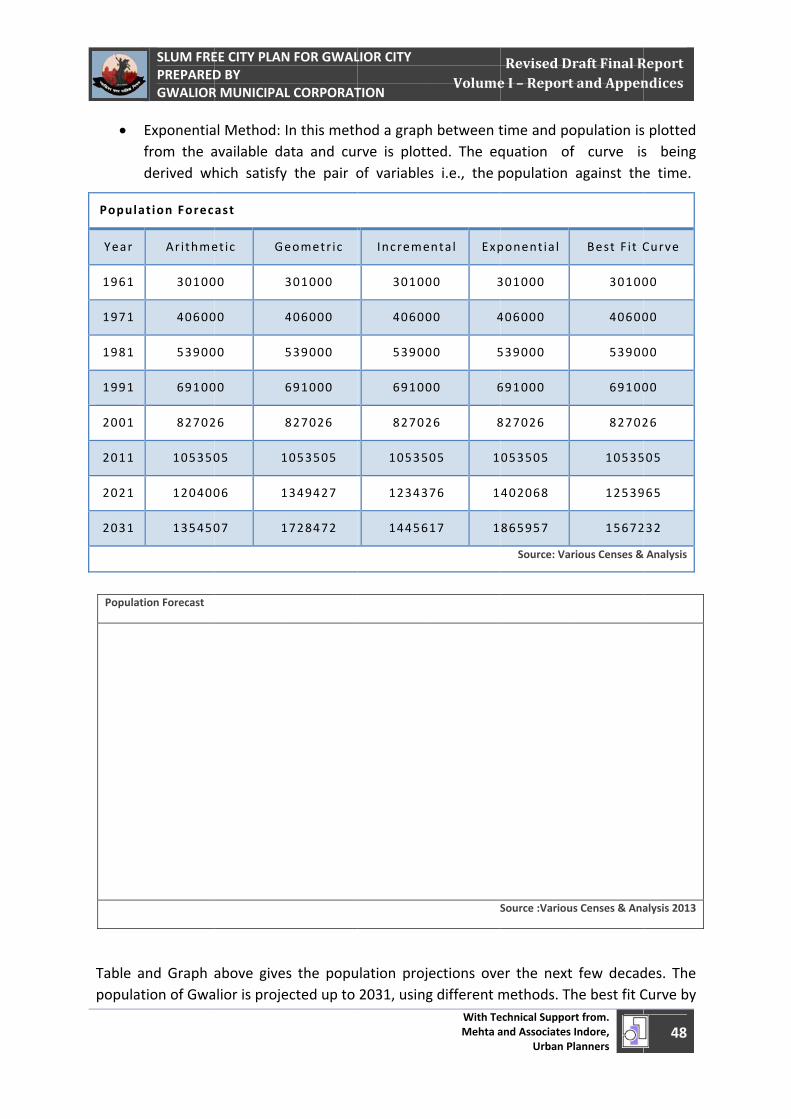
April 1, 2011
•
Popula
Year
1961
1971
1981
1991
2001
2011
2021
2031
Table apopulat
Populat
SLUM FREPREPAREDGWALIOR
Exponentiafrom the aderived wh
ation Forec
Arithme
30100
40600
53900
69100
82702
105350
120400
135450
and Graph ation of Gwa
tion Forecast
EE CITY PLAND BY R MUNICIPAL
al Method: Iavailable dahich satisfy
ast
et ic Ge
00 3
00 4
00 5
00 6
26 8
05 1
06 1
07 1
above givealior is proje
N FOR GWAL L CORPORAT
In this methata and cuy the pair o
eometr ic
301000
406000
539000
691000
827026
1053505
1349427
1728472
s the popuected up to
LIOR CITY TION
hod a graphrve is plottof variables
Increme
30100
40600
53900
69100
82702
10535
12343
14456
ulation proj2031, using
With TeMehta a
Volume
h between tted. The eqs i.e., the p
ntal Exp
00 3
00 4
00 5
00 6
26 8
05 1
76 1
17 1
ections oveg different m
S
echnical Supporand Associates
Urban P
Revised De I – Report
time and poquation ofpopulation
ponent ia l
301000
406000
539000
691000
827026
053505
402068
865957
Source: Var
er the nextmethods. Th
Source :Variou
rt from. Indore,
Planners
raft Final Rt and Appen
opulation isf curve isagainst the
Best F it C
30100
40600
53900
69100
82702
10535
12539
15672
rious Censes &
t few decadhe best fit C
us Censes & Ana
48
Report ndices
s plotted s being e time.
Curve
00
00
00
00
26
505
965
232
Analysis
des. The Curve by
alysis 2013
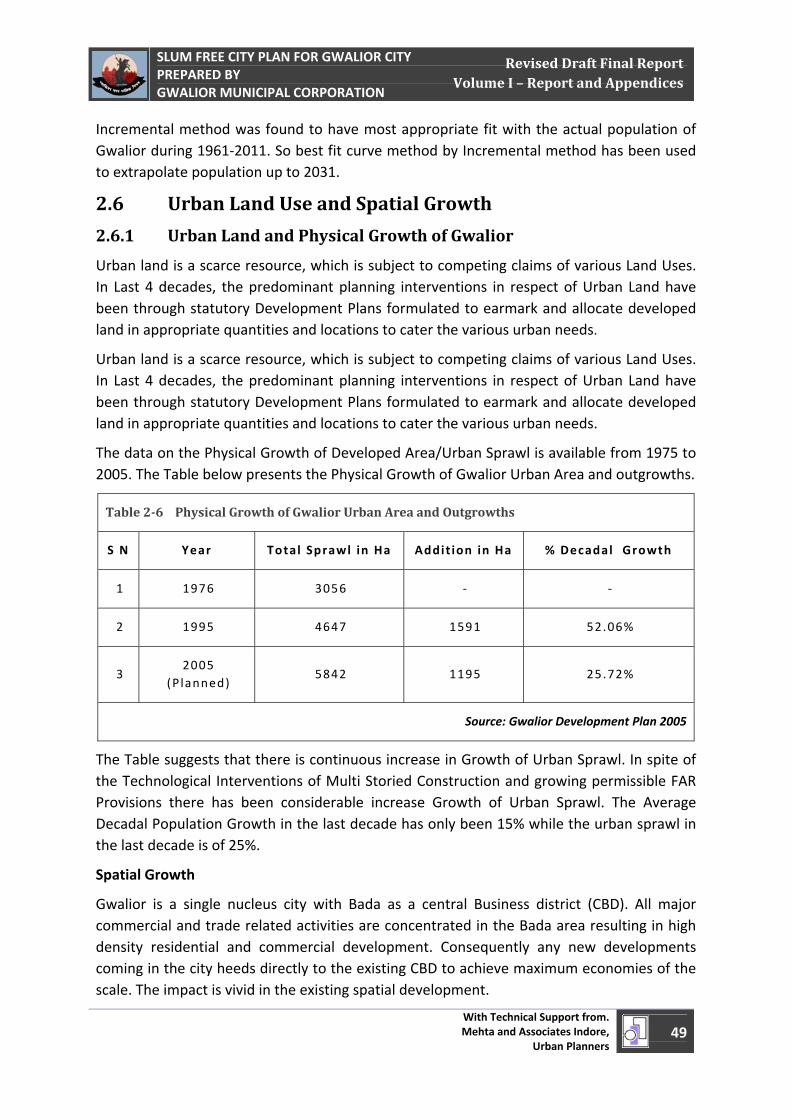
April 1, 2011
SLUM FREE CITY PLAN FOR GWALIOR CITY PREPARED BY GWALIOR MUNICIPAL CORPORATION
With Technical Support from. Mehta and Associates Indore,
Urban Planners 49
Revised Draft Final Report Volume I – Report and Appendices
Incremental method was found to have most appropriate fit with the actual population of Gwalior during 1961‐2011. So best fit curve method by Incremental method has been used to extrapolate population up to 2031.
2.6 Urban Land Use and Spatial Growth
2.6.1 Urban Land and Physical Growth of Gwalior
Urban land is a scarce resource, which is subject to competing claims of various Land Uses. In Last 4 decades, the predominant planning interventions in respect of Urban Land have been through statutory Development Plans formulated to earmark and allocate developed land in appropriate quantities and locations to cater the various urban needs.
Urban land is a scarce resource, which is subject to competing claims of various Land Uses. In Last 4 decades, the predominant planning interventions in respect of Urban Land have been through statutory Development Plans formulated to earmark and allocate developed land in appropriate quantities and locations to cater the various urban needs.
The data on the Physical Growth of Developed Area/Urban Sprawl is available from 1975 to 2005. The Table below presents the Physical Growth of Gwalior Urban Area and outgrowths.
Table 26 Physical Growth of Gwalior Urban Area and Outgrowths
S N Year Total Sprawl in Ha Addit ion in Ha % Decadal Growth
1 1976 3056 ‐ ‐
2 1995 4647 1591 52.06%
3 2005
(P lanned) 5842 1195 25.72%
Source: Gwalior Development Plan 2005
The Table suggests that there is continuous increase in Growth of Urban Sprawl. In spite of the Technological Interventions of Multi Storied Construction and growing permissible FAR Provisions there has been considerable increase Growth of Urban Sprawl. The Average Decadal Population Growth in the last decade has only been 15% while the urban sprawl in the last decade is of 25%.
Spatial Growth
Gwalior is a single nucleus city with Bada as a central Business district (CBD). All major commercial and trade related activities are concentrated in the Bada area resulting in high density residential and commercial development. Consequently any new developments coming in the city heeds directly to the existing CBD to achieve maximum economies of the scale. The impact is vivid in the existing spatial development.
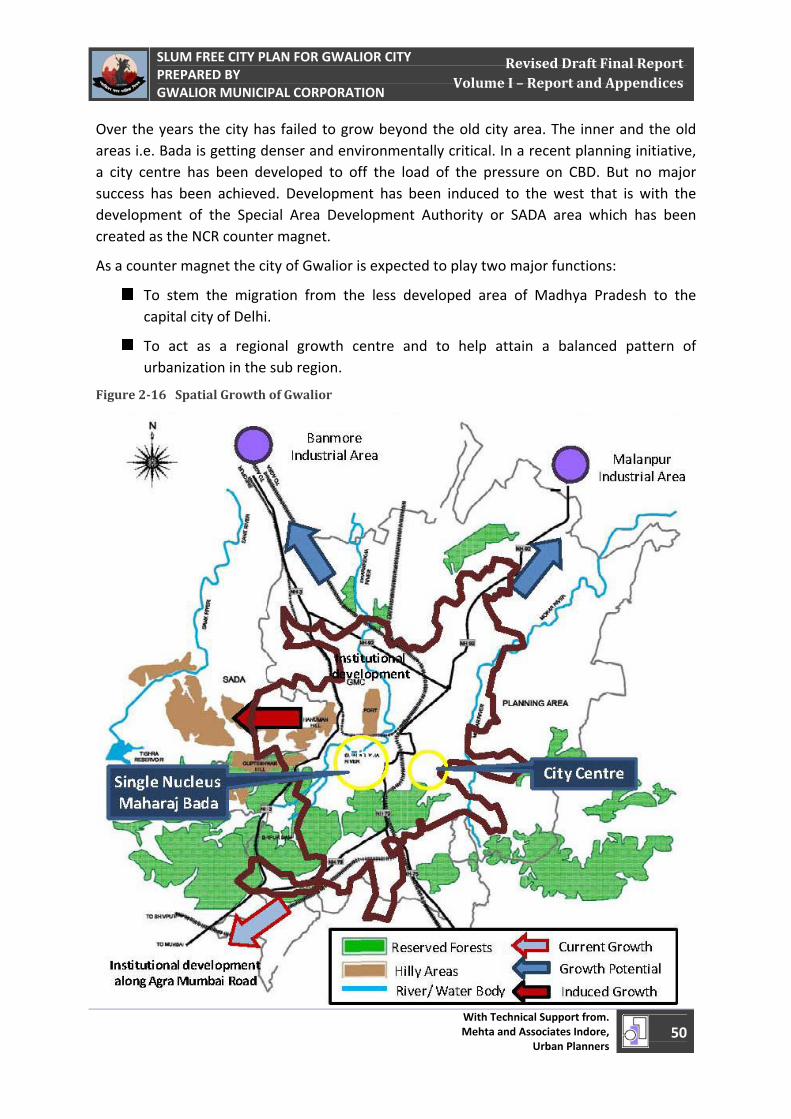
April 1, 2011
SLUM FREE CITY PLAN FOR GWALIOR CITY PREPARED BY GWALIOR MUNICIPAL CORPORATION
With Technical Support from. Mehta and Associates Indore,
Urban Planners 50
Revised Draft Final Report Volume I – Report and Appendices
Over the years the city has failed to grow beyond the old city area. The inner and the old areas i.e. Bada is getting denser and environmentally critical. In a recent planning initiative, a city centre has been developed to off the load of the pressure on CBD. But no major success has been achieved. Development has been induced to the west that is with the development of the Special Area Development Authority or SADA area which has been created as the NCR counter magnet.
As a counter magnet the city of Gwalior is expected to play two major functions:
To stem the migration from the less developed area of Madhya Pradesh to the capital city of Delhi.
To act as a regional growth centre and to help attain a balanced pattern of urbanization in the sub region.
Figure 216 Spatial Growth of Gwalior
April 1, 2011
SLUM FREE CITY PLAN FOR GWALIOR CITY PREPARED BY GWALIOR MUNICIPAL CORPORATION
With Technical Support from. Mehta and Associates Indore,
Urban Planners 51
Revised Draft Final Report Volume I – Report and Appendices
For implementation of the counter magnet project, the Government of Madhya Pradesh in the year 1992, Constituted a Special Area Development Authority (SADA). The jurisdiction of SADA covers an area of 30,000 Ha of which 6,500 Ha is Government property, 9,000 Ha is privately owned and 14,500 ha is reserve forest. This SADA area is also referred to as Gwalior west because of its location in the western side of Gwalior. In future the city has a potential to grow towards the north and north east side due to the following reasons.
The city’s proximity to Delhi and good connectivity via National Highway and Railways.
Due to the presence of industrial growth centers.
Suitable land between NH3 and NH 92
The major development in the city includes the following:
Commercial Developments
Multiplex by RLDA on Mandir Chauraha on an area of 3.5 Acres.
Development of multiplex by Bhaskar Group near the railway station.
Madhav Plaza Multiplex in Lakshar is under construction with a total area of 1 lakh Sq. ft, Rs. 100 Crores has been invested in the project.
IT Park 60 Ha, 20 Ha constructed under STPI (Administrative Building constructed by MPHB)
Residential Developments
Residential colonies by GDA include Shatabdipuram and Mahadjinagar City Centre.
Jaderua Kalan Colony on 150 Bhigas
Windsor City by Assotech, Putli Ghar, City centre
Residential development at Loha Mandi
Institutional Developments
Upgraded 1000 bed Hospital at Kampoo Road by PWD
Construction of new Collectorate by PWD
Development of Medical College – Nav Uday Educatioon Society at Morena Link Road.
2.6.2 Gwalior Development Plan 2005
The total planning area covers 52,652 Ha out of which the current developed area is 5842 Ha (11%). This indicates towards a low growth pattern. The table below highlights the existing land use pattern of the planning area.
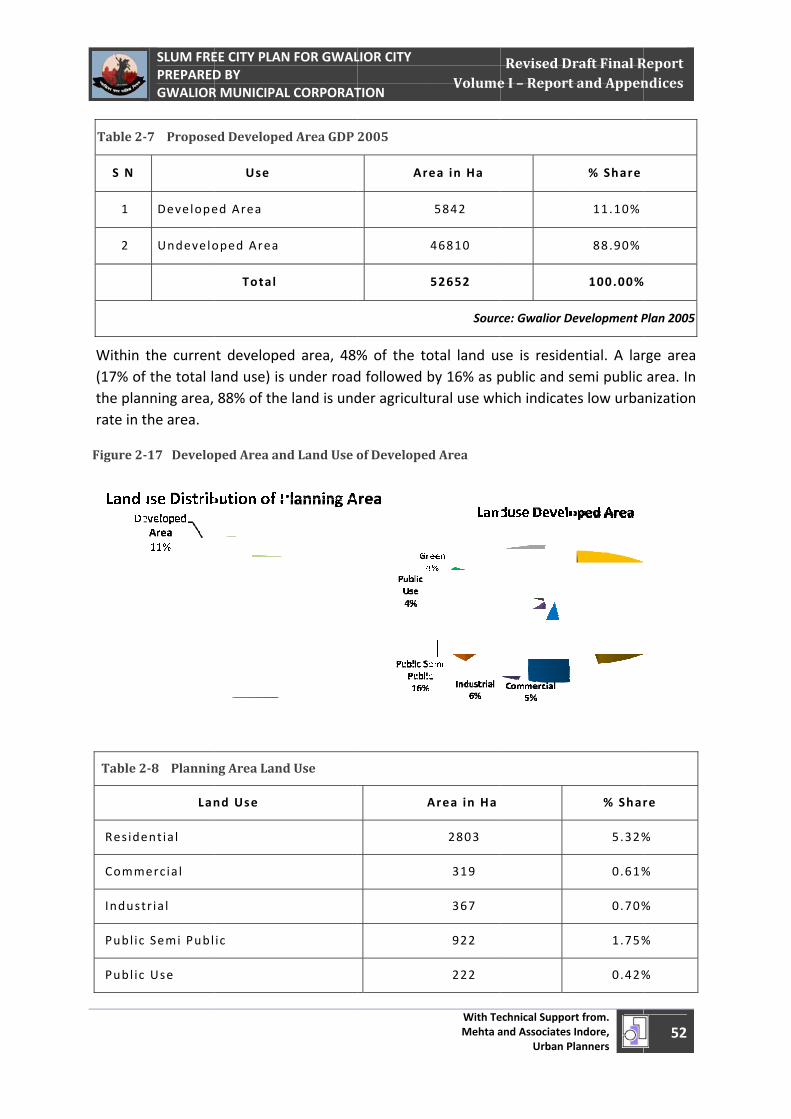
April 1, 2011
Table 2
S N
1
2
Within (17% ofthe planrate in t
Figure 2
Table 2
Reside
Comm
Indust
Publ ic
Publ ic
SLUM FREPREPAREDGWALIOR
7 Propose
Develope
Undevelo
the currenf the total lnning area, the area.
17 Develop
28 Plannin
Lan
ent ia l
mercia l
tr ia l
c Semi Publ
c Use
EE CITY PLAND BY R MUNICIPAL
ed Developed
Use
ed Area
oped Area
Total
nt developeand use) is 88% of the
ped Area an
ng Area Land
nd Use
ic
N FOR GWAL L CORPORAT
d Area GDP
ed area, 48%under road
e land is und
nd Land Use o
d Use
LIOR CITY TION
2005
Ar
% of the tod followed bder agricult
of Developed
A
With TeMehta a
Volume
ea in Ha
5842
46810
52652
Sourc
otal land usby 16% as pural use wh
d Area
Area in Ha
2803
319
367
922
222
echnical Supporand Associates
Urban P
Revised De I – Report
ce: Gwalior D
se is residepublic and shich indicate
rt from. Indore,
Planners
raft Final Rt and Appen
% Share
11.10%
88.90%
100.00%
Development P
ential. A larsemi public es low urba
% Sha
5.32%
0.61%
0.70%
1.75%
0.42%
52
Report ndices
Plan 2005
rge area area. In nization
re
%
%
%
%
%
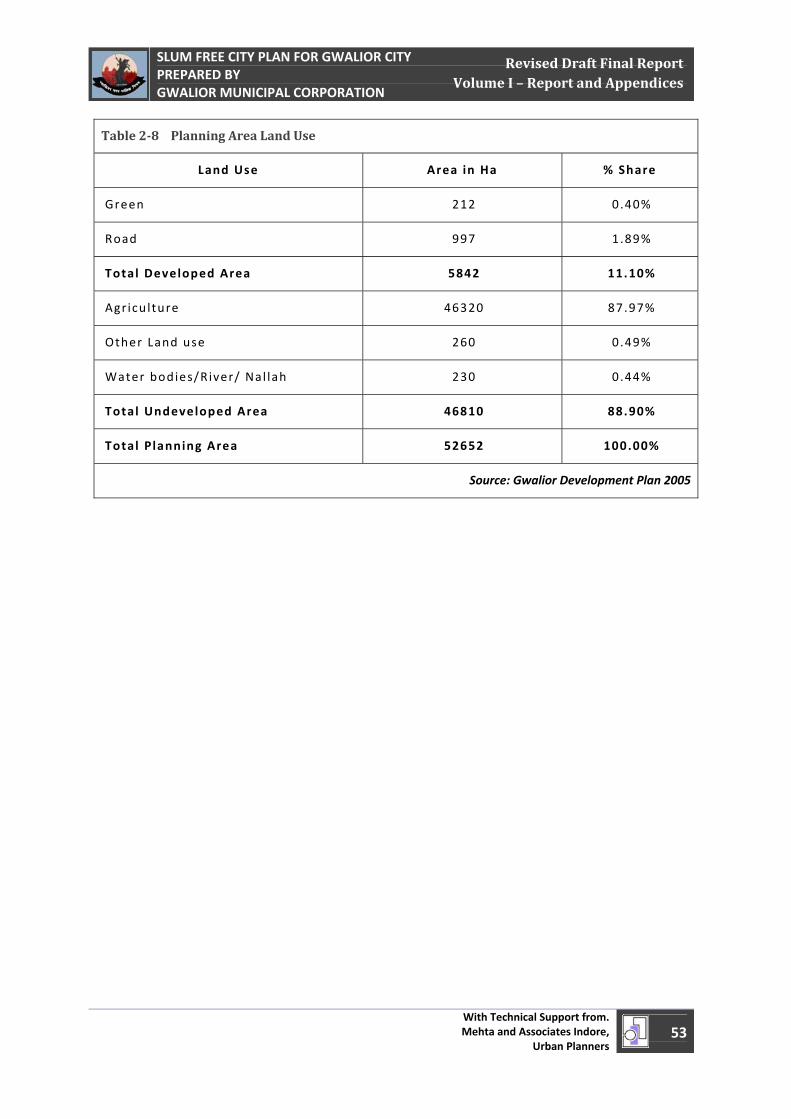
April 1, 2011
SLUM FREE CITY PLAN FOR GWALIOR CITY PREPARED BY GWALIOR MUNICIPAL CORPORATION
With Technical Support from. Mehta and Associates Indore,
Urban Planners 53
Revised Draft Final Report Volume I – Report and Appendices
Table 28 Planning Area Land Use
Land Use Area in Ha % Share
Green 212 0.40%
Road 997 1.89%
Total Developed Area 5842 11.10%
Agricu lture 46320 87.97%
Other Land use 260 0.49%
Water bodies/River/ Nal lah 230 0.44%
Total Undeveloped Area 46810 88.90%
Total Planning Area 52652 100.00%
Source: Gwalior Development Plan 2005
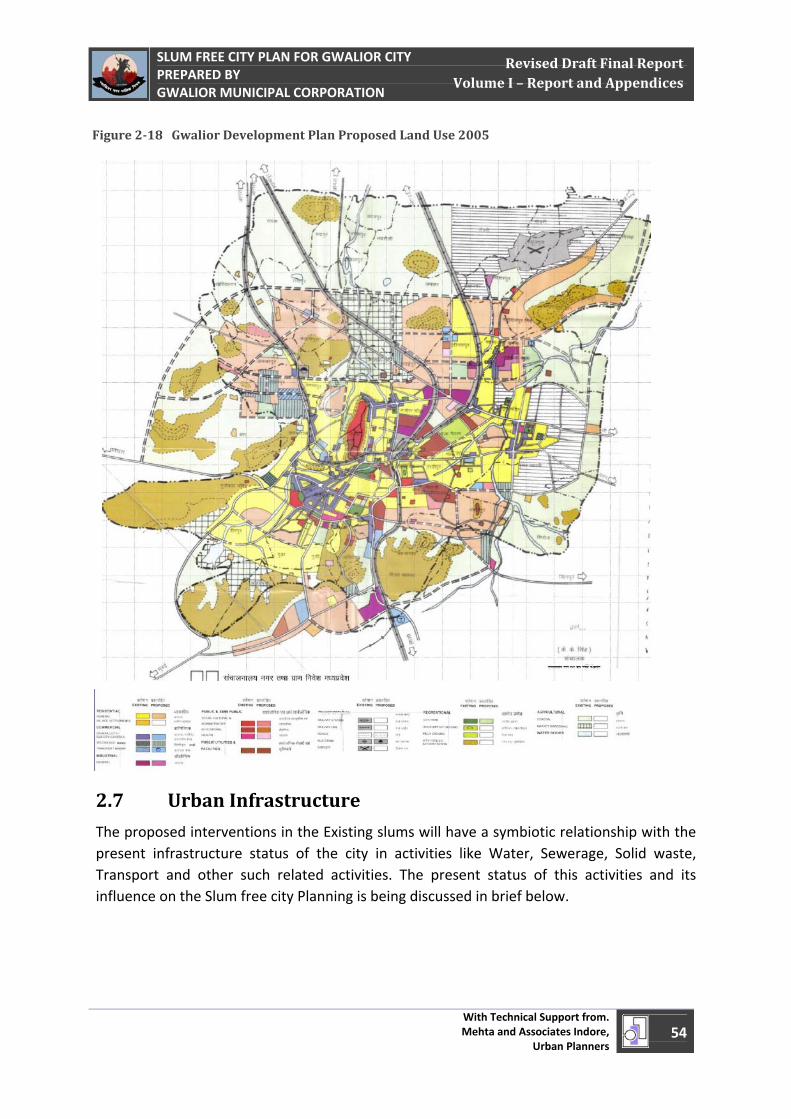
April 1, 2011
SLUM FREE CITY PLAN FOR GWALIOR CITY PREPARED BY GWALIOR MUNICIPAL CORPORATION
With Technical Support from. Mehta and Associates Indore,
Urban Planners 54
Revised Draft Final Report Volume I – Report and Appendices
Figure 218 Gwalior Development Plan Proposed Land Use 2005
2.7 Urban Infrastructure
The proposed interventions in the Existing slums will have a symbiotic relationship with the present infrastructure status of the city in activities like Water, Sewerage, Solid waste, Transport and other such related activities. The present status of this activities and its influence on the Slum free city Planning is being discussed in brief below.
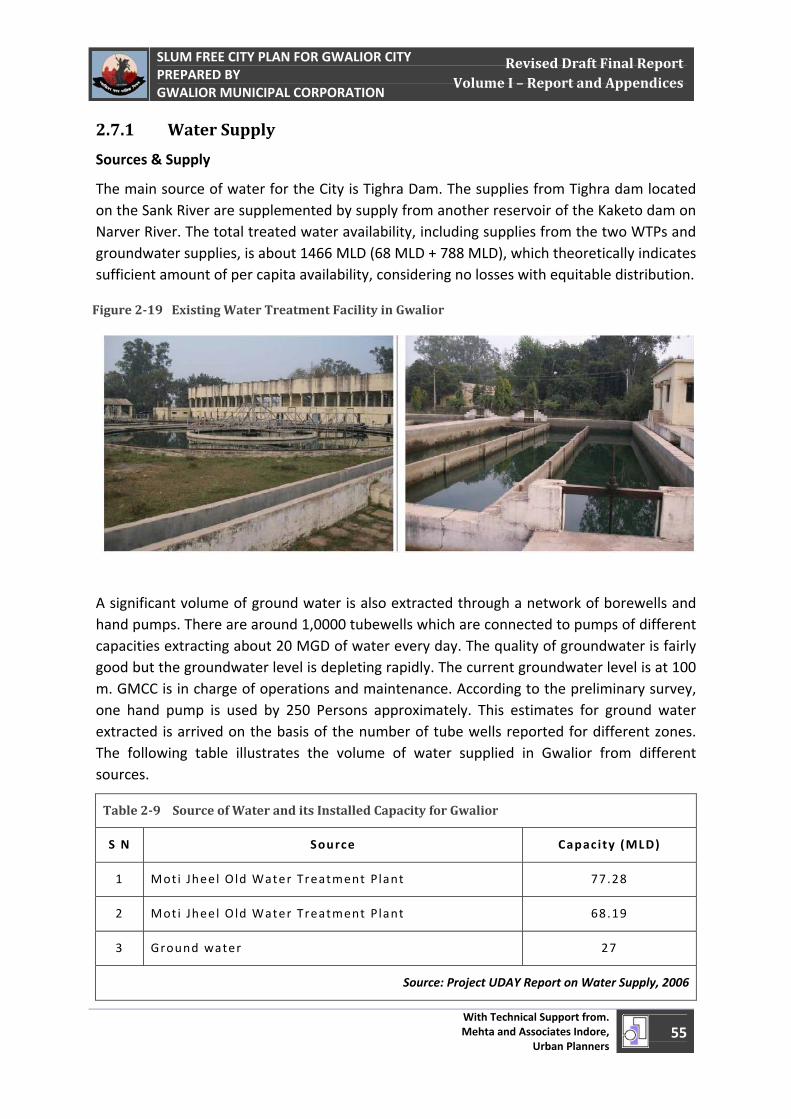
April 1, 2011
SLUM FREE CITY PLAN FOR GWALIOR CITY PREPARED BY GWALIOR MUNICIPAL CORPORATION
With Technical Support from. Mehta and Associates Indore,
Urban Planners 55
Revised Draft Final Report Volume I – Report and Appendices
2.7.1 Water Supply
Sources & Supply
The main source of water for the City is Tighra Dam. The supplies from Tighra dam located on the Sank River are supplemented by supply from another reservoir of the Kaketo dam on Narver River. The total treated water availability, including supplies from the two WTPs and groundwater supplies, is about 1466 MLD (68 MLD + 788 MLD), which theoretically indicates sufficient amount of per capita availability, considering no losses with equitable distribution.
Figure 219 Existing Water Treatment Facility in Gwalior
A significant volume of ground water is also extracted through a network of borewells and hand pumps. There are around 1,0000 tubewells which are connected to pumps of different capacities extracting about 20 MGD of water every day. The quality of groundwater is fairly good but the groundwater level is depleting rapidly. The current groundwater level is at 100 m. GMCC is in charge of operations and maintenance. According to the preliminary survey, one hand pump is used by 250 Persons approximately. This estimates for ground water extracted is arrived on the basis of the number of tube wells reported for different zones. The following table illustrates the volume of water supplied in Gwalior from different sources.
Table 29 Source of Water and its Installed Capacity for Gwalior
S N Source Capacity (MLD)
1 Moti Jheel Old Water Treatment Plant 77.28
2 Moti Jheel Old Water Treatment Plant 68.19
3 Ground water 27
Source: Project UDAY Report on Water Supply, 2006
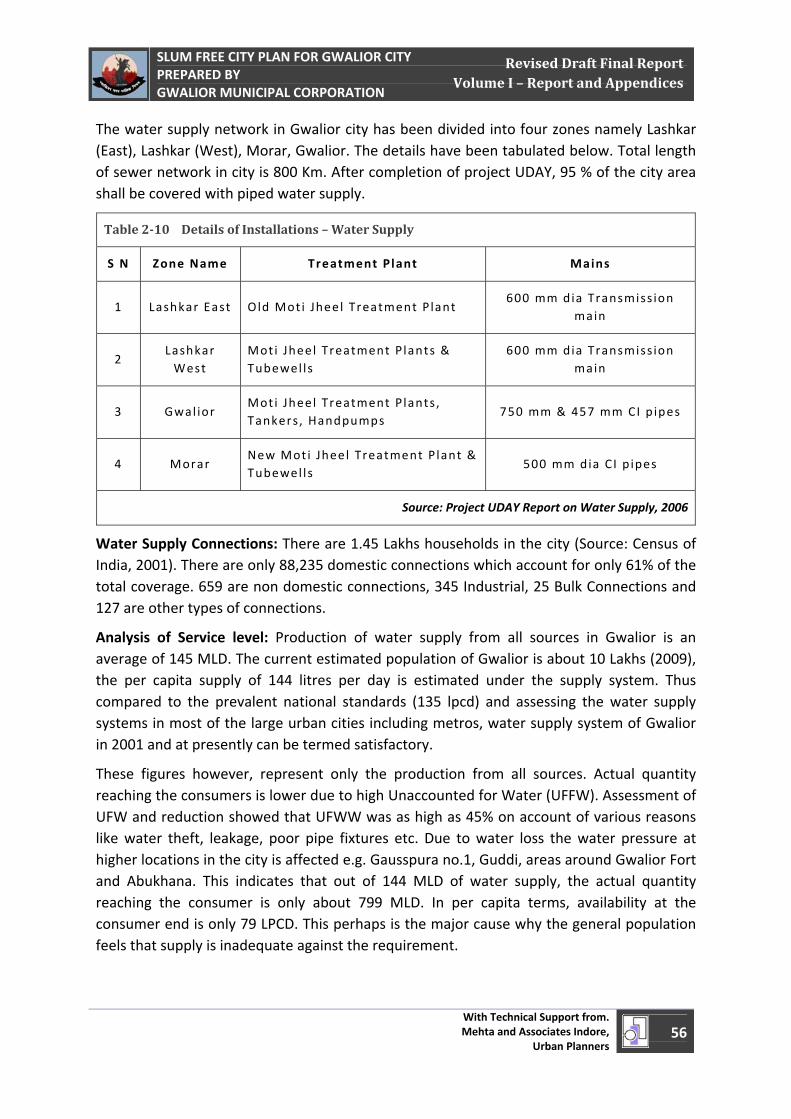
April 1, 2011
SLUM FREE CITY PLAN FOR GWALIOR CITY PREPARED BY GWALIOR MUNICIPAL CORPORATION
With Technical Support from. Mehta and Associates Indore,
Urban Planners 56
Revised Draft Final Report Volume I – Report and Appendices
The water supply network in Gwalior city has been divided into four zones namely Lashkar (East), Lashkar (West), Morar, Gwalior. The details have been tabulated below. Total length of sewer network in city is 800 Km. After completion of project UDAY, 95 % of the city area shall be covered with piped water supply.
Table 210 Details of Installations – Water Supply
S N Zone Name Treatment Plant Mains
1 Lashkar East Old Moti Jheel Treatment Plant 600 mm dia Transmiss ion
main
2 Lashkar West
Moti Jheel Treatment Plants & Tubewel ls
600 mm dia Transmiss ion main
3 Gwal ior Moti Jheel Treatment Plants, Tankers, Handpumps
750 mm & 457 mm CI pipes
4 Morar New Moti Jheel Treatment Plant & Tubewel ls
500 mm dia CI pipes
Source: Project UDAY Report on Water Supply, 2006
Water Supply Connections: There are 1.45 Lakhs households in the city (Source: Census of India, 2001). There are only 88,235 domestic connections which account for only 61% of the total coverage. 659 are non domestic connections, 345 Industrial, 25 Bulk Connections and 127 are other types of connections.
Analysis of Service level: Production of water supply from all sources in Gwalior is an average of 145 MLD. The current estimated population of Gwalior is about 10 Lakhs (2009), the per capita supply of 144 litres per day is estimated under the supply system. Thus compared to the prevalent national standards (135 lpcd) and assessing the water supply systems in most of the large urban cities including metros, water supply system of Gwalior in 2001 and at presently can be termed satisfactory.
These figures however, represent only the production from all sources. Actual quantity reaching the consumers is lower due to high Unaccounted for Water (UFFW). Assessment of UFW and reduction showed that UFWW was as high as 45% on account of various reasons like water theft, leakage, poor pipe fixtures etc. Due to water loss the water pressure at higher locations in the city is affected e.g. Gausspura no.1, Guddi, areas around Gwalior Fort and Abukhana. This indicates that out of 144 MLD of water supply, the actual quantity reaching the consumer is only about 799 MLD. In per capita terms, availability at the consumer end is only 79 LPCD. This perhaps is the major cause why the general population feels that supply is inadequate against the requirement.
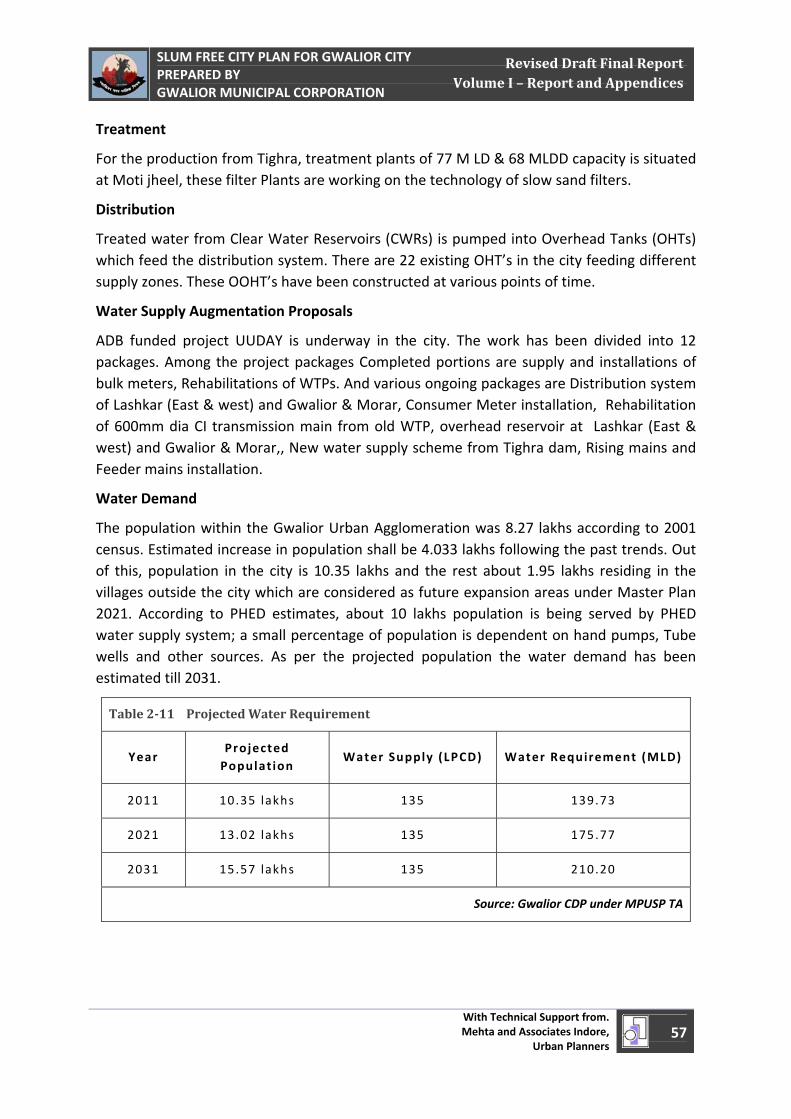
April 1, 2011
SLUM FREE CITY PLAN FOR GWALIOR CITY PREPARED BY GWALIOR MUNICIPAL CORPORATION
With Technical Support from. Mehta and Associates Indore,
Urban Planners 57
Revised Draft Final Report Volume I – Report and Appendices
Treatment
For the production from Tighra, treatment plants of 77 M LD & 68 MLDD capacity is situated at Moti jheel, these filter Plants are working on the technology of slow sand filters.
Distribution
Treated water from Clear Water Reservoirs (CWRs) is pumped into Overhead Tanks (OHTs) which feed the distribution system. There are 22 existing OHT’s in the city feeding different supply zones. These OOHT’s have been constructed at various points of time.
Water Supply Augmentation Proposals
ADB funded project UUDAY is underway in the city. The work has been divided into 12 packages. Among the project packages Completed portions are supply and installations of bulk meters, Rehabilitations of WTPs. And various ongoing packages are Distribution system of Lashkar (East & west) and Gwalior & Morar, Consumer Meter installation, Rehabilitation of 600mm dia CI transmission main from old WTP, overhead reservoir at Lashkar (East & west) and Gwalior & Morar,, New water supply scheme from Tighra dam, Rising mains and Feeder mains installation.
Water Demand
The population within the Gwalior Urban Agglomeration was 8.27 lakhs according to 2001 census. Estimated increase in population shall be 4.033 lakhs following the past trends. Out of this, population in the city is 10.35 lakhs and the rest about 1.95 lakhs residing in the villages outside the city which are considered as future expansion areas under Master Plan 2021. According to PHED estimates, about 10 lakhs population is being served by PHED water supply system; a small percentage of population is dependent on hand pumps, Tube wells and other sources. As per the projected population the water demand has been estimated till 2031.
Table 211 Projected Water Requirement
Year Projected Populat ion
Water Supply (LPCD) Water Requirement (MLD)
2011 10.35 lakhs 135 139.73
2021 13.02 lakhs 135 175.77
2031 15.57 lakhs 135 210.20
Source: Gwalior CDP under MPUSP TA
April 1, 2011
SLUM FREE CITY PLAN FOR GWALIOR CITY PREPARED BY GWALIOR MUNICIPAL CORPORATION
With Technical Support from. Mehta and Associates Indore,
Urban Planners 58
Revised Draft Final Report Volume I – Report and Appendices
2.7.2 Storm Water Drainage system
Existing Drainage System
Topography and natural drainage pattern of city is from south west to north east. Gwalior has three natural water channels which are the Swarnarekha River, Morar River and Jhinsy Nallah.
The site has well marked physiographic features which provide it with a strong sense of place and create discrete physical areas of varying shapes and sizes. The land forms offer opportunities for creating an interesting cityscape in an undulating landscape punctuated by moderate sized hills
The western boundary of the site is formed by the Gupteshwar and Hanuman hills. The Land features in the south which include hills and valleys are ideally suited for conservation. To the south also lies Cancer hill. This is reinforced by their designation as reserve forest land. There are several table top plateaus, which can provide visual nodes in the urbanscape.
The city land area is predominantly drained by the Swarnarekha and Morar River which flows from south to north. The Swarnarekha River runs toward the northeastern segment of the side and drains a smaller portion. The surface run off is mostly toward north and northeast. There are several ponds and agricultural tanks which are formed by construction of dams on the drainage channels. The area is not vulnerable to floods.
In addition there are number of nallahs which have their outfall into these natural water channels. These small water channels discharge runoff from the surrounding areas. Most of the drains are in the poor condition which requires desilting, channelisation and lining.
Drainage Network
The city lacks an efficient drainage system which is a major cause of flooding even during short spells of rainfall. The drainage condition survey conducted in the city indicates that the network in Gwalior is unorganized and scattered which leads to unchannelised flow during the rainy season. Major portions of these drains require desilting and repairs.
Approximately 88 nallahs (major and minor) are discharging into Swarnarekha River. In addition to this 300 small drains and nallahs are also present. According to reconnaissance survey all the drains are kutcha type and need desilting and lining. Only 300 Km of road length have drains hence new drains need to be constructed along the 482 kms of roads where drains are absent. (Source: PWD, Div.2, Gwalior)
At present GMC is responsible for operation and maintenance of drainage system in the city.
Runoff & Recharge Conditions: The monsoon season in the city lasts for approximately 3 to 4 months. Generally, the monsoon showers begin in the third week of June and last till September. The average annual rainfall is recorded around 700 mm.
Groundwater Recharge & Rainwater Harvesting: Long term water level declines as a result of injudicious exploitation of groundwater resource has lead to several vexing problems.
April 1, 2011
SLUM FREE CITY PLAN FOR GWALIOR CITY PREPARED BY GWALIOR MUNICIPAL CORPORATION
With Technical Support from. Mehta and Associates Indore,
Urban Planners 59
Revised Draft Final Report Volume I – Report and Appendices
Some of these problems are reduced well yields, low water level and leakage into the aquifer of highly mineralised water. In order to overcome these serious environmental implications the recharge potential of groundwater resource has to be given utmost importance. In Gwalior city, no importance has been given to ground water recharge during the last decade. As a result ground water is deteriorating at a very faster pace. It is very important for all upcoming new developments to have rain water harvesting measures. Even government can improve the urban environment by providing recharge wells at suitable locations.
Swarnarekha River – Condition Survey: With passage of time, population growth and unauthorized construction in the city resulted entry of sewage and siltation into Swarnrekha River. It has been polluted to such an extent that the river has turned into a nallahh. The stretch from Hanuman Bandh too Jalalpur pickup weir (133.65Km) passes through highly urbanized area. Several smaller tributaries meet and discharge into the river. Dumping of garbage and wastage on the bank has also contributed to the pollution.
River Nallah Improvement Works: Existing nallahs running through the city should be improved to increase the efficiency of natural channels. Improvement works shall consist of desilting of channel, development of banks, improvement of side slopes, and development of green belt around the nallahs and provision of culverts at road crossings.
Augmentation Projects underway in the city: Projects related to drainage that area underway in the city is Construction of two new secondary drains (50km each), renovation of existing primary and secondary drains.
2.7.3 Sewerage System
Sanitation has become a yardstick of socio–cultural development of the nation. Improved sanitation results in improvement of health, reduced child mortality /morbidity, improved water quality, environment and economic growth of a country. The major source of sewage is from Domestic, Commercial, Industrial and Institutional areas within the city. The sewage generated as per total water supply accounts to 116 MLD however as per actual water consumption of 80 MLD sewage generated accounts to about 64 MLD.
Sewerage Collection System
Sewerage system in Gwalior was laid back in the late 1920’s which covered core central areas of Gwalior. Since the network has been laid in various stages covering approximately 800 Km of total network. There are approximately 315 Km of trunk mains .
The sewerage system of Gwalior has been laid in various stages by PHED. At most of the places system has been laid in the late 1920s and 1985. Taking into consideration of the service life of 30 years of the water pipes, the network would require replacement. However, according to the discussions with various authorities, the system would require minor repairs only.
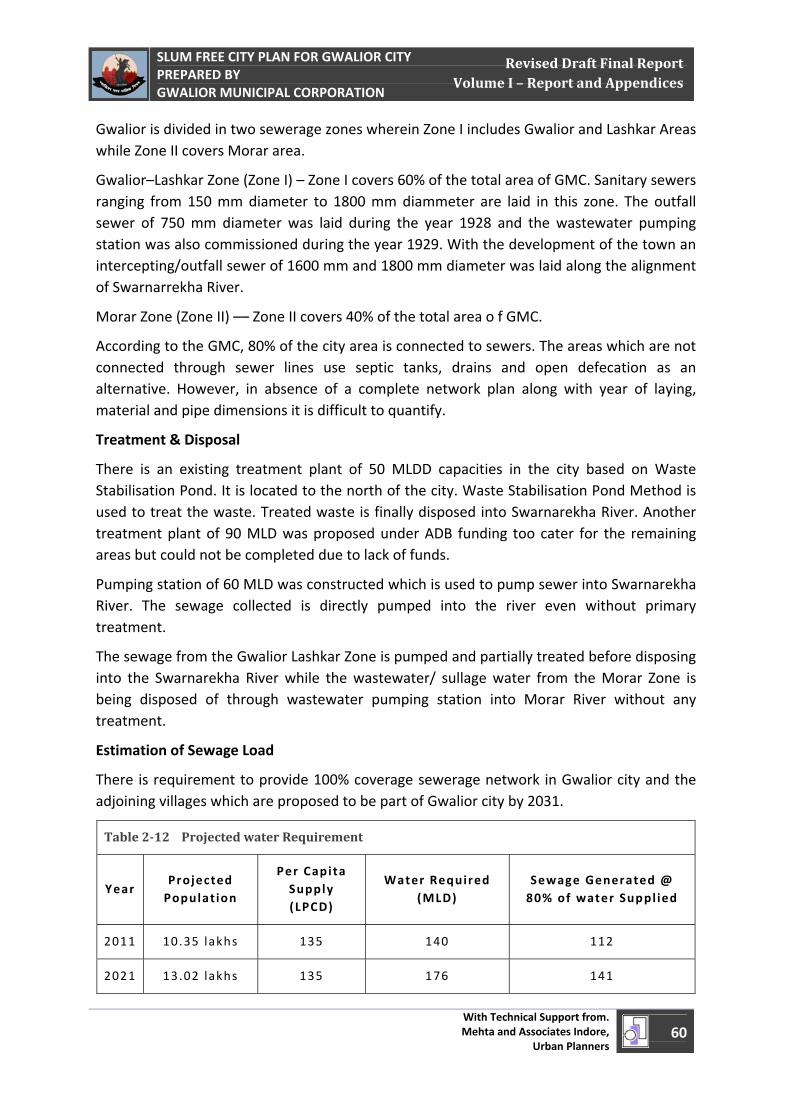
April 1, 2011
SLUM FREE CITY PLAN FOR GWALIOR CITY PREPARED BY GWALIOR MUNICIPAL CORPORATION
With Technical Support from. Mehta and Associates Indore,
Urban Planners 60
Revised Draft Final Report Volume I – Report and Appendices
Gwalior is divided in two sewerage zones wherein Zone I includes Gwalior and Lashkar Areas while Zone II covers Morar area.
Gwalior–Lashkar Zone (Zone I) – Zone I covers 60% of the total area of GMC. Sanitary sewers ranging from 150 mm diameter to 1800 mm diammeter are laid in this zone. The outfall sewer of 750 mm diameter was laid during the year 1928 and the wastewater pumping station was also commissioned during the year 1929. With the development of the town an intercepting/outfall sewer of 1600 mm and 1800 mm diameter was laid along the alignment of Swarnarrekha River.
Morar Zone (Zone II) –– Zone II covers 40% of the total area o f GMC.
According to the GMC, 80% of the city area is connected to sewers. The areas which are not connected through sewer lines use septic tanks, drains and open defecation as an alternative. However, in absence of a complete network plan along with year of laying, material and pipe dimensions it is difficult to quantify.
Treatment & Disposal
There is an existing treatment plant of 50 MLDD capacities in the city based on Waste Stabilisation Pond. It is located to the north of the city. Waste Stabilisation Pond Method is used to treat the waste. Treated waste is finally disposed into Swarnarekha River. Another treatment plant of 90 MLD was proposed under ADB funding too cater for the remaining areas but could not be completed due to lack of funds.
Pumping station of 60 MLD was constructed which is used to pump sewer into Swarnarekha River. The sewage collected is directly pumped into the river even without primary treatment.
The sewage from the Gwalior Lashkar Zone is pumped and partially treated before disposing into the Swarnarekha River while the wastewater/ sullage water from the Morar Zone is being disposed of through wastewater pumping station into Morar River without any treatment.
Estimation of Sewage Load
There is requirement to provide 100% coverage sewerage network in Gwalior city and the adjoining villages which are proposed to be part of Gwalior city by 2031.
Table 212 Projected water Requirement
Year Projected Populat ion
Per Capita Supply (LPCD)
Water Required (MLD)
Sewage Generated @ 80% of water Suppl ied
2011 10.35 lakhs 135 140 112
2021 13.02 lakhs 135 176 141
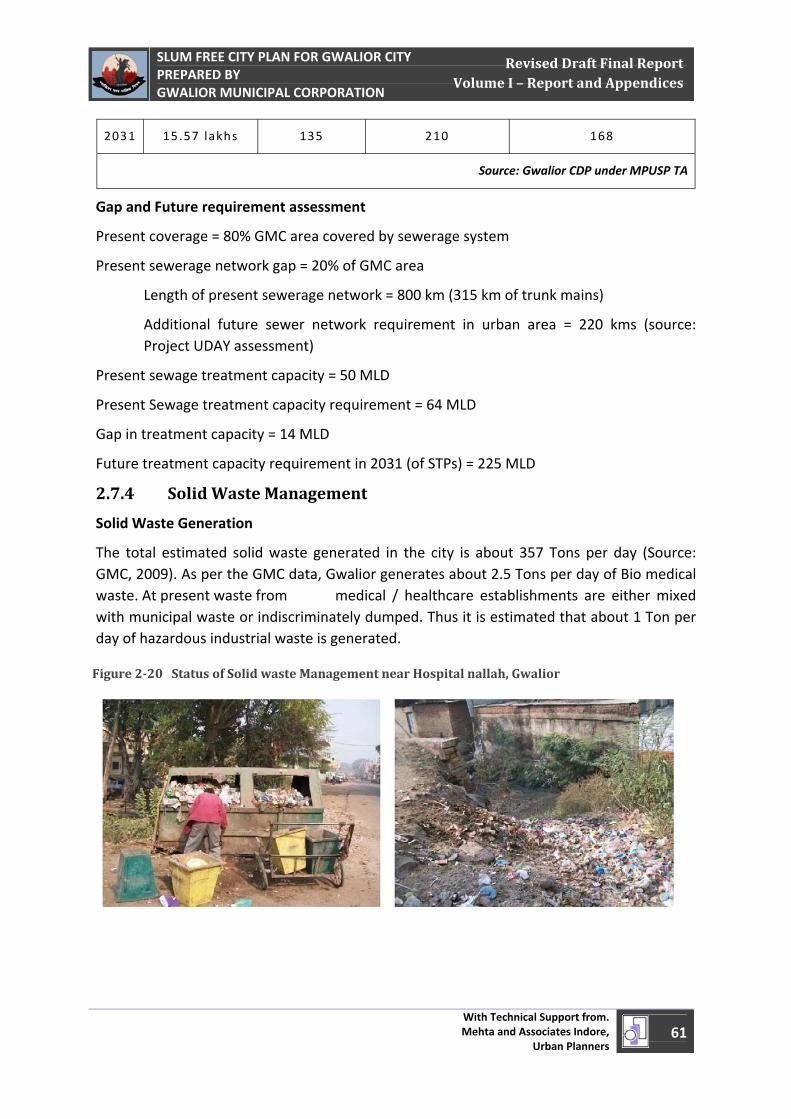
April 1, 2011
SLUM FREE CITY PLAN FOR GWALIOR CITY PREPARED BY GWALIOR MUNICIPAL CORPORATION
With Technical Support from. Mehta and Associates Indore,
Urban Planners 61
Revised Draft Final Report Volume I – Report and Appendices
2031 15.57 lakhs 135 210 168
Source: Gwalior CDP under MPUSP TA
Gap and Future requirement assessment
Present coverage = 80% GMC area covered by sewerage system
Present sewerage network gap = 20% of GMC area
Length of present sewerage network = 800 km (315 km of trunk mains)
Additional future sewer network requirement in urban area = 220 kms (source: Project UDAY assessment)
Present sewage treatment capacity = 50 MLD
Present Sewage treatment capacity requirement = 64 MLD
Gap in treatment capacity = 14 MLD
Future treatment capacity requirement in 2031 (of STPs) = 225 MLD
2.7.4 Solid Waste Management
Solid Waste Generation
The total estimated solid waste generated in the city is about 357 Tons per day (Source: GMC, 2009). As per the GMC data, Gwalior generates about 2.5 Tons per day of Bio medical waste. At present waste from medical / healthcare establishments are either mixed with municipal waste or indiscriminately dumped. Thus it is estimated that about 1 Ton per day of hazardous industrial waste is generated.
Figure 220 Status of Solid waste Management near Hospital nallah, Gwalior
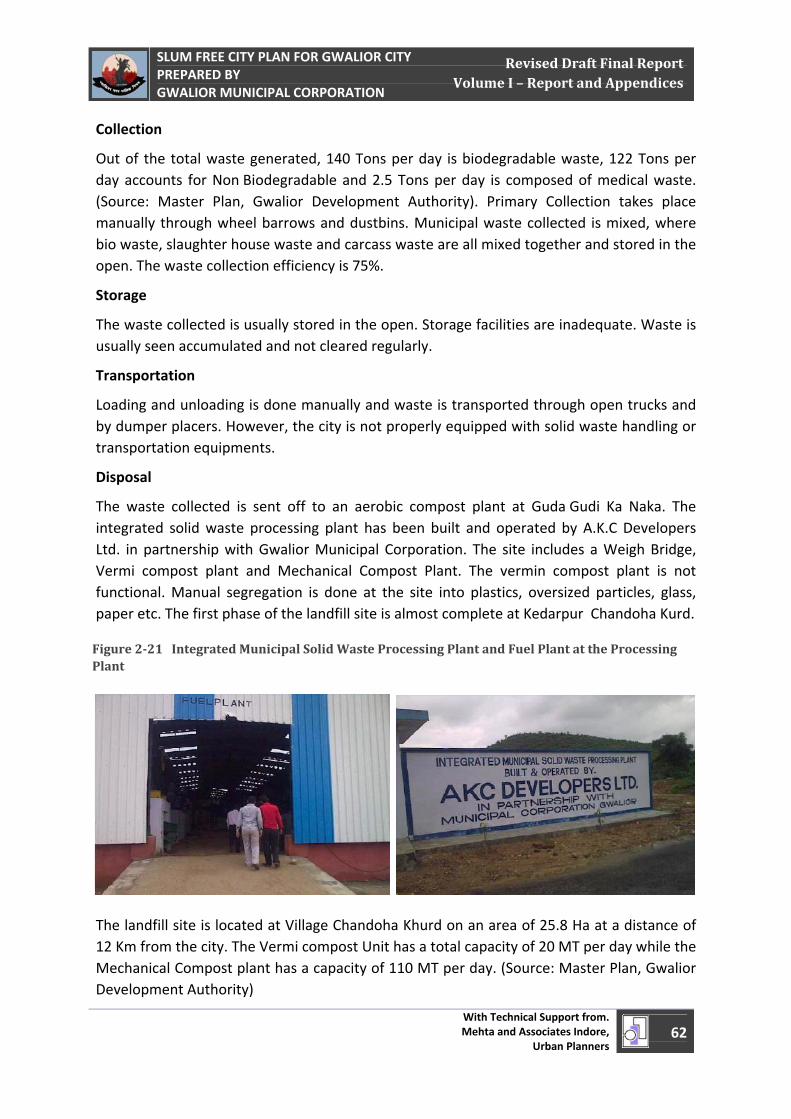
April 1, 2011
SLUM FREE CITY PLAN FOR GWALIOR CITY PREPARED BY GWALIOR MUNICIPAL CORPORATION
With Technical Support from. Mehta and Associates Indore,
Urban Planners 62
Revised Draft Final Report Volume I – Report and Appendices
Collection
Out of the total waste generated, 140 Tons per day is biodegradable waste, 122 Tons per day accounts for Non Biodegradable and 2.5 Tons per day is composed of medical waste. (Source: Master Plan, Gwalior Development Authority). Primary Collection takes place manually through wheel barrows and dustbins. Municipal waste collected is mixed, where bio waste, slaughter house waste and carcass waste are all mixed together and stored in the open. The waste collection efficiency is 75%.
Storage
The waste collected is usually stored in the open. Storage facilities are inadequate. Waste is usually seen accumulated and not cleared regularly.
Transportation
Loading and unloading is done manually and waste is transported through open trucks and by dumper placers. However, the city is not properly equipped with solid waste handling or transportation equipments.
Disposal
The waste collected is sent off to an aerobic compost plant at Guda Gudi Ka Naka. The integrated solid waste processing plant has been built and operated by A.K.C Developers Ltd. in partnership with Gwalior Municipal Corporation. The site includes a Weigh Bridge, Vermi compost plant and Mechanical Compost Plant. The vermin compost plant is not functional. Manual segregation is done at the site into plastics, oversized particles, glass, paper etc. The first phase of the landfill site is almost complete at Kedarpur Chandoha Kurd.
Figure 221 Integrated Municipal Solid Waste Processing Plant and Fuel Plant at the Processing Plant
The landfill site is located at Village Chandoha Khurd on an area of 25.8 Ha at a distance of 12 Km from the city. The Vermi compost Unit has a total capacity of 20 MT per day while the Mechanical Compost plant has a capacity of 110 MT per day. (Source: Master Plan, Gwalior Development Authority)
April 1, 2011
SLUM FREE CITY PLAN FOR GWALIOR CITY PREPARED BY GWALIOR MUNICIPAL CORPORATION
With Technical Support from. Mehta and Associates Indore,
Urban Planners 63
Revised Draft Final Report Volume I – Report and Appendices
Practice Adopted for Solid Waste Management
The Solid Waste Management practices highlighted below was being practiced in the Gwalior Municipal Corporation area however it lasted only for a year. The same system should be continued thus the same system of management has been proposed for the city with improvements in the in earlier system.
Primary and secondary collection
Daily door to door collection from houses, hotels and restaurants, all commercial establishments, institutions, offices etc in the area covered within the Gwalior Municipal Corporation.
Collection of waste from bins existed at different places in the service area.
Operating and maintaining a separate collection mechanism for bio‐degradable waste from restaurants, hotels, bulk producers, vegetable and fruit markets, garden waste, dung, dairies and tree branches etc.
Operating and maintaining a separate collection mechanism for slaughter houses, meat and fish markets.
Pre Operating and maintaining of transportation
Operating and maintaining a transportation system including equipments and vehicles for Municipal Solid Waste collected from door steps of houses, institutions, offices, hotels, restaurants and commercial establishments to the transfer stations /designated place near landfill site/disposal ground in a segregated mannner.
Maintaining hygienic conditions in and around containers and spraying of disinfectants at the time of lifting the containers.
Transportation
Municipal waste in covered containers/vehicles with colour coding as defined in Municipal Solid Waste (Management and Handling) Rules, 2000 for bio degradable and non biodegradable waste.
Safe transportation of the collected Municipal Solid Waste to the designated place near landfill site/disposal ground.
Transportation of road waste resulted from road sweeping and drain silt separately to the designated place near landfill site or disposal ground.
Transportation of inert waste to the designated place near landfill site or disposal ground.
Operating and maintaining a separate transportation mechanism for biodegradable/compostable waste from dairies, restaurants and vegetable & fruit markets and from other generators of biodegradable waste.
April 1, 2011
SLUM FREE CITY PLAN FOR GWALIOR CITY PREPARED BY GWALIOR MUNICIPAL CORPORATION
With Technical Support from. Mehta and Associates Indore,
Urban Planners 64
Revised Draft Final Report Volume I – Report and Appendices
Operating and maintaining a separate transportation mechanism for non biodegradable waste from different generators.
Segregation
Segregation of Municipal Solid Waste into recyclable, biodegradable/compost able and inert waste at source, transfer stations and designated place near landfill site/disposal ground.
Apart from the above, procurement / arrangement of equipments, vehicles and other accessories for collection, storage and transportation of municipal solid waste has also been done including their maintenance. GMC has provided new handcarts with 4 bins for door to door collection and tricycles, vehicles/bins etc. for transportation as well as storage of waste. Metal sheet, baskets, long – handled brush/ bamboo brooms etc are also procured and carried out regular repairing and maintenance of transport vehicles/carriers/containers/ handcarts etc.
Gaps and future requirement assessment
Total waste generated from urban area = 357 Tonne/day
Waste collected and disposed = 267 Tonne/day
Gap = 90 Tonne/day waste is not collected properly
GMC has already constructed Sanitary Landfill Site and Vermi Compost Site for solid waste disposal and treatment to meet the requirements for solid waste treatment till 2031. However, the solid waste collection and transportation vehicles and equipments of GMC are old and worn out which needs to be replaced.
2.7.5 Urban Transport
Old Gwalior city developed all around the foot hills of Gwalior Fort. New localities emerged towards South, South East, East and South West directions of the Gwalior Fort. Expansion of new localities was guided by the presence of major roads and natural features like forests and dispersed hillocks. Ribbon Development can be seen along NH 3 and Bhind Road. Most of the localities have rectangular road pattern in the city unlike old city areas of Lashkar e.g. Maharaj Bada, Shinde Ki Chawni, Lohia Bazaar, Dal Bazaar, Sharafa Bazaar, Falka Bazaar etc. There have been commendable efforts till now to improve traffic mobility and road network in the city by GMC, PWD and GDA in their respective jurisdiction areas. Primary concern in this sector is improvement of traffic mobility, road condition, public transport, decongestion and enhancement of traffic management efficiency etc.
April 1, 2011
SLUM FREE CITY PLAN FOR GWALIOR CITY PREPARED BY GWALIOR MUNICIPAL CORPORATION
With Technical Support from. Mehta and Associates Indore,
Urban Planners 65
Revised Draft Final Report Volume I – Report and Appendices
2.8 Urban Development & Governance Framework and Regulations
2.8.1 Overview
At the state Level the Department of Housing and Environment (DoHE) and Department of Urban Administration and Development Department (DoUAD) GoMP are the two government departments involved in the issues related to Urban Planning, Development and Governance. The DoHE deals with Urban Planning and Development while the DoUAD deals with Urban Administration and Development (Governance). It has been observed that there is overlapping of functions related to urban areas between these two Departments of Government of Madhya Pradesh.
Under the DoHE the Directorate of Town and Country Planning (T&CP), Gwalior Development Authority (GDA) Madhya Pradesh Housing Board (MPHB), Madhya Pradesh Pollution Control Board (MPPCB), Environmental Planning and Coordination Organization (EPCO) work in various sectors in respect of Urban Development and Planning. Under the DoUAD the Directorate of Urban Administration and Development (DUAD), acts as a nodal agency to guide and direct Gwalior Municipal Corporation in the matters related to Urban Administration and Development and also runs projects such as Madhya Pradesh Urban Services for Poor (MPUSP – Project Utthaan) and Urban Water Supply and Environment Improvement Project (UWSEIP – Project UDAY). Furthermore DoUAD also runs some Urban Development programmes through District Urban Development Authority (DUDA)
The interventions in the Planning and Development in Gwalior are under the statutory provisions of the Madhya Pradesh Nagar tatha Gram Nivesh Adhiniyam 1973 and rules formulated there under while the interventions in the Urban Governance and Development in Gwalior are under the statutory provisions of the Madhya Pradesh Nagar Palika Nigam Adhiniyam 1956 and rules formulated there under. The Directorate of Town and Country Planning Bhopal is the Nodal Agency for Town and Country Planning in the State acting through Office of Join Director Town and Country Planning Gwalior. Under the same legislation Gwalior Development Authority has been established to implement the provisions of Statutory Development Plans in Gwalior. Gwalior Municipal Corporation is Local Government empowered by Madhya Pradesh Nagar Palika Nigam Adhiniyam 1956 and rules there under for Urban Governance. Further the Madhya Pradesh Nagar Palika Nigam Adhiniyam 1956 and rules there under such as Madhya Pradesh Municipal Corporations (registration of colonizer, terms and conditions) Rules – 1998 etc. also have bearing on Urban Development in Gwalior. The Madhya Pradesh State Housing Policy 2007 provides guidelines for Housing related matters in the Urban Planning, Development and Governance.
April 1, 2011
SLUM FREE CITY PLAN FOR GWALIOR CITY PREPARED BY GWALIOR MUNICIPAL CORPORATION
With Technical Support from. Mehta and Associates Indore,
Urban Planners 66
Revised Draft Final Report Volume I – Report and Appendices
2.8.2 Institutions and Organizations
Gwalior is managed and governed by a number of institutions and agencies. This chapter lists the various agencies involved in urban governance and an assessment of the functions of Gwalior Municipal Corporation (GMC) and Gwalior Development Authority (GDA) as well as lists the reforms adopted till date to strengthen the governance mechanism.
Gwalior Municipal Corporation (GMC)
Gwalior Municipal Corporation came into existence in 1887. It was established by the Council of Regency which was responsible for administration of the Gwalior Estate. The main purpose of this establishment was to facilitate the citizens by addressing their problems through the mechanism of local administration.
Post Independence, Gwalior Municipal Corporation was established under the Madhya Pradesh Municipal Corporation Act, 1956 during which the corporation’s jurisdiction extended over an area of 46.62 Sq. km or 4,662 Ha. GMC was divided into 334 blocks and was governed by 40 elected members and 10 members of Central India Municipal Corporation. In 1969 the area further increased to 289 Sq. km, the current area of the GMC which is divided into 21 Zones and 60 wards.
Directorate of Town and Country Planning Bhopal
Directorate of Town and Country Planning (Directorate of T&CP) Bhopal is a State level Authority established under the provisions of and with powers, responsibilities and obligation under the Madhya Pradesh Nagar tathaa Gram Nivesh Adhiniyam 1973. Directorate Functions under the directions of the Department of Housing and Environment GoMP. Directorate of T&CP acts through Office of Joint Director T&CP Gwalior for the District of Gwalior and other attached Districts. The Primary function of T&CP is Formulation of Regional/Development Plans with Zoning and Sub‐division Regulations, Development Controls and Building Bye‐laws and enforcing the Sub‐division Regulations and Development Controls by issuing layout permissions as per the provisions of GDP‐2005 and the Madhya Pradesh Bhumi Vikas Rules 1984.
Gwalior Development Authority (GDA)
The major function of the GDA is to develop the Planning area through notified schemes. In these notified schemes, GDA is responsible for housing and infrastructure development. Once these colonies are developed it is handed over to GMC for operation and maintenance.
Gwalior Development Authority was established and incorporated in 05th October 1979 with an aim of well planned and balanced development of Gwalior City. The authority is structured under the town and country planning act 1973 of MP State Govt. and it works under the administration of Housing and Environment Department of MP Govt.
April 1, 2011
SLUM FREE CITY PLAN FOR GWALIOR CITY PREPARED BY GWALIOR MUNICIPAL CORPORATION
With Technical Support from. Mehta and Associates Indore,
Urban Planners 67
Revised Draft Final Report Volume I – Report and Appendices
District Administration
District Administration is most crucial Organization in the Purview of Urban Planning and Development in Gwalior. The Sections in the District Administration such as Diversion Section, Land Records, District Planning Committee, Nazul, Land Acquisition, District Urban Development Agency etc.
Madhya Pradesh Housing Board (MPHB)
Madhya Pradesh Housing Board (MPHB) is established under the provisions of and with powers, responsibilities and obligation under the Madhya Pradesh Griha Nirman Mandal Adhiniyam, 1972. MPHB Functions under the directions of the Department of Housing and Environment GoMP. MPHB acts through Office of Additional Housing Commissioner MPHB Division Gwalior for the District of Gwalior and other attached Districts. The Primary function of MPHB is Housing Supply to all sections of the Society by taking up Housing Schemes under the Provisions of the Madhya Pradesh Griha Nirman Mandal Adhiniyam, 1972. MPHB doesn’t have any Regulatory or Enforcement Powers under any Legislation.
Madhya Pradesh Audyogik Kendra Vikas Nigam (Gwalior) Limited (MPAKVN)
Madhya Pradesh Audyogik Kendra Vikas Nigam Gwalior Limited (MPAKVN Gwalior) is a subsidiary Public Limited Company of Madhya Pradesh State Industrial Development Corporation (MPSEDC) established under the provisions of The Indian Companies Act 1956. MPAKVN Gwalior Functions under the directions of the MPSEDC and Department of Commerce, Industries and Employment (DoCIE) Government of Madhya Pradesh. MPAKVN Gwalior acts through its Managing Director. The Primary functions of MPAKVN Development of Industrial Growth Centres and their Operation and Maintenance.
Madhya Pradesh Public Works Department (MPPWD)
Madhya Pradesh Public Works Department (MPPWD) is Department of Government of Madhya Pradesh. MPPWD acts through Office of Chief Engineer MPPED Gwalior Circle for the District of Gwalior and other attached Districts. The Primary function of MPPWD is Constructions of State Highways, Surrendered Sections of National Highways, Other District and Village Roads etc. and Operation and Maintenance of Government Buildings under their Control. MPPWD is mainly an Execution/Implementation Agency which further has its subsidiaries such as Madhya Pradesh Road Development Corporation, Madhya Pradesh Rural Road Development Corporation, and Madhya Pradesh Bridge Development Corporation.
Madhya Pradesh Public Health Engineering Department (MPPHED)
Madhya Pradesh Public Health Engineering Department (MPPHED) is Department of Government of Madhya Pradesh. MPPPHED acts through Office of Chief Engineer MPPHED Gwalior Circle for the Division of Gwalior. The Primary function of MPPHED is taking up Water Supply, Sewerage, Sanitation and Environment Improvement Projects for Urban and Rural Areas and Operation and Maintenance of such systems under their Control. Though
April 1, 2011
SLUM FREE CITY PLAN FOR GWALIOR CITY PREPARED BY GWALIOR MUNICIPAL CORPORATION
With Technical Support from. Mehta and Associates Indore,
Urban Planners 68
Revised Draft Final Report Volume I – Report and Appendices
MPPHED is an Execution/Implementation Agency; its role in the Larger Cities like Gwalior is limited to advisory and Technical Support Agency. MPPHED has deputed its staff to Municipal Corporations and other Local Bodies to help develop, operate and maintain the Water Supply, Sewerage, Sanitation, and Environment Improvement Projects by Municipal Corporations and other Local Bodies.
Madhya Pradesh Pollution Control Board (MPPCB)
Madhya Pradesh Pollution Control Board (MPHB) is established under the provisions of and with powers, responsibilities and obligation under the Water (Prevention & Control of Pollution) Act, 1974. MPHB Functions under the directions of the Department of Housing and Environment GoMP. MPPCB acts through Regional Office Gwalior for the District of Gwalior and other attached Districts. The Primary function of MPPCB is Implementation of various provisions of the Various Acts such as Water (Prevention & Control of Pollution) Act, 1974, Water (Prevention & Control of Pollution) Cess Act, 1977, Air (Prevention & Control of Pollution) Act, 1981, Environment Protection Act ,1986 (certain sections) etc.
Other Departments and Organizations
Apart from above mentioned Departments and Organizations there are many other organizations which have bearing on the issues related to Urban Planning, Development and Governance. They are
Krishi Upaj Mandi Samiti (KUMS) constituted by Madhya Pradesh State Agricultural Marketing Board (MPSANB) under the Provisions of and with the responsibility under Madhya Pradesh Krishi Upaj Mandi Adhiniyam 1972
District Trade and Industries Centre (DTIC) which is a District Office of Department of Commerce, Industries and Employment (DoCIE) GoMP
Department of Health, Government of Madhya Pradesh
Department of Education, Government of Madhya Pradesh
Madhya Pradesh State Electricity Board,
Regional Transport Authority,
Fire Department,
Madhya Pradesh Police and
Traffic Department
2.8.3 Urban Planning, Development and Governance Legislations
There are many Urban Planning, Development and Governance related Legislations, which are in force in the State of Madhya Pradesh. The Most crucial Regulations related to Urban Planning, Development and Governance with specific Reference to Housing, Slums and Poverty Pockets are
April 1, 2011
SLUM FREE CITY PLAN FOR GWALIOR CITY PREPARED BY GWALIOR MUNICIPAL CORPORATION
With Technical Support from. Mehta and Associates Indore,
Urban Planners 69
Revised Draft Final Report Volume I – Report and Appendices
Madhya Pradesh Nagar tathaa Gram Nivesh Adhiniyam 1973 and rules framed there under are
o Madhya Pradesh Nagar tathaa Gram Nivesh Niyam 1975 – (Town Development)
o Madhya Pradesh Nagar tathaa Gram Nivesh Vikasit Bhumiyon, Grihon, Bhawanon, tathaa anya Sanrachanaon ka vyayan Niyam 1975 – (Disposal of Public Housing Stock)
o Madhya Pradesh Bhumi Vikas Rules 1984 – (Zoning Regulations, Subdivision Regulations, Building Bye Laws, Various Norms and Standards and Administrative Procedures and Rules for Urban Development)
o Gwalior Development Plan 2005 – (Land Use Control, Zoning Regulations, Subdivision Regulations, Building Bye Laws, Various Norms and Standards and Administrative Procedures and Rules for Urban Development)
Madhya Pradesh Nagar Palika Nigam Adhiniyam 1956 and rules there under are
o Madhya Pradesh Municipal Corporations (registration of colonizer, terms and conditions) Rules – 1998 – (Registration of Colonisers and Reservation of Land for EWS and LIG)
o And other Rules
Madhya Pradesh Zila Yojana Samiti Adhiniyam, 1995 and rules there under – (District Statistical and Budgetary Plans)
Madhya Pradesh Griha Nirman Mandal Adhiniyam, 1972 and rules there under – (Development, Supply and Disposal of Housing Stock)
Madhya Pradesh Gandi Basti kshetra (Sudhaar tathaa Nirmulan) Adhiniyam 1976 and rules there under are
o Madhya Pradesh Gandi Basti kshetra (Sudhaar tathaa Nirmulan) Rules 1978 – (Notification of Slums, Improvement, Upgradation and Rehabilitation of Slums)
o And other Rules
Madhya Pradesh Nagariya kshetron ke Bhumiheen vyakti (Pattadhriti Adhikaaron ka pradhan kiya jana) Adhiniyam 1984 and rules there under are
o Madhya Pradesh Nagariya kshetron ke Bhumiheen vyakti (Pattadhriti Adhikaaron ka pradhan kiya jana) Rules 1998 – (Provision of Security of Land Tenure to Slum Dwellers and Urban Poor)
o Madhya Pradesh Nagariya kshetron ke Bhumiheen vyakti (Pattadhriti Adhikaaron ka pradhan kiya jana) Rules 2008 – (Provision of Security of Land Tenure to Slum Dwellers and Urban Poor)

April 1, 2011
SLUM FREE CITY PLAN FOR GWALIOR CITY PREPARED BY GWALIOR MUNICIPAL CORPORATION
With Technical Support from. Mehta and Associates Indore,
Urban Planners 70
Revised Draft Final Report Volume I – Report and Appendices
Apart from this there is the Madhya Pradesh State Housing Policy 2007 provides Policy Guidelines for Housing and Habitat.
The Urban Planning and Development Regulation for Gwalior are governed by Gwalior Development Plan 2005 and Madhya Pradesh Municipal Corporations (registration of colonizer, terms and conditions) Rules – 1998.
2.9 Strengths and Weakness of Gwalior
2.9.1 Strengths of Gwalior
Connectivity and Strategic Location ‐ The strategic location of the city in the central India with excellent connection by Road to other parts of country is best suited as intermediate growth center and distribution hub. Further located in the influence of area of strategic transport corridor of India and Delhi‐ Mumbai freight corridor to its west and Ludhiana‐ kolkata dedicated freight corridor to the west further strengthen movement of cargo in the region.
Geology – Gwalior Lies in the geologically safe seismic zone.
Economic Base ‐ Gwalior can be seen as Industrial Growth center, Counter Magnet to NCR, Tourist place and Regional Commercial and Service Center. Economic Base of Gwalior is constituted of trade and commerce, small scale industries, tourism and until recently, textiles. Gwalior is reported growing as a service center, particularly for banking, finance and insurance services, technical services, transport and communication.
Educational Hub ‐ Gwalior has been successful in establishing itself as the education hub of India. It has Asia's largest physical education institute and two national institutes which are pioneers in their respective fields. In addition to this there are several colleges of national repute.
Urban Infrastructure Feasibility – Number of water sources are available, Ground water quality is good. Favourable natural slope for good drainage through Swarnarekha and Murar River. Vermi Compost site and Landfill site has already been developed by GMC
Land Availability – Land is available for development as the city has grown very less physically as planned.
2.9.2 Weakness of Gwalior
Low sex ratio – Gwalior has a low sex ratio of 870 female per 1000 males.
High Density in old City Area – High density of (150‐200 persons/ha) is causing congestion and pressure of existing infrastructure.
Single Commercial Centre – Single commercial centre Bada is over congested leading to traffic management problem.
April 1, 2011
SLUM FREE CITY PLAN FOR GWALIOR CITY PREPARED BY GWALIOR MUNICIPAL CORPORATION
With Technical Support from. Mehta and Associates Indore,
Urban Planners 71
Revised Draft Final Report Volume I – Report and Appendices
Urban Infrastructure – Low waste collection (75%) and lack of efficient disposal of hazardous waste, poor condition of existing roads.
WFPR‐ Gwalior has a very low workforce participation ratio which makes it with high dependency ratio.
Slums Squatters and Un‐authorised Development – a high percentage of the population lives in informal housing in the absence of basic services and unhygienic conditions.
Industries – Sick industries and closed industrial units shows a weak health of industries.
Inadequate Technical and Financial Capability of Local Authority – makes the Local Authorities weak in performing the functions and responsibilities delegated to them regarding Urban Planning, Development and Governance
Interdepartmental Co‐ordination and partial Decentralization of Functions – There are many functions regarding Urban Planning, Development and Governance which are performed by state level departments and corporations. Local authorities not been part of the actual decision making of those departments share only functional relation with them. There has been lack of Interdepartmental Co‐ordination which has hampered Urban Planning, Development and Governance.
Planning Framework – Absence of Tools for Implementation of Development Plans such as Zonal Plans has resulted in un‐coordinated Urban Development. Gwalior Development Authority having sole responsibility for the implementation of the Gwalior Development Plan is handicapped in many ways such as No enforcement and Regulatory Powers, Lesser Revenue Income Base etc.
April 1, 2011
SLUM FREE CITY PLAN FOR GWALIOR CITY PREPARED BY GWALIOR MUNICIPAL CORPORATION
With Technical Support from. Mehta and Associates Indore,
Urban Planners 72
Revised Draft Final Report Volume I – Report and Appendices
Housing and Urban Poverty– Chapter – 3 3
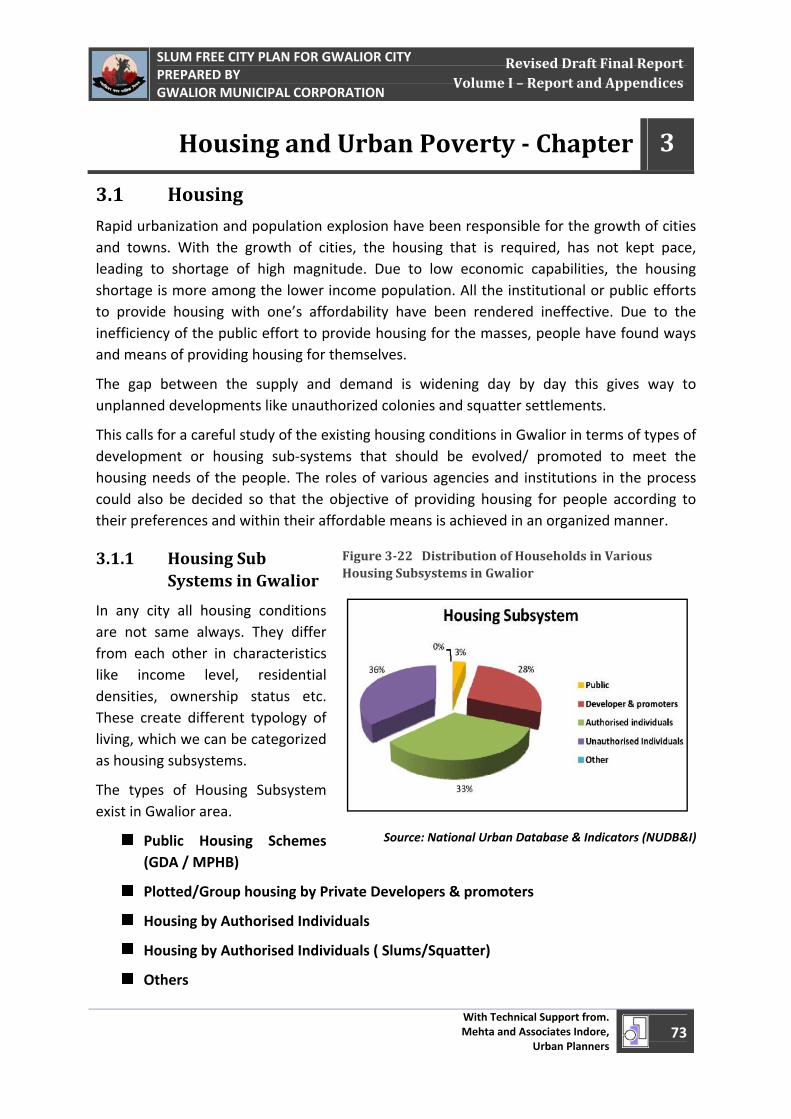
April 1, 2011
SLUM FREE CITY PLAN FOR GWALIOR CITY PREPARED BY GWALIOR MUNICIPAL CORPORATION
With Technical Support from. Mehta and Associates Indore,
Urban Planners 73
Revised Draft Final Report Volume I – Report and Appendices
3.1 Housing
Rapid urbanization and population explosion have been responsible for the growth of cities and towns. With the growth of cities, the housing that is required, has not kept pace, leading to shortage of high magnitude. Due to low economic capabilities, the housing shortage is more among the lower income population. All the institutional or public efforts to provide housing with one’s affordability have been rendered ineffective. Due to the inefficiency of the public effort to provide housing for the masses, people have found ways and means of providing housing for themselves.
The gap between the supply and demand is widening day by day this gives way to unplanned developments like unauthorized colonies and squatter settlements.
This calls for a careful study of the existing housing conditions in Gwalior in terms of types of development or housing sub‐systems that should be evolved/ promoted to meet the housing needs of the people. The roles of various agencies and institutions in the process could also be decided so that the objective of providing housing for people according to their preferences and within their affordable means is achieved in an organized manner.
3.1.1 Housing Sub Systems in Gwalior
In any city all housing conditions are not same always. They differ from each other in characteristics like income level, residential densities, ownership status etc. These create different typology of living, which we can be categorized as housing subsystems.
The types of Housing Subsystem exist in Gwalior area.
Public Housing Schemes (GDA / MPHB)
Plotted/Group housing by Private Developers & promoters
Housing by Authorised Individuals
Housing by Authorised Individuals ( Slums/Squatter)
Others
Housing and Urban Poverty Chapter 3
Figure 322 Distribution of Households in Various Housing Subsystems in Gwalior
Source: National Urban Database & Indicators (NUDB&I)
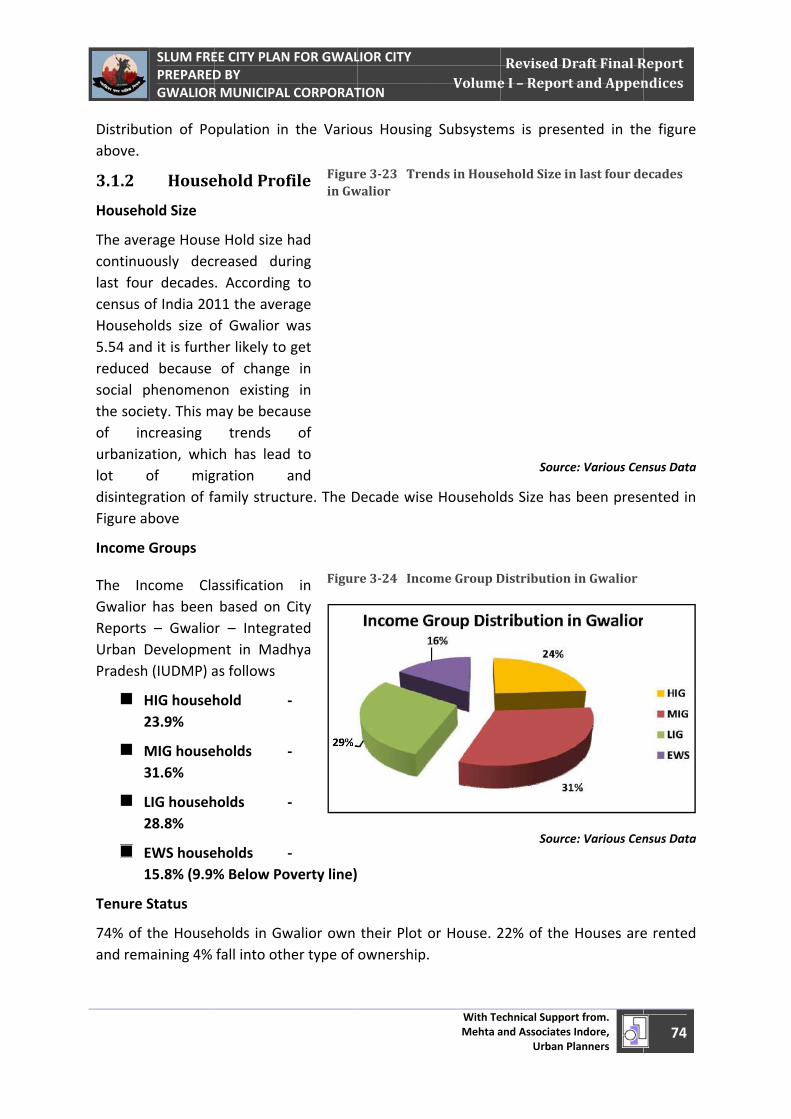
April 1, 2011
Distribuabove.
3.1.2 Househ
The avecontinulast foucensus Househ5.54 anreducedsocial the socof inurbanizlot disintegFigure a
Income
The InGwaliorReportsUrban Pradesh
Tenure
74% of and rem
SLUM FREPREPAREDGWALIOR
ution of Po
House
hold Size
erage Houseuously decur decadesof India 20holds size ond it is furthd because phenomenoiety. This mncreasing zation, whicof miggration of faabove
e Groups
ncome Clar has been s – GwalioDevelopmeh (IUDMP) a
HIG househ23.9%
MIG house31.6%
LIG househ28.8%
EWS house15.8% (9.9%
Status
the Housemaining 4%
EE CITY PLAND BY R MUNICIPAL
opulation in
ehold Pro
e Hold size reased du. According11 the averof Gwalior her likely toof change
on existingmay be beca
trends ch has leadgration amily struc
assification based on r – Integraent in Madas follows
hold
eholds
holds
eholds % Below Po
holds in Gwfall into oth
N FOR GWAL L CORPORAT
n the Vario
file
had ring g to rage was get e in g in ause
of d to and ture. The D
in City ated dhya
‐
‐
‐
‐ overty line)
walior own her type of
Figurin Gw
Figur
LIOR CITY TION
ous Housing
Decade wise
their Plot oownership.
re 323 Trenwalior
re 324 Inco
With TeMehta a
Volume
g Subsystem
e Household
or House. 2
nds in House
ome Group D
echnical Supporand Associates
Urban P
Revised De I – Report
ms is prese
ds Size has
22% of the
ehold Size in
Source
Distribution
Source
rt from. Indore,
Planners
raft Final Rt and Appen
ented in th
been prese
Houses are
n last four de
e: Various Cen
in Gwalior
e: Various Cen
74
Report ndices
e figure
ented in
e rented
ecades
nsus Data
nsus Data
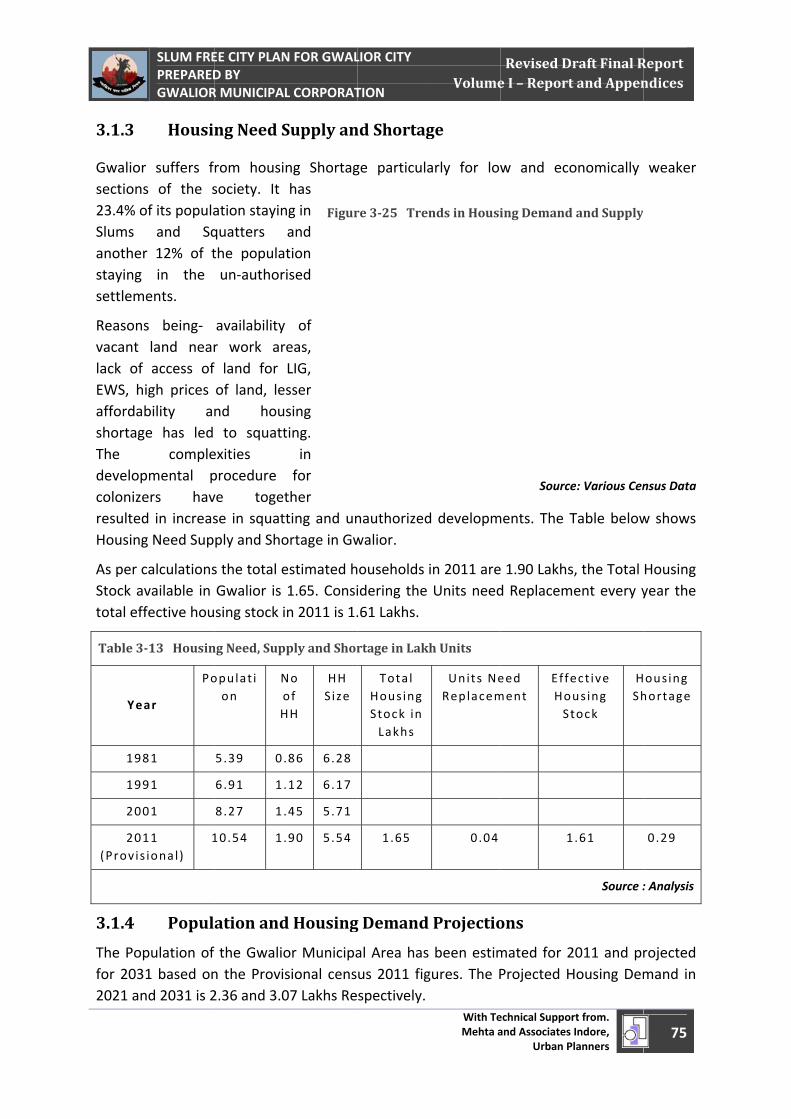
April 1, 2011
3.1.3
Gwaliorsection23.4% oSlums anothestaying settlem
Reasonvacant lack of EWS, haffordashortagThe developcolonizeresultedHousing
As per cStock atotal eff
Table 3
Ye
198
199
200
20(Provis
3.1.4 The Popfor 2032021 an
SLUM FREPREPAREDGWALIOR
Housin
r suffers fs of the sof its popula
and Sqr 12% of tin the
ments.
s being‐ land near
f access of igh prices bility ange has led
complepmental pers havd in increasg Need Sup
calculationsvailable in fective hou
13 Housin
ar
Po
81
91
01
11 s ional)
1
Popul
pulation of 31 based onnd 2031 is 2
EE CITY PLAND BY R MUNICIPAL
ng Need S
rom housinsociety. It ation stayinquatters the populatun‐author
availability r work arf land for of land, lesnd housto squatt
exities procedure ve togetse in squattply and Sho
s the total eGwalior is sing stock i
ng Need, Sup
opulat ion
NoH
5.39 0.
6.91 1.
8.27 1.
10.54 1.
ation and
the Gwalion the Provis2.36 and 3.0
N FOR GWAL L CORPORAT
Supply an
ng Shortaghas
ng in and tion ised
of eas, LIG, sser sing ting.
in for
ther ting and unortage in Gw
estimated h1.65. Consin 2011 is 1.
ply and Shor
No of HH
HH Size
86 6.28
12 6.17
45 5.71
90 5.54
d Housing
or Municipasional cens07 Lakhs Re
Figur
LIOR CITY TION
nd Shortag
ge particula
nauthorizedwalior.
ouseholds idering the .61 Lakhs.
rtage in Lakh
Total Housing Stock in Lakhs
1.65
g Demand
al Area hasus 2011 figspectively.
re 325 Tren
With TeMehta a
Volume
ge
arly for low
d developm
in 2011 areUnits need
h Units
Units NeReplacem
0.04
Projectio
been estimgures. The P
nds in Housi
echnical Supporand Associates
Urban P
Revised De I – Report
w and eco
ments. The T
e 1.90 Lakhsd Replacem
eed ment
EffeHoSt
1
ons
mated for 2Projected H
ing Demand
Source
rt from. Indore,
Planners
raft Final Rt and Appen
onomically
Table below
s, the Total ment every y
ect ive using tock
HSh
1.61
Source :
2011 and prHousing Dem
d and Supply
e: Various Cen
75
Report ndices
weaker
w shows
Housing year the
ousing hortage
0.29
: Analysis
rojected mand in
nsus Data
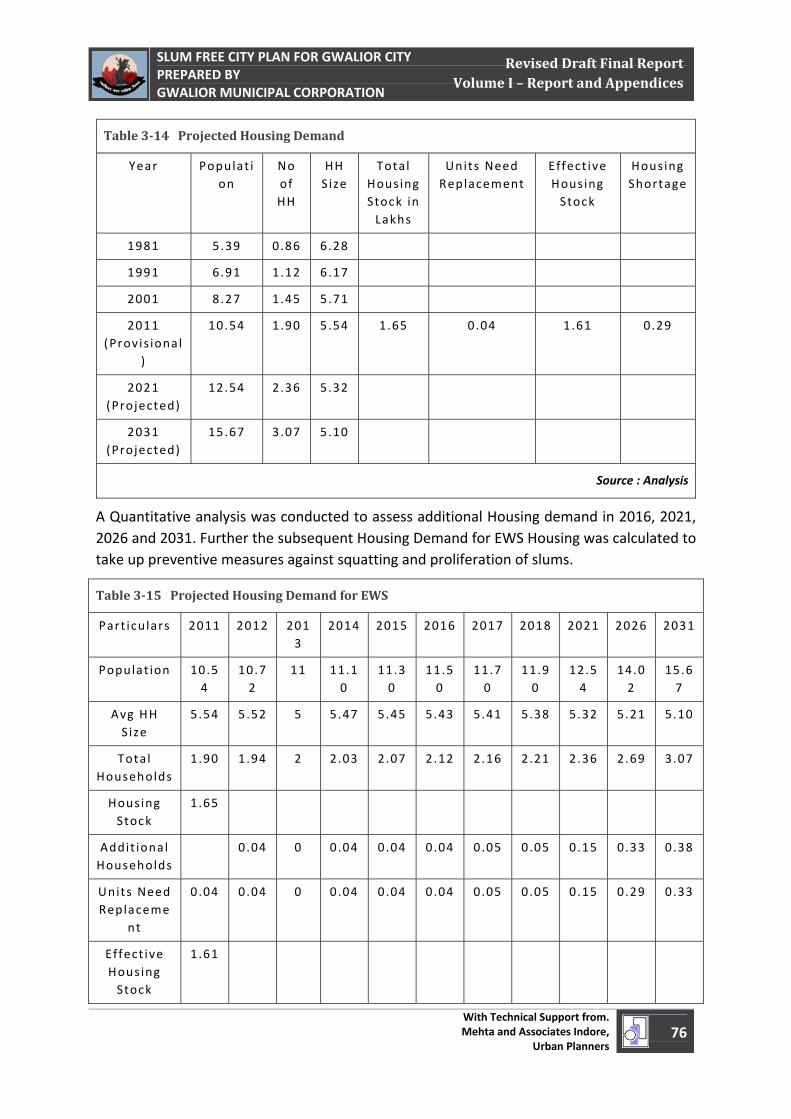
April 1, 2011
SLUM FREE CITY PLAN FOR GWALIOR CITY PREPARED BY GWALIOR MUNICIPAL CORPORATION
With Technical Support from. Mehta and Associates Indore,
Urban Planners 76
Revised Draft Final Report Volume I – Report and Appendices
Table 314 Projected Housing Demand
Year Populat ion
No of HH
HH Size
Total Housing Stock in Lakhs
Units Need Replacement
Effect ive Housing Stock
Housing Shortage
1981 5.39 0.86 6.28
1991 6.91 1.12 6.17
2001 8.27 1.45 5.71
2011 (Provis ional
)
10.54 1.90 5.54 1.65 0.04 1.61 0.29
2021 (Projected)
12.54 2.36 5.32
2031 (Projected)
15.67 3.07 5.10
Source : Analysis
A Quantitative analysis was conducted to assess additional Housing demand in 2016, 2021, 2026 and 2031. Further the subsequent Housing Demand for EWS Housing was calculated to take up preventive measures against squatting and proliferation of slums.
Table 315 Projected Housing Demand for EWS
Part iculars 2011 2012 2013
2014 2015 2016 2017 2018 2021 2026 2031
Populat ion 10.54
10.72
11 11.10
11.30
11.50
11.70
11.90
12.54
14.02
15.67
Avg HH Size
5.54 5.52 5 5.47 5.45 5.43 5.41 5.38 5.32 5.21 5.10
Total Households
1.90 1.94 2 2.03 2.07 2.12 2.16 2.21 2.36 2.69 3.07
Housing Stock
1.65
Addit ional Households
0.04 0 0.04 0.04 0.04 0.05 0.05 0.15 0.33 0.38
Units Need Replaceme
nt
0.04 0.04 0 0.04 0.04 0.04 0.05 0.05 0.15 0.29 0.33
Effect ive Housing Stock
1.61
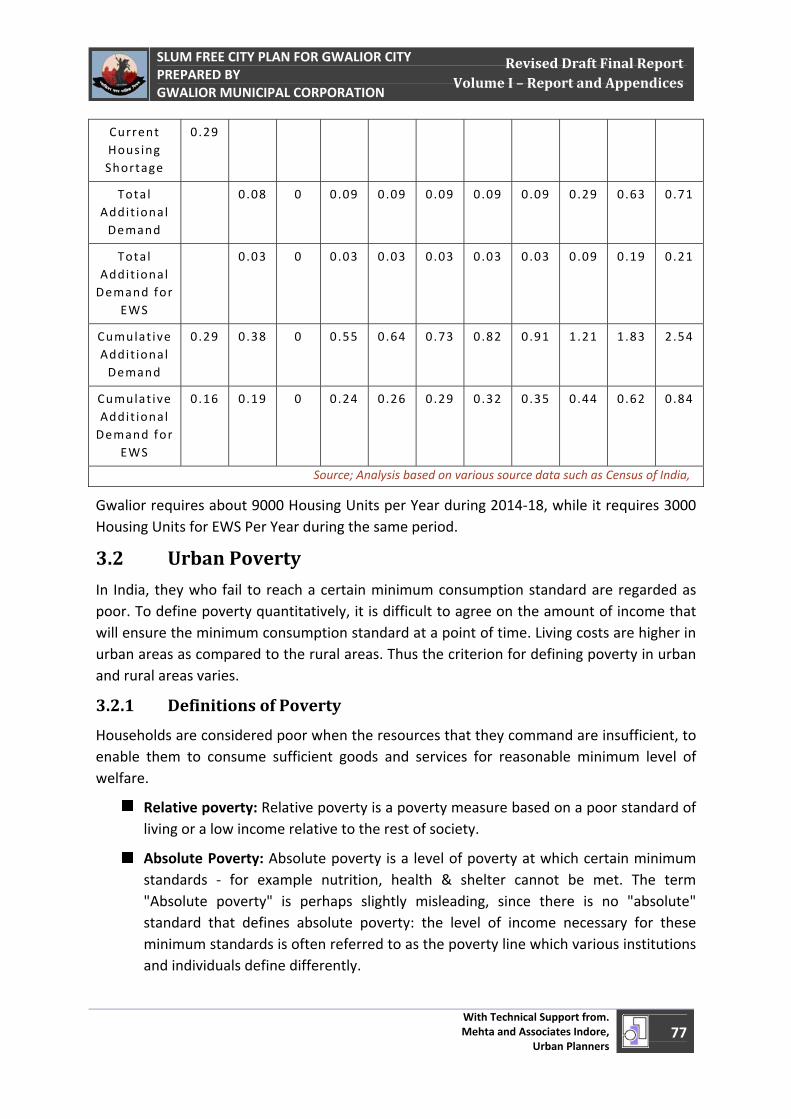
April 1, 2011
SLUM FREE CITY PLAN FOR GWALIOR CITY PREPARED BY GWALIOR MUNICIPAL CORPORATION
With Technical Support from. Mehta and Associates Indore,
Urban Planners 77
Revised Draft Final Report Volume I – Report and Appendices
Current Housing Shortage
0.29
Total Addit ional Demand
0.08 0 0.09 0.09 0.09 0.09 0.09 0.29 0.63 0.71
Total Addit ional Demand for
EWS
0.03 0 0.03 0.03 0.03 0.03 0.03 0.09 0.19 0.21
Cumulat ive Addit ional Demand
0.29 0.38 0 0.55 0.64 0.73 0.82 0.91 1.21 1.83 2.54
Cumulat ive Addit ional Demand for
EWS
0.16 0.19 0 0.24 0.26 0.29 0.32 0.35 0.44 0.62 0.84
Source; Analysis based on various source data such as Census of India,
Gwalior requires about 9000 Housing Units per Year during 2014‐18, while it requires 3000 Housing Units for EWS Per Year during the same period.
3.2 Urban Poverty
In India, they who fail to reach a certain minimum consumption standard are regarded as poor. To define poverty quantitatively, it is difficult to agree on the amount of income that will ensure the minimum consumption standard at a point of time. Living costs are higher in urban areas as compared to the rural areas. Thus the criterion for defining poverty in urban and rural areas varies.
3.2.1 Definitions of Poverty
Households are considered poor when the resources that they command are insufficient, to enable them to consume sufficient goods and services for reasonable minimum level of welfare.
Relative poverty: Relative poverty is a poverty measure based on a poor standard of living or a low income relative to the rest of society.
Absolute Poverty: Absolute poverty is a level of poverty at which certain minimum standards ‐ for example nutrition, health & shelter cannot be met. The term "Absolute poverty" is perhaps slightly misleading, since there is no "absolute" standard that defines absolute poverty: the level of income necessary for these minimum standards is often referred to as the poverty line which various institutions and individuals define differently.
April 1, 2011
SLUM FREE CITY PLAN FOR GWALIOR CITY PREPARED BY GWALIOR MUNICIPAL CORPORATION
With Technical Support from. Mehta and Associates Indore,
Urban Planners 78
Revised Draft Final Report Volume I – Report and Appendices
Housing Poverty: Individuals and households who lack safe, secure and healthy living environment with basic infrastructure such as piped water and adequate provision of sewerage, sanitation, drainage and removal of household waste.
The first concept of Poverty Line came in 1962. Poverty Line is not constant; it varies from country to country and time to time. Goods and Services i.e. consumption, whether purchased, gifts or self‐produced, is converted in monitory terms to define the Poverty Line. The nutritional intake requirement is considered as constant i.e. 2250 calories/day(avg.). The average median income in squatters is considered as Rs. 600/capita/month.
3.2.2 Urban Poverty in Gwalior
It is now widely understood that poverty is experienced through a variety of dimensions of which low income is only one. Further that within the poor, there are important differences in depths of poverty, the ability of poor households to graduate from poverty and the relative vulnerability of different groups to withstand risks to livelihood such as unemployment, sickness and eviction. Madhya Pradesh Government defines poverty line as Rs 365 per capita per month. A typology of three groups has been defined by the ADB as:
Transitional Poor ‐ those households, whose monthly per capita income is between the Poverty Line and 1.5 times the Poverty line, are likely to own productive assets and have access to basic services. They move in and out of poverty depending on particular and periodic circumstance.
Intermediate Poor ‐ those households whose income is between half the Poverty Line and the PL itself, and have limited access to basic services.
Core Poor ‐ those households whose income is less than half of the Poverty Line and who live in extreme poverty and vulnerability.
In Gwalior, 9.9% of total household were living below poverty line. 25.2% of households were in the transitional, intermediate and core poor income groups.
3.3 Slums and Squatters
Large percentage of population in any Indian city belongs to the lowest economic strata i.e. economically weaker section. Majority of this urban poor Population belongs to people who have migrated from the nearby rural areas in search of work and employment. The land holding of any family in the rural region is no longer able to support the entire family, due to the dwindling land resources and increase in the population. This encourages the exodus of rural population to the nearby city. Most poor immigrants to the city can find access to shelter only by squatting on public or private land. These squatters over the period of time continue to come and settle on this land thus creating a neighborhood, more generally called as a SLUM.
April 1, 2011
SLUM FREE CITY PLAN FOR GWALIOR CITY PREPARED BY GWALIOR MUNICIPAL CORPORATION
With Technical Support from. Mehta and Associates Indore,
Urban Planners 79
Revised Draft Final Report Volume I – Report and Appendices
These vital factors for creating harmonious symbiotic and self sustainable communities at optimal location are generally ignored and in fact in many cases no provision of habitat is made for such population in the planning of housing development. This deficiency in the formal planning leads to development of Slums and Squatter Settlements to assimilate such population. According to the estimates, 23.5% of Urban India lives below poverty line. Urban poor in live under acute unhygienic conditions in the urban slums.
The concept of slums and its definition vary from country to country depending upon the socioeconomic conditions of each society. The term slum (squatter) describes a wide range of low‐income settlements or poor living conditions. Slum (Squatter) at its simplest is a heavily populated area characterized by substandard housing. The squatter settlement often takes place along regional, linguistic, religious and caste affiliations of the migrants, although there are many settlements, which are more cosmopolitan in their composition. Inter‐household solidarity within a squatter settlement provides some measure of social security among the residents although dissensions and conflicts over trivial issues are very common. In situations of distress and challenges they exhibit tremendous degree of unity and resilience to work and live together.
Slums are generally neglected parts of cities where housing and living conditions are appallingly lacking. These range from high density, squalid central city tenements to spontaneous squatter settlements without legal recognition or rights, sprawling at the edge of cities. Some are more than many years old; some are land invasions just underway
1.7.1 Definition of Slums (Census, Slum Act and Dr. Pranab Sen Committee)
Slums Definition: 'Slums' have been defined under Section 3 of the Slums Areas (Improvement and Clearance) Act, 1976 as areas where buildings
o Are in any respect unfit for human habitation or
o Are by reason of dilapidation, overcrowding, faulty arrangement and design of such buildings, narrowness or faulty arrangement of streets, lack of ventilation, light, sanitation facilities or any combination of these factors which are detrimental to safety, health and morals.
Census of India 2001 has adopted the definition of 'Slum' areas as:
o All areas notified as 'Slum' by State/Local Govt. and UT Administration under any Act;
o All areas recognized as 'Slum' by State/Local Government and UT Administration, which have not been formally notified as slum under any Act;
o A compact area of at least 300 populations or about 60‐70 households of poorly built congested tenements, in unhygienic environment usually with
April 1, 2011
SLUM FREE CITY PLAN FOR GWALIOR CITY PREPARED BY GWALIOR MUNICIPAL CORPORATION
With Technical Support from. Mehta and Associates Indore,
Urban Planners 80
Revised Draft Final Report Volume I – Report and Appendices
inadequate infrastructure and lacking in proper sanitary and drinking water facilities.
Dr. Pranab Sen Committee define ‘Slum’ as:
o It has defined a slum as “a compact settlement of at least 20 households with a collection of poorly built tenements, mostly of temporary nature, crowded together usually with inadequate sanitary and drinking water facilities in unhygienic conditions”.
3.3.1 Slums in Gwalior
Provisional results from the 2001 census indicate that Gwalior had a slum population of 193,635 or 23.42% of the total population. This is lower compared with the national average of 21.25% but much higher than the state average of 15.16%. It may be mentioned that actual slum estimates depend much on how Municipalities have defined and notified informal settlements within their urban areas.
There are about 218 notified slum locations and 256 illegal colonies in Gwalior city with population of 478000, which is about 57.8 per cent of the city’s population.
3.3.2 Socioeconomic and Service Level Survey of Slums
To obtain the current scenario of urban poor a detailed socio‐economic and Service Level survey was conducted in all 243 notified slums of Gwalior under MPUSP Technical Assistance Programme under following components
Socio‐economic household survey (slum areas)
Survey of service levels in slums
Socio‐economic household survey of sample households in non‐slum areas.
The Sample survey format is presented in Appendix A. Close to 62000 households were surveyed and a Database was created. The slums were also marked on GIS Base map and a GIS Enabled Slum MIS was created.
Based on this data, zone wise analysis of all 243 notified slums is done.
3.3.3 Demographic Profile
Overall, there are 21 zones, 60 wards and 243 slums which have been surveyed. The spread of slum households indicates a high concentration (7078 households) in zone – 1 while zone – 15 is having the least concentration (61 households).

April 1, 2011
SLUM FREE CITY PLAN FOR GWALIOR CITY PREPARED BY GWALIOR MUNICIPAL CORPORATION
With Technical Support from. Mehta and Associates Indore,
Urban Planners 81
Revised Draft Final Report Volume I – Report and Appendices
Figure 326 Zone Wise Households and Population
Source: Socio‐economic Survey of Slums
Migration
It is observed that, about 89 percent of the slum households in the 21 zones are living in the slums for more than 5 years prior to 2010. In other words, the slums are quite old.
3.3.4 Socioeconomic Profile
Religion
Overall, about 89 percent of the slum households in the 21 zones of Gwalior city practices Hinduism, 10.5 percent practices Islam and the rest consists of marginal groups who are followers of Sikhism, Christianity and others.
Caste
The distribution of households by caste in the slums across 21 zones shows wide variations. Thus zone – 19 has the highest proportion (44.3 percent) of households in general category while zone – 15 has the highest proportion (90.16 percent) of households in SC / ST category and zone ‐ 17 has the maximum of 61.28 percent households in OBC category. Overall, the proportion of households in the slums over 21 zones consists of general category (22.82 percent), SC / ST (32.37 percent) and OBC (45.28 percent).
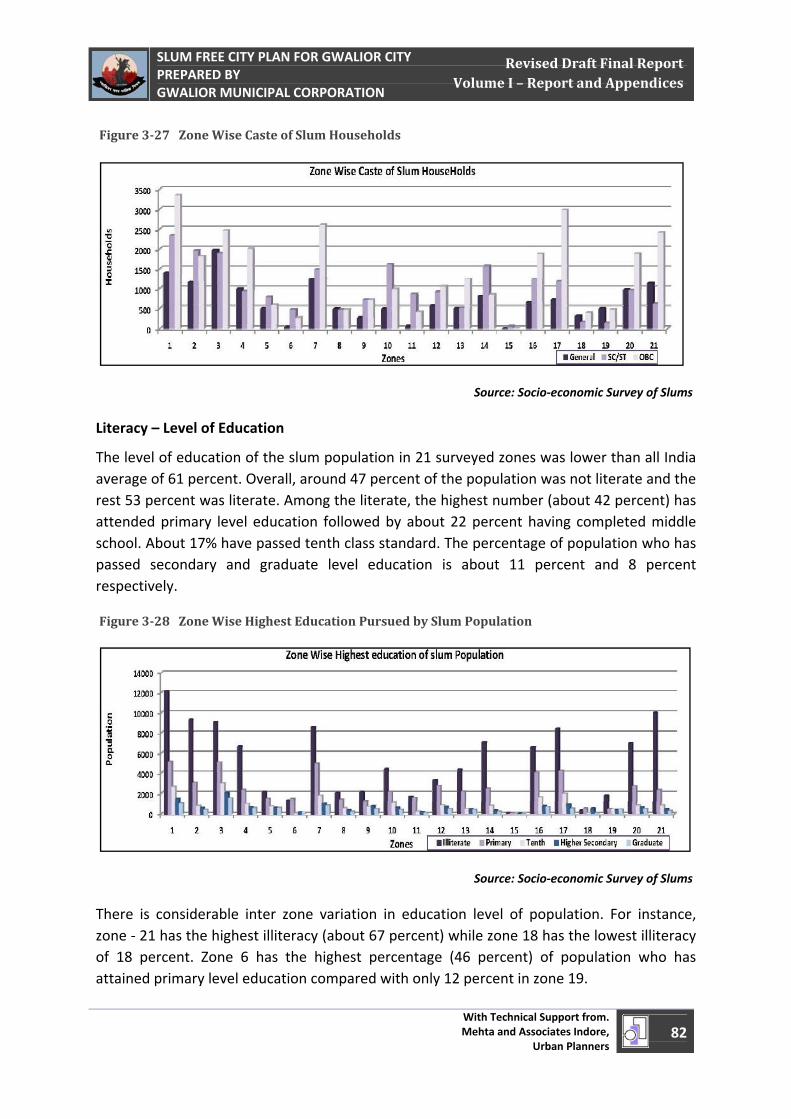
April 1, 2011
SLUM FREE CITY PLAN FOR GWALIOR CITY PREPARED BY GWALIOR MUNICIPAL CORPORATION
With Technical Support from. Mehta and Associates Indore,
Urban Planners 82
Revised Draft Final Report Volume I – Report and Appendices
Figure 327 Zone Wise Caste of Slum Households
Source: Socio‐economic Survey of Slums
Literacy – Level of Education
The level of education of the slum population in 21 surveyed zones was lower than all India average of 61 percent. Overall, around 47 percent of the population was not literate and the rest 53 percent was literate. Among the literate, the highest number (about 42 percent) has attended primary level education followed by about 22 percent having completed middle school. About 17% have passed tenth class standard. The percentage of population who has passed secondary and graduate level education is about 11 percent and 8 percent respectively.
Figure 328 Zone Wise Highest Education Pursued by Slum Population
Source: Socio‐economic Survey of Slums
There is considerable inter zone variation in education level of population. For instance, zone ‐ 21 has the highest illiteracy (about 67 percent) while zone 18 has the lowest illiteracy of 18 percent. Zone 6 has the highest percentage (46 percent) of population who has attained primary level education compared with only 12 percent in zone 19.
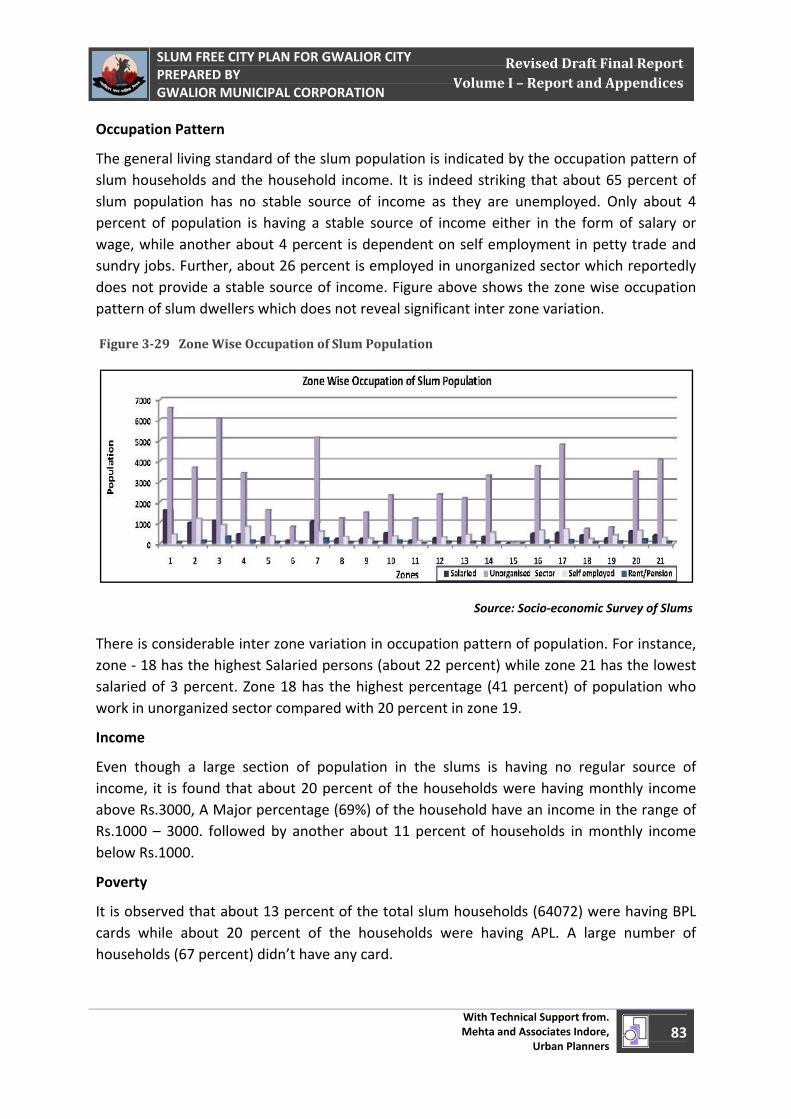
April 1, 2011
SLUM FREE CITY PLAN FOR GWALIOR CITY PREPARED BY GWALIOR MUNICIPAL CORPORATION
With Technical Support from. Mehta and Associates Indore,
Urban Planners 83
Revised Draft Final Report Volume I – Report and Appendices
Occupation Pattern
The general living standard of the slum population is indicated by the occupation pattern of slum households and the household income. It is indeed striking that about 65 percent of slum population has no stable source of income as they are unemployed. Only about 4 percent of population is having a stable source of income either in the form of salary or wage, while another about 4 percent is dependent on self employment in petty trade and sundry jobs. Further, about 26 percent is employed in unorganized sector which reportedly does not provide a stable source of income. Figure above shows the zone wise occupation pattern of slum dwellers which does not reveal significant inter zone variation.
Figure 329 Zone Wise Occupation of Slum Population
Source: Socio‐economic Survey of Slums
There is considerable inter zone variation in occupation pattern of population. For instance, zone ‐ 18 has the highest Salaried persons (about 22 percent) while zone 21 has the lowest salaried of 3 percent. Zone 18 has the highest percentage (41 percent) of population who work in unorganized sector compared with 20 percent in zone 19.
Income
Even though a large section of population in the slums is having no regular source of income, it is found that about 20 percent of the households were having monthly income above Rs.3000, A Major percentage (69%) of the household have an income in the range of Rs.1000 – 3000. followed by another about 11 percent of households in monthly income below Rs.1000.
Poverty
It is observed that about 13 percent of the total slum households (64072) were having BPL cards while about 20 percent of the households were having APL. A large number of households (67 percent) didn’t have any card.
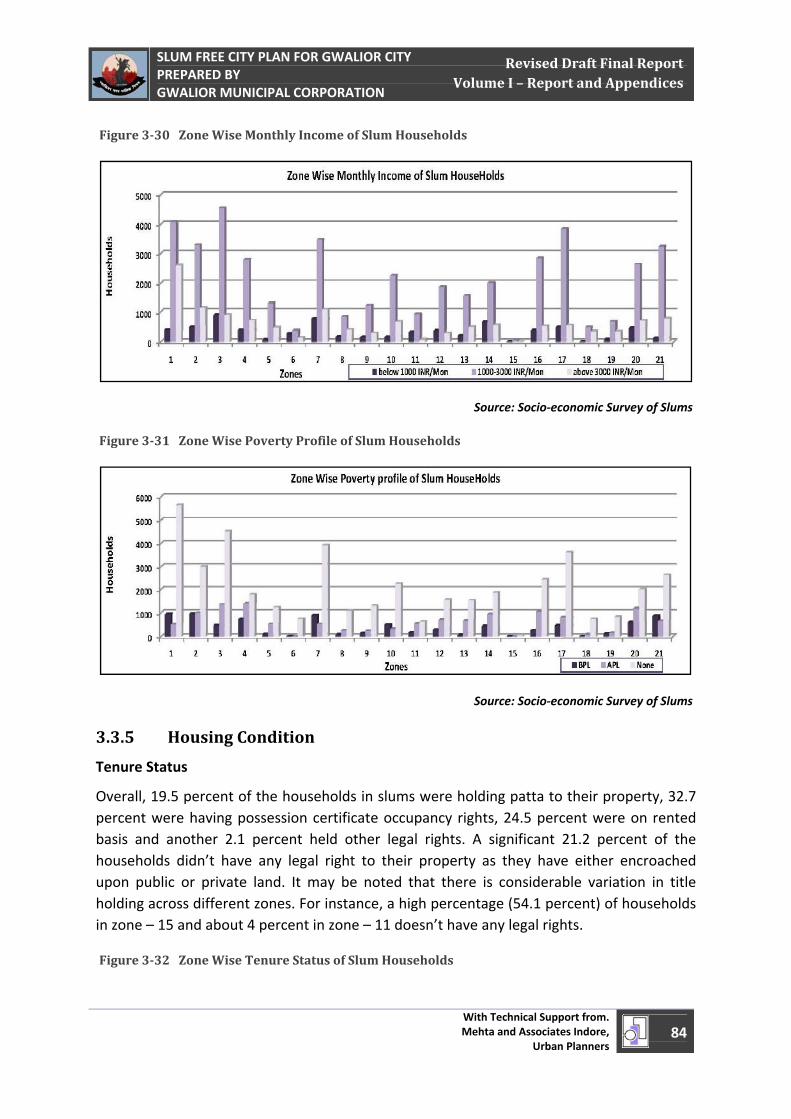
April 1, 2011
SLUM FREE CITY PLAN FOR GWALIOR CITY PREPARED BY GWALIOR MUNICIPAL CORPORATION
With Technical Support from. Mehta and Associates Indore,
Urban Planners 84
Revised Draft Final Report Volume I – Report and Appendices
Figure 330 Zone Wise Monthly Income of Slum Households
Source: Socio‐economic Survey of Slums
Figure 331 Zone Wise Poverty Profile of Slum Households
Source: Socio‐economic Survey of Slums
3.3.5 Housing Condition
Tenure Status
Overall, 19.5 percent of the households in slums were holding patta to their property, 32.7 percent were having possession certificate occupancy rights, 24.5 percent were on rented basis and another 2.1 percent held other legal rights. A significant 21.2 percent of the households didn’t have any legal right to their property as they have either encroached upon public or private land. It may be noted that there is considerable variation in title holding across different zones. For instance, a high percentage (54.1 percent) of households in zone – 15 and about 4 percent in zone – 11 doesn’t have any legal rights.
Figure 332 Zone Wise Tenure Status of Slum Households
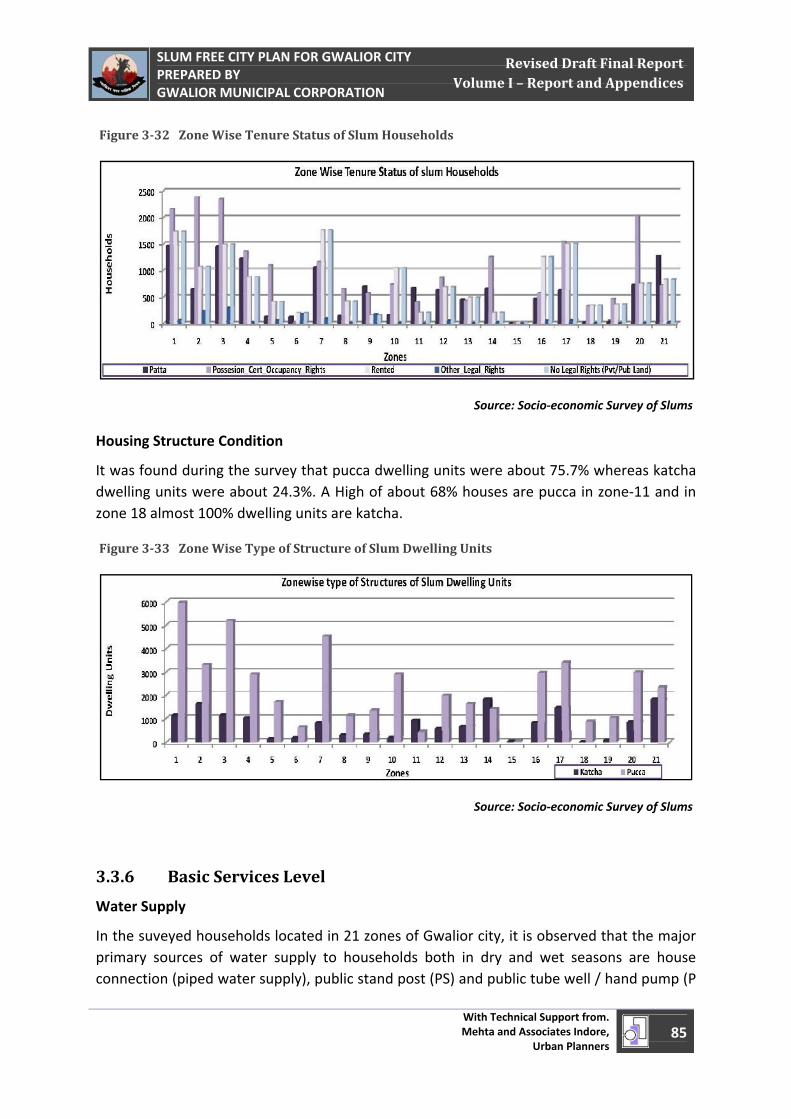
April 1, 2011
SLUM FREE CITY PLAN FOR GWALIOR CITY PREPARED BY GWALIOR MUNICIPAL CORPORATION
With Technical Support from. Mehta and Associates Indore,
Urban Planners 85
Revised Draft Final Report Volume I – Report and Appendices
Figure 332 Zone Wise Tenure Status of Slum Households
Source: Socio‐economic Survey of Slums
Housing Structure Condition
It was found during the survey that pucca dwelling units were about 75.7% whereas katcha dwelling units were about 24.3%. A High of about 68% houses are pucca in zone‐11 and in zone 18 almost 100% dwelling units are katcha.
Figure 333 Zone Wise Type of Structure of Slum Dwelling Units
Source: Socio‐economic Survey of Slums
3.3.6 Basic Services Level
Water Supply
In the suveyed households located in 21 zones of Gwalior city, it is observed that the major primary sources of water supply to households both in dry and wet seasons are house connection (piped water supply), public stand post (PS) and public tube well / hand pump (P
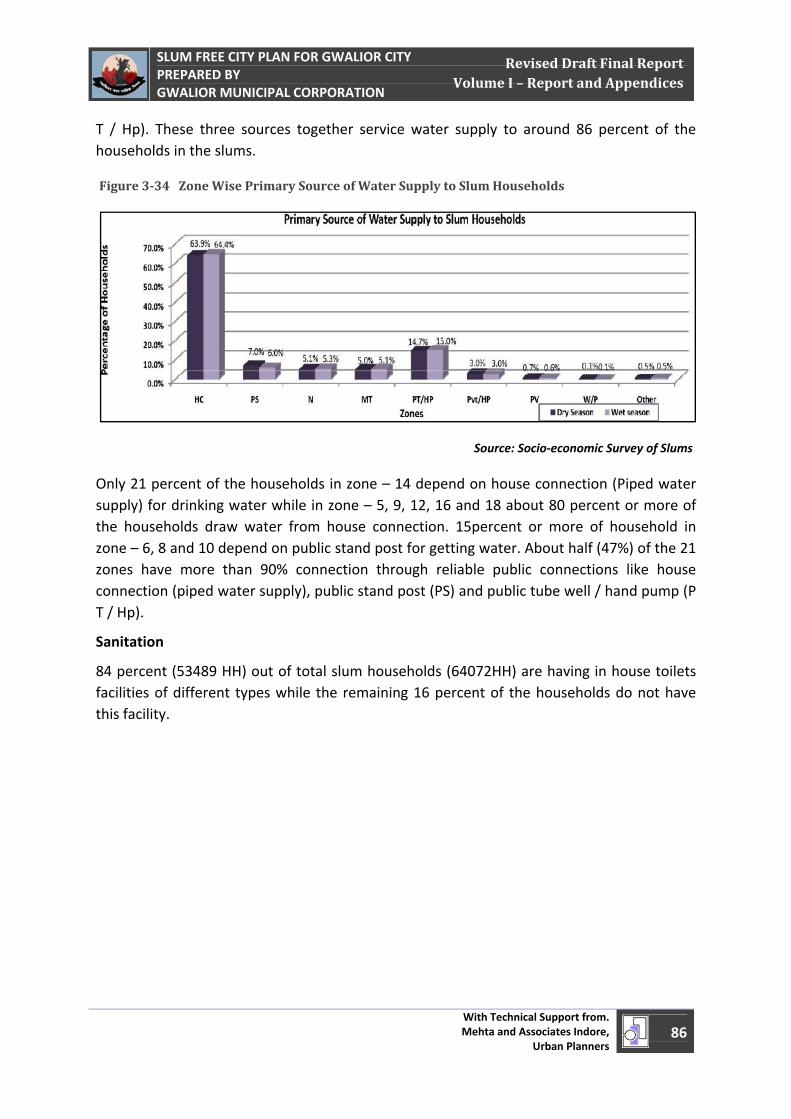
April 1, 2011
SLUM FREE CITY PLAN FOR GWALIOR CITY PREPARED BY GWALIOR MUNICIPAL CORPORATION
With Technical Support from. Mehta and Associates Indore,
Urban Planners 86
Revised Draft Final Report Volume I – Report and Appendices
T / Hp). These three sources together service water supply to around 86 percent of the households in the slums.
Figure 334 Zone Wise Primary Source of Water Supply to Slum Households
Source: Socio‐economic Survey of Slums
Only 21 percent of the households in zone – 14 depend on house connection (Piped water supply) for drinking water while in zone – 5, 9, 12, 16 and 18 about 80 percent or more of the households draw water from house connection. 15percent or more of household in zone – 6, 8 and 10 depend on public stand post for getting water. About half (47%) of the 21 zones have more than 90% connection through reliable public connections like house connection (piped water supply), public stand post (PS) and public tube well / hand pump (P T / Hp).
Sanitation
84 percent (53489 HH) out of total slum households (64072HH) are having in house toilets facilities of different types while the remaining 16 percent of the households do not have this facility.
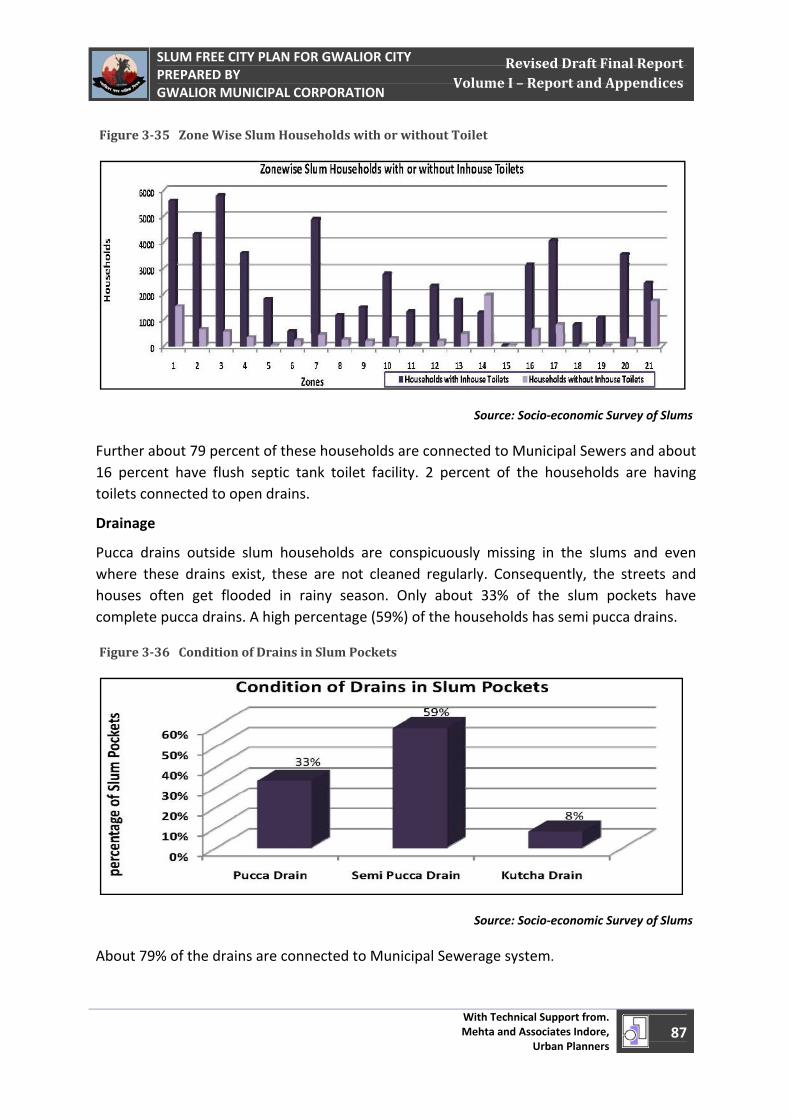
April 1, 2011
SLUM FREE CITY PLAN FOR GWALIOR CITY PREPARED BY GWALIOR MUNICIPAL CORPORATION
With Technical Support from. Mehta and Associates Indore,
Urban Planners 87
Revised Draft Final Report Volume I – Report and Appendices
Figure 335 Zone Wise Slum Households with or without Toilet
Source: Socio‐economic Survey of Slums
Further about 79 percent of these households are connected to Municipal Sewers and about 16 percent have flush septic tank toilet facility. 2 percent of the households are having toilets connected to open drains.
Drainage
Pucca drains outside slum households are conspicuously missing in the slums and even where these drains exist, these are not cleaned regularly. Consequently, the streets and houses often get flooded in rainy season. Only about 33% of the slum pockets have complete pucca drains. A high percentage (59%) of the households has semi pucca drains.
Figure 336 Condition of Drains in Slum Pockets
Source: Socio‐economic Survey of Slums
About 79% of the drains are connected to Municipal Sewerage system.
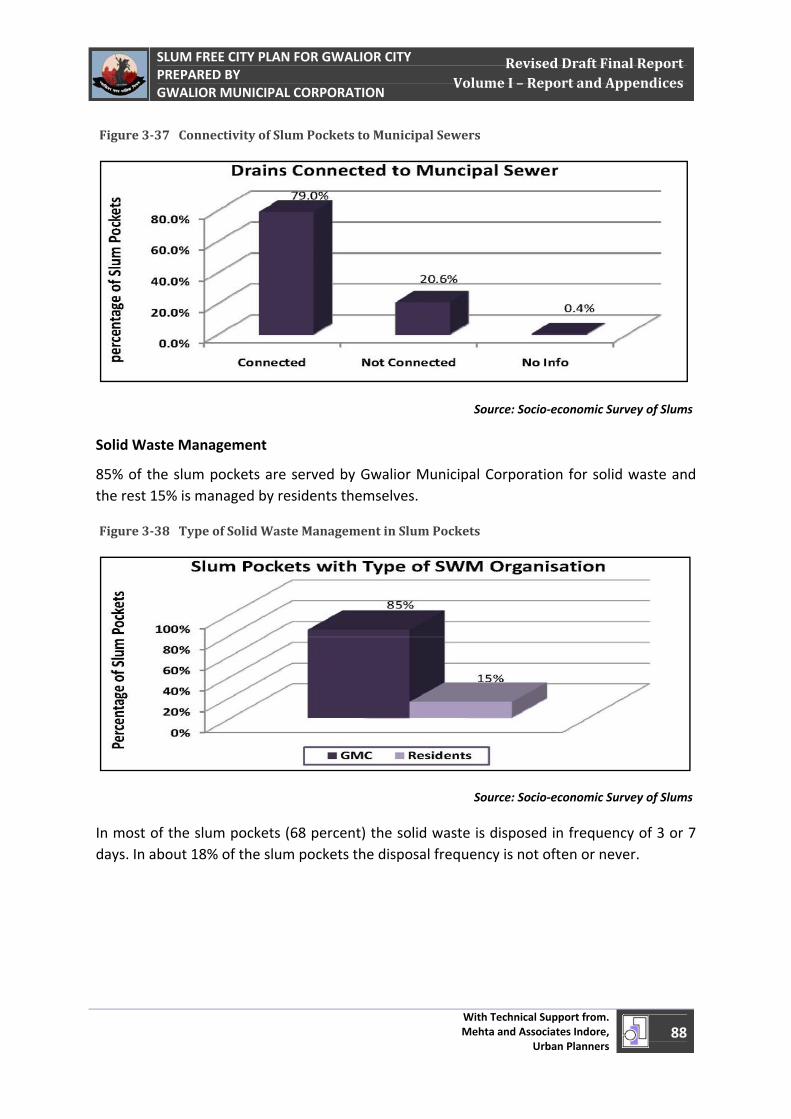
April 1, 2011
SLUM FREE CITY PLAN FOR GWALIOR CITY PREPARED BY GWALIOR MUNICIPAL CORPORATION
With Technical Support from. Mehta and Associates Indore,
Urban Planners 88
Revised Draft Final Report Volume I – Report and Appendices
Figure 337 Connectivity of Slum Pockets to Municipal Sewers
Source: Socio‐economic Survey of Slums
Solid Waste Management
85% of the slum pockets are served by Gwalior Municipal Corporation for solid waste and the rest 15% is managed by residents themselves.
Figure 338 Type of Solid Waste Management in Slum Pockets
Source: Socio‐economic Survey of Slums
In most of the slum pockets (68 percent) the solid waste is disposed in frequency of 3 or 7 days. In about 18% of the slum pockets the disposal frequency is not often or never.
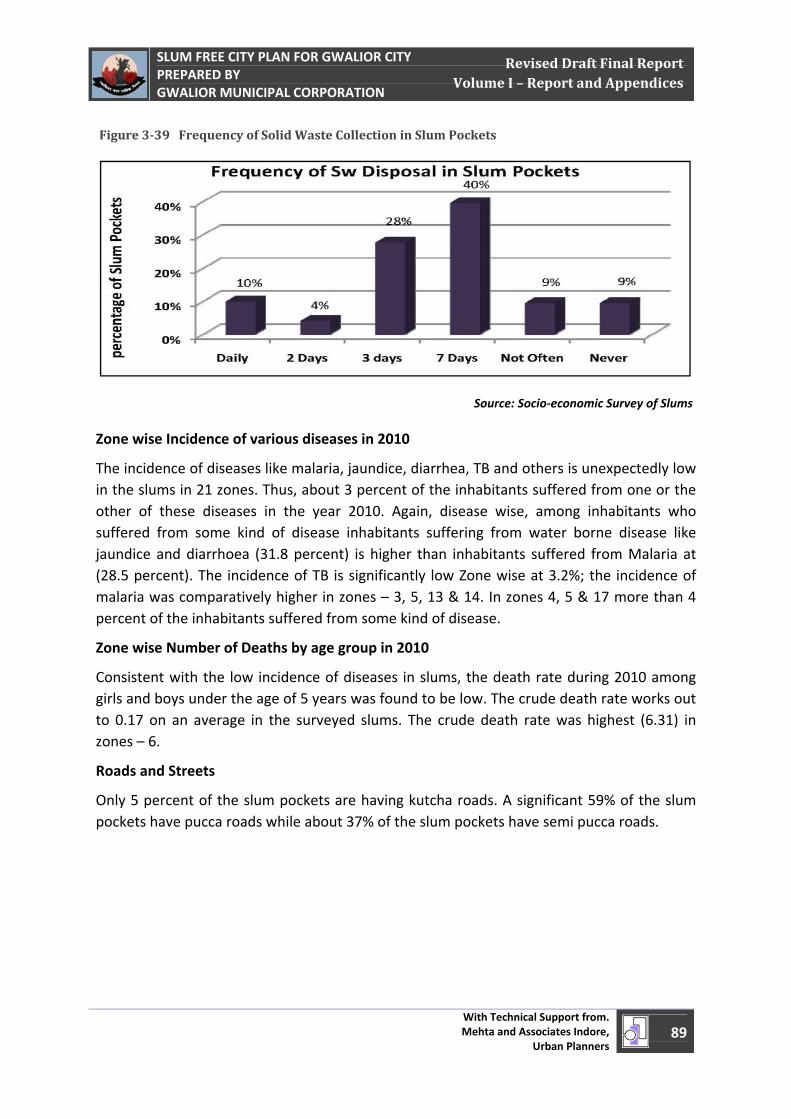
April 1, 2011
SLUM FREE CITY PLAN FOR GWALIOR CITY PREPARED BY GWALIOR MUNICIPAL CORPORATION
With Technical Support from. Mehta and Associates Indore,
Urban Planners 89
Revised Draft Final Report Volume I – Report and Appendices
Figure 339 Frequency of Solid Waste Collection in Slum Pockets
Source: Socio‐economic Survey of Slums
Zone wise Incidence of various diseases in 2010
The incidence of diseases like malaria, jaundice, diarrhea, TB and others is unexpectedly low in the slums in 21 zones. Thus, about 3 percent of the inhabitants suffered from one or the other of these diseases in the year 2010. Again, disease wise, among inhabitants who suffered from some kind of disease inhabitants suffering from water borne disease like jaundice and diarrhoea (31.8 percent) is higher than inhabitants suffered from Malaria at (28.5 percent). The incidence of TB is significantly low Zone wise at 3.2%; the incidence of malaria was comparatively higher in zones – 3, 5, 13 & 14. In zones 4, 5 & 17 more than 4 percent of the inhabitants suffered from some kind of disease.
Zone wise Number of Deaths by age group in 2010
Consistent with the low incidence of diseases in slums, the death rate during 2010 among girls and boys under the age of 5 years was found to be low. The crude death rate works out to 0.17 on an average in the surveyed slums. The crude death rate was highest (6.31) in zones – 6.
Roads and Streets
Only 5 percent of the slum pockets are having kutcha roads. A significant 59% of the slum pockets have pucca roads while about 37% of the slum pockets have semi pucca roads.
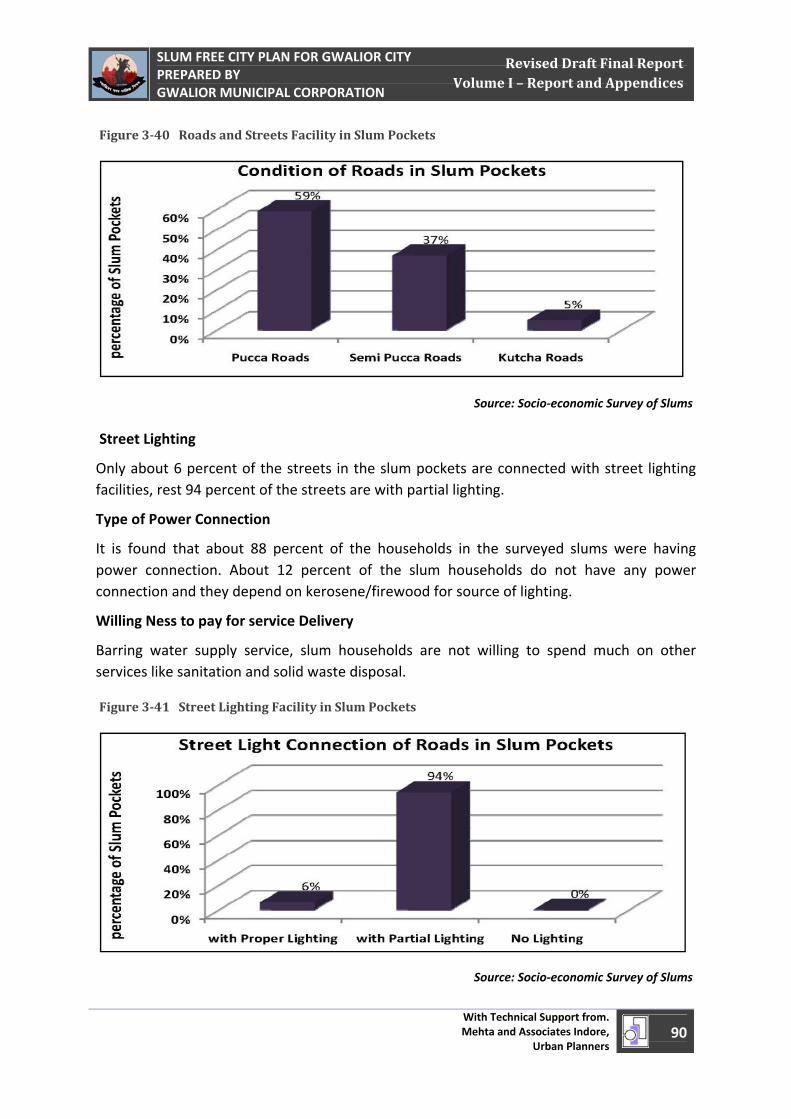
April 1, 2011
SLUM FREE CITY PLAN FOR GWALIOR CITY PREPARED BY GWALIOR MUNICIPAL CORPORATION
With Technical Support from. Mehta and Associates Indore,
Urban Planners 90
Revised Draft Final Report Volume I – Report and Appendices
Figure 340 Roads and Streets Facility in Slum Pockets
Source: Socio‐economic Survey of Slums
Street Lighting
Only about 6 percent of the streets in the slum pockets are connected with street lighting facilities, rest 94 percent of the streets are with partial lighting.
Type of Power Connection
It is found that about 88 percent of the households in the surveyed slums were having power connection. About 12 percent of the slum households do not have any power connection and they depend on kerosene/firewood for source of lighting.
Willing Ness to pay for service Delivery
Barring water supply service, slum households are not willing to spend much on other services like sanitation and solid waste disposal.
Figure 341 Street Lighting Facility in Slum Pockets
Source: Socio‐economic Survey of Slums
April 1, 2011
SLUM FREE CITY PLAN FOR GWALIOR CITY PREPARED BY GWALIOR MUNICIPAL CORPORATION
With Technical Support from. Mehta and Associates Indore,
Urban Planners 91
Revised Draft Final Report Volume I – Report and Appendices
Categorization of Slums – Chapter – 4 4
April 1, 2011
SLUM FREE CITY PLAN FOR GWALIOR CITY PREPARED BY GWALIOR MUNICIPAL CORPORATION
With Technical Support from. Mehta and Associates Indore,
Urban Planners 92
Revised Draft Final Report Volume I – Report and Appendices
Categorization of Slums is most significant step in Slum Free City Planning. Slums were categorized based on various parameters such as Tenability, Tenure Status, Land Ownership of Slum Pockets, Residential Density, Land Value and Three Dimensional Matrix Analysis on Housing, Infrastructure and Socio‐economic Conditions of Slums. The GIS Enabled MIS was used to carry out the various analysis of slums in Gwalior and ultimately categorization of Slums was carried out.
3.4 Tenability Analysis
Tenability Analysis was conducted for every slum with the help of Geographical Information System. The Criteria’s considered for Tenability Analysis were
Hazards/Risk Zones – (Flood, Seismicity and other Environmental Hazards) – based on Studies and Remote sensing spatial information.
Land use Constraints – Consistency, Compatibility and Conformity – based on Land Use Map of Gwalior Development Plan – 2005.
Land Ownership – Based on Geo‐referenced Cadastral Maps and Slum survey on Ownership
3.4.1 UnTenable Slums
Hazards/Risk Zones
Gwalior is located in Low Risk seismic zone (ZONE II) and has pre‐dominantly flat land with less than 6% slope apart from fort area. Thus the Hazards/Risk Zones considered were only based on areas prone to local flooding and buffer area of Natural Streams. Such slums were categorized as UT_I in the Tenability Analysis.
Land Use Constraints
To Determine Land Use Constraints related to every slum pockets, Proposed Land Use Plan of 2005 of Gwalior Development Plan 2005 was used. Based on the slum pockets geographic location on the Land Use Plan the slums falling on Recreational Use Zones (Green and City Forest) and slums which are an Obstruction to Extension of Urban Infrastructure (Roads, Railways, Airport, Bus Terminal etc.) were considered to be untenable. Slums which were obstruction to extension of Urban Infrastructure were categorized as UT_II and slums located on Recreational Use Zones were categorized as UT_III in the Tenability Analysis.
None of the Slums in Gwalior fall on Airport Authority of India Land. While there were few slums which were partially located on railway Land who were considered partially Tenable or semi‐tenable and the area falling under the railway Land was considered as untenable.
Categorization of Slums Chapter 4
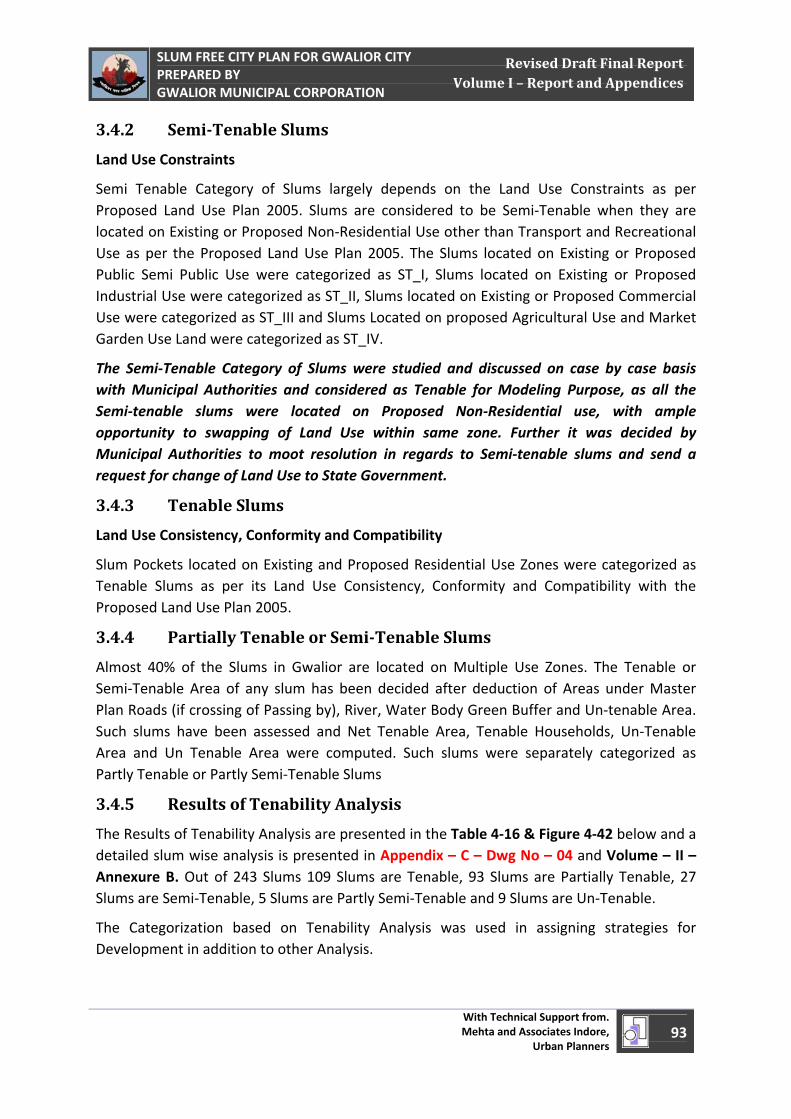
April 1, 2011
SLUM FREE CITY PLAN FOR GWALIOR CITY PREPARED BY GWALIOR MUNICIPAL CORPORATION
With Technical Support from. Mehta and Associates Indore,
Urban Planners 93
Revised Draft Final Report Volume I – Report and Appendices
3.4.2 SemiTenable Slums
Land Use Constraints
Semi Tenable Category of Slums largely depends on the Land Use Constraints as per Proposed Land Use Plan 2005. Slums are considered to be Semi‐Tenable when they are located on Existing or Proposed Non‐Residential Use other than Transport and Recreational Use as per the Proposed Land Use Plan 2005. The Slums located on Existing or Proposed Public Semi Public Use were categorized as ST_I, Slums located on Existing or Proposed Industrial Use were categorized as ST_II, Slums located on Existing or Proposed Commercial Use were categorized as ST_III and Slums Located on proposed Agricultural Use and Market Garden Use Land were categorized as ST_IV.
The Semi‐Tenable Category of Slums were studied and discussed on case by case basis with Municipal Authorities and considered as Tenable for Modeling Purpose, as all the Semi‐tenable slums were located on Proposed Non‐Residential use, with ample opportunity to swapping of Land Use within same zone. Further it was decided by Municipal Authorities to moot resolution in regards to Semi‐tenable slums and send a request for change of Land Use to State Government.
3.4.3 Tenable Slums
Land Use Consistency, Conformity and Compatibility
Slum Pockets located on Existing and Proposed Residential Use Zones were categorized as Tenable Slums as per its Land Use Consistency, Conformity and Compatibility with the Proposed Land Use Plan 2005.
3.4.4 Partially Tenable or SemiTenable Slums
Almost 40% of the Slums in Gwalior are located on Multiple Use Zones. The Tenable or Semi‐Tenable Area of any slum has been decided after deduction of Areas under Master Plan Roads (if crossing of Passing by), River, Water Body Green Buffer and Un‐tenable Area. Such slums have been assessed and Net Tenable Area, Tenable Households, Un‐Tenable Area and Un Tenable Area were computed. Such slums were separately categorized as Partly Tenable or Partly Semi‐Tenable Slums
3.4.5 Results of Tenability Analysis
The Results of Tenability Analysis are presented in the Table 4‐16 & Figure 4‐42 below and a detailed slum wise analysis is presented in Appendix – C – Dwg No – 04 and Volume – II – Annexure B. Out of 243 Slums 109 Slums are Tenable, 93 Slums are Partially Tenable, 27 Slums are Semi‐Tenable, 5 Slums are Partly Semi‐Tenable and 9 Slums are Un‐Tenable.
The Categorization based on Tenability Analysis was used in assigning strategies for Development in addition to other Analysis.
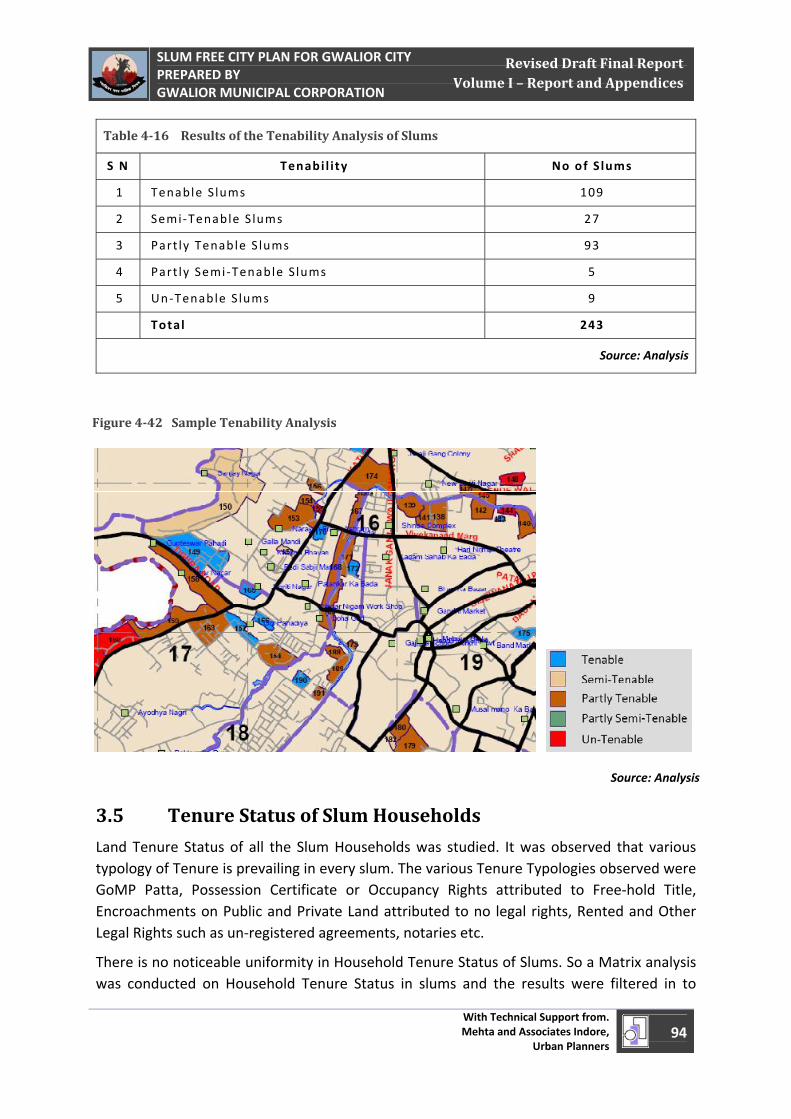
April 1, 2011
SLUM FREE CITY PLAN FOR GWALIOR CITY PREPARED BY GWALIOR MUNICIPAL CORPORATION
With Technical Support from. Mehta and Associates Indore,
Urban Planners 94
Revised Draft Final Report Volume I – Report and Appendices
Table 416 Results of the Tenability Analysis of Slums
S N Tenabi l i ty No of Slums
1 Tenable Slums 109
2 Semi ‐Tenable Slums 27
3 Part ly Tenable Slums 93
4 Part ly Semi ‐Tenable Slums 5
5 Un ‐Tenable Slums 9
Total 243
Source: Analysis
Figure 442 Sample Tenability Analysis
Source: Analysis
3.5 Tenure Status of Slum Households
Land Tenure Status of all the Slum Households was studied. It was observed that various typology of Tenure is prevailing in every slum. The various Tenure Typologies observed were GoMP Patta, Possession Certificate or Occupancy Rights attributed to Free‐hold Title, Encroachments on Public and Private Land attributed to no legal rights, Rented and Other Legal Rights such as un‐registered agreements, notaries etc.
There is no noticeable uniformity in Household Tenure Status of Slums. So a Matrix analysis was conducted on Household Tenure Status in slums and the results were filtered in to
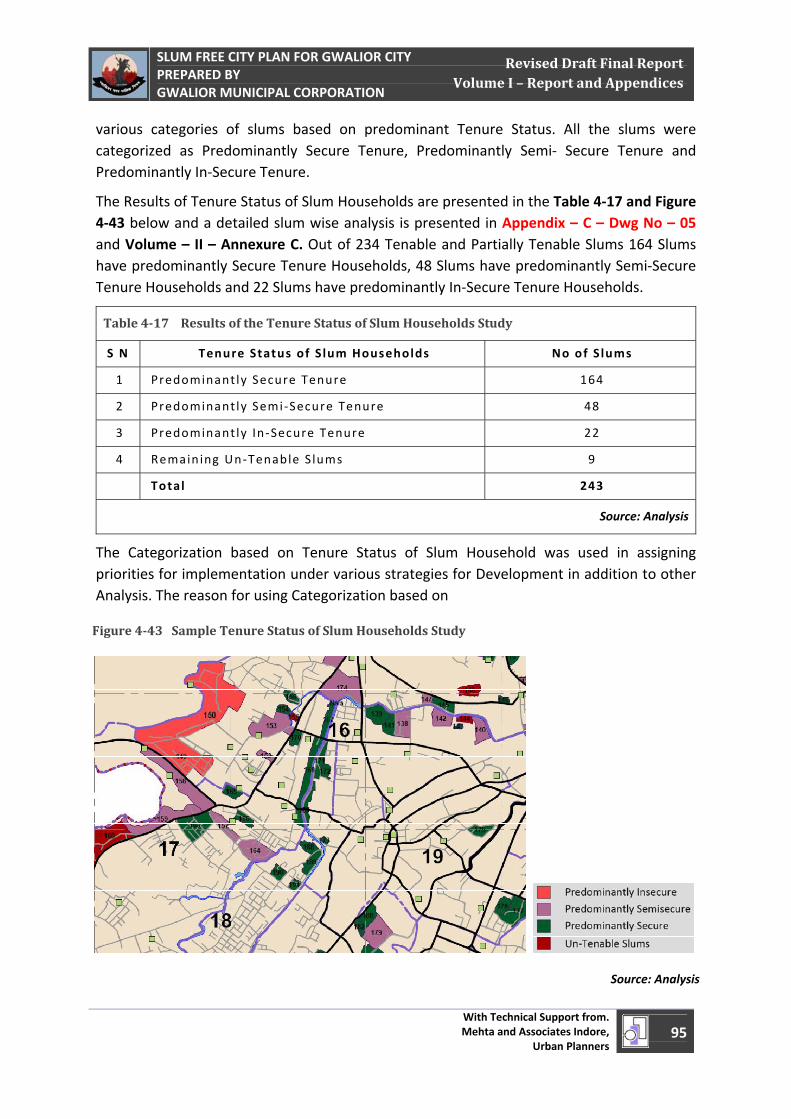
April 1, 2011
SLUM FREE CITY PLAN FOR GWALIOR CITY PREPARED BY GWALIOR MUNICIPAL CORPORATION
With Technical Support from. Mehta and Associates Indore,
Urban Planners 95
Revised Draft Final Report Volume I – Report and Appendices
various categories of slums based on predominant Tenure Status. All the slums were categorized as Predominantly Secure Tenure, Predominantly Semi‐ Secure Tenure and Predominantly In‐Secure Tenure.
The Results of Tenure Status of Slum Households are presented in the Table 4‐17 and Figure 4‐43 below and a detailed slum wise analysis is presented in Appendix – C – Dwg No – 05 and Volume – II – Annexure C. Out of 234 Tenable and Partially Tenable Slums 164 Slums have predominantly Secure Tenure Households, 48 Slums have predominantly Semi‐Secure Tenure Households and 22 Slums have predominantly In‐Secure Tenure Households.
Table 417 Results of the Tenure Status of Slum Households Study
S N Tenure Status of Slum Households No of Slums
1 Predominant ly Secure Tenure 164
2 Predominant ly Semi ‐Secure Tenure 48
3 Predominant ly In ‐Secure Tenure 22
4 Remaining Un ‐Tenable Slums 9
Total 243
Source: Analysis
The Categorization based on Tenure Status of Slum Household was used in assigning priorities for implementation under various strategies for Development in addition to other Analysis. The reason for using Categorization based on
Figure 443 Sample Tenure Status of Slum Households Study
Source: Analysis
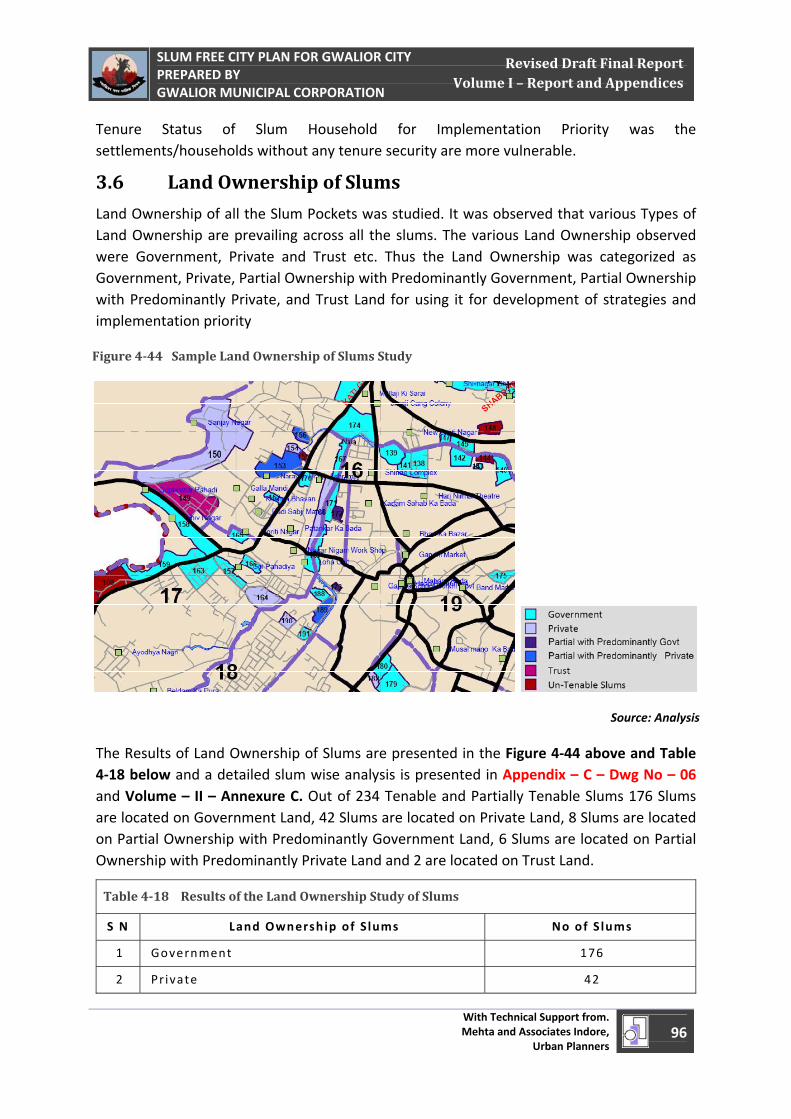
April 1, 2011
SLUM FREE CITY PLAN FOR GWALIOR CITY PREPARED BY GWALIOR MUNICIPAL CORPORATION
With Technical Support from. Mehta and Associates Indore,
Urban Planners 96
Revised Draft Final Report Volume I – Report and Appendices
Tenure Status of Slum Household for Implementation Priority was the settlements/households without any tenure security are more vulnerable.
3.6 Land Ownership of Slums
Land Ownership of all the Slum Pockets was studied. It was observed that various Types of Land Ownership are prevailing across all the slums. The various Land Ownership observed were Government, Private and Trust etc. Thus the Land Ownership was categorized as Government, Private, Partial Ownership with Predominantly Government, Partial Ownership with Predominantly Private, and Trust Land for using it for development of strategies and implementation priority
Figure 444 Sample Land Ownership of Slums Study
Source: Analysis
The Results of Land Ownership of Slums are presented in the Figure 4‐44 above and Table 4‐18 below and a detailed slum wise analysis is presented in Appendix – C – Dwg No – 06 and Volume – II – Annexure C. Out of 234 Tenable and Partially Tenable Slums 176 Slums are located on Government Land, 42 Slums are located on Private Land, 8 Slums are located on Partial Ownership with Predominantly Government Land, 6 Slums are located on Partial Ownership with Predominantly Private Land and 2 are located on Trust Land.
Table 418 Results of the Land Ownership Study of Slums
S N Land Ownership of Slums No of Slums
1 Government 176
2 Pr ivate 42
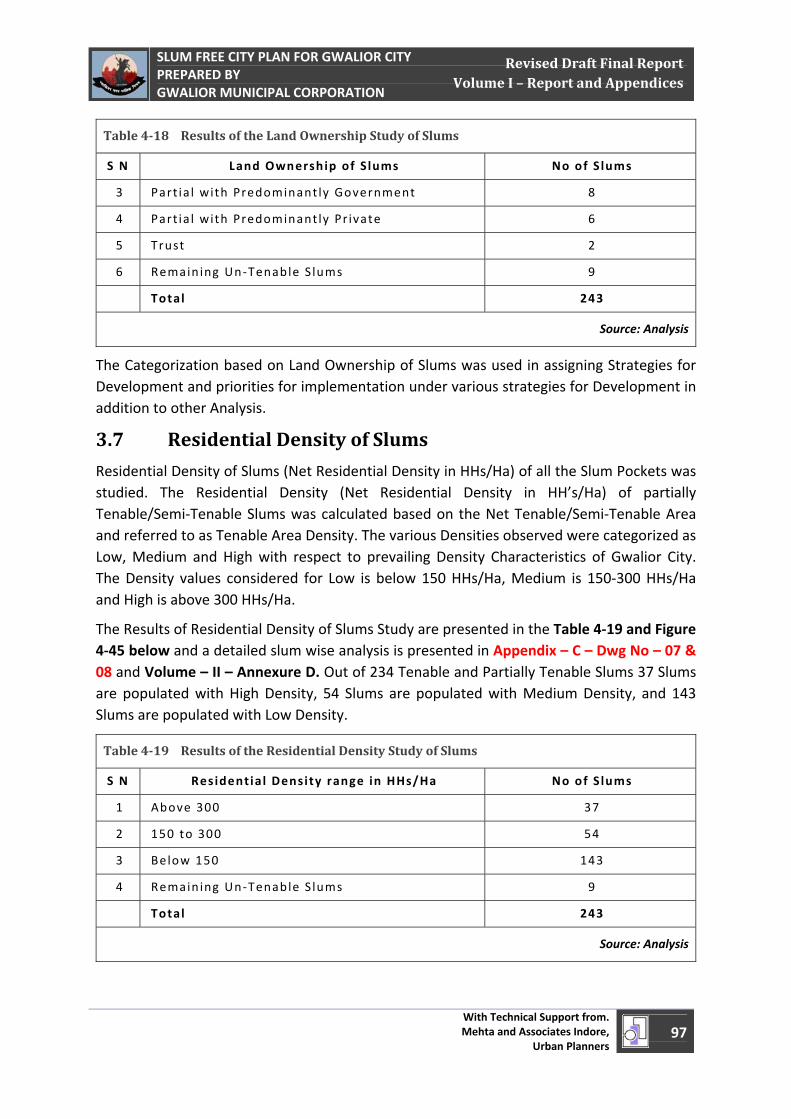
April 1, 2011
SLUM FREE CITY PLAN FOR GWALIOR CITY PREPARED BY GWALIOR MUNICIPAL CORPORATION
With Technical Support from. Mehta and Associates Indore,
Urban Planners 97
Revised Draft Final Report Volume I – Report and Appendices
Table 418 Results of the Land Ownership Study of Slums
S N Land Ownership of Slums No of Slums
3 Part ia l with Predominant ly Government 8
4 Part ia l with Predominant ly Pr ivate 6
5 Trust 2
6 Remaining Un ‐Tenable Slums 9
Total 243
Source: Analysis
The Categorization based on Land Ownership of Slums was used in assigning Strategies for Development and priorities for implementation under various strategies for Development in addition to other Analysis.
3.7 Residential Density of Slums
Residential Density of Slums (Net Residential Density in HHs/Ha) of all the Slum Pockets was studied. The Residential Density (Net Residential Density in HH’s/Ha) of partially Tenable/Semi‐Tenable Slums was calculated based on the Net Tenable/Semi‐Tenable Area and referred to as Tenable Area Density. The various Densities observed were categorized as Low, Medium and High with respect to prevailing Density Characteristics of Gwalior City. The Density values considered for Low is below 150 HHs/Ha, Medium is 150‐300 HHs/Ha and High is above 300 HHs/Ha.
The Results of Residential Density of Slums Study are presented in the Table 4‐19 and Figure 4‐45 below and a detailed slum wise analysis is presented in Appendix – C – Dwg No – 07 & 08 and Volume – II – Annexure D. Out of 234 Tenable and Partially Tenable Slums 37 Slums are populated with High Density, 54 Slums are populated with Medium Density, and 143 Slums are populated with Low Density.
Table 419 Results of the Residential Density Study of Slums
S N Residential Density range in HHs/Ha No of Slums
1 Above 300 37
2 150 to 300 54
3 Below 150 143
4 Remaining Un ‐Tenable Slums 9
Total 243
Source: Analysis
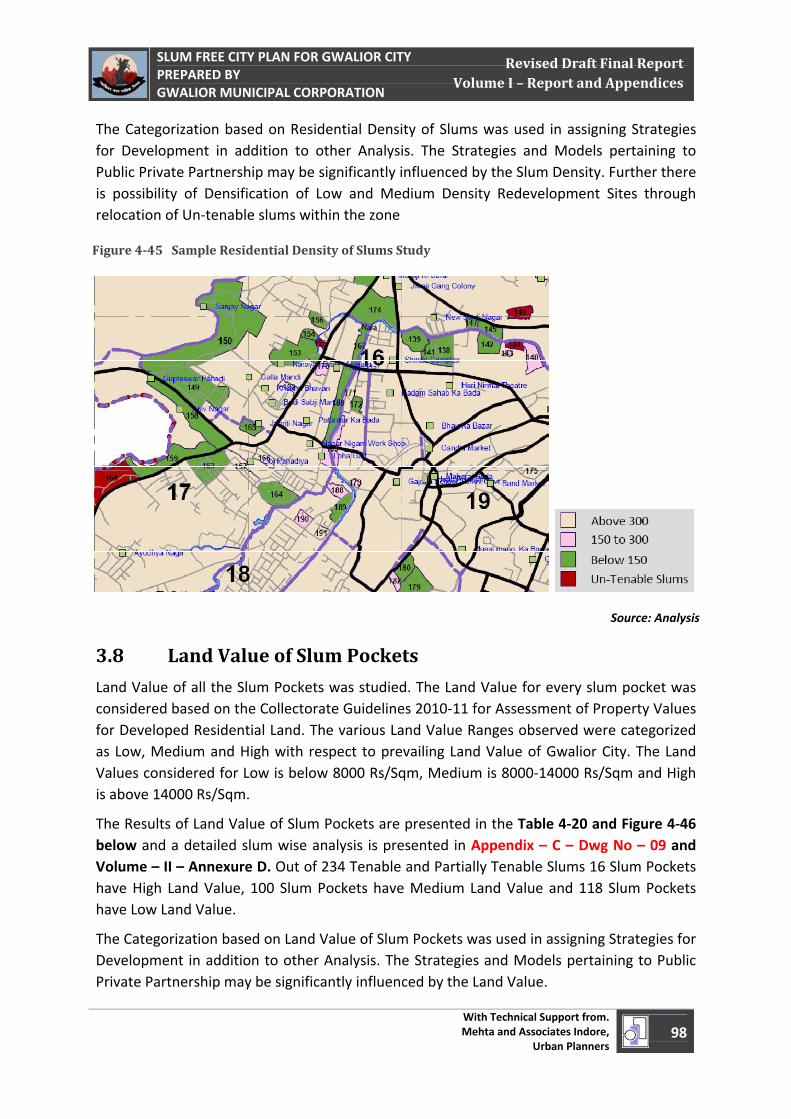
April 1, 2011
SLUM FREE CITY PLAN FOR GWALIOR CITY PREPARED BY GWALIOR MUNICIPAL CORPORATION
With Technical Support from. Mehta and Associates Indore,
Urban Planners 98
Revised Draft Final Report Volume I – Report and Appendices
The Categorization based on Residential Density of Slums was used in assigning Strategies for Development in addition to other Analysis. The Strategies and Models pertaining to Public Private Partnership may be significantly influenced by the Slum Density. Further there is possibility of Densification of Low and Medium Density Redevelopment Sites through relocation of Un‐tenable slums within the zone
Figure 445 Sample Residential Density of Slums Study
Source: Analysis
3.8 Land Value of Slum Pockets
Land Value of all the Slum Pockets was studied. The Land Value for every slum pocket was considered based on the Collectorate Guidelines 2010‐11 for Assessment of Property Values for Developed Residential Land. The various Land Value Ranges observed were categorized as Low, Medium and High with respect to prevailing Land Value of Gwalior City. The Land Values considered for Low is below 8000 Rs/Sqm, Medium is 8000‐14000 Rs/Sqm and High is above 14000 Rs/Sqm.
The Results of Land Value of Slum Pockets are presented in the Table 4‐20 and Figure 4‐46 below and a detailed slum wise analysis is presented in Appendix – C – Dwg No – 09 and Volume – II – Annexure D. Out of 234 Tenable and Partially Tenable Slums 16 Slum Pockets have High Land Value, 100 Slum Pockets have Medium Land Value and 118 Slum Pockets have Low Land Value.
The Categorization based on Land Value of Slum Pockets was used in assigning Strategies for Development in addition to other Analysis. The Strategies and Models pertaining to Public Private Partnership may be significantly influenced by the Land Value.
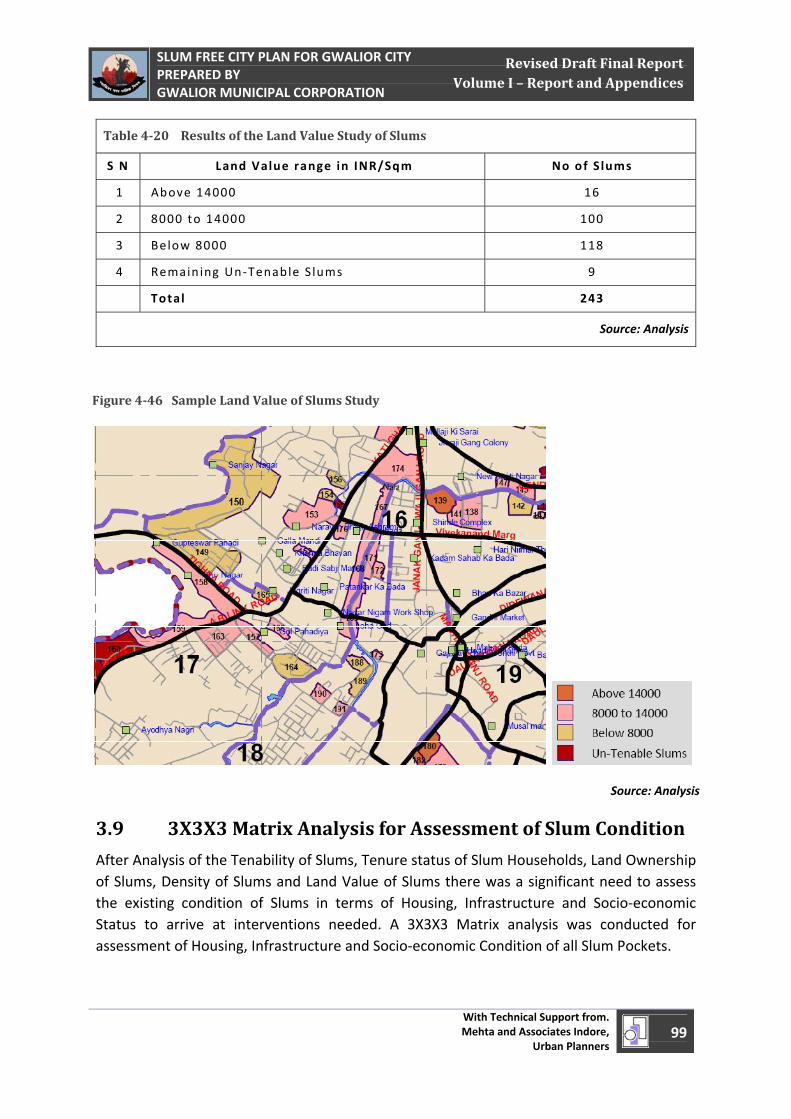
April 1, 2011
SLUM FREE CITY PLAN FOR GWALIOR CITY PREPARED BY GWALIOR MUNICIPAL CORPORATION
With Technical Support from. Mehta and Associates Indore,
Urban Planners 99
Revised Draft Final Report Volume I – Report and Appendices
Table 420 Results of the Land Value Study of Slums
S N Land Value range in INR/Sqm No of Slums
1 Above 14000 16
2 8000 to 14000 100
3 Below 8000 118
4 Remaining Un ‐Tenable Slums 9
Total 243
Source: Analysis
Figure 446 Sample Land Value of Slums Study
Source: Analysis
3.9 3X3X3 Matrix Analysis for Assessment of Slum Condition
After Analysis of the Tenability of Slums, Tenure status of Slum Households, Land Ownership of Slums, Density of Slums and Land Value of Slums there was a significant need to assess the existing condition of Slums in terms of Housing, Infrastructure and Socio‐economic Status to arrive at interventions needed. A 3X3X3 Matrix analysis was conducted for assessment of Housing, Infrastructure and Socio‐economic Condition of all Slum Pockets.
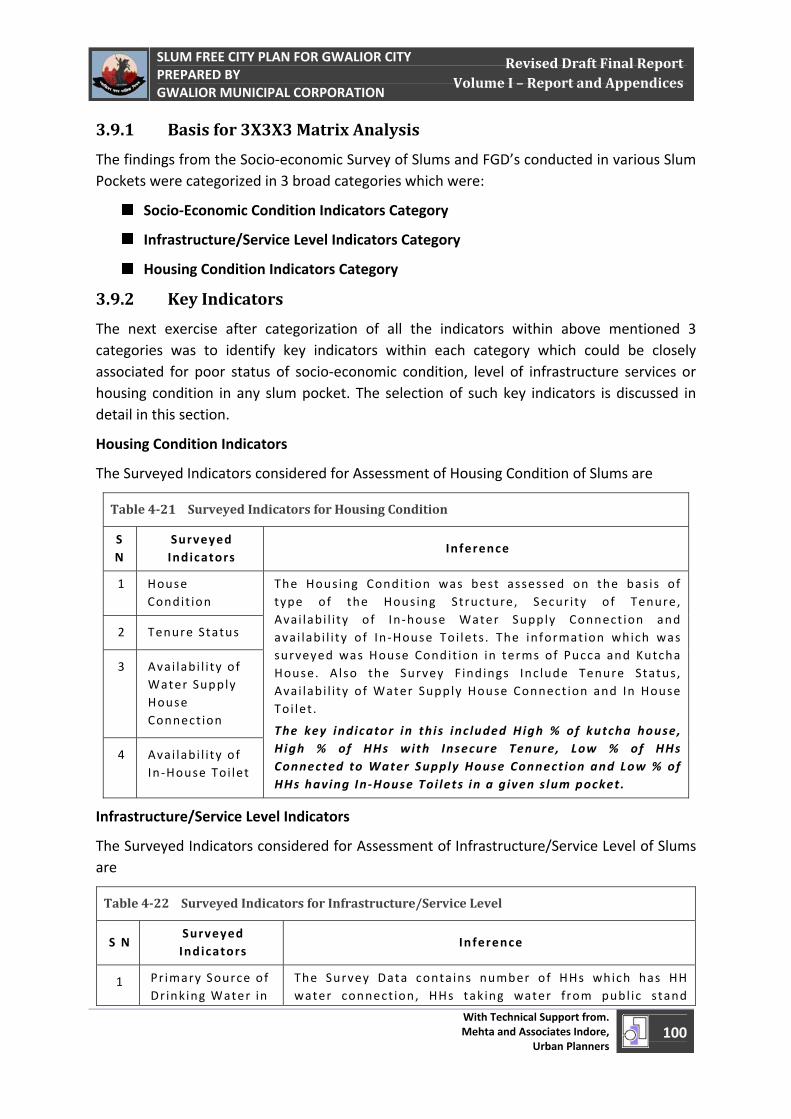
April 1, 2011
SLUM FREE CITY PLAN FOR GWALIOR CITY PREPARED BY GWALIOR MUNICIPAL CORPORATION
With Technical Support from. Mehta and Associates Indore,
Urban Planners 100
Revised Draft Final Report Volume I – Report and Appendices
3.9.1 Basis for 3X3X3 Matrix Analysis
The findings from the Socio‐economic Survey of Slums and FGD’s conducted in various Slum Pockets were categorized in 3 broad categories which were:
Socio‐Economic Condition Indicators Category
Infrastructure/Service Level Indicators Category
Housing Condition Indicators Category
3.9.2 Key Indicators
The next exercise after categorization of all the indicators within above mentioned 3 categories was to identify key indicators within each category which could be closely associated for poor status of socio‐economic condition, level of infrastructure services or housing condition in any slum pocket. The selection of such key indicators is discussed in detail in this section.
Housing Condition Indicators
The Surveyed Indicators considered for Assessment of Housing Condition of Slums are
Table 421 Surveyed Indicators for Housing Condition
S N
Surveyed Indicators
Inference
1 House Condit ion
The Housing Condit ion was best assessed on the basis of type of the Housing Structure, Secur ity of Tenure, Avai labi l i ty of In ‐house Water Supply Connect ion and avai labi l i ty of In ‐House Toi lets. The informat ion which was surveyed was House Condit ion in terms of Pucca and Kutcha House. Also the Survey F indings Inc lude Tenure Status, Avai labi l i ty of Water Supply House Connect ion and In House Toi let .
The key indicator in this inc luded High % of kutcha house, High % of HHs with Insecure Tenure, Low % of HHs Connected to Water Supply House Connect ion and Low % of HHs having In ‐House Toi lets in a given s lum pocket.
2 Tenure Status
3 Avai labi l i ty of Water Supply House Connect ion
4 Avai labi l i ty of In ‐House Toi let
Infrastructure/Service Level Indicators
The Surveyed Indicators considered for Assessment of Infrastructure/Service Level of Slums are
Table 422 Surveyed Indicators for Infrastructure/Service Level
S N Surveyed Indicators
Inference
1 Pr imary Source of Drinking Water in
The Survey Data contains number of HHs which has HH water connect ion, HHs tak ing water f rom publ ic stand
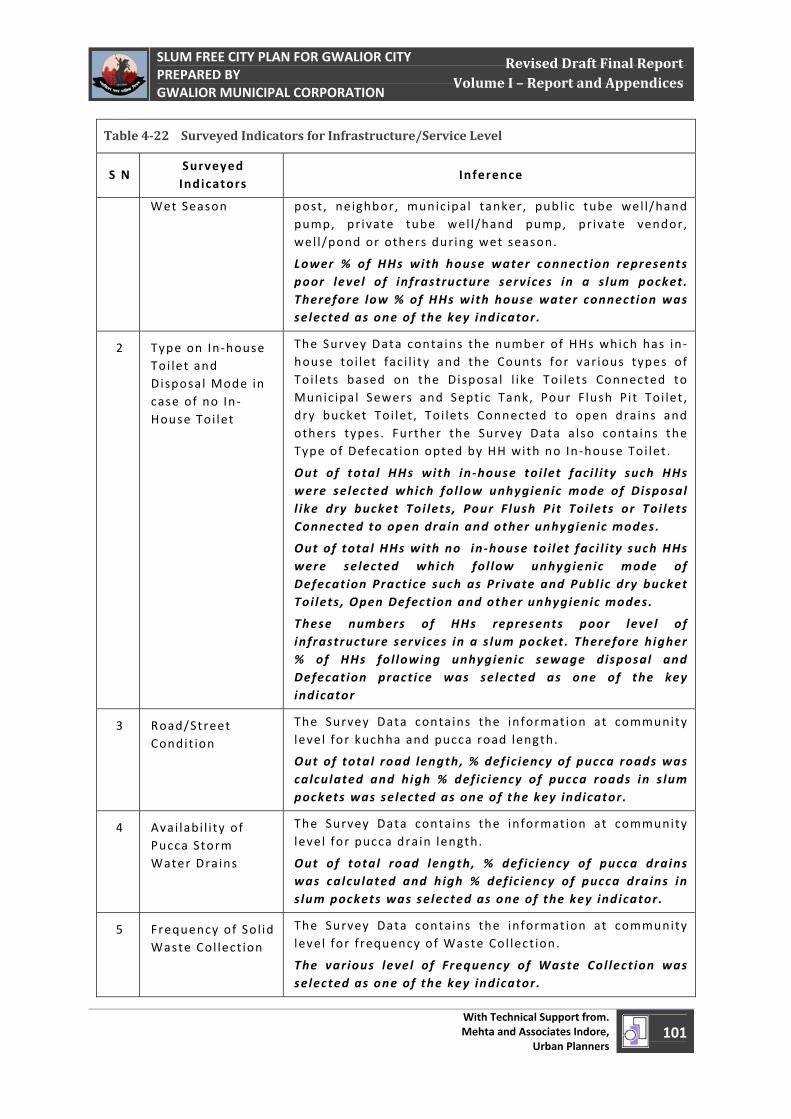
April 1, 2011
SLUM FREE CITY PLAN FOR GWALIOR CITY PREPARED BY GWALIOR MUNICIPAL CORPORATION
With Technical Support from. Mehta and Associates Indore,
Urban Planners 101
Revised Draft Final Report Volume I – Report and Appendices
Table 422 Surveyed Indicators for Infrastructure/Service Level
S N Surveyed Indicators
Inference
Wet Season post, neighbor, munic ipa l tanker, publ ic tube wel l/hand pump, pr ivate tube wel l/hand pump, pr ivate vendor, wel l/pond or others during wet season.
Lower % of HHs with house water connect ion represents poor level of infrastructure services in a s lum pocket. Therefore low % of HHs with house water connect ion was selected as one of the key indicator.
2 Type on In ‐house Toi let and Disposal Mode in case of no In ‐House Toi let
The Survey Data conta ins the number of HHs which has in ‐house to i let fac i l i ty and the Counts for var ious types of Toi lets based on the Disposal l ike Toi lets Connected to Munic ipal Sewers and Septic Tank, Pour F lush Pit Toi let , dry bucket Toi let , Toi lets Connected to open drains and others types. Further the Survey Data also contains the Type of Defecat ion opted by HH with no In ‐house Toi let .
Out of total HHs with in ‐house toi let fac i l i ty such HHs were selected which fol low unhygienic mode of Disposal l ike dry bucket Toi lets , Pour Flush Pit Toi lets or Toi lets Connected to open drain and other unhygienic modes.
Out of total HHs with no in ‐house toi let fac i l i ty such HHs were selected which fol low unhygienic mode of Defecation Pract ice such as Private and Publ ic dry bucket Toi lets , Open Defect ion and other unhygienic modes.
These numbers of HHs represents poor level of infrastructure services in a s lum pocket . Therefore higher % of HHs fo l lowing unhygienic sewage disposal and Defecation pract ice was selected as one of the key indicator
3 Road/Street Condit ion
The Survey Data conta ins the in format ion at community level for kuchha and pucca road length.
Out of total road length, % defic iency of pucca roads was calculated and high % def ic iency of pucca roads in s lum pockets was selected as one of the key indicator.
4 Avai labi l i ty of Pucca Storm Water Drains
The Survey Data conta ins the in format ion at community level for pucca drain length.
Out of total road length, % def ic iency of pucca drains was calculated and high % def ic iency of pucca drains in s lum pockets was selected as one of the key indicator .
5 Frequency of Sol id Waste Col lect ion
The Survey Data conta ins the in format ion at community level for f requency of Waste Col lect ion.
The various level of Frequency of Waste Col lect ion was selected as one of the key indicator.
April 1, 2011
SLUM FREE CITY PLAN FOR GWALIOR CITY PREPARED BY GWALIOR MUNICIPAL CORPORATION
With Technical Support from. Mehta and Associates Indore,
Urban Planners 102
Revised Draft Final Report Volume I – Report and Appendices
Table 422 Surveyed Indicators for Infrastructure/Service Level
S N Surveyed Indicators
Inference
6 Street L ight ing The Survey Data conta ins the in format ion at community level for number of street l ights . The same was then compared with required number of street l ights as per norms and % def ic iency of street l ights was calcu lated.
High % defic iency of streetl ights in s lum pockets was selected as one of the key indicator.
7 Distance f rom Health Fac i l i t ies
The Survey Data conta ins the in format ion at community level for Avai labi l i ty of Health Fac i l i t ies near S lum Pockets with their distance.
The various lengths of Distances f rom Health Faci l i t ies were selected as one of the key indicator .
8 Avai labi l i ty of Pr imary Educat ion Faci l i ty
The Survey Data conta ins the in format ion at community level for Avai labi l i ty of Pr imary Educat ion Faci l i ty in the S lum Pockets .
The Avai labi l i ty or Non ‐avai labi l i ty of Primary Education Faci l i ty at Slum Pockets was selected as one of the key indicator.
Socio‐economic Condition Indicators
The Surveyed Indicators considered for Assessment of Socio‐economic Condition of Slums are
Table 423 Surveyed Indicators for Socioeconomic Condition
S N Surveyed Indicators
Inference
1 Occupat ion/Source of Income
The Survey Data conta ins distr ibut ion of Populat ion among var ious Occupat ion/Source of Income such as Salar ied Employee, Business, Un ‐organized Sector, Rent Pension and Non ‐Workers
Higher % of Non ‐workers represents unhealthy economic status of a community. Therefore this was selected as one of the key indicator
2 Monthly HH Income
The Survey Data contains distr ibut ion of HHs among var ious Monthly HH Income Categor ies.
Higher % of HHs with Monthly HHs Income less than 3000 INR represents unhealthy economic status of a community. Therefore this was selected as one of the key indicator
3 Highest Educat ion The Survey Data conta ins distr ibut ion of Populat ion among var ious Highest Educat ion Pursued
April 1, 2011
SLUM FREE CITY PLAN FOR GWALIOR CITY PREPARED BY GWALIOR MUNICIPAL CORPORATION
With Technical Support from. Mehta and Associates Indore,
Urban Planners 103
Revised Draft Final Report Volume I – Report and Appendices
Table 423 Surveyed Indicators for Socioeconomic Condition
S N Surveyed Indicators
Inference
Pursued
Higher % of I l l i terates represents unhealthy economic status of a community. Therefore this was selected as one of the key indicator
4 Caste The Survey Data contains distr ibut ion of HHs among var ious Caste Categor ies .
Higher % of ST/SC populat ion in any s lum pocket represents i ts unhealthy socio ‐economic status. Therefore this was selected as one of the key indicator
5 Type of Consumer Card
The Survey Data contains distr ibut ion of HHs among var ious Types of Consumer Card they hold such as BPL, APL and None.
Lower % of APL Card Holders in any s lum pocket represents i ts unhealthy socio ‐economic status. Therefore this was selected as one of the key indicator
6 HH Assets Owned The Survey Data contains distr ibut ion of HHs among var ious types of Vehic les Owned.
Lower % of HH with Motor ized Vehic les Ownership in any s lum pocket represents i ts unhealthy soc io ‐economic status. Therefore this was selected as one of the key indicator
7 HH Assets Owned The Survey Data contains distr ibut ion of HHs among var ious types of Consumer Electronics/E lectr ica ls Owned.
Lower % of HH with Consumer Electronics and Electr icals Ownership in any s lum pocket represents i ts unhealthy soc io ‐economic status. Therefore this was selected as one of the key indicator
8 Source of L ight ing The Survey Data contains distr ibut ion of HHs among var ious source of HH L ight ing.
Higher % of HH with Kerosene/Firewood, source of L ight ing in any s lum pocket represents i ts unhealthy soc io ‐economic status. Therefore this was selected as one of the key indicator
3.9.3 Range Code and Weightage for Key Indicators
The Identified Key Indicators were provided with Range code as per range values and weightage as per the impact on each condition category. The Range Code and Weightage for Housing, Infrastructure and Socio‐economic Condition were presented in Tables below
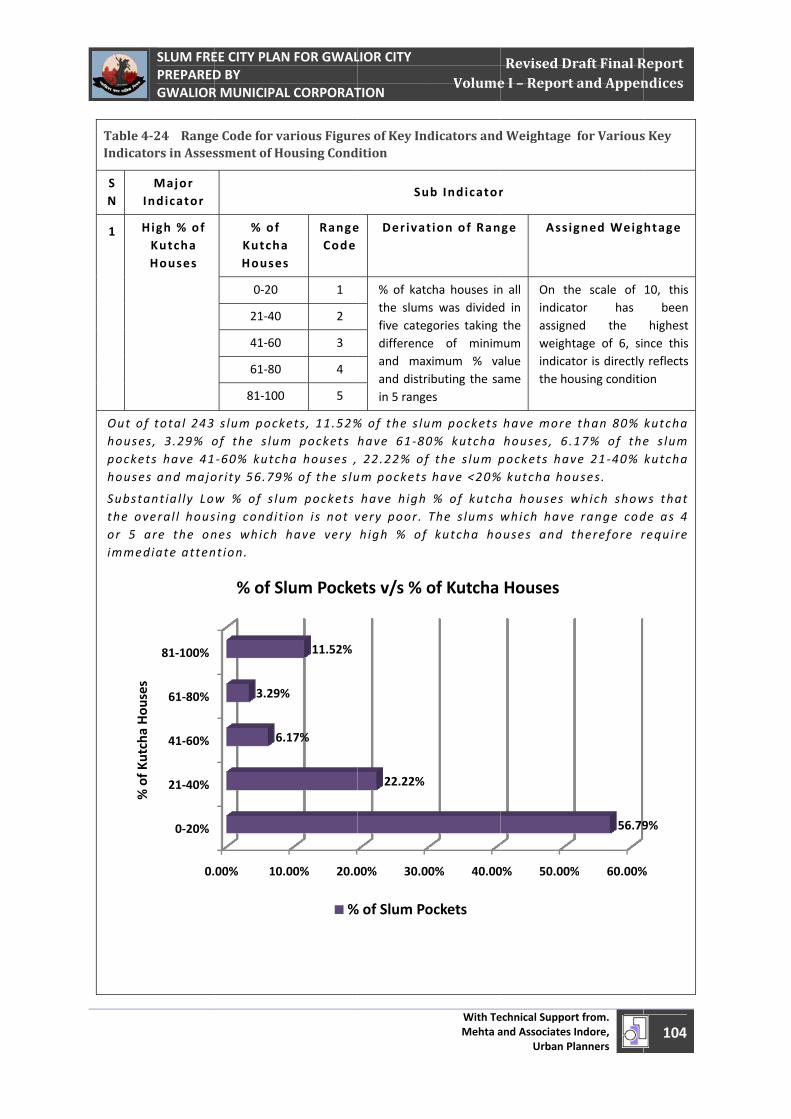
April 1, 2011
Table 4Indicat
S N
1 H
Out ofhousepockehouse
Substthe oor 5 imme
%of
Kutcha
Hou
ses
SLUM FREPREPAREDGWALIOR
424 Rangetors in Asses
Major Indicator
High % of Kutcha Houses
f tota l 243es, 3.29% oets have 41es and majo
ant ia l ly Loveral l housare the ondiate atten
0.
0‐20%
21‐40%
41‐60%
61‐80%
81‐100%
% of K
utcha Hou
ses
EE CITY PLAND BY R MUNICIPAL
e Code for vassment of Ho
% of KutchaHouses
0‐20
21‐40
41‐60
61‐80
81‐100
s lum pockof the s lum‐60% kutchor ity 56.79%
w % of s lus ing condit ines which nt ion.
00% 10.
6.
3.29%
% of Sl
N FOR GWAL L CORPORAT
arious Figurousing Cond
a s
RangeCode
1
2
3
4
5
ets , 11.52%m pockets ha houses ,% of the s lu
m pockets ion i s not vhave very
00% 20.0
17%
%
11.52%
lum Pocke
%
LIOR CITY TION
es of Key Inddition
Su
e Derivat
% of katcthe slumsfive categdifferenceand maxand distriin 5 range
% of the s luhave 61 ‐80 22.22% ofum pockets
have high very poor. high % of
00% 30.00
22.22%
ets v/s % o
% of Slum Po
With TeMehta a
Volume
dicators and
b Indicator
t ion of Ran
cha houses ins was dividedgories taking e of minimximum % vaibuting the saes
um pockets 0% kutcha f the s lum phave <20%
% of kutchThe s lums kutcha ho
0% 40.00
of Kutcha
ockets
echnical Supporand Associates
Urban P
Revised De I – Report
d Weightage
r
ge Assi
n all d in the
mum alue ame
On thindicatassignweightindicatthe ho
have morehouses, 6.pockets hav% kutcha ho
ha houses wwhich haveouses and t
0% 50.00%
Houses
rt from. Indore,
Planners
raft Final Rt and Appen
for Various
gned Weig
he scale of tor has ed the tage of 6, sitor is directlyousing conditi
than 80% 17% of theve 21 ‐40% uses .
which showe range codtherefore r
% 60.00%
56.79
104
Report ndices
s Key
htage
10, this been
highest nce this y reflects on
kutcha e s lum kutcha
ws that de as 4 require
%
9%
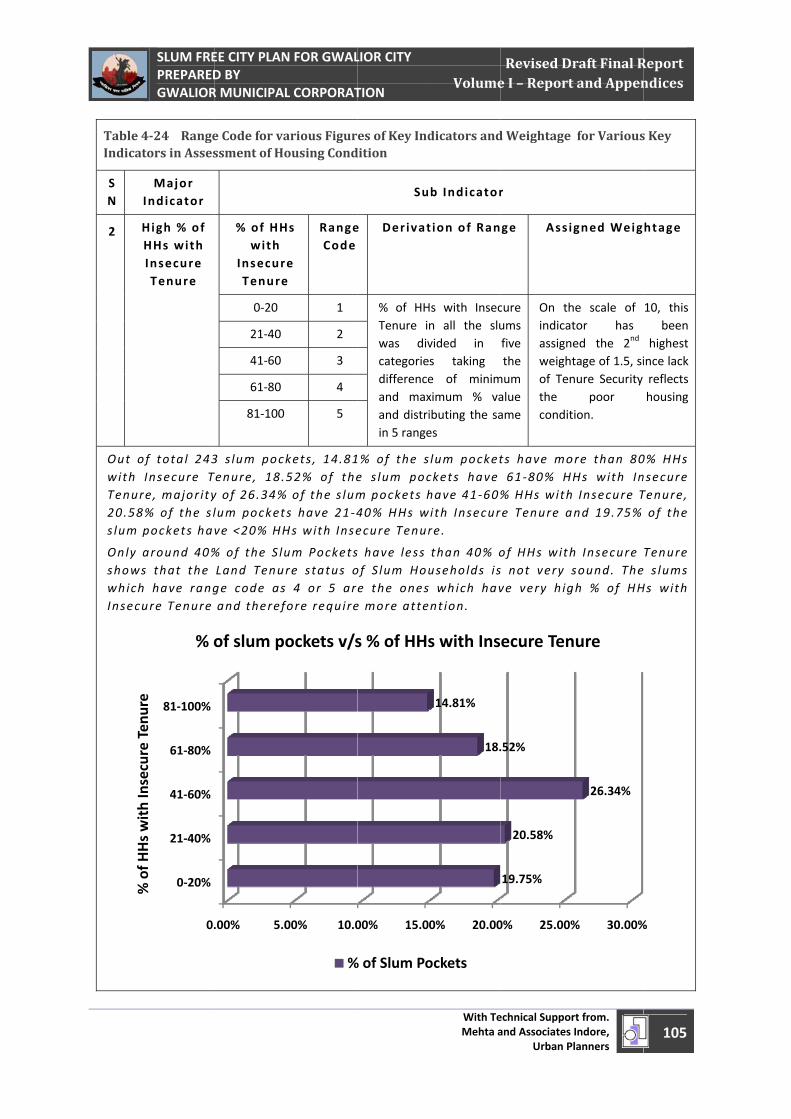
April 1, 2011
Table 4Indicat
S N
2 H
Out owith Tenur20.58s lum p
Only ashowswhichInsecu
%of
HHswithInsecure
Tenu
re
SLUM FREPREPAREDGWALIOR
424 Rangetors in Asses
Major Indicator
High % of HHs with Insecure Tenure
of tota l 243Insecure Tre, major ity% of the s lpockets ha
around 40%s that the h have rangure Tenure
0.
0‐20%
21‐40%
41‐60%
61‐80%
81‐100%
% of H
Hs with Insecure Ten
ure
% o
EE CITY PLAND BY R MUNICIPAL
e Code for vassment of Ho
% of HHwith
InsecurTenure
0‐20
21‐40
41‐60
61‐80
81‐100
3 s lum pockTenure, 18.y of 26.34%lum pocketve <20% HH
% of the S luLand Tenurge code asand theref
.00% 5.0
of slum po
N FOR GWAL L CORPORAT
arious Figurousing Cond
Hs
e e
RangeCode
1
2
3
4
5
kets , 14.8152% of the
% of the s lums have 21 ‐4Hs with Inse
um Pocketsre status o 4 or 5 arfore require
00% 10.0
ockets v/s
%
LIOR CITY TION
es of Key Inddition
Su
e Derivat
% of HHTenure iwas divcategoriedifferenceand maxand distriin 5 range
% of the se s lum pocm pockets h40% HHs wecure Tenur
have less of Slum Houe the onese more atte
00% 15.0
s % of HHs
% of Slum Po
With TeMehta a
Volume
dicators and
b Indicator
t ion of Ran
Hs with Insecn all the sluvided in s taking e of minimximum % vaibuting the saes
lum pocketckets have have 41 ‐60%ith Insecurre .
than 40% ouseholds i s which havnt ion.
0% 20.00
18.
14.81%
s with Ins
ockets
echnical Supporand Associates
Urban P
Revised De I – Report
d Weightage
r
ge Assi
cure ums five the
mum alue ame
On thindicatassignweightof Tenthe condit
ts have mo61 ‐80% H
% HHs withre Tenure a
of HHs withs not very sve very hig
0% 25.00%
19.75%
20.58%
.52%
ecure Ten
rt from. Indore,
Planners
raft Final Rt and Appen
for Various
gned Weig
he scale of tor has ed the 2nd tage of 1.5, sinure Security
poor tion.
ore than 80Hs with In Insecure Tnd 19.75%
h Insecure sound. Thegh % of HH
% 30.00%
26.34%
nure
105
Report ndices
s Key
htage
10, this been
highest ince lack reflects housing
0% HHs nsecure Tenure, of the
Tenure s lums
Hs with
%
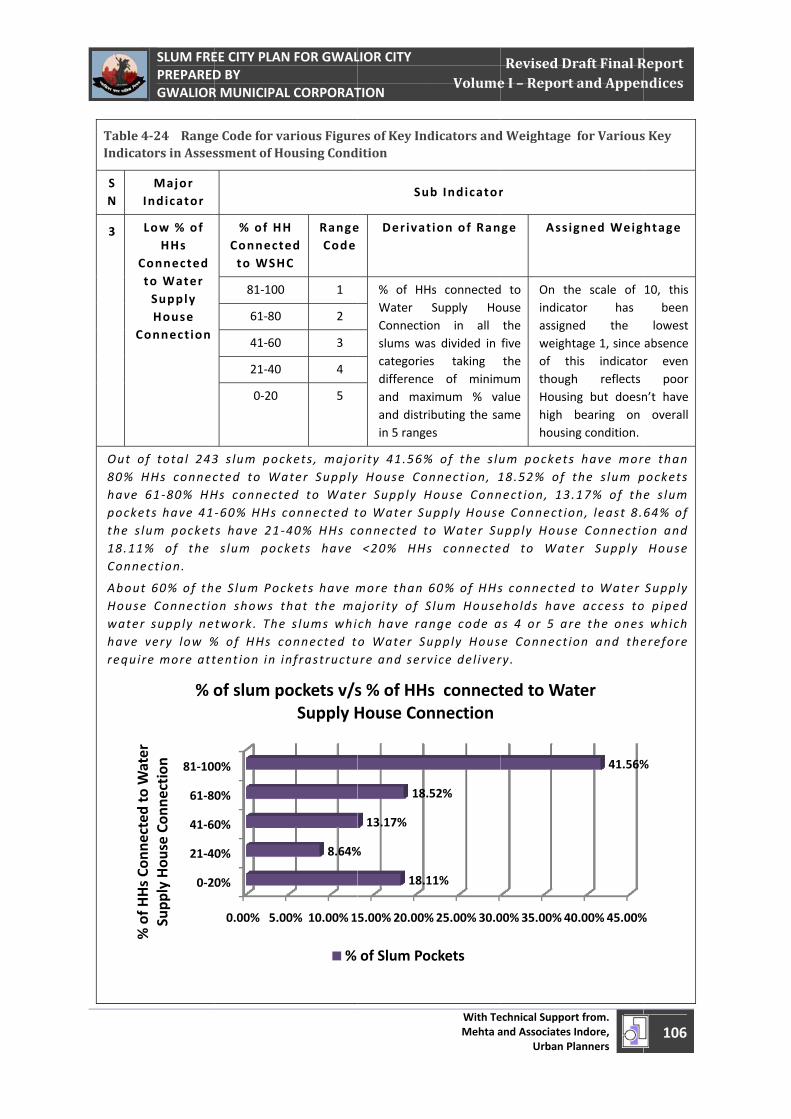
April 1, 2011
%of
HHsCo
nnectedto
Water
Table 4Indicat
S N
3
C
C
Out o80% Hhave pockethe s l18.11Conne
AboutHousewaterhave requir
SLUM FREPREPAREDGWALIOR
0‐2
21‐4
41‐6
61‐8
81‐10
% of H
Hs Co
nnected to W
ater
Supp
ly Hou
se Con
nection
% o
424 Rangetors in Asses
Major Indicator
Low % of HHs
Connected to Water Supply House
onnection
of total 243HHs connec61 ‐80% HH
ets have 41lum pocket% of the ect ion.
t 60% of the Connect ior supply nevery low %re more att
EE CITY PLAND BY R MUNICIPAL
0.00% 5.0
0%
0%
0%
0%
0%
of slum po
e Code for vassment of Ho
% of HHConnecteto WSH
81‐100
61‐80
41‐60
21‐40
0‐20
3 s lum poccted to WaHs connecte‐60% HHs cs have 21 ‐s lum pock
e S lum Pocon shows ttwork. The% of HHs cotent ion in in
N FOR GWAL L CORPORAT
0% 10.00%1
8.64%
ockets v/sSupply H
%
arious Figurousing Cond
H ed C
RangeCode
1
2
3
4
5
kets, majorater Supplyed to Wateconnected t40% HHs ckets have
kets have mhat the ma s lums whionnected tnfrastructu
LIOR CITY TION
5.00% 20.00%
18.1
%
13.17%
18.
s % of HHsHouse Con
of Slum Po
es of Key Inddition
Su
e Derivat
% of HHWater Connectioslums wacategoriedifferenceand maxand distriin 5 range
r i ty 41.56%y House Coer Supply Hto Water Suonnected t<20% HHs
more than ajor i ty of Sch have rao Water Suure and serv
With TeMehta a
Volume
%25.00% 30.0
11%
52%
s connectnnection
ockets
dicators and
b Indicator
t ion of Ran
Hs connectedSupply Hoon in all as divided in s taking e of minimximum % vaibuting the saes
% of the s lunnect ion, 1House Connupply Houseo Water Sus connecte
60% of HHsSlum Housenge code aupply Housvice del iver
echnical Supporand Associates
Urban P
Revised De I – Report
00%35.00% 40
ted to Wa
d Weightage
r
ge Assi
d to ouse the five the
mum alue ame
On thindicatassignweightof ththoughHousinhigh housin
um pockets18.52% of nect ion, 13.e Connect ioupply Houseed to Wate
s connectedeholds haveas 4 or 5 are Connect iry .
rt from. Indore,
Planners
raft Final Rt and Appen
0.00% 45.00%
41.56%
ater
for Various
gned Weig
he scale of tor has ed the tage 1, since his indicatoh reflects ng but doesnbearing on ng condition.
s have morthe s lum p.17% of thon, least 8.e Connect ioer Supply
d to Water e access tore the oneson and the
106
Report ndices
%
%
s Key
htage
10, this been
lowest absence r even
poor n’t have overall
re than pockets e s lum 64% of on and House
Supply o piped which erefore
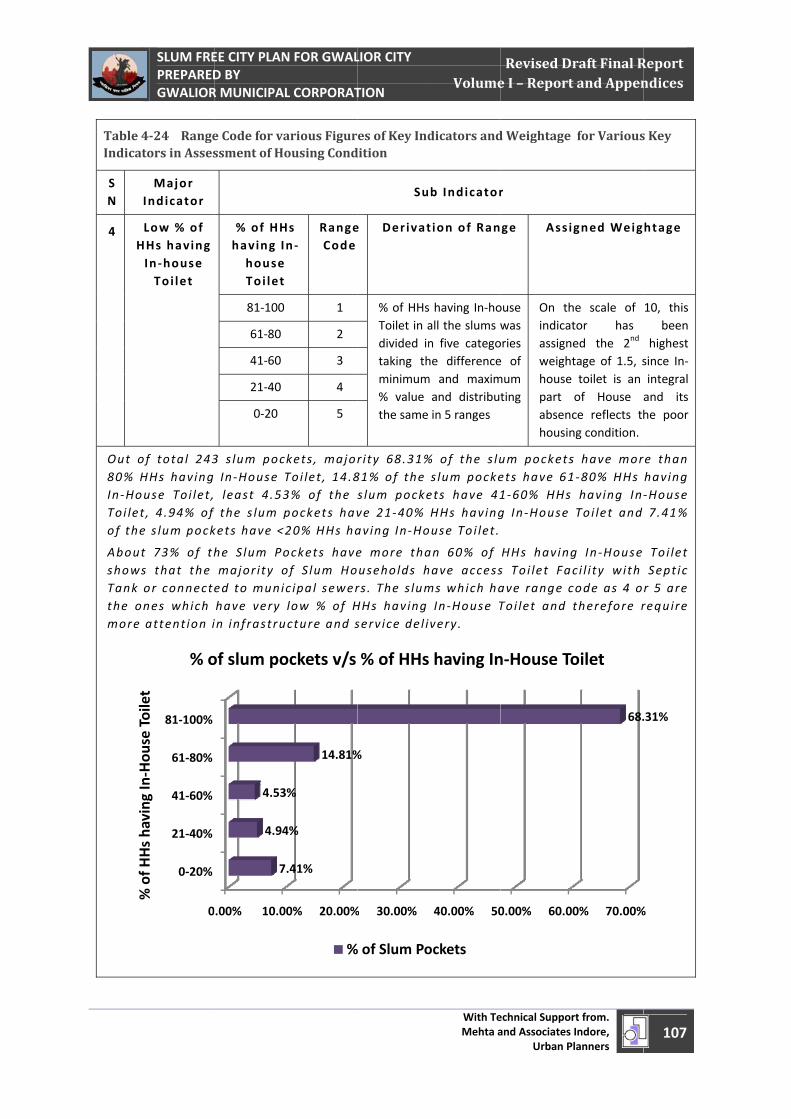
April 1, 2011
Table 4Indicat
S N
4 H
Out o80% HIn ‐HoToi letof the
AboutshowsTank the omore
%of
HHsha
ving
InHou
seToilet
SLUM FREPREPAREDGWALIOR
424 Rangetors in Asses
Major Indicator
Low % of HHs having In ‐house Toi let
of total 243HHs havinguse Toi let ,t , 4.94% of e s lum pock
t 73% of ths that the or connectenes which attent ion i
0
0‐20%
21‐40%
41‐60%
61‐80%
81‐100%
% of H
Hs ha
ving
In‐Hou
se Toilet
% o
EE CITY PLAND BY R MUNICIPAL
e Code for vassment of Ho
% of HHhaving I
house Toi let
81‐100
61‐80
41‐60
21‐40
0‐20
3 s lum poc In ‐House T least 4.53the s lum p
kets have <2
he S lum Pomajor ity oed to munichave very in infrastru
.00% 10.0
7
4.94
4.53
of slum po
N FOR GWAL L CORPORAT
arious Figurousing Cond
Hs n ‐
RangeCode
1
2
3
4
5
kets, majorToi let , 14.83% of the spockets hav20% HHs ha
ockets haveof S lum Hocipal sewerlow % of Hcture and s
0% 20.00%
.41%
4%
%
14.81%
ockets v/s
%
LIOR CITY TION
es of Key Inddition
Su
e Derivat
% of HHsToilet in adivided intaking thminimum% value the same
r i ty 68.31%81% of the s lum pockeve 21 ‐40% aving In ‐Ho
e more thauseholds hrs . The s lumHHs having serv ice del i
% 30.00%
%
% of HHs
% of Slum Po
With TeMehta a
Volume
dicators and
b Indicator
t ion of Ran
having In‐hoall the slums wn five categohe differencem and maximand distributin 5 ranges
% of the s lus lum pockeets have 41HHs havinguse Toi let .
an 60% of have accessms which haIn ‐House Tvery.
40.00% 50
having In
ockets
echnical Supporand Associates
Urban P
Revised De I – Report
d Weightage
r
ge Assi
ouse was ories e of mum ting
On thindicatassignweighthouse part absenchousin
um pocketsets have 611 ‐60% HHsg In ‐House
HHs havings Toi let Faave range cToi let and
0.00% 60.0
n‐House To
rt from. Indore,
Planners
raft Final Rt and Appen
for Various
gned Weig
he scale of tor has ed the 2nd tage of 1.5, s toilet is an of House ce reflects thng condition.
s have mor1 ‐80% HHs having InToi let and
g In ‐Houseci l i ty with code as 4 otherefore r
0% 70.00%
68.
oilet
107
Report ndices
s Key
htage
10, this been
highest since In‐integral and its he poor
re than having ‐House 7.41%
Toi let Sept ic r 5 are require
%
.31%
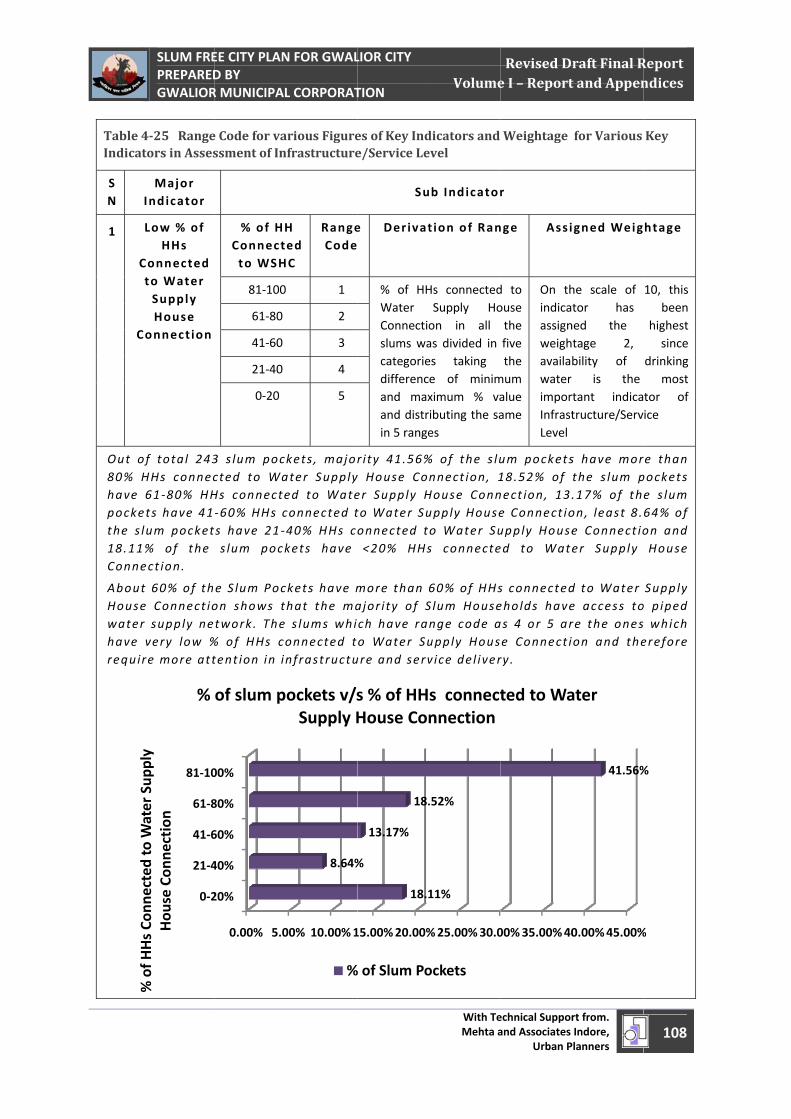
April 1, 2011
Table 4Indicat
S N
1
C
C
Out o80% Hhave pockethe s l18.11Conne
AboutHousewaterhave requir
%fH
HC
tdt
Wt
Sl
SLUM FREPREPAREDGWALIOR
425 Rangetors in Asses
Major Indicator
Low % of HHs
Connected to Water Supply House
Connection
of total 243HHs connec61 ‐80% HH
ets have 41lum pocket% of the ect ion.
t 60% of the Connect ior supply nevery low %re more att
0‐2
21‐4
41‐6
61‐8
81‐10
% of H
Hs Co
nnected to W
ater Sup
ply
Hou
se Con
nection
%
EE CITY PLAND BY R MUNICIPAL
e Code for vassment of In
% of HHConnectto WSH
81‐100
61‐80
41‐60
21‐40
0‐20
3 s lum poccted to WaHs connecte‐60% HHs cs have 21 ‐s lum pock
e S lum Pocon shows ttwork. The% of HHs cotent ion in in
0.00% 5.0
20%
40%
60%
80%
00%
of slum p
N FOR GWAL L CORPORAT
arious Figurenfrastructure
H ed C
RangeCode
1
2
3
4
5
kets, majorater Supplyed to Wateconnected t40% HHs ckets have
kets have mhat the ma s lums whionnected tnfrastructu
00% 10.00%1
8.64%
ockets v/sSupply H
%
LIOR CITY TION
es of Key Inde/Service Le
Su
e
Derivat
% of HHWater Connectioslums wacategoriedifferencand maxand distrin 5 range
r i ty 41.56%y House Coer Supply Hto Water Suonnected t<20% HHs
more than ajor i ty of Sch have rao Water Suure and serv
15.00%20.00%
18.1
%
13.17%
18.
s % of HHHouse Con
% of Slum Po
With TeMehta a
Volume
dicators and evel
b Indicator
t ion of Ran
Hs connectedSupply Hoon in all as divided in es taking e of minimximum % vaibuting the saes
% of the s lunnect ion, 1House Connupply Houseo Water Sus connecte
60% of HHsSlum Housenge code aupply Housvice del iver
%25.00%30.0
11%
.52%
s connectnnection
ockets
echnical Supporand Associates
Urban P
Revised De I – Report
Weightage
r
nge Assi
d to ouse the five the
mum alue ame
On thindicaassignweighavailawater imporInfrastLevel
um pockets18.52% of nect ion, 13.e Connect ioupply Houseed to Wate
s connectedeholds haveas 4 or 5 are Connect iry .
00%35.00%40
ted to Wa
rt from. Indore,
Planners
raft Final Rt and Appen
for Various
gned Weig
he scale of tor has ned the tage 2, bility of
is the rtant indicatructure/Serv
s have morthe s lum p.17% of thon, least 8.e Connect ioer Supply
d to Water e access tore the oneson and the
0.00%45.00%
41.56%
ater
108
Report ndices
Key
htage
10, this been
highest since
drinking most
tor of ice
re than pockets e s lum 64% of on and House
Supply o piped which erefore
%
%
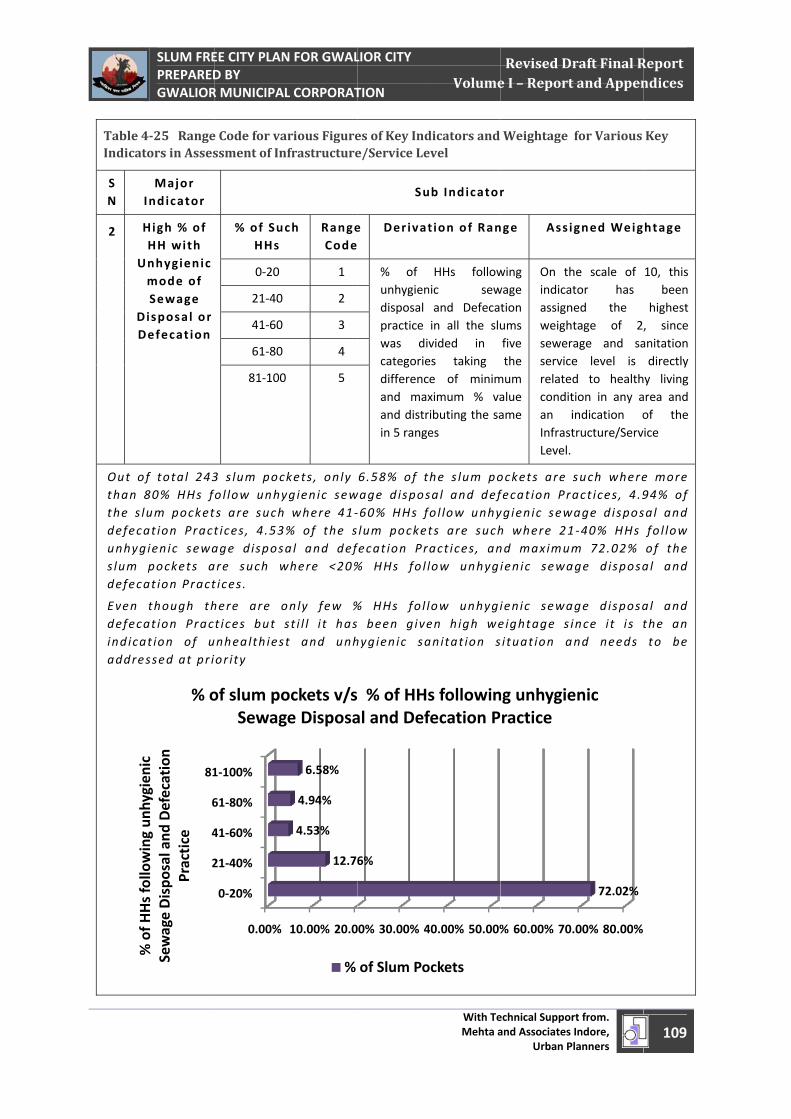
April 1, 2011
Table 4Indicat
S N
2
U
DD
Out othan the s ldefecunhygs lum defec
Even defecindicaaddre
%of
HHsfollo
wingun
hygien
ic
SLUM FREPREPAREDGWALIOR
425 Rangetors in Asses
Major Indicator
High % of HH with
Unhygienic mode of Sewage
Disposal or Defecat ion
of total 24380% HHs flum pocketat ion Practg ienic sewapockets aat ion Pract
though that ion Pracat ion of uessed at pr i
2
4
6
81
% of H
Hs follo
wing un
hygien
ic
Sewage Dispo
sal and
Defecation
Practice
% o
EE CITY PLAND BY R MUNICIPAL
e Code for vassment of In
% of SucHHs
0‐20
21‐40
41‐60
61‐80
81‐100
3 s lum pocol low unhyts are such t ices , 4.53%age disposaare such wtices.
here are ot ices but snhealth iestor ity
0.00%
0‐20%
21‐40%
41‐60%
61‐80%
1‐100%
of slum poSewag
N FOR GWAL L CORPORAT
arious Figurenfrastructure
ch RangeCode
1
2
3
4
5
kets, only ygienic sewwhere 41 ‐% of the sa l and defwhere <20%
only few %sti l l i t hast and unh
10.00% 20.0
12.76
4.53%
4.94%
6.58%
ockets v/sge Disposa
%
LIOR CITY TION
es of Key Inde/Service Le
Su
e
Derivat
% of unhygiendisposal practice was divcategoriedifferencand maxand distrin 5 range
6.58% of twage dispos‐60% HHs flum pocketfecat ion Pr% HHs fo l l
% HHs fo l l been givehygienic sa
00% 30.00% 4
6%
% of HHsal and Def
of Slum Po
With TeMehta a
Volume
dicators and evel
b Indicator
t ion of Ran
HHs follownic sewand Defecain all the sluvided in es taking e of minimximum % vaibuting the saes
he s lum posal and deffo l low unhyts are suchact ices, anlow unhygi
low unhygien high weanitat ion s
40.00% 50.00%
s followinfecation P
ockets
echnical Supporand Associates
Urban P
Revised De I – Report
Weightage
r
nge Assi
wing wage tion ums five the
mum alue ame
On thindicaassignweighsewerservicerelateconditan iInfrastLevel.
ockets are fecat ion Prygienic sewh where 21nd maximumienic sewa
ienic sewaeightage s ii tuat ion a
% 60.00% 70
ng unhygieractice
rt from. Indore,
Planners
raft Final Rt and Appen
for Various
gned Weig
he scale of tor has ned the tage of 2rage and sae level is d to healthtion in any aindication otructure/Serv
such whereact ices, 4.9
wage dispos1 ‐40% HHs m 72.02% age disposa
age disposaince i t i s tnd needs
.00% 80.00%
72.02%
enic
109
Report ndices
Key
htage
10, this been
highest , since anitation directly y living area and of the ice
e more 94% of sal and fo l low of the al and
al and the an to be
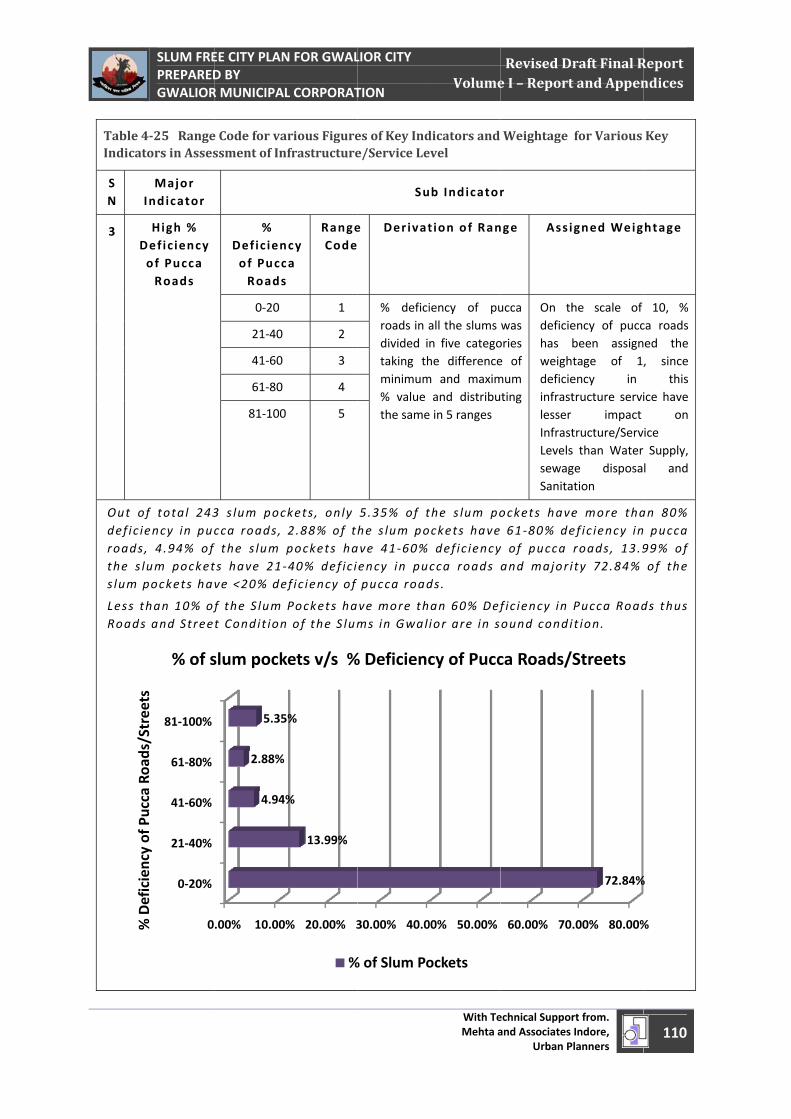
April 1, 2011
Table 4Indicat
S N
3 D
Out odef ic iroadsthe s ls lum p
Less tRoads
%Deficiencyof
PuccaRo
ads/Streets
SLUM FREPREPAREDGWALIOR
425 Rangetors in Asses
Major Indicator
High % Defic iency of Pucca Roads
of total 243iency in puc, 4.94% oflum pocketpockets ha
than 10% ofs and Stree
0
0‐20%
21‐40%
41‐60%
61‐80%
81‐100%
% Deficiency of Pucca Roa
ds/Streets
% of s
EE CITY PLAND BY R MUNICIPAL
e Code for vassment of In
% Defic ienof PuccRoads
0‐20
21‐40
41‐60
61‐80
81‐100
3 s lum poccca roads, f the s lum ts have 21 ‐ve <20% de
f the S lum t Condit ion
.00% 10.00%
4.94%
2.88%
5.35
slum pock
N FOR GWAL L CORPORAT
arious Figurenfrastructure
cy ca
RangeCode
1
2
3
4
5
kets, only 2.88% of tpockets ha‐40% def ic ief ic iency of
Pockets han of the S lum
% 20.00% 3
13.99%
%
5%
kets v/s %
%
LIOR CITY TION
es of Key Inde/Service Le
Su
e
Derivat
% deficiroads in adivided itaking thminimum% value the same
5.35% of the s lum poave 41 ‐60%ency in pupucca road
ve more thms in Gwal
30.00% 40.0
% Deficienc
% of Slum Po
With TeMehta a
Volume
dicators and evel
b Indicator
t ion of Ran
iency of puall the slums n five categohe differencem and maximand distribu
e in 5 ranges
the s lum pockets have def ic iencycca roads ds.
an 60% Defior are in s
00% 50.00%
cy of Pucc
ockets
echnical Supporand Associates
Urban P
Revised De I – Report
Weightage
r
nge Assi
ucca was ories e of mum ting
On thdeficiehas weighdeficieinfrastlesser InfrastLevelssewagSanita
ockets have 61 ‐80% dey of pucca and major i
f ic iency in ound condi
60.00% 70
ca Roads/
rt from. Indore,
Planners
raft Final Rt and Appen
for Various
gned Weig
he scale of ency of puccbeen assigntage of 1ency in tructure servi
impact tructure/Servs than Water ge disposaation
e more thaef ic iency inroads, 13.9ity 72.84%
Pucca Roadit ion.
.00% 80.00%
72.84%
Streets
110
Report ndices
Key
htage
10, % ca roads ed the , since
this ice have
on ice Supply, l and
an 80% pucca 99% of of the
ds thus
%
%
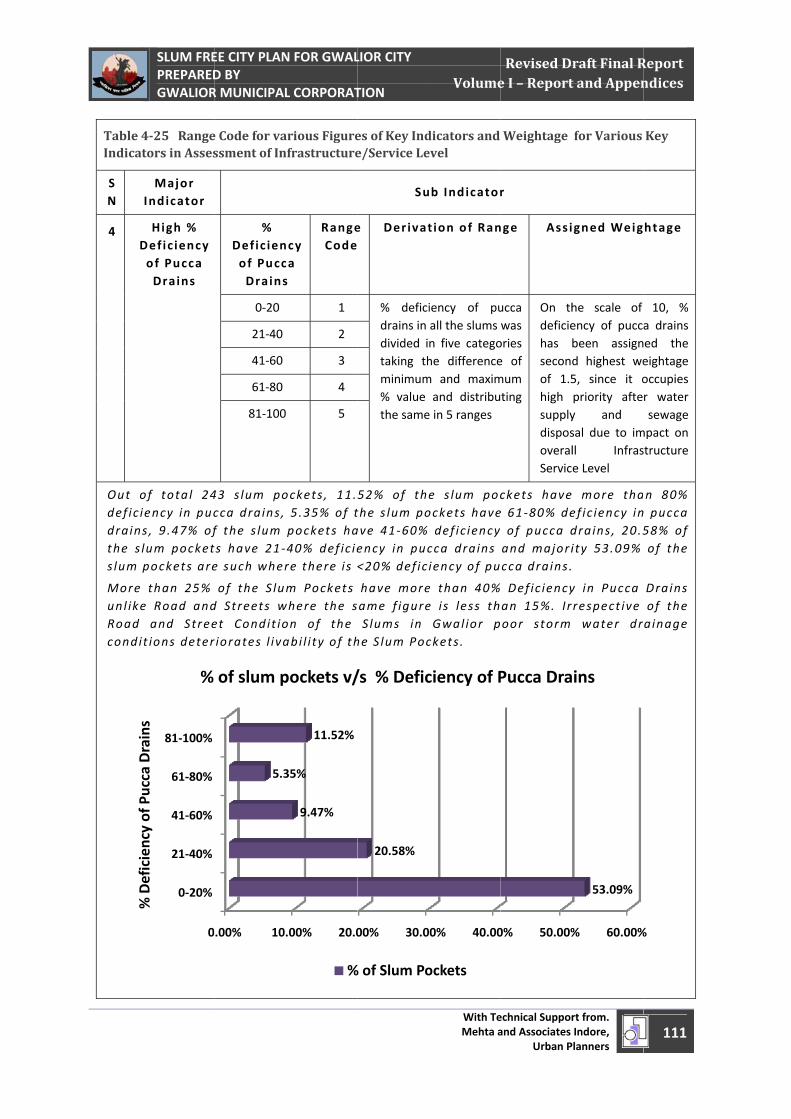
April 1, 2011
Table 4Indicat
S N
4 D
Out odef ic idrainsthe s ls lum p
More unl ikeRoad condi
%Deficiencyof
PuccaDrains
SLUM FREPREPAREDGWALIOR
425 Rangetors in Asses
Major Indicator
High % Defic iency of Pucca Drains
of tota l 24iency in pucs , 9.47% oflum pocketpockets are
than 25% e Road andand Stree
t ions deter
0
0‐20%
21‐40%
41‐60%
61‐80%
81‐100%
% Deficiency of Pucca Drains
%
EE CITY PLAND BY R MUNICIPAL
e Code for vassment of In
% Defic ienof PuccDrains
0‐20
21‐40
41‐60
61‐80
81‐100
43 s lum pocca drains, f the s lum s have 21 ‐e such wher
of the S lud Streets wet Condit ior iorates l iva
.00% 10.
5.3
of slum p
N FOR GWAL L CORPORAT
arious Figurenfrastructure
cy ca s
RangeCode
1
2
3
4
5
ockets , 11.5.35% of tpockets ha40% def ic iere there i s <
m Pockets where the son of the abi l i ty of th
.00% 20.0
9.47%
35%
11.52%
pockets v/
%
LIOR CITY TION
es of Key Inde/Service Le
Su
e
Derivat
% deficidrains in divided itaking thminimum% value the same
52% of thethe s lum poave 41 ‐60% ency in puc<20% def ic i
have moreame f igureSlums in
he S lum Poc
00% 30.0
20.58%
/s % Defic
% of Slum Po
With TeMehta a
Volume
dicators and evel
b Indicator
t ion of Ran
iency of puall the slums n five categohe differencem and maximand distribu
e in 5 ranges
e s lum pocockets havedef ic iency
cca drains iency of pu
e than 40%e i s less thGwal ior p
ckets.
00% 40.00
ciency of P
ockets
echnical Supporand Associates
Urban P
Revised De I – Report
Weightage
r
nge Assi
ucca was ories e of mum ting
On thdeficiehas seconof 1.5high supplydisposoveralServic
ckets havee 61 ‐80% de of pucca dand major icca drains .
Defic iencyan 15%. I roor storm
0% 50.00%
Pucca Dra
rt from. Indore,
Planners
raft Final Rt and Appen
for Various
gned Weig
he scale of ency of puccbeen assignd highest we5, since it opriority aftey and sal due to imll Infrase Level
more thaef ic iency indrains , 20.5ity 53.09%
y in Pucca respect ive water dr
% 60.00%
53.09%
ins
111
Report ndices
Key
htage
10, % a drains ed the eightage occupies r water sewage
mpact on structure
n 80% pucca 58% of of the
Drains of the ainage
%
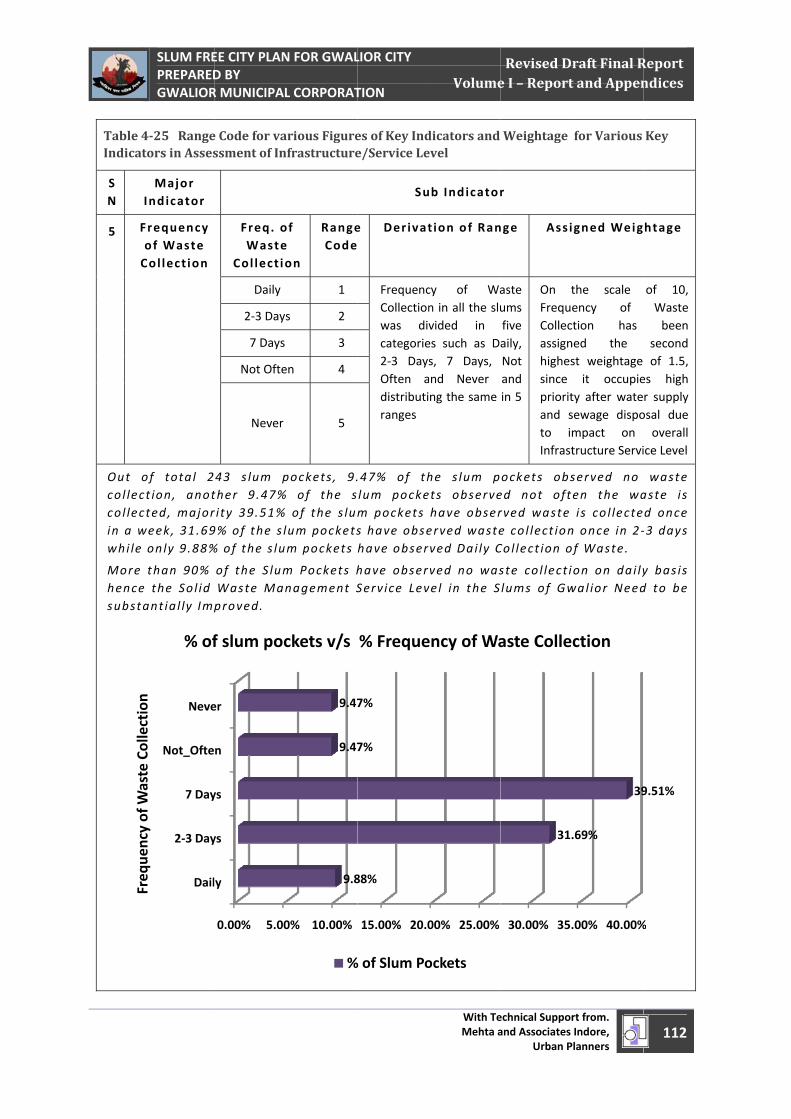
April 1, 2011
Table 4Indicat
S N
5 F
C
Out ocol leccol lecin a wwhi le
More hencesubsta
Freq
uencyof
Waste
Collection
SLUM FREPREPAREDGWALIOR
425 Rangetors in Asses
Major Indicator
Frequency of Waste Col lect ion
of tota l 2ct ion, anotcted, majorweek, 31.69only 9.88%
than 90% e the Sol id ant ia l ly Imp
Dail
2‐3 Day
7 Day
Not_Ofte
Neve
Freq
uency of W
aste Collection
% of
EE CITY PLAND BY R MUNICIPAL
e Code for vassment of In
Freq. oWaste
Col lect io
Daily
2‐3 Days
7 Days
Not Ofte
Never
43 s lum pther 9.47%rity 39.51%9% of the s l% of the s lu
of the S lumWaste Manproved.
0.00% 5.00
y
ys
ys
n
er
f slum poc
N FOR GWAL L CORPORAT
arious Figurenfrastructure
of e on
RangeCode
1
s 2
3
en 4
5
pockets, 9.% of the s of the s lumlum pocketsm pockets
m Pockets hnagement S
0% 10.00%
9.8
9.47
9.47
ckets v/s
%
LIOR CITY TION
es of Key Inde/Service Le
Su
e
Derivat
FrequencCollectionwas divcategorie2‐3 DaysOften adistributiranges
47% of thlum pockem pockets s have obsehave obser
have obserService Lev
15.00% 20.0
88%
7%
7%
% Freque
% of Slum Po
With TeMehta a
Volume
dicators and evel
b Indicator
t ion of Ran
cy of Wan in all the sluvided in es such as Ds, 7 Days, and Never ng the same
he s lum pts observehave obsererved wasteved Dai ly C
ved no wasvel in the S
00% 25.00%
ency of Wa
ockets
echnical Supporand Associates
Urban P
Revised De I – Report
Weightage
r
nge Assi
aste ums five aily, Not and in 5
On tFrequCollecassignhighessince prioritand sto imInfrast
ockets obsed not oftrved waste e col lect ionCol lect ion o
ste col lect ilums of Gw
30.00% 35.
31.
aste Colle
rt from. Indore,
Planners
raft Final Rt and Appen
for Various
gned Weig
the scale ency of ction has ned the st weightage it occupie
ty after watesewage dispompact on tructure Servi
served no en the wais col lecte
n once in 2 ‐f Waste.
on on dai lywal ior Need
.00% 40.00%
.69%
39
ction
112
Report ndices
Key
htage
of 10, Waste been
second of 1.5,
es high r supply osal due overall
ice Level
waste aste i s d once ‐3 days
y bas is d to be
%
9.51%
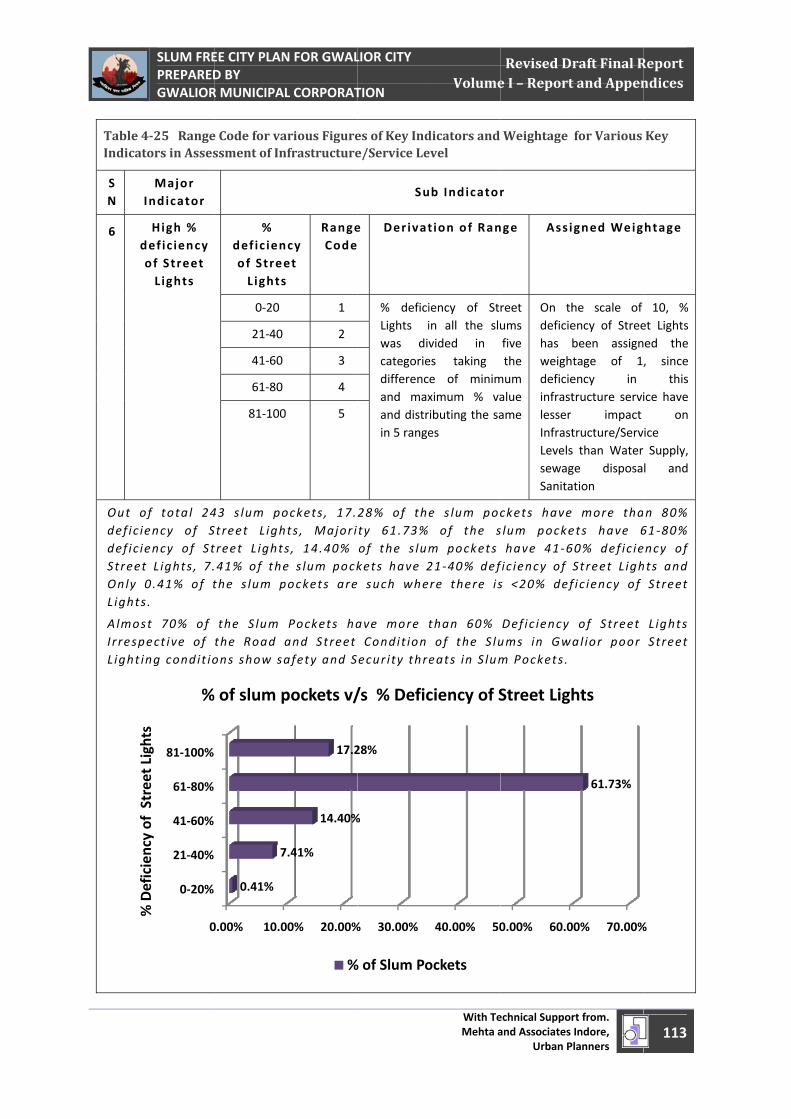
April 1, 2011
Table 4Indicat
S N
6 d
Out odef ic idef ic iStreetOnly L ights
AlmosIrrespLight i
%D
fii
fSt
tLiht
SLUM FREPREPAREDGWALIOR
425 Rangetors in Asses
Major Indicator
High % def ic iency of Street L ights
of tota l 24iency of Siency of Stt L ights , 7.0.41% of ts .
st 70% of pect ive of ing condit io
0
0‐20%
21‐40%
41‐60%
61‐80%
81‐100%
% Deficiency of Street Lights
%
EE CITY PLAND BY R MUNICIPAL
e Code for vassment of In
% def ic ienof StreeLights
0‐20
21‐40
41‐60
61‐80
81‐100
43 s lum poStreet Lightreet L ights41% of thethe s lum p
the S lum the Road aons show sa
0.00% 10.0
0.41%
7
of slum p
N FOR GWAL L CORPORAT
arious Figurenfrastructure
cy et
RangeCode
1
2
3
4
5
ockets , 17.ts , Major is , 14.40% e s lum pockockets are
Pockets haand Street afety and S
00% 20.00%
7.41%
14.40%
17.2
pockets v/
%
LIOR CITY TION
es of Key Inde/Service Le
Su
e
Derivat
% deficiLights iwas divcategoriedifferencand maxand distrin 5 range
28% of thety 61.73%of the s lumkets have 2 such whe
ave more tCondit ion ecur i ty thre
% 30.00%
%
28%
/s % Defic
% of Slum Po
With TeMehta a
Volume
dicators and evel
b Indicator
t ion of Ran
iency of Stin all the sluvided in es taking e of minimximum % vaibuting the saes
e s lum poc of the sm pockets 21 ‐40% defre there i s
than 60% of the Slu
eats in S lum
40.00% 50
ciency of S
ockets
echnical Supporand Associates
Urban P
Revised De I – Report
Weightage
r
nge Assi
reet ums five the
mum alue ame
On thdeficiehas weighdeficieinfrastlesser InfrastLevelssewagSanita
ckets haves lum pockehave 41 ‐6
f ic iency of s <20% def
Def ic iency ums in Gwm Pockets .
0.00% 60.0
Street Ligh
rt from. Indore,
Planners
raft Final Rt and Appen
for Various
gned Weig
he scale of ency of Streebeen assigntage of 1ency in tructure servi
impact tructure/Servs than Water ge disposaation
more thaets have 660% def ic ieStreet L ighf ic iency of
of Street al ior poor
00% 70.00%
61.73%
hts
113
Report ndices
Key
htage
10, % et Lights ed the , since
this ice have
on ice Supply, l and
n 80% 61 ‐80% ncy of
hts and Street
L ights Street
%
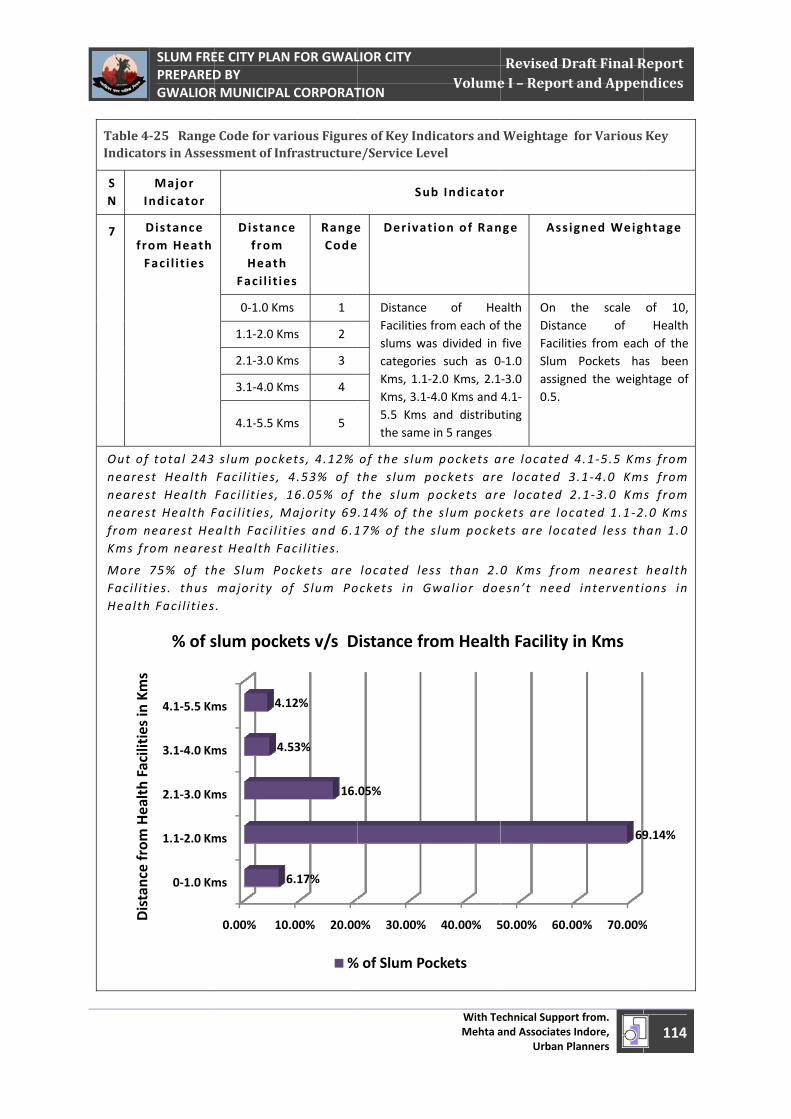
April 1, 2011
Table 4Indicat
S N
7 f r
Out ofnearenearenearefrom Kms f
More Faci l iHealt
Distancefrom
HealthFacilitiesinKm
s
SLUM FREPREPAREDGWALIOR
425 Rangetors in Asses
Major Indicator
Distance rom Heath Faci l i t ies
f tota l 243est Health est Health est Health Fnearest Hefrom neares
75% of tht ies. thus h Faci l i t ies
0‐1.0 Km
1.1‐2.0 Km
2.1‐3.0 Km
3.1‐4.0 Km
4.1‐5.5 Km
Distance from
Health Facilities in Kms
% of s
EE CITY PLAND BY R MUNICIPAL
e Code for vassment of In
Distancfrom Heath
Faci l i t ie
0‐1.0 Km
1.1‐2.0 Km
2.1‐3.0 Km
3.1‐4.0 Km
4.1‐5.5 Km
s lum pockFaci l i t ies , Faci l i t ies , Faci l i t ies , Malth Faci l i ts t Health Fa
he S lum Pomajor ity o.
0.00% 10
ms
ms
ms
ms
ms
4.
4.
slum pock
N FOR GWAL L CORPORAT
arious Figurenfrastructure
ce
es
RangeCode
ms 1
ms 2
ms 3
ms 4
ms 5
ets , 4.12% 4.53% of 16.05% of Major ity 69t ies and 6.1aci l i t ies .
ockets are of S lum Po
0.00% 20.00
6.17%
16.
.53%
12%
kets v/s D
%
LIOR CITY TION
es of Key Inde/Service Le
Su
e
Derivat
Distance Facilities slums wacategorieKms, 1.1‐Kms, 3.1‐5.5 Kmsthe same
of the s lumthe s lum pthe s lum p.14% of the17% of the
located leockets in G
0% 30.00%
05%
Distance fr
% of Slum Po
With TeMehta a
Volume
dicators and evel
b Indicator
t ion of Ran
of Hefrom each of as divided in es such as 0‐2.0 Kms, 2.1‐4.0 Kms and and distribu
e in 5 ranges
m pockets apockets arepockets aree s lum pocks lum pocke
ss than 2.Gwal ior doe
40.00% 5
rom Healt
ockets
echnical Supporand Associates
Urban P
Revised De I – Report
Weightage
r
nge Assi
alth the five ‐1.0 ‐3.0 4.1‐ting
On tDistanFacilitSlum assign0.5.
are located e located 3e located 2kets are locets are loca
0 Kms f romesn’t need
50.00% 60.0
h Facility
rt from. Indore,
Planners
raft Final Rt and Appen
for Various
gned Weig
the scale nce of ies from eachPockets ha
ned the weigh
4.1 ‐5.5 Km3.1 ‐4.0 Kms2.1 ‐3.0 Kmcated 1.1 ‐2ated less th
m nearest intervent i
00% 70.00%
69
in Kms
114
Report ndices
Key
htage
of 10, Health
h of the as been htage of
ms f rom s f rom s f rom .0 Kms han 1.0
health ions in
%
9.14%
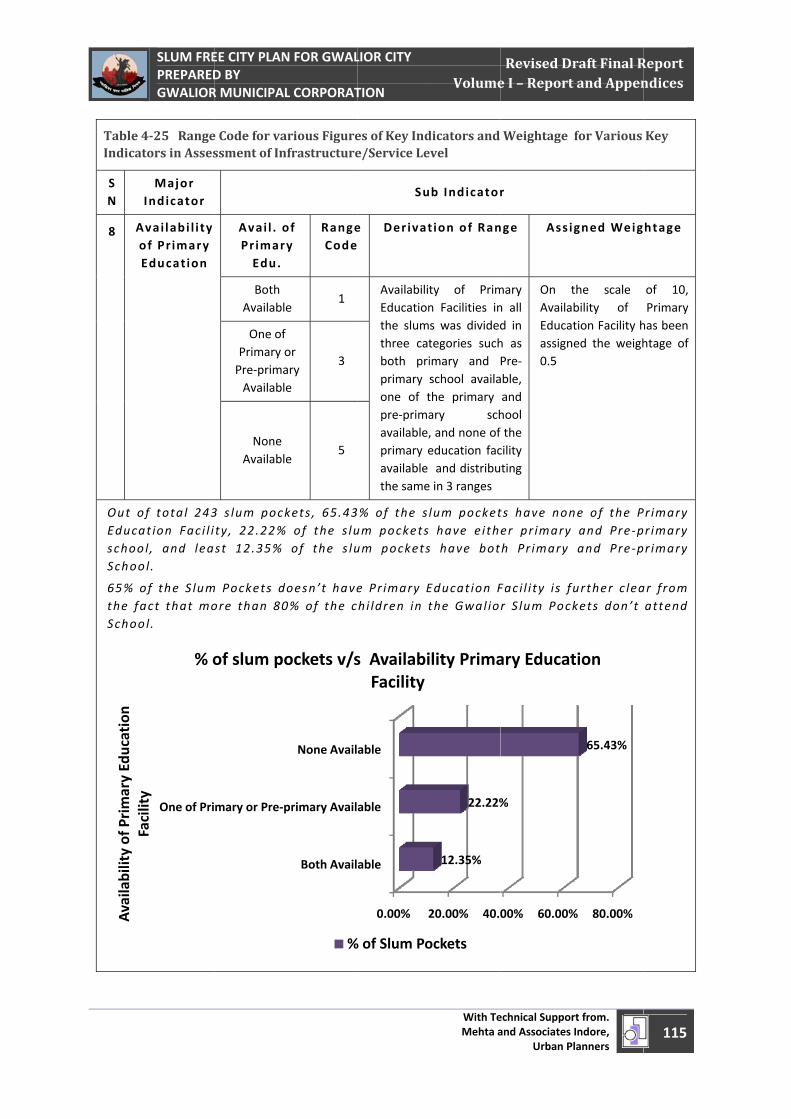
April 1, 2011
Table 4Indicat
S N
8 AoE
Out oEducaschooSchoo
65% othe faSchoo
Availability of Primary Education
Facility
SLUM FREPREPAREDGWALIOR
425 Rangetors in Asses
Major Indicator
Avai labi l i ty of Primary Education
of tota l 243at ion Faci l io l , and leaol .
of the S lumact that mool.
One of Pri
Facility
% o
EE CITY PLAND BY R MUNICIPAL
e Code for vassment of In
Avai l . oPrimarEdu.
Both Available
One of Primary oPre‐primaAvailable
None Available
3 s lum pockty, 22.22%st 12.35%
m Pockets dore than 80
mary or Pre‐p
of slum po
N FOR GWAL L CORPORAT
arious Figurenfrastructure
of y
RangeCode
e 1
or ary e
3
e 5
kets , 65.43 of the s luof the s lu
oesn’t have0% of the c
Both Avail
primary Avail
None Avail
ockets v/s
%
LIOR CITY TION
es of Key Inde/Service Le
Su
e
Derivat
AvailabiliEducationthe slumthree catboth priprimary one of tpre‐primaavailable,primary eavailable the same
% of the sum pocketsum pockets
e Pr imary Ehi ldren in t
0.00% 2
able
able
able
s AvailabiFacility
% of Slum Po
With TeMehta a
Volume
dicators and evel
b Indicator
t ion of Ran
ty of Primn Facilities ins was dividedtegories suchimary and school availathe primary ary sch, and none of education fac and distribu
e in 3 ranges
lum pocket have eiths have bot
Educat ion Fthe Gwal io
20.00% 40.0
12.35%
22.22%
ility Prima
ockets
echnical Supporand Associates
Urban P
Revised De I – Report
Weightage
r
nge Assi
mary n all d in h as Pre‐able, and hool f the cility ting
On tAvailaEducaassign0.5
ts have noner pr imaryh Pr imary
Faci l i ty i s fr S lum Poc
00% 60.00%
%
ary Educat
rt from. Indore,
Planners
raft Final Rt and Appen
for Various
gned Weig
the scale bility of tion Facility hned the weigh
ne of the P and Pre ‐pand Pre ‐p
further c leakets don’t
% 80.00%
65.43%
tion
115
Report ndices
Key
htage
of 10, Primary
has been htage of
Pr imary r imary r imary
ar f rom attend
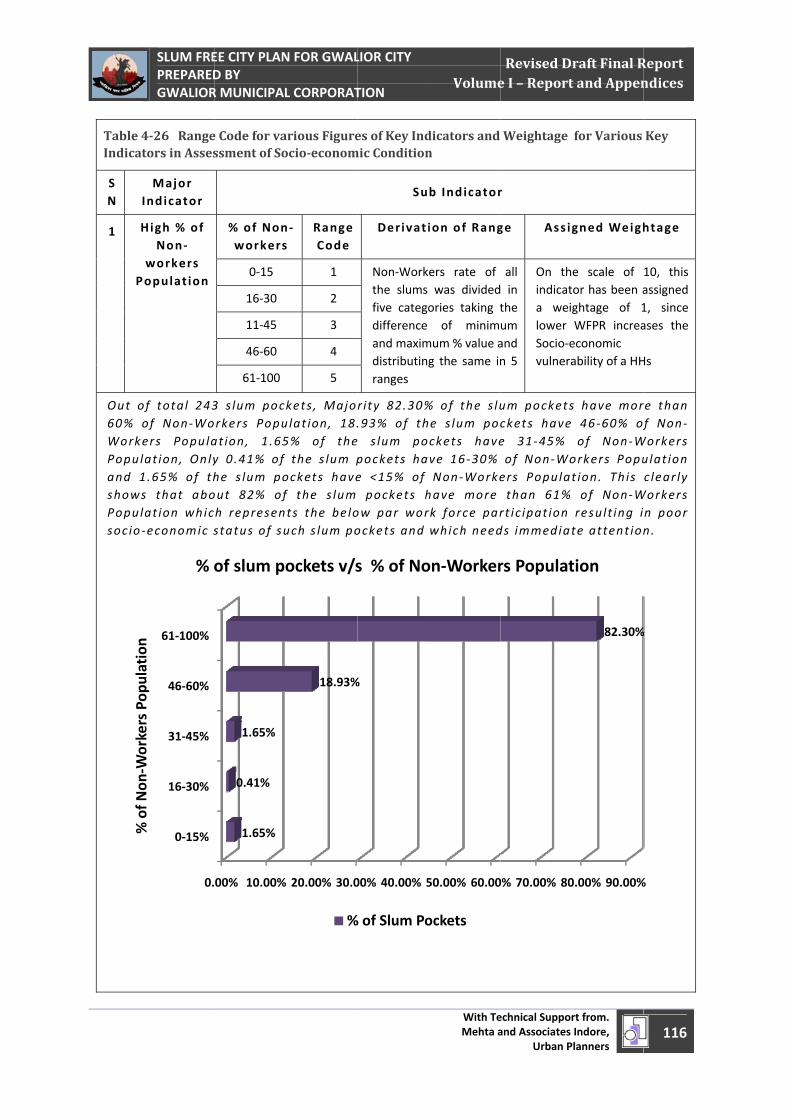
April 1, 2011
Table 4Indicat
S N I
1 H
P
Out o60% oWorkePopuland 1showsPopulsoc io ‐
%of
Non
‐WorkersPo
pulation
SLUM FREPREPAREDGWALIOR
426 Rangetors in Asses
Major Indicator
High % of Non ‐
workers opulat ion
of total 243of Non ‐Woers Populalat ion, Only1.65% of ths that abolat ion whic‐economic s
0.
0‐15%
16‐30%
31‐45%
46‐60%
61‐100%
% of N
on‐W
orkers Pop
ulation
% o
EE CITY PLAND BY R MUNICIPAL
e Code for vassment of So
% of Nonworkers
0‐15
16‐30
11‐45
46‐60
61‐100
3 s lum pocrkers Popuat ion, 1.65y 0.41% of he s lum poout 82% ofh represenstatus of su
00% 10.00%
1.65%
0.41%
1.65%
of slum po
N FOR GWAL L CORPORAT
arious Figureocioeconom
n ‐s
Range Code
1
2
3
4
5
kets, Majoulat ion, 18.5% of thethe s lum p
ockets havef the s lum ts the belouch s lum po
% 20.00% 30.0
18.93%
ockets v/s
%
LIOR CITY TION
es of Key Indmic Condition
Su
Derivat i
Non‐Workthe slums five categodifference and maximdistributingranges
r i ty 82.30%.93% of th s lum popockets hae <15% of pockets h
ow par worockets and
00% 40.00% 5
%
s % of No
% of Slum Po
With TeMehta a
Volume
dicators and n
b Indicator
ion of Rang
ers rate of was dividedories taking t
of minimmum % value ag the same in
% of the s lue s lum pocckets haveve 16 ‐30% Non ‐Worke
have more k force parwhich need
50.00% 60.00
on‐Worker
ockets
echnical Supporand Associates
Urban P
Revised De I – Report
Weightage
r
ge Assig
all in the um and n 5
On thindicata weilower Socio‐evulnera
um pocketsckets havee 31 ‐45% of Non ‐Woers Populathan 61%
rt ic ipat ion ds immediat
0% 70.00% 80
rs Populat
rt from. Indore,
Planners
raft Final Rt and Appen
for Various
gned Weigh
e scale of tor has been aghtage of 1WFPR increaeconomic ability of a HH
s have mor 46 ‐60% ofof Non ‐W
orkers Poput ion. This of Non ‐Wresult ing ite attent ion
0.00% 90.00%
82.30%
tion
116
Report ndices
Key
htage
10, this assigned 1, since ases the
Hs
re than f Non ‐
Workers ulat ion c lear ly
Workers n poor n.
%
%
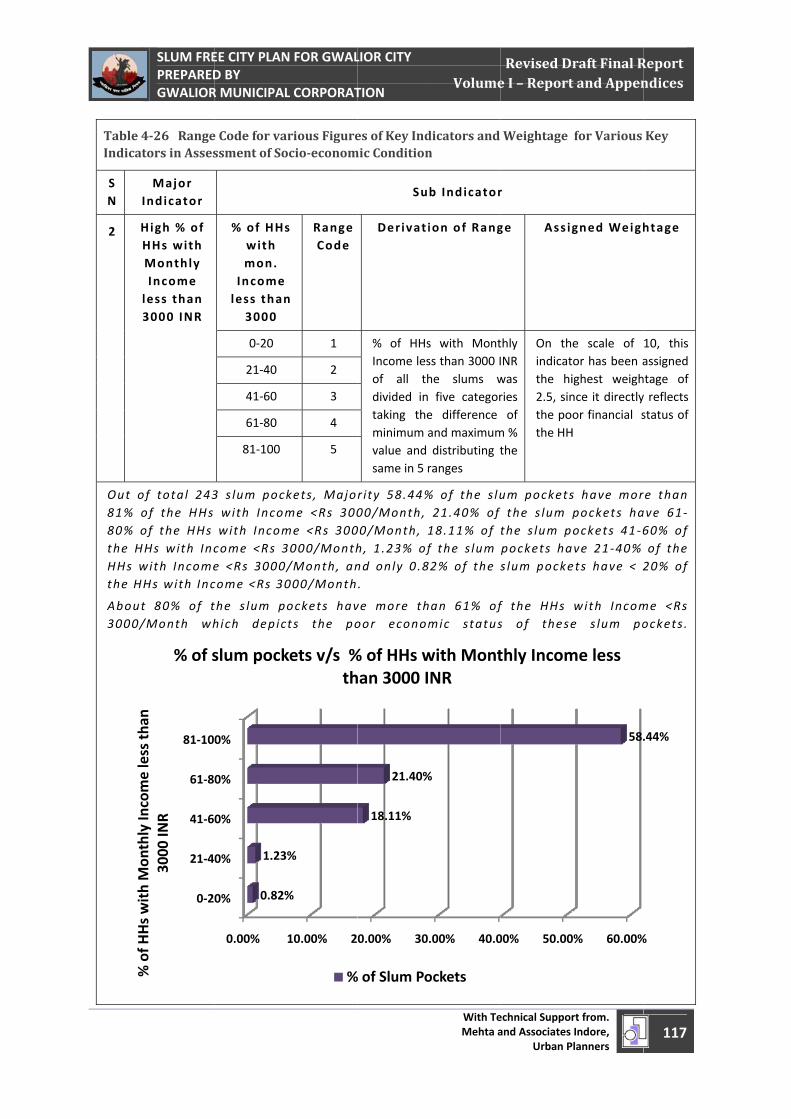
April 1, 2011
Table 4Indicat
S N I
2 H
l3
Out o81% o80% othe HHHs wthe H
About3000/
%of
HHswithMon
thlyIncomeless
than
SLUM FREPREPAREDGWALIOR
426 Rangetors in Asses
Major Indicator
High % of HHs with Monthly Income less than 3000 INR
of total 243of the HHs of the HHs Hs with Incwith IncomeHs with Inc
t 80% of t/Month wh
0‐2
21‐4
41‐6
61‐8
81‐10
% of H
Hs with Mon
thly In
come less th
an
3000
INR
% of s
EE CITY PLAND BY R MUNICIPAL
e Code for vassment of So
% of HHswith mon.
Income less than
3000
0‐20
21‐40
41‐60
61‐80
81‐100
3 s lum poc with Incomwith Incomcome <Rs 3e <Rs 3000/come <Rs 30
the s lum phich depic
0.00%
0%
0%
0%
0%
0%
0.82%
1.23
slum pock
N FOR GWAL L CORPORAT
arious Figureocioeconom
s
n
Range Code
1
2
3
4
5
kets, Majome <Rs 300me <Rs 3003000/Month/Month, an000/Month
ockets havcts the po
10.00% 2
%
3%
kets v/s %th
%
LIOR CITY TION
es of Key Indmic Condition
Su
Derivat i
% of HHsIncome lesof all thdivided in taking theminimum avalue and same in 5 r
r i ty 58.44%00/Month, 00/Month, 1h, 1.23% ofnd only 0.8.
ve more thoor econom
0.00% 30
18.11%
21.40%
% of HHs whan 3000 I
% of Slum Po
With TeMehta a
Volume
dicators and n
b Indicator
ion of Rang
s with Montss than 3000 Ihe slums wfive categor
e difference and maximumdistributing tranges
% of the s lu21.40% of 18.11% of f the s lum 2% of the s
an 61% ofmic status
.00% 40.0
%
with MontNR
ockets
echnical Supporand Associates
Urban P
Revised De I – Report
Weightage
r
ge Assig
thly INR was ries of
m % the
On thindicatthe hi2.5, sinthe pothe HH
um pocketsthe s lum the s lum ppockets has lum pocke
f the HHs s of these
00% 50.00
thly Incom
rt from. Indore,
Planners
raft Final Rt and Appen
for Various
gned Weigh
e scale of tor has been aighest weighnce it directlyor financial sH
s have morpockets haockets 41 ‐6ve 21 ‐40% ets have < 2
with Income s lum po
0% 60.00%
58.
me less
117
Report ndices
Key
htage
10, this assigned htage of y reflects status of
re than ave 61 ‐ 60% of of the 20% of
me <Rs ockets .
%
.44%
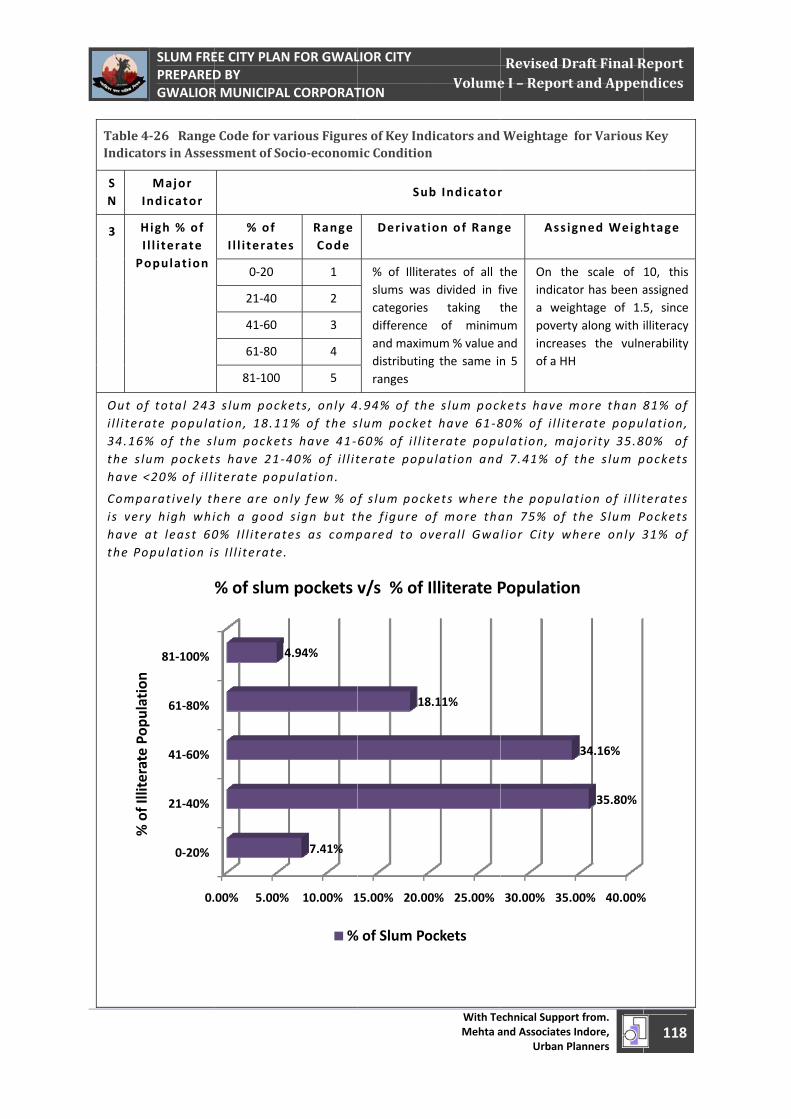
April 1, 2011
Table 4Indicat
S N I
3 H
P
Out oi l l i ter34.16the s lhave
Compis verhave the Po
%of
IlliteratePo
pulation
SLUM FREPREPAREDGWALIOR
426 Rangetors in Asses
Major Indicator
High % of I l l i terate opulat ion
f tota l 243rate popula% of the s llum pocket<20% of i l l i
arat ive ly thry high whiat least 60opulat ion i s
0.
0‐20%
21‐40%
41‐60%
61‐80%
81‐100%
% of Illiterate Pop
ulation
EE CITY PLAND BY R MUNICIPAL
e Code for vassment of So
% of I l l i terate
0‐20
21‐40
41‐60
61‐80
81‐100
3 s lum pockat ion, 18.11lum pockets have 21 ‐4iterate pop
here are onich a good 0% I l l i terats I l l i terate.
00% 5.00%
4
% of slum
N FOR GWAL L CORPORAT
arious Figureocioeconom
es Range Code
1
2
3
4
5
kets , only 41% of the ss have 41 ‐40% of i l l i tu lat ion.
nly few % ofs ign but t
tes as comp
% 10.00% 1
7.41%
4.94%
m pockets v
%
LIOR CITY TION
es of Key Indmic Condition
Su
Derivat i
% of Illiteslums wascategories difference and maximdistributingranges
.94% of thelum pocket60% of i l l i tterate popu
f s lum pockhe f igure opared to ov
15.00% 20.00
18
v/s % of I
% of Slum Po
With TeMehta a
Volume
dicators and n
b Indicator
ion of Rang
rates of all ts divided in f
taking tof minim
mum % value ag the same in
e s lum poct have 61 ‐8terate popuulat ion and
kets where of more thaveral l Gwa
0% 25.00%
8.11%
Illiterate P
ockets
echnical Supporand Associates
Urban P
Revised De I – Report
Weightage
r
ge Assig
the five the um and n 5
On thindicata weigpovertyincreasof a HH
kets have m80% of i l l i tu lat ion, mad 7.41% of
the populaan 75% of l ior City w
30.00% 35.
Population
rt from. Indore,
Planners
raft Final Rt and Appen
for Various
gned Weigh
e scale of tor has been aghtage of 1.y along with ses the vulnH
more than 8erate popuajor i ty 35.8the s lum p
at ion of i l l i tthe S lum Phere only 3
00% 40.00%
35.80%
34.16%
n
118
Report ndices
Key
htage
10, this assigned 5, since illiteracy erability
81% of lat ion,
80% of pockets
terates Pockets 31% of
%
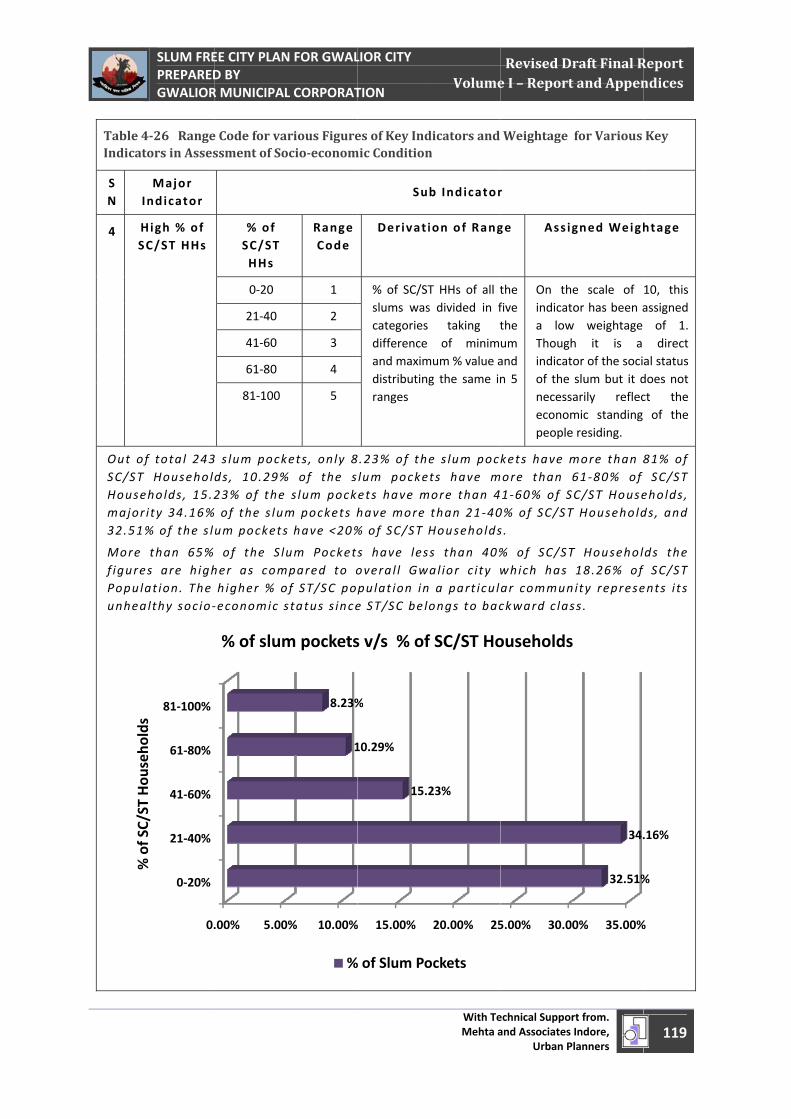
April 1, 2011
Table 4Indicat
S N I
4 HS
Out oSC/STHousemajor32.51
More f igurePopulunhea
%of
SC/STHou
seho
lds
SLUM FREPREPAREDGWALIOR
426 Rangetors in Asses
Major Indicator
High % of SC/ST HHs
f tota l 243T Householeholds, 15.2r i ty 34.16%% of the s l
than 65%es are highlat ion. The althy socio ‐
0.
0‐20%
21‐40%
41‐60%
61‐80%
81‐100%
% of SC/ST Hou
seho
lds
EE CITY PLAND BY R MUNICIPAL
e Code for vassment of So
% of SC/ST HHs
0‐20
21‐40
41‐60
61‐80
81‐100
3 s lum pockds, 10.29%23% of the of the s lumum pockets
of the S lher as comhigher % o‐economic s
.00% 5.00
% of slum
N FOR GWAL L CORPORAT
arious Figureocioeconom
Range Code
1
2
3
4
5
kets , only 8% of the ss lum pock
m pockets hs have <20%
um Pocketsmpared to oof ST/SC postatus s ince
0% 10.00%
1
8.23%
m pockets
%
LIOR CITY TION
es of Key Indmic Condition
Su
Derivat i
% of SC/STslums wascategories difference and maximdistributingranges
8.23% of thelum pockeets have mhave more % of SC/ST H
s have lesoveral l Gwpulat ion ine ST/SC bel
% 15.00%
15.2
10.29%
%
s v/s % of
% of Slum Po
With TeMehta a
Volume
dicators and n
b Indicator
ion of Rang
T HHs of all ts divided in f
taking tof minim
mum % value ag the same in
e s lum pocts have m
more than 4than 21 ‐40Households
s than 40%al ior c ity w a part icu longs to bac
20.00% 25
23%
f SC/ST Ho
ockets
echnical Supporand Associates
Urban P
Revised De I – Report
Weightage
r
ge Assig
the five the um and n 5
On thindicata lowThoughindicatof the necesseconompeople
kets have more than 1 ‐60% of S0% of SC/STs .
% of SC/STwhich has ar communckward c las
5.00% 30.0
ouseholds
rt from. Indore,
Planners
raft Final Rt and Appen
for Various
gned Weigh
e scale of tor has been aw weightage h it is a tor of the socislum but it darily reflecmic standing e residing.
more than 861 ‐80% of C/ST HouseT Household
T Househol18.26% of
nity represess .
0% 35.00%
32.51%
34.
s
119
Report ndices
Key
htage
10, this assigned of 1. direct
al status does not ct the of the
81% of SC/ST
eholds , ds, and
ds the f SC/ST ents i t s
%
%
.16%
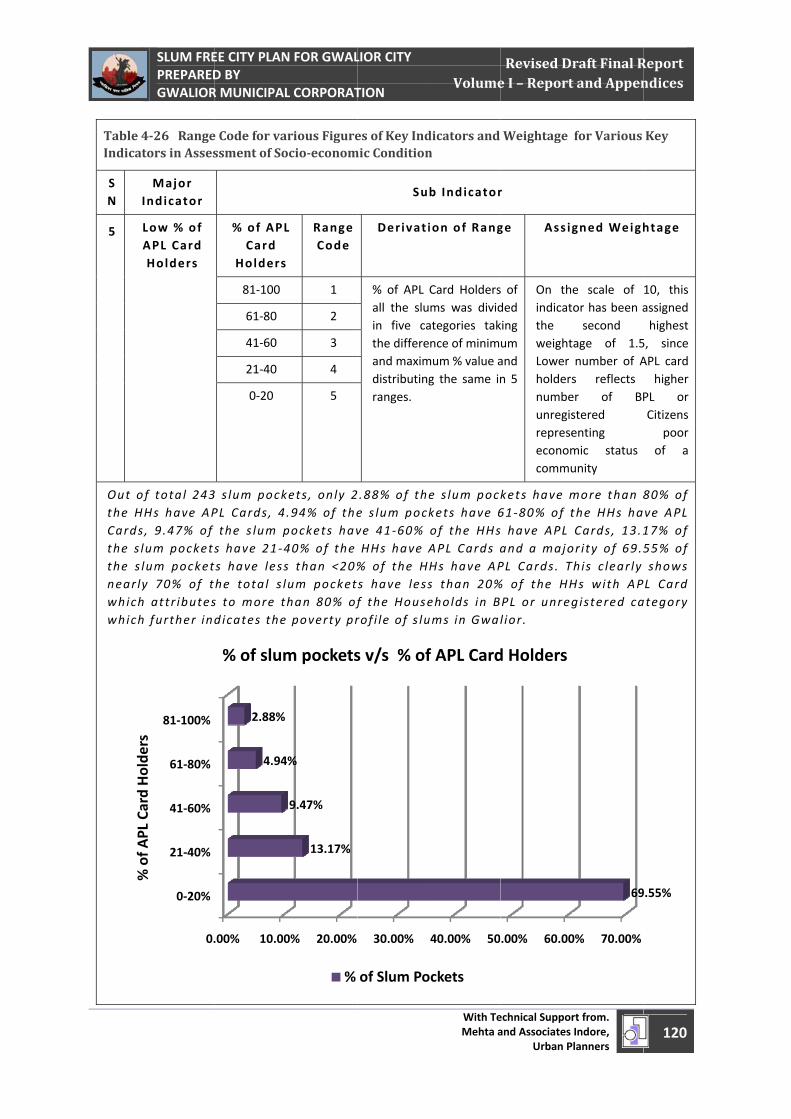
April 1, 2011
Table 4Indicat
S N I
5 A
Out othe HCardsthe s lthe s lnear lywhichwhich
%of
APL
Card
Holde
rs
SLUM FREPREPAREDGWALIOR
426 Rangetors in Asses
Major Indicator
Low % of APL Card Holders
f tota l 243Hs have AP, 9.47% of lum pocketslum pockety 70% of th attr ibutesh further ind
0.
0‐20%
21‐40%
41‐60%
61‐80%
81‐100%
% of A
PL Card Holde
rs
EE CITY PLAND BY R MUNICIPAL
e Code for vassment of So
% of APLCard
Holders
81‐100
61‐80
41‐60
21‐40
0‐20
3 s lum pockPL Cards, 4the s lum ps have 21 ‐4s have lesshe tota l s ls to more td icates the
.00% 10.00
4.94
2.88%
% of slum
N FOR GWAL L CORPORAT
arious Figureocioeconom
L
Range Code
1
2
3
4
5
kets , only 2.94% of thepockets hav40% of the s than <20%lum pockethan 80% of poverty pr
0% 20.00%
13.17%
9.47%
4%
m pockets
%
LIOR CITY TION
es of Key Indmic Condition
Su
Derivat i
% of APL all the sluin five cathe differeand maximdistributingranges.
.88% of thee s lum pockve 41 ‐60% HHs have A% of the Hs have lessf the Houserof i le of s lu
30.00%
s v/s % of
of Slum Po
With TeMehta a
Volume
dicators and n
b Indicator
ion of Rang
Card Holdersms was dividategories taknce of minim
mum % value ag the same in
e s lum pockets have 6of the HHsAPL Cards aHs have APs than 20%eholds in Bums in Gwal
40.00% 50
f APL Card
ockets
echnical Supporand Associates
Urban P
Revised De I – Report
Weightage
r
ge Assig
s of ded king um and n 5
On thindicatthe weightLower holdersnumbeunregisrepreseeconomcommu
kets have m61 ‐80% of t have APL and a majoPL Cards. T% of the HHPL or unregl ior .
.00% 60.00
d Holders
rt from. Indore,
Planners
raft Final Rt and Appen
for Various
gned Weigh
e scale of tor has been a
second tage of 1.5number of As reflects er of BPstered enting mic status unity
more than 8the HHs haCards, 13.1
or i ty of 69.5This c lear ly Hs with APgistered ca
0% 70.00%
69
120
Report ndices
Key
htage
10, this assigned highest
5, since APL card
higher PL or Citizens
poor of a
80% of ve APL 17% of 55% of shows L Card
ategory
9.55%
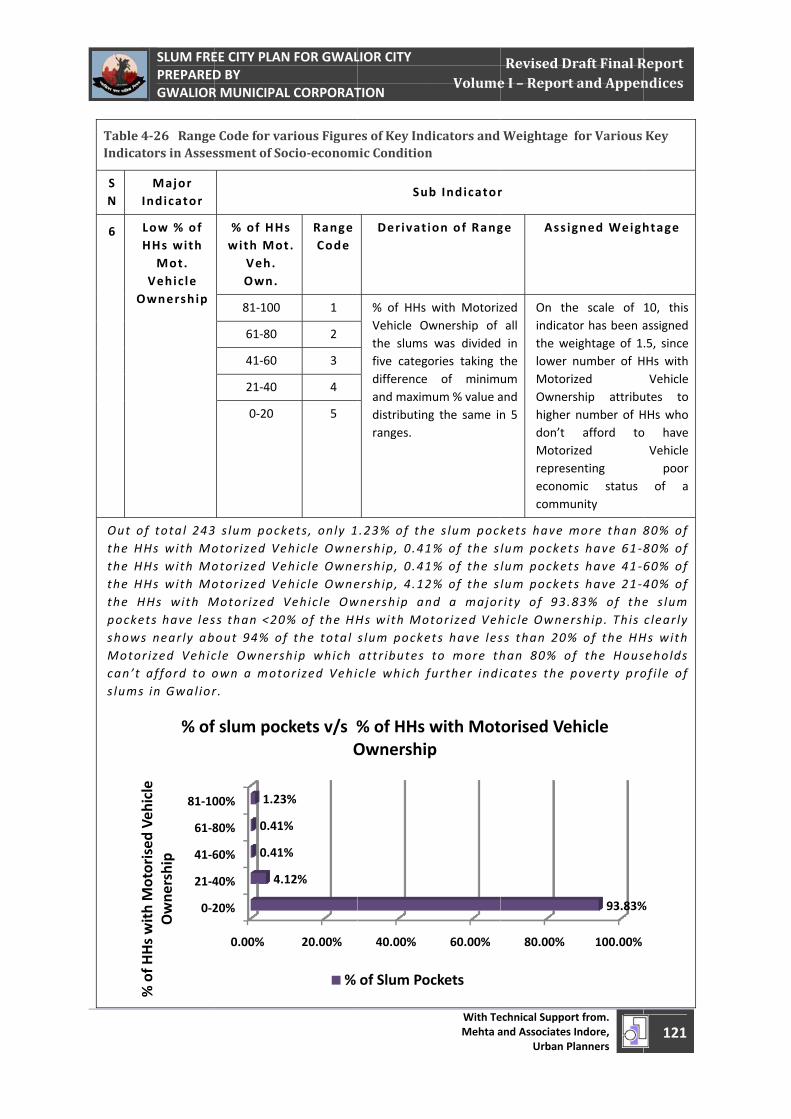
April 1, 2011
Table 4Indicat
S N I
6
O
Out othe Hthe Hthe Hthe HpockeshowsMotorcan’t s lums
%fH
HithM
ti
dV
hil
SLUM FREPREPAREDGWALIOR
426 Rangetors in Asses
Major Indicator
Low % of HHs with
Mot. Vehicle
Ownership
f tota l 243Hs with MoHs with MoHs with MoHHs with Mets have less near ly abr ized Vehicafford to o
s in Gwal ior
0‐2
21‐4
41‐6
61‐8
81‐10
% of H
Hs with Motorised
Veh
icle
Owne
rship
% of
EE CITY PLAND BY R MUNICIPAL
e Code for vassment of So
% of HHswith Mot
Veh. Own.
81‐100
61‐80
41‐60
21‐40
0‐20
3 s lum pockotor ized Veotor ized Veotor ized VeMotor ized Vss than <20out 94% ofc le Ownersown a motor.
0.00%
20%
40%
60%
80%
00%
4.1
0.41%
0.41%
1.23
f slum poc
N FOR GWAL L CORPORAT
arious Figureocioeconom
s t .
Range Code
1
2
3
4
5
kets , only 1ehic le Owneehic le Owneehic le OwneVehic le Ow% of the HHf the tota l hip which or ized Vehi
20.00%
12%
%
%
3%
ckets v/s %O
%
LIOR CITY TION
es of Key Indmic Condition
Su
Derivat i
% of HHs Vehicle Owthe slums five categodifference and maximdistributingranges.
.23% of theership, 0.41ership, 0.41ership, 4.12wnership anHs with Moslum pockeattr ibutes cle which f
40.00%
% of HHs Ownership
of Slum Po
With TeMehta a
Volume
dicators and n
b Indicator
ion of Rang
with Motorizwnership of was dividedories taking t
of minimmum % value ag the same in
e s lum poc1% of the s1% of the s2% of the snd a majortor ized Vehets have lesto more thfurther ind i
60.00%
with Motp
ockets
echnical Supporand Associates
Urban P
Revised De I – Report
Weightage
r
ge Assig
zed all in the um and n 5
On thindicatthe welower MotoriOwnerhigher don’t Motorirepreseeconomcommu
kets have mlum pocketlum pocketlum pocketr i ty of 93.8hic le Ownerss than 20%han 80% oficates the p
80.00%
orised Ve
rt from. Indore,
Planners
raft Final Rt and Appen
for Various
gned Weigh
e scale of tor has been aeightage of 1number of Hized rship attribunumber of Hafford to
ized enting mic status unity
more than 8ts have 61 ‐8ts have 41 ‐ts have 21 ‐483% of thersh ip . This % of the HHf the Houspoverty pro
100.00%
93.83%
hicle
121
Report ndices
Key
htage
10, this assigned .5, since HHs with Vehicle
utes to HHs who o have Vehicle
poor of a
80% of 80% of 60% of 40% of e s lum c lear ly Hs with seholds of i le of
%
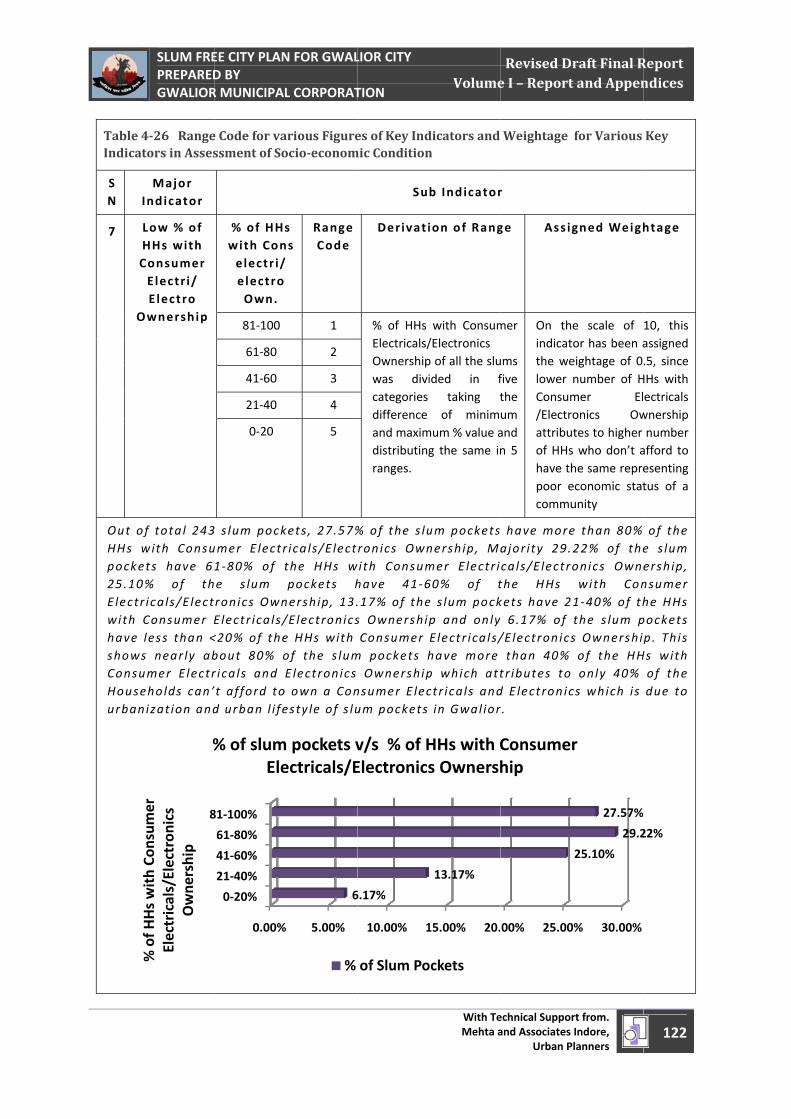
April 1, 2011
Table 4Indicat
S N I
7
C
O
Out oHHs wpocke25.10Electrwith have showsConsuHouseurban
SLUM FREPREPAREDGWALIOR
426 Rangetors in Asses
Major Indicator
Low % of HHs with Consumer Electr i/ Electro
Ownership
f tota l 243with Consuets have 61% of thr ica ls/E lectConsumer Eless than <s near ly abumer Electreholds can’n izat ion and
8
% of H
Hs with Co
nsum
er
Electricals/Electron
ics
Owne
rship
%
EE CITY PLAND BY R MUNICIPAL
e Code for vassment of So
% of HHswith Conelectr i/electro Own.
81‐100
61‐80
41‐60
21‐40
0‐20
s lum pockumer Electr1 ‐80% of te s lum ronics OwnElectr ica ls/<20% of thebout 80% or ica ls and Et afford tod urban l i fe
0.00%
0‐20%
21‐40%
41‐60%
61‐80%
81‐100%
% of slumEle
N FOR GWAL L CORPORAT
arious Figureocioeconom
s s
Range Code
1
2
3
4
5
kets , 27.57%ricals/E lectthe HHs wpockets h
nership, 13./E lectronicse HHs with of the s lumElectronics own a Conesty le of s lu
5.00%
6
m pockets vectricals/E
%
LIOR CITY TION
es of Key Indmic Condition
Su
Derivat i
% of HHs Electricals/Ownershipwas divicategories difference and maximdistributingranges.
% of the s luronics Ownith Consumhave 41 ‐617% of thes OwnershipConsumer
m pockets hOwnership
nsumer Elecum pockets
10.00% 1
6.17%
v/s % of HElectronics
of Slum Po
With TeMehta a
Volume
dicators and n
b Indicator
ion of Rang
with Consum/Electronics p of all the sluided in f
taking tof minim
mum % value ag the same in
um pocketsnersh ip , Mamer Electr i60% of te s lum pockp and onlyE lectr ica ls/have more p which attctr icals andin Gwal ior
15.00% 20.
13.17%
HHs with Cs Ownersh
ockets
echnical Supporand Associates
Urban P
Revised De I – Report
Weightage
r
ge Assig
mer
ums five the um and n 5
On thindicatthe welower Consum/Electrattribuof HHshave thpoor ecommu
have moreajor ity 29.cals/E lectrthe HHs kets have 2 6.17% of /E lectronicsthan 40%
t r ibutes tod Electronicr .
00% 25.00
Consumehip
rt from. Indore,
Planners
raft Final Rt and Appen
for Various
gned Weigh
e scale of tor has been aeightage of 0number of Hmer Elonics Owtes to higher s who don’t ahe same repreeconomic statunity
e than 80%22% of theonics Ownwith Con1 ‐40% of ththe s lum ps Ownershiof the HH only 40% cs which i s
0% 30.00%
25.10%
29.2
27.57%
r
122
Report ndices
Key
htage
10, this assigned .5, since HHs with ectricals wnership number afford to esenting tus of a
of the e s lum ership, nsumer he HHs pockets p. This
Hs with of the due to
22%
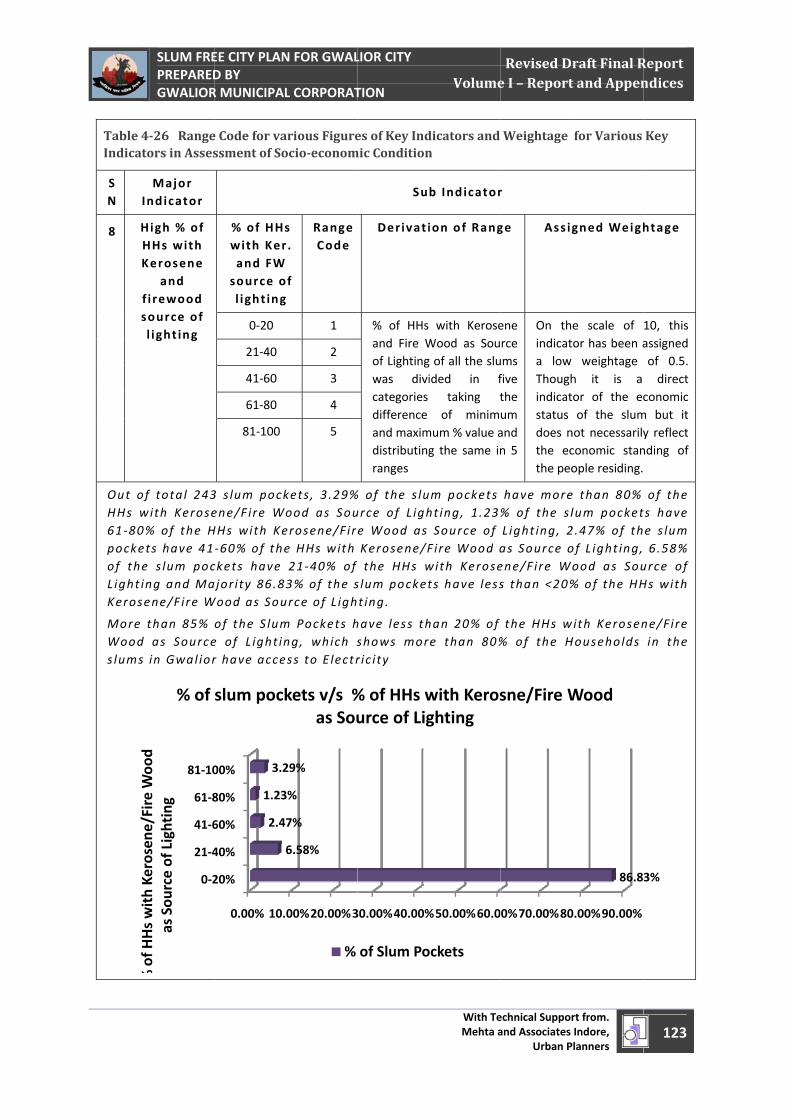
April 1, 2011
Table 4Indicat
S N I
8 H
K
fs
Out oHHs w61 ‐80pockeof theL ight iKeros
More Woodslums
%fH
HithK
/Fi
Wd
SLUM FREPREPAREDGWALIOR
426 Rangetors in Asses
Major Indicator
High % of HHs with Kerosene
and f i rewood source of l ight ing
of tota l 243with Kerose0% of the Hets have 41e s lum pocing and Maene/F ire W
than 85% d as Sources in Gwal ior
0‐2
21‐4
41‐6
61‐8
81‐10
% of H
Hs with Ke
rosene
/Fire Woo
d as Sou
rce of Lighting
% of
EE CITY PLAND BY R MUNICIPAL
e Code for vassment of So
% of HHswith Kerand FWsource ol ight ing
0‐20
21‐40
41‐60
61‐80
81‐100
3 s lum pockene/F ire WoHHs with Ke‐60% of theckets have jor i ty 86.83
Wood as Sou
of the S lume of L ight inr have acce
0.00% 10.
20%
40%
60%
80%
00%
2.4
1.23
3.2
slum pock
N FOR GWAL L CORPORAT
arious Figureocioeconom
s r . f
Range Code
1
2
3
4
5
kets , 3.29%ood as Souerosene/Fire HHs with 21 ‐40% of 3% of the surce of L igh
m Pockets hng, which sss to Electr
00%20.00%3
6.58%
7%
3%
29%
kets v/s %as Sou
%
LIOR CITY TION
es of Key Indmic Condition
Su
Derivat i
% of HHs and Fire Wof Lightingwas divicategories difference and maximdistributingranges
% of the s luurce of L ighe Wood as Kerosene/Fthe HHs w
slum pockett ing.
have less thshows morr ic i ty
30.00%40.00%
% of HHs wurce of Lig
of Slum Po
With TeMehta a
Volume
dicators and n
b Indicator
ion of Rang
with KeroseWood as Soug of all the sluided in f
taking tof minim
mum % value ag the same in
m pockets ht ing, 1.23%Source of
Fire Wood awith Kerosets have less
han 20% of e than 80%
%50.00%60.0
with Kerosghting
ockets
echnical Supporand Associates
Urban P
Revised De I – Report
Weightage
r
ge Assig
ene rce ums five the um and n 5
On thindicata low Thoughindicatstatus does nthe ecthe peo
have more% of the s lL ight ing, 2as Source oene/F ire Ws than <20%
the HHs w% of the H
0%70.00%80
sne/Fire W
rt from. Indore,
Planners
raft Final Rt and Appen
for Various
gned Weigh
e scale of tor has been aweightage
h it is a tor of the ecof the slum
not necessarilyconomic stanople residing.
e than 80% lum pocket2.47% of thof L ight ing,ood as Sou% of the HH
with KerosenHouseholds
0.00%90.00%
86.8
Wood
123
Report ndices
Key
htage
10, this assigned of 0.5. direct
conomic m but it y reflect nding of
of the ts have e s lum 6.58% urce of Hs with
ne/Fire in the
3%
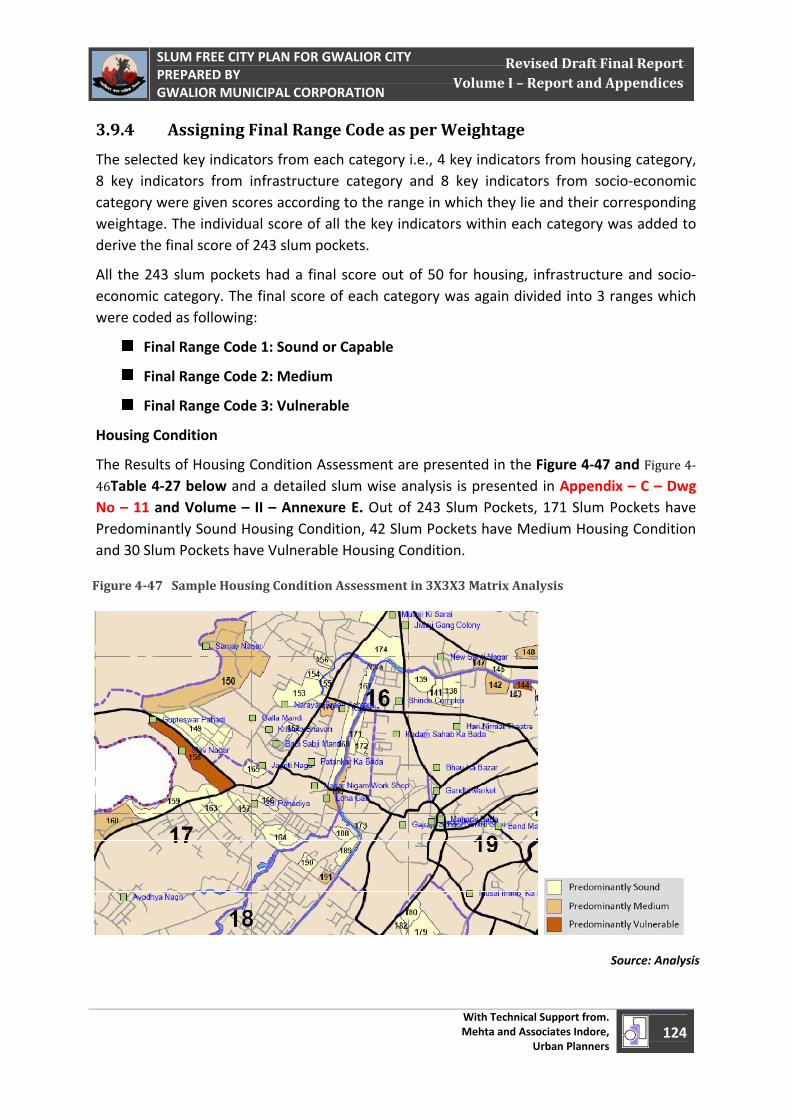
April 1, 2011
SLUM FREE CITY PLAN FOR GWALIOR CITY PREPARED BY GWALIOR MUNICIPAL CORPORATION
With Technical Support from. Mehta and Associates Indore,
Urban Planners 124
Revised Draft Final Report Volume I – Report and Appendices
3.9.4 Assigning Final Range Code as per Weightage
The selected key indicators from each category i.e., 4 key indicators from housing category, 8 key indicators from infrastructure category and 8 key indicators from socio‐economic category were given scores according to the range in which they lie and their corresponding weightage. The individual score of all the key indicators within each category was added to derive the final score of 243 slum pockets.
All the 243 slum pockets had a final score out of 50 for housing, infrastructure and socio‐economic category. The final score of each category was again divided into 3 ranges which were coded as following:
Final Range Code 1: Sound or Capable
Final Range Code 2: Medium
Final Range Code 3: Vulnerable
Housing Condition
The Results of Housing Condition Assessment are presented in the Figure 4‐47 and Figure 4‐46Table 4‐27 below and a detailed slum wise analysis is presented in Appendix – C – Dwg No – 11 and Volume – II – Annexure E. Out of 243 Slum Pockets, 171 Slum Pockets have Predominantly Sound Housing Condition, 42 Slum Pockets have Medium Housing Condition and 30 Slum Pockets have Vulnerable Housing Condition.
Figure 447 Sample Housing Condition Assessment in 3X3X3 Matrix Analysis
Source: Analysis
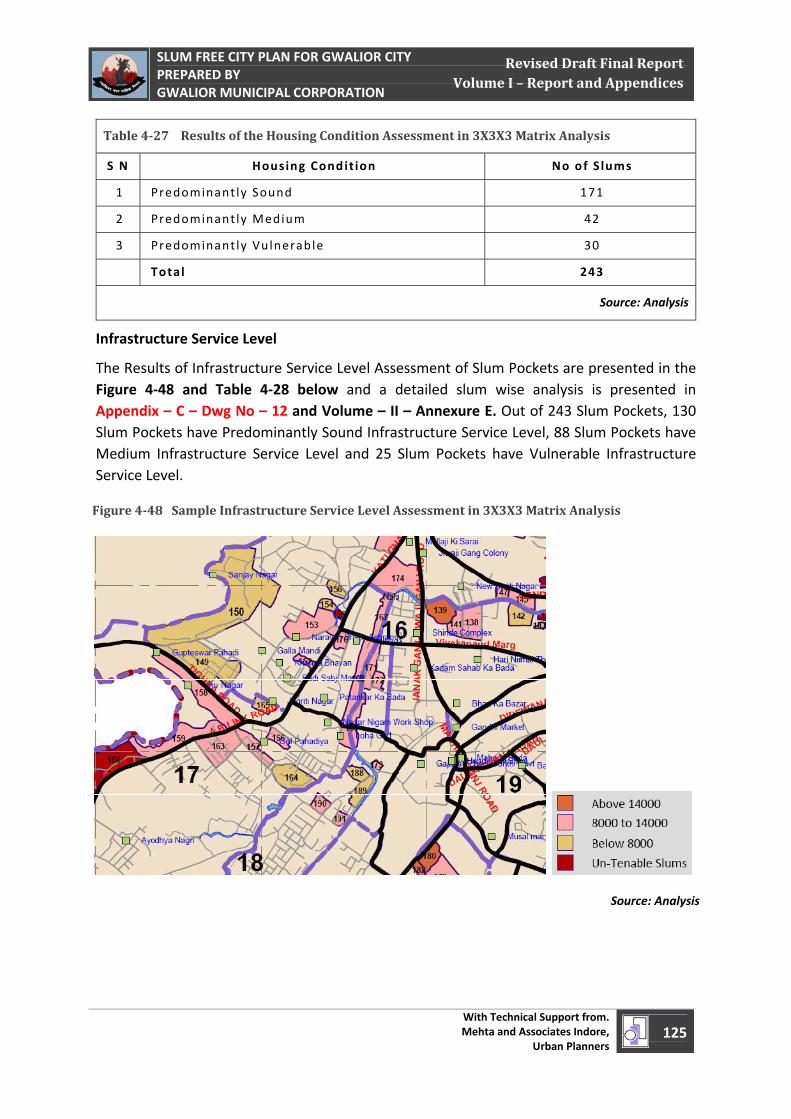
April 1, 2011
SLUM FREE CITY PLAN FOR GWALIOR CITY PREPARED BY GWALIOR MUNICIPAL CORPORATION
With Technical Support from. Mehta and Associates Indore,
Urban Planners 125
Revised Draft Final Report Volume I – Report and Appendices
Table 427 Results of the Housing Condition Assessment in 3X3X3 Matrix Analysis
S N Housing Condit ion No of Slums
1 Predominant ly Sound 171
2 Predominant ly Medium 42
3 Predominant ly Vulnerable 30
Total 243
Source: Analysis
Infrastructure Service Level
The Results of Infrastructure Service Level Assessment of Slum Pockets are presented in the Figure 4‐48 and Table 4‐28 below and a detailed slum wise analysis is presented in Appendix – C – Dwg No – 12 and Volume – II – Annexure E. Out of 243 Slum Pockets, 130 Slum Pockets have Predominantly Sound Infrastructure Service Level, 88 Slum Pockets have Medium Infrastructure Service Level and 25 Slum Pockets have Vulnerable Infrastructure Service Level.
Figure 448 Sample Infrastructure Service Level Assessment in 3X3X3 Matrix Analysis
Source: Analysis
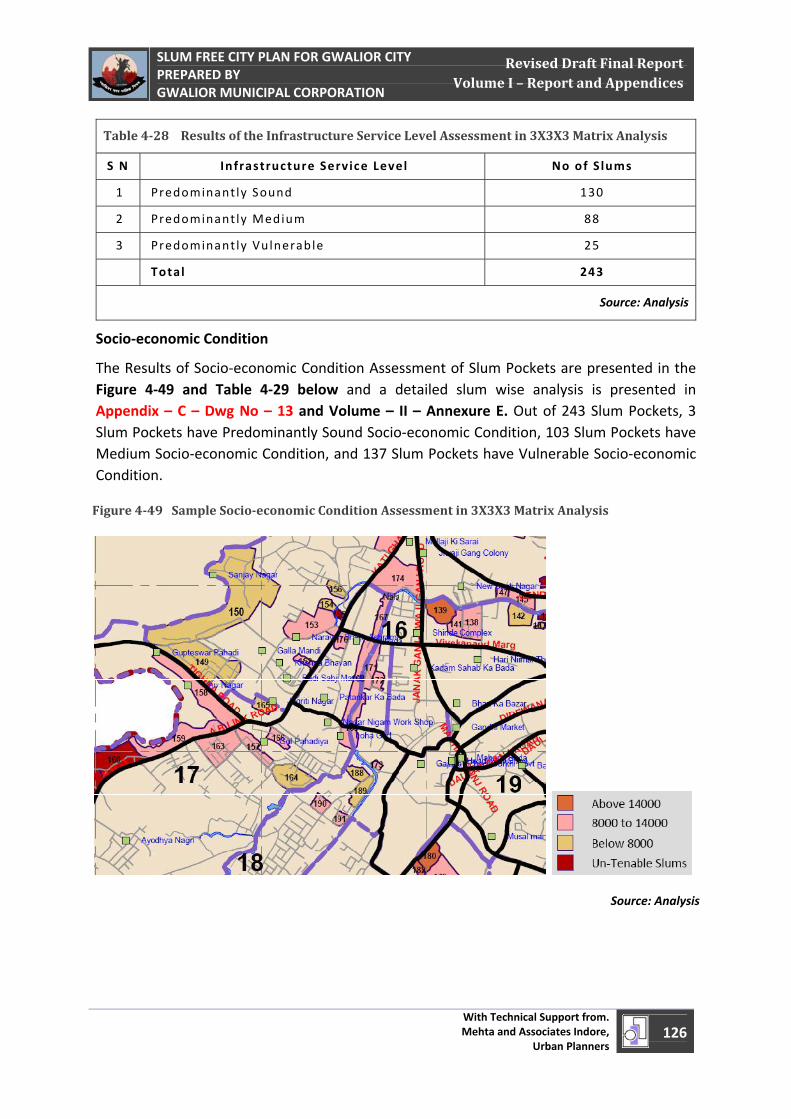
April 1, 2011
SLUM FREE CITY PLAN FOR GWALIOR CITY PREPARED BY GWALIOR MUNICIPAL CORPORATION
With Technical Support from. Mehta and Associates Indore,
Urban Planners 126
Revised Draft Final Report Volume I – Report and Appendices
Table 428 Results of the Infrastructure Service Level Assessment in 3X3X3 Matrix Analysis
S N Infrastructure Service Level No of Slums
1 Predominant ly Sound 130
2 Predominant ly Medium 88
3 Predominant ly Vulnerable 25
Total 243
Source: Analysis
Socio‐economic Condition
The Results of Socio‐economic Condition Assessment of Slum Pockets are presented in the Figure 4‐49 and Table 4‐29 below and a detailed slum wise analysis is presented in Appendix – C – Dwg No – 13 and Volume – II – Annexure E. Out of 243 Slum Pockets, 3 Slum Pockets have Predominantly Sound Socio‐economic Condition, 103 Slum Pockets have Medium Socio‐economic Condition, and 137 Slum Pockets have Vulnerable Socio‐economic Condition.
Figure 449 Sample Socioeconomic Condition Assessment in 3X3X3 Matrix Analysis
Source: Analysis
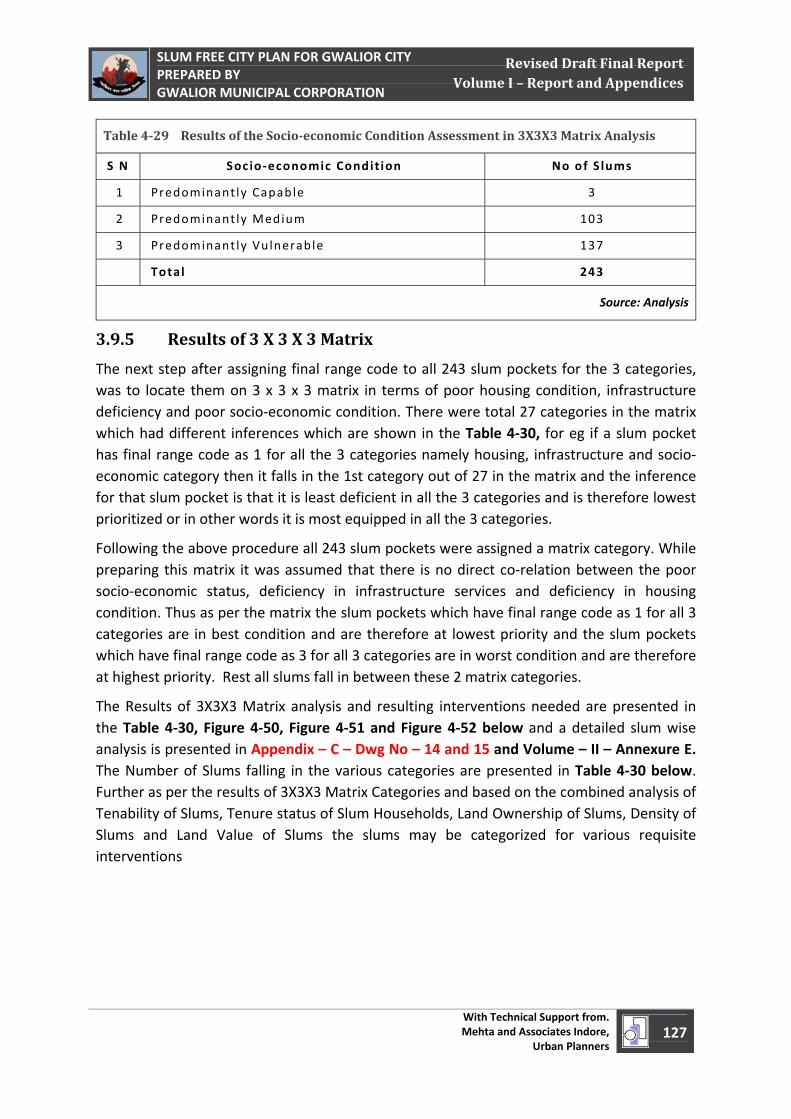
April 1, 2011
SLUM FREE CITY PLAN FOR GWALIOR CITY PREPARED BY GWALIOR MUNICIPAL CORPORATION
With Technical Support from. Mehta and Associates Indore,
Urban Planners 127
Revised Draft Final Report Volume I – Report and Appendices
Table 429 Results of the Socioeconomic Condition Assessment in 3X3X3 Matrix Analysis
S N Socio ‐economic Condit ion No of Slums
1 Predominant ly Capable 3
2 Predominant ly Medium 103
3 Predominant ly Vulnerable 137
Total 243
Source: Analysis
3.9.5 Results of 3 X 3 X 3 Matrix
The next step after assigning final range code to all 243 slum pockets for the 3 categories, was to locate them on 3 x 3 x 3 matrix in terms of poor housing condition, infrastructure deficiency and poor socio‐economic condition. There were total 27 categories in the matrix which had different inferences which are shown in the Table 4‐30, for eg if a slum pocket has final range code as 1 for all the 3 categories namely housing, infrastructure and socio‐economic category then it falls in the 1st category out of 27 in the matrix and the inference for that slum pocket is that it is least deficient in all the 3 categories and is therefore lowest prioritized or in other words it is most equipped in all the 3 categories.
Following the above procedure all 243 slum pockets were assigned a matrix category. While preparing this matrix it was assumed that there is no direct co‐relation between the poor socio‐economic status, deficiency in infrastructure services and deficiency in housing condition. Thus as per the matrix the slum pockets which have final range code as 1 for all 3 categories are in best condition and are therefore at lowest priority and the slum pockets which have final range code as 3 for all 3 categories are in worst condition and are therefore at highest priority. Rest all slums fall in between these 2 matrix categories.
The Results of 3X3X3 Matrix analysis and resulting interventions needed are presented in the Table 4‐30, Figure 4‐50, Figure 4‐51 and Figure 4‐52 below and a detailed slum wise analysis is presented in Appendix – C – Dwg No – 14 and 15 and Volume – II – Annexure E. The Number of Slums falling in the various categories are presented in Table 4‐30 below. Further as per the results of 3X3X3 Matrix Categories and based on the combined analysis of Tenability of Slums, Tenure status of Slum Households, Land Ownership of Slums, Density of Slums and Land Value of Slums the slums may be categorized for various requisite interventions
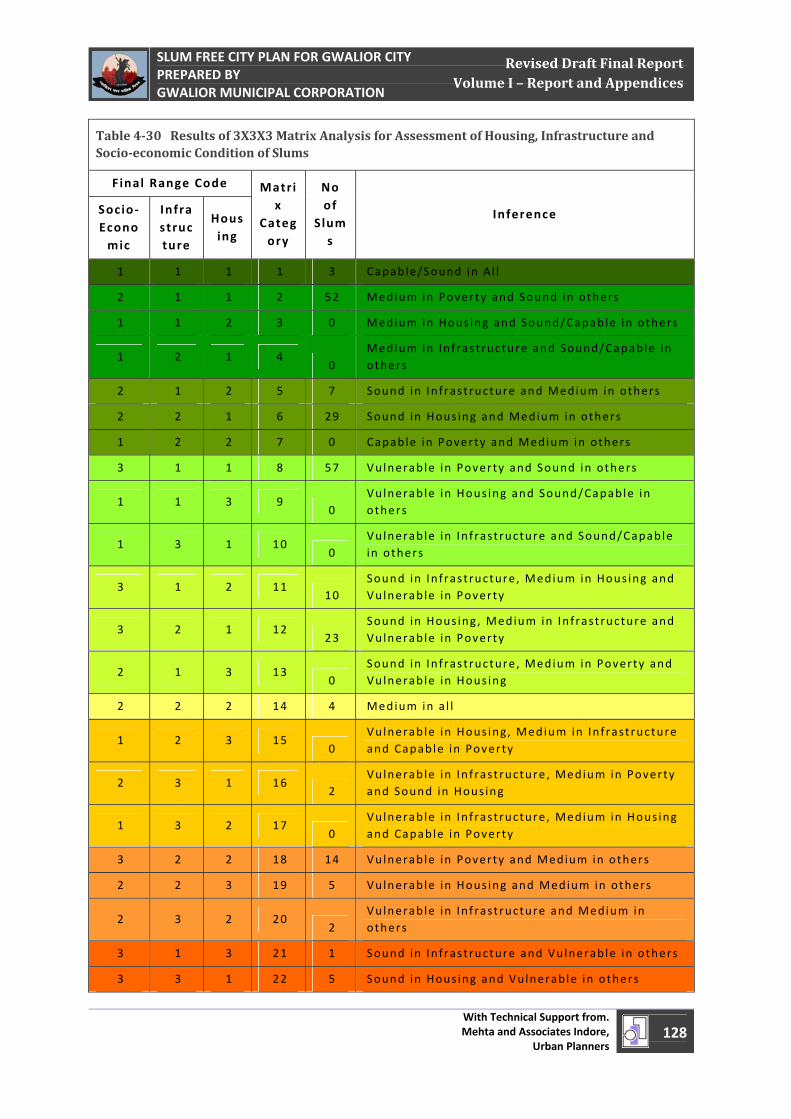
April 1, 2011
SLUM FREE CITY PLAN FOR GWALIOR CITY PREPARED BY GWALIOR MUNICIPAL CORPORATION
With Technical Support from. Mehta and Associates Indore,
Urban Planners 128
Revised Draft Final Report Volume I – Report and Appendices
Table 430 Results of 3X3X3 Matrix Analysis for Assessment of Housing, Infrastructure and Socioeconomic Condition of Slums
Final Range Code Matrix
Category
No of
Slums
Inference Socio ‐Economic
Infrastructure
Housing
1 1 1 1 3 Capable/Sound in Al l
2 1 1 2 52 Medium in Poverty and Sound in others
1 1 2 3 0 Medium in Hous ing and Sound/Capable in others
1 2 1 4 0
Medium in In f rast ructure and Sound/Capable in others
2 1 2 5 7 Sound in In frast ructure and Medium in others
2 2 1 6 29 Sound in Hous ing and Medium in others
1 2 2 7 0 Capable in Poverty and Medium in others
3 1 1 8 57 Vulnerab le in Poverty and Sound in others
1 1 3 9 0
Vulnerab le in Hous ing and Sound/Capable in others
1 3 1 10 0
Vulnerab le in In f rast ructure and Sound/Capable in others
3 1 2 11 10
Sound in In frast ructure , Medium in Hous ing and Vulnerab le in Poverty
3 2 1 12 23
Sound in Hous ing , Medium in In f rastructure and Vulnerab le in Poverty
2 1 3 13 0
Sound in In frast ructure , Medium in Poverty and Vulnerab le in Hous ing
2 2 2 14 4 Medium in al l
1 2 3 15 0
Vulnerab le in Hous ing , Medium in In f rast ructure and Capable in Poverty
2 3 1 16 2
Vulnerab le in In f rast ructure , Medium in Poverty and Sound in Hous ing
1 3 2 17 0
Vulnerab le in In f rast ructure , Medium in Hous ing and Capable in Poverty
3 2 2 18 14 Vulnerab le in Poverty and Medium in others
2 2 3 19 5 Vulnerab le in Hous ing and Medium in others
2 3 2 20 2
Vulnerab le in In f rast ructure and Medium in others
3 1 3 21 1 Sound in In frast ructure and Vulnerab le in others
3 3 1 22 5 Sound in Hous ing and Vulnerable in others
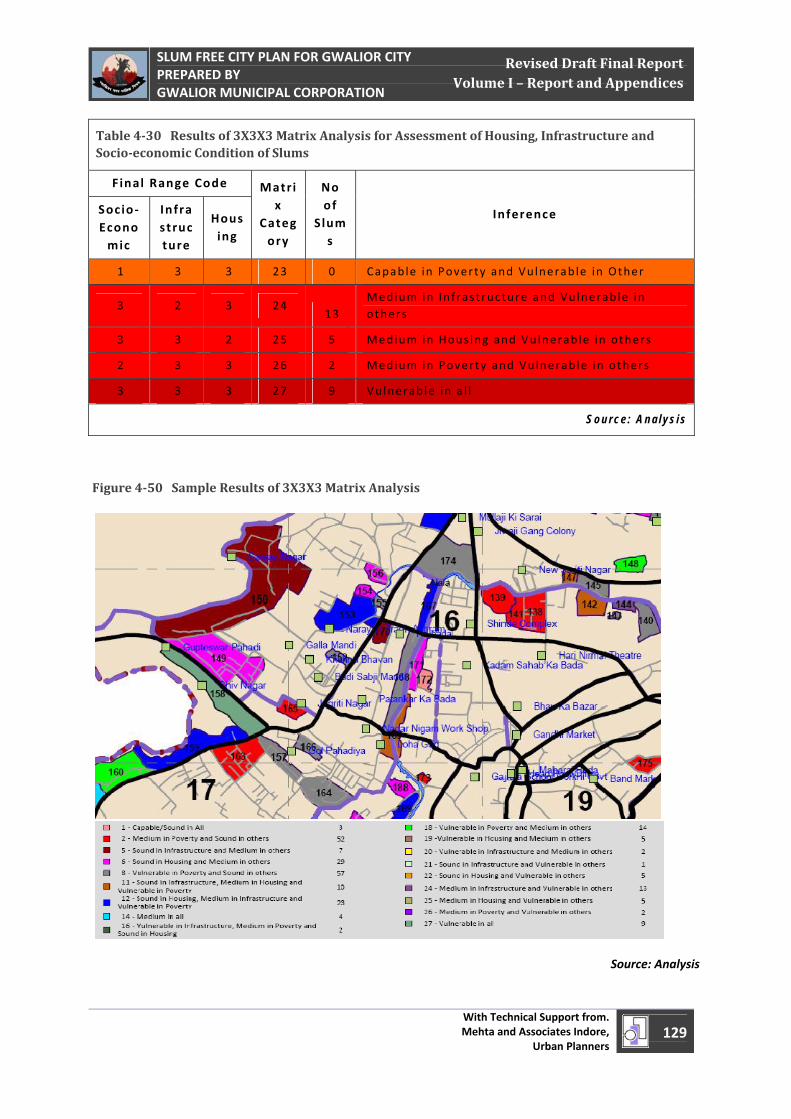
April 1, 2011
SLUM FREE CITY PLAN FOR GWALIOR CITY PREPARED BY GWALIOR MUNICIPAL CORPORATION
With Technical Support from. Mehta and Associates Indore,
Urban Planners 129
Revised Draft Final Report Volume I – Report and Appendices
Table 430 Results of 3X3X3 Matrix Analysis for Assessment of Housing, Infrastructure and Socioeconomic Condition of Slums
Final Range Code Matrix
Category
No of
Slums
Inference Socio ‐Economic
Infrastructure
Housing
1 3 3 23 0 Capable in Poverty and Vulnerable in Other
3 2 3 24 13
Medium in In f rast ructure and Vulnerab le in others
3 3 2 25 5 Medium in Hous ing and Vulnerab le in others
2 3 3 26 2 Medium in Poverty and Vulnerable in others
3 3 3 27 9 Vulnerab le in a l l
Source : Ana lys is
Figure 450 Sample Results of 3X3X3 Matrix Analysis
Source: Analysis
April 1, 2011
SLUM FREE CITY PLAN FOR GWALIOR CITY PREPARED BY GWALIOR MUNICIPAL CORPORATION
With Technical Support from. Mehta and Associates Indore,
Urban Planners 130
Revised Draft Final Report Volume I – Report and Appendices
3.9.6 3 X 3 X 3 Matrix Resulting Interventions
The Categorization based on 3X3X3 Matrix analysis of Slum Pockets was used in identification of required interventions and their priority, which has helped in Development Strategies and Implementation Priority in addition to other Analysis.
Figure 451 Results of 3X3X3 Matrix Analysis for Assessment of Housing, Infrastructure and Socioeconomic Condition of Slums
Source: Analysis
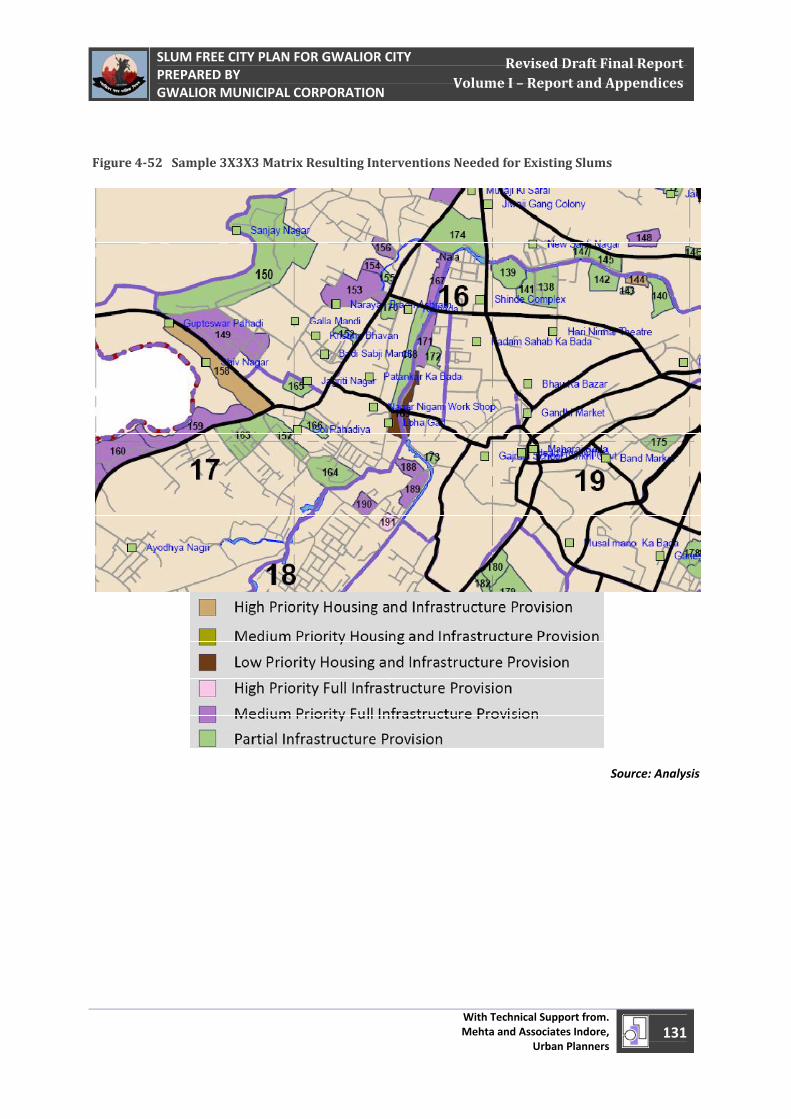
April 1, 2011
SLUM FREE CITY PLAN FOR GWALIOR CITY PREPARED BY GWALIOR MUNICIPAL CORPORATION
With Technical Support from. Mehta and Associates Indore,
Urban Planners 131
Revised Draft Final Report Volume I – Report and Appendices
Figure 452 Sample 3X3X3 Matrix Resulting Interventions Needed for Existing Slums
Source: Analysis

April 1, 2011
SLUM FREE CITY PLAN FOR GWALIOR CITY PREPARED BY GWALIOR MUNICIPAL CORPORATION
With Technical Support from. Mehta and Associates Indore,
Urban Planners 132
Revised Draft Final Report Volume I – Report and Appendices
Development of Strategies and Prioritization – Chapter – 5 5
April 1, 2011
SLUM FREE CITY PLAN FOR GWALIOR CITY PREPARED BY GWALIOR MUNICIPAL CORPORATION
With Technical Support from. Mehta and Associates Indore,
Urban Planners 133
Revised Draft Final Report Volume I – Report and Appendices
5.1 Development of Strategies
The strategy has been developed based on the analysis of Tenability of Slums and 3X3X3 Matrix analysis conducted for assessment of Housing, Infrastructure and Socio‐economic Condition. A Prevention Strategy was also identified as per the study of City Profile, Housing Scenario and Urban Development and Governance Framework and Regulations. The strategy aims at bringing about an overall development in improving the quality of life of entire Slum population in Gwalior.
5.1.1 Goal
The strategy aims at providing a permanent and secure place for the slum and squatter Households to reside and have a destination. The strategy provides a common forum to address all the socio‐economic problems of the slums and squatter settlements with the involvement of the community for a sustainable future. A city with minimum slums and squatters will not only lead to vital transformation in all social and economic indicators of development, but will also help to make Gwalior a healthier and a cleaner city for the generations to come. Increasing control of people over the processes of decision making through systems of community building and interface are the only true sustainable solutions
5.1.2 Objectives
The Strategies seeks to achieve the following objectives
Access to secure land tenure
Slums and Squatters develop because access to affordable land is denied to the under privileged section of Society. They do not have an access to the formal housing, which is why they seek informal housing. Once the land and housing become affordable and easily accessible, the phenomenon of squatting will automatically get curbed.
Reduction of Housing Poverty
Housing is an asset. It is a fundamental right. Housing poverty refers to the people who are denied housing because its supply does not match the demand and the right kind of affordable housing is not available in the market. Housing poverty is a human problem arising out of economic distress. The migration stream will continue for the next two decades especially from economically backward areas. The inflows therefore must be regulated through planned expansion of the city, away from the core.
Development of Strategies and Prioritization Chapter
5
April 1, 2011
SLUM FREE CITY PLAN FOR GWALIOR CITY PREPARED BY GWALIOR MUNICIPAL CORPORATION
With Technical Support from. Mehta and Associates Indore,
Urban Planners 134
Revised Draft Final Report Volume I – Report and Appendices
Shelter Improvement
The strategies not only aims at reduction of housing poverty but also towards improvement of the existing shelters by giving grant and loans through various programmes and schemes.
Access to Basic Services
Basic urban services that are considered bare minimum for a healthy living like water supply, sanitation, roads, solid waste disposal, etc. should be made accessible. Basic services are crucial for human capital development and poverty reduction. Improved access to social services would help in building up capacity of the poor and empowering the Slum Households to improve their own living condition and quality of life.
Integration with planning system
The objective of the strategies is to integrate the slums and squatter settlements with the formal planning system and not alienate them.
5.1.3 Strategies Identified
The Proposed Strategies are clubbed in to four categories and were assigned to every slum based on the categorization done earlier on. The various strategies are
Relocation Strategy
In Situ Upgradation and Improvement Strategy
In‐Situ Redevelopment Strategy
Prevention Strategy
The Proposed strategies of In Situ Upgradation and Improvement Strategy and In‐Situ Redevelopment Strategy also have some slums were they need to be partially relocated due to Part Tenability in the case of In Situ Upgradation and Improvement Strategy and due to High density above permissible densities of existing Households in the case of In‐Situ Redevelopment Strategy.
5.2 Proposed Strategies
The Assignment of strategies for every slum in Gwalior are presented in the Figure 5‐53 and Table 5‐31 below and a detailed slum wise Strategies Assigned are presented in Appendix – C – Dwg No – 16 and Volume – II – Annexure G. Out of 243 Existing Slum Pockets in Gwalior 9 Slum Pockets have been assigned Relocation Strategy 119 Slum Pockets have been assigned In Situ Upgradation and Improvement Strategy out of which 80 also involve Relocation of un‐Tenable Households, and 35 Slum Pockets have been assigned with In‐Situ Redevelopment Strategy out of which two slums are High Density Slums were additional Households above the permissible Density are to be relocated.
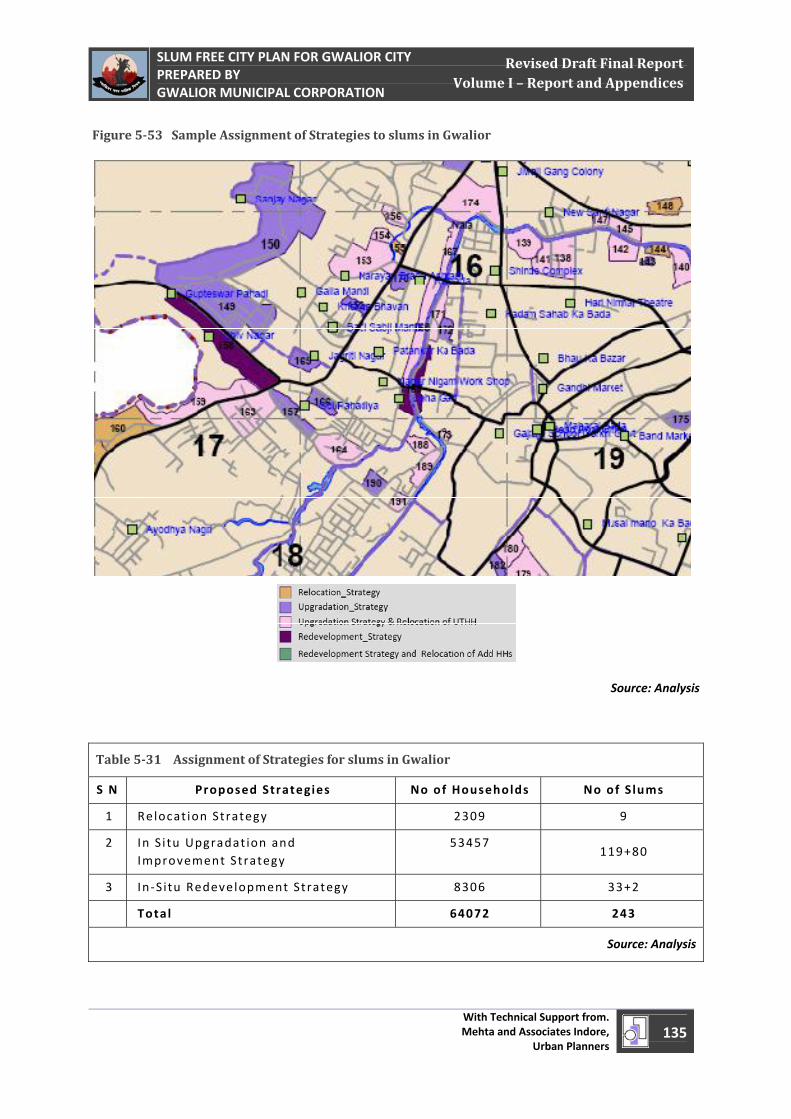
April 1, 2011
SLUM FREE CITY PLAN FOR GWALIOR CITY PREPARED BY GWALIOR MUNICIPAL CORPORATION
With Technical Support from. Mehta and Associates Indore,
Urban Planners 135
Revised Draft Final Report Volume I – Report and Appendices
Figure 553 Sample Assignment of Strategies to slums in Gwalior
Source: Analysis
Table 531 Assignment of Strategies for slums in Gwalior
S N Proposed Strategies No of Households No of Slums
1 Relocat ion Strategy 2309 9
2 In Situ Upgradat ion and Improvement Strategy
53457 119+80
3 In ‐S itu Redevelopment Strategy 8306 33+2
Total 64072 243
Source: Analysis
April 1, 2011
SLUM FREE CITY PLAN FOR GWALIOR CITY PREPARED BY GWALIOR MUNICIPAL CORPORATION
With Technical Support from. Mehta and Associates Indore,
Urban Planners 136
Revised Draft Final Report Volume I – Report and Appendices
5.2.1 Relocation Strategy
Relocation Strategy has been chosen for Un‐Tenable Slums and Un‐Tenable Households of Partially Tenable Slums. There are 9 Slums which need to be wholly relocated and there are 82 Slums of which some of the Households need to be relocated due to them located on un‐tenable area or the slums have high density and some of the Households need to be relocated as they can’t be accommodated at the same site in Redevelopment.
Thus the Total No of Households under Relocation strategy are; Complete Slum Relocation of 2309 Households from 9 un‐tenable Slums and Partial Slum Relocation of 82 partially tenable Slums with 5446 Households falling on un‐Tenable Area.
5.2.2 In Situ Up gradation and Improvement Strategy
In Situ Up gradation and Improvement Strategy has been chosen for Tenable Slums and Tenable Households from Partially Tenable Slums with predominant Pucca Structures and Poor/average Infrastructure. There are 199 such Slums which need to be upgraded with the Total Households of 53457. Out of the Total 53457 Households in which 7374 Households spread across 133 slums, have kutcha Houses thus they need Housing along with Infrastructure and proposed to be provided with Gap Filling Housing.
5.2.3 InSitu Redevelopment Strategy
In Situ Redevelopment Strategy has been chosen for Tenable Slums and Partially Tenable slums with predominant Kutcha Structures and Poor Infrastructure. There are 35 such Slums which need to be redeveloped with the Total Households of 8306. Out of the Total 8306 Households, 970 Households spread across 9 slums of the total 35 slums, have pucca Houses thus they need Infrastructure only. While there are around 826 Households in partially tenable slum location or high density slums which need to be relocated in nearby redevelopment or relocation site which has been included in Relocation Strategy. Rest 6510 Households need both Infrastructure and Housing.
5.2.4 Prevention Strategy
Preventions Strategy involves actions by State Government and Urban Local Bodies (i.e. GMC, GDA & MPHB) so that slums are not created in future. Under the Prevention strategy apart from statutory and regulatory reforms required through state level policy interventions, options have been developed to be implemented by GDA, GMC or MPHB through their schemes. The Proposed Option is Creation of affordable housing and disposal of the same to target groups. The need for affordable housing has been derived from existing Housing scenario of Gwalior and its Housing Demand Assessment.
The Prevention Strategy is proposed to be implemented by Municipal Corporation and other Parastatal Agencies like Development Authority, Housing Board etc. in an Integrated
April 1, 2011
SLUM FREE CITY PLAN FOR GWALIOR CITY PREPARED BY GWALIOR MUNICIPAL CORPORATION
With Technical Support from. Mehta and Associates Indore,
Urban Planners 137
Revised Draft Final Report Volume I – Report and Appendices
manner. The Creation and Disposal of Affordable Housing Units for EWS and LIG are worked out on the baseis of Demand Calculations in Chapter 4
Preventive strategy aims to
• Restrict\ prevent the formation of slums in future, • Correcting the supply and demand constraints in the housing market for Urban Poor.
The aims of Prevention strategy may be achieved through Direct Interventions for increasing Affordable Housing Stock as well as regulatory interventions to ensure supply of Affordable housing to EWS and LIG. As per the Housing Demand Assessment Gwalior requires about 8000 to 9000 Housing Units per Year during 2014‐18, of which 2500 to 3000 per Year is for EWS and LIG.
The Prevention Strategy is proposed to be implemented through
• Ensuring Affordable Housing stock by way of Reservations under Madhya Pradesh Nagar Palika (Registration of Colonizer, Terms and Condition) Rules, 1998
o Colonizer has to Reserve 15% of the Dwelling units for EWS and LIG, further the Proportion of EWS and LIG Dwelling Units are required to be provided in the ratio of 3:2. So out of total housing Demand,
o Thus 15% of the 9000 Housing Units i.e. 1350 Housing Units will be catered by Private Developer, Gwalior Development Authority and Madhya Pradesh Housing Board in their Schemes.
o This accounts for 45% of Affordable Housing Units Demand for EWS and LIG
The Remaining 1650 odd Affordable Housing Units (55% of Affordable Housing Units Demand for EWS and LIG ) are proposed to be created through special Projects for Urban Poor as Rental Housing and Affordable Housing Projects under RAY.
• Rental Housing o 20% of Affordable Housing Units Demand for EWS and LIG as Rental Housing
to be implemented by Gwalior Municipal Corporation • Special Affordable Housing Projects
o Remaining 40% of Affordable Housing Units Demand for EWS and LIG as Special Affordable Housing Projects/ Schemes to be implemented by Gwalior Development Authority and Madhya Pradesh Housing Board
5.3 Development of Options
Various Options were identified for every slum under abovementioned different strategies based on the Categorization as per Strategies Assigned, Land Ownership of Slum Pockets, Residential/Tenable Area Density of the Slum Pockets and Land Value of the Slum Pockets. While under Prevention Strategy Options were identified to create Housing Stock for Economically Weaker Section.
Figure 554 Sample Identification of Options under Various Strategies for slums in Gwalior
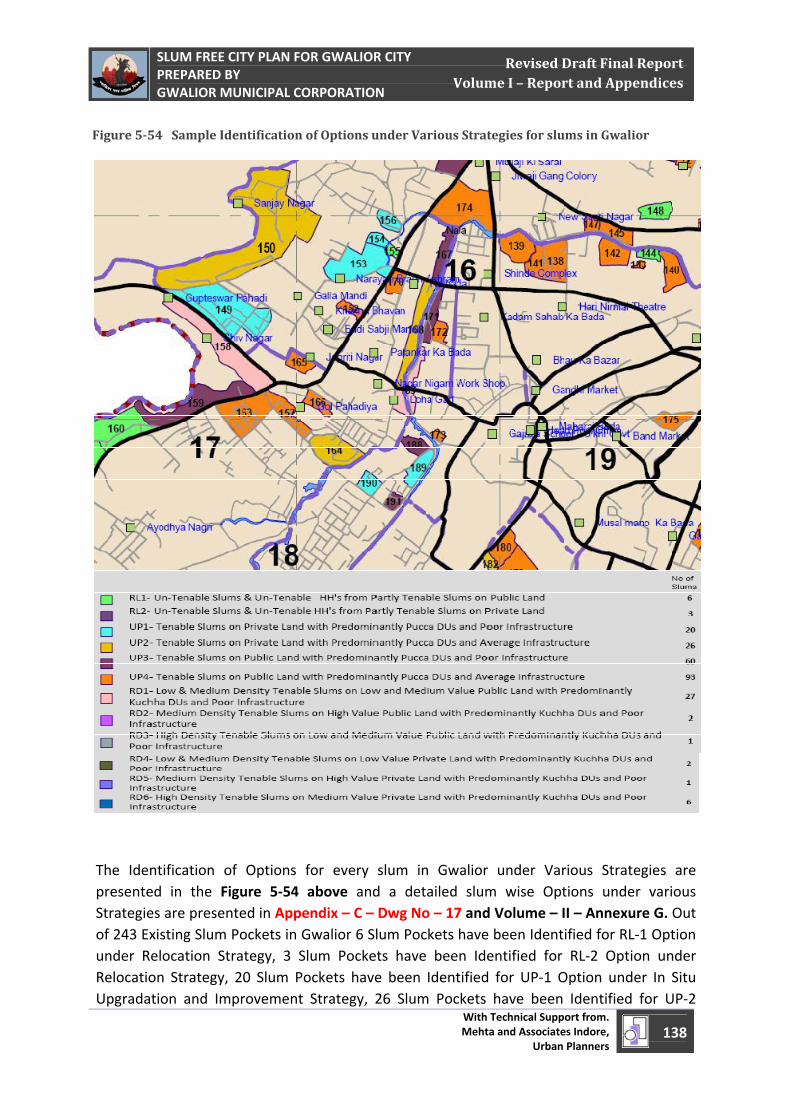
April 1, 2011
SLUM FREE CITY PLAN FOR GWALIOR CITY PREPARED BY GWALIOR MUNICIPAL CORPORATION
With Technical Support from. Mehta and Associates Indore,
Urban Planners 138
Revised Draft Final Report Volume I – Report and Appendices
Figure 554 Sample Identification of Options under Various Strategies for slums in Gwalior
The Identification of Options for every slum in Gwalior under Various Strategies are presented in the Figure 5‐54 above and a detailed slum wise Options under various Strategies are presented in Appendix – C – Dwg No – 17 and Volume – II – Annexure G. Out of 243 Existing Slum Pockets in Gwalior 6 Slum Pockets have been Identified for RL‐1 Option under Relocation Strategy, 3 Slum Pockets have been Identified for RL‐2 Option under Relocation Strategy, 20 Slum Pockets have been Identified for UP‐1 Option under In Situ Upgradation and Improvement Strategy, 26 Slum Pockets have been Identified for UP‐2
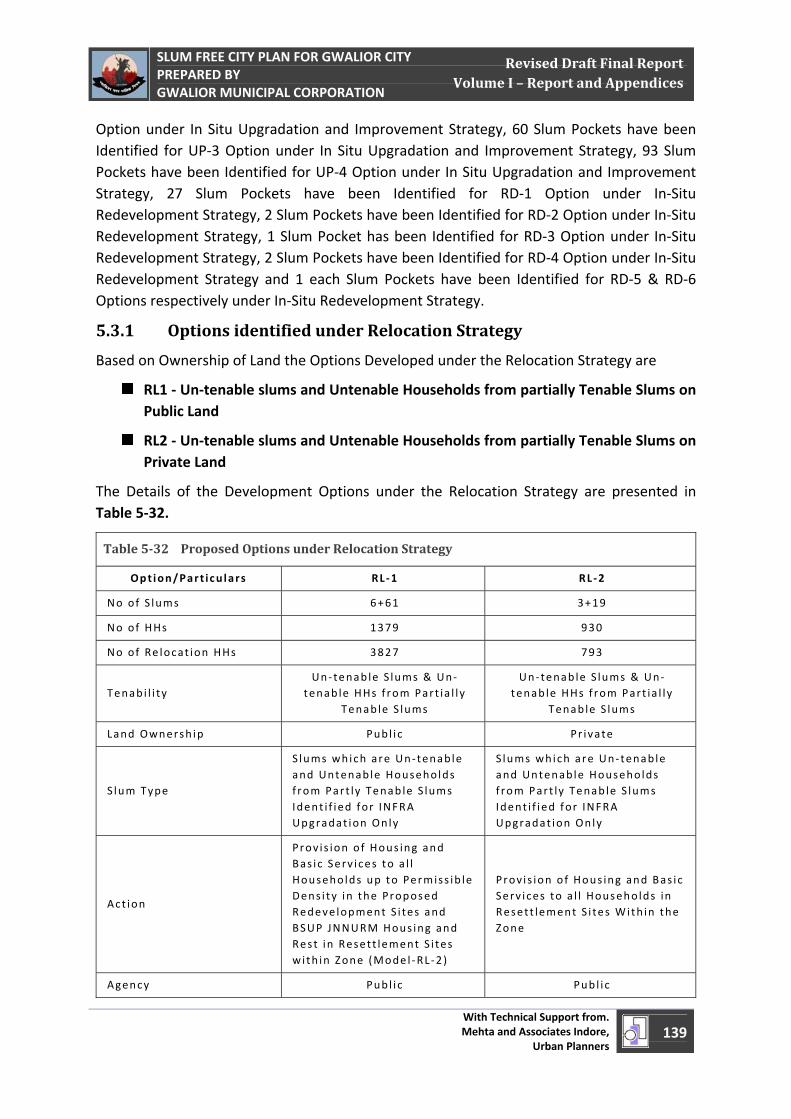
April 1, 2011
SLUM FREE CITY PLAN FOR GWALIOR CITY PREPARED BY GWALIOR MUNICIPAL CORPORATION
With Technical Support from. Mehta and Associates Indore,
Urban Planners 139
Revised Draft Final Report Volume I – Report and Appendices
Option under In Situ Upgradation and Improvement Strategy, 60 Slum Pockets have been Identified for UP‐3 Option under In Situ Upgradation and Improvement Strategy, 93 Slum Pockets have been Identified for UP‐4 Option under In Situ Upgradation and Improvement Strategy, 27 Slum Pockets have been Identified for RD‐1 Option under In‐Situ Redevelopment Strategy, 2 Slum Pockets have been Identified for RD‐2 Option under In‐Situ Redevelopment Strategy, 1 Slum Pocket has been Identified for RD‐3 Option under In‐Situ Redevelopment Strategy, 2 Slum Pockets have been Identified for RD‐4 Option under In‐Situ Redevelopment Strategy and 1 each Slum Pockets have been Identified for RD‐5 & RD‐6 Options respectively under In‐Situ Redevelopment Strategy.
5.3.1 Options identified under Relocation Strategy
Based on Ownership of Land the Options Developed under the Relocation Strategy are
RL1 ‐ Un‐tenable slums and Untenable Households from partially Tenable Slums on Public Land
RL2 ‐ Un‐tenable slums and Untenable Households from partially Tenable Slums on Private Land
The Details of the Development Options under the Relocation Strategy are presented in Table 5‐32.
Table 532 Proposed Options under Relocation Strategy
Option/Part icu lars RL ‐1 RL ‐2
No of S lums 6+61 3+19
No of HHs 1379 930
No of Re locat ion HHs 3827 793
Tenab i l i ty Un ‐ tenab le S lums & Un ‐
tenab le HHs f rom Part ia l l y Tenab le S lums
Un ‐ tenab le S lums & Un ‐tenab le HHs f rom Part ia l l y
Tenab le S lums
Land Ownersh ip Publ i c Pr ivate
S lum Type
S lums which are Un ‐ tenable and Untenable Households f rom Part ly Tenab le S lums Ident i f ied for INFRA Upgradat ion Only
S lums which are Un ‐ tenable and Untenable Households f rom Part ly Tenab le S lums Ident i f ied for INFRA Upgradat ion Only
Act ion
Prov i s ion of Hous ing and Bas ic Serv ices to a l l Households up to Permiss ib le Dens i ty in the Proposed Redeve lopment S i tes and BSUP JNNURM Hous ing and Rest in Resett lement S i tes with in Zone (Mode l ‐RL ‐2)
Prov i s ion of Hous ing and Bas ic Serv ices to a l l Households in Reset t lement S i tes With in the Zone
Agency Publ i c Publ i c
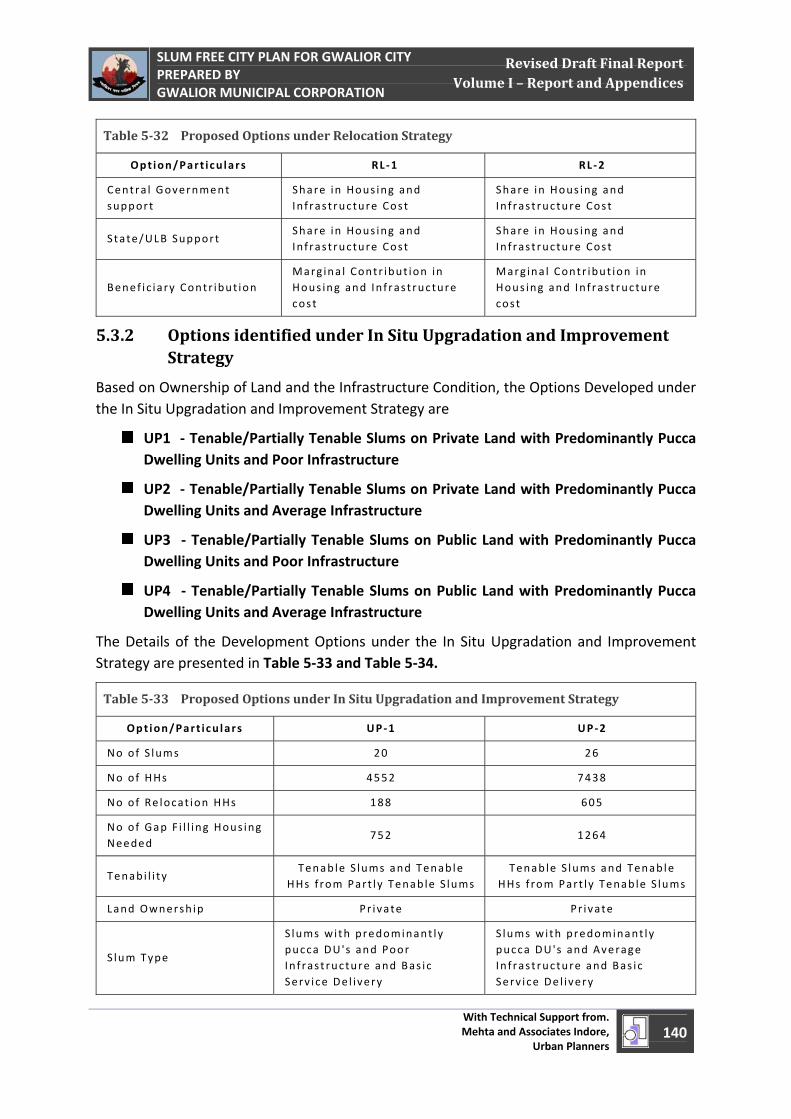
April 1, 2011
SLUM FREE CITY PLAN FOR GWALIOR CITY PREPARED BY GWALIOR MUNICIPAL CORPORATION
With Technical Support from. Mehta and Associates Indore,
Urban Planners 140
Revised Draft Final Report Volume I – Report and Appendices
Table 532 Proposed Options under Relocation Strategy
Option/Part icu lars RL ‐1 RL ‐2
Centra l Government support
Share in Hous ing and In f ras t ructure Cost
Share in Hous ing and In f ras t ructure Cost
State/ULB Support Share in Hous ing and In f ras t ructure Cost
Share in Hous ing and In f ras t ructure Cost
Benef ic ia ry Contr ibut ion Marg ina l Contr ibut ion in Hous ing and In f ras t ructure cos t
Marg ina l Contr ibut ion in Hous ing and In f ras t ructure cos t
5.3.2 Options identified under In Situ Upgradation and Improvement Strategy
Based on Ownership of Land and the Infrastructure Condition, the Options Developed under the In Situ Upgradation and Improvement Strategy are
UP1 ‐ Tenable/Partially Tenable Slums on Private Land with Predominantly Pucca Dwelling Units and Poor Infrastructure
UP2 ‐ Tenable/Partially Tenable Slums on Private Land with Predominantly Pucca Dwelling Units and Average Infrastructure
UP3 ‐ Tenable/Partially Tenable Slums on Public Land with Predominantly Pucca Dwelling Units and Poor Infrastructure
UP4 ‐ Tenable/Partially Tenable Slums on Public Land with Predominantly Pucca Dwelling Units and Average Infrastructure
The Details of the Development Options under the In Situ Upgradation and Improvement Strategy are presented in Table 5‐33 and Table 5‐34.
Table 533 Proposed Options under In Situ Upgradation and Improvement Strategy
Option/Part icu lars UP ‐1 UP ‐2
No of S lums 20 26
No of HHs 4552 7438
No of Re locat ion HHs 188 605
No of Gap F i l l ing Hous ing Needed
752 1264
Tenab i l i ty Tenab le S lums and Tenab le
HHs f rom Part ly Tenab le S lums Tenab le S lums and Tenab le
HHs f rom Part ly Tenab le S lums
Land Ownersh ip Pr ivate Pr ivate
S lum Type
S lums with predominant ly pucca DU's and Poor In f ras t ructure and Bas ic Serv ice Del ivery
S lums with predominant ly pucca DU's and Average In f ras t ructure and Bas ic Serv ice Del ivery
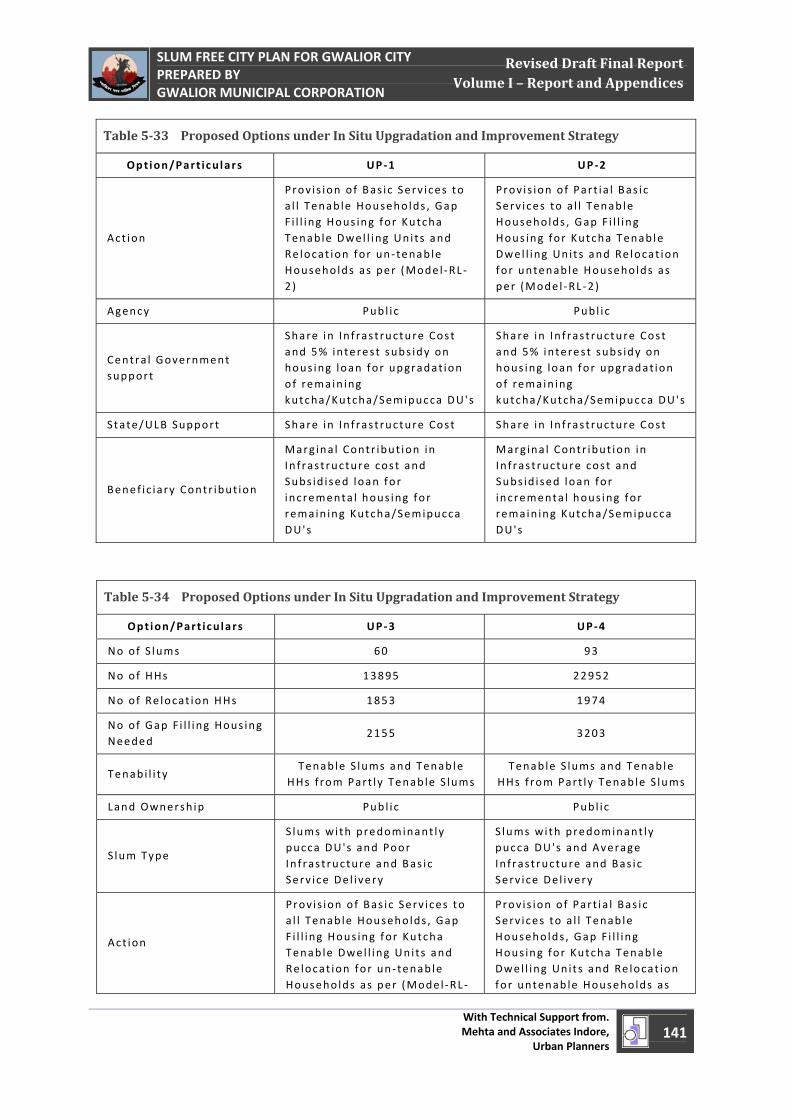
April 1, 2011
SLUM FREE CITY PLAN FOR GWALIOR CITY PREPARED BY GWALIOR MUNICIPAL CORPORATION
With Technical Support from. Mehta and Associates Indore,
Urban Planners 141
Revised Draft Final Report Volume I – Report and Appendices
Table 533 Proposed Options under In Situ Upgradation and Improvement Strategy
Option/Part icu lars UP ‐1 UP ‐2
Act ion
Prov i s ion of Bas ic Serv ices to a l l Tenab le Househo lds , Gap F i l l ing Hous ing for Kutcha Tenab le Dwel l ing Uni ts and Re locat ion for un ‐ tenab le Households as per (Mode l ‐RL ‐2)
Prov i s ion of Part ia l Bas ic Serv ices to a l l Tenab le Households , Gap F i l l ing Hous ing for Kutcha Tenab le Dwel l ing Units and Re locat ion for untenab le Households as per (Mode l ‐RL ‐2)
Agency Publ i c Publ i c
Centra l Government support
Share in In f ras t ructure Cost and 5% in teres t subs idy on hous ing loan for upgradat ion of remain ing kutcha/Kutcha/Semipucca DU's
Share in In f ras t ructure Cost and 5% in teres t subs idy on hous ing loan for upgradat ion of remain ing kutcha/Kutcha/Semipucca DU's
State/ULB Support Share in In f ras t ructure Cost Share in In f ras t ructure Cost
Benef ic ia ry Contr ibut ion
Marg ina l Contr ibut ion in In f ras t ructure cos t and Subs id i sed loan for incrementa l hous ing for remain ing Kutcha/Semipucca DU's
Marg ina l Contr ibut ion in In f ras t ructure cos t and Subs id i sed loan for incrementa l hous ing for remain ing Kutcha/Semipucca DU's
Table 534 Proposed Options under In Situ Upgradation and Improvement Strategy
Option/Part icu lars UP ‐3 UP ‐4
No of S lums 60 93
No of HHs 13895 22952
No of Re locat ion HHs 1853 1974
No of Gap F i l l ing Hous ing Needed
2155 3203
Tenab i l i ty Tenab le S lums and Tenab le
HHs f rom Part ly Tenab le S lums Tenab le S lums and Tenab le
HHs f rom Part ly Tenab le S lums
Land Ownersh ip Publ i c Publ i c
S lum Type
S lums with predominant ly pucca DU's and Poor In f ras t ructure and Bas ic Serv ice Del ivery
S lums with predominant ly pucca DU's and Average In f ras t ructure and Bas ic Serv ice Del ivery
Act ion
Prov i s ion of Bas ic Serv ices to a l l Tenab le Househo lds , Gap F i l l ing Hous ing for Kutcha Tenab le Dwel l ing Uni ts and Re locat ion for un ‐ tenab le Households as per (Mode l ‐RL ‐
Prov i s ion of Part ia l Bas ic Serv ices to a l l Tenab le Households , Gap F i l l ing Hous ing for Kutcha Tenab le Dwel l ing Units and Re locat ion for untenab le Households as
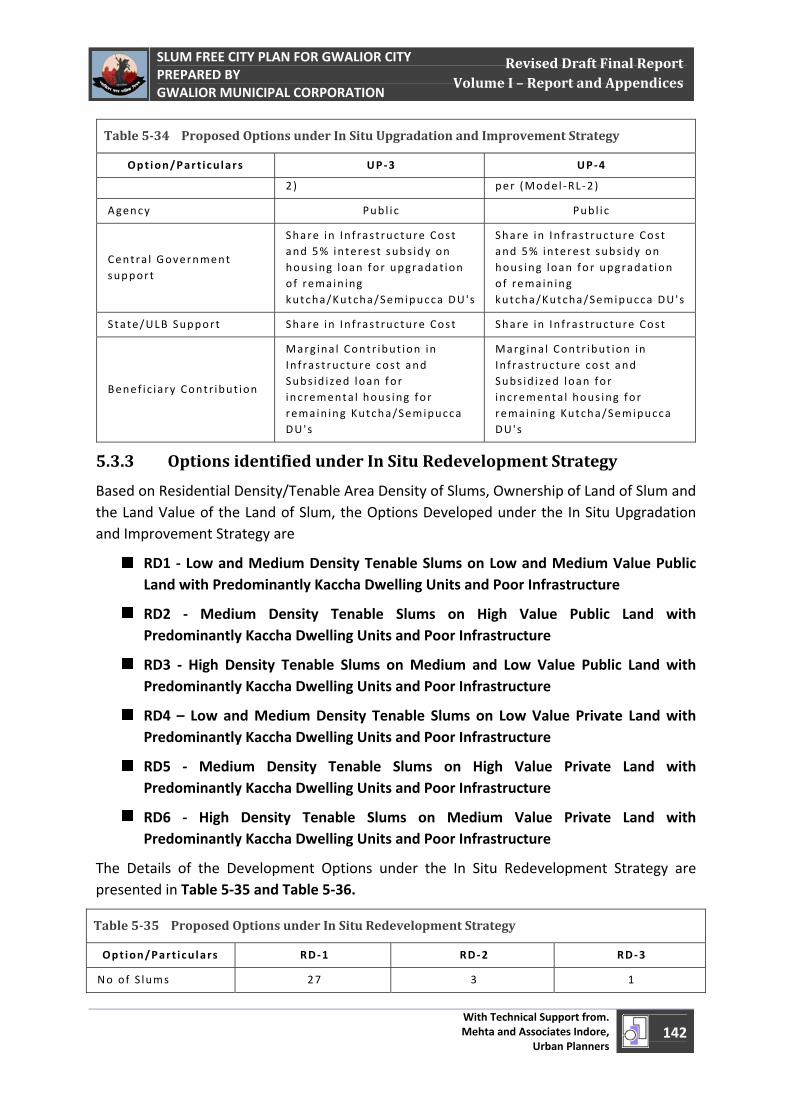
April 1, 2011
SLUM FREE CITY PLAN FOR GWALIOR CITY PREPARED BY GWALIOR MUNICIPAL CORPORATION
With Technical Support from. Mehta and Associates Indore,
Urban Planners 142
Revised Draft Final Report Volume I – Report and Appendices
Table 534 Proposed Options under In Situ Upgradation and Improvement Strategy
Option/Part icu lars UP ‐3 UP ‐4
2) per (Mode l ‐RL ‐2)
Agency Publ i c Publ i c
Centra l Government support
Share in In f ras t ructure Cost and 5% in teres t subs idy on hous ing loan for upgradat ion of remain ing kutcha/Kutcha/Semipucca DU's
Share in In f ras t ructure Cost and 5% in teres t subs idy on hous ing loan for upgradat ion of remain ing kutcha/Kutcha/Semipucca DU's
State/ULB Support Share in In f ras t ructure Cost Share in In f ras t ructure Cost
Benef ic ia ry Contr ibut ion
Marg ina l Contr ibut ion in In f ras t ructure cos t and Subs id i zed loan for incrementa l hous ing for remain ing Kutcha/Semipucca DU's
Marg ina l Contr ibut ion in In f ras t ructure cos t and Subs id i zed loan for incrementa l hous ing for remain ing Kutcha/Semipucca DU's
5.3.3 Options identified under In Situ Redevelopment Strategy
Based on Residential Density/Tenable Area Density of Slums, Ownership of Land of Slum and the Land Value of the Land of Slum, the Options Developed under the In Situ Upgradation and Improvement Strategy are
RD1 ‐ Low and Medium Density Tenable Slums on Low and Medium Value Public Land with Predominantly Kaccha Dwelling Units and Poor Infrastructure
RD2 ‐ Medium Density Tenable Slums on High Value Public Land with Predominantly Kaccha Dwelling Units and Poor Infrastructure
RD3 ‐ High Density Tenable Slums on Medium and Low Value Public Land with Predominantly Kaccha Dwelling Units and Poor Infrastructure
RD4 – Low and Medium Density Tenable Slums on Low Value Private Land with Predominantly Kaccha Dwelling Units and Poor Infrastructure
RD5 ‐ Medium Density Tenable Slums on High Value Private Land with Predominantly Kaccha Dwelling Units and Poor Infrastructure
RD6 ‐ High Density Tenable Slums on Medium Value Private Land with Predominantly Kaccha Dwelling Units and Poor Infrastructure
The Details of the Development Options under the In Situ Redevelopment Strategy are presented in Table 5‐35 and Table 5‐36.
Table 535 Proposed Options under In Situ Redevelopment Strategy
Option/Part icu lars RD ‐1 RD ‐2 RD ‐3
No of S lums 27 3 1
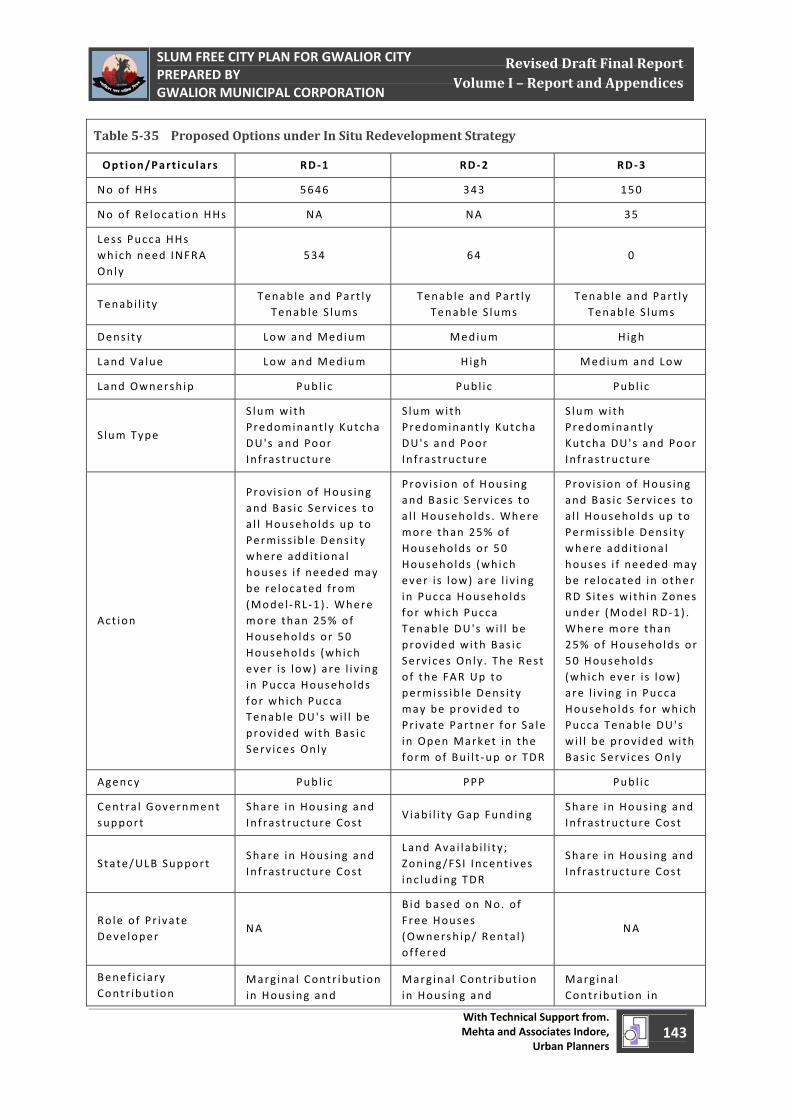
April 1, 2011
SLUM FREE CITY PLAN FOR GWALIOR CITY PREPARED BY GWALIOR MUNICIPAL CORPORATION
With Technical Support from. Mehta and Associates Indore,
Urban Planners 143
Revised Draft Final Report Volume I – Report and Appendices
Table 535 Proposed Options under In Situ Redevelopment Strategy
Option/Part icu lars RD ‐1 RD ‐2 RD ‐3
No of HHs 5646 343 150
No of Re locat ion HHs NA NA 35
Less Pucca HHs which need INFRA Only
534 64 0
Tenab i l i ty Tenab le and Part ly
Tenab le S lums Tenab le and Part ly
Tenab le S lums Tenab le and Part ly
Tenab le S lums
Dens i ty Low and Medium Medium High
Land Va lue Low and Medium High Medium and Low
Land Ownersh ip Publ i c Publ i c Publ i c
S lum Type
S lum with Predominant ly Kutcha DU's and Poor In f ras t ructure
S lum with Predominant ly Kutcha DU's and Poor In f ras t ructure
S lum with Predominant ly Kutcha DU's and Poor In f ras t ructure
Act ion
Prov i s ion of Hous ing and Bas ic Serv ices to a l l Households up to Permiss ib le Dens i ty where add i t iona l houses i f needed may be re located f rom (Mode l ‐RL ‐1) . Where more than 25% of Households or 50 Households (which ever i s low) are l i v ing in Pucca Households for which Pucca Tenab le DU's wi l l be prov ided with Bas ic Serv ices Only
Prov i s ion of Hous ing and Bas ic Serv ices to a l l Households . Where more than 25% of Households or 50 Households (which ever i s low) are l i v ing in Pucca Households for which Pucca Tenab le DU's wi l l be prov ided with Bas ic Serv ices Only . The Rest of the FAR Up to permiss ib le Dens i ty may be prov ided to Pr ivate Partner for Sa le in Open Market in the form of Bu i l t ‐up or TDR
Prov i s ion of Hous ing and Bas ic Serv ices to a l l Households up to Permiss ib le Dens i ty where add i t iona l houses i f needed may be re located in other RD S i tes with in Zones under (Model RD ‐1) . Where more than 25% of Households or 50 Househo lds (which ever i s low) are l i v ing in Pucca Households for which Pucca Tenab le DU's wi l l be prov ided with Bas ic Serv ices Only
Agency Publ i c PPP Publ i c
Centra l Government support
Share in Hous ing and In f ras t ructure Cost
Viab i l i ty Gap Fund ing Share in Hous ing and In f ras t ructure Cost
State/ULB Support Share in Hous ing and In f ras t ructure Cost
Land Ava i lab i l i ty ; Zoning/FS I Incent ives i nc lud ing TDR
Share in Hous ing and In f ras t ructure Cost
Role of Pr ivate Deve loper
NA
B id based on No. of Free Houses (Ownersh ip/ Renta l ) of fered
NA
Benef ic ia ry Contr ibut ion
Marg ina l Contr ibut ion in Hous ing and
Marg ina l Contr ibut ion in Hous ing and
Marg ina l Contr ibut ion in
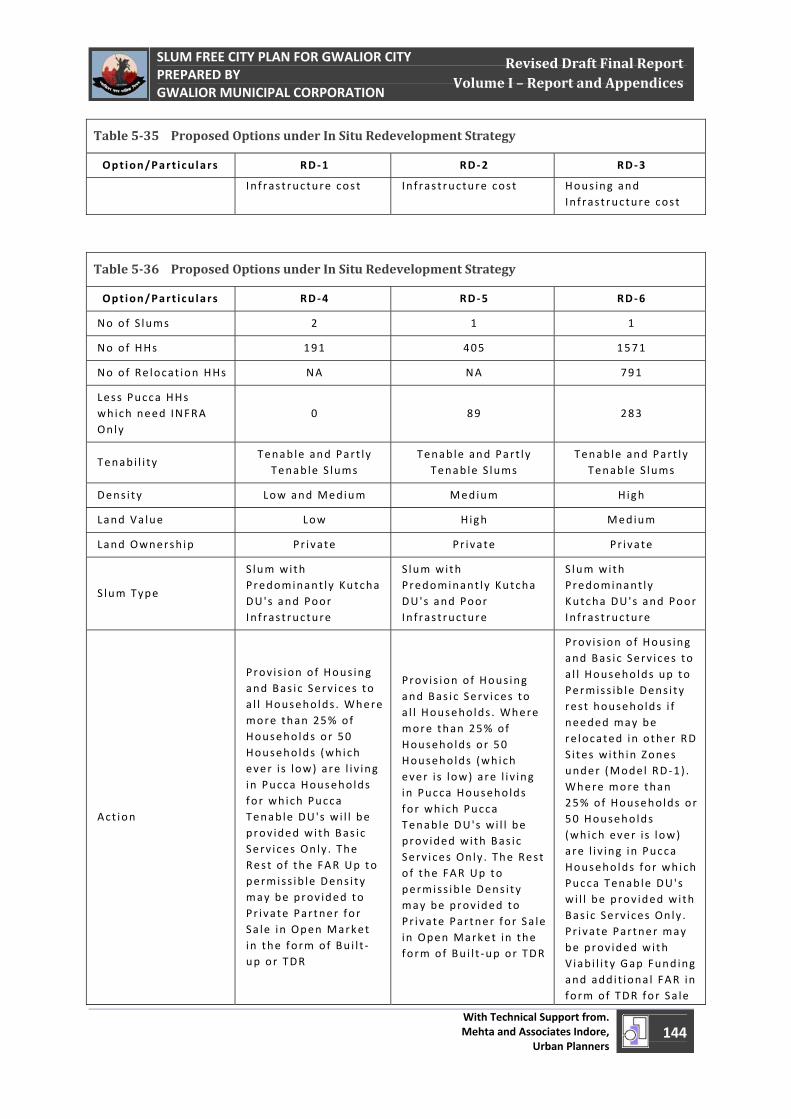
April 1, 2011
SLUM FREE CITY PLAN FOR GWALIOR CITY PREPARED BY GWALIOR MUNICIPAL CORPORATION
With Technical Support from. Mehta and Associates Indore,
Urban Planners 144
Revised Draft Final Report Volume I – Report and Appendices
Table 535 Proposed Options under In Situ Redevelopment Strategy
Option/Part icu lars RD ‐1 RD ‐2 RD ‐3
In f ras t ructure cos t In f ras t ructure cos t Hous ing and In f ras t ructure cos t
Table 536 Proposed Options under In Situ Redevelopment Strategy
Option/Part icu lars RD ‐4 RD ‐5 RD ‐6
No of S lums 2 1 1
No of HHs 191 405 1571
No of Re locat ion HHs NA NA 791
Less Pucca HHs which need INFRA Only
0 89 283
Tenab i l i ty Tenab le and Part ly
Tenab le S lums Tenab le and Part ly
Tenab le S lums Tenab le and Part ly
Tenab le S lums
Dens i ty Low and Medium Medium High
Land Va lue Low High Medium
Land Ownersh ip Pr ivate Pr ivate Pr ivate
S lum Type
S lum with Predominant ly Kutcha DU's and Poor In f ras t ructure
S lum with Predominant ly Kutcha DU's and Poor In f ras t ructure
S lum with Predominant ly Kutcha DU's and Poor In f ras t ructure
Act ion
Prov i s ion of Hous ing and Bas ic Serv ices to a l l Households . Where more than 25% of Households or 50 Households (which ever i s low) are l i v ing in Pucca Households for which Pucca Tenab le DU's wi l l be prov ided with Bas ic Serv ices Only . The Rest of the FAR Up to permiss ib le Dens i ty may be prov ided to Pr ivate Partner for Sa le in Open Market in the form of Bu i l t ‐up or TDR
Prov i s ion of Hous ing and Bas ic Serv ices to a l l Households . Where more than 25% of Households or 50 Households (which ever i s low) are l i v ing in Pucca Households for which Pucca Tenab le DU's wi l l be prov ided with Bas ic Serv ices Only . The Rest of the FAR Up to permiss ib le Dens i ty may be prov ided to Pr ivate Partner for Sa le in Open Market in the form of Bu i l t ‐up or TDR
Prov i s ion of Hous ing and Bas ic Serv ices to a l l Households up to Permiss ib le Dens i ty rest households i f needed may be re located in other RD S i tes with in Zones under (Model RD ‐1) . Where more than 25% of Households or 50 Househo lds (which ever i s low) are l i v ing in Pucca Households for which Pucca Tenab le DU's wi l l be prov ided with Bas ic Serv ices Only . Pr ivate Partner may be prov ided with Viab i l i ty Gap Fund ing and add i t iona l FAR in form of TDR for Sa le
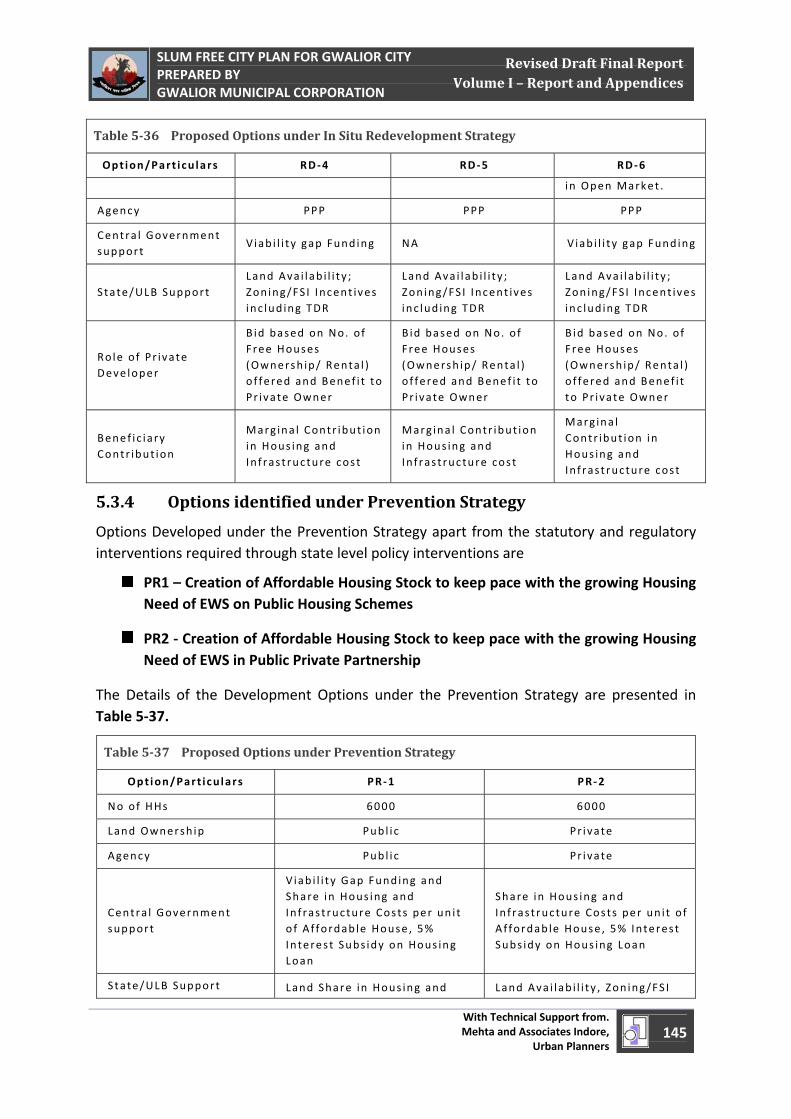
April 1, 2011
SLUM FREE CITY PLAN FOR GWALIOR CITY PREPARED BY GWALIOR MUNICIPAL CORPORATION
With Technical Support from. Mehta and Associates Indore,
Urban Planners 145
Revised Draft Final Report Volume I – Report and Appendices
Table 536 Proposed Options under In Situ Redevelopment Strategy
Option/Part icu lars RD ‐4 RD ‐5 RD ‐6
in Open Market .
Agency PPP PPP PPP
Centra l Government support
Viab i l i ty gap Fund ing NA Viab i l i ty gap Fund ing
State/ULB Support Land Ava i lab i l i ty ; Zoning/FS I Incent ives i nc lud ing TDR
Land Ava i lab i l i ty ; Zoning/FS I Incent ives i nc lud ing TDR
Land Ava i lab i l i ty ; Zoning/FS I Incent ives i nc lud ing TDR
Role of Pr ivate Deve loper
B id based on No. of Free Houses (Ownersh ip/ Renta l ) of fered and Benef i t to Pr ivate Owner
B id based on No. of Free Houses (Ownersh ip/ Renta l ) of fered and Benef i t to Pr ivate Owner
B id based on No. of Free Houses (Ownersh ip/ Renta l ) of fered and Benef i t to Pr ivate Owner
Benef ic ia ry Contr ibut ion
Marg ina l Contr ibut ion in Hous ing and In f ras t ructure cos t
Marg ina l Contr ibut ion in Hous ing and In f ras t ructure cos t
Marg ina l Contr ibut ion in Hous ing and In f ras t ructure cos t
5.3.4 Options identified under Prevention Strategy
Options Developed under the Prevention Strategy apart from the statutory and regulatory interventions required through state level policy interventions are
PR1 – Creation of Affordable Housing Stock to keep pace with the growing Housing Need of EWS on Public Housing Schemes
PR2 ‐ Creation of Affordable Housing Stock to keep pace with the growing Housing Need of EWS in Public Private Partnership
The Details of the Development Options under the Prevention Strategy are presented in Table 5‐37.
Table 537 Proposed Options under Prevention Strategy
Option/Part icu lars PR ‐1 PR ‐2
No of HHs 6000 6000
Land Ownersh ip Publ i c Pr ivate
Agency Publ i c Pr ivate
Centra l Government support
Viab i l i ty Gap Fund ing and Share in Hous ing and In f ras t ructure Costs per un i t of Affordab le House , 5% In teres t Subs idy on Hous ing Loan
Share in Hous ing and In f ras t ructure Costs per un i t of Affordab le House , 5% In teres t Subs idy on Hous ing Loan
State/ULB Support Land Share in Hous ing and Land Ava i lab i l i ty , Zon ing/FS I
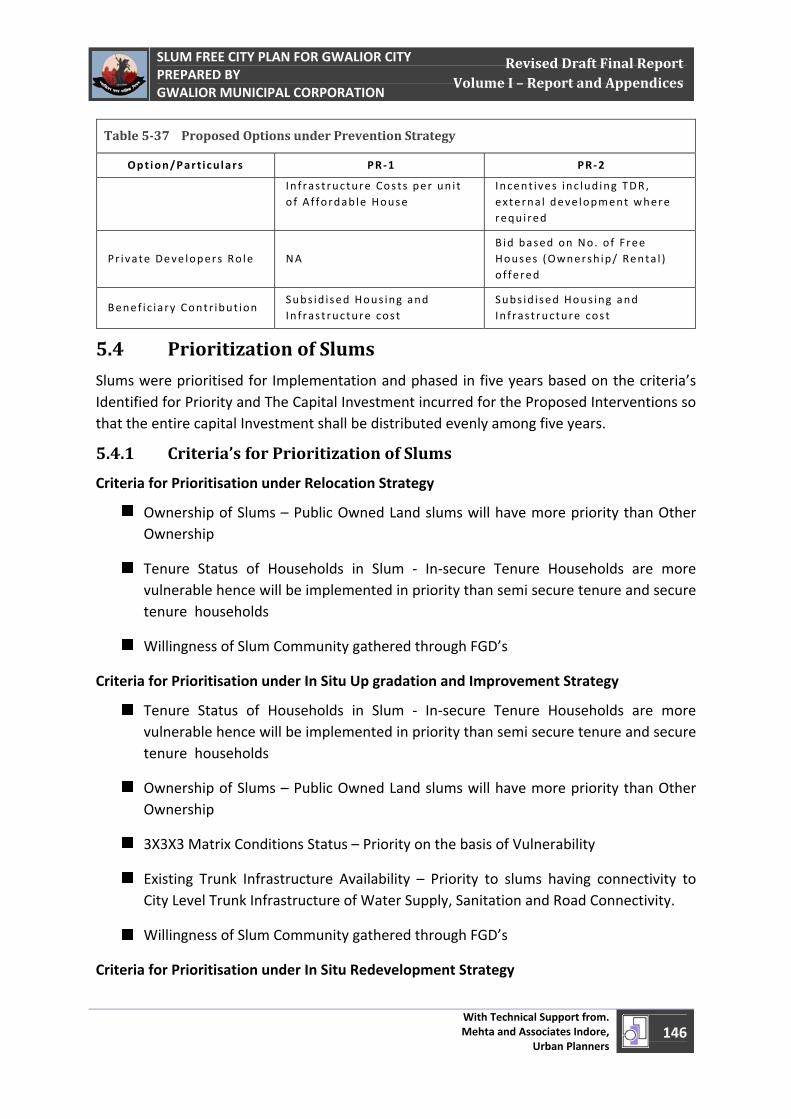
April 1, 2011
SLUM FREE CITY PLAN FOR GWALIOR CITY PREPARED BY GWALIOR MUNICIPAL CORPORATION
With Technical Support from. Mehta and Associates Indore,
Urban Planners 146
Revised Draft Final Report Volume I – Report and Appendices
Table 537 Proposed Options under Prevention Strategy
Option/Part icu lars PR ‐1 PR ‐2
In f ras t ructure Costs per un i t of Affordab le House
Incent ives inc lud ing TDR, externa l deve lopment where requ i red
Pr ivate Deve lopers Role NA B id based on No. of Free Houses (Ownersh ip/ Renta l ) of fered
Benef ic ia ry Contr ibut ion Subs id i sed Hous ing and In f ras t ructure cos t
Subs id i sed Hous ing and In f ras t ructure cos t
5.4 Prioritization of Slums
Slums were prioritised for Implementation and phased in five years based on the criteria’s Identified for Priority and The Capital Investment incurred for the Proposed Interventions so that the entire capital Investment shall be distributed evenly among five years.
5.4.1 Criteria’s for Prioritization of Slums
Criteria for Prioritisation under Relocation Strategy
Ownership of Slums – Public Owned Land slums will have more priority than Other Ownership
Tenure Status of Households in Slum ‐ In‐secure Tenure Households are more vulnerable hence will be implemented in priority than semi secure tenure and secure tenure households
Willingness of Slum Community gathered through FGD’s
Criteria for Prioritisation under In Situ Up gradation and Improvement Strategy
Tenure Status of Households in Slum ‐ In‐secure Tenure Households are more vulnerable hence will be implemented in priority than semi secure tenure and secure tenure households
Ownership of Slums – Public Owned Land slums will have more priority than Other Ownership
3X3X3 Matrix Conditions Status – Priority on the basis of Vulnerability
Existing Trunk Infrastructure Availability – Priority to slums having connectivity to City Level Trunk Infrastructure of Water Supply, Sanitation and Road Connectivity.
Willingness of Slum Community gathered through FGD’s
Criteria for Prioritisation under In Situ Redevelopment Strategy
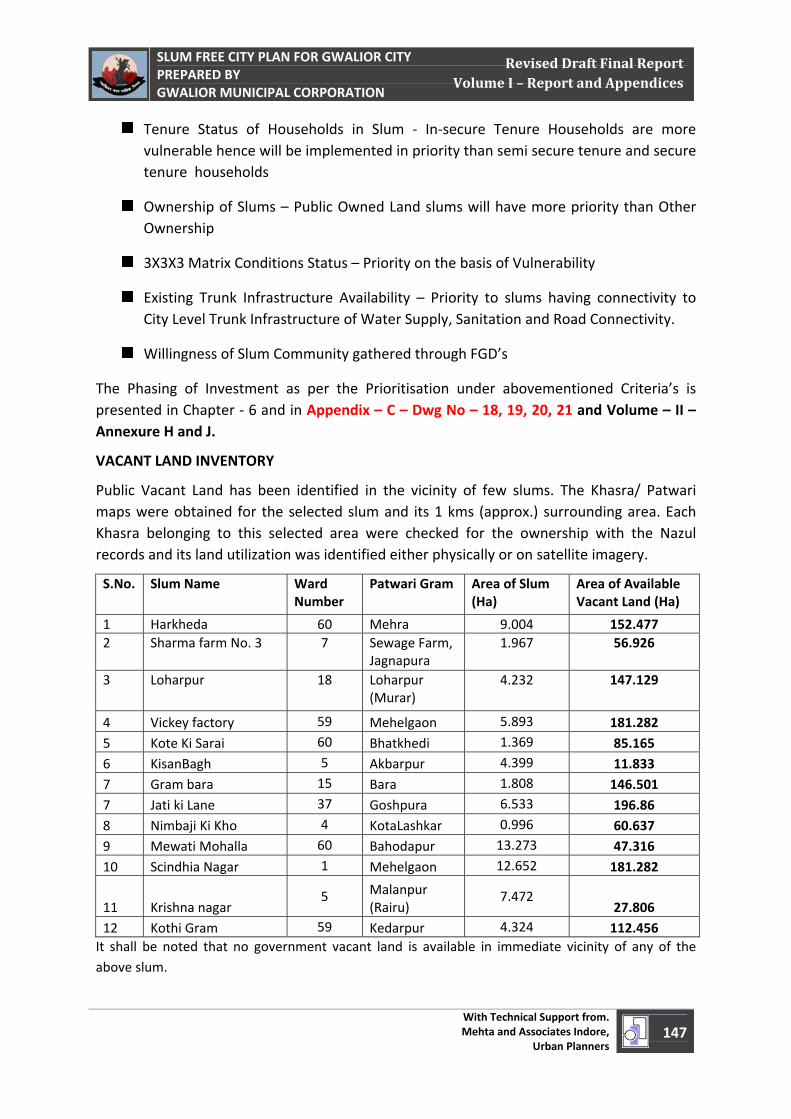
April 1, 2011
SLUM FREE CITY PLAN FOR GWALIOR CITY PREPARED BY GWALIOR MUNICIPAL CORPORATION
With Technical Support from. Mehta and Associates Indore,
Urban Planners 147
Revised Draft Final Report Volume I – Report and Appendices
Tenure Status of Households in Slum ‐ In‐secure Tenure Households are more vulnerable hence will be implemented in priority than semi secure tenure and secure tenure households
Ownership of Slums – Public Owned Land slums will have more priority than Other Ownership
3X3X3 Matrix Conditions Status – Priority on the basis of Vulnerability
Existing Trunk Infrastructure Availability – Priority to slums having connectivity to City Level Trunk Infrastructure of Water Supply, Sanitation and Road Connectivity.
Willingness of Slum Community gathered through FGD’s
The Phasing of Investment as per the Prioritisation under abovementioned Criteria’s is presented in Chapter ‐ 6 and in Appendix – C – Dwg No – 18, 19, 20, 21 and Volume – II – Annexure H and J.
VACANT LAND INVENTORY
Public Vacant Land has been identified in the vicinity of few slums. The Khasra/ Patwari maps were obtained for the selected slum and its 1 kms (approx.) surrounding area. Each Khasra belonging to this selected area were checked for the ownership with the Nazul records and its land utilization was identified either physically or on satellite imagery.
S.No. Slum Name Ward Number
Patwari Gram Area of Slum (Ha)
Area of Available Vacant Land (Ha)
1 Harkheda 60 Mehra 9.004 152.477 2 Sharma farm No. 3 7 Sewage Farm,
Jagnapura 1.967 56.926
3 Loharpur 18 Loharpur (Murar)
4.232 147.129
4 Vickey factory 59 Mehelgaon 5.893 181.282 5 Kote Ki Sarai 60 Bhatkhedi 1.369 85.165 6 KisanBagh 5 Akbarpur 4.399 11.833 7 Gram bara 15 Bara 1.808 146.501 7 Jati ki Lane 37 Goshpura 6.533 196.86 8 Nimbaji Ki Kho 4 KotaLashkar 0.996 60.637 9 Mewati Mohalla 60 Bahodapur 13.273 47.316 10 Scindhia Nagar 1 Mehelgaon 12.652 181.282
11 Krishna nagar 5 Malanpur
(Rairu) 7.472
27.806 12 Kothi Gram 59 Kedarpur 4.324 112.456 It shall be noted that no government vacant land is available in immediate vicinity of any of the above slum.
April 1, 2011
SLUM FREE CITY PLAN FOR GWALIOR CITY PREPARED BY GWALIOR MUNICIPAL CORPORATION
With Technical Support from. Mehta and Associates Indore,
Urban Planners 148
Revised Draft Final Report Volume I – Report and Appendices
Similarly, all vacant land will be identified as per the priority of slum in Slum Free City Plan of Action.
5.5 Reforms As per the RAY Guidelines the Cities are required to implement following three Pro poor Reforms under JNNURM:
Internal earmarking within local body budgets for basic services to the urban poor.
o The Municipal Corporation has already started to earmark 25% of the Budget for Urban Poor
Conferment of Property Rights to Slum Dwellers including security of tenure at affordable
prices, improved housing, water supply, sanitation and ensuring delivery of other already
existing universal services of the government for education, health and social security
5.6 MP has Patta Act since 1984 and on the same line the beneficiaries under RAY will be provided with Property Rights
Reservation of 20‐25% of developed land in all housing projects (both public and private
agencies) for EWS/LIG category with a system of cross‐subsidization.
o MP has amended its Land Reservation Rules for EWS and LIG recently to make it 15% of the
Dwelling units shall be reserved for EWS and LIG enforced on 19th April 2012
Apart from the JnNURM Pro‐Poor Reforms Madhya Pradesh Government is also taking Initiatives in following Reforms
Amendment to Rent Control Regulation to enable new rental housing stock
Amendment to enactments governing Town Planning, Urban Development and Local Bodies and
Land Assembly to ensure assembly at desired rate to improve housing supply for all sections of
society and arrest the Housing Shortage.
Simplification of the processes and procedures of sanctioning buildings and building byelaws
concerning development and housing projects
April 1, 2011
SLUM FREE CITY PLAN FOR GWALIOR CITY PREPARED BY GWALIOR MUNICIPAL CORPORATION
With Technical Support from. Mehta and Associates Indore,
Urban Planners 149
Revised Draft Final Report Volume I – Report and Appendices
Proposed Investment Plan and Phasing – Chapter – 6 6
April 1, 2011
SLUM FREE CITY PLAN FOR GWALIOR CITY PREPARED BY GWALIOR MUNICIPAL CORPORATION
With Technical Support from. Mehta and Associates Indore,
Urban Planners 150
Revised Draft Final Report Volume I – Report and Appendices
6.1 Proposed Investment Plan for Existing Slums
The Detailed Proposed Investment Plan on Existing Slums in Gwalior has been in Volume – II – Annexure H, I and J.
6.1.1 Relocation of Slums
The Total Cost of Complete Slum Relocation of 2309 Households in 9 slums is INR 159.93 Crores.
6.1.2 In Situ up gradation and Improvement of Slums
The Total Cost of In‐situ up gradation and Improvement of 53457 Households in 199 slums Including Relocation of 4620 Households from 80 Slums and Gap Filling Housing for 7374 Households who have kutcha Houses is INR 1360.83 Crores.
6.1.3 InSitu Redevelopment of Slums
The Total Cost of In‐situ Redevelopment of 6510 Households with Housing and Infrastructure and 970 Households with Infrastructure only and 826 Households need to be relocated due to high Density in 35 slums is INR 527.69 Crores.
Thus the Capital Investment needed for Existing Slums in Gwalior is to the Tune of INR 2048.45 Crores.
6.2 Investment on Preventive Strategy 6.2.1 Creation of Affordable Housing for LIG and EWS category
The cumulative need of Affordable Housing for LIG and EWS Category Units during next five years at the rate of 1150 units per year is 5750 Units, which will cost around INR 502.24 Crores
6.2.2 Creation of Rental Housing EWS category
The cumulative need of Rental Housing for EWS Category Units during next five years at the rate of 500 units per year is 2500 Units, which will cost around INR 173.91 Crores
Thus, The cumulative need Creating Housing Stock as Preventive Strategy during next five years at the rate of 1650 units per year is 8250 Units, which will cost around INR 676.14 Crores
6.3 Phasing of Investment as per the Priority
The Total Capital Investment required to make Gwalior City Slum Free is INR 2724.59 Crores. The Total Investment has been phased in five years as per the Prioritisation Criteria’s
Proposed Investment Plan and Phasing Chapter
6
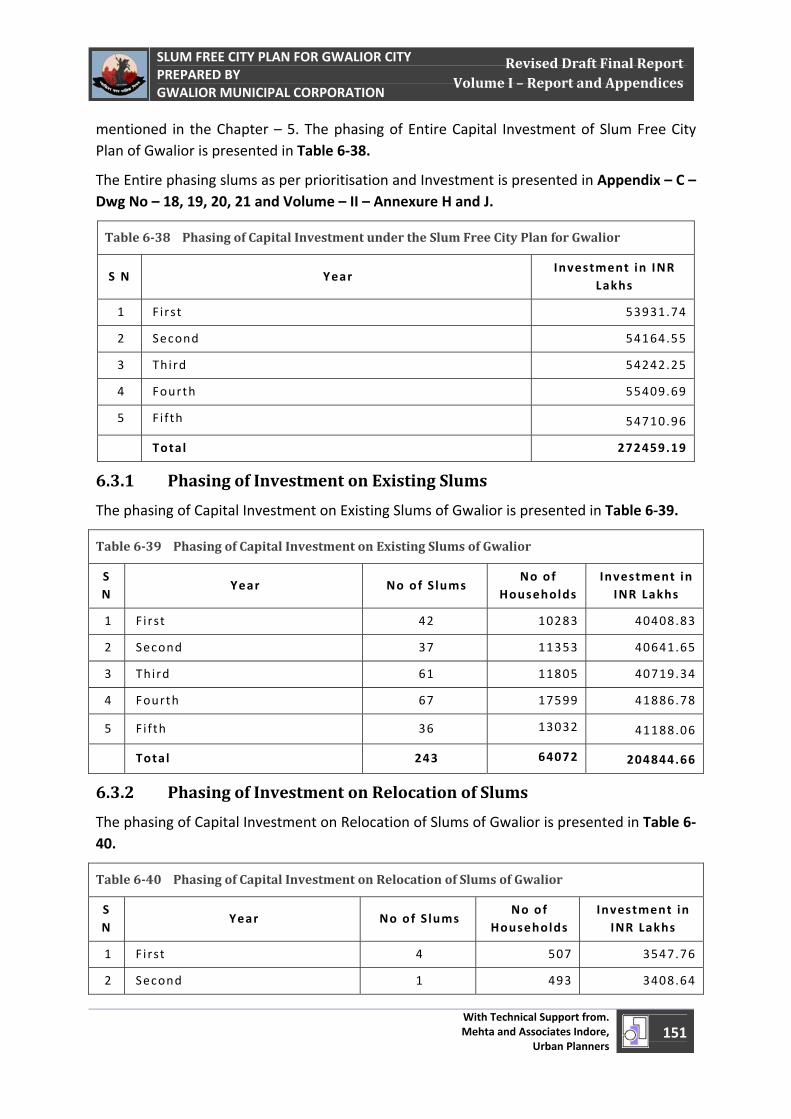
April 1, 2011
SLUM FREE CITY PLAN FOR GWALIOR CITY PREPARED BY GWALIOR MUNICIPAL CORPORATION
With Technical Support from. Mehta and Associates Indore,
Urban Planners 151
Revised Draft Final Report Volume I – Report and Appendices
mentioned in the Chapter – 5. The phasing of Entire Capital Investment of Slum Free City Plan of Gwalior is presented in Table 6‐38.
The Entire phasing slums as per prioritisation and Investment is presented in Appendix – C – Dwg No – 18, 19, 20, 21 and Volume – II – Annexure H and J.
Table 638 Phasing of Capital Investment under the Slum Free City Plan for Gwalior
S N Year Investment in INR
Lakhs
1 First 53931.74
2 Second 54164.55
3 Third 54242.25
4 Fourth 55409.69
5 Fi fth 54710.96
Total 272459.19
6.3.1 Phasing of Investment on Existing Slums
The phasing of Capital Investment on Existing Slums of Gwalior is presented in Table 6‐39.
Table 639 Phasing of Capital Investment on Existing Slums of Gwalior
S N
Year No of Slums No of
Households Investment in
INR Lakhs
1 First 42 10283 40408.83
2 Second 37 11353 40641.65
3 Third 61 11805 40719.34
4 Fourth 67 17599 41886.78
5 Fi fth 36 13032 41188.06
Total 243 64072 204844.66
6.3.2 Phasing of Investment on Relocation of Slums
The phasing of Capital Investment on Relocation of Slums of Gwalior is presented in Table 6‐40.
Table 640 Phasing of Capital Investment on Relocation of Slums of Gwalior
S N
Year No of Slums No of
Households Investment in
INR Lakhs
1 First 4 507 3547.76
2 Second 1 493 3408.64
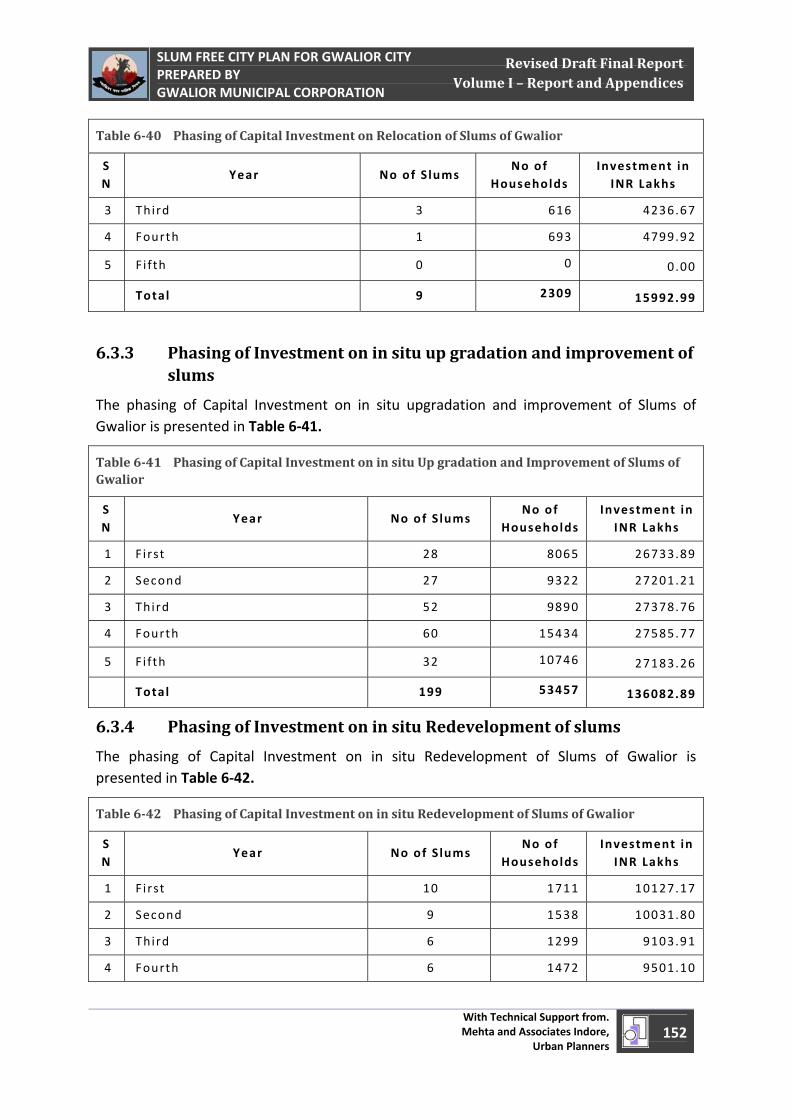
April 1, 2011
SLUM FREE CITY PLAN FOR GWALIOR CITY PREPARED BY GWALIOR MUNICIPAL CORPORATION
With Technical Support from. Mehta and Associates Indore,
Urban Planners 152
Revised Draft Final Report Volume I – Report and Appendices
Table 640 Phasing of Capital Investment on Relocation of Slums of Gwalior
S N
Year No of Slums No of
Households Investment in
INR Lakhs
3 Third 3 616 4236.67
4 Fourth 1 693 4799.92
5 Fi fth 0 0 0.00
Total 9 2309 15992.99
6.3.3 Phasing of Investment on in situ up gradation and improvement of
slums
The phasing of Capital Investment on in situ upgradation and improvement of Slums of Gwalior is presented in Table 6‐41.
Table 641 Phasing of Capital Investment on in situ Up gradation and Improvement of Slums of Gwalior
S N
Year No of Slums No of
Households Investment in
INR Lakhs
1 First 28 8065 26733.89
2 Second 27 9322 27201.21
3 Third 52 9890 27378.76
4 Fourth 60 15434 27585.77
5 Fi fth 32 10746 27183.26
Total 199 53457 136082.89
6.3.4 Phasing of Investment on in situ Redevelopment of slums
The phasing of Capital Investment on in situ Redevelopment of Slums of Gwalior is presented in Table 6‐42.
Table 642 Phasing of Capital Investment on in situ Redevelopment of Slums of Gwalior
S N
Year No of Slums No of
Households Investment in
INR Lakhs
1 First 10 1711 10127.17
2 Second 9 1538 10031.80
3 Third 6 1299 9103.91
4 Fourth 6 1472 9501.10
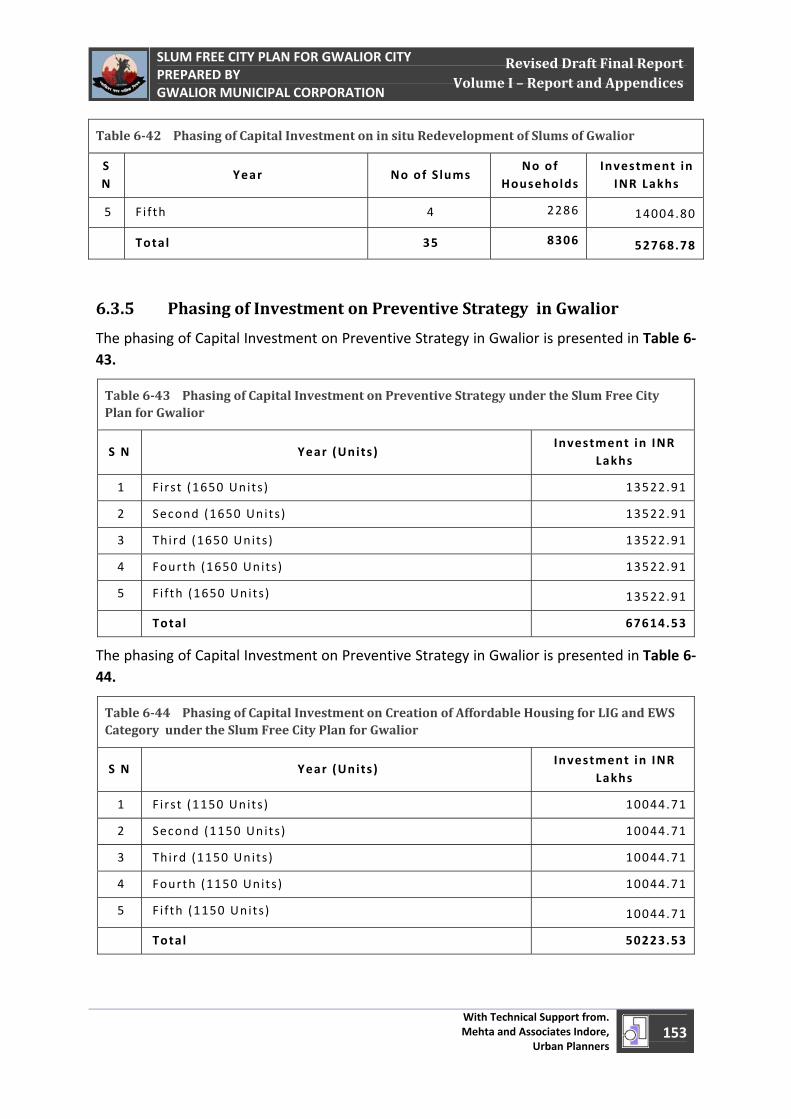
April 1, 2011
SLUM FREE CITY PLAN FOR GWALIOR CITY PREPARED BY GWALIOR MUNICIPAL CORPORATION
With Technical Support from. Mehta and Associates Indore,
Urban Planners 153
Revised Draft Final Report Volume I – Report and Appendices
Table 642 Phasing of Capital Investment on in situ Redevelopment of Slums of Gwalior
S N
Year No of Slums No of
Households Investment in
INR Lakhs
5 Fi fth 4 2286 14004.80
Total 35 8306 52768.78
6.3.5 Phasing of Investment on Preventive Strategy in Gwalior
The phasing of Capital Investment on Preventive Strategy in Gwalior is presented in Table 6‐43.
Table 643 Phasing of Capital Investment on Preventive Strategy under the Slum Free City Plan for Gwalior
S N Year (Units ) Investment in INR
Lakhs
1 First (1650 Units) 13522.91
2 Second (1650 Units) 13522.91
3 Third (1650 Units) 13522.91
4 Fourth (1650 Units) 13522.91
5 Fi fth (1650 Units) 13522.91
Total 67614.53
The phasing of Capital Investment on Preventive Strategy in Gwalior is presented in Table 6‐44.
Table 644 Phasing of Capital Investment on Creation of Affordable Housing for LIG and EWS Category under the Slum Free City Plan for Gwalior
S N Year (Units ) Investment in INR
Lakhs
1 First (1150 Units) 10044.71
2 Second (1150 Units) 10044.71
3 Third (1150 Units) 10044.71
4 Fourth (1150 Units) 10044.71
5 Fi fth (1150 Units) 10044.71
Total 50223.53
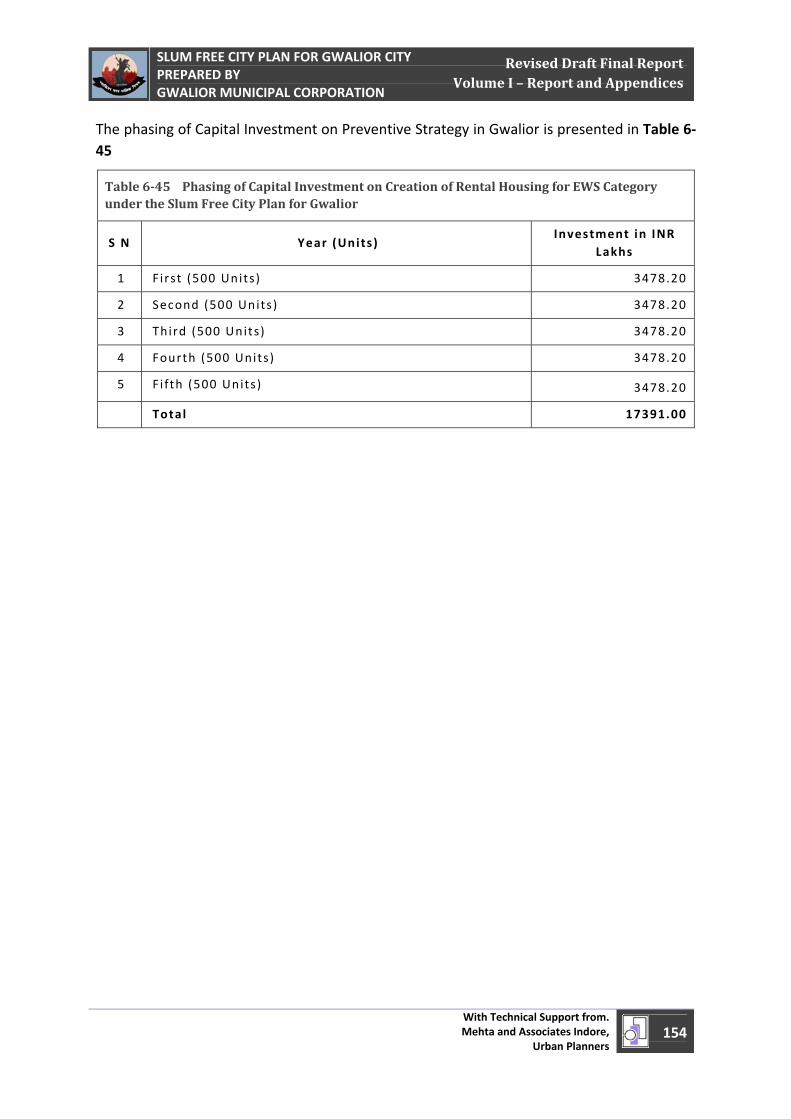
April 1, 2011
SLUM FREE CITY PLAN FOR GWALIOR CITY PREPARED BY GWALIOR MUNICIPAL CORPORATION
With Technical Support from. Mehta and Associates Indore,
Urban Planners 154
Revised Draft Final Report Volume I – Report and Appendices
The phasing of Capital Investment on Preventive Strategy in Gwalior is presented in Table 6‐45
Table 645 Phasing of Capital Investment on Creation of Rental Housing for EWS Category under the Slum Free City Plan for Gwalior
S N Year (Units ) Investment in INR
Lakhs
1 First (500 Units) 3478.20
2 Second (500 Units) 3478.20
3 Third (500 Units) 3478.20
4 Fourth (500 Units) 3478.20
5 Fi fth (500 Units) 3478.20
Total 17391.00
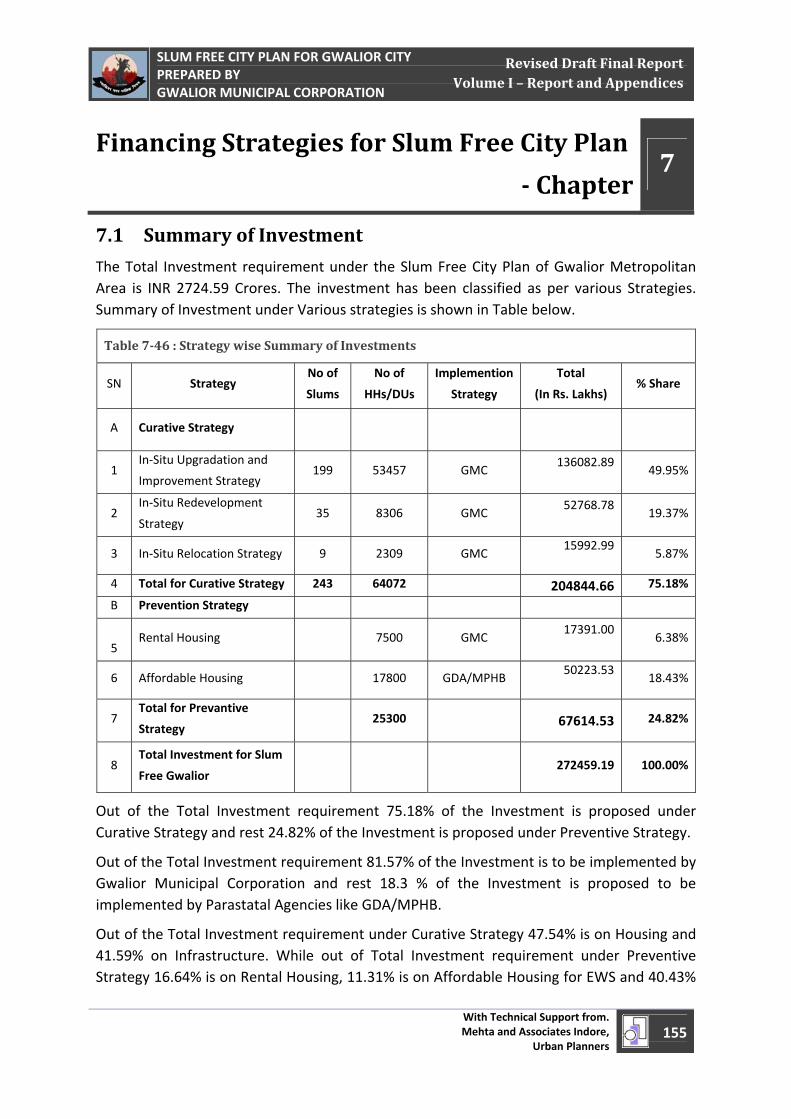
April 1, 2011
SLUM FREE CITY PLAN FOR GWALIOR CITY PREPARED BY GWALIOR MUNICIPAL CORPORATION
With Technical Support from. Mehta and Associates Indore,
Urban Planners 155
Revised Draft Final Report Volume I – Report and Appendices
7.1 Summary of Investment
The Total Investment requirement under the Slum Free City Plan of Gwalior Metropolitan Area is INR 2724.59 Crores. The investment has been classified as per various Strategies. Summary of Investment under Various strategies is shown in Table below.
Out of the Total Investment requirement 75.18% of the Investment is proposed under Curative Strategy and rest 24.82% of the Investment is proposed under Preventive Strategy.
Out of the Total Investment requirement 81.57% of the Investment is to be implemented by Gwalior Municipal Corporation and rest 18.3 % of the Investment is proposed to be implemented by Parastatal Agencies like GDA/MPHB.
Out of the Total Investment requirement under Curative Strategy 47.54% is on Housing and 41.59% on Infrastructure. While out of Total Investment requirement under Preventive Strategy 16.64% is on Rental Housing, 11.31% is on Affordable Housing for EWS and 40.43%
Financing Strategies for Slum Free City Plan
Chapter 7
Table 746 : Strategy wise Summary of Investments
SN Strategy No of
Slums
No of
HHs/DUs
Implemention
Strategy
Total
(In Rs. Lakhs) % Share
A Curative Strategy
1 In‐Situ Upgradation and
Improvement Strategy 199 53457 GMC
136082.89
49.95%
2 In‐Situ Redevelopment
Strategy 35 8306 GMC
52768.78
19.37%
3 In‐Situ Relocation Strategy 9 2309 GMC 15992.99
5.87%
4 Total for Curative Strategy 243 64072 204844.66 75.18%
B Prevention Strategy
5 Rental Housing
7500 GMC
17391.00
6.38%
6 Affordable Housing
17800 GDA/MPHB 50223.53
18.43%
7 Total for Prevantive
Strategy 25300
67614.53 24.82%
8 Total Investment for Slum
Free Gwalior 272459.19 100.00%
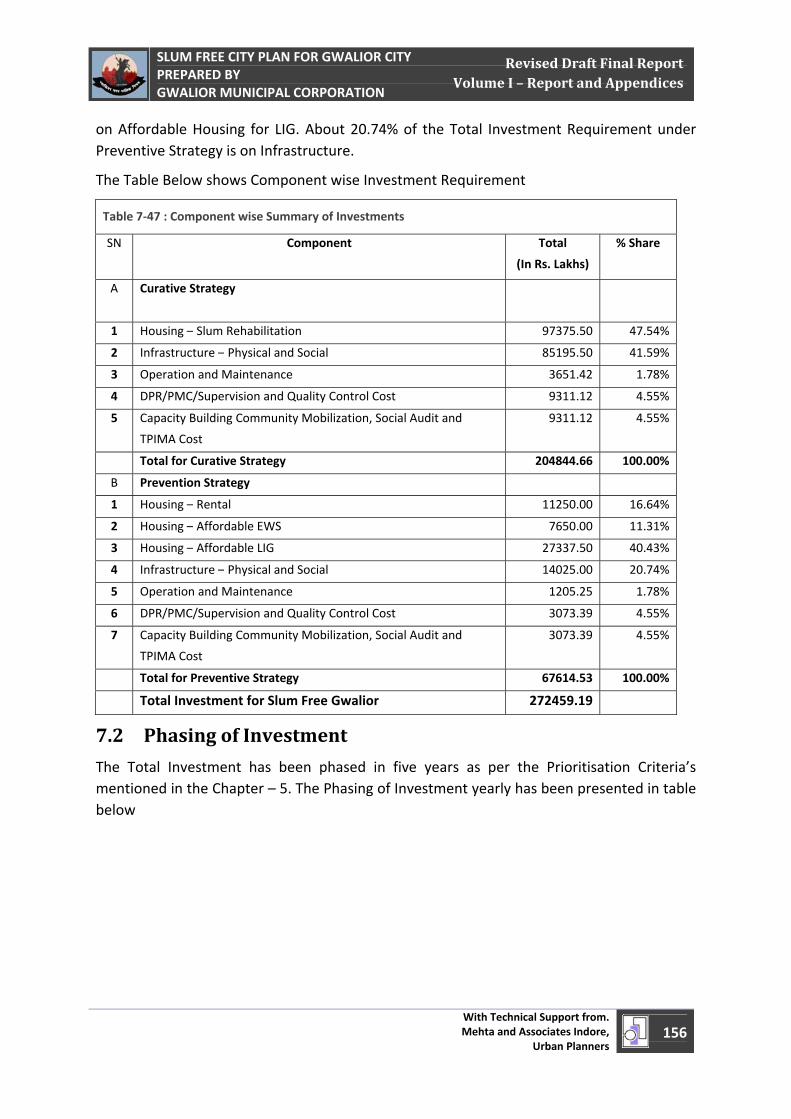
April 1, 2011
SLUM FREE CITY PLAN FOR GWALIOR CITY PREPARED BY GWALIOR MUNICIPAL CORPORATION
With Technical Support from. Mehta and Associates Indore,
Urban Planners 156
Revised Draft Final Report Volume I – Report and Appendices
on Affordable Housing for LIG. About 20.74% of the Total Investment Requirement under Preventive Strategy is on Infrastructure.
The Table Below shows Component wise Investment Requirement
7.2 Phasing of Investment
The Total Investment has been phased in five years as per the Prioritisation Criteria’s mentioned in the Chapter – 5. The Phasing of Investment yearly has been presented in table below
Table 7‐47 : Component wise Summary of Investments
SN Component Total
(In Rs. Lakhs)
% Share
A Curative Strategy
1 Housing – Slum Rehabilitation 97375.50 47.54%
2 Infrastructure – Physical and Social 85195.50 41.59%
3 Operation and Maintenance 3651.42 1.78%
4 DPR/PMC/Supervision and Quality Control Cost 9311.12 4.55%
5 Capacity Building Community Mobilization, Social Audit and
TPIMA Cost
9311.12 4.55%
Total for Curative Strategy 204844.66 100.00%
B Prevention Strategy
1 Housing – Rental 11250.00 16.64%
2 Housing – Affordable EWS 7650.00 11.31%
3 Housing – Affordable LIG 27337.50 40.43%
4 Infrastructure – Physical and Social 14025.00 20.74%
5 Operation and Maintenance 1205.25 1.78%
6 DPR/PMC/Supervision and Quality Control Cost 3073.39 4.55%
7 Capacity Building Community Mobilization, Social Audit and
TPIMA Cost
3073.39 4.55%
Total for Preventive Strategy 67614.53 100.00%
Total Investment for Slum Free Gwalior 272459.19
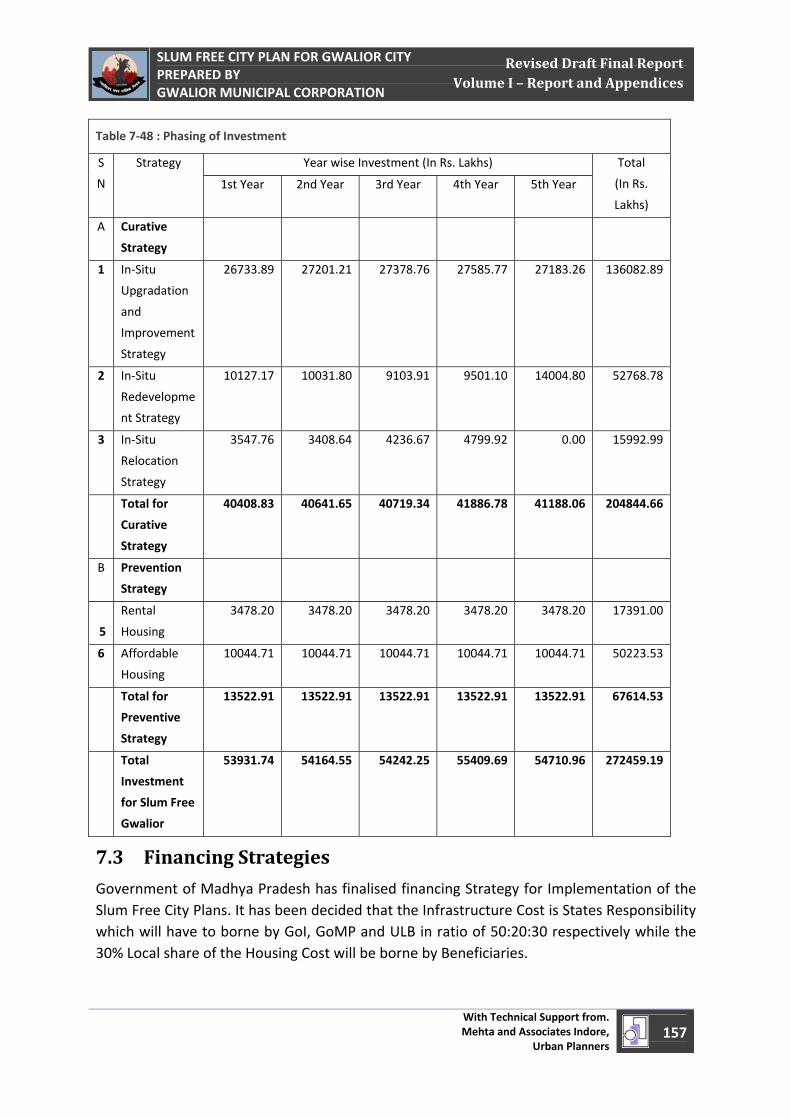
April 1, 2011
SLUM FREE CITY PLAN FOR GWALIOR CITY PREPARED BY GWALIOR MUNICIPAL CORPORATION
With Technical Support from. Mehta and Associates Indore,
Urban Planners 157
Revised Draft Final Report Volume I – Report and Appendices
Table 7‐48 : Phasing of Investment
S
N
Strategy Year wise Investment (In Rs. Lakhs) Total
(In Rs.
Lakhs)
1st Year 2nd Year 3rd Year 4th Year 5th Year
A Curative
Strategy
1 In‐Situ
Upgradation
and
Improvement
Strategy
26733.89 27201.21 27378.76 27585.77 27183.26 136082.89
2 In‐Situ
Redevelopme
nt Strategy
10127.17 10031.80 9103.91 9501.10 14004.80 52768.78
3 In‐Situ
Relocation
Strategy
3547.76 3408.64 4236.67 4799.92 0.00 15992.99
Total for
Curative
Strategy
40408.83 40641.65 40719.34 41886.78 41188.06 204844.66
B Prevention
Strategy
5
Rental
Housing
3478.20 3478.20 3478.20 3478.20 3478.20 17391.00
6 Affordable
Housing
10044.71 10044.71 10044.71 10044.71 10044.71 50223.53
Total for
Preventive
Strategy
13522.91 13522.91 13522.91 13522.91 13522.91 67614.53
Total
Investment
for Slum Free
Gwalior
53931.74 54164.55 54242.25 55409.69 54710.96 272459.19
7.3 Financing Strategies
Government of Madhya Pradesh has finalised financing Strategy for Implementation of the Slum Free City Plans. It has been decided that the Infrastructure Cost is States Responsibility which will have to borne by GoI, GoMP and ULB in ratio of 50:20:30 respectively while the 30% Local share of the Housing Cost will be borne by Beneficiaries.
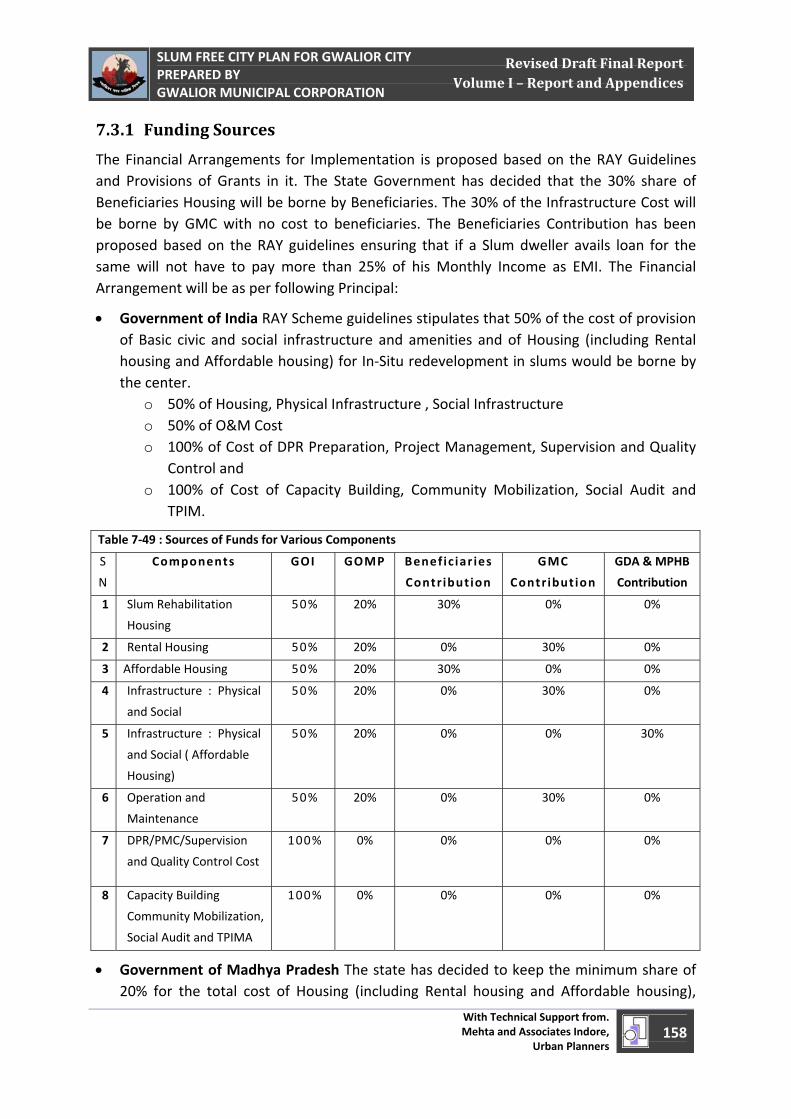
April 1, 2011
SLUM FREE CITY PLAN FOR GWALIOR CITY PREPARED BY GWALIOR MUNICIPAL CORPORATION
With Technical Support from. Mehta and Associates Indore,
Urban Planners 158
Revised Draft Final Report Volume I – Report and Appendices
7.3.1 Funding Sources The Financial Arrangements for Implementation is proposed based on the RAY Guidelines and Provisions of Grants in it. The State Government has decided that the 30% share of Beneficiaries Housing will be borne by Beneficiaries. The 30% of the Infrastructure Cost will be borne by GMC with no cost to beneficiaries. The Beneficiaries Contribution has been proposed based on the RAY guidelines ensuring that if a Slum dweller avails loan for the same will not have to pay more than 25% of his Monthly Income as EMI. The Financial Arrangement will be as per following Principal:
• Government of India RAY Scheme guidelines stipulates that 50% of the cost of provision of Basic civic and social infrastructure and amenities and of Housing (including Rental housing and Affordable housing) for In‐Situ redevelopment in slums would be borne by the center.
o 50% of Housing, Physical Infrastructure , Social Infrastructure o 50% of O&M Cost o 100% of Cost of DPR Preparation, Project Management, Supervision and Quality
Control and o 100% of Cost of Capacity Building, Community Mobilization, Social Audit and
TPIM.
• Government of Madhya Pradesh The state has decided to keep the minimum share of 20% for the total cost of Housing (including Rental housing and Affordable housing),
Table 7‐49 : Sources of Funds for Various Components
S
N
Components GOI GOMP Benefic iar ies
Contribut ion
GMC
Contribut ion
GDA & MPHB
Contribution
1 Slum Rehabilitation
Housing
50% 20% 30% 0% 0%
2 Rental Housing 50% 20% 0% 30% 0%
3 Affordable Housing 50% 20% 30% 0% 0%
4 Infrastructure : Physical
and Social
50% 20% 0% 30% 0%
5 Infrastructure : Physical
and Social ( Affordable
Housing)
50% 20% 0% 0% 30%
6 Operation and
Maintenance
50% 20% 0% 30% 0%
7 DPR/PMC/Supervision
and Quality Control Cost
100% 0% 0% 0% 0%
8 Capacity Building
Community Mobilization,
Social Audit and TPIMA
100% 0% 0% 0% 0%
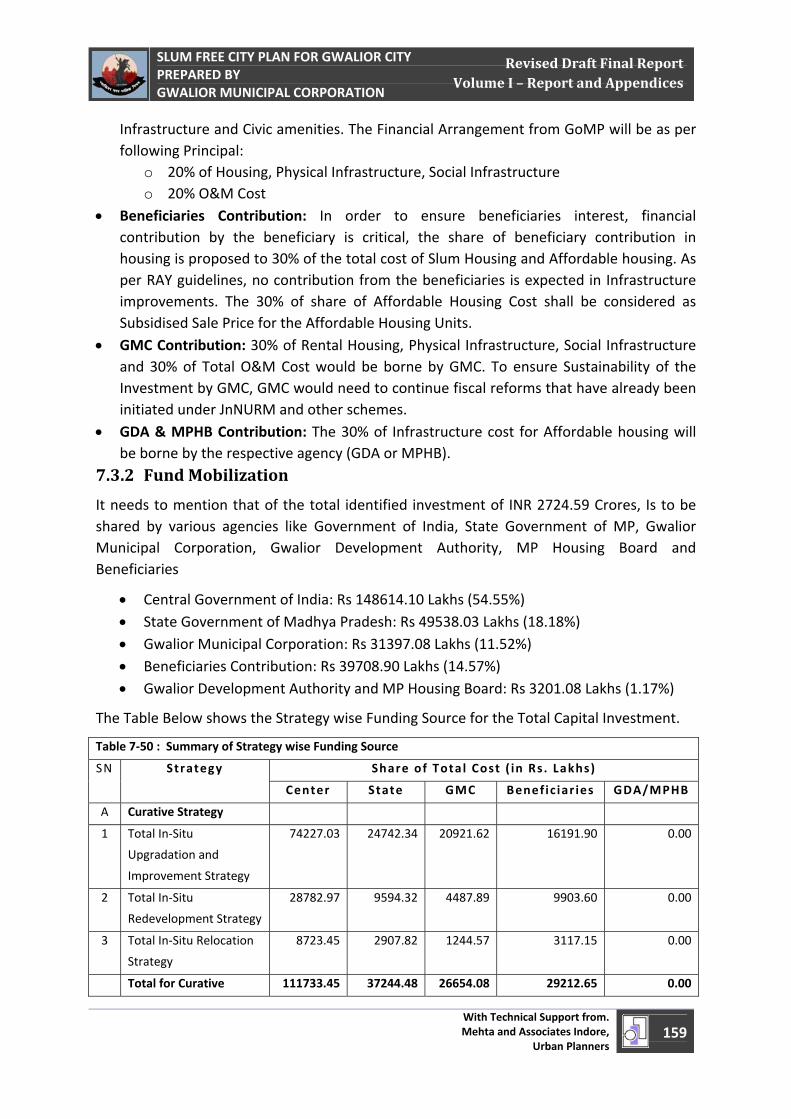
April 1, 2011
SLUM FREE CITY PLAN FOR GWALIOR CITY PREPARED BY GWALIOR MUNICIPAL CORPORATION
With Technical Support from. Mehta and Associates Indore,
Urban Planners 159
Revised Draft Final Report Volume I – Report and Appendices
Infrastructure and Civic amenities. The Financial Arrangement from GoMP will be as per following Principal:
o 20% of Housing, Physical Infrastructure, Social Infrastructure o 20% O&M Cost
• Beneficiaries Contribution: In order to ensure beneficiaries interest, financial contribution by the beneficiary is critical, the share of beneficiary contribution in housing is proposed to 30% of the total cost of Slum Housing and Affordable housing. As per RAY guidelines, no contribution from the beneficiaries is expected in Infrastructure improvements. The 30% of share of Affordable Housing Cost shall be considered as Subsidised Sale Price for the Affordable Housing Units.
• GMC Contribution: 30% of Rental Housing, Physical Infrastructure, Social Infrastructure and 30% of Total O&M Cost would be borne by GMC. To ensure Sustainability of the Investment by GMC, GMC would need to continue fiscal reforms that have already been initiated under JnNURM and other schemes.
• GDA & MPHB Contribution: The 30% of Infrastructure cost for Affordable housing will be borne by the respective agency (GDA or MPHB).
7.3.2 Fund Mobilization It needs to mention that of the total identified investment of INR 2724.59 Crores, Is to be shared by various agencies like Government of India, State Government of MP, Gwalior Municipal Corporation, Gwalior Development Authority, MP Housing Board and Beneficiaries
• Central Government of India: Rs 148614.10 Lakhs (54.55%) • State Government of Madhya Pradesh: Rs 49538.03 Lakhs (18.18%) • Gwalior Municipal Corporation: Rs 31397.08 Lakhs (11.52%) • Beneficiaries Contribution: Rs 39708.90 Lakhs (14.57%) • Gwalior Development Authority and MP Housing Board: Rs 3201.08 Lakhs (1.17%)
The Table Below shows the Strategy wise Funding Source for the Total Capital Investment.
Table 7‐50 : Summary of Strategy wise Funding Source
SN Strategy Share of Total Cost ( in Rs. Lakhs)
Center State GMC Benefic iar ies GDA/MPHB
A Curative Strategy
1 Total In‐Situ
Upgradation and
Improvement Strategy
74227.03 24742.34 20921.62 16191.90 0.00
2 Total In‐Situ
Redevelopment Strategy
28782.97 9594.32 4487.89 9903.60 0.00
3 Total In‐Situ Relocation
Strategy
8723.45 2907.82 1244.57 3117.15 0.00
Total for Curative 111733.45 37244.48 26654.08 29212.65 0.00
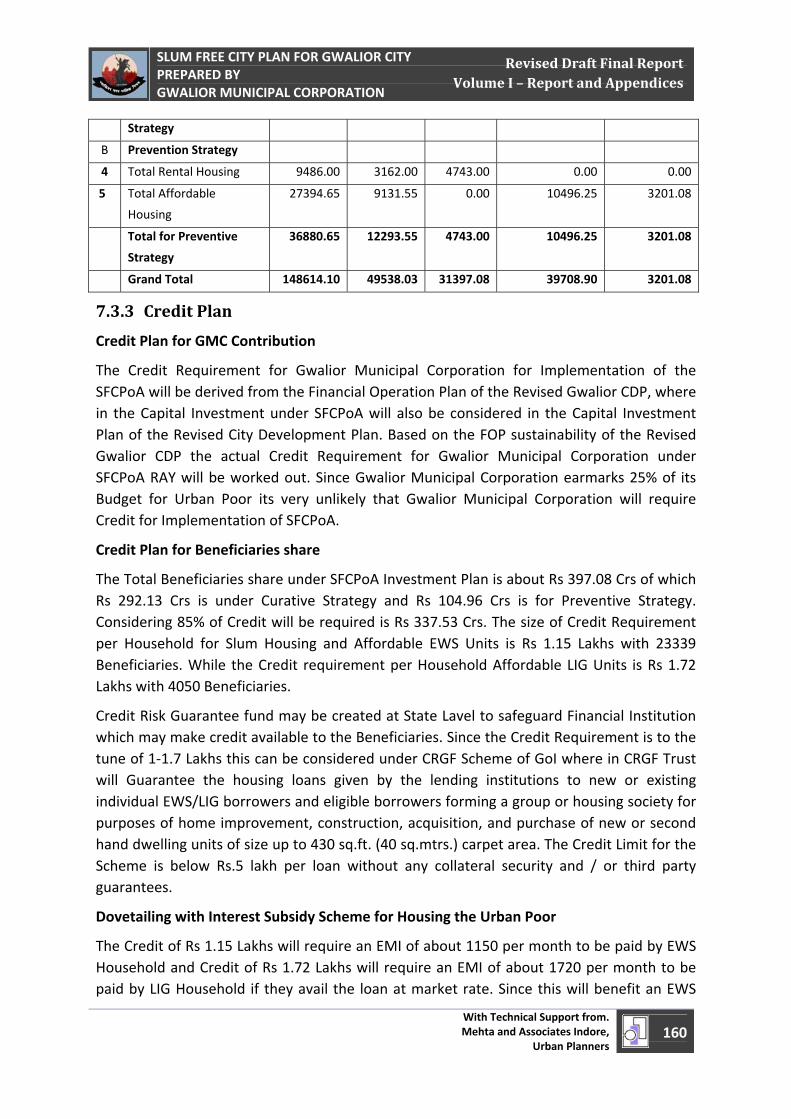
April 1, 2011
SLUM FREE CITY PLAN FOR GWALIOR CITY PREPARED BY GWALIOR MUNICIPAL CORPORATION
With Technical Support from. Mehta and Associates Indore,
Urban Planners 160
Revised Draft Final Report Volume I – Report and Appendices
7.3.3 Credit Plan Credit Plan for GMC Contribution
The Credit Requirement for Gwalior Municipal Corporation for Implementation of the SFCPoA will be derived from the Financial Operation Plan of the Revised Gwalior CDP, where in the Capital Investment under SFCPoA will also be considered in the Capital Investment Plan of the Revised City Development Plan. Based on the FOP sustainability of the Revised Gwalior CDP the actual Credit Requirement for Gwalior Municipal Corporation under SFCPoA RAY will be worked out. Since Gwalior Municipal Corporation earmarks 25% of its Budget for Urban Poor its very unlikely that Gwalior Municipal Corporation will require Credit for Implementation of SFCPoA.
Credit Plan for Beneficiaries share
The Total Beneficiaries share under SFCPoA Investment Plan is about Rs 397.08 Crs of which Rs 292.13 Crs is under Curative Strategy and Rs 104.96 Crs is for Preventive Strategy. Considering 85% of Credit will be required is Rs 337.53 Crs. The size of Credit Requirement per Household for Slum Housing and Affordable EWS Units is Rs 1.15 Lakhs with 23339 Beneficiaries. While the Credit requirement per Household Affordable LIG Units is Rs 1.72 Lakhs with 4050 Beneficiaries.
Credit Risk Guarantee fund may be created at State Lavel to safeguard Financial Institution which may make credit available to the Beneficiaries. Since the Credit Requirement is to the tune of 1‐1.7 Lakhs this can be considered under CRGF Scheme of GoI where in CRGF Trust will Guarantee the housing loans given by the lending institutions to new or existing individual EWS/LIG borrowers and eligible borrowers forming a group or housing society for purposes of home improvement, construction, acquisition, and purchase of new or second hand dwelling units of size up to 430 sq.ft. (40 sq.mtrs.) carpet area. The Credit Limit for the Scheme is below Rs.5 lakh per loan without any collateral security and / or third party guarantees.
Dovetailing with Interest Subsidy Scheme for Housing the Urban Poor
The Credit of Rs 1.15 Lakhs will require an EMI of about 1150 per month to be paid by EWS Household and Credit of Rs 1.72 Lakhs will require an EMI of about 1720 per month to be paid by LIG Household if they avail the loan at market rate. Since this will benefit an EWS
Strategy
B Prevention Strategy
4 Total Rental Housing 9486.00 3162.00 4743.00 0.00 0.00
5 Total Affordable
Housing
27394.65 9131.55 0.00 10496.25 3201.08
Total for Preventive
Strategy
36880.65 12293.55 4743.00 10496.25 3201.08
Grand Total 148614.10 49538.03 31397.08 39708.90 3201.08
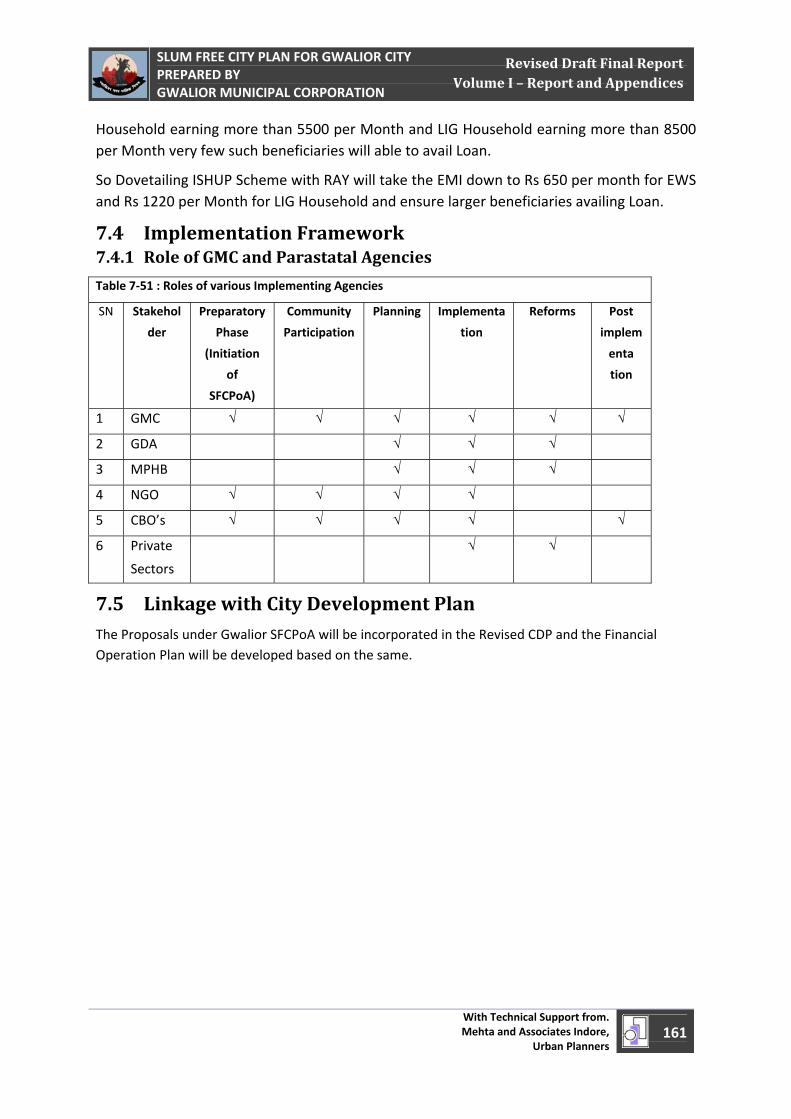
April 1, 2011
SLUM FREE CITY PLAN FOR GWALIOR CITY PREPARED BY GWALIOR MUNICIPAL CORPORATION
With Technical Support from. Mehta and Associates Indore,
Urban Planners 161
Revised Draft Final Report Volume I – Report and Appendices
Household earning more than 5500 per Month and LIG Household earning more than 8500 per Month very few such beneficiaries will able to avail Loan.
So Dovetailing ISHUP Scheme with RAY will take the EMI down to Rs 650 per month for EWS and Rs 1220 per Month for LIG Household and ensure larger beneficiaries availing Loan.
7.4 Implementation Framework 7.4.1 Role of GMC and Parastatal Agencies Table 7‐51 : Roles of various Implementing Agencies
SN Stakehol
der
Preparatory
Phase
(Initiation
of
SFCPoA)
Community
Participation
Planning Implementa
tion
Reforms Post
implem
enta
tion
1 GMC √ √ √ √ √ √
2 GDA √ √ √
3 MPHB √ √ √
4 NGO √ √ √ √
5 CBO’s √ √ √ √ √
6 Private
Sectors
√ √
7.5 Linkage with City Development Plan The Proposals under Gwalior SFCPoA will be incorporated in the Revised CDP and the Financial Operation Plan will be developed based on the same.

April 1, 2011
SLUM FREE CITY PLAN FOR GWALIOR CITY PREPARED BY GWALIOR MUNICIPAL CORPORATION
With Technical Support from. Mehta and Associates Indore,
Urban Planners 162
Revised Draft Final Report Volume I – Report and Appendices
Appendices
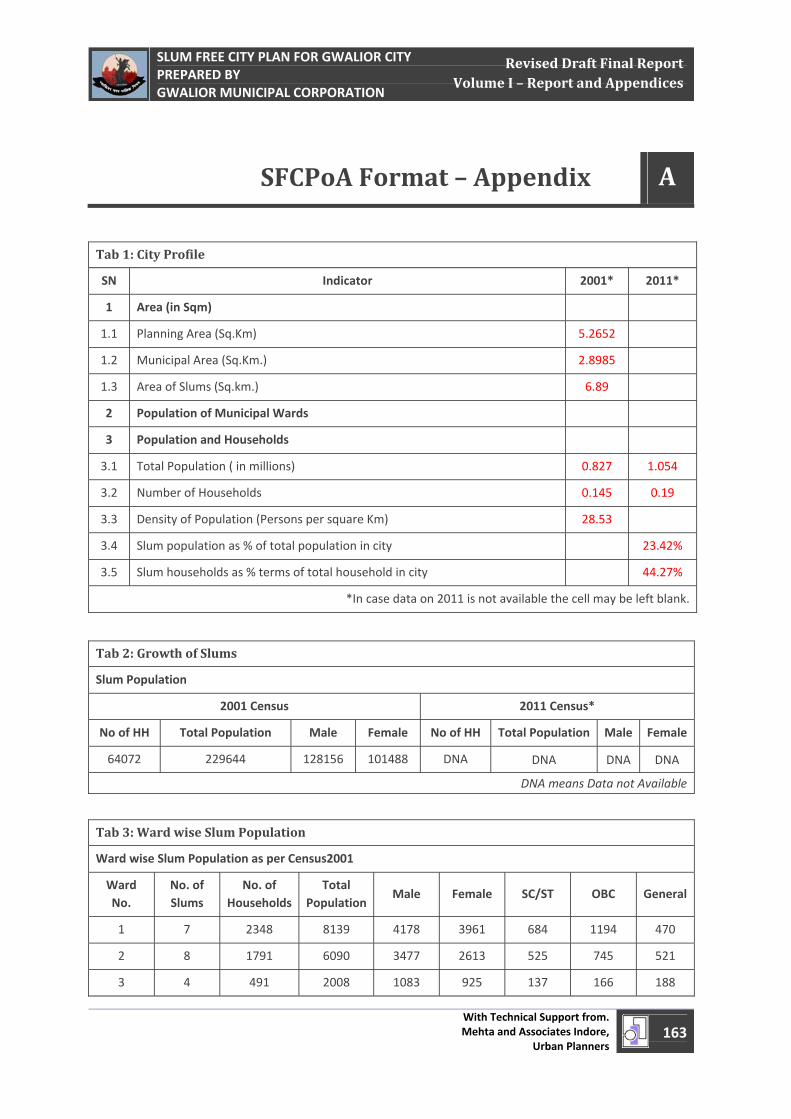
April 1, 2011
SLUM FREE CITY PLAN FOR GWALIOR CITY PREPARED BY GWALIOR MUNICIPAL CORPORATION
With Technical Support from. Mehta and Associates Indore,
Urban Planners 163
Revised Draft Final Report Volume I – Report and Appendices
Tab 1: City Profile
SN Indicator 2001* 2011*
1 Area (in Sqm)
1.1 Planning Area (Sq.Km) 5.2652
1.2 Municipal Area (Sq.Km.) 2.8985
1.3 Area of Slums (Sq.km.) 6.89
2 Population of Municipal Wards
3 Population and Households
3.1 Total Population ( in millions) 0.827 1.054
3.2 Number of Households 0.145 0.19
3.3 Density of Population (Persons per square Km) 28.53
3.4 Slum population as % of total population in city 23.42%
3.5 Slum households as % terms of total household in city 44.27%
*In case data on 2011 is not available the cell may be left blank.
Tab 2: Growth of Slums
Slum Population
2001 Census 2011 Census*
No of HH Total Population Male Female No of HH Total Population Male Female
64072 229644 128156 101488 DNA DNA DNA DNA
DNA means Data not Available
Tab 3: Ward wise Slum Population
Ward wise Slum Population as per Census2001
Ward No.
No. of Slums
No. of Households
Total Population
Male Female SC/ST OBC General
1 7 2348 8139 4178 3961 684 1194 470
2 8 1791 6090 3477 2613 525 745 521
3 4 491 2008 1083 925 137 166 188
SFCPoA Format – Appendix – A A
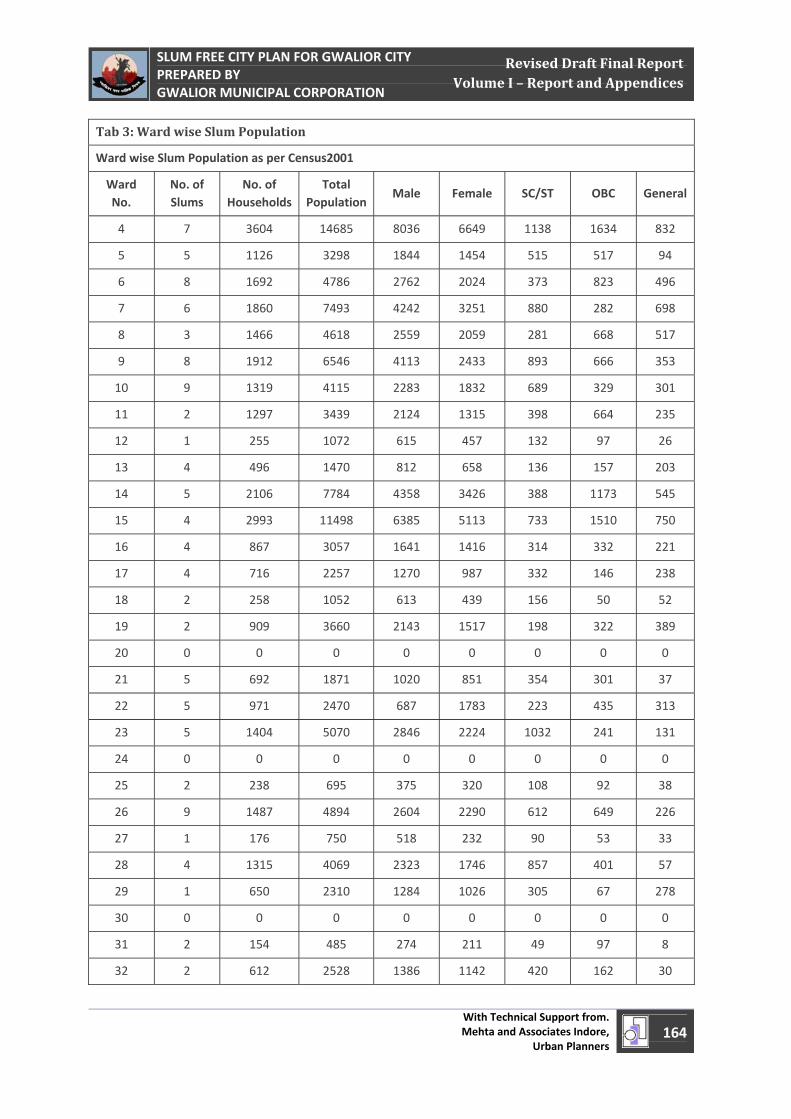
April 1, 2011
SLUM FREE CITY PLAN FOR GWALIOR CITY PREPARED BY GWALIOR MUNICIPAL CORPORATION
With Technical Support from. Mehta and Associates Indore,
Urban Planners 164
Revised Draft Final Report Volume I – Report and Appendices
Tab 3: Ward wise Slum Population
Ward wise Slum Population as per Census2001
Ward No.
No. of Slums
No. of Households
Total Population
Male Female SC/ST OBC General
4 7 3604 14685 8036 6649 1138 1634 832
5 5 1126 3298 1844 1454 515 517 94
6 8 1692 4786 2762 2024 373 823 496
7 6 1860 7493 4242 3251 880 282 698
8 3 1466 4618 2559 2059 281 668 517
9 8 1912 6546 4113 2433 893 666 353
10 9 1319 4115 2283 1832 689 329 301
11 2 1297 3439 2124 1315 398 664 235
12 1 255 1072 615 457 132 97 26
13 4 496 1470 812 658 136 157 203
14 5 2106 7784 4358 3426 388 1173 545
15 4 2993 11498 6385 5113 733 1510 750
16 4 867 3057 1641 1416 314 332 221
17 4 716 2257 1270 987 332 146 238
18 2 258 1052 613 439 156 50 52
19 2 909 3660 2143 1517 198 322 389
20 0 0 0 0 0 0 0 0
21 5 692 1871 1020 851 354 301 37
22 5 971 2470 687 1783 223 435 313
23 5 1404 5070 2846 2224 1032 241 131
24 0 0 0 0 0 0 0 0
25 2 238 695 375 320 108 92 38
26 9 1487 4894 2604 2290 612 649 226
27 1 176 750 518 232 90 53 33
28 4 1315 4069 2323 1746 857 401 57
29 1 650 2310 1284 1026 305 67 278
30 0 0 0 0 0 0 0 0
31 2 154 485 274 211 49 97 8
32 2 612 2528 1386 1142 420 162 30
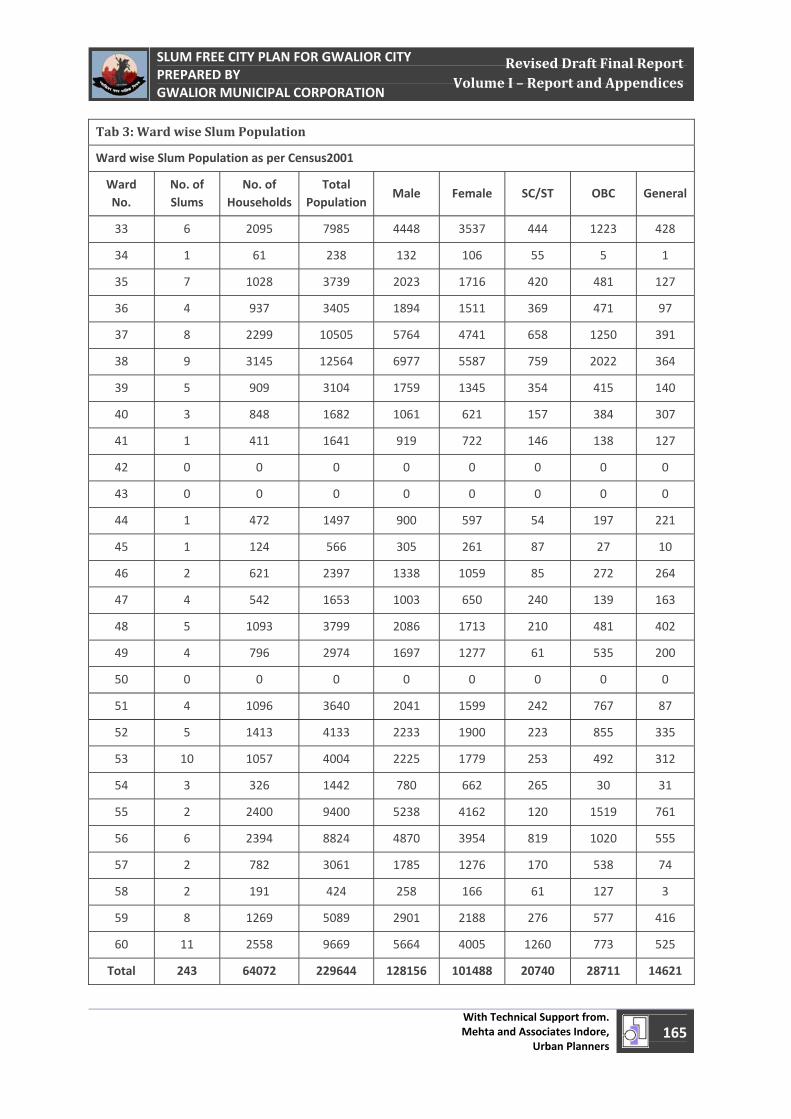
April 1, 2011
SLUM FREE CITY PLAN FOR GWALIOR CITY PREPARED BY GWALIOR MUNICIPAL CORPORATION
With Technical Support from. Mehta and Associates Indore,
Urban Planners 165
Revised Draft Final Report Volume I – Report and Appendices
Tab 3: Ward wise Slum Population
Ward wise Slum Population as per Census2001
Ward No.
No. of Slums
No. of Households
Total Population
Male Female SC/ST OBC General
33 6 2095 7985 4448 3537 444 1223 428
34 1 61 238 132 106 55 5 1
35 7 1028 3739 2023 1716 420 481 127
36 4 937 3405 1894 1511 369 471 97
37 8 2299 10505 5764 4741 658 1250 391
38 9 3145 12564 6977 5587 759 2022 364
39 5 909 3104 1759 1345 354 415 140
40 3 848 1682 1061 621 157 384 307
41 1 411 1641 919 722 146 138 127
42 0 0 0 0 0 0 0 0
43 0 0 0 0 0 0 0 0
44 1 472 1497 900 597 54 197 221
45 1 124 566 305 261 87 27 10
46 2 621 2397 1338 1059 85 272 264
47 4 542 1653 1003 650 240 139 163
48 5 1093 3799 2086 1713 210 481 402
49 4 796 2974 1697 1277 61 535 200
50 0 0 0 0 0 0 0 0
51 4 1096 3640 2041 1599 242 767 87
52 5 1413 4133 2233 1900 223 855 335
53 10 1057 4004 2225 1779 253 492 312
54 3 326 1442 780 662 265 30 31
55 2 2400 9400 5238 4162 120 1519 761
56 6 2394 8824 4870 3954 819 1020 555
57 2 782 3061 1785 1276 170 538 74
58 2 191 424 258 166 61 127 3
59 8 1269 5089 2901 2188 276 577 416
60 11 2558 9669 5664 4005 1260 773 525
Total 243 64072 229644 128156 101488 20740 28711 14621
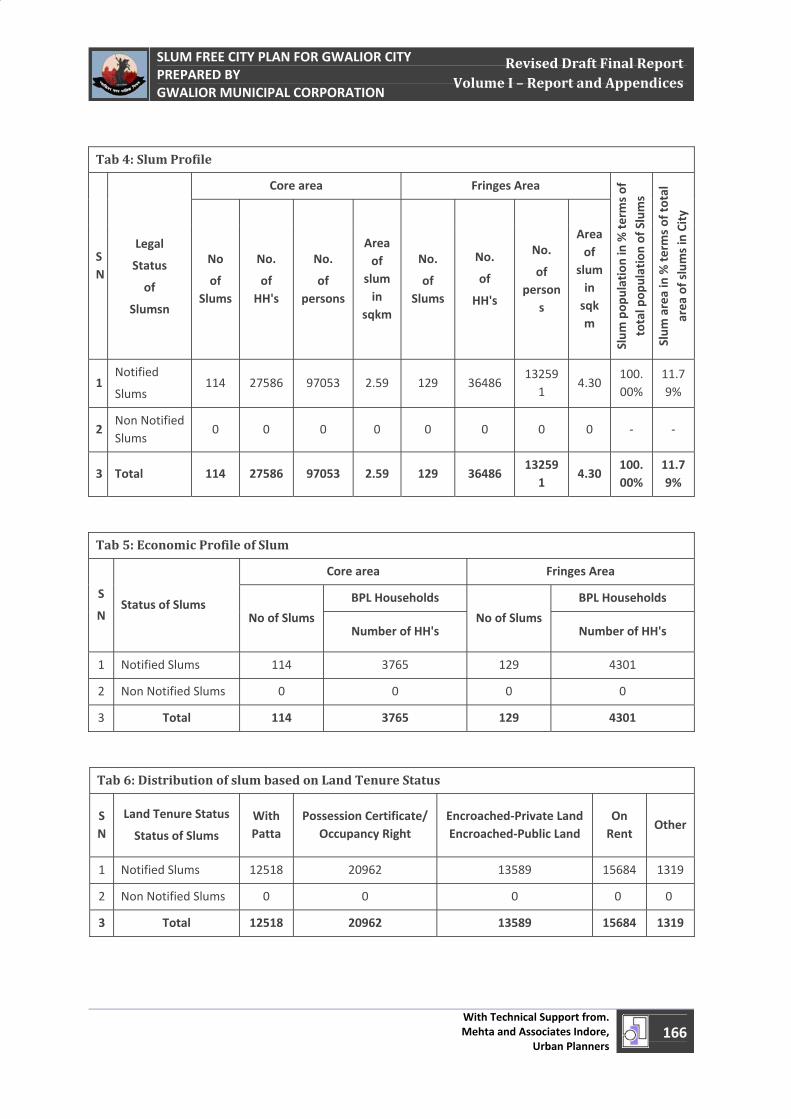
April 1, 2011
SLUM FREE CITY PLAN FOR GWALIOR CITY PREPARED BY GWALIOR MUNICIPAL CORPORATION
With Technical Support from. Mehta and Associates Indore,
Urban Planners 166
Revised Draft Final Report Volume I – Report and Appendices
Tab 4: Slum Profile
SN
Legal
Status
of
Slumsn
Core area Fringes Area
Slum
pop
ulation in % terms of
total pop
ulation of Slums
Slum
area in % terms of total
area
of slums in City
No
of Slums
No.
of HH's
No.
of persons
Area of
slum in
sqkm
No.
of Slums
No.
of
HH's
No.
of person
s
Area of
slum in sqkm
1 Notified
Slums 114 27586 97053 2.59 129 36486
132591
4.30 100.00%
11.79%
2 Non Notified Slums
0 0 0 0 0 0 0 0 ‐ ‐
3 Total 114 27586 97053 2.59 129 36486 132591
4.30 100.00%
11.79%
Tab 5: Economic Profile of Slum
S
N Status of Slums
Core area Fringes Area
No of Slums
BPL Households
No of Slums
BPL Households
Number of HH's Number of HH's
1 Notified Slums 114 3765 129 4301
2 Non Notified Slums 0 0 0 0
3 Total 114 3765 129 4301
Tab 6: Distribution of slum based on Land Tenure Status
SN
Land Tenure Status
Status of Slums
With Patta
Possession Certificate/ Occupancy Right
Encroached‐Private Land Encroached‐Public Land
On Rent
Other
1 Notified Slums 12518 20962 13589 15684 1319
2 Non Notified Slums 0 0 0 0 0
3 Total 12518 20962 13589 15684 1319

April 1, 2011
SLUM FREE CITY PLAN FOR GWALIOR CITY PREPARED BY GWALIOR MUNICIPAL CORPORATION
With Technical Support from. Mehta and Associates Indore,
Urban Planners 167
Revised Draft Final Report Volume I – Report and Appendices
Tab 7: WardWise Distribution of Slums
Ward No.
Notified Slums Non‐Notified Slums Total Slums
Number of
Notified slums
Pop_Density = Total population of all notified
slums in ward/total area (sqm) of all
notified slums in ward.
Number of Non
Notified slums
Pop_Density = Total population of all non‐notified
slums in ward/total area (sqm) of all non‐notified slums in
ward.
Total Number
of
Slums
Pop_Density = Total
population of all slums in ward/total area (sqm) of all slums in
ward.
1 7 0.022 0 0 7 0.022
2 8 0.052 0 0 8 0.052
3 4 0.030 0 0 4 0.030
4 7 0.086 0 0 7 0.086
5 5 0.009 0 0 5 0.009
6 8 0.024 0 0 8 0.024
7 6 0.050 0 0 6 0.050
8 3 0.043 0 0 3 0.043
9 8 0.023 0 0 8 0.023
10 9 0.034 0 0 9 0.034
11 2 0.185 0 0 2 0.185
12 1 0.165 0 0 1 0.165
13 4 0.081 0 0 4 0.081
14 5 0.070 0 0 5 0.070
15 4 0.048 0 0 4 0.048
16 4 0.036 0 0 4 0.036
17 4 0.047 0 0 4 0.047
18 2 0.033 0 0 2 0.033
19 2 0.046 0 0 2 0.046
21 5 0.015 0 0 5 0.015
22 5 0.057 0 0 5 0.057
23 5 0.041 0 0 5 0.041
25 2 0.014 0 0 2 0.014
26 9 0.060 0 0 9 0.060
27 1 0.053 0 0 1 0.053
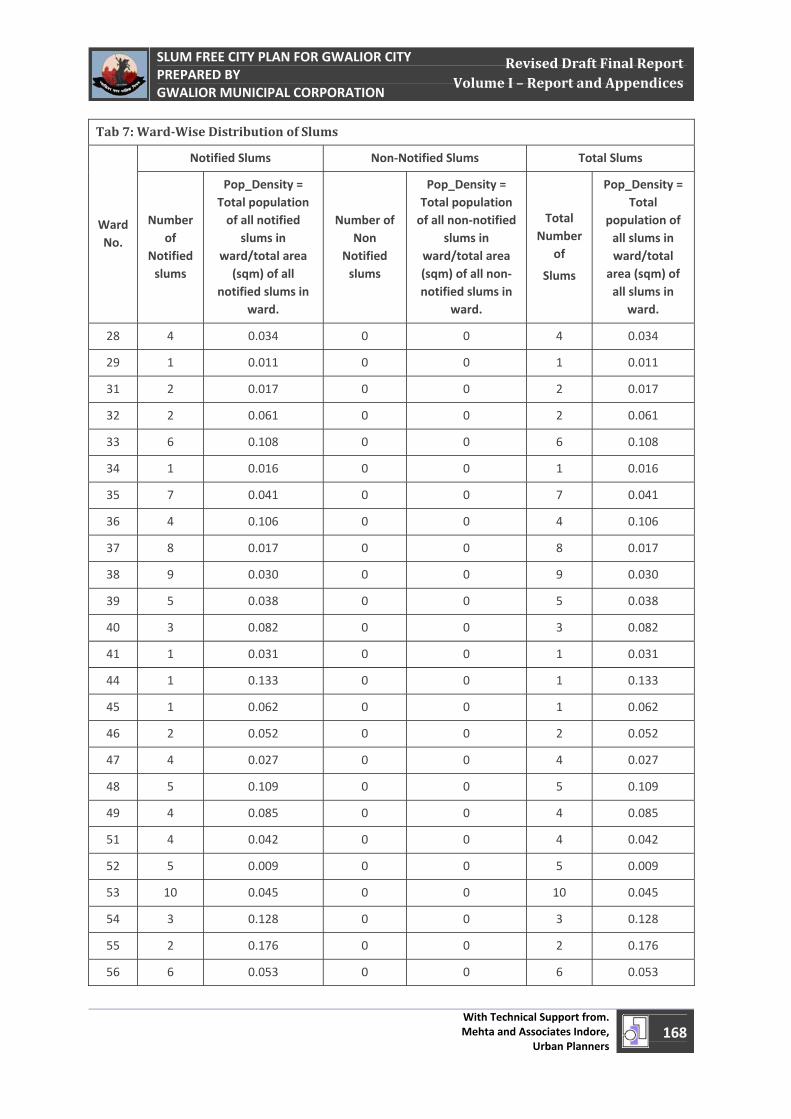
April 1, 2011
SLUM FREE CITY PLAN FOR GWALIOR CITY PREPARED BY GWALIOR MUNICIPAL CORPORATION
With Technical Support from. Mehta and Associates Indore,
Urban Planners 168
Revised Draft Final Report Volume I – Report and Appendices
Tab 7: WardWise Distribution of Slums
Ward No.
Notified Slums Non‐Notified Slums Total Slums
Number of
Notified slums
Pop_Density = Total population of all notified
slums in ward/total area (sqm) of all
notified slums in ward.
Number of Non
Notified slums
Pop_Density = Total population of all non‐notified
slums in ward/total area (sqm) of all non‐notified slums in
ward.
Total Number
of
Slums
Pop_Density = Total
population of all slums in ward/total area (sqm) of all slums in
ward.
28 4 0.034 0 0 4 0.034
29 1 0.011 0 0 1 0.011
31 2 0.017 0 0 2 0.017
32 2 0.061 0 0 2 0.061
33 6 0.108 0 0 6 0.108
34 1 0.016 0 0 1 0.016
35 7 0.041 0 0 7 0.041
36 4 0.106 0 0 4 0.106
37 8 0.017 0 0 8 0.017
38 9 0.030 0 0 9 0.030
39 5 0.038 0 0 5 0.038
40 3 0.082 0 0 3 0.082
41 1 0.031 0 0 1 0.031
44 1 0.133 0 0 1 0.133
45 1 0.062 0 0 1 0.062
46 2 0.052 0 0 2 0.052
47 4 0.027 0 0 4 0.027
48 5 0.109 0 0 5 0.109
49 4 0.085 0 0 4 0.085
51 4 0.042 0 0 4 0.042
52 5 0.009 0 0 5 0.009
53 10 0.045 0 0 10 0.045
54 3 0.128 0 0 3 0.128
55 2 0.176 0 0 2 0.176
56 6 0.053 0 0 6 0.053
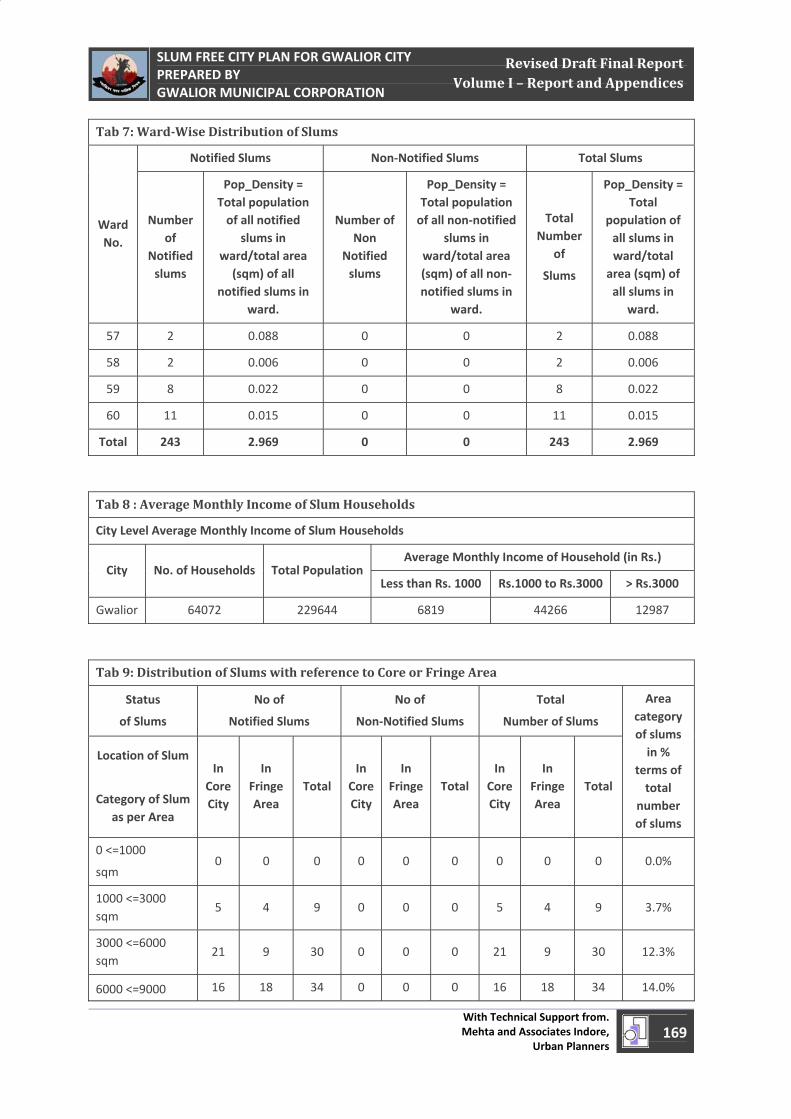
April 1, 2011
SLUM FREE CITY PLAN FOR GWALIOR CITY PREPARED BY GWALIOR MUNICIPAL CORPORATION
With Technical Support from. Mehta and Associates Indore,
Urban Planners 169
Revised Draft Final Report Volume I – Report and Appendices
Tab 7: WardWise Distribution of Slums
Ward No.
Notified Slums Non‐Notified Slums Total Slums
Number of
Notified slums
Pop_Density = Total population of all notified
slums in ward/total area (sqm) of all
notified slums in ward.
Number of Non
Notified slums
Pop_Density = Total population of all non‐notified
slums in ward/total area (sqm) of all non‐notified slums in
ward.
Total Number
of
Slums
Pop_Density = Total
population of all slums in ward/total area (sqm) of all slums in
ward.
57 2 0.088 0 0 2 0.088
58 2 0.006 0 0 2 0.006
59 8 0.022 0 0 8 0.022
60 11 0.015 0 0 11 0.015
Total 243 2.969 0 0 243 2.969
Tab 8 : Average Monthly Income of Slum Households
City Level Average Monthly Income of Slum Households
City No. of Households Total PopulationAverage Monthly Income of Household (in Rs.)
Less than Rs. 1000 Rs.1000 to Rs.3000 > Rs.3000
Gwalior 64072 229644 6819 44266 12987
Tab 9: Distribution of Slums with reference to Core or Fringe Area
Status
of Slums
No of
Notified Slums
No of
Non‐Notified Slums
Total
Number of Slums
Area category of slums in %
terms of total
number of slums
Location of Slum
Category of Slum as per Area
In Core City
In Fringe Area
Total In
Core City
In Fringe Area
Total In
Core City
In Fringe Area
Total
0 <=1000
sqm 0 0 0 0 0 0 0 0 0 0.0%
1000 <=3000 sqm
5 4 9 0 0 0 5 4 9 3.7%
3000 <=6000 sqm
21 9 30 0 0 0 21 9 30 12.3%
6000 <=9000 16 18 34 0 0 0 16 18 34 14.0%
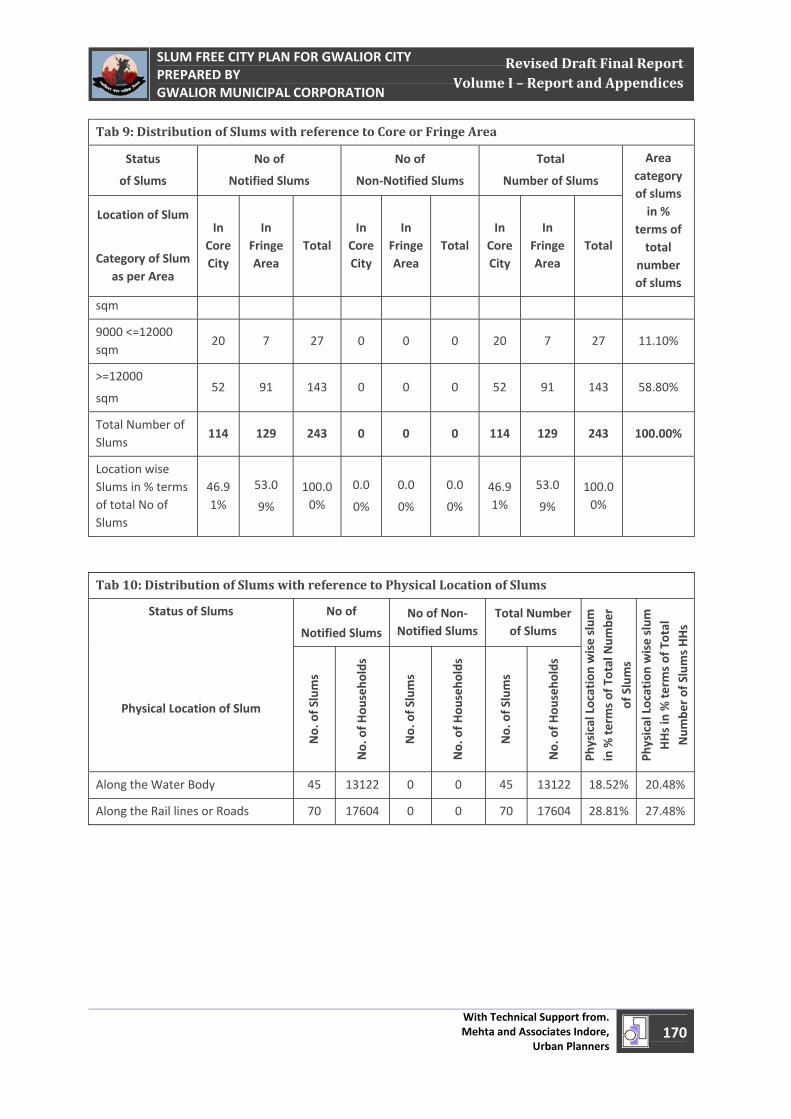
April 1, 2011
SLUM FREE CITY PLAN FOR GWALIOR CITY PREPARED BY GWALIOR MUNICIPAL CORPORATION
With Technical Support from. Mehta and Associates Indore,
Urban Planners 170
Revised Draft Final Report Volume I – Report and Appendices
Tab 9: Distribution of Slums with reference to Core or Fringe Area
Status
of Slums
No of
Notified Slums
No of
Non‐Notified Slums
Total
Number of Slums
Area category of slums in %
terms of total
number of slums
Location of Slum
Category of Slum as per Area
In Core City
In Fringe Area
Total In
Core City
In Fringe Area
Total In
Core City
In Fringe Area
Total
sqm
9000 <=12000 sqm
20 7 27 0 0 0 20 7 27 11.10%
>=12000
sqm 52 91 143 0 0 0 52 91 143 58.80%
Total Number of Slums
114 129 243 0 0 0 114 129 243 100.00%
Location wise Slums in % terms of total No of Slums
46.91%
53.0
9%
100.00%
0.0
0%
0.0
0%
0.0
0%
46.91%
53.0
9%
100.00%
Tab 10: Distribution of Slums with reference to Physical Location of Slums
Status of Slums
Physical Location of Slum
No of
Notified Slums
No of Non‐Notified Slums
Total Number of Slums
Physical Location wise slum
in % terms of Total Num
ber
of Slums
Physical Location wise slum
HHs in % te
rms of Total
Num
ber of Slums HHs
No. of Slums
No. of H
ouseho
lds
No. of Slums
No. of H
ouseho
lds
No. of Slums
No. of H
ouseho
lds
Along the Water Body 45 13122 0 0 45 13122 18.52% 20.48%
Along the Rail lines or Roads 70 17604 0 0 70 17604 28.81% 27.48%
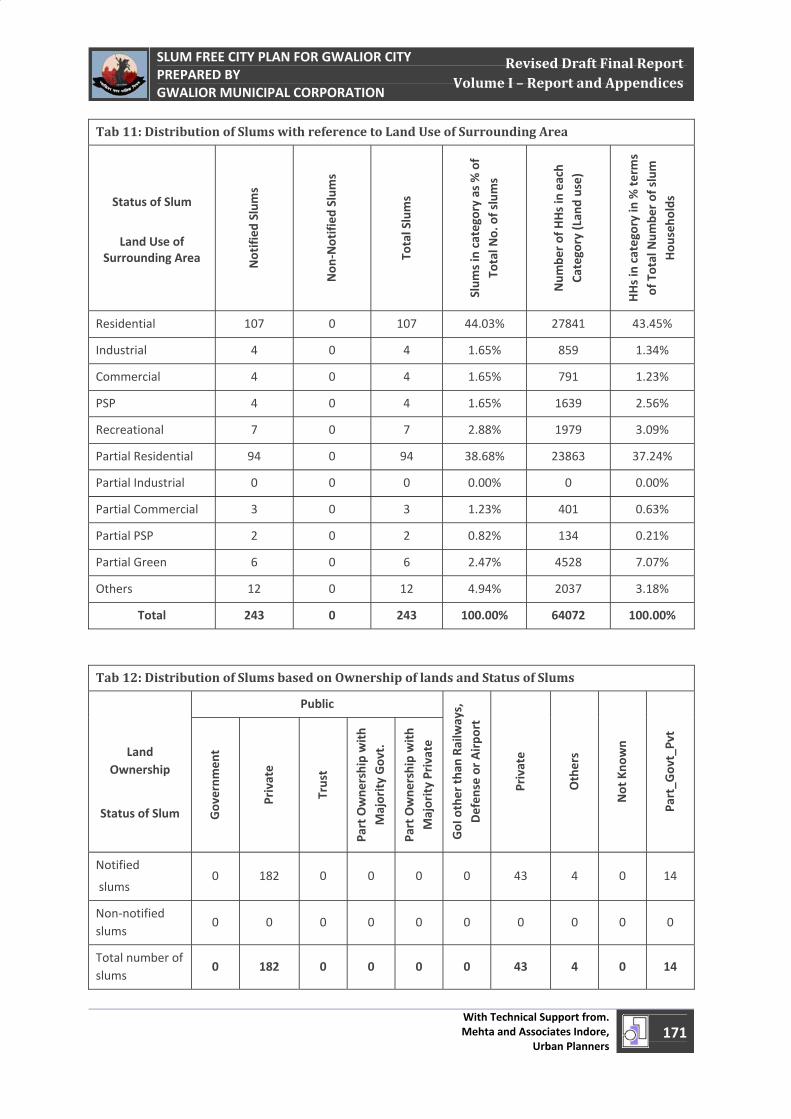
April 1, 2011
SLUM FREE CITY PLAN FOR GWALIOR CITY PREPARED BY GWALIOR MUNICIPAL CORPORATION
With Technical Support from. Mehta and Associates Indore,
Urban Planners 171
Revised Draft Final Report Volume I – Report and Appendices
Tab 11: Distribution of Slums with reference to Land Use of Surrounding Area
Status of Slum
Land Use of
Surrounding Area Notified
Slums
Non
‐Notified
Slums
Total Slums
Slum
s in category as % of
Total N
o. of slums
Num
ber of HHs in each
Category (Lan
d use)
HHs in category in % terms
of Total Num
ber of slum
Hou
seho
lds
Residential 107 0 107 44.03% 27841 43.45%
Industrial 4 0 4 1.65% 859 1.34%
Commercial 4 0 4 1.65% 791 1.23%
PSP 4 0 4 1.65% 1639 2.56%
Recreational 7 0 7 2.88% 1979 3.09%
Partial Residential 94 0 94 38.68% 23863 37.24%
Partial Industrial 0 0 0 0.00% 0 0.00%
Partial Commercial 3 0 3 1.23% 401 0.63%
Partial PSP 2 0 2 0.82% 134 0.21%
Partial Green 6 0 6 2.47% 4528 7.07%
Others 12 0 12 4.94% 2037 3.18%
Total 243 0 243 100.00% 64072 100.00%
Tab 12: Distribution of Slums based on Ownership of lands and Status of Slums
Land Ownership
Status of Slum
Public
GoI other th
an Railways,
Defen
se or Airpo
rt
Private
Others
Not Kno
wn
Part_G
ovt_Pvt
Governm
ent
Private
Trust
Part Owne
rship with
Majority Govt.
Part Owne
rship with
Majority Private
Notified
slums 0 182 0 0 0 0 43 4 0 14
Non‐notified slums
0 0 0 0 0 0 0 0 0 0
Total number of slums
0 182 0 0 0 0 43 4 0 14
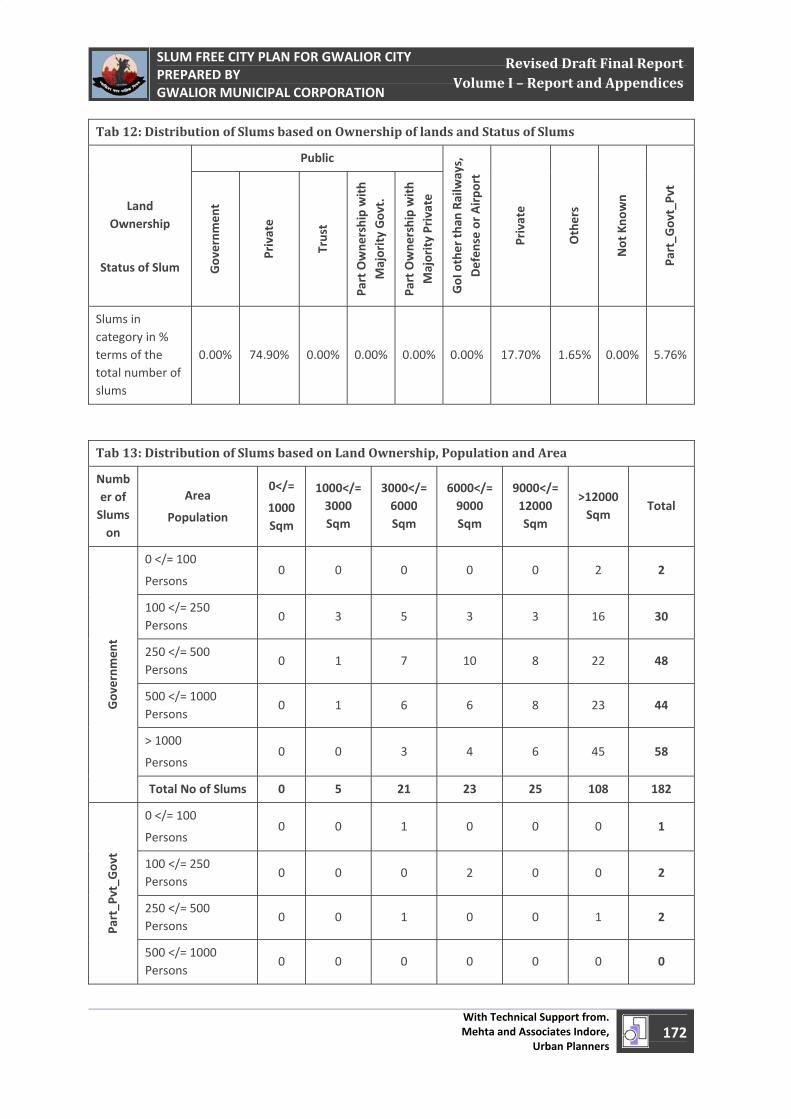
April 1, 2011
SLUM FREE CITY PLAN FOR GWALIOR CITY PREPARED BY GWALIOR MUNICIPAL CORPORATION
With Technical Support from. Mehta and Associates Indore,
Urban Planners 172
Revised Draft Final Report Volume I – Report and Appendices
Tab 12: Distribution of Slums based on Ownership of lands and Status of Slums
Land Ownership
Status of Slum
Public
GoI other th
an Railways,
Defen
se or Airpo
rt
Private
Others
Not Kno
wn
Part_G
ovt_Pvt
Governm
ent
Private
Trust
Part Owne
rship with
Majority Govt.
Part Owne
rship with
Majority Private
Slums in category in % terms of the total number of slums
0.00% 74.90% 0.00% 0.00% 0.00% 0.00% 17.70% 1.65% 0.00% 5.76%
Tab 13: Distribution of Slums based on Land Ownership, Population and Area
Number of Slums on
Area
Population
0</=
1000 Sqm
1000</=3000 Sqm
3000</=6000 Sqm
6000</=9000 Sqm
9000</=12000 Sqm
>12000 Sqm
Total
Governm
ent
0 </= 100
Persons 0 0 0 0 0 2 2
100 </= 250 Persons
0 3 5 3 3 16 30
250 </= 500 Persons
0 1 7 10 8 22 48
500 </= 1000 Persons
0 1 6 6 8 23 44
> 1000
Persons 0 0 3 4 6 45 58
Total No of Slums 0 5 21 23 25 108 182
Part_P
vt_G
ovt
0 </= 100
Persons 0 0 1 0 0 0 1
100 </= 250 Persons
0 0 0 2 0 0 2
250 </= 500 Persons
0 0 1 0 0 1 2
500 </= 1000 Persons
0 0 0 0 0 0 0
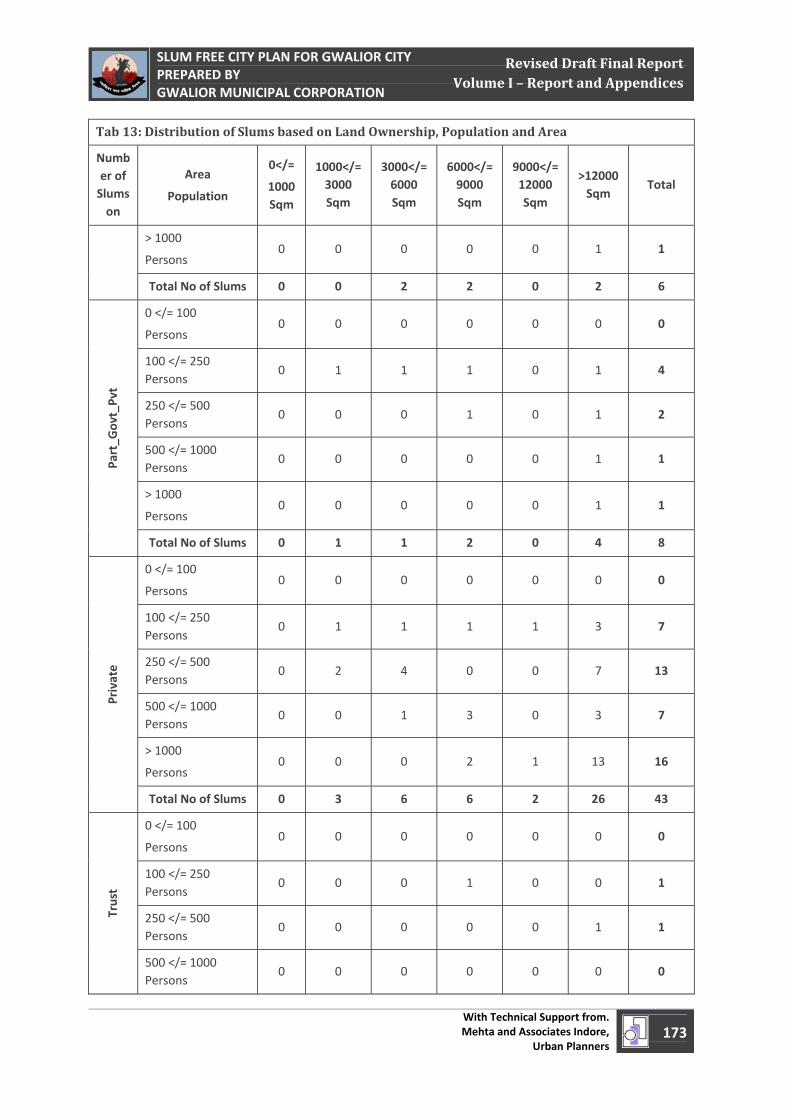
April 1, 2011
SLUM FREE CITY PLAN FOR GWALIOR CITY PREPARED BY GWALIOR MUNICIPAL CORPORATION
With Technical Support from. Mehta and Associates Indore,
Urban Planners 173
Revised Draft Final Report Volume I – Report and Appendices
Tab 13: Distribution of Slums based on Land Ownership, Population and Area
Number of Slums on
Area
Population
0</=
1000 Sqm
1000</=3000 Sqm
3000</=6000 Sqm
6000</=9000 Sqm
9000</=12000 Sqm
>12000 Sqm
Total
> 1000
Persons 0 0 0 0 0 1 1
Total No of Slums 0 0 2 2 0 2 6
Part_G
ovt_Pvt
0 </= 100
Persons 0 0 0 0 0 0 0
100 </= 250 Persons
0 1 1 1 0 1 4
250 </= 500 Persons
0 0 0 1 0 1 2
500 </= 1000 Persons
0 0 0 0 0 1 1
> 1000
Persons 0 0 0 0 0 1 1
Total No of Slums 0 1 1 2 0 4 8
Private
0 </= 100
Persons 0 0 0 0 0 0 0
100 </= 250 Persons
0 1 1 1 1 3 7
250 </= 500 Persons
0 2 4 0 0 7 13
500 </= 1000 Persons
0 0 1 3 0 3 7
> 1000
Persons 0 0 0 2 1 13 16
Total No of Slums 0 3 6 6 2 26 43
Trust
0 </= 100
Persons 0 0 0 0 0 0 0
100 </= 250 Persons
0 0 0 1 0 0 1
250 </= 500 Persons
0 0 0 0 0 1 1
500 </= 1000 Persons
0 0 0 0 0 0 0
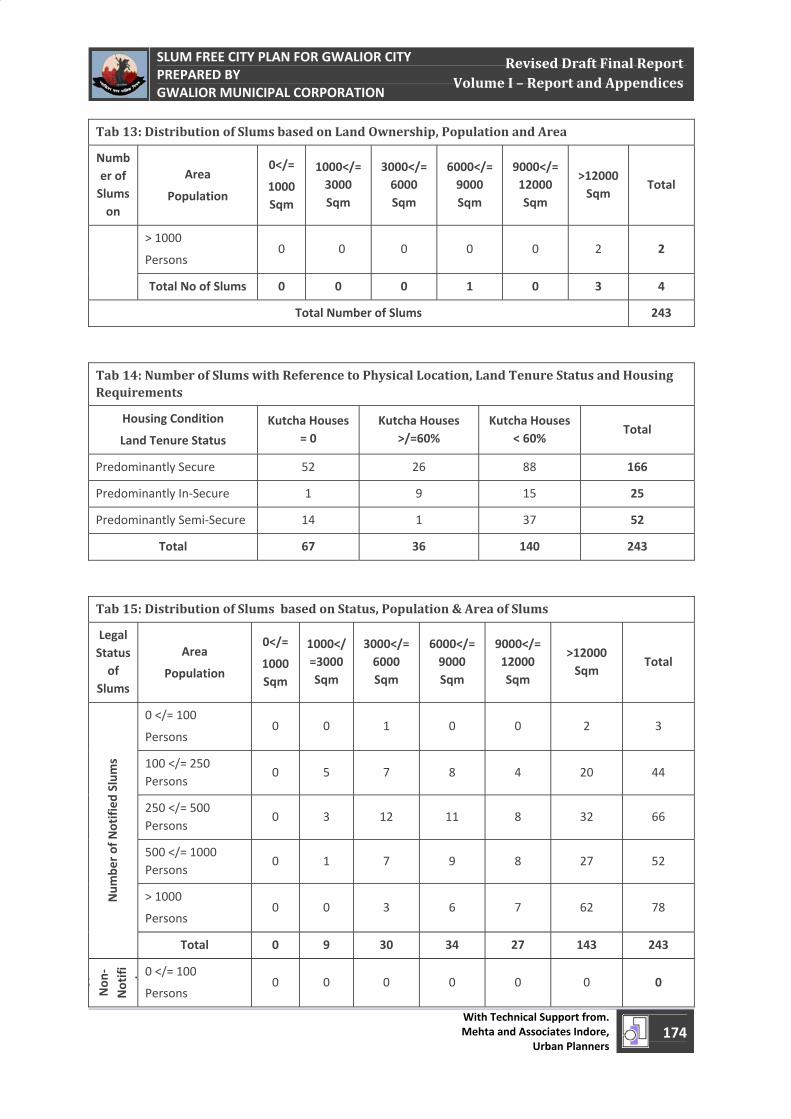
April 1, 2011
SLUM FREE CITY PLAN FOR GWALIOR CITY PREPARED BY GWALIOR MUNICIPAL CORPORATION
With Technical Support from. Mehta and Associates Indore,
Urban Planners 174
Revised Draft Final Report Volume I – Report and Appendices
Tab 13: Distribution of Slums based on Land Ownership, Population and Area
Number of Slums on
Area
Population
0</=
1000 Sqm
1000</=3000 Sqm
3000</=6000 Sqm
6000</=9000 Sqm
9000</=12000 Sqm
>12000 Sqm
Total
> 1000
Persons 0 0 0 0 0 2 2
Total No of Slums 0 0 0 1 0 3 4
Total Number of Slums 243
Tab 14: Number of Slums with Reference to Physical Location, Land Tenure Status and Housing Requirements
Housing Condition
Land Tenure Status
Kutcha Houses = 0
Kutcha Houses >/=60%
Kutcha Houses < 60%
Total
Predominantly Secure 52 26 88 166
Predominantly In‐Secure 1 9 15 25
Predominantly Semi‐Secure 14 1 37 52
Total 67 36 140 243
Tab 15: Distribution of Slums based on Status, Population & Area of Slums
Legal Status of
Slums
Area
Population
0</=
1000 Sqm
1000</=3000 Sqm
3000</=6000 Sqm
6000</=9000 Sqm
9000</=12000 Sqm
>12000 Sqm
Total
Num
ber of Notified
Slums
0 </= 100
Persons 0 0 1 0 0 2 3
100 </= 250 Persons
0 5 7 8 4 20 44
250 </= 500 Persons
0 3 12 11 8 32 66
500 </= 1000 Persons
0 1 7 9 8 27 52
> 1000
Persons 0 0 3 6 7 62 78
Total 0 9 30 34 27 143 243
of
Non
‐Notifi d0 </= 100
Persons 0 0 0 0 0 0 0
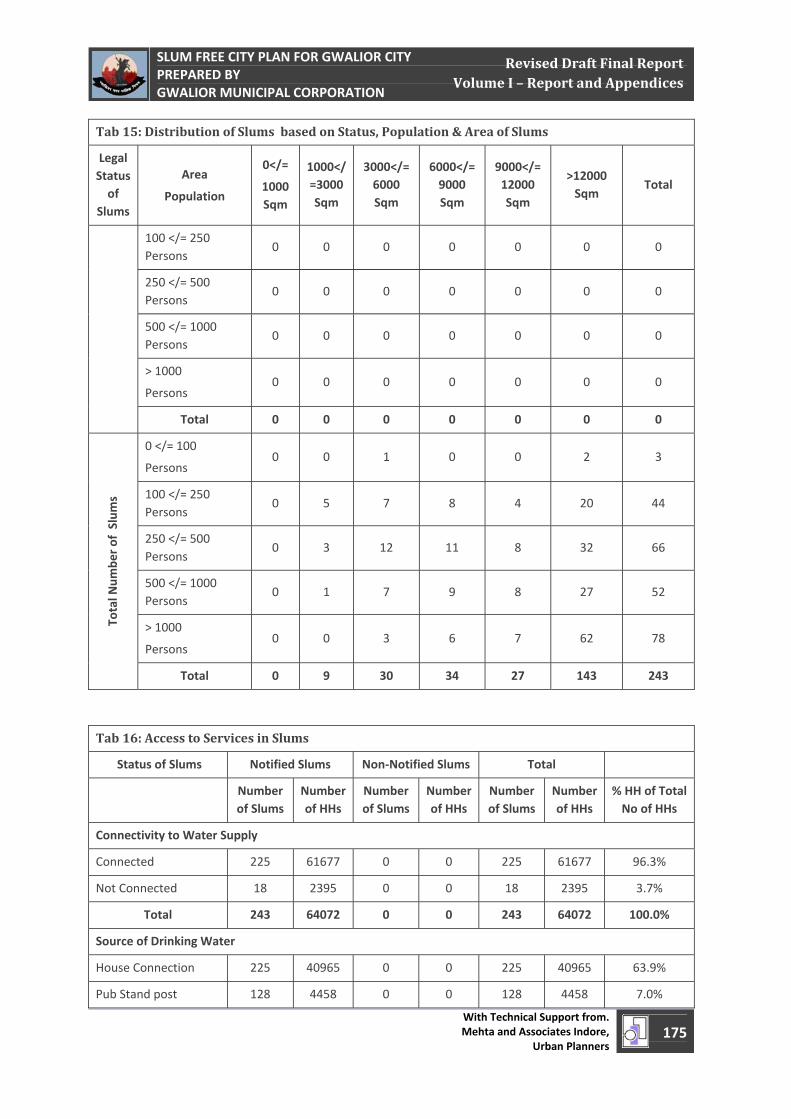
April 1, 2011
SLUM FREE CITY PLAN FOR GWALIOR CITY PREPARED BY GWALIOR MUNICIPAL CORPORATION
With Technical Support from. Mehta and Associates Indore,
Urban Planners 175
Revised Draft Final Report Volume I – Report and Appendices
Tab 15: Distribution of Slums based on Status, Population & Area of Slums
Legal Status of
Slums
Area
Population
0</=
1000 Sqm
1000</=3000 Sqm
3000</=6000 Sqm
6000</=9000 Sqm
9000</=12000 Sqm
>12000 Sqm
Total
100 </= 250 Persons
0 0 0 0 0 0 0
250 </= 500 Persons
0 0 0 0 0 0 0
500 </= 1000 Persons
0 0 0 0 0 0 0
> 1000
Persons 0 0 0 0 0 0 0
Total 0 0 0 0 0 0 0
Total N
umbe
r of Slums
0 </= 100
Persons 0 0 1 0 0 2 3
100 </= 250 Persons
0 5 7 8 4 20 44
250 </= 500 Persons
0 3 12 11 8 32 66
500 </= 1000 Persons
0 1 7 9 8 27 52
> 1000
Persons 0 0 3 6 7 62 78
Total 0 9 30 34 27 143 243
Tab 16: Access to Services in Slums
Status of Slums Notified Slums Non‐Notified Slums Total
Number of Slums
Number of HHs
Number of Slums
Number of HHs
Number of Slums
Number of HHs
% HH of Total No of HHs
Connectivity to Water Supply
Connected 225 61677 0 0 225 61677 96.3%
Not Connected 18 2395 0 0 18 2395 3.7%
Total 243 64072 0 0 243 64072 100.0%
Source of Drinking Water
House Connection 225 40965 0 0 225 40965 63.9%
Pub Stand post 128 4458 0 0 128 4458 7.0%
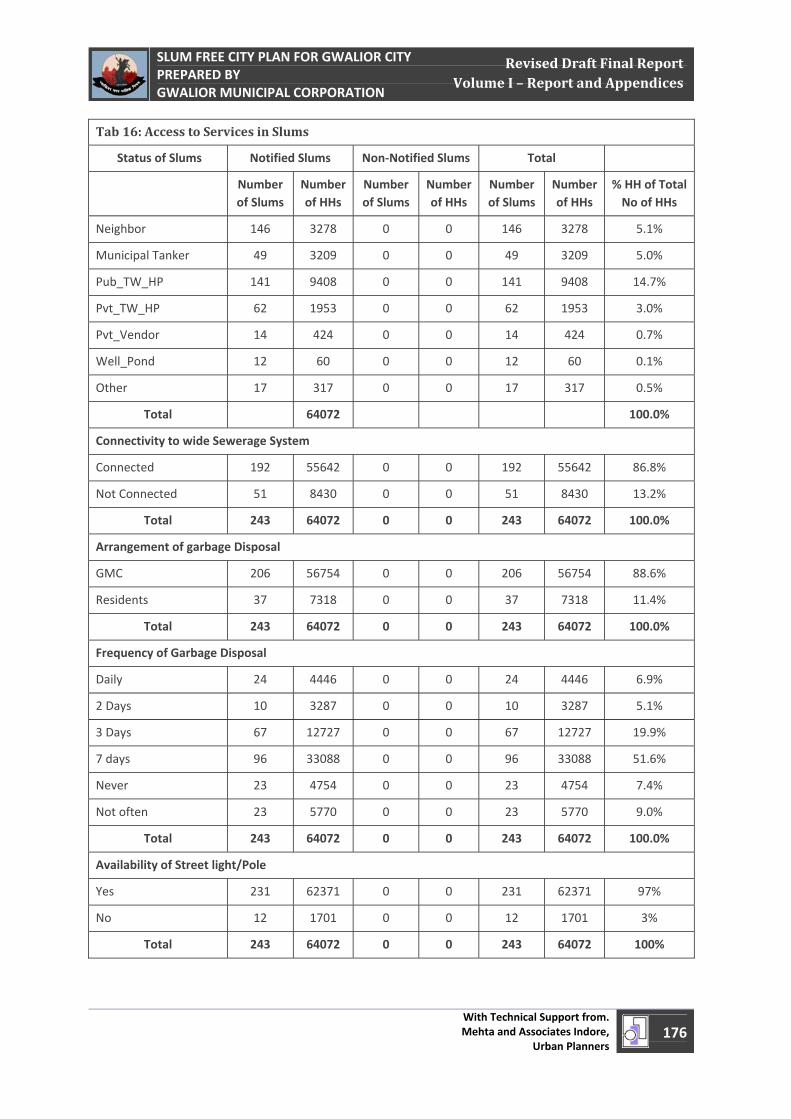
April 1, 2011
SLUM FREE CITY PLAN FOR GWALIOR CITY PREPARED BY GWALIOR MUNICIPAL CORPORATION
With Technical Support from. Mehta and Associates Indore,
Urban Planners 176
Revised Draft Final Report Volume I – Report and Appendices
Tab 16: Access to Services in Slums
Status of Slums Notified Slums Non‐Notified Slums Total
Number of Slums
Number of HHs
Number of Slums
Number of HHs
Number of Slums
Number of HHs
% HH of Total No of HHs
Neighbor 146 3278 0 0 146 3278 5.1%
Municipal Tanker 49 3209 0 0 49 3209 5.0%
Pub_TW_HP 141 9408 0 0 141 9408 14.7%
Pvt_TW_HP 62 1953 0 0 62 1953 3.0%
Pvt_Vendor 14 424 0 0 14 424 0.7%
Well_Pond 12 60 0 0 12 60 0.1%
Other 17 317 0 0 17 317 0.5%
Total 64072 100.0%
Connectivity to wide Sewerage System
Connected 192 55642 0 0 192 55642 86.8%
Not Connected 51 8430 0 0 51 8430 13.2%
Total 243 64072 0 0 243 64072 100.0%
Arrangement of garbage Disposal
GMC 206 56754 0 0 206 56754 88.6%
Residents 37 7318 0 0 37 7318 11.4%
Total 243 64072 0 0 243 64072 100.0%
Frequency of Garbage Disposal
Daily 24 4446 0 0 24 4446 6.9%
2 Days 10 3287 0 0 10 3287 5.1%
3 Days 67 12727 0 0 67 12727 19.9%
7 days 96 33088 0 0 96 33088 51.6%
Never 23 4754 0 0 23 4754 7.4%
Not often 23 5770 0 0 23 5770 9.0%
Total 243 64072 0 0 243 64072 100.0%
Availability of Street light/Pole
Yes 231 62371 0 0 231 62371 97%
No 12 1701 0 0 12 1701 3%
Total 243 64072 0 0 243 64072 100%
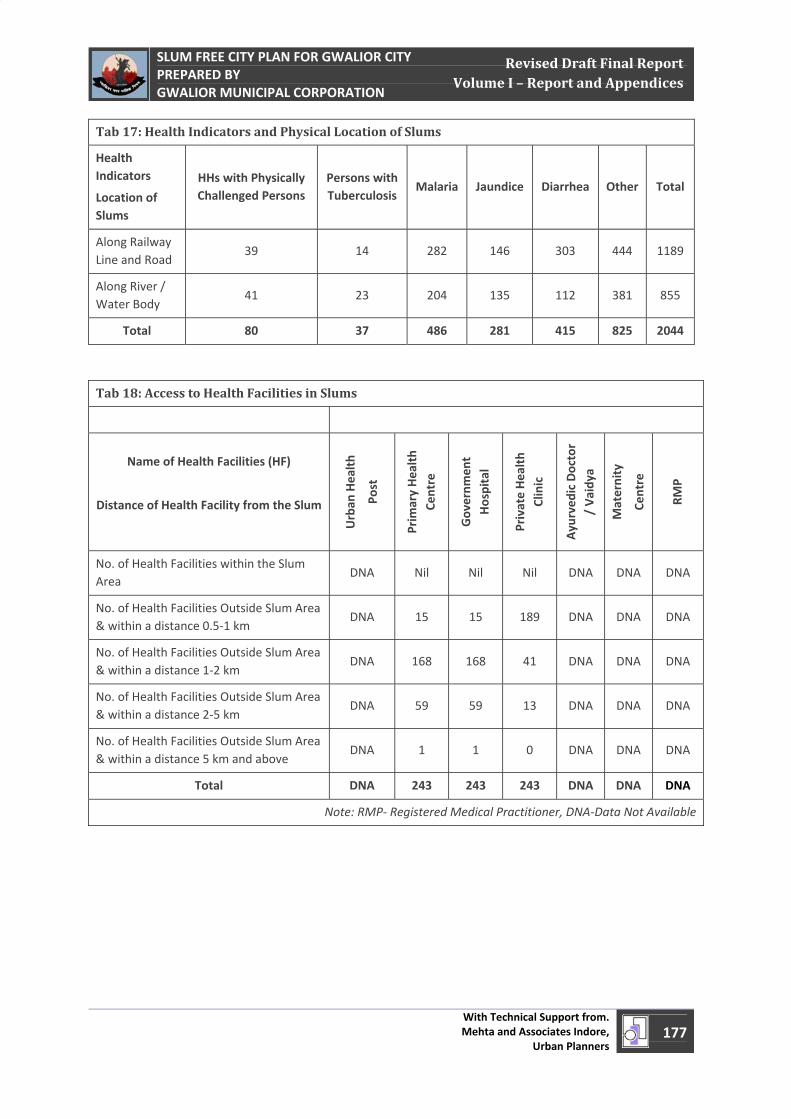
April 1, 2011
SLUM FREE CITY PLAN FOR GWALIOR CITY PREPARED BY GWALIOR MUNICIPAL CORPORATION
With Technical Support from. Mehta and Associates Indore,
Urban Planners 177
Revised Draft Final Report Volume I – Report and Appendices
Tab 17: Health Indicators and Physical Location of Slums
Health Indicators
Location of Slums
HHs with Physically Challenged Persons
Persons with Tuberculosis
Malaria Jaundice Diarrhea Other Total
Along Railway Line and Road
39 14 282 146 303 444 1189
Along River / Water Body
41 23 204 135 112 381 855
Total 80 37 486 281 415 825 2044
Tab 18: Access to Health Facilities in Slums
Name of Health Facilities (HF)
Distance of Health Facility from the Slum
Urban
Health
Post
Prim
ary Health
Centre
Governm
ent
Hospital
Private Health
Clinic
Ayurved
ic Doctor
/ Vaidya
Maternity
Centre
RMP
No. of Health Facilities within the Slum Area
DNA Nil Nil Nil DNA DNA DNA
No. of Health Facilities Outside Slum Area & within a distance 0.5‐1 km
DNA 15 15 189 DNA DNA DNA
No. of Health Facilities Outside Slum Area & within a distance 1‐2 km
DNA 168 168 41 DNA DNA DNA
No. of Health Facilities Outside Slum Area & within a distance 2‐5 km
DNA 59 59 13 DNA DNA DNA
No. of Health Facilities Outside Slum Area & within a distance 5 km and above
DNA 1 1 0 DNA DNA DNA
Total DNA 243 243 243 DNA DNA DNA
Note: RMP‐ Registered Medical Practitioner, DNA‐Data Not Available
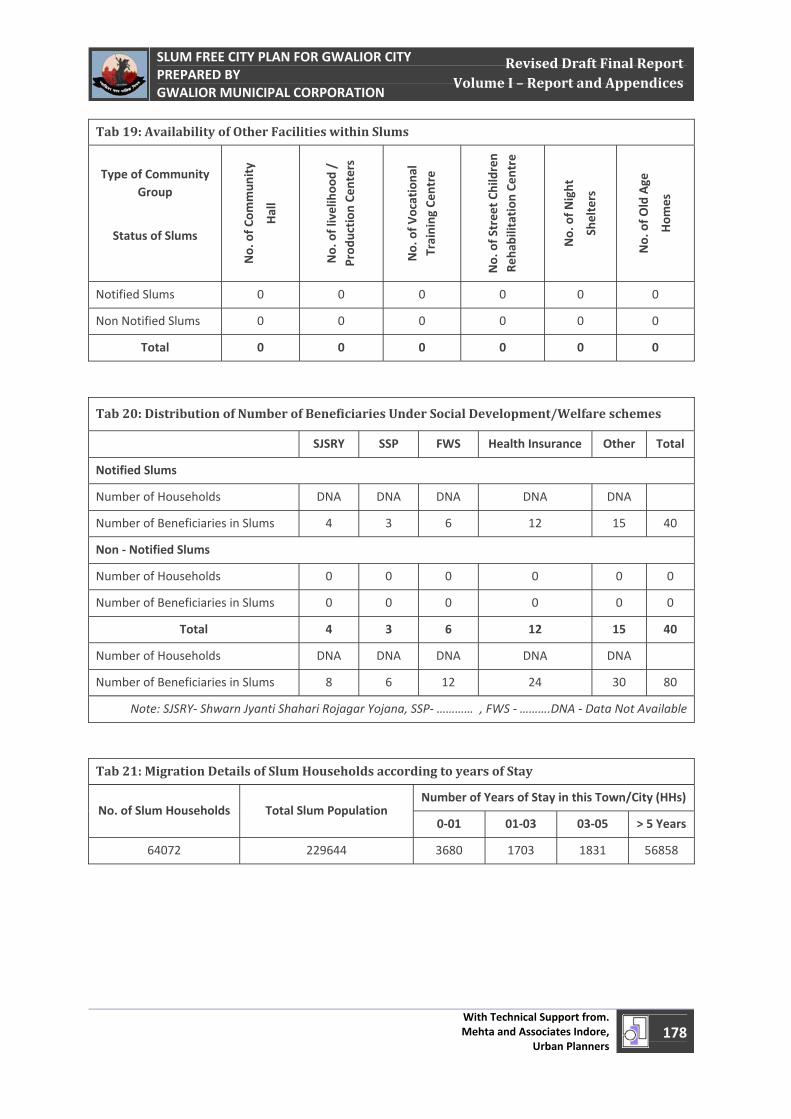
April 1, 2011
SLUM FREE CITY PLAN FOR GWALIOR CITY PREPARED BY GWALIOR MUNICIPAL CORPORATION
With Technical Support from. Mehta and Associates Indore,
Urban Planners 178
Revised Draft Final Report Volume I – Report and Appendices
Tab 19: Availability of Other Facilities within Slums
Type of Community Group
Status of Slums No. of C
ommun
ity
Hall
No. of livelihoo
d /
Prod
uction
Cen
ters
No. of V
ocationa
l Training
Cen
tre
No. of Street Ch
ildren
Reha
bilitation Ce
ntre
No. of N
ight
Shelters
No. of O
ld Age
Hom
es
Notified Slums 0 0 0 0 0 0
Non Notified Slums 0 0 0 0 0 0
Total 0 0 0 0 0 0
Tab 20: Distribution of Number of Beneficiaries Under Social Development/Welfare schemes
SJSRY SSP FWS Health Insurance Other Total
Notified Slums
Number of Households DNA DNA DNA DNA DNA
Number of Beneficiaries in Slums 4 3 6 12 15 40
Non ‐ Notified Slums
Number of Households 0 0 0 0 0 0
Number of Beneficiaries in Slums 0 0 0 0 0 0
Total 4 3 6 12 15 40
Number of Households DNA DNA DNA DNA DNA
Number of Beneficiaries in Slums 8 6 12 24 30 80
Note: SJSRY‐ Shwarn Jyanti Shahari Rojagar Yojana, SSP‐ ………… , FWS ‐ ……….DNA ‐ Data Not Available
Tab 21: Migration Details of Slum Households according to years of Stay
No. of Slum Households Total Slum Population Number of Years of Stay in this Town/City (HHs)
0‐01 01‐03 03‐05 > 5 Years
64072 229644 3680 1703 1831 56858
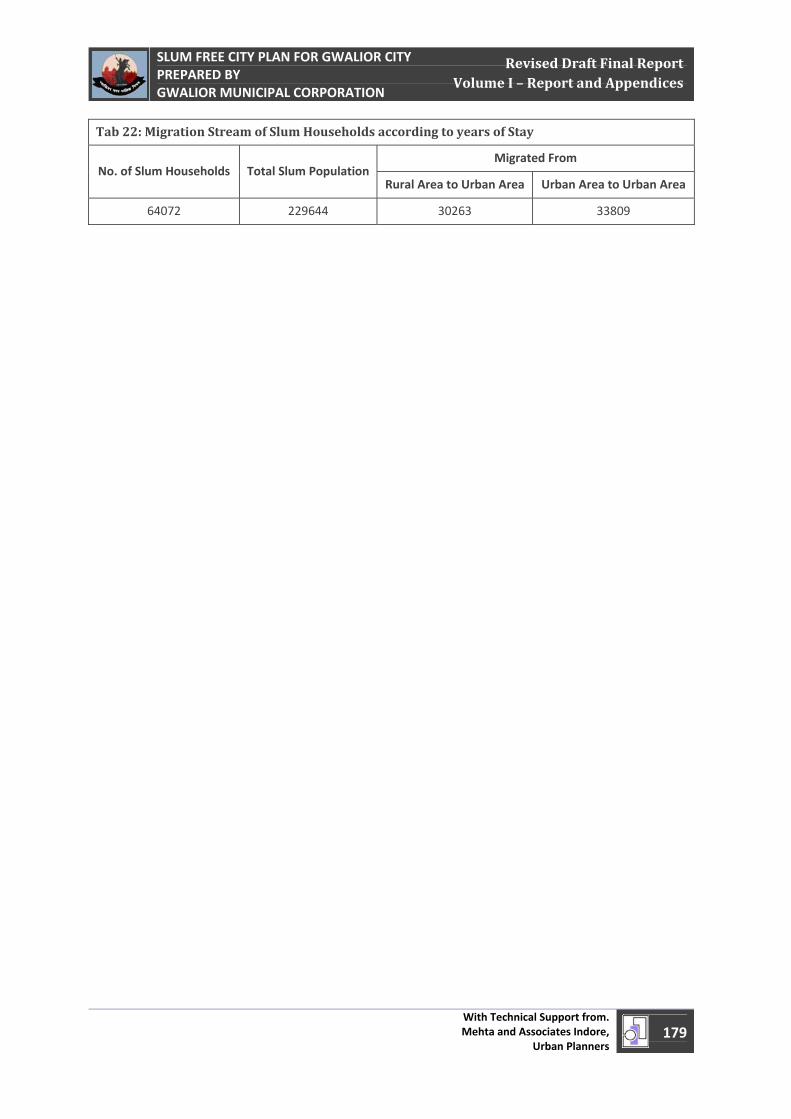
April 1, 2011
SLUM FREE CITY PLAN FOR GWALIOR CITY PREPARED BY GWALIOR MUNICIPAL CORPORATION
With Technical Support from. Mehta and Associates Indore,
Urban Planners 179
Revised Draft Final Report Volume I – Report and Appendices
Tab 22: Migration Stream of Slum Households according to years of Stay
No. of Slum Households Total Slum PopulationMigrated From
Rural Area to Urban Area Urban Area to Urban Area
64072 229644 30263 33809
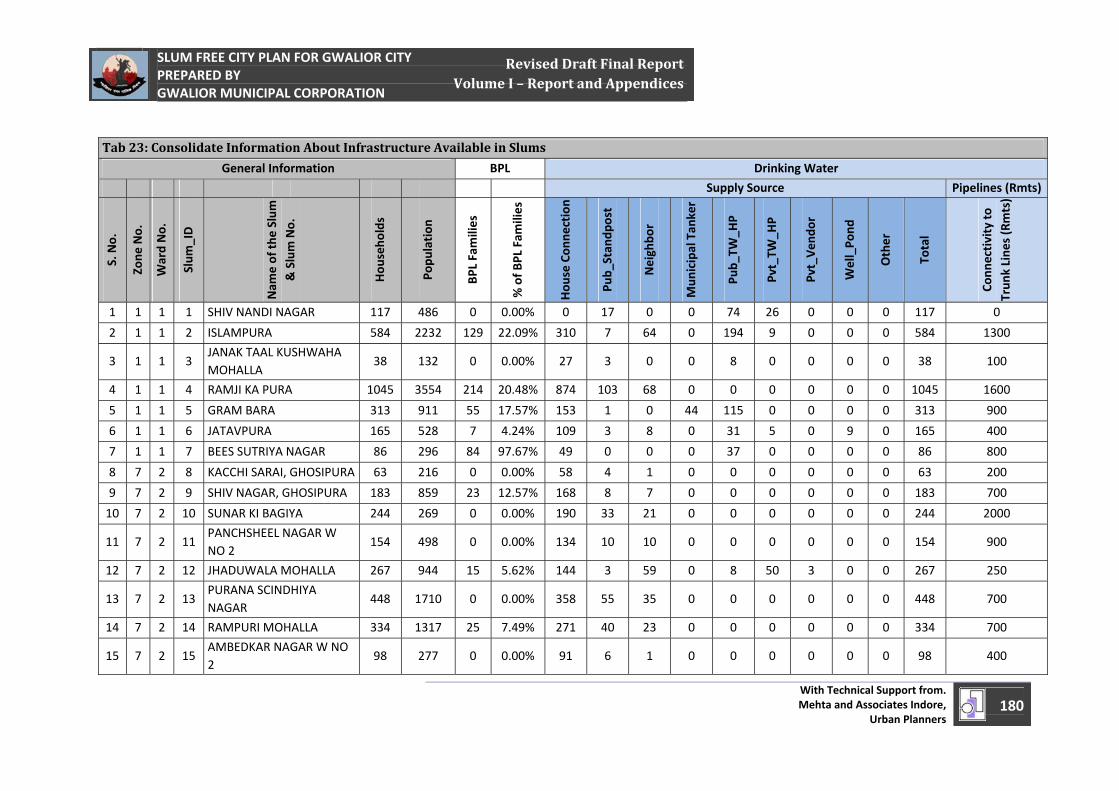
April 1, 2011
SLUM FREE CITY PLAN FOR GWALIOR CITY PREPARED BY GWALIOR MUNICIPAL CORPORATION
With Technical Support from. Mehta and Associates Indore,
Urban Planners180
Revised Draft Final Report Volume I – Report and Appendices
Tab 23: Consolidate Information About Infrastructure Available in Slums
General Information BPL Drinking Water
Supply Source Pipelines (Rmts)
S. No.
Zone
No.
Ward No.
Slum
_ID
Nam
e of th
e Slum
& Slum No.
Hou
seho
lds
Popu
lation
BPL Families
% of B
PL Fam
ilies
Hou
se Con
nection
Pub_
Stan
dpost
Neighbo
r
Mun
icipal Tan
ker
Pub_
TW_H
P
Pvt_TW
_HP
Pvt_Ven
dor
Well_Po
nd
Other
Total
Conn
ectivity to
Trun
k Line
s (Rmts)
1 1 1 1 SHIV NANDI NAGAR 117 486 0 0.00% 0 17 0 0 74 26 0 0 0 117 0
2 1 1 2 ISLAMPURA 584 2232 129 22.09% 310 7 64 0 194 9 0 0 0 584 1300
3 1 1 3 JANAK TAAL KUSHWAHA MOHALLA
38 132 0 0.00% 27 3 0 0 8 0 0 0 0 38 100
4 1 1 4 RAMJI KA PURA 1045 3554 214 20.48% 874 103 68 0 0 0 0 0 0 1045 1600
5 1 1 5 GRAM BARA 313 911 55 17.57% 153 1 0 44 115 0 0 0 0 313 900
6 1 1 6 JATAVPURA 165 528 7 4.24% 109 3 8 0 31 5 0 9 0 165 400
7 1 1 7 BEES SUTRIYA NAGAR 86 296 84 97.67% 49 0 0 0 37 0 0 0 0 86 800
8 7 2 8 KACCHI SARAI, GHOSIPURA 63 216 0 0.00% 58 4 1 0 0 0 0 0 0 63 200
9 7 2 9 SHIV NAGAR, GHOSIPURA 183 859 23 12.57% 168 8 7 0 0 0 0 0 0 183 700
10 7 2 10 SUNAR KI BAGIYA 244 269 0 0.00% 190 33 21 0 0 0 0 0 0 244 2000
11 7 2 11 PANCHSHEEL NAGAR W NO 2
154 498 0 0.00% 134 10 10 0 0 0 0 0 0 154 900
12 7 2 12 JHADUWALA MOHALLA 267 944 15 5.62% 144 3 59 0 8 50 3 0 0 267 250
13 7 2 13 PURANA SCINDHIYA NAGAR
448 1710 0 0.00% 358 55 35 0 0 0 0 0 0 448 700
14 7 2 14 RAMPURI MOHALLA 334 1317 25 7.49% 271 40 23 0 0 0 0 0 0 334 700
15 7 2 15 AMBEDKAR NAGAR W NO 2
98 277 0 0.00% 91 6 1 0 0 0 0 0 0 98 400
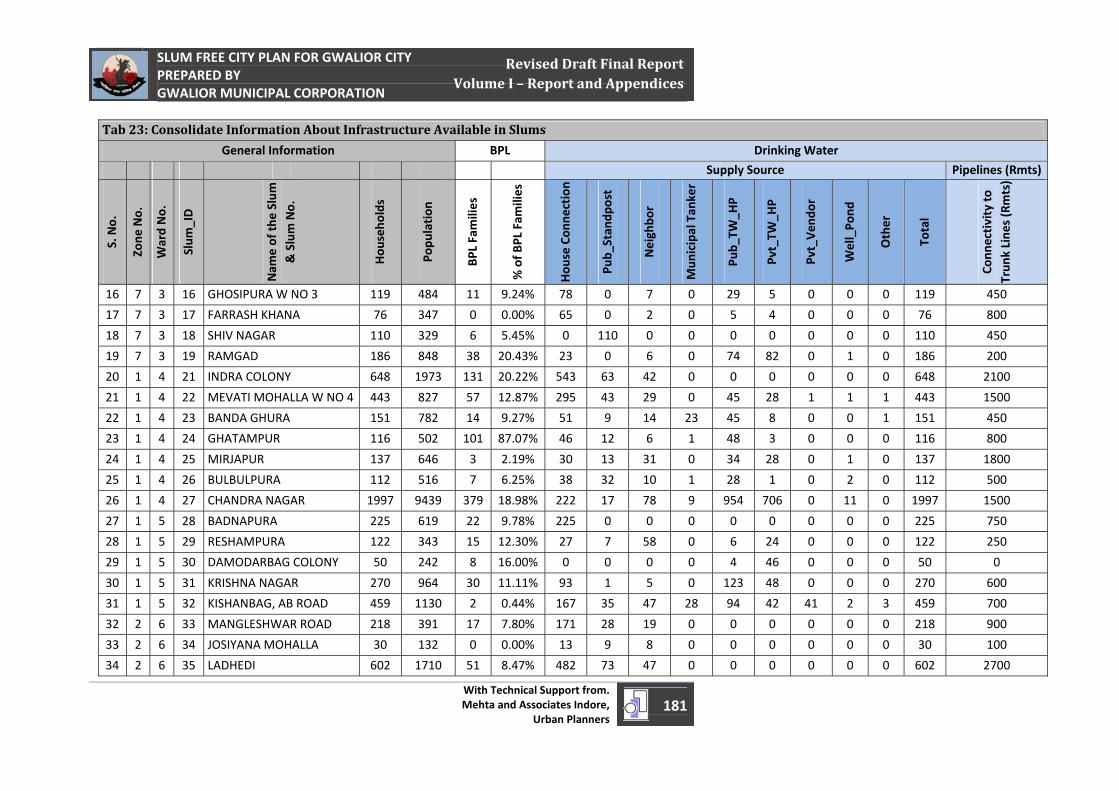
April 1, 2011
SLUM FREE CITY PLAN FOR GWALIOR CITY PREPARED BY GWALIOR MUNICIPAL CORPORATION
With Technical Support from. Mehta and Associates Indore,
Urban Planners181
Revised Draft Final Report Volume I – Report and Appendices
Tab 23: Consolidate Information About Infrastructure Available in Slums
General Information BPL Drinking Water
Supply Source Pipelines (Rmts)
S. No.
Zone
No.
Ward No.
Slum
_ID
Nam
e of th
e Slum
& Slum No.
Hou
seho
lds
Popu
lation
BPL Families
% of B
PL Fam
ilies
Hou
se Con
nection
Pub_
Stan
dpost
Neighbo
r
Mun
icipal Tan
ker
Pub_
TW_H
P
Pvt_TW
_HP
Pvt_Ven
dor
Well_Po
nd
Other
Total
Conn
ectivity to
Trun
k Line
s (Rmts)
16 7 3 16 GHOSIPURA W NO 3 119 484 11 9.24% 78 0 7 0 29 5 0 0 0 119 450
17 7 3 17 FARRASH KHANA 76 347 0 0.00% 65 0 2 0 5 4 0 0 0 76 800
18 7 3 18 SHIV NAGAR 110 329 6 5.45% 0 110 0 0 0 0 0 0 0 110 450
19 7 3 19 RAMGAD 186 848 38 20.43% 23 0 6 0 74 82 0 1 0 186 200
20 1 4 21 INDRA COLONY 648 1973 131 20.22% 543 63 42 0 0 0 0 0 0 648 2100
21 1 4 22 MEVATI MOHALLA W NO 4 443 827 57 12.87% 295 43 29 0 45 28 1 1 1 443 1500
22 1 4 23 BANDA GHURA 151 782 14 9.27% 51 9 14 23 45 8 0 0 1 151 450
23 1 4 24 GHATAMPUR 116 502 101 87.07% 46 12 6 1 48 3 0 0 0 116 800
24 1 4 25 MIRJAPUR 137 646 3 2.19% 30 13 31 0 34 28 0 1 0 137 1800
25 1 4 26 BULBULPURA 112 516 7 6.25% 38 32 10 1 28 1 0 2 0 112 500
26 1 4 27 CHANDRA NAGAR 1997 9439 379 18.98% 222 17 78 9 954 706 0 11 0 1997 1500
27 1 5 28 BADNAPURA 225 619 22 9.78% 225 0 0 0 0 0 0 0 0 225 750
28 1 5 29 RESHAMPURA 122 343 15 12.30% 27 7 58 0 6 24 0 0 0 122 250
29 1 5 30 DAMODARBAG COLONY 50 242 8 16.00% 0 0 0 0 4 46 0 0 0 50 0
30 1 5 31 KRISHNA NAGAR 270 964 30 11.11% 93 1 5 0 123 48 0 0 0 270 600
31 1 5 32 KISHANBAG, AB ROAD 459 1130 2 0.44% 167 35 47 28 94 42 41 2 3 459 700
32 2 6 33 MANGLESHWAR ROAD 218 391 17 7.80% 171 28 19 0 0 0 0 0 0 218 900
33 2 6 34 JOSIYANA MOHALLA 30 132 0 0.00% 13 9 8 0 0 0 0 0 0 30 100
34 2 6 35 LADHEDI 602 1710 51 8.47% 482 73 47 0 0 0 0 0 0 602 2700

April 1, 2011
SLUM FREE CITY PLAN FOR GWALIOR CITY PREPARED BY GWALIOR MUNICIPAL CORPORATION
With Technical Support from. Mehta and Associates Indore,
Urban Planners182
Revised Draft Final Report Volume I – Report and Appendices
Tab 23: Consolidate Information About Infrastructure Available in Slums
General Information BPL Drinking Water
Supply Source Pipelines (Rmts)
S. No.
Zone
No.
Ward No.
Slum
_ID
Nam
e of th
e Slum
& Slum No.
Hou
seho
lds
Popu
lation
BPL Families
% of B
PL Fam
ilies
Hou
se Con
nection
Pub_
Stan
dpost
Neighbo
r
Mun
icipal Tan
ker
Pub_
TW_H
P
Pvt_TW
_HP
Pvt_Ven
dor
Well_Po
nd
Other
Total
Conn
ectivity to
Trun
k Line
s (Rmts)
35 2 6 36 MEVATI MOHALLA W NO 6 180 547 14 7.78% 147 20 13 0 0 0 0 0 0 180 900
36 2 6 37 HAVELI KA PICHWADA 285 690 26 9.12% 246 23 16 0 0 0 0 0 0 285 1600
37 2 6 38 JHANSIGANJ 96 484 10 10.42% 91 2 3 0 0 0 0 0 0 96 450
38 2 6 39 JHANGIR KATRA 192 584 50 26.04% 102 78 12 0 0 0 0 0 0 192 500
39 2 6 40 MACHHI ADDI 89 248 7 7.87% 63 16 10 0 0 0 0 0 0 89 1600
40 3 7 41 JAGNAPURA 53 212 0 0.00% 53 0 0 0 0 0 0 0 0 53 1850
41 3 7 42 INDRA NAGAR 1091 4569 279 25.57% 949 1 129 0 12 0 0 0 0 1091 2100
42 3 7 43 MADANPURA, MADAN KUI 104 399 7 6.73% 85 0 2 0 17 0 0 0 0 104 1100
43 3 7 44 LOOTPURA 494 1906 101 20.45% 447 0 15 0 12 0 0 1 19 494 600
44 3 7 45 SHARMA FARM NO 2 62 223 7 11.29% 8 0 0 0 37 17 0 0 0 62 0
45 3 7 46 SHARMA FARM NO 3 56 184 34 60.71% 26 2 0 0 28 0 0 0 0 56 0
46 3 8 47 CHODE KE HANUMAN 930 2964 50 5.38% 727 31 39 0 131 2 0 0 0 930 1400
47 3 8 48 NARSINGH NAGAR 478 1478 42 8.79% 477 0 0 0 1 0 0 0 0 478 1200
48 3 8 49 SHARMA FARM NO 1 58 176 0 0.00% 30 0 0 0 28 0 0 0 0 58 150
49 2 9 50 RANIPURA 324 1223 47 14.51% 288 11 22 0 1 2 0 0 0 324 1200
50 2 9 51 RANGIYANA MOHALLA 304 1272 54 17.76% 252 40 12 0 0 0 0 0 0 304 1200
51 2 9 52 POSTHIKHANA 161 518 0 0.00% 14 0 0 0 147 0 0 0 0 161 600
52 2 9 53 GOLPADE 347 1014 169 48.70% 326 21 0 0 0 0 0 0 0 347 450
53 2 9 54 RAJA KI MANDI 304 902 178 58.55% 174 77 53 0 0 0 0 0 0 304 2800
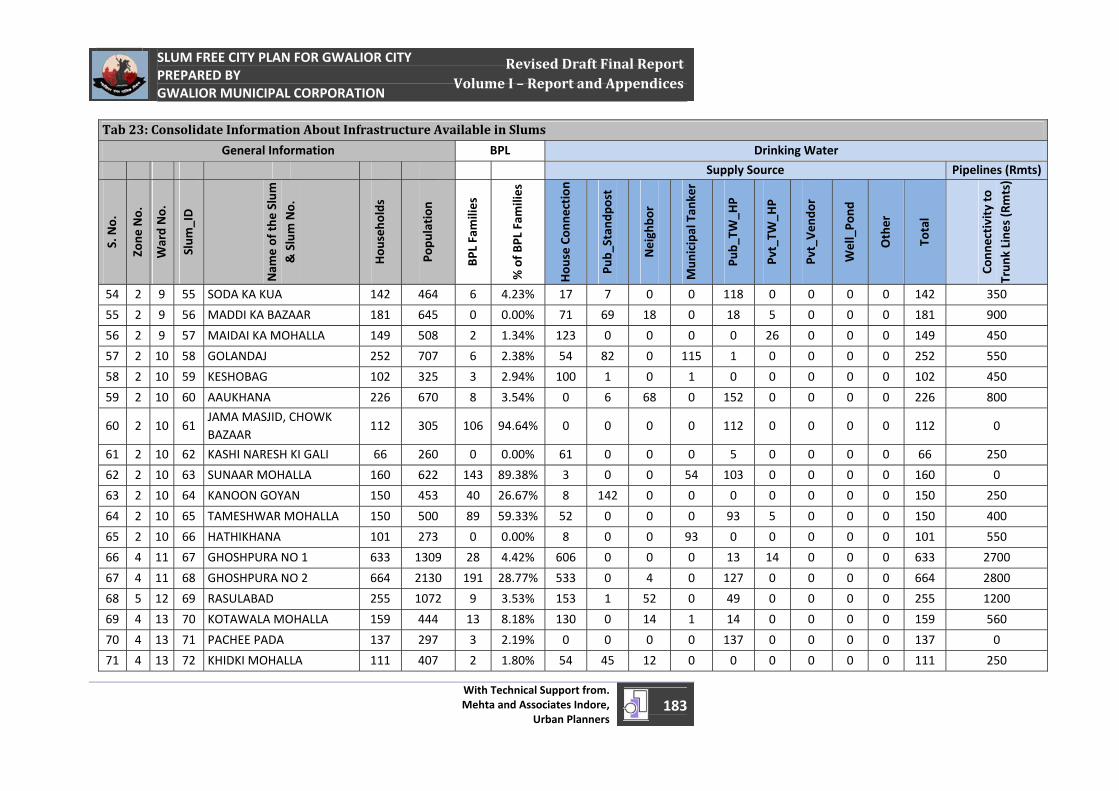
April 1, 2011
SLUM FREE CITY PLAN FOR GWALIOR CITY PREPARED BY GWALIOR MUNICIPAL CORPORATION
With Technical Support from. Mehta and Associates Indore,
Urban Planners183
Revised Draft Final Report Volume I – Report and Appendices
Tab 23: Consolidate Information About Infrastructure Available in Slums
General Information BPL Drinking Water
Supply Source Pipelines (Rmts)
S. No.
Zone
No.
Ward No.
Slum
_ID
Nam
e of th
e Slum
& Slum No.
Hou
seho
lds
Popu
lation
BPL Families
% of B
PL Fam
ilies
Hou
se Con
nection
Pub_
Stan
dpost
Neighbo
r
Mun
icipal Tan
ker
Pub_
TW_H
P
Pvt_TW
_HP
Pvt_Ven
dor
Well_Po
nd
Other
Total
Conn
ectivity to
Trun
k Line
s (Rmts)
54 2 9 55 SODA KA KUA 142 464 6 4.23% 17 7 0 0 118 0 0 0 0 142 350
55 2 9 56 MADDI KA BAZAAR 181 645 0 0.00% 71 69 18 0 18 5 0 0 0 181 900
56 2 9 57 MAIDAI KA MOHALLA 149 508 2 1.34% 123 0 0 0 0 26 0 0 0 149 450
57 2 10 58 GOLANDAJ 252 707 6 2.38% 54 82 0 115 1 0 0 0 0 252 550
58 2 10 59 KESHOBAG 102 325 3 2.94% 100 1 0 1 0 0 0 0 0 102 450
59 2 10 60 AAUKHANA 226 670 8 3.54% 0 6 68 0 152 0 0 0 0 226 800
60 2 10 61 JAMA MASJID, CHOWK BAZAAR
112 305 106 94.64% 0 0 0 0 112 0 0 0 0 112 0
61 2 10 62 KASHI NARESH KI GALI 66 260 0 0.00% 61 0 0 0 5 0 0 0 0 66 250
62 2 10 63 SUNAAR MOHALLA 160 622 143 89.38% 3 0 0 54 103 0 0 0 0 160 0
63 2 10 64 KANOON GOYAN 150 453 40 26.67% 8 142 0 0 0 0 0 0 0 150 250
64 2 10 65 TAMESHWAR MOHALLA 150 500 89 59.33% 52 0 0 0 93 5 0 0 0 150 400
65 2 10 66 HATHIKHANA 101 273 0 0.00% 8 0 0 93 0 0 0 0 0 101 550
66 4 11 67 GHOSHPURA NO 1 633 1309 28 4.42% 606 0 0 0 13 14 0 0 0 633 2700
67 4 11 68 GHOSHPURA NO 2 664 2130 191 28.77% 533 0 4 0 127 0 0 0 0 664 2800
68 5 12 69 RASULABAD 255 1072 9 3.53% 153 1 52 0 49 0 0 0 0 255 1200
69 4 13 70 KOTAWALA MOHALLA 159 444 13 8.18% 130 0 14 1 14 0 0 0 0 159 560
70 4 13 71 PACHEE PADA 137 297 3 2.19% 0 0 0 0 137 0 0 0 0 137 0
71 4 13 72 KHIDKI MOHALLA 111 407 2 1.80% 54 45 12 0 0 0 0 0 0 111 250
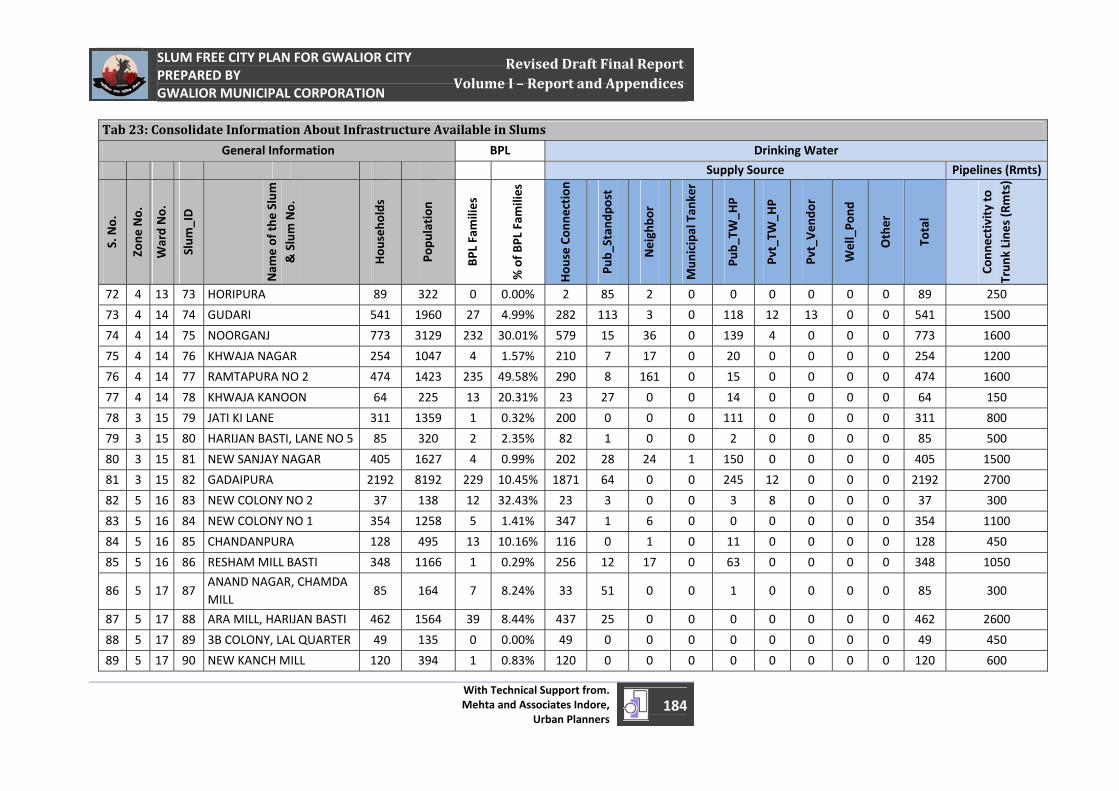
April 1, 2011
SLUM FREE CITY PLAN FOR GWALIOR CITY PREPARED BY GWALIOR MUNICIPAL CORPORATION
With Technical Support from. Mehta and Associates Indore,
Urban Planners184
Revised Draft Final Report Volume I – Report and Appendices
Tab 23: Consolidate Information About Infrastructure Available in Slums
General Information BPL Drinking Water
Supply Source Pipelines (Rmts)
S. No.
Zone
No.
Ward No.
Slum
_ID
Nam
e of th
e Slum
& Slum No.
Hou
seho
lds
Popu
lation
BPL Families
% of B
PL Fam
ilies
Hou
se Con
nection
Pub_
Stan
dpost
Neighbo
r
Mun
icipal Tan
ker
Pub_
TW_H
P
Pvt_TW
_HP
Pvt_Ven
dor
Well_Po
nd
Other
Total
Conn
ectivity to
Trun
k Line
s (Rmts)
72 4 13 73 HORIPURA 89 322 0 0.00% 2 85 2 0 0 0 0 0 0 89 250
73 4 14 74 GUDARI 541 1960 27 4.99% 282 113 3 0 118 12 13 0 0 541 1500
74 4 14 75 NOORGANJ 773 3129 232 30.01% 579 15 36 0 139 4 0 0 0 773 1600
75 4 14 76 KHWAJA NAGAR 254 1047 4 1.57% 210 7 17 0 20 0 0 0 0 254 1200
76 4 14 77 RAMTAPURA NO 2 474 1423 235 49.58% 290 8 161 0 15 0 0 0 0 474 1600
77 4 14 78 KHWAJA KANOON 64 225 13 20.31% 23 27 0 0 14 0 0 0 0 64 150
78 3 15 79 JATI KI LANE 311 1359 1 0.32% 200 0 0 0 111 0 0 0 0 311 800
79 3 15 80 HARIJAN BASTI, LANE NO 5 85 320 2 2.35% 82 1 0 0 2 0 0 0 0 85 500
80 3 15 81 NEW SANJAY NAGAR 405 1627 4 0.99% 202 28 24 1 150 0 0 0 0 405 1500
81 3 15 82 GADAIPURA 2192 8192 229 10.45% 1871 64 0 0 245 12 0 0 0 2192 2700
82 5 16 83 NEW COLONY NO 2 37 138 12 32.43% 23 3 0 0 3 8 0 0 0 37 300
83 5 16 84 NEW COLONY NO 1 354 1258 5 1.41% 347 1 6 0 0 0 0 0 0 354 1100
84 5 16 85 CHANDANPURA 128 495 13 10.16% 116 0 1 0 11 0 0 0 0 128 450
85 5 16 86 RESHAM MILL BASTI 348 1166 1 0.29% 256 12 17 0 63 0 0 0 0 348 1050
86 5 17 87 ANAND NAGAR, CHAMDA MILL
85 164 7 8.24% 33 51 0 0 1 0 0 0 0 85 300
87 5 17 88 ARA MILL, HARIJAN BASTI 462 1564 39 8.44% 437 25 0 0 0 0 0 0 0 462 2600
88 5 17 89 3B COLONY, LAL QUARTER 49 135 0 0.00% 49 0 0 0 0 0 0 0 0 49 450
89 5 17 90 NEW KANCH MILL 120 394 1 0.83% 120 0 0 0 0 0 0 0 0 120 600
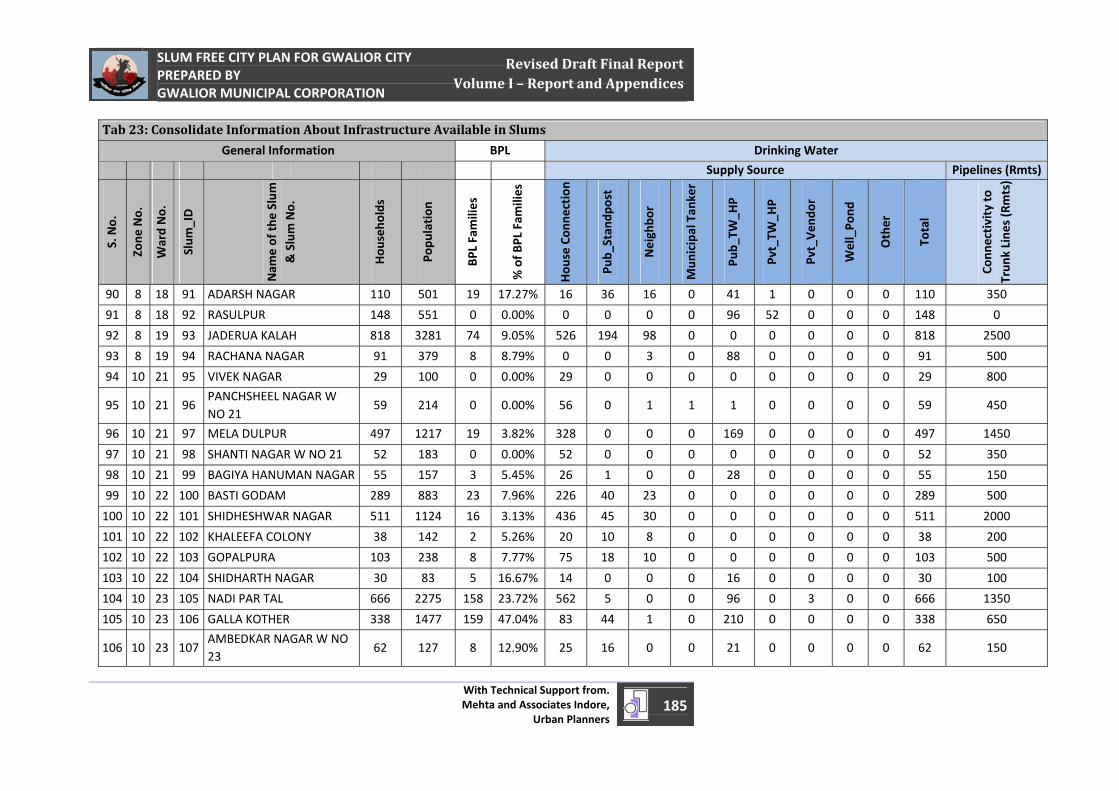
April 1, 2011
SLUM FREE CITY PLAN FOR GWALIOR CITY PREPARED BY GWALIOR MUNICIPAL CORPORATION
With Technical Support from. Mehta and Associates Indore,
Urban Planners185
Revised Draft Final Report Volume I – Report and Appendices
Tab 23: Consolidate Information About Infrastructure Available in Slums
General Information BPL Drinking Water
Supply Source Pipelines (Rmts)
S. No.
Zone
No.
Ward No.
Slum
_ID
Nam
e of th
e Slum
& Slum No.
Hou
seho
lds
Popu
lation
BPL Families
% of B
PL Fam
ilies
Hou
se Con
nection
Pub_
Stan
dpost
Neighbo
r
Mun
icipal Tan
ker
Pub_
TW_H
P
Pvt_TW
_HP
Pvt_Ven
dor
Well_Po
nd
Other
Total
Conn
ectivity to
Trun
k Line
s (Rmts)
90 8 18 91 ADARSH NAGAR 110 501 19 17.27% 16 36 16 0 41 1 0 0 0 110 350
91 8 18 92 RASULPUR 148 551 0 0.00% 0 0 0 0 96 52 0 0 0 148 0
92 8 19 93 JADERUA KALAH 818 3281 74 9.05% 526 194 98 0 0 0 0 0 0 818 2500
93 8 19 94 RACHANA NAGAR 91 379 8 8.79% 0 0 3 0 88 0 0 0 0 91 500
94 10 21 95 VIVEK NAGAR 29 100 0 0.00% 29 0 0 0 0 0 0 0 0 29 800
95 10 21 96 PANCHSHEEL NAGAR W NO 21
59 214 0 0.00% 56 0 1 1 1 0 0 0 0 59 450
96 10 21 97 MELA DULPUR 497 1217 19 3.82% 328 0 0 0 169 0 0 0 0 497 1450
97 10 21 98 SHANTI NAGAR W NO 21 52 183 0 0.00% 52 0 0 0 0 0 0 0 0 52 350
98 10 21 99 BAGIYA HANUMAN NAGAR 55 157 3 5.45% 26 1 0 0 28 0 0 0 0 55 150
99 10 22 100 BASTI GODAM 289 883 23 7.96% 226 40 23 0 0 0 0 0 0 289 500
100 10 22 101 SHIDHESHWAR NAGAR 511 1124 16 3.13% 436 45 30 0 0 0 0 0 0 511 2000
101 10 22 102 KHALEEFA COLONY 38 142 2 5.26% 20 10 8 0 0 0 0 0 0 38 200
102 10 22 103 GOPALPURA 103 238 8 7.77% 75 18 10 0 0 0 0 0 0 103 500
103 10 22 104 SHIDHARTH NAGAR 30 83 5 16.67% 14 0 0 0 16 0 0 0 0 30 100
104 10 23 105 NADI PAR TAL 666 2275 158 23.72% 562 5 0 0 96 0 3 0 0 666 1350
105 10 23 106 GALLA KOTHER 338 1477 159 47.04% 83 44 1 0 210 0 0 0 0 338 650
106 10 23 107AMBEDKAR NAGAR W NO 23
62 127 8 12.90% 25 16 0 0 21 0 0 0 0 62 150

April 1, 2011
SLUM FREE CITY PLAN FOR GWALIOR CITY PREPARED BY GWALIOR MUNICIPAL CORPORATION
With Technical Support from. Mehta and Associates Indore,
Urban Planners186
Revised Draft Final Report Volume I – Report and Appendices
Tab 23: Consolidate Information About Infrastructure Available in Slums
General Information BPL Drinking Water
Supply Source Pipelines (Rmts)
S. No.
Zone
No.
Ward No.
Slum
_ID
Nam
e of th
e Slum
& Slum No.
Hou
seho
lds
Popu
lation
BPL Families
% of B
PL Fam
ilies
Hou
se Con
nection
Pub_
Stan
dpost
Neighbo
r
Mun
icipal Tan
ker
Pub_
TW_H
P
Pvt_TW
_HP
Pvt_Ven
dor
Well_Po
nd
Other
Total
Conn
ectivity to
Trun
k Line
s (Rmts)
107 10 23 108 SHRI NAGAR COLONY 303 1029 94 31.02% 267 0 12 0 24 0 0 0 0 303 1700
108 10 23 109HARIJAN BASTI, SHAMSHAN GHAT
35 162 2 5.71% 33 0 0 0 2 0 0 0 0 35 700
109 8 25 110 LEATHER FACTORY 199 523 0 0.00% 199 0 0 0 0 0 0 0 0 199 650
110 8 25 111 SHITLA COLONY 39 172 0 0.00% 29 0 5 0 4 1 0 0 0 39 100
111 9 26 112 TIKONIYA 138 472 50 36.23% 78 50 10 0 0 0 0 0 0 138 700
112 9 26 113HARIJAN BASTI, GURUDWARA
275 742 9 3.27% 275 0 0 0 0 0 0 0 0 275 750
113 9 26 114KHATEEK MOHALLA W NO 26
118 550 0 0.00% 118 0 0 0 0 0 0 0 0 118 250
114 9 26 115 HANUMAN COLONY 100 356 0 0.00% 100 0 0 0 0 0 0 0 0 100 300
115 9 26 116 TYAGI NAGAR 451 1384 76 16.85% 396 44 0 0 0 11 0 0 0 451 750
116 9 26 117 PEETAL KARKHANA 149 485 1 0.67% 149 0 0 0 0 0 0 0 0 149 325
117 9 26 118 KACHERI PARUSRAM 51 159 0 0.00% 51 0 0 0 0 0 0 0 0 51 150
118 9 26 119 VINAY COLONY 123 460 0 0.00% 0 0 0 123 0 0 0 0 0 123 0
119 9 26 120 GHAS MANDI 82 286 81 98.78% 80 0 2 0 0 0 0 0 0 82 200
120 9 27 121 RAM NAGAR 176 750 3 1.70% 149 18 9 0 0 0 0 0 0 176 650
121 11 28 122 HARNAMPURA 401 1261 78 19.45% 350 0 0 0 51 0 0 0 0 401 1250
122 11 28 123 BHIM NAGAR 405 1336 144 35.56% 234 0 0 18 153 0 0 0 0 405 1400
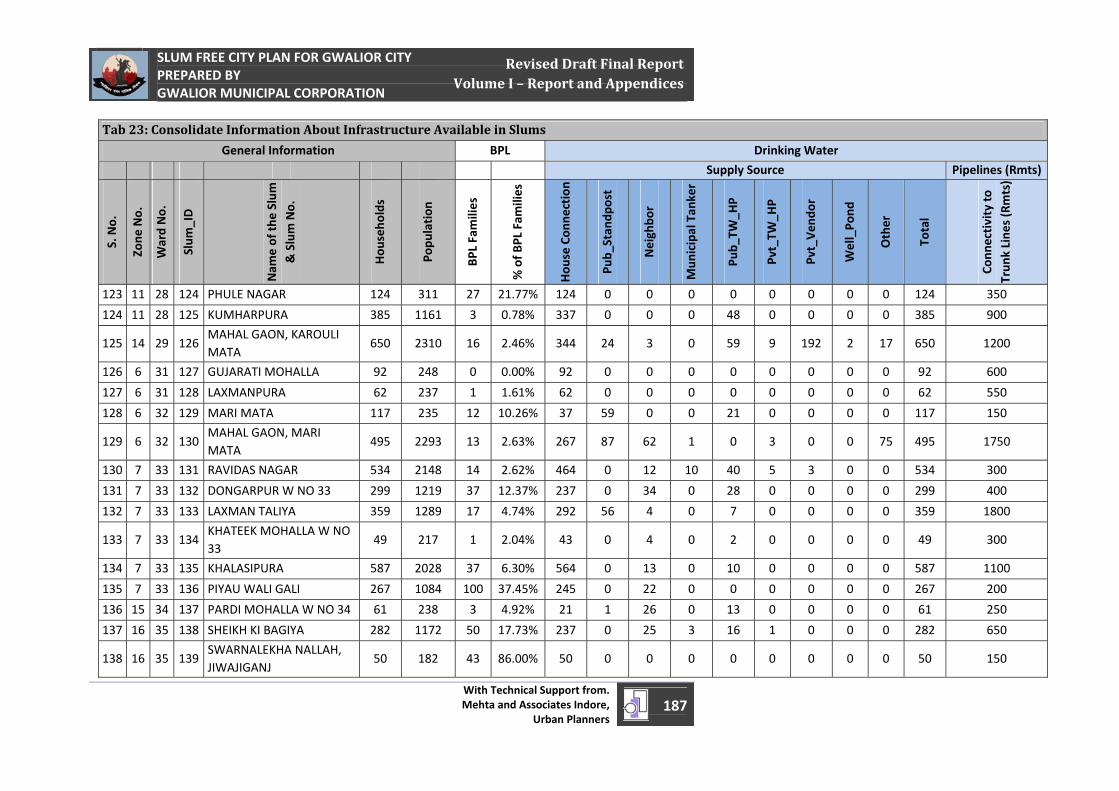
April 1, 2011
SLUM FREE CITY PLAN FOR GWALIOR CITY PREPARED BY GWALIOR MUNICIPAL CORPORATION
With Technical Support from. Mehta and Associates Indore,
Urban Planners187
Revised Draft Final Report Volume I – Report and Appendices
Tab 23: Consolidate Information About Infrastructure Available in Slums
General Information BPL Drinking Water
Supply Source Pipelines (Rmts)
S. No.
Zone
No.
Ward No.
Slum
_ID
Nam
e of th
e Slum
& Slum No.
Hou
seho
lds
Popu
lation
BPL Families
% of B
PL Fam
ilies
Hou
se Con
nection
Pub_
Stan
dpost
Neighbo
r
Mun
icipal Tan
ker
Pub_
TW_H
P
Pvt_TW
_HP
Pvt_Ven
dor
Well_Po
nd
Other
Total
Conn
ectivity to
Trun
k Line
s (Rmts)
123 11 28 124 PHULE NAGAR 124 311 27 21.77% 124 0 0 0 0 0 0 0 0 124 350
124 11 28 125 KUMHARPURA 385 1161 3 0.78% 337 0 0 0 48 0 0 0 0 385 900
125 14 29 126MAHAL GAON, KAROULI MATA
650 2310 16 2.46% 344 24 3 0 59 9 192 2 17 650 1200
126 6 31 127 GUJARATI MOHALLA 92 248 0 0.00% 92 0 0 0 0 0 0 0 0 92 600
127 6 31 128 LAXMANPURA 62 237 1 1.61% 62 0 0 0 0 0 0 0 0 62 550
128 6 32 129 MARI MATA 117 235 12 10.26% 37 59 0 0 21 0 0 0 0 117 150
129 6 32 130MAHAL GAON, MARI MATA
495 2293 13 2.63% 267 87 62 1 0 3 0 0 75 495 1750
130 7 33 131 RAVIDAS NAGAR 534 2148 14 2.62% 464 0 12 10 40 5 3 0 0 534 300
131 7 33 132 DONGARPUR W NO 33 299 1219 37 12.37% 237 0 34 0 28 0 0 0 0 299 400
132 7 33 133 LAXMAN TALIYA 359 1289 17 4.74% 292 56 4 0 7 0 0 0 0 359 1800
133 7 33 134KHATEEK MOHALLA W NO 33
49 217 1 2.04% 43 0 4 0 2 0 0 0 0 49 300
134 7 33 135 KHALASIPURA 587 2028 37 6.30% 564 0 13 0 10 0 0 0 0 587 1100
135 7 33 136 PIYAU WALI GALI 267 1084 100 37.45% 245 0 22 0 0 0 0 0 0 267 200
136 15 34 137 PARDI MOHALLA W NO 34 61 238 3 4.92% 21 1 26 0 13 0 0 0 0 61 250
137 16 35 138 SHEIKH KI BAGIYA 282 1172 50 17.73% 237 0 25 3 16 1 0 0 0 282 650
138 16 35 139SWARNALEKHA NALLAH, JIWAJIGANJ
50 182 43 86.00% 50 0 0 0 0 0 0 0 0 50 150

April 1, 2011
SLUM FREE CITY PLAN FOR GWALIOR CITY PREPARED BY GWALIOR MUNICIPAL CORPORATION
With Technical Support from. Mehta and Associates Indore,
Urban Planners188
Revised Draft Final Report Volume I – Report and Appendices
Tab 23: Consolidate Information About Infrastructure Available in Slums
General Information BPL Drinking Water
Supply Source Pipelines (Rmts)
S. No.
Zone
No.
Ward No.
Slum
_ID
Nam
e of th
e Slum
& Slum No.
Hou
seho
lds
Popu
lation
BPL Families
% of B
PL Fam
ilies
Hou
se Con
nection
Pub_
Stan
dpost
Neighbo
r
Mun
icipal Tan
ker
Pub_
TW_H
P
Pvt_TW
_HP
Pvt_Ven
dor
Well_Po
nd
Other
Total
Conn
ectivity to
Trun
k Line
s (Rmts)
139 16 35 140 SUBEY KI GOTH 374 1236 18 4.81% 314 32 14 7 6 0 0 0 1 374 900
140 16 35 141SHANTI NAGAR, NAI SADAK
112 400 15 13.39% 109 0 3 0 0 0 0 0 0 112 500
141 16 35 142 RASSI WALA MOHALLA 107 409 8 7.48% 107 0 0 0 0 0 0 0 0 107 450
142 16 35 143 DALIYA WALA MOHALLA 50 158 0 0.00% 50 0 0 0 0 0 0 0 0 50 225
143 16 35 144GANJ WALA MOHALLA W NO 35
53 182 23 43.40% 48 0 1 1 3 0 0 0 0 53 250
144 7 36 145 DHOBI GHAT NO 2 135 400 6 4.44% 68 0 26 0 40 1 0 0 0 135 900
145 7 36 146 DHOBI GHAT NO 1 255 673 13 5.10% 255 0 0 0 0 0 0 0 0 255 1400
146 7 36 147 BAKRA MANDI 54 268 0 0.00% 40 0 11 0 3 0 0 0 0 54 150
147 7 36 148 SATYA NARAYAN KI TEKARI 493 2064 26 5.27% 57 0 139 0 288 9 0 0 0 493 0
148 16 37 149 MADHO NAGAR 451 2607 94 20.84% 372 0 14 2 57 6 0 0 0 451 800
149 16 37 150 SANJAY NAGAR 102 472 3 2.94% 45 4 11 9 11 0 22 0 0 102 1000
150 16 37 151 NIMBAJI KI KHO 653 2739 34 5.21% 614 0 19 0 20 0 0 0 0 653 2000
151 16 37 152 NAYAPURA W NO 37 213 1035 25 11.74% 187 0 1 0 18 7 0 0 0 213 800
152 16 37 153 JAGRITI NAGAR 587 2513 36 6.13% 535 1 12 26 8 5 0 0 0 587 2000
153 16 37 154 TITURIYA COLONY 70 208 66 94.29% 44 16 10 0 0 0 0 0 0 70 50
154 16 37 155 SHANTI NAGAR W NO 37 191 819 13 6.81% 166 2 16 0 6 0 0 0 1 191 1500
155 16 37 156 AMAN KA PURA 32 112 2 6.25% 17 10 5 0 0 0 0 0 0 32 100
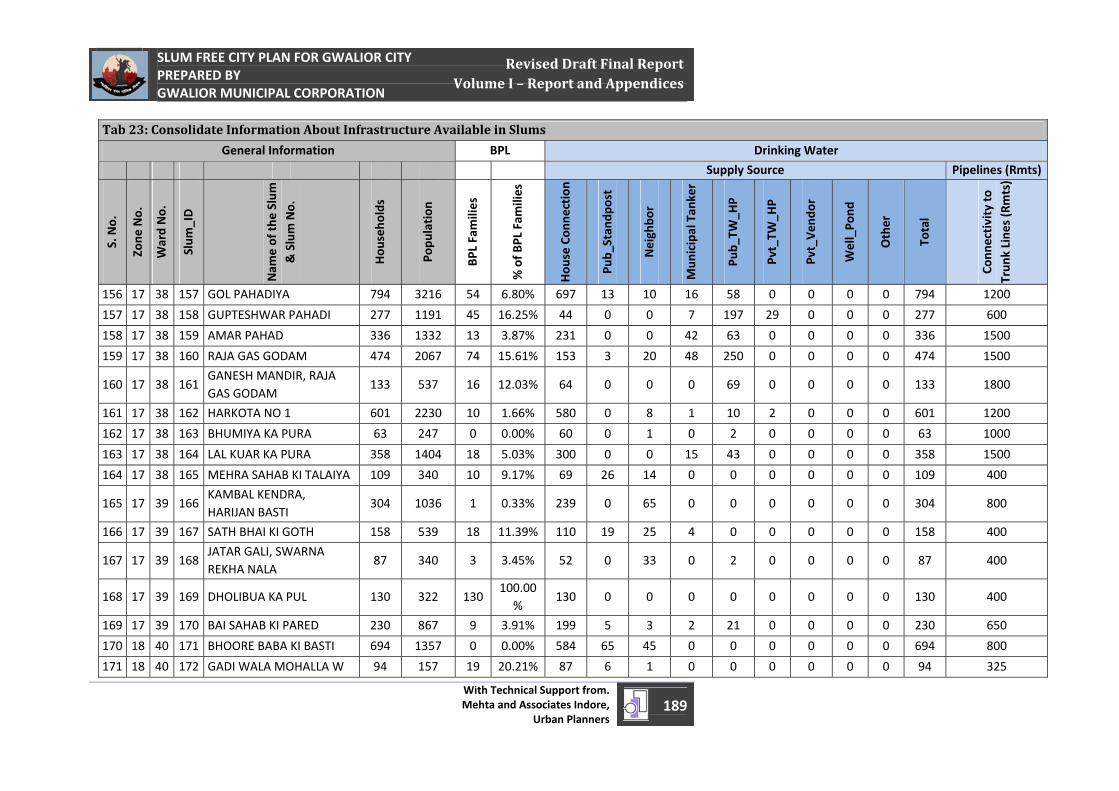
April 1, 2011
SLUM FREE CITY PLAN FOR GWALIOR CITY PREPARED BY GWALIOR MUNICIPAL CORPORATION
With Technical Support from. Mehta and Associates Indore,
Urban Planners189
Revised Draft Final Report Volume I – Report and Appendices
Tab 23: Consolidate Information About Infrastructure Available in Slums
General Information BPL Drinking Water
Supply Source Pipelines (Rmts)
S. No.
Zone
No.
Ward No.
Slum
_ID
Nam
e of th
e Slum
& Slum No.
Hou
seho
lds
Popu
lation
BPL Families
% of B
PL Fam
ilies
Hou
se Con
nection
Pub_
Stan
dpost
Neighbo
r
Mun
icipal Tan
ker
Pub_
TW_H
P
Pvt_TW
_HP
Pvt_Ven
dor
Well_Po
nd
Other
Total
Conn
ectivity to
Trun
k Line
s (Rmts)
156 17 38 157 GOL PAHADIYA 794 3216 54 6.80% 697 13 10 16 58 0 0 0 0 794 1200
157 17 38 158 GUPTESHWAR PAHADI 277 1191 45 16.25% 44 0 0 7 197 29 0 0 0 277 600
158 17 38 159 AMAR PAHAD 336 1332 13 3.87% 231 0 0 42 63 0 0 0 0 336 1500
159 17 38 160 RAJA GAS GODAM 474 2067 74 15.61% 153 3 20 48 250 0 0 0 0 474 1500
160 17 38 161GANESH MANDIR, RAJA GAS GODAM
133 537 16 12.03% 64 0 0 0 69 0 0 0 0 133 1800
161 17 38 162 HARKOTA NO 1 601 2230 10 1.66% 580 0 8 1 10 2 0 0 0 601 1200
162 17 38 163 BHUMIYA KA PURA 63 247 0 0.00% 60 0 1 0 2 0 0 0 0 63 1000
163 17 38 164 LAL KUAR KA PURA 358 1404 18 5.03% 300 0 0 15 43 0 0 0 0 358 1500
164 17 38 165 MEHRA SAHAB KI TALAIYA 109 340 10 9.17% 69 26 14 0 0 0 0 0 0 109 400
165 17 39 166KAMBAL KENDRA, HARIJAN BASTI
304 1036 1 0.33% 239 0 65 0 0 0 0 0 0 304 800
166 17 39 167 SATH BHAI KI GOTH 158 539 18 11.39% 110 19 25 4 0 0 0 0 0 158 400
167 17 39 168JATAR GALI, SWARNA REKHA NALA
87 340 3 3.45% 52 0 33 0 2 0 0 0 0 87 400
168 17 39 169 DHOLIBUA KA PUL 130 322 130 100.00
% 130 0 0 0 0 0 0 0 0 130 400
169 17 39 170 BAI SAHAB KI PARED 230 867 9 3.91% 199 5 3 2 21 0 0 0 0 230 650
170 18 40 171 BHOORE BABA KI BASTI 694 1357 0 0.00% 584 65 45 0 0 0 0 0 0 694 800
171 18 40 172 GADI WALA MOHALLA W 94 157 19 20.21% 87 6 1 0 0 0 0 0 0 94 325
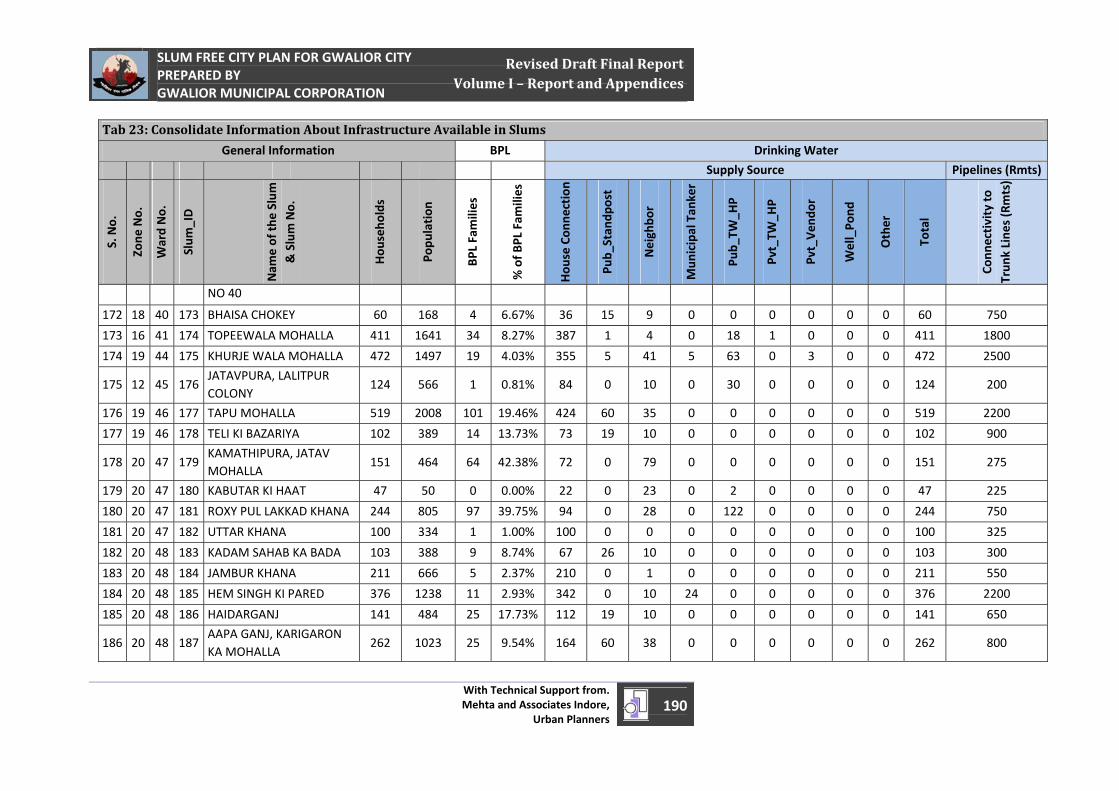
April 1, 2011
SLUM FREE CITY PLAN FOR GWALIOR CITY PREPARED BY GWALIOR MUNICIPAL CORPORATION
With Technical Support from. Mehta and Associates Indore,
Urban Planners190
Revised Draft Final Report Volume I – Report and Appendices
Tab 23: Consolidate Information About Infrastructure Available in Slums
General Information BPL Drinking Water
Supply Source Pipelines (Rmts)
S. No.
Zone
No.
Ward No.
Slum
_ID
Nam
e of th
e Slum
& Slum No.
Hou
seho
lds
Popu
lation
BPL Families
% of B
PL Fam
ilies
Hou
se Con
nection
Pub_
Stan
dpost
Neighbo
r
Mun
icipal Tan
ker
Pub_
TW_H
P
Pvt_TW
_HP
Pvt_Ven
dor
Well_Po
nd
Other
Total
Conn
ectivity to
Trun
k Line
s (Rmts)
NO 40
172 18 40 173 BHAISA CHOKEY 60 168 4 6.67% 36 15 9 0 0 0 0 0 0 60 750
173 16 41 174 TOPEEWALA MOHALLA 411 1641 34 8.27% 387 1 4 0 18 1 0 0 0 411 1800
174 19 44 175 KHURJE WALA MOHALLA 472 1497 19 4.03% 355 5 41 5 63 0 3 0 0 472 2500
175 12 45 176JATAVPURA, LALITPUR COLONY
124 566 1 0.81% 84 0 10 0 30 0 0 0 0 124 200
176 19 46 177 TAPU MOHALLA 519 2008 101 19.46% 424 60 35 0 0 0 0 0 0 519 2200
177 19 46 178 TELI KI BAZARIYA 102 389 14 13.73% 73 19 10 0 0 0 0 0 0 102 900
178 20 47 179KAMATHIPURA, JATAV MOHALLA
151 464 64 42.38% 72 0 79 0 0 0 0 0 0 151 275
179 20 47 180 KABUTAR KI HAAT 47 50 0 0.00% 22 0 23 0 2 0 0 0 0 47 225
180 20 47 181 ROXY PUL LAKKAD KHANA 244 805 97 39.75% 94 0 28 0 122 0 0 0 0 244 750
181 20 47 182 UTTAR KHANA 100 334 1 1.00% 100 0 0 0 0 0 0 0 0 100 325
182 20 48 183 KADAM SAHAB KA BADA 103 388 9 8.74% 67 26 10 0 0 0 0 0 0 103 300
183 20 48 184 JAMBUR KHANA 211 666 5 2.37% 210 0 1 0 0 0 0 0 0 211 550
184 20 48 185 HEM SINGH KI PARED 376 1238 11 2.93% 342 0 10 24 0 0 0 0 0 376 2200
185 20 48 186 HAIDARGANJ 141 484 25 17.73% 112 19 10 0 0 0 0 0 0 141 650
186 20 48 187AAPA GANJ, KARIGARON KA MOHALLA
262 1023 25 9.54% 164 60 38 0 0 0 0 0 0 262 800

April 1, 2011
SLUM FREE CITY PLAN FOR GWALIOR CITY PREPARED BY GWALIOR MUNICIPAL CORPORATION
With Technical Support from. Mehta and Associates Indore,
Urban Planners191
Revised Draft Final Report Volume I – Report and Appendices
Tab 23: Consolidate Information About Infrastructure Available in Slums
General Information BPL Drinking Water
Supply Source Pipelines (Rmts)
S. No.
Zone
No.
Ward No.
Slum
_ID
Nam
e of th
e Slum
& Slum No.
Hou
seho
lds
Popu
lation
BPL Families
% of B
PL Fam
ilies
Hou
se Con
nection
Pub_
Stan
dpost
Neighbo
r
Mun
icipal Tan
ker
Pub_
TW_H
P
Pvt_TW
_HP
Pvt_Ven
dor
Well_Po
nd
Other
Total
Conn
ectivity to
Trun
k Line
s (Rmts)
187 17 49 188 HARI ANNA KA PAYGA 236 805 17 7.20% 160 64 12 0 0 0 0 0 0 236 1400
188 17 49 189 BANJARSHAH KA NALLAH 119 410 115 96.64% 103 1 5 0 10 0 0 0 0 119 1800
189 17 49 190 KALA SAIYYED 244 974 17 6.97% 161 54 29 0 0 0 0 0 0 244 1250
190 17 49 191 NAYAPURA W NO 49 197 785 17 8.63% 24 0 0 0 70 102 1 0 0 197 0
191 20 51 192 IMLI NAKA 245 679 10 4.08% 29 26 0 0 190 0 0 0 0 245 900
192 20 51 193 JATAV MOHALLA 110 277 0 0.00% 1 38 1 70 0 0 0 0 0 110 0
193 20 51 194 SIKANDAR KAMPU 381 1217 108 28.35% 360 0 17 3 0 1 0 0 0 381 900
194 20 51 195AAPA GANJ, HAATHI KHANA
360 1467 163 45.28% 92 54 32 174 7 0 0 0 1 360 800
195 21 52 196 GUDDI NAKA 83 397 3 3.61% 0 0 0 5 0 78 0 0 0 83 0
196 21 52 197PAYGA, GUDDI GUDDA KA NAKA
226 794 213 94.25% 178 27 21 0 0 0 0 0 0 226 600
197 21 52 198 NADARIYA WALI MATA 574 1287 541 94.25% 448 80 46 0 0 0 0 0 0 574 1000
198 21 52 199 GUDDI UPAR 456 1372 28 6.14% 268 117 71 0 0 0 0 0 0 456 1500
199 21 52 200 BELLGAIYA KA PURA 74 283 7 9.46% 45 19 10 0 0 0 0 0 0 74 550
200 20 53 201 LAKKAD KHANA 70 234 34 48.57% 69 0 0 1 0 0 0 0 0 70 250
201 20 53 202 MUNSHIYON KA MOHALLA 113 493 3 2.65% 70 0 14 0 29 0 0 0 0 113 100
202 20 53 203 DEV NAGAR 128 557 25 19.53% 117 0 0 10 1 0 0 0 0 128 160
203 20 53 204 KARWARI MOHALLA 111 456 52 46.85% 22 0 1 75 0 9 0 0 4 111 1000

April 1, 2011
SLUM FREE CITY PLAN FOR GWALIOR CITY PREPARED BY GWALIOR MUNICIPAL CORPORATION
With Technical Support from. Mehta and Associates Indore,
Urban Planners192
Revised Draft Final Report Volume I – Report and Appendices
Tab 23: Consolidate Information About Infrastructure Available in Slums
General Information BPL Drinking Water
Supply Source Pipelines (Rmts)
S. No.
Zone
No.
Ward No.
Slum
_ID
Nam
e of th
e Slum
& Slum No.
Hou
seho
lds
Popu
lation
BPL Families
% of B
PL Fam
ilies
Hou
se Con
nection
Pub_
Stan
dpost
Neighbo
r
Mun
icipal Tan
ker
Pub_
TW_H
P
Pvt_TW
_HP
Pvt_Ven
dor
Well_Po
nd
Other
Total
Conn
ectivity to
Trun
k Line
s (Rmts)
204 20 53 205 NAYAPURA W NO 53 87 386 47 54.02% 8 0 0 31 3 26 19 0 0 87 700
205 20 53 206 INGALE KI GOTH 87 205 4 4.60% 69 0 17 1 0 0 0 0 0 87 250
206 20 53 207GANJI WALA MOHALLA W NO 53
147 380 32 21.77% 88 0 13 0 41 1 0 3 1 147 350
207 20 53 208 PAN PATTE KI GOTH 240 931 36 15.00% 144 0 25 0 68 3 0 0 0 240 650
208 20 53 209 RISHI NAGAR 43 217 8 18.60% 38 1 0 0 3 0 1 0 0 43 130
209 20 53 210 SURYA NAGAR 31 145 5 16.13% 31 0 0 0 0 0 0 0 0 31 150
210 21 54 211HARIJAN BASTI, JAWAHAR COLONY
80 361 2 2.50% 23 0 3 50 1 3 0 0 0 80 1200
211 21 54 212 ARMY KI BAJARIYA 149 679 29 19.46% 71 0 13 44 20 1 0 0 0 149 600
212 21 54 213 CHANA KOTHAR 97 402 11 11.34% 6 0 2 35 47 7 0 0 0 97 800
213 21 55 214 AWADHPURA 1571 6131 98 6.24% 157 96 28 1190 14 34 52 0 0 1571 3500
214 21 55 215 KHAJANCHI BABA 829 3269 4 0.48% 17 4 3 800 0 0 5 0 0 829 1800
215 12 56 216 MUDHIYA PAHAD 865 3522 22 2.54% 856 1 4 1 3 0 0 0 0 865 1200
216 12 56 217GADDE WALA MOHALLA W NO 56
141 749 2 1.42% 133 2 0 0 6 0 0 0 0 141 750
217 12 56 218 PARDI MOHALLA W NO 56 225 654 31 13.78% 107 0 0 0 118 0 0 0 0 225 600
218 13 58 219 GANJI KHO GALI NO 1 37 143 0 0.00% 37 0 0 0 0 0 0 0 0 37 150
219 12 56 220 LABHEDPURA 196 791 1 0.51% 125 0 11 0 58 2 0 0 0 196 400
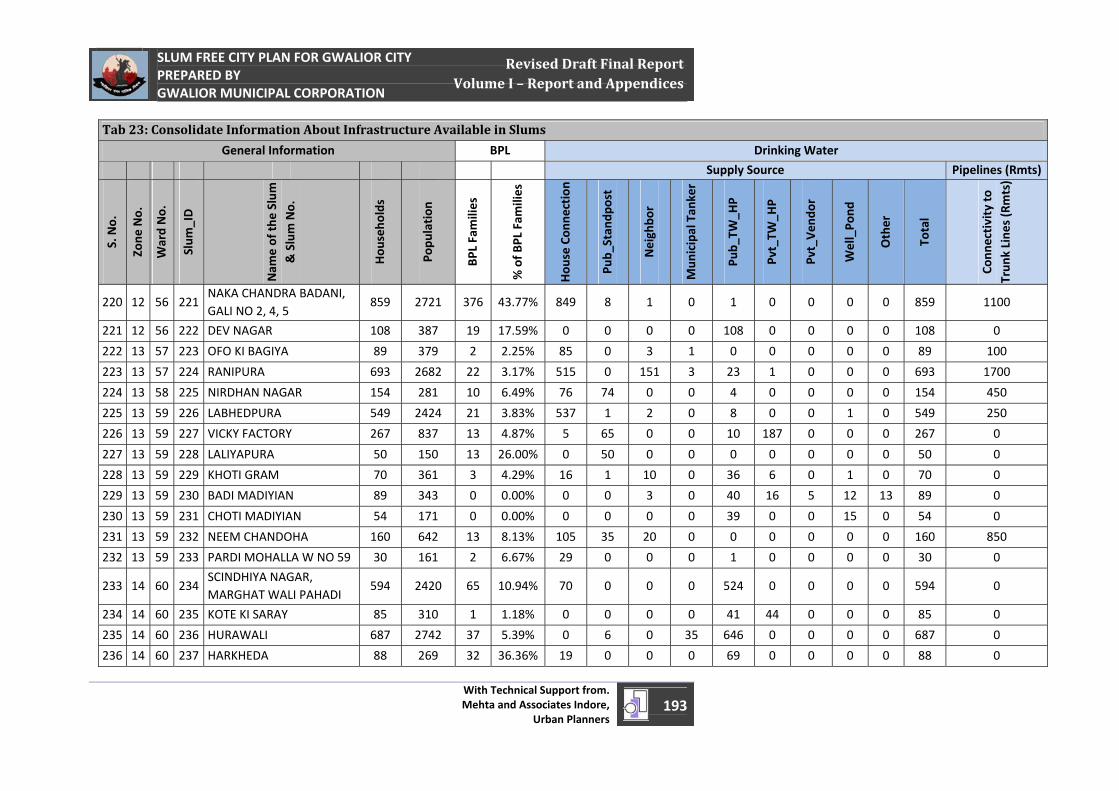
April 1, 2011
SLUM FREE CITY PLAN FOR GWALIOR CITY PREPARED BY GWALIOR MUNICIPAL CORPORATION
With Technical Support from. Mehta and Associates Indore,
Urban Planners193
Revised Draft Final Report Volume I – Report and Appendices
Tab 23: Consolidate Information About Infrastructure Available in Slums
General Information BPL Drinking Water
Supply Source Pipelines (Rmts)
S. No.
Zone
No.
Ward No.
Slum
_ID
Nam
e of th
e Slum
& Slum No.
Hou
seho
lds
Popu
lation
BPL Families
% of B
PL Fam
ilies
Hou
se Con
nection
Pub_
Stan
dpost
Neighbo
r
Mun
icipal Tan
ker
Pub_
TW_H
P
Pvt_TW
_HP
Pvt_Ven
dor
Well_Po
nd
Other
Total
Conn
ectivity to
Trun
k Line
s (Rmts)
220 12 56 221NAKA CHANDRA BADANI, GALI NO 2, 4, 5
859 2721 376 43.77% 849 8 1 0 1 0 0 0 0 859 1100
221 12 56 222 DEV NAGAR 108 387 19 17.59% 0 0 0 0 108 0 0 0 0 108 0
222 13 57 223 OFO KI BAGIYA 89 379 2 2.25% 85 0 3 1 0 0 0 0 0 89 100
223 13 57 224 RANIPURA 693 2682 22 3.17% 515 0 151 3 23 1 0 0 0 693 1700
224 13 58 225 NIRDHAN NAGAR 154 281 10 6.49% 76 74 0 0 4 0 0 0 0 154 450
225 13 59 226 LABHEDPURA 549 2424 21 3.83% 537 1 2 0 8 0 0 1 0 549 250
226 13 59 227 VICKY FACTORY 267 837 13 4.87% 5 65 0 0 10 187 0 0 0 267 0
227 13 59 228 LALIYAPURA 50 150 13 26.00% 0 50 0 0 0 0 0 0 0 50 0
228 13 59 229 KHOTI GRAM 70 361 3 4.29% 16 1 10 0 36 6 0 1 0 70 0
229 13 59 230 BADI MADIYIAN 89 343 0 0.00% 0 0 3 0 40 16 5 12 13 89 0
230 13 59 231 CHOTI MADIYIAN 54 171 0 0.00% 0 0 0 0 39 0 0 15 0 54 0
231 13 59 232 NEEM CHANDOHA 160 642 13 8.13% 105 35 20 0 0 0 0 0 0 160 850
232 13 59 233 PARDI MOHALLA W NO 59 30 161 2 6.67% 29 0 0 0 1 0 0 0 0 30 0
233 14 60 234SCINDHIYA NAGAR, MARGHAT WALI PAHADI
594 2420 65 10.94% 70 0 0 0 524 0 0 0 0 594 0
234 14 60 235 KOTE KI SARAY 85 310 1 1.18% 0 0 0 0 41 44 0 0 0 85 0
235 14 60 236 HURAWALI 687 2742 37 5.39% 0 6 0 35 646 0 0 0 0 687 0
236 14 60 237 HARKHEDA 88 269 32 36.36% 19 0 0 0 69 0 0 0 0 88 0
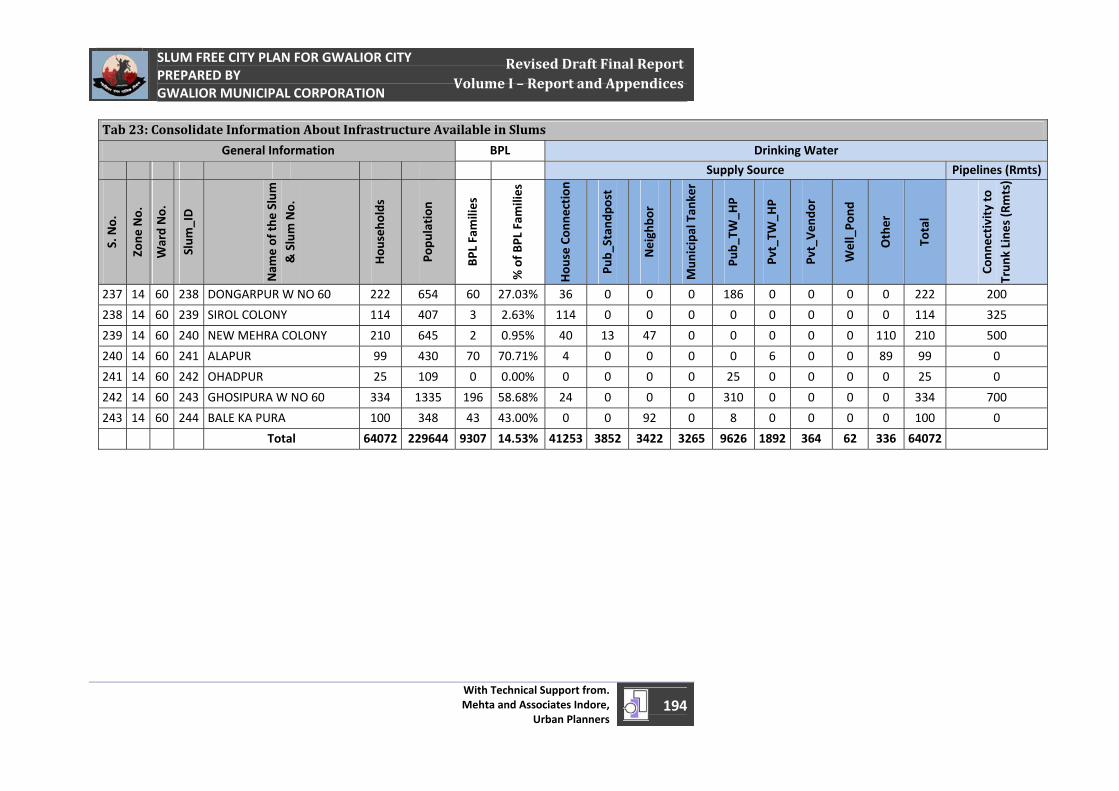
April 1, 2011
SLUM FREE CITY PLAN FOR GWALIOR CITY PREPARED BY GWALIOR MUNICIPAL CORPORATION
With Technical Support from. Mehta and Associates Indore,
Urban Planners194
Revised Draft Final Report Volume I – Report and Appendices
Tab 23: Consolidate Information About Infrastructure Available in Slums
General Information BPL Drinking Water
Supply Source Pipelines (Rmts)
S. No.
Zone
No.
Ward No.
Slum
_ID
Nam
e of th
e Slum
& Slum No.
Hou
seho
lds
Popu
lation
BPL Families
% of B
PL Fam
ilies
Hou
se Con
nection
Pub_
Stan
dpost
Neighbo
r
Mun
icipal Tan
ker
Pub_
TW_H
P
Pvt_TW
_HP
Pvt_Ven
dor
Well_Po
nd
Other
Total
Conn
ectivity to
Trun
k Line
s (Rmts)
237 14 60 238 DONGARPUR W NO 60 222 654 60 27.03% 36 0 0 0 186 0 0 0 0 222 200
238 14 60 239 SIROL COLONY 114 407 3 2.63% 114 0 0 0 0 0 0 0 0 114 325
239 14 60 240 NEW MEHRA COLONY 210 645 2 0.95% 40 13 47 0 0 0 0 0 110 210 500
240 14 60 241 ALAPUR 99 430 70 70.71% 4 0 0 0 0 6 0 0 89 99 0
241 14 60 242 OHADPUR 25 109 0 0.00% 0 0 0 0 25 0 0 0 0 25 0
242 14 60 243 GHOSIPURA W NO 60 334 1335 196 58.68% 24 0 0 0 310 0 0 0 0 334 700
243 14 60 244 BALE KA PURA 100 348 43 43.00% 0 0 92 0 8 0 0 0 0 100 0
Total 64072 229644 9307 14.53% 41253 3852 3422 3265 9626 1892 364 62 336 64072
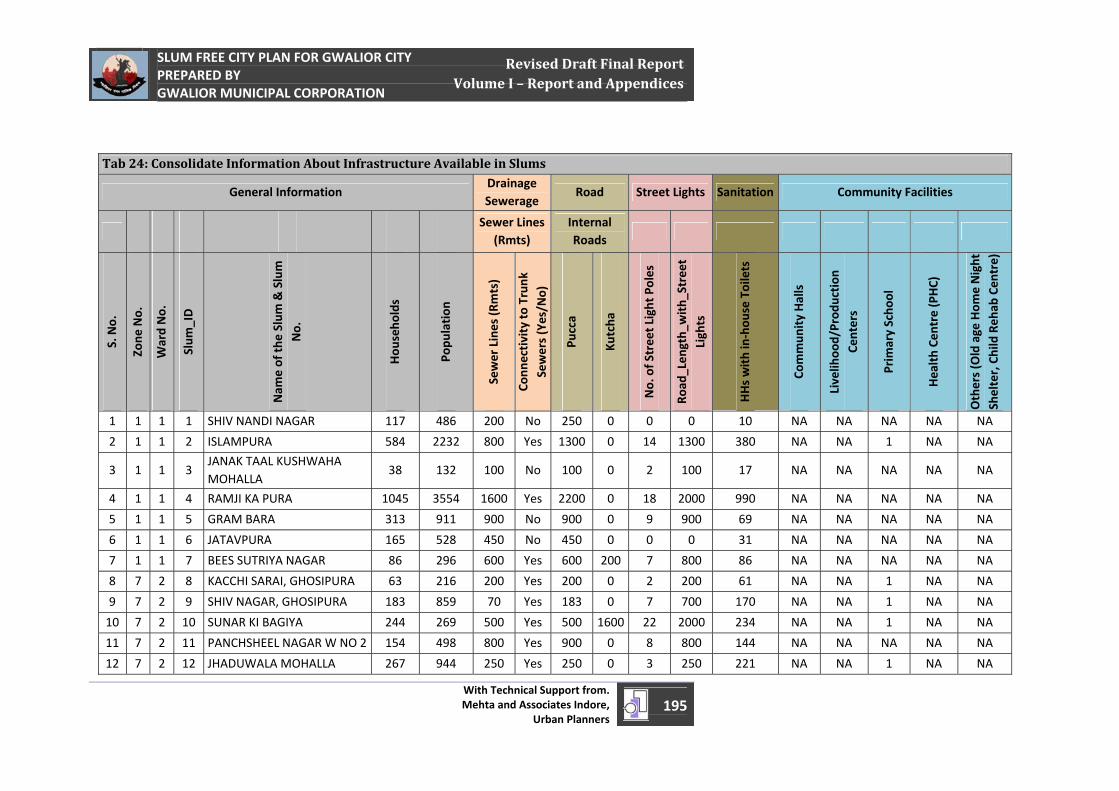
April 1, 2011
SLUM FREE CITY PLAN FOR GWALIOR CITY PREPARED BY GWALIOR MUNICIPAL CORPORATION
With Technical Support from. Mehta and Associates Indore,
Urban Planners195
Revised Draft Final Report Volume I – Report and Appendices
Tab 24: Consolidate Information About Infrastructure Available in Slums
General Information Drainage Sewerage
Road Street Lights Sanitation Community Facilities
Sewer Lines (Rmts)
Internal Roads
S. No.
Zone
No.
Ward No.
Slum
_ID
Nam
e of th
e Slum
& Slum
No.
Hou
seho
lds
Popu
lation
Sewer Lines (R
mts)
Conn
ectivity to
Trunk
Sewers (Yes/N
o)
Pucca
Kutcha
No. of Street Light Poles
Road
_Len
gth_
with_
Street
Lights
HHs with in‐hou
se Toilets
Commun
ity Halls
Livelih
ood/Prod
uction
Ce
nters
Prim
ary Scho
ol
Health Ce
ntre (P
HC)
Others (Old age Hom
e Night
Shelter, Child Reh
ab Cen
tre)
1 1 1 1 SHIV NANDI NAGAR 117 486 200 No 250 0 0 0 10 NA NA NA NA NA
2 1 1 2 ISLAMPURA 584 2232 800 Yes 1300 0 14 1300 380 NA NA 1 NA NA
3 1 1 3 JANAK TAAL KUSHWAHA MOHALLA
38 132 100 No 100 0 2 100 17 NA NA NA NA NA
4 1 1 4 RAMJI KA PURA 1045 3554 1600 Yes 2200 0 18 2000 990 NA NA NA NA NA
5 1 1 5 GRAM BARA 313 911 900 No 900 0 9 900 69 NA NA NA NA NA
6 1 1 6 JATAVPURA 165 528 450 No 450 0 0 0 31 NA NA NA NA NA
7 1 1 7 BEES SUTRIYA NAGAR 86 296 600 Yes 600 200 7 800 86 NA NA NA NA NA
8 7 2 8 KACCHI SARAI, GHOSIPURA 63 216 200 Yes 200 0 2 200 61 NA NA 1 NA NA
9 7 2 9 SHIV NAGAR, GHOSIPURA 183 859 70 Yes 183 0 7 700 170 NA NA 1 NA NA
10 7 2 10 SUNAR KI BAGIYA 244 269 500 Yes 500 1600 22 2000 234 NA NA 1 NA NA
11 7 2 11 PANCHSHEEL NAGAR W NO 2 154 498 800 Yes 900 0 8 800 144 NA NA NA NA NA
12 7 2 12 JHADUWALA MOHALLA 267 944 250 Yes 250 0 3 250 221 NA NA 1 NA NA
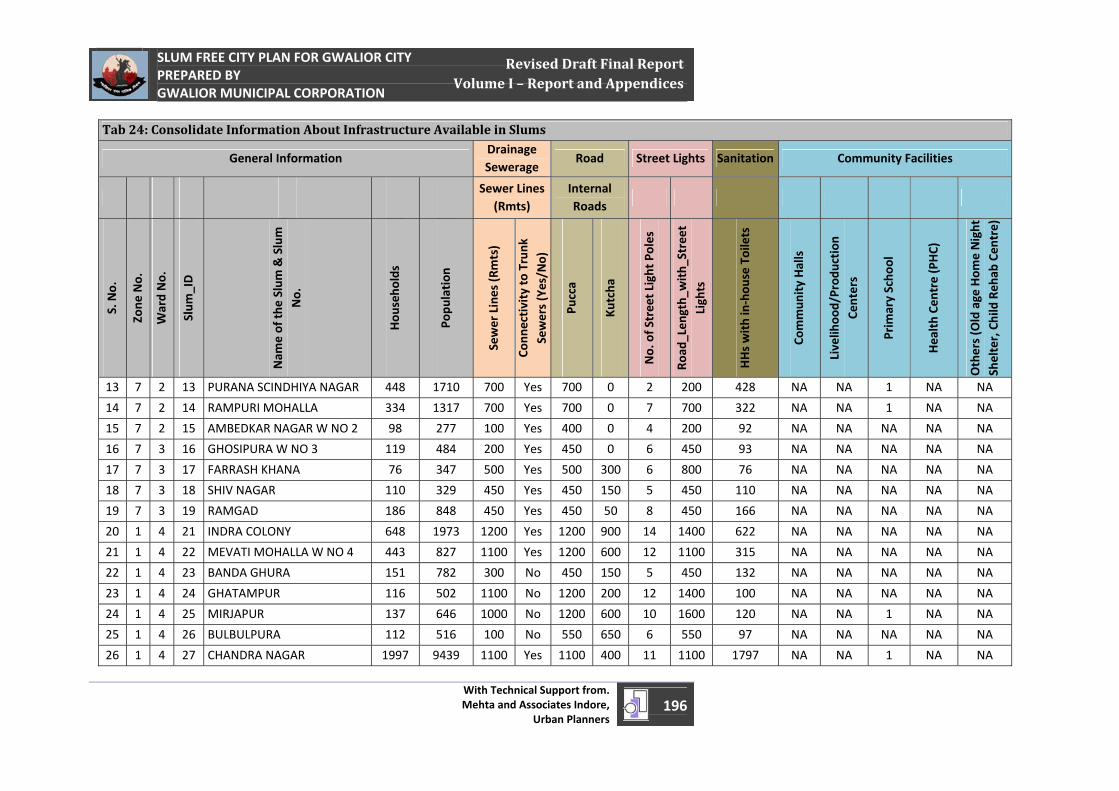
April 1, 2011
SLUM FREE CITY PLAN FOR GWALIOR CITY PREPARED BY GWALIOR MUNICIPAL CORPORATION
With Technical Support from. Mehta and Associates Indore,
Urban Planners196
Revised Draft Final Report Volume I – Report and Appendices
Tab 24: Consolidate Information About Infrastructure Available in Slums
General Information Drainage Sewerage
Road Street Lights Sanitation Community Facilities
Sewer Lines (Rmts)
Internal Roads
S. No.
Zone
No.
Ward No.
Slum
_ID
Nam
e of th
e Slum
& Slum
No.
Hou
seho
lds
Popu
lation
Sewer Lines (R
mts)
Conn
ectivity to
Trunk
Sewers (Yes/N
o)
Pucca
Kutcha
No. of Street Light Poles
Road
_Len
gth_
with_
Street
Lights
HHs with in‐hou
se Toilets
Commun
ity Halls
Livelih
ood/Prod
uction
Ce
nters
Prim
ary Scho
ol
Health Ce
ntre (P
HC)
Others (Old age Hom
e Night
Shelter, Child Reh
ab Cen
tre)
13 7 2 13 PURANA SCINDHIYA NAGAR 448 1710 700 Yes 700 0 2 200 428 NA NA 1 NA NA
14 7 2 14 RAMPURI MOHALLA 334 1317 700 Yes 700 0 7 700 322 NA NA 1 NA NA
15 7 2 15 AMBEDKAR NAGAR W NO 2 98 277 100 Yes 400 0 4 200 92 NA NA NA NA NA
16 7 3 16 GHOSIPURA W NO 3 119 484 200 Yes 450 0 6 450 93 NA NA NA NA NA
17 7 3 17 FARRASH KHANA 76 347 500 Yes 500 300 6 800 76 NA NA NA NA NA
18 7 3 18 SHIV NAGAR 110 329 450 Yes 450 150 5 450 110 NA NA NA NA NA
19 7 3 19 RAMGAD 186 848 450 Yes 450 50 8 450 166 NA NA NA NA NA
20 1 4 21 INDRA COLONY 648 1973 1200 Yes 1200 900 14 1400 622 NA NA NA NA NA
21 1 4 22 MEVATI MOHALLA W NO 4 443 827 1100 Yes 1200 600 12 1100 315 NA NA NA NA NA
22 1 4 23 BANDA GHURA 151 782 300 No 450 150 5 450 132 NA NA NA NA NA
23 1 4 24 GHATAMPUR 116 502 1100 No 1200 200 12 1400 100 NA NA NA NA NA
24 1 4 25 MIRJAPUR 137 646 1000 No 1200 600 10 1600 120 NA NA 1 NA NA
25 1 4 26 BULBULPURA 112 516 100 No 550 650 6 550 97 NA NA NA NA NA
26 1 4 27 CHANDRA NAGAR 1997 9439 1100 Yes 1100 400 11 1100 1797 NA NA 1 NA NA
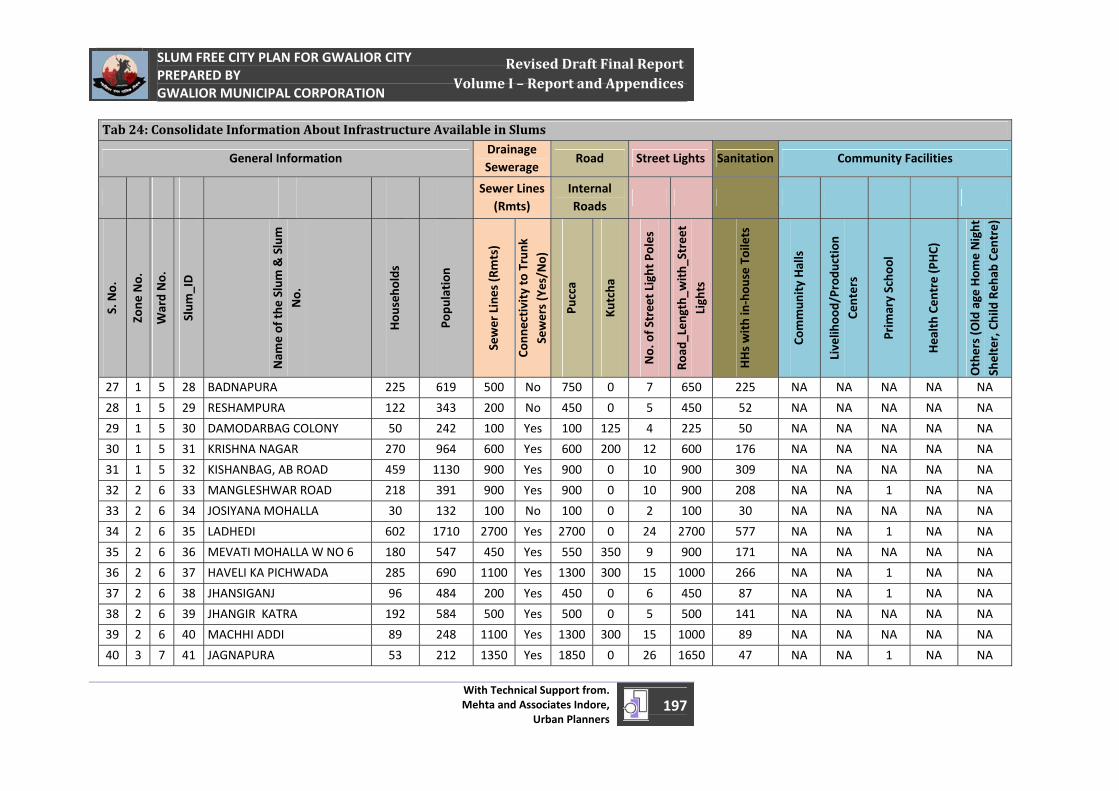
April 1, 2011
SLUM FREE CITY PLAN FOR GWALIOR CITY PREPARED BY GWALIOR MUNICIPAL CORPORATION
With Technical Support from. Mehta and Associates Indore,
Urban Planners197
Revised Draft Final Report Volume I – Report and Appendices
Tab 24: Consolidate Information About Infrastructure Available in Slums
General Information Drainage Sewerage
Road Street Lights Sanitation Community Facilities
Sewer Lines (Rmts)
Internal Roads
S. No.
Zone
No.
Ward No.
Slum
_ID
Nam
e of th
e Slum
& Slum
No.
Hou
seho
lds
Popu
lation
Sewer Lines (R
mts)
Conn
ectivity to
Trunk
Sewers (Yes/N
o)
Pucca
Kutcha
No. of Street Light Poles
Road
_Len
gth_
with_
Street
Lights
HHs with in‐hou
se Toilets
Commun
ity Halls
Livelih
ood/Prod
uction
Ce
nters
Prim
ary Scho
ol
Health Ce
ntre (P
HC)
Others (Old age Hom
e Night
Shelter, Child Reh
ab Cen
tre)
27 1 5 28 BADNAPURA 225 619 500 No 750 0 7 650 225 NA NA NA NA NA
28 1 5 29 RESHAMPURA 122 343 200 No 450 0 5 450 52 NA NA NA NA NA
29 1 5 30 DAMODARBAG COLONY 50 242 100 Yes 100 125 4 225 50 NA NA NA NA NA
30 1 5 31 KRISHNA NAGAR 270 964 600 Yes 600 200 12 600 176 NA NA NA NA NA
31 1 5 32 KISHANBAG, AB ROAD 459 1130 900 Yes 900 0 10 900 309 NA NA NA NA NA
32 2 6 33 MANGLESHWAR ROAD 218 391 900 Yes 900 0 10 900 208 NA NA 1 NA NA
33 2 6 34 JOSIYANA MOHALLA 30 132 100 No 100 0 2 100 30 NA NA NA NA NA
34 2 6 35 LADHEDI 602 1710 2700 Yes 2700 0 24 2700 577 NA NA 1 NA NA
35 2 6 36 MEVATI MOHALLA W NO 6 180 547 450 Yes 550 350 9 900 171 NA NA NA NA NA
36 2 6 37 HAVELI KA PICHWADA 285 690 1100 Yes 1300 300 15 1000 266 NA NA 1 NA NA
37 2 6 38 JHANSIGANJ 96 484 200 Yes 450 0 6 450 87 NA NA 1 NA NA
38 2 6 39 JHANGIR KATRA 192 584 500 Yes 500 0 5 500 141 NA NA NA NA NA
39 2 6 40 MACHHI ADDI 89 248 1100 Yes 1300 300 15 1000 89 NA NA NA NA NA
40 3 7 41 JAGNAPURA 53 212 1350 Yes 1850 0 26 1650 47 NA NA 1 NA NA
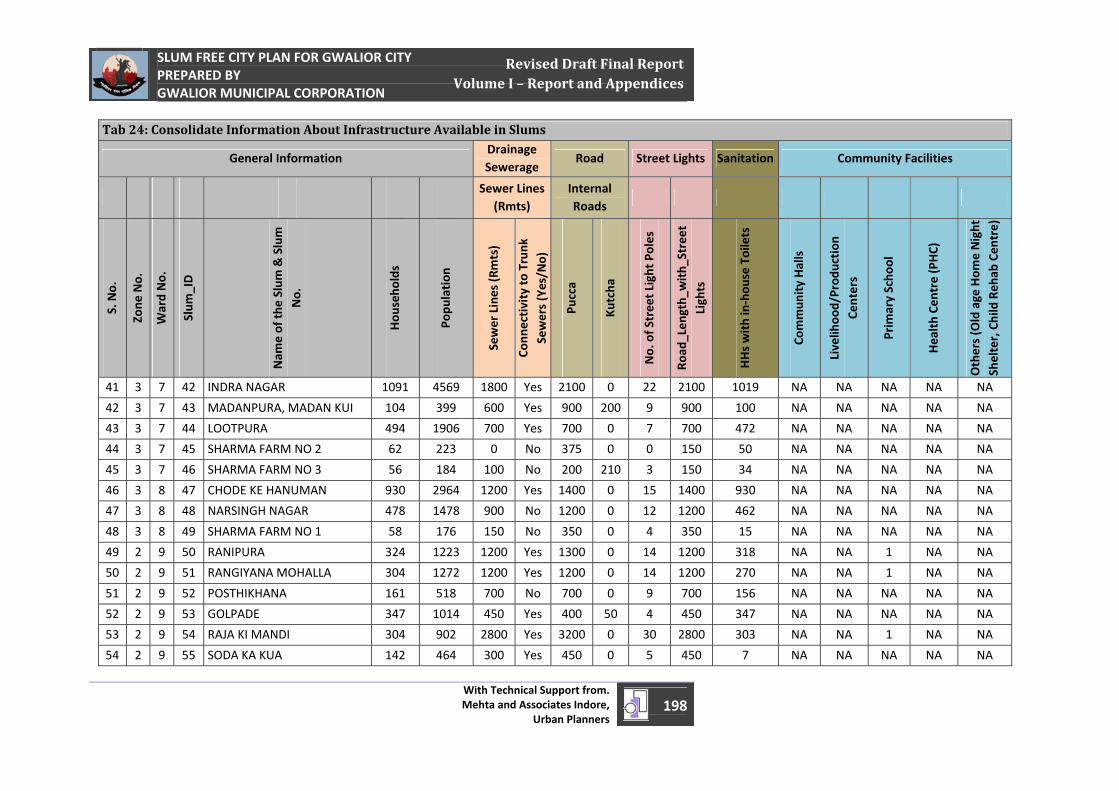
April 1, 2011
SLUM FREE CITY PLAN FOR GWALIOR CITY PREPARED BY GWALIOR MUNICIPAL CORPORATION
With Technical Support from. Mehta and Associates Indore,
Urban Planners198
Revised Draft Final Report Volume I – Report and Appendices
Tab 24: Consolidate Information About Infrastructure Available in Slums
General Information Drainage Sewerage
Road Street Lights Sanitation Community Facilities
Sewer Lines (Rmts)
Internal Roads
S. No.
Zone
No.
Ward No.
Slum
_ID
Nam
e of th
e Slum
& Slum
No.
Hou
seho
lds
Popu
lation
Sewer Lines (R
mts)
Conn
ectivity to
Trunk
Sewers (Yes/N
o)
Pucca
Kutcha
No. of Street Light Poles
Road
_Len
gth_
with_
Street
Lights
HHs with in‐hou
se Toilets
Commun
ity Halls
Livelih
ood/Prod
uction
Ce
nters
Prim
ary Scho
ol
Health Ce
ntre (P
HC)
Others (Old age Hom
e Night
Shelter, Child Reh
ab Cen
tre)
41 3 7 42 INDRA NAGAR 1091 4569 1800 Yes 2100 0 22 2100 1019 NA NA NA NA NA
42 3 7 43 MADANPURA, MADAN KUI 104 399 600 Yes 900 200 9 900 100 NA NA NA NA NA
43 3 7 44 LOOTPURA 494 1906 700 Yes 700 0 7 700 472 NA NA NA NA NA
44 3 7 45 SHARMA FARM NO 2 62 223 0 No 375 0 0 150 50 NA NA NA NA NA
45 3 7 46 SHARMA FARM NO 3 56 184 100 No 200 210 3 150 34 NA NA NA NA NA
46 3 8 47 CHODE KE HANUMAN 930 2964 1200 Yes 1400 0 15 1400 930 NA NA NA NA NA
47 3 8 48 NARSINGH NAGAR 478 1478 900 No 1200 0 12 1200 462 NA NA NA NA NA
48 3 8 49 SHARMA FARM NO 1 58 176 150 No 350 0 4 350 15 NA NA NA NA NA
49 2 9 50 RANIPURA 324 1223 1200 Yes 1300 0 14 1200 318 NA NA 1 NA NA
50 2 9 51 RANGIYANA MOHALLA 304 1272 1200 Yes 1200 0 14 1200 270 NA NA 1 NA NA
51 2 9 52 POSTHIKHANA 161 518 700 No 700 0 9 700 156 NA NA NA NA NA
52 2 9 53 GOLPADE 347 1014 450 Yes 400 50 4 450 347 NA NA NA NA NA
53 2 9 54 RAJA KI MANDI 304 902 2800 Yes 3200 0 30 2800 303 NA NA 1 NA NA
54 2 9 55 SODA KA KUA 142 464 300 Yes 450 0 5 450 7 NA NA NA NA NA
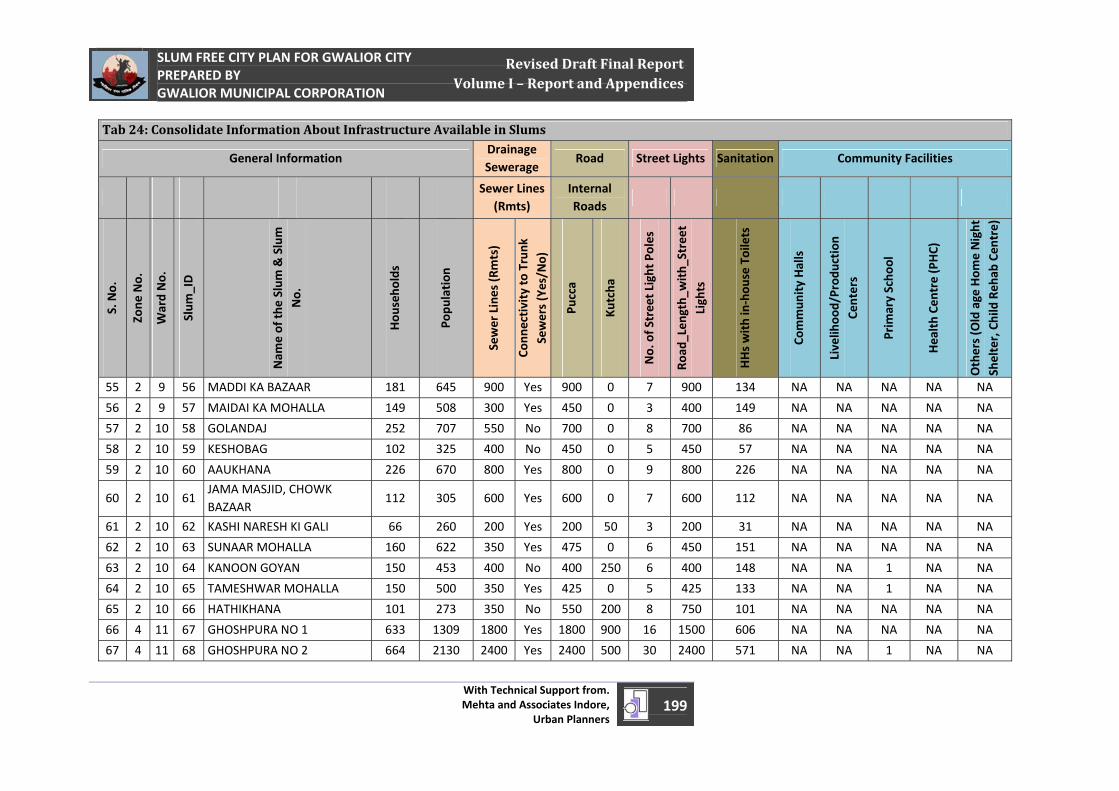
April 1, 2011
SLUM FREE CITY PLAN FOR GWALIOR CITY PREPARED BY GWALIOR MUNICIPAL CORPORATION
With Technical Support from. Mehta and Associates Indore,
Urban Planners199
Revised Draft Final Report Volume I – Report and Appendices
Tab 24: Consolidate Information About Infrastructure Available in Slums
General Information Drainage Sewerage
Road Street Lights Sanitation Community Facilities
Sewer Lines (Rmts)
Internal Roads
S. No.
Zone
No.
Ward No.
Slum
_ID
Nam
e of th
e Slum
& Slum
No.
Hou
seho
lds
Popu
lation
Sewer Lines (R
mts)
Conn
ectivity to
Trunk
Sewers (Yes/N
o)
Pucca
Kutcha
No. of Street Light Poles
Road
_Len
gth_
with_
Street
Lights
HHs with in‐hou
se Toilets
Commun
ity Halls
Livelih
ood/Prod
uction
Ce
nters
Prim
ary Scho
ol
Health Ce
ntre (P
HC)
Others (Old age Hom
e Night
Shelter, Child Reh
ab Cen
tre)
55 2 9 56 MADDI KA BAZAAR 181 645 900 Yes 900 0 7 900 134 NA NA NA NA NA
56 2 9 57 MAIDAI KA MOHALLA 149 508 300 Yes 450 0 3 400 149 NA NA NA NA NA
57 2 10 58 GOLANDAJ 252 707 550 No 700 0 8 700 86 NA NA NA NA NA
58 2 10 59 KESHOBAG 102 325 400 No 450 0 5 450 57 NA NA NA NA NA
59 2 10 60 AAUKHANA 226 670 800 Yes 800 0 9 800 226 NA NA NA NA NA
60 2 10 61 JAMA MASJID, CHOWK BAZAAR
112 305 600 Yes 600 0 7 600 112 NA NA NA NA NA
61 2 10 62 KASHI NARESH KI GALI 66 260 200 Yes 200 50 3 200 31 NA NA NA NA NA
62 2 10 63 SUNAAR MOHALLA 160 622 350 Yes 475 0 6 450 151 NA NA NA NA NA
63 2 10 64 KANOON GOYAN 150 453 400 No 400 250 6 400 148 NA NA 1 NA NA
64 2 10 65 TAMESHWAR MOHALLA 150 500 350 Yes 425 0 5 425 133 NA NA 1 NA NA
65 2 10 66 HATHIKHANA 101 273 350 No 550 200 8 750 101 NA NA NA NA NA
66 4 11 67 GHOSHPURA NO 1 633 1309 1800 Yes 1800 900 16 1500 606 NA NA NA NA NA
67 4 11 68 GHOSHPURA NO 2 664 2130 2400 Yes 2400 500 30 2400 571 NA NA 1 NA NA
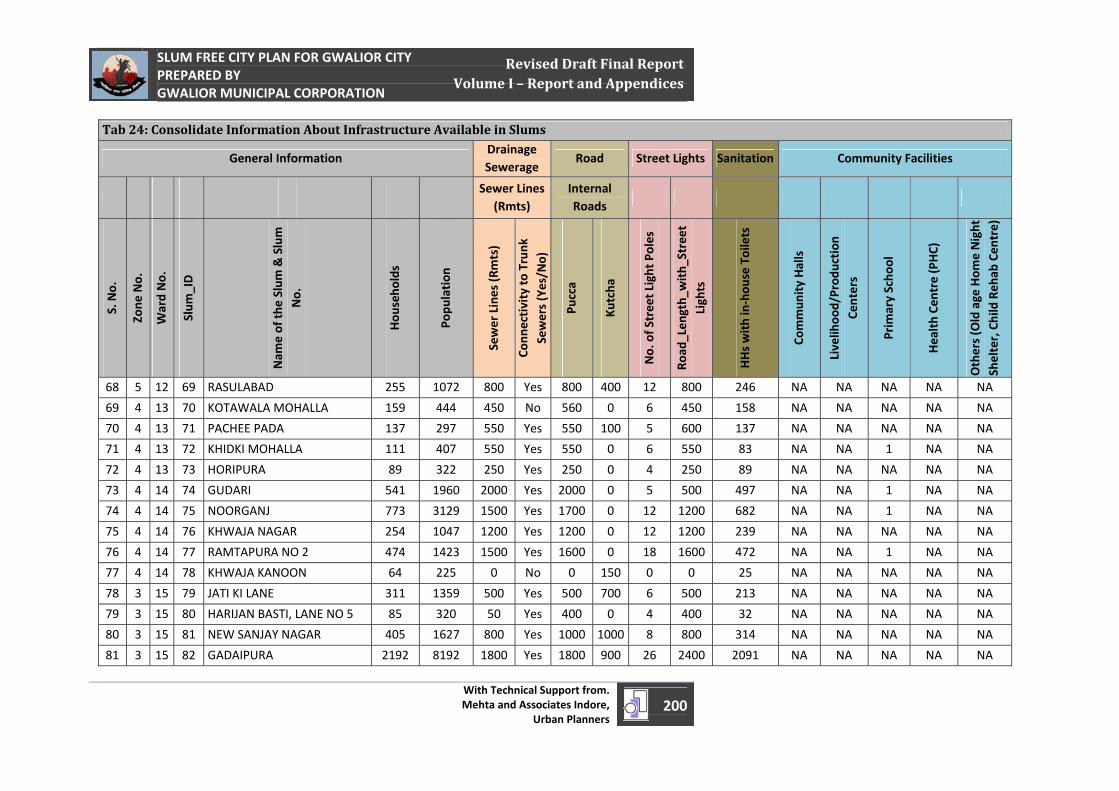
April 1, 2011
SLUM FREE CITY PLAN FOR GWALIOR CITY PREPARED BY GWALIOR MUNICIPAL CORPORATION
With Technical Support from. Mehta and Associates Indore,
Urban Planners200
Revised Draft Final Report Volume I – Report and Appendices
Tab 24: Consolidate Information About Infrastructure Available in Slums
General Information Drainage Sewerage
Road Street Lights Sanitation Community Facilities
Sewer Lines (Rmts)
Internal Roads
S. No.
Zone
No.
Ward No.
Slum
_ID
Nam
e of th
e Slum
& Slum
No.
Hou
seho
lds
Popu
lation
Sewer Lines (R
mts)
Conn
ectivity to
Trunk
Sewers (Yes/N
o)
Pucca
Kutcha
No. of Street Light Poles
Road
_Len
gth_
with_
Street
Lights
HHs with in‐hou
se Toilets
Commun
ity Halls
Livelih
ood/Prod
uction
Ce
nters
Prim
ary Scho
ol
Health Ce
ntre (P
HC)
Others (Old age Hom
e Night
Shelter, Child Reh
ab Cen
tre)
68 5 12 69 RASULABAD 255 1072 800 Yes 800 400 12 800 246 NA NA NA NA NA
69 4 13 70 KOTAWALA MOHALLA 159 444 450 No 560 0 6 450 158 NA NA NA NA NA
70 4 13 71 PACHEE PADA 137 297 550 Yes 550 100 5 600 137 NA NA NA NA NA
71 4 13 72 KHIDKI MOHALLA 111 407 550 Yes 550 0 6 550 83 NA NA 1 NA NA
72 4 13 73 HORIPURA 89 322 250 Yes 250 0 4 250 89 NA NA NA NA NA
73 4 14 74 GUDARI 541 1960 2000 Yes 2000 0 5 500 497 NA NA 1 NA NA
74 4 14 75 NOORGANJ 773 3129 1500 Yes 1700 0 12 1200 682 NA NA 1 NA NA
75 4 14 76 KHWAJA NAGAR 254 1047 1200 Yes 1200 0 12 1200 239 NA NA NA NA NA
76 4 14 77 RAMTAPURA NO 2 474 1423 1500 Yes 1600 0 18 1600 472 NA NA 1 NA NA
77 4 14 78 KHWAJA KANOON 64 225 0 No 0 150 0 0 25 NA NA NA NA NA
78 3 15 79 JATI KI LANE 311 1359 500 Yes 500 700 6 500 213 NA NA NA NA NA
79 3 15 80 HARIJAN BASTI, LANE NO 5 85 320 50 Yes 400 0 4 400 32 NA NA NA NA NA
80 3 15 81 NEW SANJAY NAGAR 405 1627 800 Yes 1000 1000 8 800 314 NA NA NA NA NA
81 3 15 82 GADAIPURA 2192 8192 1800 Yes 1800 900 26 2400 2091 NA NA NA NA NA

April 1, 2011
SLUM FREE CITY PLAN FOR GWALIOR CITY PREPARED BY GWALIOR MUNICIPAL CORPORATION
With Technical Support from. Mehta and Associates Indore,
Urban Planners201
Revised Draft Final Report Volume I – Report and Appendices
Tab 24: Consolidate Information About Infrastructure Available in Slums
General Information Drainage Sewerage
Road Street Lights Sanitation Community Facilities
Sewer Lines (Rmts)
Internal Roads
S. No.
Zone
No.
Ward No.
Slum
_ID
Nam
e of th
e Slum
& Slum
No.
Hou
seho
lds
Popu
lation
Sewer Lines (R
mts)
Conn
ectivity to
Trunk
Sewers (Yes/N
o)
Pucca
Kutcha
No. of Street Light Poles
Road
_Len
gth_
with_
Street
Lights
HHs with in‐hou
se Toilets
Commun
ity Halls
Livelih
ood/Prod
uction
Ce
nters
Prim
ary Scho
ol
Health Ce
ntre (P
HC)
Others (Old age Hom
e Night
Shelter, Child Reh
ab Cen
tre)
82 5 16 83 NEW COLONY NO 2 37 138 300 Yes 300 0 4 300 37 NA NA 1 NA NA
83 5 16 84 NEW COLONY NO 1 354 1258 1100 Yes 1100 0 11 1100 350 NA NA NA NA NA
84 5 16 85 CHANDANPURA 128 495 450 Yes 450 0 6 450 114 NA NA NA NA NA
85 5 16 86 RESHAM MILL BASTI 348 1166 300 Yes 750 300 4 300 348 NA NA NA NA NA
86 5 17 87 ANAND NAGAR, CHAMDA MILL
85 164 300 Yes 300 0 4 300 80 NA NA NA NA NA
87 5 17 88 ARA MILL, HARIJAN BASTI 462 1564 2400 Yes 2600 0 27 2600 460 NA NA 1 NA NA
88 5 17 89 3B COLONY, LAL QUARTER 49 135 450 Yes 450 0 4 450 49 NA NA 1 NA NA
89 5 17 90 NEW KANCH MILL 120 394 600 Yes 600 0 6 600 119 NA NA NA NA NA
90 8 18 91 ADARSH NAGAR 110 501 300 Yes 300 100 4 350 35 NA NA NA NA NA
91 8 18 92 RASULPUR 148 551 0 No 0 100 3 100 0 NA NA NA NA NA
92 8 19 93 JADERUA KALAH 818 3281 1200 Yes 1200 1800 22 2000 818 NA NA NA NA NA
93 8 19 94 RACHANA NAGAR 91 379 0 Yes 350 150 0 0 67 NA NA NA NA NA
94 10 21 95 VIVEK NAGAR 29 100 800 Yes 800 0 8 800 26 NA NA NA NA NA

April 1, 2011
SLUM FREE CITY PLAN FOR GWALIOR CITY PREPARED BY GWALIOR MUNICIPAL CORPORATION
With Technical Support from. Mehta and Associates Indore,
Urban Planners202
Revised Draft Final Report Volume I – Report and Appendices
Tab 24: Consolidate Information About Infrastructure Available in Slums
General Information Drainage Sewerage
Road Street Lights Sanitation Community Facilities
Sewer Lines (Rmts)
Internal Roads
S. No.
Zone
No.
Ward No.
Slum
_ID
Nam
e of th
e Slum
& Slum
No.
Hou
seho
lds
Popu
lation
Sewer Lines (R
mts)
Conn
ectivity to
Trunk
Sewers (Yes/N
o)
Pucca
Kutcha
No. of Street Light Poles
Road
_Len
gth_
with_
Street
Lights
HHs with in‐hou
se Toilets
Commun
ity Halls
Livelih
ood/Prod
uction
Ce
nters
Prim
ary Scho
ol
Health Ce
ntre (P
HC)
Others (Old age Hom
e Night
Shelter, Child Reh
ab Cen
tre)
95 10 21 96 PANCHSHEEL NAGAR W NO 21
59 214 450 Yes 450 0 6 450 55 NA NA NA NA NA
96 10 21 97 MELA DULPUR 497 1217 900 Yes 1450 0 12 1450 436 NA NA NA NA NA
97 10 21 98 SHANTI NAGAR W NO 21 52 183 0 No 0 350 1 0 0 NA NA NA NA NA
98 10 21 99 BAGIYA HANUMAN NAGAR 55 157 150 No 150 0 3 150 51 NA NA NA NA NA
99 10 22 100 BASTI GODAM 289 883 0 Yes 1200 200 0 0 281 NA NA 1 NA NA
100 10 22 101 SHIDHESHWAR NAGAR 511 1124 1600 Yes 2300 0 19 2000 482 NA NA 1 NA NA
101 10 22 102 KHALEEFA COLONY 38 142 200 Yes 200 0 4 200 37 NA NA NA NA NA
102 10 22 103 GOPALPURA 103 238 0 Yes 500 100 2 200 102 NA NA NA NA NA
103 10 22 104 SHIDHARTH NAGAR 30 83 100 Yes 100 0 2 100 29 NA NA NA NA NA
104 10 23 105 NADI PAR TAL 666 2275 1200 Yes 1350 0 11 800 666 NA NA NA NA NA
105 10 23 106 GALLA KOTHER 338 1477 550 Yes 750 0 6 550 218 NA NA 1 NA NA
106 10 23 107 AMBEDKAR NAGAR W NO 23 62 127 175 No 175 0 4 175 60 NA NA NA NA NA
107 10 23 108 SHRI NAGAR COLONY 303 1029 1700 Yes 1700 0 17 1700 298 NA NA NA NA NA
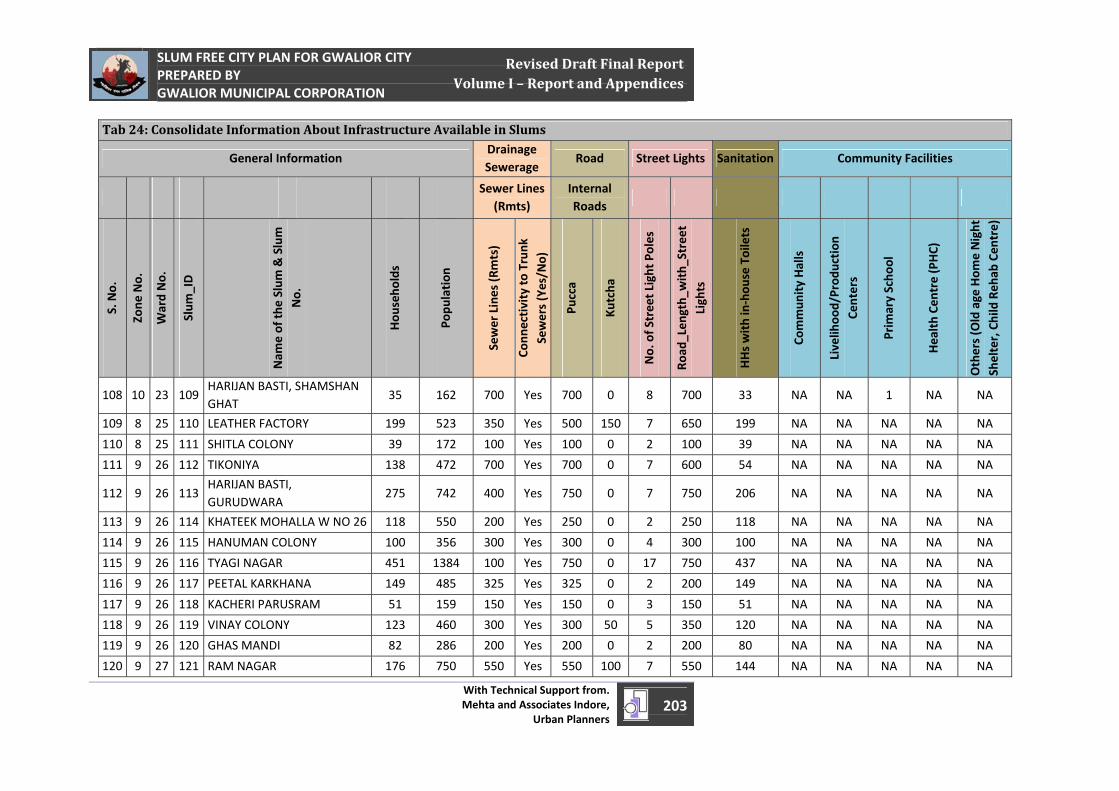
April 1, 2011
SLUM FREE CITY PLAN FOR GWALIOR CITY PREPARED BY GWALIOR MUNICIPAL CORPORATION
With Technical Support from. Mehta and Associates Indore,
Urban Planners203
Revised Draft Final Report Volume I – Report and Appendices
Tab 24: Consolidate Information About Infrastructure Available in Slums
General Information Drainage Sewerage
Road Street Lights Sanitation Community Facilities
Sewer Lines (Rmts)
Internal Roads
S. No.
Zone
No.
Ward No.
Slum
_ID
Nam
e of th
e Slum
& Slum
No.
Hou
seho
lds
Popu
lation
Sewer Lines (R
mts)
Conn
ectivity to
Trunk
Sewers (Yes/N
o)
Pucca
Kutcha
No. of Street Light Poles
Road
_Len
gth_
with_
Street
Lights
HHs with in‐hou
se Toilets
Commun
ity Halls
Livelih
ood/Prod
uction
Ce
nters
Prim
ary Scho
ol
Health Ce
ntre (P
HC)
Others (Old age Hom
e Night
Shelter, Child Reh
ab Cen
tre)
108 10 23 109HARIJAN BASTI, SHAMSHAN GHAT
35 162 700 Yes 700 0 8 700 33 NA NA 1 NA NA
109 8 25 110 LEATHER FACTORY 199 523 350 Yes 500 150 7 650 199 NA NA NA NA NA
110 8 25 111 SHITLA COLONY 39 172 100 Yes 100 0 2 100 39 NA NA NA NA NA
111 9 26 112 TIKONIYA 138 472 700 Yes 700 0 7 600 54 NA NA NA NA NA
112 9 26 113HARIJAN BASTI, GURUDWARA
275 742 400 Yes 750 0 7 750 206 NA NA NA NA NA
113 9 26 114 KHATEEK MOHALLA W NO 26 118 550 200 Yes 250 0 2 250 118 NA NA NA NA NA
114 9 26 115 HANUMAN COLONY 100 356 300 Yes 300 0 4 300 100 NA NA NA NA NA
115 9 26 116 TYAGI NAGAR 451 1384 100 Yes 750 0 17 750 437 NA NA NA NA NA
116 9 26 117 PEETAL KARKHANA 149 485 325 Yes 325 0 2 200 149 NA NA NA NA NA
117 9 26 118 KACHERI PARUSRAM 51 159 150 Yes 150 0 3 150 51 NA NA NA NA NA
118 9 26 119 VINAY COLONY 123 460 300 Yes 300 50 5 350 120 NA NA NA NA NA
119 9 26 120 GHAS MANDI 82 286 200 Yes 200 0 2 200 80 NA NA NA NA NA
120 9 27 121 RAM NAGAR 176 750 550 Yes 550 100 7 550 144 NA NA NA NA NA

April 1, 2011
SLUM FREE CITY PLAN FOR GWALIOR CITY PREPARED BY GWALIOR MUNICIPAL CORPORATION
With Technical Support from. Mehta and Associates Indore,
Urban Planners204
Revised Draft Final Report Volume I – Report and Appendices
Tab 24: Consolidate Information About Infrastructure Available in Slums
General Information Drainage Sewerage
Road Street Lights Sanitation Community Facilities
Sewer Lines (Rmts)
Internal Roads
S. No.
Zone
No.
Ward No.
Slum
_ID
Nam
e of th
e Slum
& Slum
No.
Hou
seho
lds
Popu
lation
Sewer Lines (R
mts)
Conn
ectivity to
Trunk
Sewers (Yes/N
o)
Pucca
Kutcha
No. of Street Light Poles
Road
_Len
gth_
with_
Street
Lights
HHs with in‐hou
se Toilets
Commun
ity Halls
Livelih
ood/Prod
uction
Ce
nters
Prim
ary Scho
ol
Health Ce
ntre (P
HC)
Others (Old age Hom
e Night
Shelter, Child Reh
ab Cen
tre)
121 11 28 122 HARNAMPURA 401 1261 1075 Yes 1075 175 7 1200 401 NA NA NA NA NA
122 11 28 123 BHIM NAGAR 405 1336 900 Yes 900 500 12 1200 404 NA NA NA NA NA
123 11 28 124 PHULE NAGAR 124 311 350 Yes 350 50 4 375 124 NA NA NA NA NA
124 11 28 125 KUMHARPURA 385 1161 900 Yes 900 0 6 900 371 NA NA NA NA NA
125 14 29 126MAHAL GAON, KAROULI MATA
650 2310 1000 Yes 1000 200 8 800 438 NA NA 1 NA NA
126 6 31 127 GUJARATI MOHALLA 92 248 600 Yes 600 0 4 600 92 NA NA NA NA NA
127 6 31 128 LAXMANPURA 62 237 550 Yes 550 0 4 550 46 NA NA NA NA NA
128 6 32 129 MARI MATA 117 235 200 Yes 200 0 4 200 84 NA NA NA NA NA
129 6 32 130 MAHAL GAON, MARI MATA 495 2293 1400 Yes 1750 0 19 1750 327 NA NA NA NA NA
130 7 33 131 RAVIDAS NAGAR 534 2148 300 No 300 0 4 300 487 NA NA 1 NA NA
131 7 33 132 DONGARPUR W NO 33 299 1219 400 Yes 450 50 4 450 271 NA NA 1 NA NA
132 7 33 133 LAXMAN TALIYA 359 1289 1800 Yes 1800 0 20 1800 337 NA NA 1 NA NA
133 7 33 134 KHATEEK MOHALLA W NO 33 49 217 300 Yes 300 0 5 300 41 NA NA NA NA NA

April 1, 2011
SLUM FREE CITY PLAN FOR GWALIOR CITY PREPARED BY GWALIOR MUNICIPAL CORPORATION
With Technical Support from. Mehta and Associates Indore,
Urban Planners205
Revised Draft Final Report Volume I – Report and Appendices
Tab 24: Consolidate Information About Infrastructure Available in Slums
General Information Drainage Sewerage
Road Street Lights Sanitation Community Facilities
Sewer Lines (Rmts)
Internal Roads
S. No.
Zone
No.
Ward No.
Slum
_ID
Nam
e of th
e Slum
& Slum
No.
Hou
seho
lds
Popu
lation
Sewer Lines (R
mts)
Conn
ectivity to
Trunk
Sewers (Yes/N
o)
Pucca
Kutcha
No. of Street Light Poles
Road
_Len
gth_
with_
Street
Lights
HHs with in‐hou
se Toilets
Commun
ity Halls
Livelih
ood/Prod
uction
Ce
nters
Prim
ary Scho
ol
Health Ce
ntre (P
HC)
Others (Old age Hom
e Night
Shelter, Child Reh
ab Cen
tre)
134 7 33 135 KHALASIPURA 587 2028 500 Yes 700 500 11 1000 539 NA NA NA NA NA
135 7 33 136 PIYAU WALI GALI 267 1084 200 Yes 200 0 4 200 244 NA NA NA NA NA
136 15 34 137 PARDI MOHALLA W NO 34 61 238 250 No 250 0 4 250 28 NA NA 1 NA NA
137 16 35 138 SHEIKH KI BAGIYA 282 1172 650 Yes 650 100 7 600 234 NA NA NA NA NA
138 16 35 139SWARNALEKHA NALLAH, JIWAJIGANJ
50 182 100 Yes 100 50 2 100 50 NA NA NA NA NA
139 16 35 140 SUBEY KI GOTH 374 1236 800 Yes 750 150 8 800 349 NA NA NA NA NA
140 16 35 141 SHANTI NAGAR, NAI SADAK 112 400 375 Yes 450 75 5 450 82 NA NA NA NA NA
141 16 35 142 RASSI WALA MOHALLA 107 409 300 Yes 350 100 5 450 47 NA NA NA NA NA
142 16 35 143 DALIYA WALA MOHALLA 50 158 225 Yes 225 0 4 225 50 NA NA NA NA NA
143 16 35 144GANJ WALA MOHALLA W NO 35
53 182 200 No 200 50 2 250 27 NA NA NA NA NA
144 7 36 145 DHOBI GHAT NO 2 135 400 850 Yes 850 50 8 900 121 NA NA NA NA NA
145 7 36 146 DHOBI GHAT NO 1 255 673 1200 Yes 1200 200 11 1400 245 NA NA NA NA NA
146 7 36 147 BAKRA MANDI 54 268 150 Yes 150 0 3 150 29 NA NA NA NA NA

April 1, 2011
SLUM FREE CITY PLAN FOR GWALIOR CITY PREPARED BY GWALIOR MUNICIPAL CORPORATION
With Technical Support from. Mehta and Associates Indore,
Urban Planners206
Revised Draft Final Report Volume I – Report and Appendices
Tab 24: Consolidate Information About Infrastructure Available in Slums
General Information Drainage Sewerage
Road Street Lights Sanitation Community Facilities
Sewer Lines (Rmts)
Internal Roads
S. No.
Zone
No.
Ward No.
Slum
_ID
Nam
e of th
e Slum
& Slum
No.
Hou
seho
lds
Popu
lation
Sewer Lines (R
mts)
Conn
ectivity to
Trunk
Sewers (Yes/N
o)
Pucca
Kutcha
No. of Street Light Poles
Road
_Len
gth_
with_
Street
Lights
HHs with in‐hou
se Toilets
Commun
ity Halls
Livelih
ood/Prod
uction
Ce
nters
Prim
ary Scho
ol
Health Ce
ntre (P
HC)
Others (Old age Hom
e Night
Shelter, Child Reh
ab Cen
tre)
147 7 36 148 SATYA NARAYAN KI TEKARI 493 2064 400 Yes 400 800 10 900 438 NA NA NA NA NA
148 16 37 149 MADHO NAGAR 451 2607 200 Yes 1000 100 2 200 406 NA NA NA NA NA
149 16 37 150 SANJAY NAGAR 102 472 1000 Yes 1000 200 12 1200 88 NA NA 1 NA NA
150 16 37 151 NIMBAJI KI KHO 653 2739 1500 Yes 2000 1000 15 1000 491 NA NA 1 NA NA
151 16 37 152 NAYAPURA W NO 37 213 1035 1000 Yes 1000 0 3 300 185 NA NA NA NA NA
152 16 37 153 JAGRITI NAGAR 587 2513 500 Yes 2000 100 5 500 523 NA NA 1 NA NA
153 16 37 154 TITURIYA COLONY 70 208 0 Yes 0 100 0 40 70 NA NA NA NA NA
154 16 37 155 SHANTI NAGAR W NO 37 191 819 1200 No 2000 0 10 1100 125 NA NA NA NA NA
155 16 37 156 AMAN KA PURA 32 112 0 Yes 0 100 0 0 32 NA NA NA NA NA
156 17 38 157 GOL PAHADIYA 794 3216 1000 Yes 1000 600 7 700 650 NA NA NA NA NA
157 17 38 158 GUPTESHWAR PAHADI 277 1191 0 No 0 1600 2 100 37 NA NA NA NA NA
158 17 38 159 AMAR PAHAD 336 1332 1500 No 1500 500 15 1500 296 NA NA NA NA NA
159 17 38 160 RAJA GAS GODAM 474 2067 1500 No 2000 200 4 400 318 NA NA NA NA NA
160 17 38 161 GANESH MANDIR, RAJA GAS 133 537 1200 Yes 1400 400 10 0 113 NA NA NA NA NA

April 1, 2011
SLUM FREE CITY PLAN FOR GWALIOR CITY PREPARED BY GWALIOR MUNICIPAL CORPORATION
With Technical Support from. Mehta and Associates Indore,
Urban Planners207
Revised Draft Final Report Volume I – Report and Appendices
Tab 24: Consolidate Information About Infrastructure Available in Slums
General Information Drainage Sewerage
Road Street Lights Sanitation Community Facilities
Sewer Lines (Rmts)
Internal Roads
S. No.
Zone
No.
Ward No.
Slum
_ID
Nam
e of th
e Slum
& Slum
No.
Hou
seho
lds
Popu
lation
Sewer Lines (R
mts)
Conn
ectivity to
Trunk
Sewers (Yes/N
o)
Pucca
Kutcha
No. of Street Light Poles
Road
_Len
gth_
with_
Street
Lights
HHs with in‐hou
se Toilets
Commun
ity Halls
Livelih
ood/Prod
uction
Ce
nters
Prim
ary Scho
ol
Health Ce
ntre (P
HC)
Others (Old age Hom
e Night
Shelter, Child Reh
ab Cen
tre)
GODAM
161 17 38 162 HARKOTA NO 1 601 2230 100 Yes 1300 700 12 1300 571 NA NA NA NA NA
162 17 38 163 BHUMIYA KA PURA 63 247 1000 Yes 1000 0 5 1000 60 NA NA NA NA NA
163 17 38 164 LAL KUAR KA PURA 358 1404 1800 Yes 1800 300 18 1800 343 NA NA 1 NA NA
164 17 38 165 MEHRA SAHAB KI TALAIYA 109 340 400 Yes 400 50 6 400 109 NA NA NA NA NA
165 17 39 166KAMBAL KENDRA, HARIJAN BASTI
304 1036 600 Yes 600 200 4 800 304 NA NA 1 NA NA
166 17 39 167 SATH BHAI KI GOTH 158 539 350 Yes 400 50 6 400 157 NA NA NA NA NA
167 17 39 168JATAR GALI, SWARNA REKHA NALA
87 340 400 Yes 425 0 5 425 87 NA NA NA NA NA
168 17 39 169 DHOLIBUA KA PUL 130 322 400 Yes 400 0 4 400 130 NA NA NA NA NA
169 17 39 170 BAI SAHAB KI PARED 230 867 600 Yes 600 50 7 600 227 NA NA NA NA NA
170 18 40 171 BHOORE BABA KI BASTI 694 1357 500 Yes 800 0 8 800 653 NA NA NA NA NA
171 18 40 172GADI WALA MOHALLA W NO 40
94 157 325 Yes 325 0 4 325 91 NA NA NA NA NA
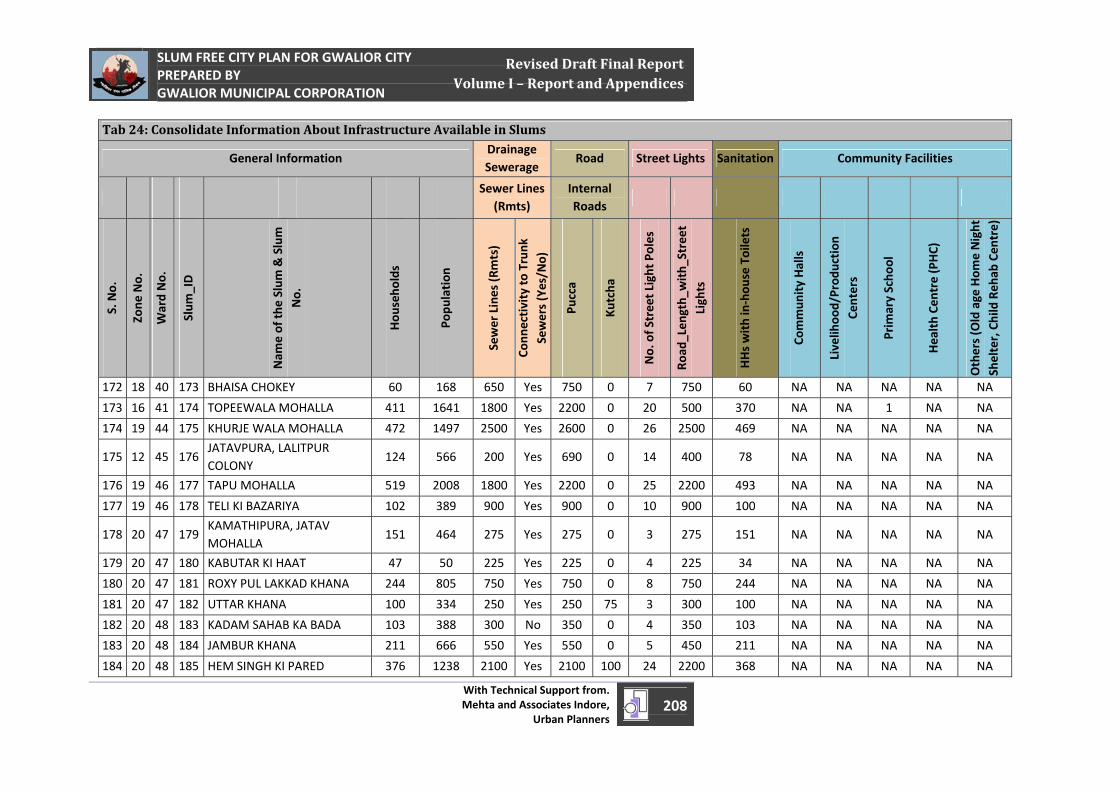
April 1, 2011
SLUM FREE CITY PLAN FOR GWALIOR CITY PREPARED BY GWALIOR MUNICIPAL CORPORATION
With Technical Support from. Mehta and Associates Indore,
Urban Planners208
Revised Draft Final Report Volume I – Report and Appendices
Tab 24: Consolidate Information About Infrastructure Available in Slums
General Information Drainage Sewerage
Road Street Lights Sanitation Community Facilities
Sewer Lines (Rmts)
Internal Roads
S. No.
Zone
No.
Ward No.
Slum
_ID
Nam
e of th
e Slum
& Slum
No.
Hou
seho
lds
Popu
lation
Sewer Lines (R
mts)
Conn
ectivity to
Trunk
Sewers (Yes/N
o)
Pucca
Kutcha
No. of Street Light Poles
Road
_Len
gth_
with_
Street
Lights
HHs with in‐hou
se Toilets
Commun
ity Halls
Livelih
ood/Prod
uction
Ce
nters
Prim
ary Scho
ol
Health Ce
ntre (P
HC)
Others (Old age Hom
e Night
Shelter, Child Reh
ab Cen
tre)
172 18 40 173 BHAISA CHOKEY 60 168 650 Yes 750 0 7 750 60 NA NA NA NA NA
173 16 41 174 TOPEEWALA MOHALLA 411 1641 1800 Yes 2200 0 20 500 370 NA NA 1 NA NA
174 19 44 175 KHURJE WALA MOHALLA 472 1497 2500 Yes 2600 0 26 2500 469 NA NA NA NA NA
175 12 45 176JATAVPURA, LALITPUR COLONY
124 566 200 Yes 690 0 14 400 78 NA NA NA NA NA
176 19 46 177 TAPU MOHALLA 519 2008 1800 Yes 2200 0 25 2200 493 NA NA NA NA NA
177 19 46 178 TELI KI BAZARIYA 102 389 900 Yes 900 0 10 900 100 NA NA NA NA NA
178 20 47 179KAMATHIPURA, JATAV MOHALLA
151 464 275 Yes 275 0 3 275 151 NA NA NA NA NA
179 20 47 180 KABUTAR KI HAAT 47 50 225 Yes 225 0 4 225 34 NA NA NA NA NA
180 20 47 181 ROXY PUL LAKKAD KHANA 244 805 750 Yes 750 0 8 750 244 NA NA NA NA NA
181 20 47 182 UTTAR KHANA 100 334 250 Yes 250 75 3 300 100 NA NA NA NA NA
182 20 48 183 KADAM SAHAB KA BADA 103 388 300 No 350 0 4 350 103 NA NA NA NA NA
183 20 48 184 JAMBUR KHANA 211 666 550 Yes 550 0 5 450 211 NA NA NA NA NA
184 20 48 185 HEM SINGH KI PARED 376 1238 2100 Yes 2100 100 24 2200 368 NA NA NA NA NA
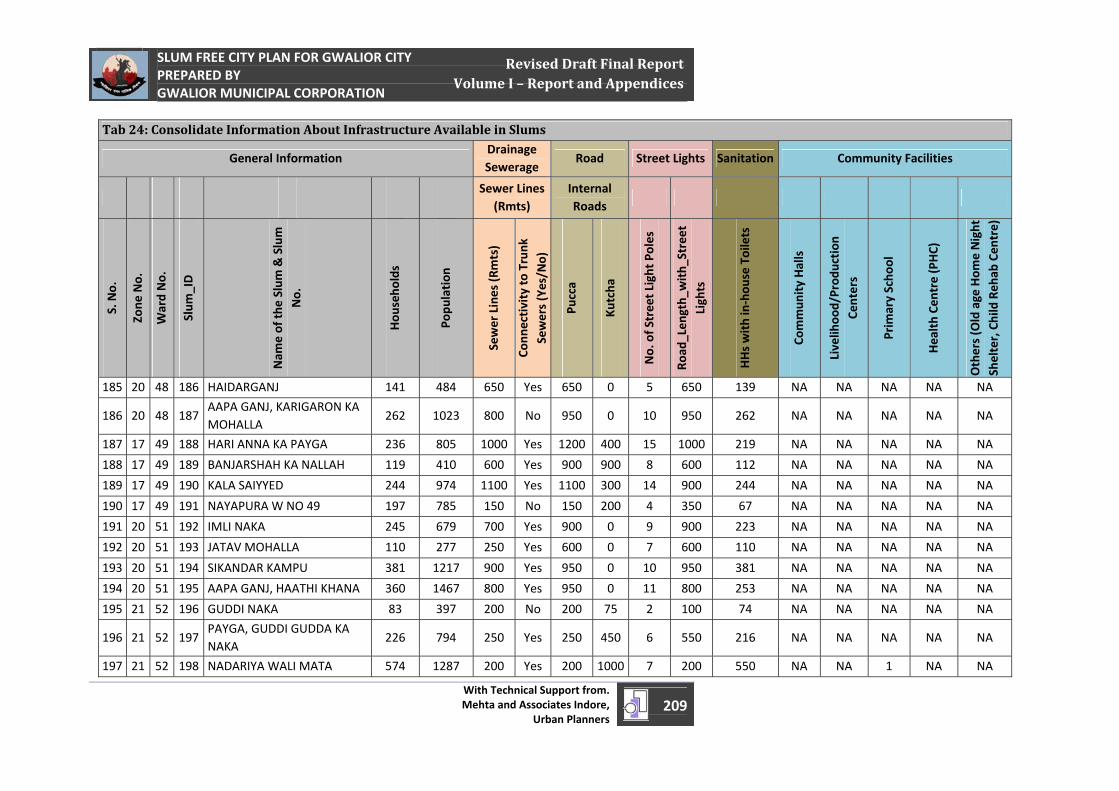
April 1, 2011
SLUM FREE CITY PLAN FOR GWALIOR CITY PREPARED BY GWALIOR MUNICIPAL CORPORATION
With Technical Support from. Mehta and Associates Indore,
Urban Planners209
Revised Draft Final Report Volume I – Report and Appendices
Tab 24: Consolidate Information About Infrastructure Available in Slums
General Information Drainage Sewerage
Road Street Lights Sanitation Community Facilities
Sewer Lines (Rmts)
Internal Roads
S. No.
Zone
No.
Ward No.
Slum
_ID
Nam
e of th
e Slum
& Slum
No.
Hou
seho
lds
Popu
lation
Sewer Lines (R
mts)
Conn
ectivity to
Trunk
Sewers (Yes/N
o)
Pucca
Kutcha
No. of Street Light Poles
Road
_Len
gth_
with_
Street
Lights
HHs with in‐hou
se Toilets
Commun
ity Halls
Livelih
ood/Prod
uction
Ce
nters
Prim
ary Scho
ol
Health Ce
ntre (P
HC)
Others (Old age Hom
e Night
Shelter, Child Reh
ab Cen
tre)
185 20 48 186 HAIDARGANJ 141 484 650 Yes 650 0 5 650 139 NA NA NA NA NA
186 20 48 187AAPA GANJ, KARIGARON KA MOHALLA
262 1023 800 No 950 0 10 950 262 NA NA NA NA NA
187 17 49 188 HARI ANNA KA PAYGA 236 805 1000 Yes 1200 400 15 1000 219 NA NA NA NA NA
188 17 49 189 BANJARSHAH KA NALLAH 119 410 600 Yes 900 900 8 600 112 NA NA NA NA NA
189 17 49 190 KALA SAIYYED 244 974 1100 Yes 1100 300 14 900 244 NA NA NA NA NA
190 17 49 191 NAYAPURA W NO 49 197 785 150 No 150 200 4 350 67 NA NA NA NA NA
191 20 51 192 IMLI NAKA 245 679 700 Yes 900 0 9 900 223 NA NA NA NA NA
192 20 51 193 JATAV MOHALLA 110 277 250 Yes 600 0 7 600 110 NA NA NA NA NA
193 20 51 194 SIKANDAR KAMPU 381 1217 900 Yes 950 0 10 950 381 NA NA NA NA NA
194 20 51 195 AAPA GANJ, HAATHI KHANA 360 1467 800 Yes 950 0 11 800 253 NA NA NA NA NA
195 21 52 196 GUDDI NAKA 83 397 200 No 200 75 2 100 74 NA NA NA NA NA
196 21 52 197PAYGA, GUDDI GUDDA KA NAKA
226 794 250 Yes 250 450 6 550 216 NA NA NA NA NA
197 21 52 198 NADARIYA WALI MATA 574 1287 200 Yes 200 1000 7 200 550 NA NA 1 NA NA

April 1, 2011
SLUM FREE CITY PLAN FOR GWALIOR CITY PREPARED BY GWALIOR MUNICIPAL CORPORATION
With Technical Support from. Mehta and Associates Indore,
Urban Planners210
Revised Draft Final Report Volume I – Report and Appendices
Tab 24: Consolidate Information About Infrastructure Available in Slums
General Information Drainage Sewerage
Road Street Lights Sanitation Community Facilities
Sewer Lines (Rmts)
Internal Roads
S. No.
Zone
No.
Ward No.
Slum
_ID
Nam
e of th
e Slum
& Slum
No.
Hou
seho
lds
Popu
lation
Sewer Lines (R
mts)
Conn
ectivity to
Trunk
Sewers (Yes/N
o)
Pucca
Kutcha
No. of Street Light Poles
Road
_Len
gth_
with_
Street
Lights
HHs with in‐hou
se Toilets
Commun
ity Halls
Livelih
ood/Prod
uction
Ce
nters
Prim
ary Scho
ol
Health Ce
ntre (P
HC)
Others (Old age Hom
e Night
Shelter, Child Reh
ab Cen
tre)
198 21 52 199 GUDDI UPAR 456 1372 1200 Yes 1200 600 10 1400 456 NA NA NA NA NA
199 21 52 200 BELLGAIYA KA PURA 74 283 550 Yes 550 50 7 600 69 NA NA NA NA NA
200 20 53 201 LAKKAD KHANA 70 234 250 Yes 250 0 4 250 69 NA NA NA NA NA
201 20 53 202 MUNSHIYON KA MOHALLA 113 493 100 Yes 140 0 0 0 80 NA NA NA NA NA
202 20 53 203 DEV NAGAR 128 557 140 Yes 160 0 3 160 121 NA NA NA NA NA
203 20 53 204 KARWARI MOHALLA 111 456 1000 Yes 1000 0 10 1000 109 NA NA NA NA NA
204 20 53 205 NAYAPURA W NO 53 87 386 600 Yes 800 0 8 800 59 NA NA 1 NA NA
205 20 53 206 INGALE KI GOTH 87 205 25 Yes 250 0 4 250 86 NA NA NA NA NA
206 20 53 207GANJI WALA MOHALLA W NO 53
147 380 250 Yes 300 150 4 300 118 NA NA NA NA NA
207 20 53 208 PAN PATTE KI GOTH 240 931 650 Yes 650 0 7 650 231 NA NA NA NA NA
208 20 53 209 RISHI NAGAR 43 217 130 Yes 130 0 3 130 43 NA NA NA NA NA
209 20 53 210 SURYA NAGAR 31 145 125 Yes 150 0 3 150 27 NA NA NA NA NA
210 21 54 211HARIJAN BASTI, JAWAHAR COLONY
80 361 800 Yes 1200 0 8 1200 28 NA NA NA NA NA
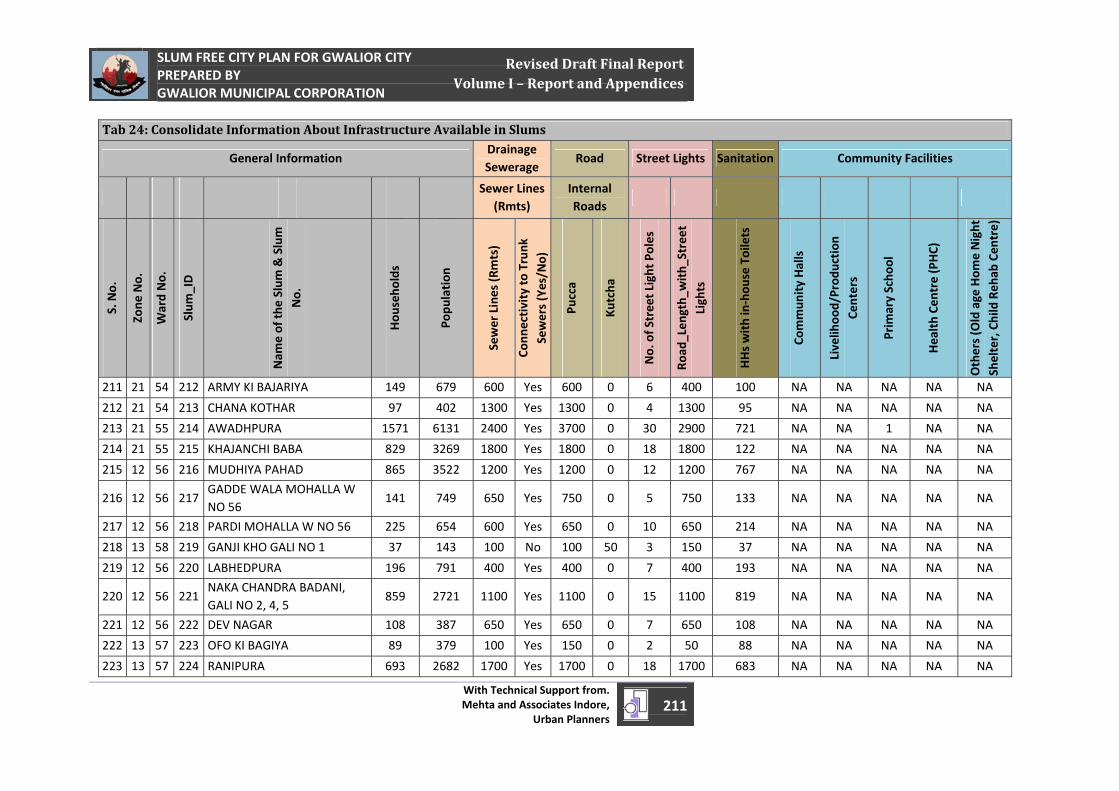
April 1, 2011
SLUM FREE CITY PLAN FOR GWALIOR CITY PREPARED BY GWALIOR MUNICIPAL CORPORATION
With Technical Support from. Mehta and Associates Indore,
Urban Planners211
Revised Draft Final Report Volume I – Report and Appendices
Tab 24: Consolidate Information About Infrastructure Available in Slums
General Information Drainage Sewerage
Road Street Lights Sanitation Community Facilities
Sewer Lines (Rmts)
Internal Roads
S. No.
Zone
No.
Ward No.
Slum
_ID
Nam
e of th
e Slum
& Slum
No.
Hou
seho
lds
Popu
lation
Sewer Lines (R
mts)
Conn
ectivity to
Trunk
Sewers (Yes/N
o)
Pucca
Kutcha
No. of Street Light Poles
Road
_Len
gth_
with_
Street
Lights
HHs with in‐hou
se Toilets
Commun
ity Halls
Livelih
ood/Prod
uction
Ce
nters
Prim
ary Scho
ol
Health Ce
ntre (P
HC)
Others (Old age Hom
e Night
Shelter, Child Reh
ab Cen
tre)
211 21 54 212 ARMY KI BAJARIYA 149 679 600 Yes 600 0 6 400 100 NA NA NA NA NA
212 21 54 213 CHANA KOTHAR 97 402 1300 Yes 1300 0 4 1300 95 NA NA NA NA NA
213 21 55 214 AWADHPURA 1571 6131 2400 Yes 3700 0 30 2900 721 NA NA 1 NA NA
214 21 55 215 KHAJANCHI BABA 829 3269 1800 Yes 1800 0 18 1800 122 NA NA NA NA NA
215 12 56 216 MUDHIYA PAHAD 865 3522 1200 Yes 1200 0 12 1200 767 NA NA NA NA NA
216 12 56 217GADDE WALA MOHALLA W NO 56
141 749 650 Yes 750 0 5 750 133 NA NA NA NA NA
217 12 56 218 PARDI MOHALLA W NO 56 225 654 600 Yes 650 0 10 650 214 NA NA NA NA NA
218 13 58 219 GANJI KHO GALI NO 1 37 143 100 No 100 50 3 150 37 NA NA NA NA NA
219 12 56 220 LABHEDPURA 196 791 400 Yes 400 0 7 400 193 NA NA NA NA NA
220 12 56 221NAKA CHANDRA BADANI, GALI NO 2, 4, 5
859 2721 1100 Yes 1100 0 15 1100 819 NA NA NA NA NA
221 12 56 222 DEV NAGAR 108 387 650 Yes 650 0 7 650 108 NA NA NA NA NA
222 13 57 223 OFO KI BAGIYA 89 379 100 Yes 150 0 2 50 88 NA NA NA NA NA
223 13 57 224 RANIPURA 693 2682 1700 Yes 1700 0 18 1700 683 NA NA NA NA NA

April 1, 2011
SLUM FREE CITY PLAN FOR GWALIOR CITY PREPARED BY GWALIOR MUNICIPAL CORPORATION
With Technical Support from. Mehta and Associates Indore,
Urban Planners212
Revised Draft Final Report Volume I – Report and Appendices
Tab 24: Consolidate Information About Infrastructure Available in Slums
General Information Drainage Sewerage
Road Street Lights Sanitation Community Facilities
Sewer Lines (Rmts)
Internal Roads
S. No.
Zone
No.
Ward No.
Slum
_ID
Nam
e of th
e Slum
& Slum
No.
Hou
seho
lds
Popu
lation
Sewer Lines (R
mts)
Conn
ectivity to
Trunk
Sewers (Yes/N
o)
Pucca
Kutcha
No. of Street Light Poles
Road
_Len
gth_
with_
Street
Lights
HHs with in‐hou
se Toilets
Commun
ity Halls
Livelih
ood/Prod
uction
Ce
nters
Prim
ary Scho
ol
Health Ce
ntre (P
HC)
Others (Old age Hom
e Night
Shelter, Child Reh
ab Cen
tre)
224 13 58 225 NIRDHAN NAGAR 154 281 450 Yes 450 0 6 450 152 NA NA NA NA NA
225 13 59 226 LABHEDPURA 549 2424 200 Yes 500 0 5 500 538 NA NA NA NA NA
226 13 59 227 VICKY FACTORY 267 837 200 No 200 350 3 200 41 NA NA NA NA NA
227 13 59 228 LALIYAPURA 50 150 150 No 300 0 0 300 0 NA NA NA NA NA
228 13 59 229 KHOTI GRAM 70 361 0 Yes 600 0 4 300 34 NA NA NA NA NA
229 13 59 230 BADI MADIYIAN 89 343 0 No 600 0 40 300 1 NA NA NA NA NA
230 13 59 231 CHOTI MADIYIAN 54 171 0 No 0 700 0 0 3 NA NA NA NA NA
231 13 59 232 NEEM CHANDOHA 160 642 750 Yes 750 100 8 800 160 NA NA NA NA NA
232 13 59 233 PARDI MOHALLA W NO 59 30 161 150 Yes 150 0 3 150 26 NA NA NA NA NA
233 14 60 234SCINDHIYA NAGAR, MARGHAT WALI PAHADI
594 2420 0 Yes 0 1250 0 0 115 NA NA NA NA NA
234 14 60 235 KOTE KI SARAY 85 310 0 No 0 400 3 200 85 NA NA NA NA NA
235 14 60 236 HURAWALI 687 2742 800 No 800 0 9 800 46 NA NA NA NA NA
236 14 60 237 HARKHEDA 88 269 0 Yes 0 500 6 500 88 NA NA NA NA NA
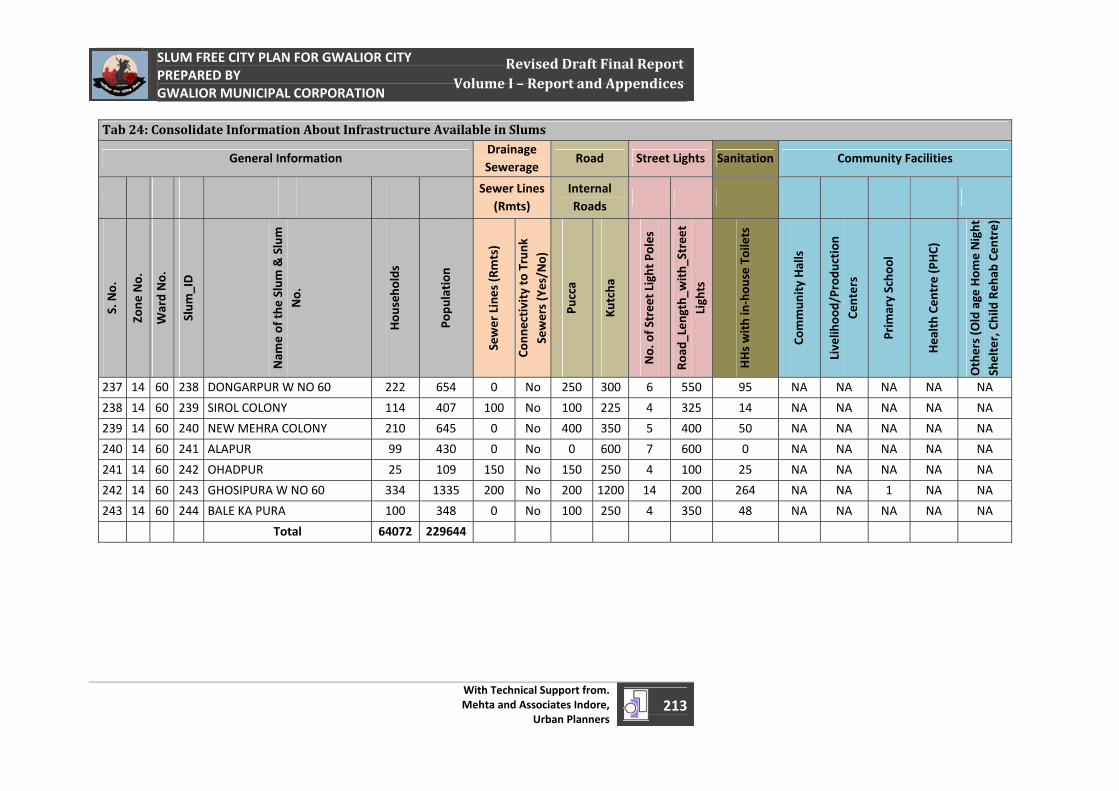
April 1, 2011
SLUM FREE CITY PLAN FOR GWALIOR CITY PREPARED BY GWALIOR MUNICIPAL CORPORATION
With Technical Support from. Mehta and Associates Indore,
Urban Planners213
Revised Draft Final Report Volume I – Report and Appendices
Tab 24: Consolidate Information About Infrastructure Available in Slums
General Information Drainage Sewerage
Road Street Lights Sanitation Community Facilities
Sewer Lines (Rmts)
Internal Roads
S. No.
Zone
No.
Ward No.
Slum
_ID
Nam
e of th
e Slum
& Slum
No.
Hou
seho
lds
Popu
lation
Sewer Lines (R
mts)
Conn
ectivity to
Trunk
Sewers (Yes/N
o)
Pucca
Kutcha
No. of Street Light Poles
Road
_Len
gth_
with_
Street
Lights
HHs with in‐hou
se Toilets
Commun
ity Halls
Livelih
ood/Prod
uction
Ce
nters
Prim
ary Scho
ol
Health Ce
ntre (P
HC)
Others (Old age Hom
e Night
Shelter, Child Reh
ab Cen
tre)
237 14 60 238 DONGARPUR W NO 60 222 654 0 No 250 300 6 550 95 NA NA NA NA NA
238 14 60 239 SIROL COLONY 114 407 100 No 100 225 4 325 14 NA NA NA NA NA
239 14 60 240 NEW MEHRA COLONY 210 645 0 No 400 350 5 400 50 NA NA NA NA NA
240 14 60 241 ALAPUR 99 430 0 No 0 600 7 600 0 NA NA NA NA NA
241 14 60 242 OHADPUR 25 109 150 No 150 250 4 100 25 NA NA NA NA NA
242 14 60 243 GHOSIPURA W NO 60 334 1335 200 No 200 1200 14 200 264 NA NA 1 NA NA
243 14 60 244 BALE KA PURA 100 348 0 No 100 250 4 350 48 NA NA NA NA NA
Total 64072 229644
April 1, 2011
SLUM FREE CITY PLAN FOR GWALIOR CITY PREPARED BY GWALIOR MUNICIPAL CORPORATION
With Technical Support from. Mehta and Associates Indore,
Urban Planners 214
Revised Draft Final Report Volume I – Report and Appendices
Household Survey Format – Appendix – A B
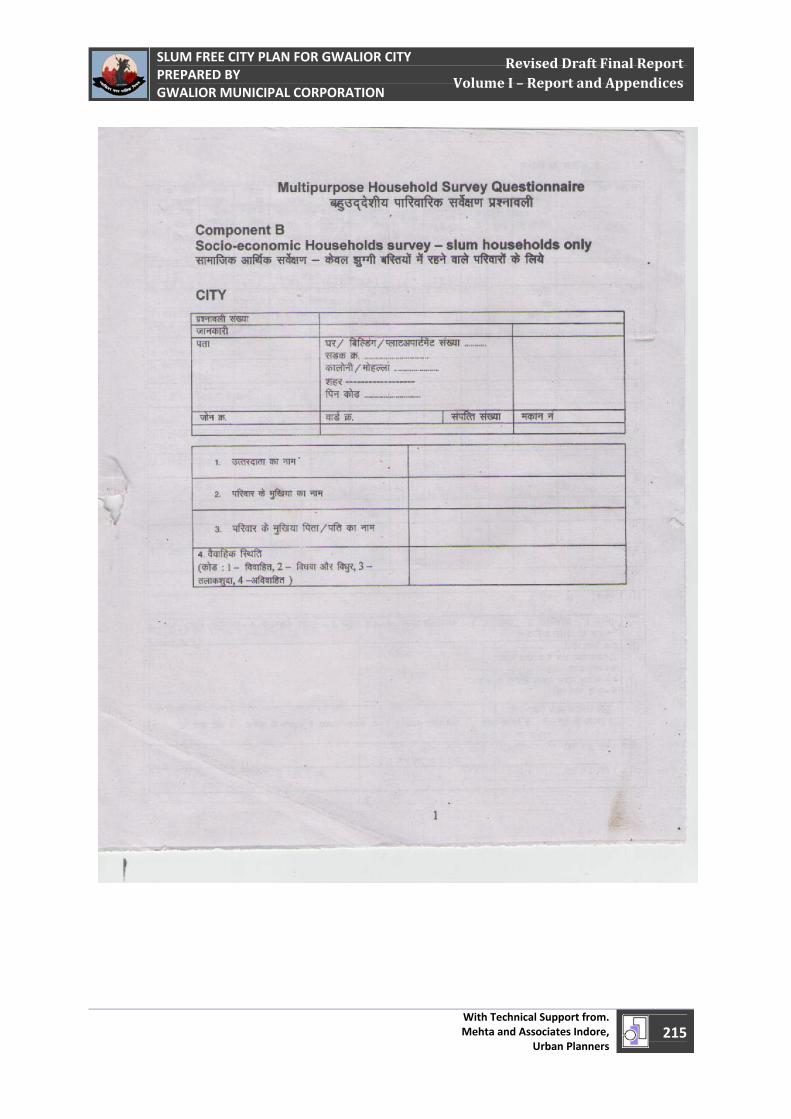
April 1, 2011
SLUM FREE CITY PLAN FOR GWALIOR CITY PREPARED BY GWALIOR MUNICIPAL CORPORATION
With Technical Support from. Mehta and Associates Indore,
Urban Planners 215
Revised Draft Final Report Volume I – Report and Appendices
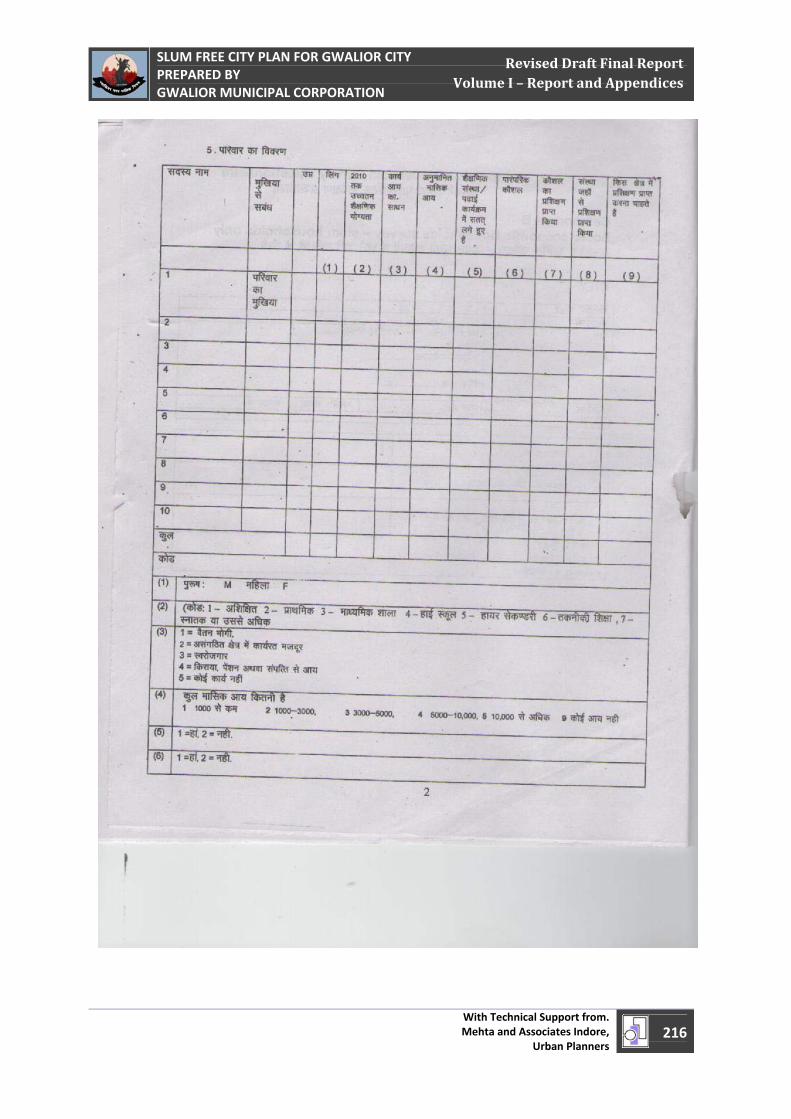
April 1, 2011
SLUM FREE CITY PLAN FOR GWALIOR CITY PREPARED BY GWALIOR MUNICIPAL CORPORATION
With Technical Support from. Mehta and Associates Indore,
Urban Planners 216
Revised Draft Final Report Volume I – Report and Appendices
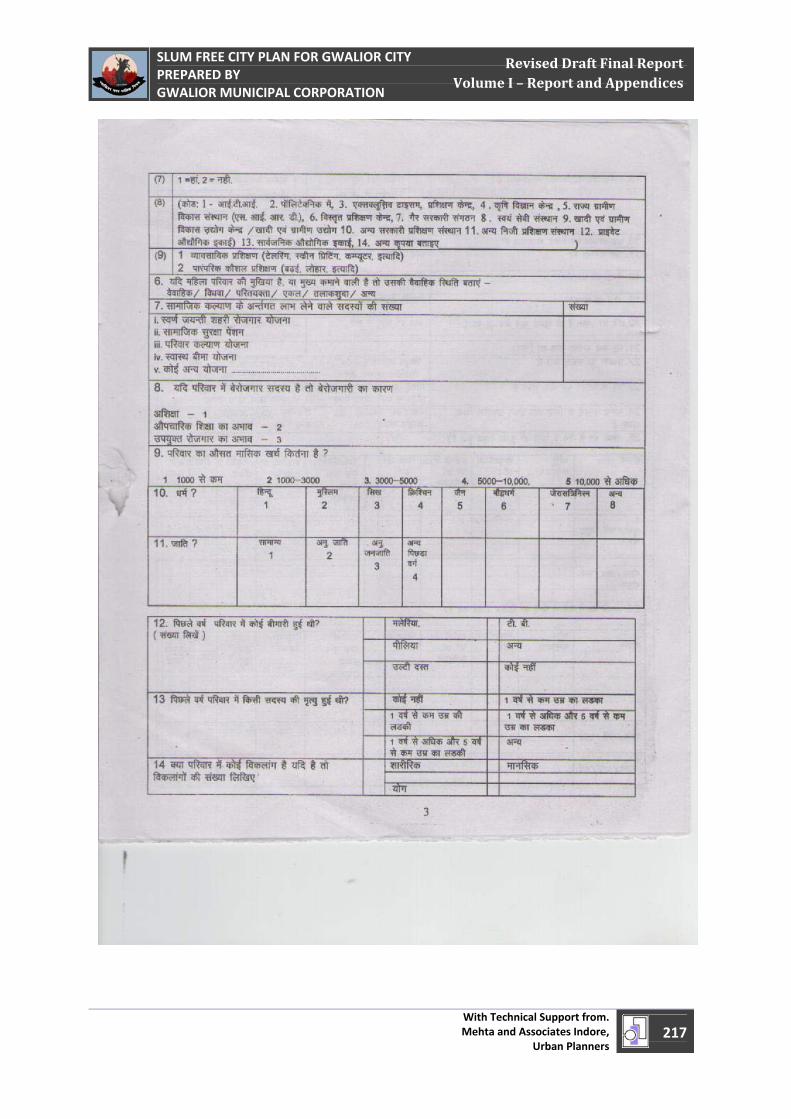
April 1, 2011
SLUM FREE CITY PLAN FOR GWALIOR CITY PREPARED BY GWALIOR MUNICIPAL CORPORATION
With Technical Support from. Mehta and Associates Indore,
Urban Planners 217
Revised Draft Final Report Volume I – Report and Appendices
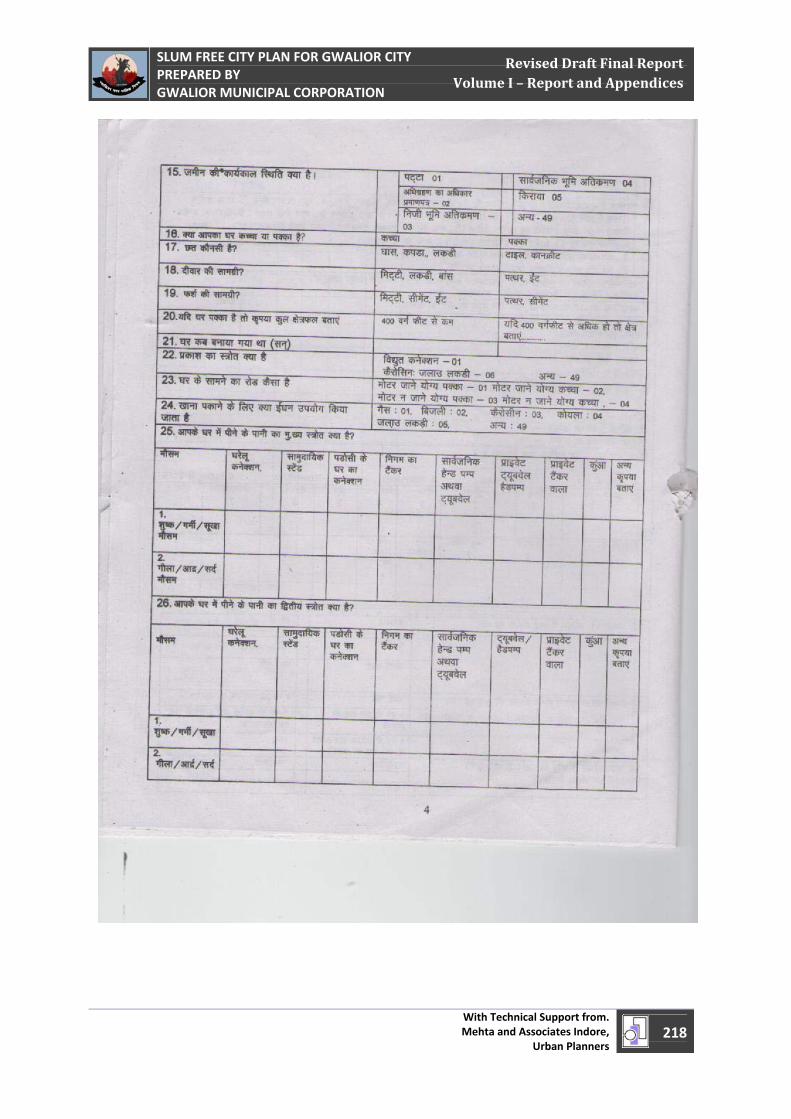
April 1, 2011
SLUM FREE CITY PLAN FOR GWALIOR CITY PREPARED BY GWALIOR MUNICIPAL CORPORATION
With Technical Support from. Mehta and Associates Indore,
Urban Planners 218
Revised Draft Final Report Volume I – Report and Appendices
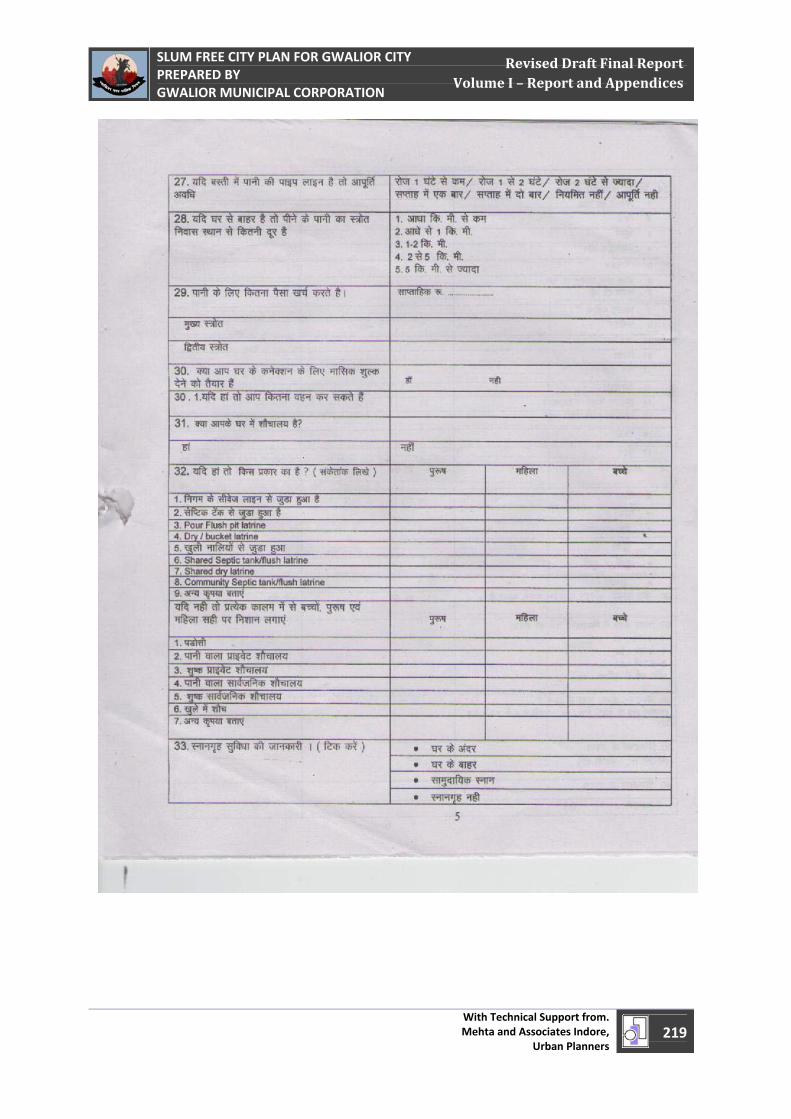
April 1, 2011
SLUM FREE CITY PLAN FOR GWALIOR CITY PREPARED BY GWALIOR MUNICIPAL CORPORATION
With Technical Support from. Mehta and Associates Indore,
Urban Planners 219
Revised Draft Final Report Volume I – Report and Appendices
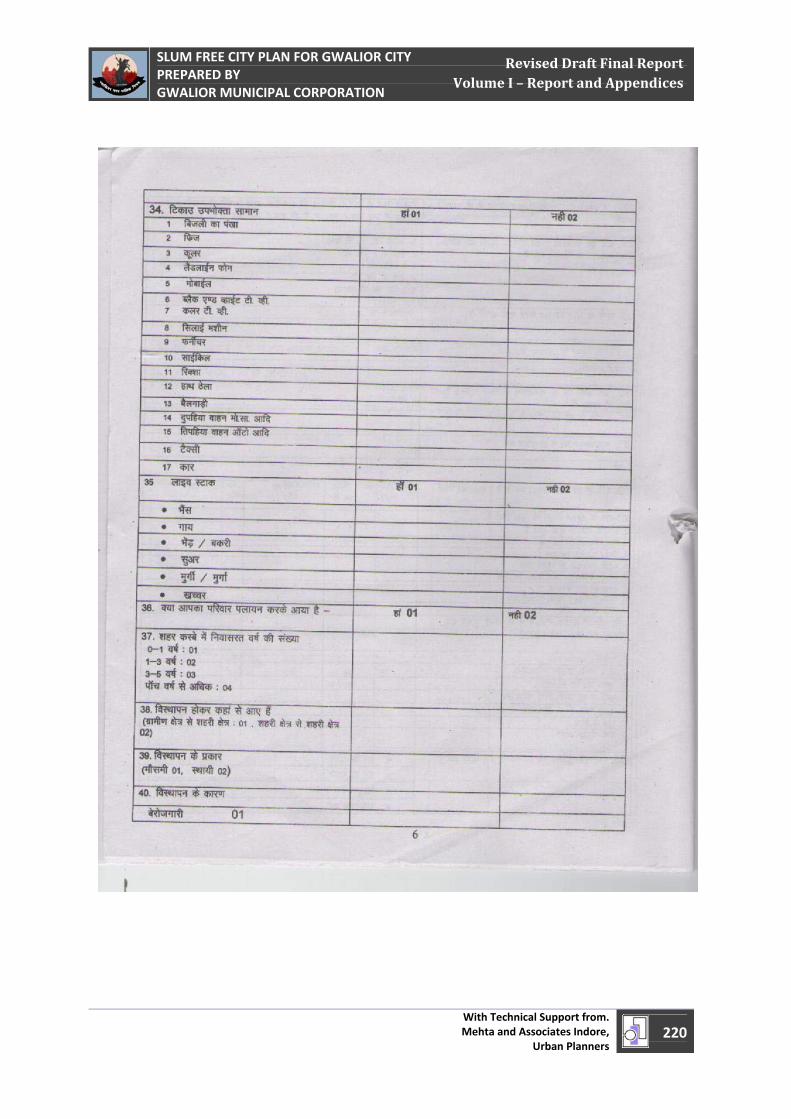
April 1, 2011
SLUM FREE CITY PLAN FOR GWALIOR CITY PREPARED BY GWALIOR MUNICIPAL CORPORATION
With Technical Support from. Mehta and Associates Indore,
Urban Planners 220
Revised Draft Final Report Volume I – Report and Appendices
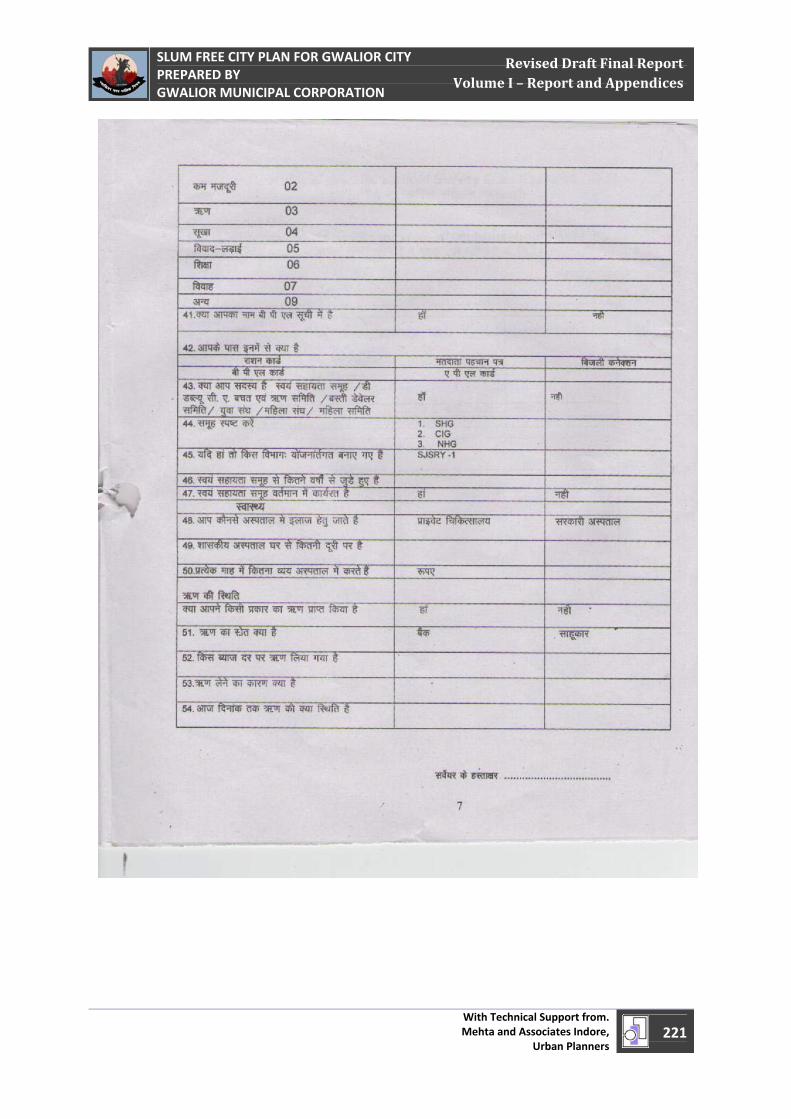
April 1, 2011
SLUM FREE CITY PLAN FOR GWALIOR CITY PREPARED BY GWALIOR MUNICIPAL CORPORATION
With Technical Support from. Mehta and Associates Indore,
Urban Planners 221
Revised Draft Final Report Volume I – Report and Appendices
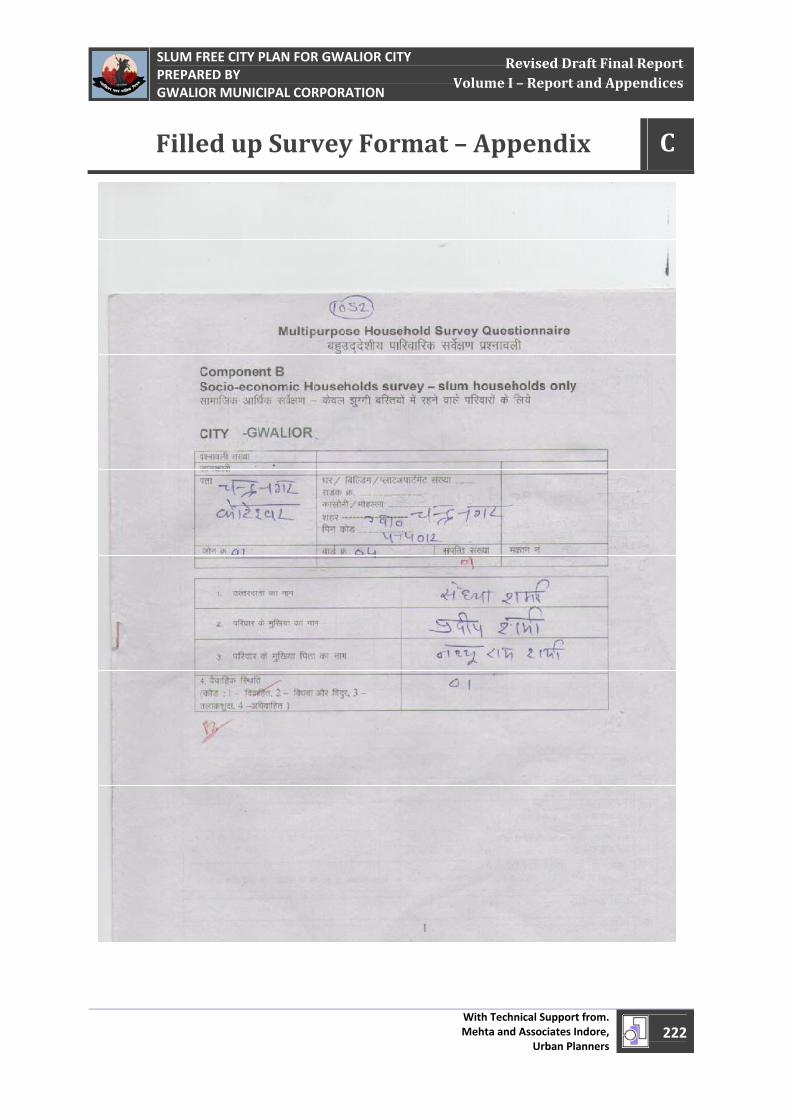
April 1, 2011
SLUM FREE CITY PLAN FOR GWALIOR CITY PREPARED BY GWALIOR MUNICIPAL CORPORATION
With Technical Support from. Mehta and Associates Indore,
Urban Planners 222
Revised Draft Final Report Volume I – Report and Appendices
Filled up Survey Format – Appendix – B C
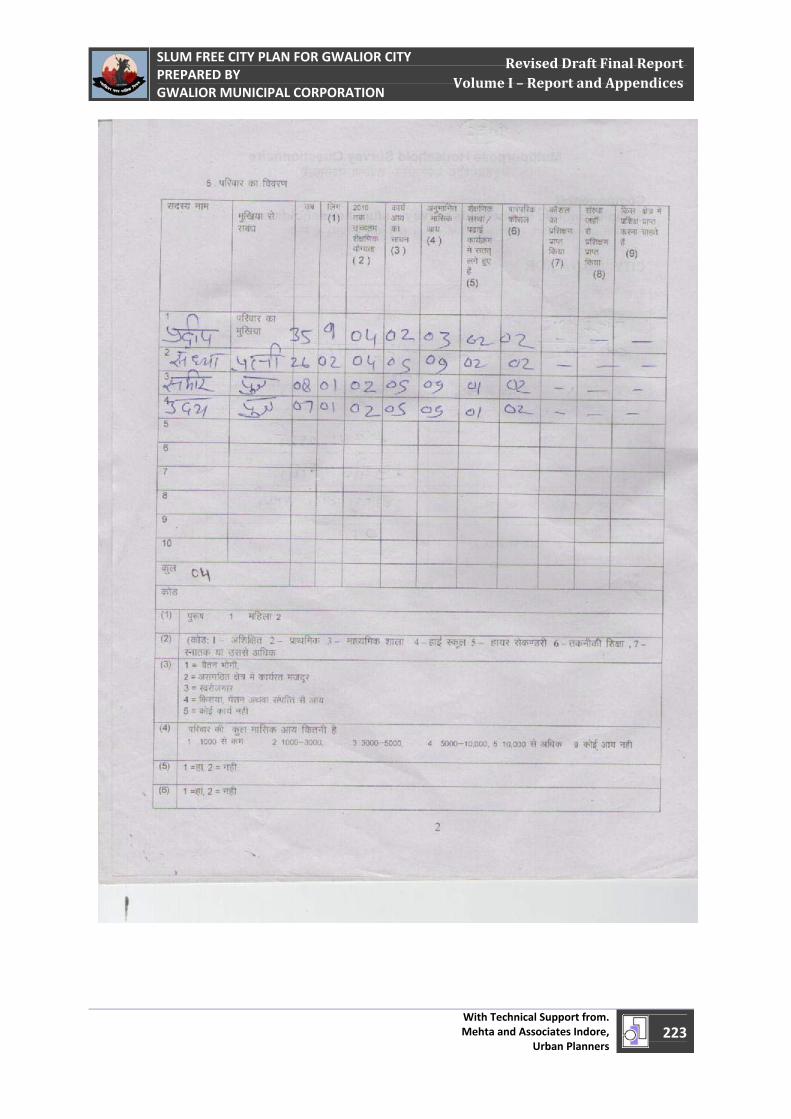
April 1, 2011
SLUM FREE CITY PLAN FOR GWALIOR CITY PREPARED BY GWALIOR MUNICIPAL CORPORATION
With Technical Support from. Mehta and Associates Indore,
Urban Planners 223
Revised Draft Final Report Volume I – Report and Appendices
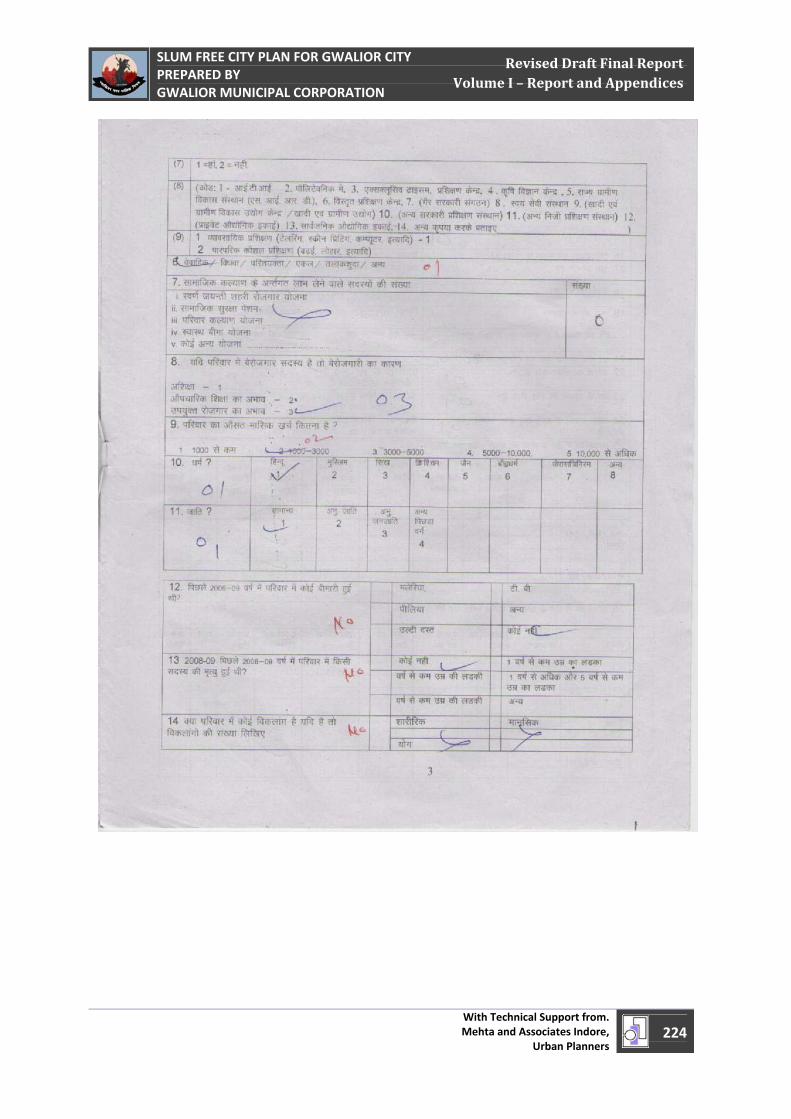
April 1, 2011
SLUM FREE CITY PLAN FOR GWALIOR CITY PREPARED BY GWALIOR MUNICIPAL CORPORATION
With Technical Support from. Mehta and Associates Indore,
Urban Planners 224
Revised Draft Final Report Volume I – Report and Appendices
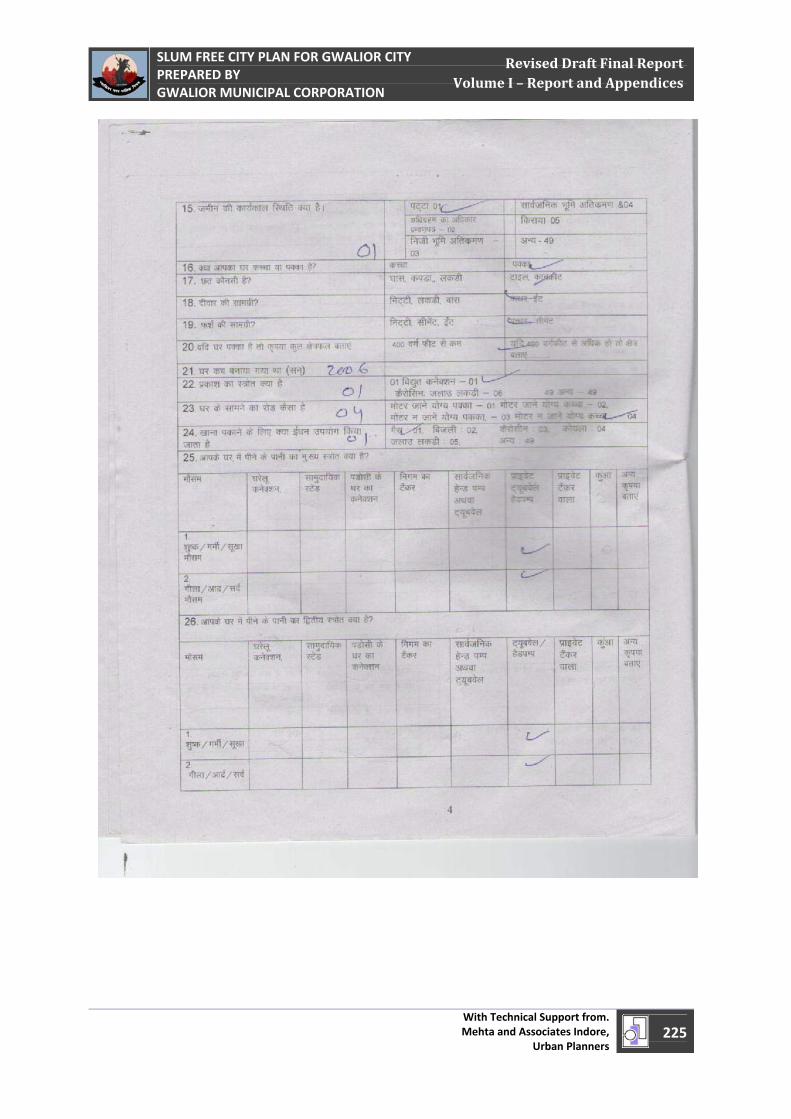
April 1, 2011
SLUM FREE CITY PLAN FOR GWALIOR CITY PREPARED BY GWALIOR MUNICIPAL CORPORATION
With Technical Support from. Mehta and Associates Indore,
Urban Planners 225
Revised Draft Final Report Volume I – Report and Appendices
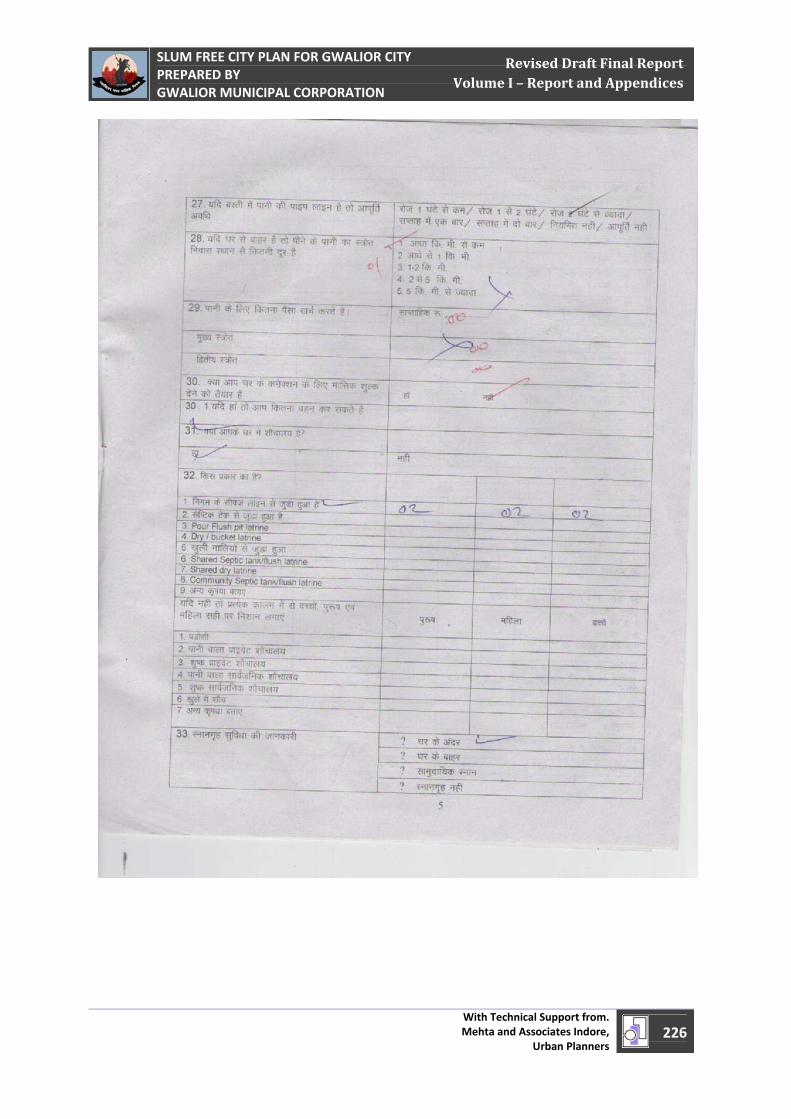
April 1, 2011
SLUM FREE CITY PLAN FOR GWALIOR CITY PREPARED BY GWALIOR MUNICIPAL CORPORATION
With Technical Support from. Mehta and Associates Indore,
Urban Planners 226
Revised Draft Final Report Volume I – Report and Appendices
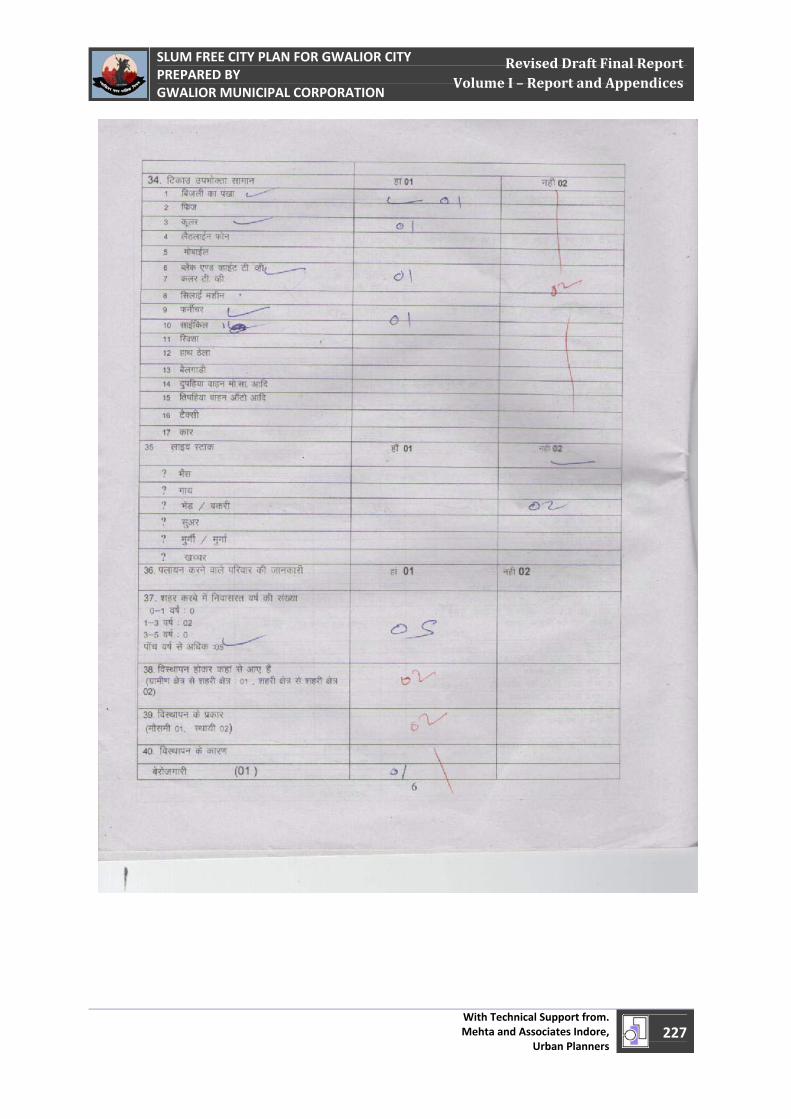
April 1, 2011
SLUM FREE CITY PLAN FOR GWALIOR CITY PREPARED BY GWALIOR MUNICIPAL CORPORATION
With Technical Support from. Mehta and Associates Indore,
Urban Planners 227
Revised Draft Final Report Volume I – Report and Appendices
April 1, 2011
SLUM FREE CITY PLAN FOR GWALIOR CITY PREPARED BY GWALIOR MUNICIPAL CORPORATION
With Technical Support from. Mehta and Associates Indore,
Urban Planners 228
Revised Draft Final Report Volume I – Report and Appendices
Dwg. No – 1 Location of Slums in Gwalior City
Dwg. No – 2 Slum Pockets on Georeferenced City Base Map
Dwg. No – 3 Gwalior Development Plan 2005
Dwg. No – 4 Tenability Status of Slums
Dwg. No – 5 Tenure Status of Slums Households
Dwg. No – 6 Land Ownership Status of Slums
Dwg. No – 7 Residential Density of Slums
Dwg. No – 8 Tenable Area Density of Tenable/Partly Tenable Slums
Dwg. No – 9 Land Value Range for Slums (Collectorate Guideline
201011)
Dwg. No – 10 % of Kuchha Dwellings Units in Slums
Dwg. No – 11 Housing Condition Status of Slums
Dwg. No – 12 Infrastructure/Service Level Status of Slums
Dwg. No – 13 Socioeconomic Condition Status of Slums
Dwg. No – 14 3X3X3 Matrix Analysis Results for Slums
Dwg. No – 15 Resulting Interventions in Slums as per 3X3X3 Matrix
Analyses
Dwg. No – 16 Proposed Strategies for Existing Slums
Dwg. No – 17 Proposed Development Options for Existing Slums
Dwg. No – 18 Year wise Up gradation Priority in Slums
Dwg. No – 19 Year wise Redevelopment Priority in Slums
Dwg. No – 20 Year wise Relocation Priority in Slums
Dwg. No – 21 Year wise Implementation Priority in Slums
Drawings Appendix – C D