GLUTAMINYL CYCLASE INHIBITION ATTENUATES … · 1 Supplementary Information to: GLUTAMINYL CYCLASE...
13
1 Supplementary Information to: GLUTAMINYL CYCLASE INHIBITION ATTENUATES PYROGLUTAMATE Aβ AND ALZHEIMER’S DISEASE-LIKE PATHOLOGY Stephan Schilling, Ulrike Zeitschel, Torsten Hoffmann, Ulrich Heiser, Mike Francke, Astrid Kehlen, Max Holzer, Birgit Hutter-Paier, Manuela Prokesch, Manfred Windisch, Wolfgang Jagla, Dagmar Schlenzig, Christiane Lindner, Thomas Rudolph, Gunter Reuter, Holger Cynis, Dirk Montag, Hans-Ulrich Demuth, Steffen Roßner SUPPLEMENTARY FIGURES Supplementary Figure 1. Experimental Design and QC Inhibitor Characteristics (a) A total number of 180 APP transgenic Tg2576 mice were used for this study. Mice were randomly assigned to 3 experimental groups: vehicle-treated, PBD150 low dose-treated and PBD150 high dose-treated (60 mice each). The 60 mice of each pharmacological treatment were assigned to three different treatment periods (20 mice per substance per treatment period) to test for the effects of QC inhibition on the concentrations of Aβ before the onset of amyloid plaque formation (prophylactic treatment I), to study the effects of QC inhibition on Aβ, on amyloid plaque formation and on gliosis (prophylactic treatment II), or treatment of old mice at the time of amyloid plaque formation (therapeutic treatment). The 20 mice of each experimental group in each treatment period were used for Aβ ELISAs (n=8), biochemical analysis (n=8) and for immunohistochemistry (n=4). Additionally, 28 TASD-41 mice at the age of 4 months were treated with the high dose of PBD150 or vehicle (n=14, each) for 3 months and used for Aβ ELISAs (n=10) or immunohistochemistry (n=4). Aβ transgenic Drosophila were treated with PBD150 in the first 4 weeks of life and subjected to Aβ ELISAs. (b) Compound characteristics of the competitive QC inhibitor. PBD150 is an imidazole- thiourea derivative with a K i value of 173 ±20 nM for murine QC. A logBB value of –1.6 was determined for the compound. Inhibitor concentrations were: 1.6 μM (open circles); 0.8 μM (filled circles); 0.4 μM (open squares); 0.2 μM (filled squares); 0.1 μM (open triangles) and 0 μM (filled triangles). (c) Demonstration of PBD150 inhibitory specificity for QC. PBD150 dose-dependently reduces QC activity with 22% remaining QC activity at an inhibitor concentration of 10 μM. Even a ten-fold higher PBD150 concentration does not affect the enzymatic activities of enzymes involved in Aβ degradation such as neprilysin (NEP), insulin-degrading enzyme (IDE) or aminopeptidase N (APN). Also, the enzymatic activity of the β-secretase BACE1 is not affected by QC inhibition.
Transcript of GLUTAMINYL CYCLASE INHIBITION ATTENUATES … · 1 Supplementary Information to: GLUTAMINYL CYCLASE...

1
Supplementary Information to: GLUTAMINYL CYCLASE INHIBITION ATTENUATES PYROGLUTAMATE Aβ AND ALZHEIMER’S DISEASE-LIKE PATHOLOGY Stephan Schilling, Ulrike Zeitschel, Torsten Hoffmann, Ulrich Heiser, Mike Francke, Astrid Kehlen, Max Holzer, Birgit Hutter-Paier, Manuela Prokesch, Manfred Windisch, Wolfgang Jagla, Dagmar Schlenzig, Christiane Lindner, Thomas Rudolph, Gunter Reuter, Holger Cynis, Dirk Montag, Hans-Ulrich Demuth, Steffen Roßner SUPPLEMENTARY FIGURES Supplementary Figure 1. Experimental Design and QC Inhibitor Characteristics (a) A total number of 180 APP transgenic Tg2576 mice were used for this study. Mice were randomly assigned to 3 experimental groups: vehicle-treated, PBD150 low dose-treated and PBD150 high dose-treated (60 mice each). The 60 mice of each pharmacological treatment were assigned to three different treatment periods (20 mice per substance per treatment period) to test for the effects of QC inhibition on the concentrations of Aβ before the onset of amyloid plaque formation (prophylactic treatment I), to study the effects of QC inhibition on Aβ, on amyloid plaque formation and on gliosis (prophylactic treatment II), or treatment of old mice at the time of amyloid plaque formation (therapeutic treatment). The 20 mice of each experimental group in each treatment period were used for Aβ ELISAs (n=8), biochemical analysis (n=8) and for immunohistochemistry (n=4). Additionally, 28 TASD-41 mice at the age of 4 months were treated with the high dose of PBD150 or vehicle (n=14, each) for 3 months and used for Aβ ELISAs (n=10) or immunohistochemistry (n=4). Aβ transgenic Drosophila were treated with PBD150 in the first 4 weeks of life and subjected to Aβ ELISAs. (b) Compound characteristics of the competitive QC inhibitor. PBD150 is an imidazole-thiourea derivative with a Ki value of 173 ±20 nM for murine QC. A logBB value of –1.6 was determined for the compound. Inhibitor concentrations were: 1.6 µM (open circles); 0.8 µM (filled circles); 0.4 µM (open squares); 0.2 µM (filled squares); 0.1 µM (open triangles) and 0 µM (filled triangles). (c) Demonstration of PBD150 inhibitory specificity for QC. PBD150 dose-dependently reduces QC activity with 22% remaining QC activity at an inhibitor concentration of 10 µM. Even a ten-fold higher PBD150 concentration does not affect the enzymatic activities of enzymes involved in Aβ degradation such as neprilysin (NEP), insulin-degrading enzyme (IDE) or aminopeptidase N (APN). Also, the enzymatic activity of the β-secretase BACE1 is not affected by QC inhibition.
2
Supplementary Figure 1:
0 20 400
2
4
6
0 1 2[PBD150] µM
Slo
pe
PBD150
N
N
NH
HN
S
O
O
1/[H-Gln-AMC] (mM–1)
1/v
(min
µM
–1)
Ki =173±20 nMlogBB(determ.) = -1.6
b
I. 6-month-treatment of young Tg2576 mice
0 4 10 mo
prophylactic treatment a
II. 10-month-treatment of young Tg2576 mice
0 6 16 mo
prophylactic treatment
III. 6-month-treatment of old Tg2576 mice
0 10 16 mo
therapeutic treatment
IV. Prophylactic 3-month-treatment of young TASD-41 mice
0 4 7 mo
V. 4-week-treatment of Aβ Drosophila
0 4 we
Effects of PDB150 on different enzymes
0
50
100
150
enzy
mat
icac
tivity
(%)
QC NEP IDE APN BACE1
PBD150 [µM]: 0.1 1 10 100
c
0 20 400
2
4
6
0 1 2[PBD150] µM
Slo
pe
PBD150
N
N
NH
HN
S
O
O
1/[H-Gln-AMC] (mM–1)
1/v
(min
µM
–1)
Ki =173±20 nMlogBB(determ.) = -1.6
b
0 20 400
2
4
6
0 1 2[PBD150] µM
Slo
pe
PBD150
N
N
NH
HN
S
O
O
1/[H-Gln-AMC] (mM–1)
1/v
(min
µM
–1)
Ki =173±20 nMlogBB(determ.) = -1.6
b
I. 6-month-treatment of young Tg2576 mice
0 4 10 mo
prophylactic treatment a
II. 10-month-treatment of young Tg2576 mice
0 6 16 mo
prophylactic treatment
III. 6-month-treatment of old Tg2576 mice
0 10 16 mo
therapeutic treatment
IV. Prophylactic 3-month-treatment of young TASD-41 mice
0 4 7 mo
V. 4-week-treatment of Aβ Drosophila
0 4 we
Effects of PDB150 on different enzymes
0
50
100
150
enzy
mat
icac
tivity
(%)
QC NEP IDE APN BACE1
PBD150 [µM]: 0.1 1 10 100
c Effects of PDB150 on different enzymes
0
50
100
150
enzy
mat
icac
tivity
(%)
QC NEP IDE APN BACE1
PBD150 [µM]: 0.1 1 10 100
c

3
Supplementary Figure 2. Influence of QC-Inhibition on APP Expression and α-Secretase processing There are no effects of the QC inhibitor PBD150 on the total APP concentration measured by the antibody 22C11 or on the α-secretase-processed APP quantified by the antibody 6E10 in any of the chronic treatment paradigms applied to Tg2576 mice (left column). Moreover, an organotypic brain slice culture model as described recently1 was used to reveal acute effects of PBD150 on APP expression and processing. Treatment of Tg2575 brain slice cultures by 10 µM of PBD150 (black bars) did not affect the APP content in brain slices (right top panel) nor the secretion of APP or α-secretase-processed APP (right bottom panel) from brain slices into the culture medium.
APP secretion from Tg2576 brain slice cultures
0
5
10
15
20
25
APP
sec
rete
d(r
el. u
nits
)
22C11 6E10
APP in Tg2576 brain slices
0
5
10
15
APP
con
tent
(rel
. uni
ts)
22C11 6E10
Prophylactic treatment month 4-10
0
50
100
150
APP
con
tent
(% o
f con
trol
)
22C11 6E10
0
50
100
150
APP
con
tent
(% o
f con
trol
)
22C11 6E10
Prophylactic treatment month 6-16
0
50
100
150
APP
con
tent
(% o
f con
trol
)
22C11 6E10
Control PBD150 lc PBD150 hc
Therapeutic treatment month 10-16
APP secretion from Tg2576 brain slice cultures
0
5
10
15
20
25
APP
sec
rete
d(r
el. u
nits
)
22C11 6E10
APP secretion from Tg2576 brain slice cultures
0
5
10
15
20
25
APP
sec
rete
d(r
el. u
nits
)
22C11 6E10
APP in Tg2576 brain slices
0
5
10
15
APP
con
tent
(rel
. uni
ts)
22C11 6E10
APP in Tg2576 brain slices
0
5
10
15
APP
con
tent
(rel
. uni
ts)
22C11 6E10
Prophylactic treatment month 4-10
0
50
100
150
APP
con
tent
(% o
f con
trol
)
22C11 6E10
Prophylactic treatment month 4-10
0
50
100
150
APP
con
tent
(% o
f con
trol
)
22C11 6E10
0
50
100
150
APP
con
tent
(% o
f con
trol
)
22C11 6E10
Prophylactic treatment month 6-16
0
50
100
150
APP
con
tent
(% o
f con
trol
)
22C11 6E10
Prophylactic treatment month 6-16
0
50
100
150
APP
con
tent
(% o
f con
trol
)
22C11 6E10
Control PBD150 lc PBD150 hc
Therapeutic treatment month 10-16
0
50
100
150
APP
con
tent
(% o
f con
trol
)
22C11 6E10
Control PBD150 lc PBD150 hc
Therapeutic treatment month 10-16
4
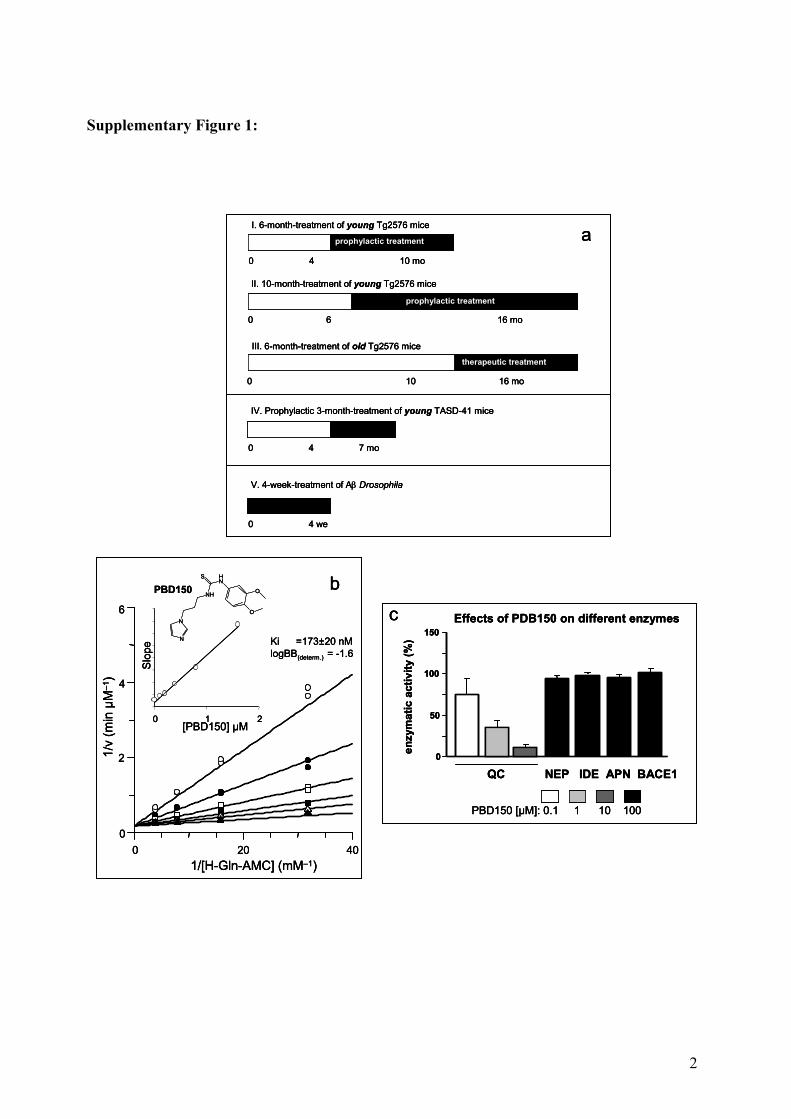
Supplementary Figure 3. Therapeutic Treatment of Tg2576 Mice from Month 10–16 (a) Quantification of Aβ concentrations in brains of 16-month-old Tg2576 control mice (white bars) and of age-matched littermates treated for 6 months after the onset of amyloid plaque formation (therapeutic treatment) with the QC inhibitor PBD150 at a concentration of 2.4 mg (PBD150 lc, grey bars) or of 7.2 mg (PBD150 hc, black bars) per g food pellets. QC inhibition resulted in dose-dependent slight to moderate reductions of Aβ3(pE)–42 formation. In contrast to the prophylactic treatments, reductions of Aβ3(pE)–42 were not accompanied by lower concentrations of Aβx–42 and Aβx–40. (b) Immunohistochemical detection of Aβ plaques in 16-month-old control mice and of age-matched littermates treated for 6 months with the QC inhibitor PBD150 at 2.4 mg (PBD150 lc) or of 7.2 mg (PBD150 hc) per g food pellets. Top two rows: diaminobenzidine (DAB) staining of Aβ plaques with the antibodies 4G8 and 6E10. There was no change in astrocytic activation (GFAP labeling, red fluorescence) but reduced microglial (bio-GSA, red fluorescence) labeling after PBD150 treatment. The scale bar applies to all images. (c) Quantification of the Aβ plaque load in brain sections revealed only a moderate, but statistically non-significant, reduction in Aβ deposition after PBD150 treatment. (d) Conditioned fear test performed at the end of the treatment period. There was a statistically non-significant improved context fear memory. Data are expressed as mean ± SEM.
Control PBD150 lc PBD150 hc
d Conditioned fear
0
10
20
30
40
50
Con
text
mem
ory
(%)
b Control PBD150 lc PBD150 hc
6E10
+b-G
SA
4
G8+
GFA
P
Th
iofla
vin
S6E
10
4G
8
100 µm
Aβ p
laqu
elo
ad(%
)
0
2
4
6
8
10
4G8 6E10
c Aβ plaque load
Aβ3(
pE)-
42(n
g g–
1 ) A
β x-4
2(µ
g g–
1 )
0
2
4
6
8
10
0
20
40
60
80
100
Aβ3(pE)-42 Aβx-42 Aβx-40
Aβ
x-40 (µg g–1)
a Aβ ELISA
Control PBD150 lc PBD150 hc
d Conditioned fear
0
10
20
30
40
50
Con
text
mem
ory
(%)
Control PBD150 lc PBD150 hc
d Conditioned fear
0
10
20
30
40
50
Con
text
mem
ory
(%)
b Control PBD150 lc PBD150 hc
6E10
+b-G
SA
4
G8+
GFA
P
Th
iofla
vin
S6E
10
4G
8
100 µm
b Control PBD150 lc PBD150 hc
6E10
+b-G
SA
4
G8+
GFA
P
Th
iofla
vin
S6E
10
4G
8
100 µm
Aβ p
laqu
elo
ad(%
)
0
2
4
6
8
10
4G8 6E10
c Aβ plaque load
Aβ p
laqu
elo
ad(%
)
0
2
4
6
8
10
4G8 6E10
c Aβ plaque load
Aβ3(
pE)-
42(n
g g–
1 ) A
β x-4
2(µ
g g–
1 )
0
2
4
6
8
10
0
20
40
60
80
100
Aβ3(pE)-42 Aβx-42 Aβx-40
Aβ
x-40 (µg g–1)
a Aβ ELISA
Aβ3(
pE)-
42(n
g g–
1 ) A
β x-4
2(µ
g g–
1 )
0
2
4
6
8
10
0
20
40
60
80
100
Aβ3(pE)-42 Aβx-42 Aβx-40
Aβ
x-40 (µg g–1)
a Aβ ELISA

5
Supplementary Figure 4. Assessment of Spatial Memory of TASD-41 Mice in a Morris-Water-Maze Test (a) The swimming speed of APP transgenic TASD-41 mice and wildtype littermates did not differ throughout the training period. Additionally, PBD150 treatment did not affect swimming speed at any time point. (b) The reduction in swimming path length between training day 1 and training day 4 was significantly higher in PBD150-treated transgenic mice than in untreated transgenic mice (* P<0.05). PBD150 had no effect on the shortening of the swimming path length in wildtype mice, indicating a specific effect of PBD150 in transgenic mice via reduction of Aβ3(pE)–42 peptides. (c) There was no effect of genotype or PBD150 treatment on the number of probe trial crossings in the Morris water maze test.
swim
min
gsp
eed
(m s
–1)
Tg control Tg treatment WT control WT treatment
0.00
0.05
0.10
0.15
0.20
Day 1 Day 2 Day 3 Day 4
Morris water maze TASD-41swimming speed
a
0
2
4
6
8
num
bero
f cro
ssin
gs
Tg cont. Tg treat. WT cont. WT treat.
Morris water maze TASD-41probe trial crossings
c
0.0
1.0
2.0
3.0
4.0
Diff
eren
cepa
thle
ngth
day
1 to
day
4
Tg cont. Tg treat. WT cont. WT treat.
Morris water maze TASD-41reduction in swim path length
b
*sw
imm
ing
spee
d(m
s–1
)
Tg control Tg treatment WT control WT treatment
0.00
0.05
0.10
0.15
0.20
Day 1 Day 2 Day 3 Day 4
Morris water maze TASD-41swimming speed
a
swim
min
gsp
eed
(m s
–1)
Tg control Tg treatment WT control WT treatment
0.00
0.05
0.10
0.15
0.20
Day 1 Day 2 Day 3 Day 4
Morris water maze TASD-41swimming speed
a
0
2
4
6
8
num
bero
f cro
ssin
gs
Tg cont. Tg treat. WT cont. WT treat.
Morris water maze TASD-41probe trial crossings
c
0
2
4
6
8
num
bero
f cro
ssin
gs
Tg cont. Tg treat. WT cont. WT treat.
Morris water maze TASD-41probe trial crossings
c
0.0
1.0
2.0
3.0
4.0
Diff
eren
cepa
thle
ngth
day
1 to
day
4
Tg cont. Tg treat. WT cont. WT treat.
Morris water maze TASD-41reduction in swim path length
b
*
0.0
1.0
2.0
3.0
4.0
Diff
eren
cepa
thle
ngth
day
1 to
day
4
Tg cont. Tg treat. WT cont. WT treat.
Morris water maze TASD-41reduction in swim path length
b
*
6
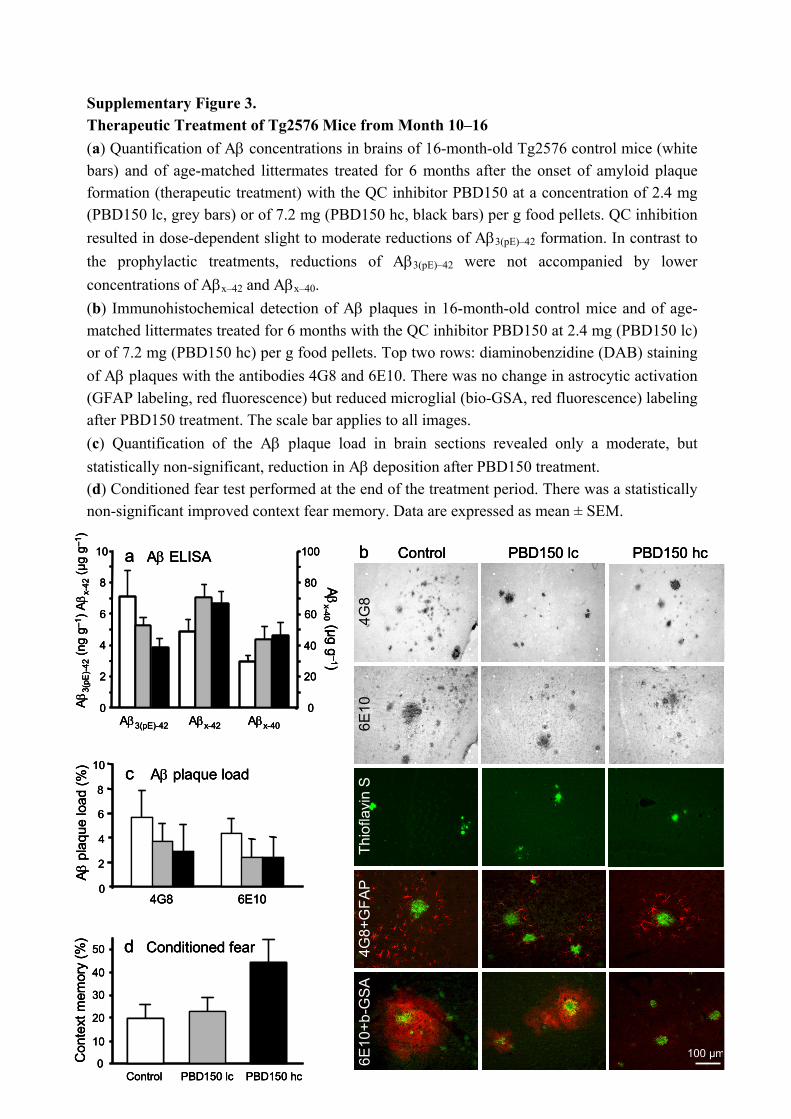
Supplementary Figure 5. Aggregation of and Seeding by Aβ3(pE)–40 (a) Demonstration of the seeding capacity of Aβ3(pE)–40 peptides. Top panel: The initial aggregation rate of Aβ1-40 is accelerated by Aβ3(pE)–40 peptides dose-dependently as measured by Thioflavin T assay. The total Aβ concentration was 50 µM in all assays. Bottom panel: Electron microscopic images of Aβ fibrils formed under the different assay conditions. While incubation of Aβ1–40 alone led to the formation of fewer but long fibrils, the addition of Aβ3(pE)–
40 peptides resulted in the appearance of more, shorter fibrils; consistent with Aβ3(pE)–40 peptides acting as seeds for fibril formation. (b) The QC inhibitor used in this study, PBD150, did not affect the aggregation kinetics or total aggregation levels of Aβ peptides as shown for Aβ3(pE)–40 and for Aβ1–40 at the endpoint of the Thioflavin T assay.
a Aβ1-40 aggregation - seeding by Aβ3(pE)-40
Aβ1-40 Aβ1-40 (10% Aβ3(pE)-40) Aβ1-40 (40% Aβ3(pE)-40) Aβ3(pE)-40
1000 nm
200 nm
0 50 100 150 200 250 3000
500
1000
1500
2000
t [h]
Thio
flavi
nT
assa
y(R
FU) Aβ1-40 Aβ3(pE)-40
100 0
90 10
60 40
0 100
b No effect of PBD150 on Aβ aggregation
0 100 200 3000
200
400 Aβ3(pE)-40 50 µM
Thio
flavi
nT
assa
y(R
FU)
0 100 2000
200
400
600 Aβ1-40 50 µM
Thio
flavi
nT
assa
y(R
FU)
t [h]
no PBD150 10 µM PBD150 100 µM PBD150
a Aβ1-40 aggregation - seeding by Aβ3(pE)-40
Aβ1-40 Aβ1-40 (10% Aβ3(pE)-40) Aβ1-40 (40% Aβ3(pE)-40) Aβ3(pE)-40
1000 nm
200 nm
0 50 100 150 200 250 3000
500
1000
1500
2000
t [h]
Thio
flavi
nT
assa
y(R
FU) Aβ1-40 Aβ3(pE)-40
100 0
90 10
60 40
0 100
a Aβ1-40 aggregation - seeding by Aβ3(pE)-40
Aβ1-40 Aβ1-40 (10% Aβ3(pE)-40) Aβ1-40 (40% Aβ3(pE)-40) Aβ3(pE)-40
1000 nm
200 nm
Aβ1-40 Aβ1-40 (10% Aβ3(pE)-40) Aβ1-40 (40% Aβ3(pE)-40) Aβ3(pE)-40
1000 nm
200 nm
0 50 100 150 200 250 3000
500
1000
1500
2000
t [h]
Thio
flavi
nT
assa
y(R
FU) Aβ1-40 Aβ3(pE)-40
100 0
90 10
60 40
0 100
b No effect of PBD150 on Aβ aggregation
0 100 200 3000
200
400 Aβ3(pE)-40 50 µM
Thio
flavi
nT
assa
y(R
FU)
0 100 2000
200
400
600 Aβ1-40 50 µM
Thio
flavi
nT
assa
y(R
FU)
t [h]
no PBD150 10 µM PBD150 100 µM PBD150
b No effect of PBD150 on Aβ aggregation
0 100 200 3000
200
400 Aβ3(pE)-40 50 µM
Thio
flavi
nT
assa
y(R
FU)
0 100 2000
200
400
600 Aβ1-40 50 µM
Thio
flavi
nT
assa
y(R
FU)
t [h]
no PBD150 10 µM PBD150 100 µM PBD150
7
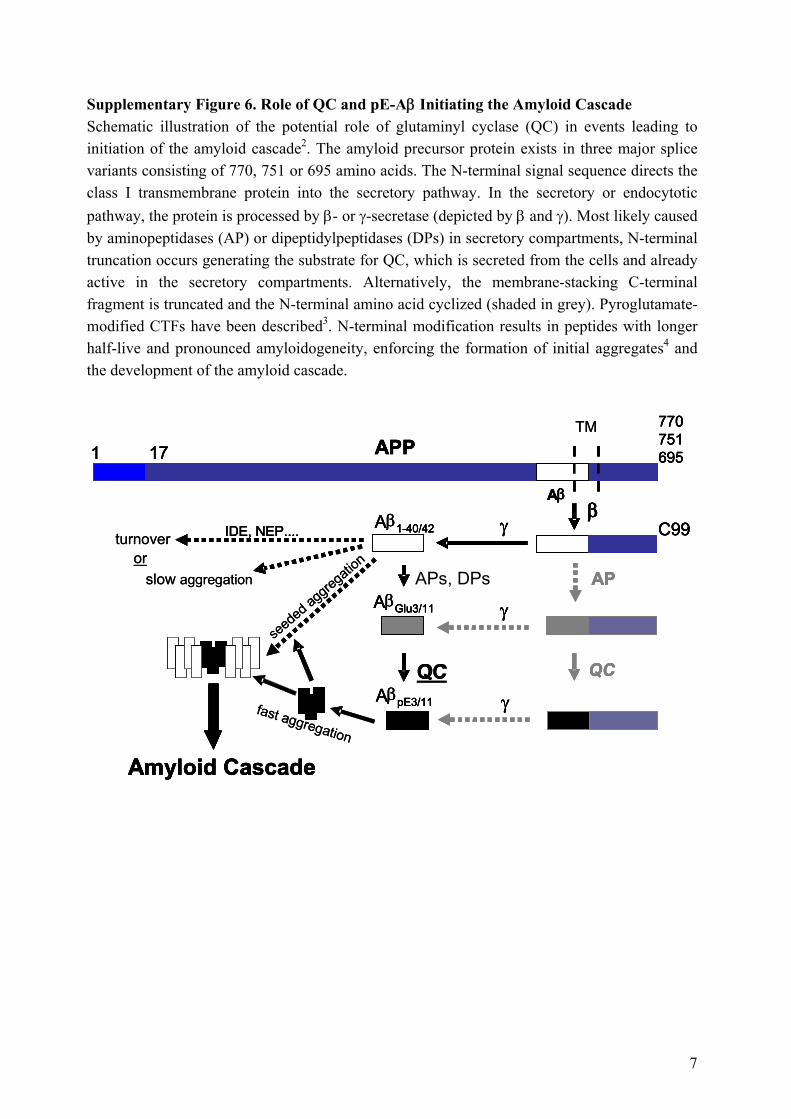
Supplementary Figure 6. Role of QC and pE-Aβ Initiating the Amyloid Cascade Schematic illustration of the potential role of glutaminyl cyclase (QC) in events leading to initiation of the amyloid cascade2. The amyloid precursor protein exists in three major splice variants consisting of 770, 751 or 695 amino acids. The N-terminal signal sequence directs the class I transmembrane protein into the secretory pathway. In the secretory or endocytotic pathway, the protein is processed by β- or γ-secretase (depicted by β and γ). Most likely caused by aminopeptidases (AP) or dipeptidylpeptidases (DPs) in secretory compartments, N-terminal truncation occurs generating the substrate for QC, which is secreted from the cells and already active in the secretory compartments. Alternatively, the membrane-stacking C-terminal fragment is truncated and the N-terminal amino acid cyclized (shaded in grey). Pyroglutamate-modified CTFs have been described3. N-terminal modification results in peptides with longer half-live and pronounced amyloidogeneity, enforcing the formation of initial aggregates4 and the development of the amyloid cascade.
Aβ
7707516951 17
γβ
AP
C99Aβ1-40/42
AP, (AβGlu3/11 γ
AβpE3/11fast aggregation
APP
QC QC
γ
Amyloid Cascade
IDE, NEP....
Aβ
7707516951 17
γβ
TM
AP
C99Aβ1-40/42
APs, DPsAβGlu3/11 γ
slow aggregation
turnover
AβpE3/11
APP
QC QC
γ
Amyloid Cascade
seede
d aggreg
ation
IDE, NEP....
or
Aβ
7707516951 17
γβ
AP
C99Aβ1-40/42
AP, (AβGlu3/11 γ
AβpE3/11fast aggregation
APP
QC QC
γ
Amyloid Cascade
IDE, NEP....
Aβ
7707516951 17
γβ
TM
AP
C99Aβ1-40/42
APs, DPsAβGlu3/11 γ
slow aggregation
turnover
AβpE3/11
APP
QC QC
γ
Amyloid Cascade
seede
d aggreg
ation
IDE, NEP....
or
8
SUPPLEMENTARY METHODS Human brain tissue The definite diagnosis of AD for all cases used in this study was based on the presence of neurofibrillary tangles and neuritic plaques in the hippocampal formation and neocortical areas and met the criteria of the National Institute of Neurologic and Communicative Disorders and Stroke (NINDS) and the Alzheimer’s Disease and Related Disorders Association (ADRDA)5. Cortical tissue (Brodmann area 22) from the same cases was used for the quantification of QC mRNA concentrations, QC protein and Aβ3(pE)–42. In total, 10 control cases and 10 AD cases each of Braak staging I–II and V–VI were analyzed. The groups were matched for gender and age (control: mean 72 years ± 6.6 years; AD I–II: mean 73 years ± 3.1 years; AD V–VI: mean 77 years ± 6.6 years). The mean post mortem interval (PMI) was similar among the groups and ranged from 26 to 96 hours. The duration of PMI was neither related to the detection of QC by Western blot analysis nor to quantification of Aβ by ELISA. For QC mRNA detection by qRT-PCR, only tissue samples with a PMI below 48 hours were included. QC mRNA quantification and QC Western blot analysis Tissue samples were homogenized by means of the homogenizer Precellys with 1.4 mm ceramic beads (5000 rpm, 30 sec, peqlab). RNA was isolated using the NucleoSpin RNA II kit (Macherey Nagel) according to the manufacturer’s instructions. Constant 100 ng of RNA were reversely transcribed to cDNA using random primers (Roche) and Superscript II (Invitrogen). Quantitative real-time PCR was performed in a Rotorgene3000 (Corbett Research) using the QuantiTect Primer Assay for QPCT (QT00013881, Qiagen) as well as the QuantiTect SYBR Green RT-PCR kit (Qiagen). Absolute amounts of QC were determined using six dilutions of the external QC standard DNA (full length QC cloned in the pcDNA3.1 vector) in duplicate. For verification of the PCR, product melting curves were generated and single amplicons were confirmed by agarose gel electrophoresis. Absolute amounts were determined with the Rotorgene software version 4.6 in quantitation mode. Normalization was done against the two most stably expressed housekeeping genes HPRT and GAPDH (geNorm). For Western-Blot analysis, the brain samples (50 mg) were homogenized in buffer (1 ml) containing 10 mM Tris pH 7.5, 100 mM NaCl, 5 mM EDTA and 0.5% Triton X-100 and 10% glycerol. The tissue was homogenized by several strokes in Dounce-homogenizer and subjected to 3 x 10 s of ultrasonic shock. The resulting homogenate was cleared by centrifugation at 20,000 x g for 25 min. A total of 12 µg protein of each sample was separated in Tris-Glycine SDS-PAGE. QC was detected using purified rabbit polyclonal antibodies raised against recombinant human QC. For visualization, blot membranes were incubated with secondary antibody conjugated with horseradish peroxidase (Cell Signaling) in TBS-T containing 5% (w/v) dry milk and subsequently developed using the SuperSignal West Pico System (Pierce) according to the manufacturer’s protocol. Cultivation, transfection and QC inhibitor treatment of HEK cells Human embryonic kidney cells HEK293 were cultured in DMEM (10% FBS) in a humidified atmosphere of 5% CO2 at 37°C. Cells were co-transfected with the APP695 variant APP-NLE6
9
and human QC using Lipofectamin2000 (Invitrogen). The transfected cells were incubated for 24 h in assay medium (DMEM, w/o phenol-red, w/o FBS) in absence or presence of 0.1 µM and 1 µM QC-inhibitor PBD150. The next day, the supernatant was collected and Complete Mini protease inhibitor cocktail (Roche) supplemented with additional 1 mM AEBSF (Roth) was added. The samples were stored at –80 °C. In vitro assays of enzymatic activities after QC inhibitor treatment In order to reveal any effects of the QC inhibitor PBD150 on other enzymes involved in Aβ generation or degradation we measured the respective enzymatic activities at the highest PBD150 concentration (100 µM) tolerated by the cells with a toxicity below 10%. Aminopeptidase N (APN; porcine kidney, Calbiochem) enzymatic activity was determined using 40 mM HEPES buffer, pH 7.6 and Ala-pNA (63 µM) as substrate. Release of pNA was monitored continuously at 405 nm. BACE-1 (human, recombinant, Oncogen research products) activity was determined using a 40 mM sodium acetate buffer pH 4.5 and the fluorescence quenched beta secretase substrate VI (Calbiochem) at a concentration of 1 µM. The enzymatic reaction was performed at 37°C and stopped after 60 min by addition of 1 M HCl. Fluorescence was measured using at Ex/Em of 420/520 nm. The enzymatic activity of insulin degrading enzyme (IDE; rat, recombinant, Calbiochem) was determined using a 25 mM potassium phosphate buffer pH 7.3 and the fluorescence quenched substrate Abz-GGFLRKVGQED-Dnp (23.5 µM). The enzymatic reaction was performed at 37°C and substrate cleavage was monitored continuously at Ex/Em of 325/410 nm. The activity of neutral endopeptidase (NEP; porcine kidney, Calbiochem) was determined using a 40 mM HEPES buffer pH 7.6 and Suc-Ala-Ala-Phe-pNA (211 µM, Bachem) as substrate. APN was used as auxiliary enzyme. Release of pNA was monitored at 405 nm. Animals A total number of 180 Tg2576 mice7 (B6/SJL, human APPsw695-transgen) was used for this study. The Tg2576 mice were kept on mixed B6/SJL genetic background, by crossing Tg males on B6/SJL mixed background with wild type females on B6/SJL F1 background. This results in hemicygote Tg2576 mice with regard to the hAPP gene. Animals were housed at a 12 hours day/12 hours night cycle with free access to tab water and food pellets supplemented with the following test compounds: no supplement (control), 2.4 mg/g of the QC inhibitor PBD150 (low concentration), 7.2 mg/g of the QC inhibitor PBD150 (high concentration). Animals were treated for three different periods of time (Supplementary Fig. 1 online). Food consumption was monitored twice a week and the animal weight was taken every second week. The initial treatment paradigms of the Tg2576 mice from month 4–10 and 10–16 were performed with female mice only. In the following treatment studies of Tg2576 (months 6–16), male and female mice were enrolled. TASD-41 mice8,9 (C57/Bl6 hybrid) were housed in individually ventilated cages (IVCs) under a constant light-cycle (12 hours light/dark). Normal tap water was available to the animals ad libitum. Food pellets supplemented with 7.2 mg/g of the QC inhibitor PBD150 or without inhibitor were provided. Animals were 4 months ± 2 weeks old at the time when treatment via food pellets started. Mice were treated for 12
10
consecutive weeks and also during the evaluation of the behavior in the Morris water maze. Male and female TASD-41 mice were enrolled in the treatment studies. Male Tg2576 and TASD-41 mice were housed individually; cages with females contained a maximum of five mice. Behavioral testing For conditioned fear testing of Tg2576 and TASD-41 mice, the experimental protocol used by Comery et al.10 and Jacobsen et al.11 for the study of Tg2576 mice was followed closely. Mice were trained and tested on two consecutive days. Training consisted of placing the subject in an operant chamber and allowing exploration for 2 min. Afterwards, an auditory cue was presented for 15 sec followed by a foot shock for 2 sec (1.5 mA un-pulsed). This procedure was repeated, and mice were returned to the home cage 30 sec later. 24 hours after training, mice were returned to the same chamber in which training occurred (context), and freezing behavior (immobility) was recorded. At the end of the 5 min context test, mice were returned to their home cage. One hour later, mice were placed in a novel environment and freezing behavior (immobility) was recorded for 3 min. The auditory cue (CS) was then presented for 3 min and freezing behavior (immobility) was recorded. Freezing scores are expressed as percentage for each portion of the test. The Morris water maze task was conducted in a black circular pool of 100 cm diameter. Tap water was filled and a temperature of 22 ± 1°C was maintained. During the whole test session the platform was located in the southwest quadrant of the pool. Each mouse had to perform three trials on four consecutive days. A single trial lasted for a maximum of one minute. During this time, the mouse had the chance to find the hidden, diaphanous target. If the animal did not find the platform the investigator guided to or placed the mouse on it at the end of each trial. After each trial, mice were allowed to rest on the platform for 10–15 sec. For the quantification of escape latency (the time [second] - the mouse needed to find the hidden platform and therefore to escape from the water), of pathway (the length of the trajectory [meter] to reach the target) and of the abidance in the goal quadrant a computerized tracking system was used. The computer was connected to a camera placed above the centre of the pool. The camera detected the signal of the light emitting diode (LED), which was fixed with a little hairgrip on the mouse tail in a manner not interfering with the swimming ability. Recording of swimming path and escape latency is initiated automatically as soon as the LED (= tail of the mouse) is in the starting area. Monitoring stops when the mouse sits on the platform for more than 2 sec. Tissue preparation At the end of the treatment period, 1 day after the behavioral testing was completed, 4 mice of each experimental group were anaesthetized with pentobarbital and perfused transcardially with 25 ml phosphate-buffered saline (PBS, 0.01 M; pH 7.4) followed by perfusion with 25 ml 4% paraformaldehyde in phosphate buffer (PB, 0.01 M; pH 7.4). The brains were removed from the skull and postfixed by immersion in the same fixative overnight at 4°C. After cryoprotection the brains were frozen and coronal sections (30 µm thick) were cut on a sliding microtome and collected in PBS.

11
Brain samples for ELISA Mice were sacrificed by CO2 inhalation, the brains were removed from the skull, flushed with ice cold saline and placed shortly on filter paper. Brain tissue without cerebellum was homogenized in TBS (20 mM Tris, 137 mM NaCl, pH 7.6) containing protease inhibitor cocktail (Complete Mini, Roche), sonicated and centrifuged at 75,500 x g for 1 hour at 4°C. The supernatant was stored at –80°C and Aβ peptides were sequentially extracted with TBS/1% Triton X-100 (TBS/triton fraction), 2% SDS in distilled water (SDS fraction), and 70% formic acid (formic acid fraction). The combined SDS and FA fractions were considered as the insoluble pool of Aβ. Aβx–40, Aβx–42 and Aβ3(pE)–42 specific sandwich ELISAs (all from IBL, Hamburg) were performed according to the manufacturer’s manual. Immunohistochemical Analysis of Human Brain Samples Frozen human brain tissue was fixed with HOPE fixative (Hepes Glutamic Acid Buffer Mediated Organic Solvent Protection Effect, DCS Innovative Diagnostic-Systems, Germany) for 3 days at 4°C, dehydrated in acetone and transferred to low melting paraffin. After antigen-retrieval (5 minutes in 10 mM citrate buffer pH6 at 94°C), 5 µm sections were used for immunohistochemical staining with Aβ3(pE)-specific antibody (Clone 6, mAb mouse, dilution 1:2,500) and Aβ-specific antibody (4G8 mAb mouse, dilution 1:2,500, Calbiochem) for 2 h at room temperature. Biotinylated anti-mouse IgG (BA 9200, Vector Laboratories) was used as a secondary antibody. Sections were incubated for 40 minutes at room temperature followed by detection with ABC (Vectastain ABC-Kit standard, PK-6100, Vector Laboratories) and Diaminobenzidine (DAB-Substrate Kit, SK-4100, Vector Laboratories). Immuno- and lectin histochemistry Immunohistochemistry to detect Aβ peptides was performed using the antibodies 6E10 (Chemicon) and biotinylated antibody 4G8 (Signet). Microglial cells were detected with the biotinylated lectin Griffonia simplicifolia agglutinin isolectin B4 (bio-GSA, Sigma). Depending on the Aβ double labeling procedure, astrocytes were detected with mouse GFAP-specific or with rabbit GFAP-specific antibodies (both from Sigma). For single labeling procedures, primary antibodies were visualized with secondary horseradish peroxidase-conjugated antibodies and the diaminobenzidine reaction in the presence of H2O2. In dual fluorescent immunolabeling procedures, brain sections were incubated with cocktails of primary antibodies from different species (i.e. mouse Aβ−specific and rabbit GFAP-specific, antibodies for example) overnight at 4°C. On the next day, sections were washed and then incubated with cocktails of fluorochromated secondary antibodies (i.e. Cy3-conjugated goat rabbit-specific and Cy2-conjugated goat mouse-specifc antibody, for example) for 90 minutes at room temperature. Brain sections were washed extensively, mounted on slides and cover slipped. Laser scanning microscopy (LSM 510, Zeiss, Oberkochen, Germany) was performed to reveal co-localization of glial cells and Aβ plaques.

12
Generation of transgenic Drosophila The prepro-mTRH-Aβ constructs encoding Aβ1–42 and Aβ3(Q)–42 were cloned into a pUAST expression vector containing P element repeats and white as a marker gene. The sequence was verified and used for DNA injection into Drosophila embryos. The insertion of the DNA into germ line chromosomes was mediated by P element transposase. Transgenic lines were selected in the F2 generation. For transgene production, a white isogenized Drosophila line was used. Males of five different transgenic lines expressing Aβ1–42 or Aβ3(Q)–42 were crossed to females of driver line P{GawB}elavC155 (Bloomington Stock 458). At the age of about 50 days, 100 transgenic flies were collected. The Aβ content was determined by ELISA following SDS- and formic acid extraction. Two fly lines were selected for the treatment experiments. For treatment, PBD150 was applied to the released medium containing the brood immediately after removing parental animals. Hatched flies were transferred to new medium once a week to avoid cross breeding with their offspring. After 4 weeks, heads of treated and untreated flies were collected, the Aβ was extracted by 2% SDS and 70% formic acid and the Aβ concentrations were determined. Analysis of Aβ aggregation Aggregation of Aβ peptides was investigated by ThT assay. Seedless Aβ stock solutions were prepared according to Schilling et al.4 with slight modifications. Briefly, peptides were disaggregated in HFIP, evaporated and 1.0 mM stock solutions were prepared in 0.1 M NaOH. After 15 min incubation, these solutions were diluted to 100 µM in MES/Acetate/Tris-buffer, and pH was adjusted to 7.0 by addition of 0.1 M HCl. The peptide solutions in the appropriate ratio were added to an equal volume of a 40 µM ThT solution containing 0.01% NaN3. Final concentrations were 50 µM peptide in 50 µM Tris, 25 µM MES, 25 µM Acetate and 20 µM ThT. 200 µl of the solutions were applied 6-fold to a 96-well black well plate. The plate was covered with an adhesive film and incubated in a plate reader (NOVOstar, BMG Labtechnologies) at 37°C for up to 300 h. Fluorescence readings were taken every 2 h (excitation 440 nm; emission 590 nm). For transmission electron microscopy, samples were taken from the 96-well plate after finishing the ThT assay, adsorbed on Formvar coated copper grids, washed with distilled water 3 times and negatively stained with 2% uranyl acetate. Finally, they were observed with an EM 900 (Carl Zeiss SMT, Oberkochen) operating at 80 kV and images were taken with a Variospeed SSCCD camera SM-1k-120 (TRS, Moorenweis). Statistical analysis The statistical analysis of the Aβ ELISAs was performed applying one-way ANOVA followed by Tukey HSD. Conditioned fear data were evaluated by one-way ANOVA followed by post-hoc analysis using Fisher PLSD and Scheffé's test. For multiple comparisons P= 0.5/ k with k= number of comparisons was considered significant (Bonferroni-Dunn test). The Morris water
13
maze was evaluated applying one- and two-way ANOVA followed by post-hoc analysis using Newman-Keuls Multiple Comparison Test, if significance was obtained in ANOVA. References:
1. Reimers, S. et al. Formation of perineuronal nets in organotypic mouse brain slice cultures is independent of neuronal glutamatergic activity. Eur. J. Neuroci. 25, 2640–2648 (2007).
2. Hardy, J.A. & Higgins, G.A. Alzheimer's disease: the amyloid cascade hypothesis.
Science 256, 184–185 (1992). 3. Russo, C. et al. Amino-terminal modification and tyrosine phosphorylation of
[corrected] carboxy-terminal fragments of the amyloid precursor protein in Alzheimer's disease and Down's syndrome brain. Neurobiol. Dis. 8, 173–180 (2001).
4. Schilling, S. et al. On the seeding and oligomerization of pGlu-amyloid peptides (in
vitro). Biochemistry 45, 12393–12399 (2006).
5. McKhann, G. et al. Clinical diagnosis of Alzheimer’s disease: report of the NINCDS-ADRDA work group under the auspices of Department of Health and Human Services Task Force on Alzheimer’s disease. Neurology 34, 939–944 (1984).
6. Shirotani, K., Tsubuki, S., Lee, H.J., Maruyama, K. & Saido, T.C. Generation of
amyloid beta peptide with pyroglutamate at position 3 in primary cortical neurons. Neurosci. Lett. 327, 25–28 (2002).
7. Hsiao, K. et al. Correlative memory deficits, Abeta elevation, and amyloid plaques in
transgenic mice. Science 274, 99–102 (1996).
8. Rockenstein, E. et al. Early formation of mature amyloid-β protein deposits in a mutant APP transgenic model depends on levels of Aβ(1–42). J. Neurosci. Res. 66, 573–582 (2001).
9. Hutter-Paier, B. et al. The ACAT inhibitor CP-113,818 markedly reduces amyloid
pathology in a mouse model of Alzheimer’s disease. Neuron 44, 227–238 (2004).
10. Comery, T.A. et al. Acute gamma-secretase inhibition improves contextual fear conditioning in the Tg2576 mouse model of Alzheimer's disease. J. Neurosci. 25, 8898–8902 (2005).
11. Jacobsen, J.S. et al. Early-onset behavioral and synaptic deficits in a mouse model of
Alzheimer's disease. Proc. Natl. Acad. Sci. USA 103, 5161–5166 (2006).