Glucagon Levels and Metabolic Effects Fasting...Glucagon Levels and Metabolic Effects in Fasting Man...
15
Glucagon Levels and Metabolic Effects in Fasting Man ERROL B. MARLiss, THOMAS T. AOKI, ROGER H. UNGER, J. STUART SOELDNER, and GEORGE F. CA111Li, JR. From the Department of Medicine, Harvard Medical School and the Peter Bent Brigham Hospital, the Elliott P. Joslin Diabetes Foundation, Inc., Boston, Mas- sachusetts 02215, the Department of Internal Medicine, the University of Texas Southwestern Medical School at Dallas, and the V.A. Hospital, Dallas, Texas 75216 A B S T R A C T The role of glucagon in the metabolic adaptation to prolonged fasting in man has been ex- amined. Plasma immunoreactive glucagon was deter- mined during 6-wk fasts and during infusion of exoge- nous glucagon using an assay which minimized non- pancreatic immunoreactivity. Plasma glucagon concentrations rose twofold to a peak on the 3rd day of fasting and then declined thereafter to a level maintained at or above postabsorptive. Insu- lin concentration declined to a plateau by the 3rd day. Thus a persisting altered relationship of glucagon and insulin concentrations characterized the fasted state. A synergism of low insulin and relative or absolute ele- vation of glucagon levels is viewed as a hormonal mecha- nism controlling the rate of hepatic substrate extraction for gluconeogenesis. Glucagon was infused systemically into 4-6-wk fasted subjects at three dose levels. A marked sensitivity of individual plasma free amino acids to the induced ele- vations of plasma glucagon within the physiologic range was demonstrated. At higher concentrations, equivalent to those present in the portal vein, stimulation of hepatic gluconeogenesis occurred, and the effects on glucose, insulin, and growth hormone levels and on ketone metabolism were induced. INTRODUCTION Although glucagon is essential to metabolic homeostasis in some species (1, 2), a physiologic role in man has not These data have been presented in part at the meeting of the American Society for Clinical Investigation, Atlantic City, N. J., 3 May 1970. Dr. Marliss is recipient of a Medical Research Council of Canada Fellowship, and Dr. Aoki of U. S. Public Health Service Special Postdoctoral Fellowship 1 F03 AM43067 01. Received for publication 11 June 1970 and in revised form 27 July 1970. been defined. Glucagon secretion is responsive to induced hypoglycemia (3) and to infusion or ingestion of large loads of amino acids (4), but these are not standard challenges within the physiologic setting of alternating meal consumption and fasting. Since man maintains his blood glucose concentration mainly by gluconeogenesis (5), the glycogenolytic effect of glucagon may not be a primary function, except in "emergency" situations. Unger and colleagues have suggested that the relative levels of insulin and glucagon are important in fasting and after amino acid challenge. In fasting they demon- strated elevated plasma levels of immunoreactive glu- cagon in the presence of lowered insulin levels and have suggested a synergistic effect on hepatic glucose release (6). In the latter situation during protein or amino acid challenge, they have proposed that the parallel increases of glucagon with increasing insulin levels prevent the hypoglycemia that would otherwise occur if insulin levels alone were to rise (7). It has been shown that man, when fasted, reaches a near steady state with respect to protein, fat, and car- bohydrate metabolism by 3 wk (8). Gluconeogenesis from protein, though initially increased, diminishes to a plateau by this time, as the adaptation of brain to ketone body oxidation reduces the glucose requirement of the body. Any induced hormonal alteration at such a time might be expected to influence this metabolic adjustment in a manner which provides insight into the relative im- portance of the physiological effects of the hormone to fuel homeostasis. Furthermore, the availability of hor- monal assays now permits quantification of the levels of hormone achieved during its administration and permits correlation with known physiological levels. Presently available immuno- and bioassays demonstrate that pancreatic glucagon circulates in extremely low con- centrations (7, 9). Metabolic responses in most previous studies have therefore been a result of pharmacologic 2256 The Journal of Clinical Investigation Volume 49 1970
Transcript of Glucagon Levels and Metabolic Effects Fasting...Glucagon Levels and Metabolic Effects in Fasting Man...
Glucagon Levels and Metabolic Effects in Fasting Man
ERROLB. MARLiss, THOMAST. AOKI, ROGERH. UNGER,J. STUARTSOELDNER,and GEORGEF. CA111Li, JR.
From the Department of Medicine, Harvard Medical School and the Peter BentBrigham Hospital, the Elliott P. Joslin Diabetes Foundation, Inc., Boston, Mas-sachusetts 02215, the Department of Internal Medicine, the University of TexasSouthwestern Medical School at Dallas, and the V.A. Hospital,Dallas, Texas 75216
A B S T R A C T The role of glucagon in the metabolicadaptation to prolonged fasting in man has been ex-amined. Plasma immunoreactive glucagon was deter-mined during 6-wk fasts and during infusion of exoge-nous glucagon using an assay which minimized non-pancreatic immunoreactivity.
Plasma glucagon concentrations rose twofold to a peakon the 3rd day of fasting and then declined thereafterto a level maintained at or above postabsorptive. Insu-lin concentration declined to a plateau by the 3rd day.Thus a persisting altered relationship of glucagon andinsulin concentrations characterized the fasted state.A synergism of low insulin and relative or absolute ele-vation of glucagon levels is viewed as a hormonal mecha-nism controlling the rate of hepatic substrate extractionfor gluconeogenesis.
Glucagon was infused systemically into 4-6-wk fastedsubjects at three dose levels. A marked sensitivity ofindividual plasma free amino acids to the induced ele-vations of plasma glucagon within the physiologic rangewas demonstrated. At higher concentrations, equivalentto those present in the portal vein, stimulation of hepaticgluconeogenesis occurred, and the effects on glucose,insulin, and growth hormone levels and on ketonemetabolism were induced.
INTRODUCTIONAlthough glucagon is essential to metabolic homeostasisin some species (1, 2), a physiologic role in man has not
These data have been presented in part at the meeting ofthe American Society for Clinical Investigation, AtlanticCity, N. J., 3 May 1970.
Dr. Marliss is recipient of a Medical Research Council ofCanada Fellowship, and Dr. Aoki of U. S. Public HealthService Special Postdoctoral Fellowship 1 F03 AM43067 01.
Received for publication 11 June 1970 and in revised form27 July 1970.
been defined. Glucagon secretion is responsive to inducedhypoglycemia (3) and to infusion or ingestion of largeloads of amino acids (4), but these are not standardchallenges within the physiologic setting of alternatingmeal consumption and fasting. Since man maintains hisblood glucose concentration mainly by gluconeogenesis(5), the glycogenolytic effect of glucagon may not be aprimary function, except in "emergency" situations.Unger and colleagues have suggested that the relativelevels of insulin and glucagon are important in fastingand after amino acid challenge. In fasting they demon-strated elevated plasma levels of immunoreactive glu-cagon in the presence of lowered insulin levels and havesuggested a synergistic effect on hepatic glucose release(6). In the latter situation during protein or amino acidchallenge, they have proposed that the parallel increasesof glucagon with increasing insulin levels prevent thehypoglycemia that would otherwise occur if insulin levelsalone were to rise (7).
It has been shown that man, when fasted, reaches anear steady state with respect to protein, fat, and car-bohydrate metabolism by 3 wk (8). Gluconeogenesisfrom protein, though initially increased, diminishes to aplateau by this time, as the adaptation of brain to ketonebody oxidation reduces the glucose requirement of thebody. Any induced hormonal alteration at such a timemight be expected to influence this metabolic adjustmentin a manner which provides insight into the relative im-portance of the physiological effects of the hormone tofuel homeostasis. Furthermore, the availability of hor-monal assays now permits quantification of the levels ofhormone achieved during its administration and permitscorrelation with known physiological levels.
Presently available immuno- and bioassays demonstratethat pancreatic glucagon circulates in extremely low con-centrations (7, 9). Metabolic responses in most previousstudies have therefore been a result of pharmacologic
2256 The Journal of Clinical Investigation Volume 49 1970

TABLE I
Clinical Data
Deviation ofWeight initial weight
from populationInitials Age Sex Height Initial Final Difference ideal weight*
yr cm kg S K+RB 40 F 175 152.7 133.6 19.1 116 1.42DB 37 M 183 160.8 138.8 22.0 100 1.30SC 42 M 180 117.7 97.6 20.1 48 1.40J Ca 51 F 171 122.7 102.3 20.4 66 1.09J Co 38 M 180 107.2 86.9 20.3 46 1.48PC 27 F 165 93.3 76.8 16.5 56 1.89FD 30 M 173 114.5 93.0 21.5 66 1.02LD 21 F 175 102.1 84.1 18.0 56 2.03FF 38 M 183 130.0 104.7 25.3 60 1.82MH 35 F 155 95.4 77.5 17.9 71 2.69MK 55 M 163 129.0 103.5 25.5 96 1.22BS 29 F 162 129.3 110.6 18.7 118 1.59MS 23 M 191 161.4 130.4 31.0 99 2.50RS 22 M 185 140.0 112.2 27.8 84 1.32PW 28 F 163 99.7 84.2 15.5 74 2.00
* From Metropolitan Life Insurance Tables, 1959.t Intravenous glucose tolerance test performed before weight reduction. Values expressed as absoluteper cent disappearance per minute (after glucose, 0.5 g/kg).
levels of the hormone. The current study was designedto quantify the in vivo metabolic effects of glucagon whengiven by constant infusion in more physiologic dosagein fasting man. In addition, levels of endogenous glu-cagon throughout periods of prolonged fasting havebeen determined.
METHODSSubjects. 15 obese subjects were admitted to The Clini-
cal Center of the Peter Bent Brigham Hospital (Table I);each had been carefully screened prior to fasting to assurethat no endocrine abnormality was present. None had ahistory, signs, or symptoms of cardiac, renal, or hepaticdisease or gout. The screening tests employed have beendescribed (8). The patients were informed of the nature,purpose, and possible risks involved in fasting and in theinfusion procedures, and each had volunteered to undergoprolonged fasting as a therapeutic measure.
The patients were not losing weight prior to admission,and for at least 3 days before fasting they received a 2500calorie diet containing 300 g of carbohydrate, 100 g of pro-tein, and 85 g of fat. Daily intake during fasting (35-43days) consisted of a minimum of 2000 ml of water, 17 mEqof NaCl, one multivitamin tablet (Theragran; E. R. Squibb& Sons, New York), and, in most patients, 17 mEq of KCl.These medications contained no appreciable calories. Nodietetic food or beverage or other intake was permitted.
Blood and urine collection and analyses. Blood wasdrawn between 8 and 9 a.m. from an antecubital vein with-out stasis with patients recumbent for at least 90 min. Itwas immediately distributed into tubes for the analysesdescribed. (a) Oxalate-fluoride tubes were used for tripli-cate blood glucose analyses by the Technicon AutoAnalyzerferricyanide procedure (Technicon Corporation, Tarrytown,
N. Y.). (b) Tubes containing lithium-heparin were employedfor analysis of free amino acids on plasma deproteinizedwith sulfosalicylic acid, as previously described (10), usingthe automated ion-exchange chromatographic technique ona Beckman 120C amino acid analyzer (Beckman Instru-ments Inc., Palo Alto, Calif.) modified to provide simul-taneous recording from two columns. Glutamine and gluta-mate are not reliably quantified in plasma by this methodand where reported were determined by specific enzymaticassay (11). Filtrates were immediately frozen and stored at-200C until analysis. (c) Clotted blood was collected fordetermination of serum immunoreactive insulin and immuno-reactive growth hormone. (d) Plasma for assay of immu-noreactive glucagon (12) was obtained from blood collectedin tubes containing EDTA and Trasylol (FBA Pharma-ceuticals Ltd., N. Y.). (e) Precooled tubes containing 30%(w/v) perchloric acid received blood for instantaneousdeproteinization for determination of p-hydroxybutyrate,acetoacetate, lactate, and pyruvate by modified enzymaticfluorimetric procedures and glycerol by an enzymatic spectro-photometric method. (f) Free fatty acids were determinedon heparinized plasma and were shown not to be artificiallyelevated by the levels of ketones present.
Urine was collected in plastic containers and stored at40C in 24-hr collections, the total volumes of which weremeasured and aliquots taken for analysis of total nitrogen,urea nitrogen, ammonia, creatinine, uric acid, 8-hydroxy-butyrate, acetoacetate, and electrolytes. These were frozenat -200C until analysis. All analytical techniques for bloodand urine have been described (13).
Statistical analyses were performed according to Snedecor(14).
Infusion procedures. Crystalline beef and pork glucagon(courtesy of Dr. Walter N. Shaw, Eli Lilly & Co., Indi-anapolis, Ind.) was given, by constant infusion over 48 hr,
Glucagon in Fasting Man 2257

<0.0I <0.01 <0.001 <0.01 <0.01
II II
io*.
so
<0.01
0 3 5 7 14 21 28 35 42
DAY OF FAST
FIGURE 1 Concentration of blood glucose, serum insulin, and plasmaglucagon in seven obese subjects at various intervals, throughout a pro-longed fast. Values are mean ±SEM and show the probability that con-centrations during fasting do not differ from 'those on day zero (pairedt test).
on one or two occasions to each patient after at least 28days of fasting. Infusion was maintained constant by aninfusion pump (Harvard Apparatus Co., Millis, Mass.)into a slow drip of physiologic saline in a superficial fore-arm vein. Blood was sampled from the contralateral ante-cubital vein just prior to and at 8-hr intervals during theprocedure (i.e., at 8 a.m., 4 p.m, and midnight on each of2 days, and just prior to termination of the infusion). Theinfusate was prepared in physiologic saline containing 250mg/100 ml of human serum albumin (E. R. Squibb &Sons, New York), to prevent adherence of the glucagon tothe glass and tubing. This was verified by immunoassay ofglucagon in the infusate which- contained 109 ±+-2% of the
calculated amount. The infusate was similarly assayed forimmunoreactive insulin and was found to contain 85 mUof insulin per mg of glucagon, a physiologically insig-nificant amount at the rate infused.
Three dose levels of glucagon were used to deliver thefollowing over a 24 hr period: 10 mg (four subjects),1 mg (five subjects), and 0.1 mg (five subjects). In thosereceiving two infusions, 5-7 days were allowed betweeninfusions to permit return to baseline conditions, and thelower dose was administered prior to the higher dose.
Since pronounced circadian changes in plasma amino acidsand other metabolites are present in the fed state, whichcould themselves mitigate changes induced by infusion of
2258 Marliss, Aoki, Unger, Soeldner, and Cahill
5[
4
3BLOOD
GLUCOSEmM
<0.001I T 3
<0.001<0.001< 0.001
I I
2
INSULINPU/ml
54
2

TABLE I ICircadian Pattern of Circulating Substrates and Hormones on Day 28
of Prolonged Fasting (Seven Subjects)*
8 a.m. 4 p.m.: Midnight*
Blood glucose (mM) 3.42 ±0.14 3.52 ±0.30 3.27 40.19(mg/100 ml) 62 ±3 63 ± 5 59 43
Serum insulin (iuU/ml) 13 42 17 ±4 14 ±2Plasma free fatty acids (mEqiliter) 1.16 40.06 1.32 ±0.15 1.23 40.11Blood P-hydroxybutyrate (mM) 6.19 40.36 6.34 40.32 6.26 ±0.34Blood acetoacetate (mM) 1.14 40.08 1.14 40.09 1.25 ±0.08Blood glycerol (mM) 0.157 ±0.030 0.256 40.048 0.209 ±0.059
* Mean ASEM.None of the values for 4 p.m. or midnight were significantly different from the 8 a.m. values
by paired comparison (P > 0.05).
glucagon, samples were taken at 8 a.m., 4 p;m., and mid-night of day 28 of fasting in seven patients, during whichtime no glucagon was administered. Similarly, a 24 hrinfusion, of albumin in saline alone was administered to onepatient (L. D.) to determine if the albumin affected thesame parameters.
RESULTS
The mean morning values of blood glucose and plasmaimmunoreactive glucagon and serum insulin at day 0(postabsorptive) and at intervals throughout a prolongedperiod of fasting in seven subjects are presented in Fig.1. There was a significant rise in glucagon from thepostabsorptive mean of 73 1AIzg/ml (sEM ±4.7) to a maxi-mumon day 3 of 144 ±15.7 u'g/ml (P < 0.01). Thisrise was followed by a gradual return toward prefastlevels, but the values remained- significantly elevatedat day 5, 14, and 42. This early rise is identical with thatpreviously reported using the same immunoassay (6) innonobese subjects fasted 4 days. Also similar is the fallin insulin levels with fasting, a well-recognized phenome-non which is clearly associated with falling glucose con-centrations. 'Thus the hormonal milieu of prolongedfasting is characterized by lowered -insulin levels, ele-vated or normal immunoreactive glucagon levels', andlow blood glucose.
Table II presents the results of circulating hormonesand substrates measured three times during the 28th dayof fasting without hormone infusion. No significant vari-ation from 8 a.m. values was present by paired com-parison of 4 p.m. and midnight values. Similarly, but notshown, no change occurred in any of these parametersin patient L. D. during infusion of human serum albumin(2.5 g/24 hr) in saline without glucagon. The aminoacid patterns of these patients are presented in TableIII, and again no significant change in concentrationof the individual amino acids was noted.
The responses of circulating substrates and hormonesto glucagon. infusion at two dose- levels (10 -mg/24 hr
and 1 mg/24 hr) are shown in Table IV and Fig. 2.Blood glucose rose with infusion of both doses of glu-cagon and was significant (P < 0.05, paired t test) atmost sampling intervals. The higher dose infusion pro-
TABLE I I ICircadian Pattern of Individual Plasma Free Amino Acids on
Day 28 of Prolonged Fasting (Five Subjects)*
8 aim. 4 p.m.: Midnight:
AM AM pMTaurine 66 ±7 64 ±6 70 ±6Threonine 248 433 223 ±28 230 ±33Serine 139 ±11- 127 *10 133 ±14Glutamine§ 387 ±109 448 ±87 361 ±90Proline 163 ±14, 162 ±15 166 ±15Glutamicacid§ 24±1 3143 24±1Citrulline 19 ±3 20 ±3 19 ±3Glycine 372 ±14 347 ±22 356 426Alanine 174 411 175 +9 184 411a-Amino-n-
butyric acid 49 ±6 42 42 44 ±2Valine 211±21 197 ±12 205 ±12Half-cystine 70 49 79 ±7 79 ±7Methionine 31 43 34 ±2 32 43Isaleucine 91 47 85 46 88 47Leucine 145 ±12 132 ±8 140 48Tyrosine 59 43 55 42 55 42Phenylalani ne 48 44 51 41 47 ±2Ornithine 55 ±47 51 ±4 56 S5Lysine 221 421 204 ±16 200 429Histidine 68 410 61 42 63 ±7Arginine. 70 ±14 59 46 62 ±6
* Mean ASEM.+ None of the values for 4 p.m. or midnight were significantlydifferent from the 8 a.m. values by paired comparison(P-> 0.05).
-§ Glutamine and glutahnic acid were determined separately by-specific--enzymfnatic methods-;,
Glucagon in Fasting Man 2259

TABLE IVInfluence of Glucagon Infusion during Prolonged Fasting
Experimental period:
Preinfusion Infusion
0 8 hr 16 hr
mgBlood glucose (mM) 10§ 3.30 40.12 6.00 40.51 4.77 40.37
III 3.47 40.14 4.30 40.18 4.10 ±-0.26Serum insulin (&U/mi) 10 14 ±2 62 414 33 ±9
1 14 ±2 19 ±4 21 43Serum growth hormone (mgg/ml) 10 0.8 40.4 4.8 ±1.5 3.0 ±0.8
1 0.5 ±0.2 1.2 ±-0.4 1.4 ±0.5Plasma free fatty acids (mEqiliter) 10 1.26 40.12 1.23 ±0.19 1.07 40.17
1 1.20 ±0.12 1.12 ±0.11 1.02 ±0.09Blood 3-hydroxybutyrate (mM) 10 5.80 ±0.78 3.58 ± 1.03 4.50 ±0.94
1 5.50 ±0.54 5.31 40.70 5.04 ±0.66Blood acetoacetate (mM) 10 1.28 ±0.23 1.25 ±0.30 1.39 ±0.23
1 1.06 +0.11 1.27 ±0.27 1.25 40.28Blood glycerol (mM) 10 0.141 ±0.009 0.203 ±-0.033 0.141 40.025
1 0.116 ±0.019 0.143 40.024 - -Plasma glucagon (pug/ml) 1 148 ±21 1345 ±244
* Values are mean ASEM.t Hours from beginning of infusion. Zero time value is mean of 8 a.m. values on 3 days preceding infusion (exceptglucagon).§ 48 hr infusion of 10 mg/24 hr (n = 4) of glucagon.11 48-hr infusion of 1 mg/24 hr (n = 5) of glucagon.
duced higher glucose and insulin levels, but there wasmuch interindividual variation.
Glucagon levels in excess of 2000 M/g/ml were achievedand maintained throughout the infusions of 10 mg/24hr. In the 1 mg/24 hr infusions, the plasma concentra-tions were still above the peripheral venous levels ofglucagon observed by stimulation of endogenous secre-tion (6), but within the range measured in portal venousplasma in animals (15) and in peripheral venous plasmain man in diabetic acidosis (12).
Serum growth hormone levels rose in both groups tosignificantly higher than preinfusion levels at 16 hr(P <0.05, paired t test). Again the absolute valueswere higher with the 10 mg/24 hr dose, but interpreta-tion of these is complicated by the fact that this groupcomprised two females and two males, whereas the fivesubjects in the 1 mg/24 hr dose group were all males(although zero time values were not significantlydifferent).
Mean plasma free fatty acids underwent a slight butinsignificant fall in the first 24 hr, followed by a sec-ondary rise in the next 24 hr which, though greater inthe higher dose group, reached significantly greater thanbaseline values only in the 1 mg/24 hr group at 32 hr(P <0.05, paired t test). A similar pattern was ob-servel for blood P-hydroxybutyrate in the 10 mg/24 hr
studies, but a progressive decline occurred in the lowerdose group, which was significant compared with thecontrol value at 24 hr (P < 0.05, paired t test). Bloodacetoacetate and glycerol did not exhibit significantchanges from preinfusion concentrations.
Urinary ketone acid excretion is shown in Table V.In both groups an increase in ketone excretion was ob-served, most marked in the 10 mg/24 hr group. Thisincreased excretion corresponded to the diminution inblood P-hydroxybutyrate on the 1st day and the increaseon the 2nd day of infusion in the higher dose group.But in the lower-dose group, the increase in urinaryexcretion was associated with a progressive decrease inblood levels.
The 24 hr urinary total nitrogen excretion is shownin Fig. 3 as the sum of its components. The principalcomponents, urea and ammonia nitrogen, are shown in-dividually. The remainder, comprising creatinine, uricacid, and other undetermined nitrogenous compounds(including alpha-amino nitrogen) are shown together.None of the latter measured components changed sig-nificantly during infusion. The pattern and magnitudeof the preinfusion nitrogen components are compatiblewith results previously published, in which ammonia ex-cretion is equal to or greater than urea excretion, re-flecting the important role of the kidney in both glu-
2260 Marliss, Aoki, Unger, Soeldner, and Cahill

on Circulating Substrate and Hormone Concentrations*
Infusion Postinfusion
24 hr 32 hr 40 hr 48 hr 72 hr 96hr
4.80 ±-0.24 5.49 -±0.40 5.96 ±-0.83 6.48 ±0.58 4.31 A-0.19 3.85 1:0.184.38 -:0.24 3.89 :10.22 4.17 :-0.14 4.02 --0.21 3.54 -±0.06 3.71 ±t0.2142 A-13 37 ±t8 36 ±-7 52 --18 22 ±2 19 ±-718 -45 19 ±-4 13 ±t1 19 ±t3 14 ±42 13 ±-15.4 ±i2 3.4 ±t1.7 1.7 -±0.5 1.4 ±-0.5 0.9 -±0.2 0.9 ±t0.30.6 ±-0.2 0.4 ±-0.2 0.5 ±40.3 0.4 --0.2 0.4 ±40.2 0.5 4-0.21.59 ±-0.64 1.77 ±-0.32 2.21 A±0.65 1.85 ±-0.44 1.44 ±-0.24 1.49 4-0.381.21 ±-0.19 1.39 ±-0.15 1.34 ±-0.08 1.26 --0.18 1.11 ±-0.13 1.23 ±40.276.01 ±-0.46 6.70 ±-0.36 6.24 4-0.59 4.63 ±i0.72 5.59 ±-0.90 5.48 ±-0.584.92 ±W0.56 5.27 ±-0.60 4.11 ±10.35 4.46 -0.75 5.65 ±h0.50 5.58 ±t1.261.48 ±-0.23 1.64 4-0.20 1.60 4-0.20 1.42 ±t0.21 1.43 *10.25 1.38 ±-0.211.26 ±-0.26 1.22 ±-0.26 0.85 ±-0.13 1.24 ±-0.23 1.38 -±0.18 1.30 ±-0.35
0.115 ±-0.010 0.208 ±10.037 0.160 -±0.020 0.192 ±-0.031 0.236 ±t0.0670.142 4-0.032 0.184 ±t0.022 - - 0.176 ±-0.028 0.134 ±-0.017 0.125 ±40.0351176 ±-190 752 4-166
coneogenesis and acid-base homeostasis in this state(8). Day 1 of the infusion was, in general, several dayslater in the fast for the group receiving 10 mg of glu-cagon per 24 hr, probably in part accounting for thesomewhat lower urea nitrogen excretion for this groupin the perinfusion period.
The effect noted in both groups was an increase inurea nitrogen excretion beginning on the 1st day andbecoming significant on the 2nd day of infusion. Levelsreturned to preinfusion values promptly in the lowerdose group, but they remained elevated for several daysafter the termination of the 10 mg/24 hr infusions. Nochange in ammonia nitrogen excretion occurred. This isconsistent with the failure of glucagon infusion to havealtered the blood acid-base equilibrium typical of pro-longed fasting (compensated metabolic acidosis).
Concurrent with the increase in urea nitrogen ex-cretion, the plasma concentrations of individual freeamino acids showed striking changes (Table VI). Allamino acids measured during the 10 mg/24 hr infusionsdiminished significantly, and only taurine and phenylala-nine failed to diminish during the 1 mg/24 hr infusions.In every other instance, the response to the lower doseinfusions was similar to but smaller in magnitude thanthe response to the higher dose. Apart from taurine andphenvlalanine in the 1 mg/24 hr infusions, three general
patterns of response were observed. Two of these aredemonstrated by representative amino acids in Fig. 4.The first group is represented by glycine and is charac-terized by either a progressive decline in plasma concen-tration or a decline to a plateau. This group includesserine, proline, citrulline, alanine, a-aminobutyric acid,half cystine, ornithine, and arginine. The second group,represented by leucine, showed a transient decrease fol-lowed by a return to levels not significantly differentfrom preinfusion by 24 hr. Included were valine, leu-cine, and isoleucine (1 mg/24 hr only). Methioninesimilarly decreased transiently but remained significantlylower until after the 24-hr interval. A third response,that of lysine and histidine (in the 10 mg/24 hr studies),was a decrease, a recovery toward preinfusion at 24 hr,then a subsequent decrease.
The zero time values in the two groups were compara-ble and in both instances showed the pattern previouslypublished for prolonged-fasted subjects (10).
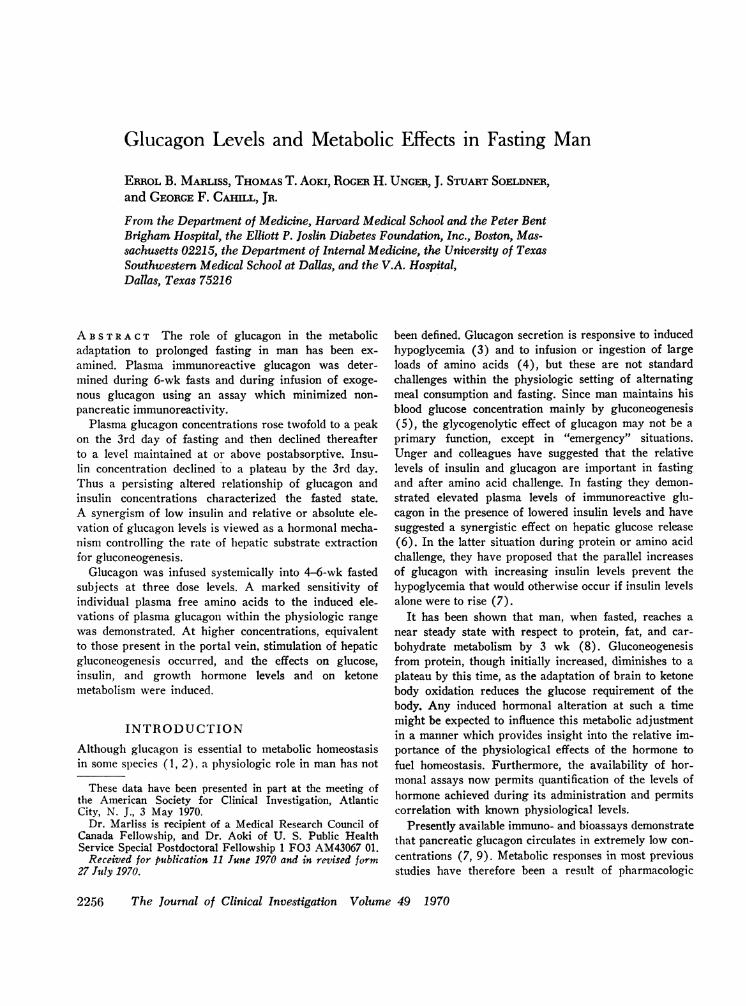
The responses of the five subjects receiving 0.1 m-g/24hr are shown in Fig. 5. No change in blood glucose orinsulin occurred during the significant elevation of im-munoreactive glucagon from the preinfusion mean of102 ±3 to a mean of 143-180 A,*g/ml. Similarly, plasma-free fatty acids and blood ketones did not change. Growthhormone was not determined. Urinary P-hydroxybutyrate
Glucagon in Fasting Man 2261

4.5
4.0
3.5
3.0
2.5
2.0
1.5
GLUCAGON2mg/48hr
(0.01(0.01 (0.05(0.01
I.0-
0.5
30 -
20.
10.
0 .
(0.05~~~~~~~~
1 600 _
1200F
GLUCAGON8001-
400- ~ 1(0.02 (0.01 (0.05
0 8 16 24 32 40 48 72 96HOURS AFTER BEGINNING OF INFUSION
FIGURE 2 Influence of 48 hr glucagon infusion (1 mg/24 hr) on
blood glucose, serum insulin, and plasma glucagon. Values are mean±SEM for five prolonged-fasted subjects and show the probability that
concentrations during infusion do not differ from zero time (pairedt test). Zero time value'of glucose 'and insulin is the mean of the3 days preceding in-fusioti.
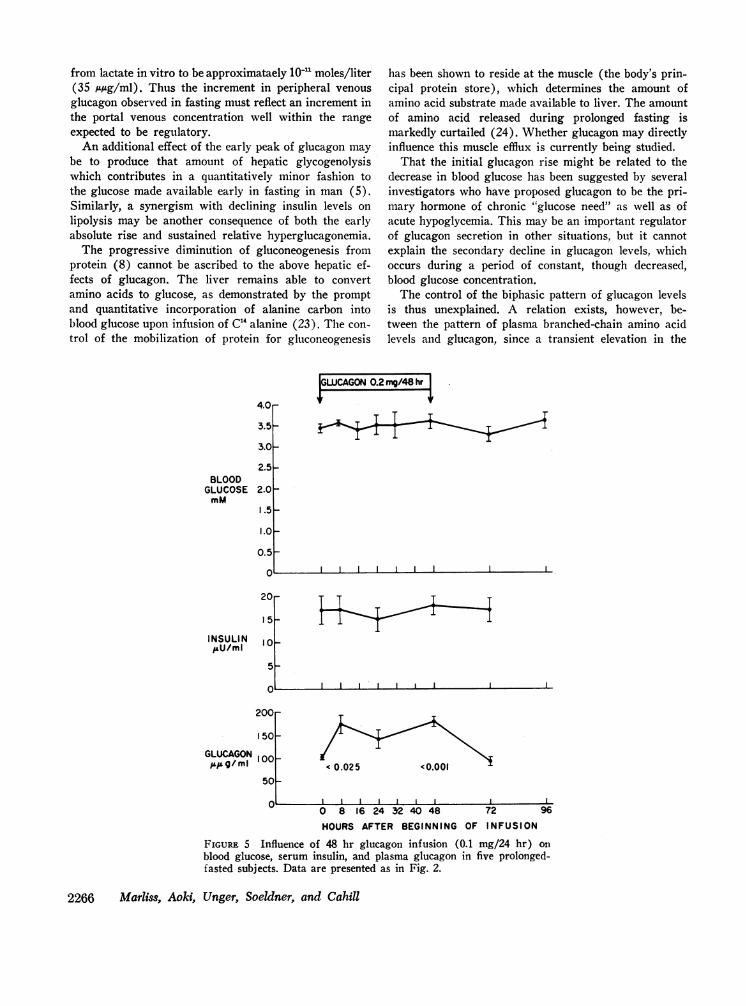
increased significantly during the first 24 hr' (P < 0.01)but returned to baseline thereafter. Acetoacetate excre-'tion did not change significantly. Urine' nitrogen re-
sponses are shown in Fig. 6, and these contrast with thehigher dose groups (Fig. 3), in that a' significant fall in
urea nitrogen excretion occurred. Whether this fall- is'greater than would have occurred without interventioncannot be determined.
Individual plasma amino acids whose levels' fell sig-nificantly (P <0.05, paired t test) during these infu-sions are shown in Fig. 7. Particularly noteworthy are
the decreases in threonine, serine, and glycine, vhichare elevated with prolonged fasting and which showa postinfusion rebound. There was no change in the con-
centration of the remaining measured amino acids.
DISCUSSION
Circadian rhythm of substrate and insulin concentra-tions. The studies performed on day 28 confirm- that-
the near steady-state metabolic adaptation of prolongedfasting obtains without significant variation in theparameters examined in relation to time of day. Thusany changes demonstrated during glucagon infusion may
be attributed solely to the effects of the hormone.Though circadian 'changes in blood glucose and se-
rum insulin unrelated to meal taking in the fed statehave been suggested (16, 17), such'changes did not oc-
cur during 'prolonged fasting. Similarly, the measuredparameters reflecting fat mobilization (free fatty acidand glycerol) and hepatic oxidation of fatty acid (thelevels, of ketone acids) do --not show variations at thetimes of the day studied. These observations suggest thatthe glucoregulatory and fat-mobilizing mechanisms whichresult in the fasting adaptation are not regulated by.hormones -whose secretion may show circadian change,or change related 'to intermittent activity -(though -the'subjects were recumbent for 90 min prior to- blood'sampling).
2262 Marliss, Aoki, Unger, Soeldner, and Cahill
BLOODGLUCOSE
mM
INSULINAU/ml
, Il

TABLE V
Urinary Ketone Acid Excretion during and following Glucagon Infusion in Prolonged Fasting*
Infusion period Postinfusion periodPreinfusion
period$ Day I Day 2 Day I Day 2 Day 3 Day 4 Day 5
mgj-hydroxybutyrate 10§ 107 ±17 133 :129 254 a14611 108 ±-23 80 ±2511 74 4:6 83 ±t34
11 103 415 127 413** 150 ±20t 106 418 101 ± 12 86 46 99 ±4 79 ±6Acetoacetate 10 8 ±1 10 ±2 23 ±5 13 ±2 10 ±1 8 ±2 9 ±2
1 10 ±1 11 ±:1 14 ±2 10 ±1 9 ±1 8 ±1 10 ±2 8 ±1
* Mean ±tSEM (mM/24 hr).t Mean of 5 days preceding infusion.§ 48 hr infusion of 10 mg/24 hr (n = 4).
P < 0.05, paired t test vs. preinfusion mean.¶ 48 hr infusion of 1 mg/24 hr (n = 5).** P < 0.02, paired t test vs. preinfusion mean.At P < 0.01, paired t test vs. preinfusion mean.
GLUCAGONI mg/ 24 hr GL'CAG
1EI GLUC-POST-1 INFUSION PRE-fl -ON
*UREANITROGENAMMONIANITROGEN
_ ~~~~~~OTHER
2 3 4 5 6 7 8 9 10 It 12
DAY OF STUDY
;ON 10 mg/24 hr
XL POSTINFUSION4-
2 3 4 5 6 7 8 9 10 11 12DAY OF STUDY
FIGURE 3 Influence of 48 hr glucagon infusion (1 mg and 10 mg/24 hr) on urine nitrogenexcretion during prolonged fasting. Total height of bar represents total nitrogen, the urea
and ammonia components of which are shown separately. Each bar represents the mean value,for five subjects in the 1 mg/24 hr group and four subjects in the 10 mg/24 hr group. Values on
day 7 of both groups and day 11 of the 1 mg/24 hr group show probability that the com-
ponent shown does not differ from the mean of the preinfusion values (paired t test).
Glucagon in Fasting Man 2263
7-
6-
5 -
4-
N ITROGENg/24hr
3-
2-
1 -
0-

TABLE VIInfluence of 48-Hour Glucagon Infusions upon Individual Plasma Free Amino Acids in Prolonged Fasting
Mean per cent decrease from zero time value
Zero time* 8 hr P: 24 hr P 48 hr P
mg AI10§ 68 ±-3
ill 57 --410 228 -14
1 187 -2410 117 -7
1 133 -910 145 4±21
1 151 -1310 15--5
1 17--210 341 -54
1 305 ±42510 144 -15
1 143 ±t1410 32--5
1 35 ±-110 157 ±t14
1 177 ±t1410 79 --11
1 67 ±t610 24 ±-5
1 29 ±-110 76--7
1 78 ±t710 110 ±1 1
1 119 ±1110 49--4
1 47 ±-310 46±-2
1 43 410 43±-3
1 47--610 137 ±4
1 186 ±t610 57 ±t2
1 60 ±-110 66--7
1 60 ±-1
32 <0.010 NS
67 <0.00129 <0.0261 <0.00128 <0.0158 <0.0121 <0.0163 NS29 <0.0561 <0.0123 <0.0546 <0.0121 NS61 <0.0120 <0.0231 <0.00117 <0.0537 NS13 NS70 <0.0232 <0.0155 <0.0122 <0.0559 <0.00124 <0.0560 <0.0222 <0.0546 <0.0115 NS62 <0.0123 NS59 <0.0130 <0.0553 <0.0520 <0.00158 NS33 <0.05
30 <0.0212 NS84 <0.0149 <0.0167 <0.0129 <0.0276 <0.0130 <0.0570 NS38 NS67 <0.0131 <0.0549 <0.0525 NS59 <0.0525 <0.0518 NS11 NS40 <0.0525 <0.0253 <0.0131 <0.0236 <0.05
9 NS27 NS
9 NS60 <0.0119 NS18 NS
-2 NS67 <0.0147 NS32 NS40 <0.0218 NS20 <0.0563 <0.0543 <0.05
* Zero time value is value immediately prior to commencement of infusion. Mean ±SEM.+ Probability that per cent decrease is not different from zero (paired t test).§ Infusion of 10 mg/24 hr (n = 4).
Infusion of 1 mg/24 hr (n = 5).
A well-defined circadian rhythm of plasma amino acid
concentrations in the fed state has been demonstrated
(18), in which the nadir in levels of most amino acids
occurs in the early morning and the peak at about 10
p.m. The obese patients studied herein in the fed stateconformed to this pattern (unpublished data). However,after 4 wk of fasting there was no change in concen-
trations at the times samples were drawn (8 a.m., 4 p.m.,
and midnight). This finding does not preclude smallerchanges occurring at other time intervals but does ruleout changes of the order of magnitude that are seen infed subjects. These observations support the contention'
1 Hussein, M. A., V. R. Young, E. Murrary, and N. S.Scrimshaw. Diurnal fluctuations of plasma amino acids inadult men. Effect of dietary tryptophan intake and distri-bution of meals. Submitted for publication.
2264 Marliss, Aoki, Unger, Soeldner, and Cahill
Taurine
Threonine
Serine
Proline
Citrulline
Glycine
Alanine
a-Amino-n-butyric acid
Valine
Half cystine
Methionine
Isoleucine
Leucine
Tyrosine
Phenylalanine
Ornithine
Lysine
Histidine
Arginine
19-12
845656318130813766333824742522
74427211842
332
5461210
-27449523626106243
NSNS
<0.01<0.01<0.01<0.01<0.01<0.01<0.05<0.01<0.01<0.01<0.05<0.05<0.02<0.01NSNSNS
<0.05NSNS
<0.05NSNSNS
<0.01NSNSNS
<0.05<0.05<0.01<0.01<0.05NSNS
<0.01

GLUCAGON.(mg /24hr)
- 100-i-° a I
<0.01 0
LEUCINE
150
100
50PM
<0.05
'0.001
0 8 24 48
HOURS FROM BEGINNING OF INFUSION
FIGuRE 4 Influence of 48 hr glucagon infusion during prolongedfasting on plasma glycine and leucine concentrations. Each representsthe pattern of response of a group of amino acids (see text). Valuesfor each dose level (1 mg/24 hr, five subjects; 10 mg/24 hr, foursubjects) show probability that concentration does not differ fromthat at zero time (paired t test).
(19) that the previously observed circadian amino acidrhythms are at least partly, if not entirely, patternedby meal taking and its induced hormonal responses.
Immunoreactive glucagon levels in prolonged fasting.The present findings confirm and amplify those of Agui-lar-Parada, Eisentraut and Unger, who have recentlydemonstrated a 50% rise in glucagon levels in 3- and4-day fasts in normal weight volunteers (6). The peakrise of 100% on day 3 of the present study thus cor-
responds closely to their observations. A similar earlyelevation of glucagon had been demonstrated previously(3, 20), but its interpretation was questioned because ofthe lack of antisera specific for pancreatic glucagon. Theyassay procedure used in the present study has been modi-fied to exclude nonpancreatic glucagon-like immuno-reactivity (12).
This early rise in plasma glucagon corresponds to a
transient period of accelerated hepatic gluconeogenesis,as evidenced by urinary urea nitrogen and by enhancedsplanchnic amino acid extraction. Indeed, an increase in
the fractional splanchnic extraction of alanine, the prin-cipal gluconeogenic amino acid, from 43% postabsorp-tively to 71% on day 3 has been reported recently fromthis laboratory (10). Fractional alanine extraction re-
turned to 53% at 5-6 wk of fasting, a pattern whichcorrelates with the fall in glucagon toward postabsorptivelevels beyond day 3. Thus, a synergism of the decreasein circulating insulin and increase in glucagon may beviewed as the cause of stimulated hepatic gluconeogenicmechanisms early in fasting. Although the absolute levelof glucagon later falls, the low insulin levels result in an
increased ratio of glucagon to insulin, which persists andmay be responsible for determining the proportion ofamino acid extracted by the liver in prolonged fasting.The work of Mackrell and Sokal (21) in the isolatedperfused rat liver has confirmed the importance of therelative concentrations of these hormones in regulatinghepatic metabolism. Furthermore, Lewis, Exton, Ho, andPark (22) have recently demonstrated the minimum con-
centration of. glucagon which stimulates gluconeogenesis
Glucagon in Fasting Man 2265
GIL YC/NE
400r
35OF
300
250
PM 200p
1501
1o00
SO
from lactate in vitro to be approximataely 10' moles/liter(35 A/g/ml). Thus the increment in peripheral venousglucagon observed in fasting must reflect an increment inthe portal venous concentration well within the rangeexpected to be regulatory.
An additional effect of the early peak of glucagon maybe to produce that amount of hepatic glycogenolysiswhich contributes in a quantitatively minor fashion tothe glucose made available early in fasting in man (5).Similarly, a synergism with declining insulin levels onlipolysis may be another consequence of both the earlyabsolute rise and sustained relative hyperglucagonemia.
The progressive diminution of gluconeogenesis fromprotein (8) cannot be ascribed to the above hepatic ef-fects of glucagon. The liver remains able to convertamino acids to glucose, as demonstrated by the promptand quantitative incorporation of alanine carbon intoblood glucose upon infusion of C'4 alanine (23). The con-trol of the mobilization of protein for gluconeogenesis
4.0
3.5
3.0
2.5BLOOD
GLUCOSE 2.0mM
1.5
1.0
0.5
2
INSULIN'&U/ml
GLUCAGON (;L g/ mlI
has been shown to reside at the muscle (the body's prin-cipal protein store), which determines the amount ofamino acid substrate made available to liver. The amountof amino acid released during prolonged fasting ismarkedly curtailed (24). Whether glucagon may directlyinfluence this muscle efflux is currently being studied.
That the initial glucagon rise might be related to thedecrease in blood glucose has been suggested by severalinvestigators who have proposed glucagon to be the pri-mary hormone of chronic "glucose need" as well as ofacute hypoglycemia. This may be an important regulatorof glucagon secretion in other situations, but it cannotexplain the secondary decline in glucagon levels, whichoccurs during a period of constant, though decreased,blood glucose concentration.
The control of the biphasic pattern of glucagon levelsis thus unexplained. A relation exists, however, be-tween the pattern of plasma branched-chain amino acidlevels and glucagon, since a transient elevation in the
GWCAGON0.2 mg/48 hr
4r +
!or
5 -
0-
5-
L1 I I
< 0.02 5 <0.001
0 8 16 24 32 40 48 72 96
HOURS AFTER BEGINNING OF INFUSION
FIGURE 5 Influence of 48 hr glucagon infusion (0.1-mg/24 hr) onblood glucose, serum insulin, and plasma glucagon in five prolonged-fasted subjects. Data are presented as in Fig. 2.
2266 Marliss, Aoki, Unger, Soeldner, and Cahill
6 |LI| REAU NITROGEN
AMMONIANITROGEN
5~~ ~ ~ ~ ~ ~ j~~OTHER
NI TROGENg/24hr 3
2
01 2 3 4 5 6 7 8 9 1 0 1 1
DAY OF STUDY
FIGURE 6 Influence of 48 hr glucagon infusion (0.1 mg/24 hr) on urinenitrogen excretion in five prolonged-fasted subjects. Data are presentedas in Fig. 3.
former also occurs early in fasting (10). It is now wellrecognized that many amino acids are potent stimulatorsof glucagon as well as of insulin secretion (15). Felig,Marliss, and Cahill (25) recently proposed that en-dogenous levels of amino acids, particularly the branched-chain amino acids (valine, leucine, and isoleucine), mayexert a tonic influence on beta cell secretory activity,secondary in sensitivity to the glucose levels. Thus, therise in these amino acids seen early in fasting has beeninterpreted to be the result of declining blood glucose andinsulin levels and a diminution in the known effect ofinsulin of inhibiting muscle release of these amino acids(26). It is possible that the early hyperglucagonemiamay be a reflection of the increased levels of valine orisoleucine, and the secondary decline related to the de-crease in the same amino acids. The possibility of en-hanced glucagon responsiveness to endogenous levelsof amino acids is also raised by the data of Aguilar-Parada and colleagues in which glucagon increments inresponse to arginine infusion were greater in subjectsfasted 3 days than in the same subjects in the post-absorptive state (6).
Glucagon infusions in prolonged fasting. The infu-sions of 10 mg/24 hr were clearly pharmacologic in
that the levels achieved were considerably greater thanthose observed in any physiologic setting. These infu-sions regularly induced moderate nausea and, on occa-sion, vomiting requiring treatment. Such an effect wasnot observed in the 1 mg/24 hr infusions, which stillproduced high peripheral levels of glucagon. Neverthe-less, the principal differences in the effects of the twodoses upon circulating substrates and hormones arelargely quantitative, since the same parameters werealtered proportionally in both instances.
The mechanism of blood glucose elevation was proba-bly largely due to increased gluconeogenesis (in additionto glycogenolysis) from amino acid precursors, asshown by the increase in urine urea nitrogen excretion.Similar results in fed subjects have been reported (27).This effect was primarily hepatic in locus, despite therole of the kidney in producing 50% of the body's totalglucose requirement in prolonged fasting (8), becauseno effect on urinary ammonia excretion was seen.Renal gluconeogenesis and ammoniagenesis have beenshown to be closely correlated in states of acidosis suchas in fasting (28). The increase in hepatic gluconeo-genesis occurred, despite substantial increase in seruminsulin levels to a peak of 62 /4U/ml (±14) in the 10
Glucagon in Fasting Man 2267

0 Time* 24 hr*48 hr
024 hr
Post i nf usion
Mm
THR SER PRO GLY ALA oNHBUT CYS/2 TYR ORN
FIGURE 7 Individual plasma amino acids showing significant (P < 0.05, pairedt test) decline in concentration during 48 hr glucagon infusion (0.1 mg/24 hr)in prolonged-fasted subjects. A returnoccurred at 24 hr postinfusion for allornithine.
mg/24 hr infusions, a value greater than the meanpostabsorptive insulin concentration in this group (40±8 AU/ml). Whether this increment in insulin was dueto the elevated blood glucose cencentration cannot beascertained from the present study. It must be conceded,however, that the sensitivity of the beta cell to glucagonstimulation in this state must be very low, since ex-
tremely high concentrations of glucagon were present.The biochemical mechanism whereby glucagon ex-
erted its stimulatory effect on hepatic gluconeogenesis is
not apparent. No clear evidence is provided of an in-crease in ketogenesis after glucagon, because of thealtered blood levels in association with increased excre-
tion, probably a direct effect of glucagon on renalketone metabolism or excretion. Thus, an effect inde-pendent of acceleration of fatty acid oxidation remainsa possibility.
The effect of glucagon on increasing lipolysis invitro (29) and in vivo in other species (30) was not
evident in these studies, in that plasma-free fatty acidand blood glycerol concentrations did not rise sig-nificantly.
to levels not different from zero timeamino acids shown except alanine and
Glucagon has recently been reported -to affect con-centrations of individual plasma amino acids in man(31) and animals (32). The present findings confirm theobserved effect of a decrease in levels of most aminoacids and of previous studies in which total amino acids(as alpha-amino nitrogen) were measured (33). Theseinvestigations uniformly employed large doses of glu-cagon.
That a primary site of the amino acid lowering effectis the liver is suggested by the data referred to above,indicating increased urea nitrogen excretion in thestudies with higher glucagon doses. Since no changein the "unmeasured" urine nitrogen component was ob-served, it is unlikely that a substantial increase in renalamino acid excretion could account for the hypoamino-acidemia. Studies by Kibler, Taylor, and Meyers in man(34) and by Shoemaker and Van Itallie in dogs (35)have shown increased splanchnic extraction of alpha-amino nitrogen after glucagon. These in vivo experi-ments do not account for possible heterogeneity ofhepatic response to glucagon with respect to individualamino acids, nor to the induced insulin response exert-
2268 Marliss, Aoki, Unger, Soeldner, and Cahill

ing a peripheral effect (26) in reducing circulatingamino acid levels. That the former is important hasrecently been demonstrated by Mallette, Exton, andPark (36) with physiological glucagon doses in isolatedperfused livers of fed rats. Indeed, the following fourdifferent patterns of response were shown: (a) uptakeof histidine, the only amino acid with resting uptake oroutput, was unchanged by glucagon; (b) uptake ofglycine, alanine, phenylalanine, arginine, and lysine wasstimulated; (c) output of leucine, isoleucine, and valineresulted; (d) tyrosine, methionine, and tryptophan han-dling did not change. Furthermore, the alterations inextracellular and intracellular concentration of freeamino acids suggested that the observed response re-sulted from one or a combination of the followingmechanisms: (a) increased intracellular utilization, forexample, for gluconeogenesis, (b) stimulation of inwardtransport, and (c) intracellular production, as fromproteolysis.
The most striking difference between these findingsin vitro and those of the present study is that, with noimportant exception, all circulating amino acids mea-sured decreased in concentration at least transiently.This may be accounted for by one or more of threepossibilities: (a) species differences, (b) difference inthe dose levels administered, or (c) presence of otherresponses in vivo which might obscure a similar effectin hepatic proteolysis and hepatic production of certainamino acids (36).
Levels of glucagon in the portal vein in the post-absorptive state are probably 500-800 ,Ag/ml, as esti-mated from values determined in prancreaticoduodenalveins of dogs (15), which have similar peripheral veinconcentrations to those in man. Thus, in order thatperipheral vein levels double (as observed in earlyfasting), it would be anticipated that portal vein con-centrations would increase at least twofold. The currentstudies employing 1 mg/24 hr showed hyperglycemiaand stimulated gluconeogenesis with peripheral levelsof glucagon of 700-1400 uiug/ml. This suggests that theobserved elevations in endogenous peripheral glucagonlevels early in fasting reflect levels in portal bloodwhich would be expected to stimulate hepatic gluco-neogenesis, further confirming an important regulatoryrole in fasting.
The studies employing 0.1 mg of glucagon per 24 hrdemonstrate the exquisite sensitivity of the amino acidlowering effect. Kaminsky and colleagues (37), infusing1.5 times this amount into postabsorptive man, recentlyshowed highly significant increases in plasma cyclic3',5'-adenosine monophosphate concentration, furtherevidence of an effect at low levels. In light of the highconcentrations of glucagon to which the liver is alwaysexposed as compared with the periphery, the increment
in the 0.1 mg/24 hr infusions is proportionally greaterat the periphery (75%) than at the liver (probably lessthan 20%). This, in addition to the absence of increasedurea excretion, suggests that an extrahepatic site maycontribute to the hypoaminoacidemia. Whatever thelocus of this effect, its demonstration at physiologiclevels clearly implicates glucagon as an important regu-lator of amino acid metabolism.
Finally, the levels of glucagon obtained with the twolower rates of infusion confirm the accuracy of theglucagon determinations. Distribution of the infusedhormone into the extracellular fluid with an estimatedhalf-time of disappearance of 10-15 min would be ex-pected to induce the magnitude of rise observed. Theendogenous levels reported are thus validated as bonafide estimates of pancreatic glucagon.
ACKNOWLEDGMENTSWe wish to express our appreciation to Miss PatriciaBarlas and to Mrs. Dzidra Rumba, Adacie Allen, VeltaRamolins, and Anna Karras and to Mr. Lynn Lowe for theirdedicated technical assistance; to Dr. Ray Gleason for valua-ble suggestions regarding the statistical analyses; and to thenurses and staff of The Clinical Center at the Peter BentBrigham Hospital.
This work was supported in part by U. S. Public HealthService grants, AM-05077, AM-09584, AM-09748, AM-02700,and FR-31, and the John A. Hartford Foundation, Inc.,New York.
REFERENCES1. Mialhe, P. 1958. Glucagon, insuline et regulation endo-
crine de la glycemie chez le canard. Acta Endocrinol. 28(Suppl. 36): 134.
2. Mikami, S.-I., and K. Ono. 1962. Glucagon deficiencyinduced by extirpation of alpha islets of the fowl pan-creas. Endocrinology. 71: 464.
3. Unger, R. H., A. M. Eisentraut, M. S. McCall, andL. L. Madison. 1962. Measurements of endogenous glu-cagon in plasma and the influence of blood glucose con-centration upon its secretion. J. Clin. Invest. 41: 682.
4. Assan, R., G. Rosselin, and J. Dolais. 1967. Effets surla glucagonemie des perfusions et ingestions d'acidesamines. Journees Annuells de Diabetologie de l'HotelDieu. 7: 25.
5. Benedict, F. G. 1915. A study of prolonged fasting.Carnegie Inst. Wash. Publ. 203.
6. Aguilar-Parada, E., A. M. Eisentraut, and R. H. Unger.1969. Effects of starvation on plasma pancreatic glu-cagon in normal man. Diabetes. 18: 717.
7. Unger, R. H., A. Ohneda, E. Aguilar-Parada, and A. M.Eisentraut. 1969. The role of aminogenic glucagon se-cretion in blood glucose homeostasis. J. Clin. Invest. 48:810.
8. Owen, 0. E., P. Felig, A. P. Morgan, J. Wahren, andG. F. Cahill, Jr. 1969. Liver and kidney metabolismduring prolonged starvation. J. Clin. Invest. 48: 574.
9. Sokal, J. E., and E. Z. Ezdinli. 1967. Basal plasma glu-cagon levels of man. J. Clin. Invest. 46: 778.
10. Felig, P., 0. E. Owen, J. Wahren, and G. F. Cahill, Jr.1969. Amino acid metabolism during prolonged starva-tion. J. Clin. Invest. 48: 584.
Glucagon in Fasting Man 2269

11. Pagliara, A. S., and A. D. Goodman. 1969. Elevation ofplasma glutamate in gout. Its possible role in the patho-genesis of hyperuricemia. N. Engl. J. lIed. 281: 767.
12. Unger, R. H., E. Aguilar-Parada, W. A. Muller, andA. M. Eisentraut. 1970. Studies of pancreatic alpha cellfunction in normal and diabetic subjects. J. Clin. Invest.49: 837.
13. Cahill, G. F., Jr., M. G. Herrera, A. P. Morgan, J. S.Soeldner, J. Steinke, P. L. Levy, G. A. Reichard, Jr., andD. M. Kipnis. 1966. Hormone-fuel interrelationshipsduring fasting. J. Clin. Invest. 45: 1751.
14. Snedecor, G. W. 1956. Statistical Methods. Applied toExperiments in Agriculture Biology. Iowa State Col-lege Press, Ames, Iowa. 5th edition.
15. Unger, R. H., A. Ohneda, E. Ajuilar-Parada, and A. M.Eisentraut. 1969. The role of aminogenic glucagon se-cretion in blood glucose homeostasis. J. Clin. Invest. 48:810.
16. Lambert, A. E., and J. J. Hoet. 1965. Diurnal patternof plasma insulin concentration in the human. Diabeto-logia. 2: 69.
17. Faiman, C., and J. A. Moorhouse. 1967. Diurnal varia-tion in the levels of glucose and related substances inhealthy and diabetic subjects during starvation. Clin.Sci. (London). 32: 111.
18. Feigin, R. D. 1969. Blood and urine amino acid aber-rations. Physiologic and pathological changes in patientswithout inborn errors of amino acid metabolism. Anter.J. Dis. Child. 117: 24.
19. Young, V. R., M. A. Hussein, E. Murray, and N. S.Scrimshaw. 1969. Tryptophan intake, spacing of meals,and diurnal fluctuations of plasma tryptophan in men.Amer. J. Clin. Nutr. 22: 1563.
20. Unger, R. H., A. M. Eisentraut, and L. L. Madison.1963. The effects of total starvation upon the levels ofcirculating glucagon and insulin in man. J. Clin. Invest.42: 1031.
21. Mackrell, D. J., and J. E. Sokal. 1969. Antagonism be-tween the effects of insulin and glucagon on the isolatedliver. Diabetes. 18: 724.
22. Lewis, S. B., J. H. Exton, R. J. Ho, and C. R. Park.1970. Dose responses of glucagon (2 X 10¹² to 1 X 10⁶M) in the perfused rat liver. Fed. Proc. 29: 379. (Abstr.)
23. Felig, P., E. Marliss, T. Pozefsky, and G. F. Cahill,Jr. 1970. Amino acid metabolism in the regulation of glu-coneogenesis in man. Amer. J. Clin. Nutr. 23: 986.
24. Felig, P., T. Pozefsky, E. Marliss, and G. F. Cahill, Jr.1970. Alanine: key role in gluconeogenesis. Science(Washington) . 167: 1003.
25. Felig, P., E. Marliss, and G. F. Cahill, Jr. 1969. Plasmaamino acid levels and insulin secretion in obesity. N.Engl. J. Med. 281: 811.
26. Pozefsky, T., P. Felig, J. D. Tobin, J. S. Soeldner, andG. F. Cahill, Jr. 1969. Amino acid balance across tissuesof the forearm in postabsorptive man. Effects of insulinat two dose levels. J. Clin. Invest. 48: 2273.
27. Salter, J. M., C. Ezrin, J. C. Laidlaw, and A. G. Gornall.1960. Metabolic effects of glucagon in human subjects.Metab. (Clin. Exp.) 9: 753.
28. Goodman, A. D., R. E. Fuisz, and G. F. Cahill, Jr. 1966.Renal gluconeogenesis in acidosis, alkalosis, and potas-sium deficiency: its possible role in regulation of renal am-monia production. J. Clin. Invest. 45: 612.
29. Hagen, J. H. 1961. Effects of glucagon on the metabolismof adipose tissue. J. Biol. Chem. 236: 1023.
30. Lefebvre, P. 1966. The physiological effect of glucagonon fat-mobilisation. Diabetologia. 2: 130.
31. Landau, R. L., and K. Lugibihl. 1969. Effect of glucagonon concentration of several free amino acids in plasma.Metab. (Clin. Exp.) 18: 265.
32. Bromer, W. W., and R. E. Chance. 1969. Zinc glucagondepression of blood amino acids in rabbits. Diabetes. 18:748.
33. Bondy, P. K.., and L. R. Cardillo. 1956. The effects ofglucagon on carbohydrate metabolism in normal humanbeings. J. Clin. Invest. 35: 494.
34. Kibler, R. F., W. J. Taylor, and J. D. Myers. 1964. Theeffect of glucagon on net splanchnic balances of glucose,amino acid nitrogen, urea, ketones, and oxygen in man.J. Clin. Invest. 43: 904.
35. Shoemaker, W. C., and T. B. Van Itallie. 1960. Thehepatic response to glucagon in the unanesthetized dog.Endocrinology. 66: 260.
36. Mallette, L. E., J. H. Exton, and C. R. Park. 1969. Ef-fects of glucagon on amino acid transport and utilizationin the perfused rat liver. J. Biol. Chem. 244: 5724.
37. Kaminsky, N. I., J. H. Ball, A. E. Broadus, J. G. Hard-man, E. W. Sutherland, and G. W. Liddle. 1970. Hor-monal effects on extracellular cyclic nucleotides in man.Clin. Res. 18: 528.
2270 Marliss, Aoki, Unger, Soeldner, and Cahill