Consulting the Experts: Prandial Insulin or a GLP-1 Receptor Agonist as Add-On to Basal Insulin
Upload
trinhhuongCategory
view
225download
2
GLP-1 Agonists And
Insulin Therapy
Steven V. Edelman, MDProfessor of Medicine
University of California San Diego School of MedicineVeterans Affairs Medical Center
Founder and Director, Taking Control of Your Diabetes, 501(c) 3

T2D –
Type 2 Diabetes A1C –
HbA1c or Glycated hemoglobin (1)
Abstract 0278-OR presented at ADA’s 71st Scientific Sessions in June 2011, and published online in Diabetes, Obesity and Metabolism on May 30, 2012
(2) Adapted from IMS data
3) Includes all types of basal insulinsLixisenatide was in-licensed from Zealand Pharma A/S. Lyxumia®
is the intended trademark for lixisenatide. Lixisenatide is currently not approved or licensed anywhere in the world
Riccardo Perfetti, MD, PhD

In patients controlled with basal insulin, PPG –
not FBG –
is the major contributor to
hyperglycaemia
42 41 42 43 48
58 59 58 57 52
0
10
20
30
40
50
60
70
80
90
100
<6.5 6.5–˂7.0 7.0–˂7.5 7.5–˂8.0 ≥8.0
% o
f pat
ient
s
HbA1c (%)
Basal hyperglycaemia
Postprandial hyperglycaemia
Relative contributions of FBG and PPG hyperglycaemia to overall hyperglycaemia at Week 24/28 in patients receiving insulin glargine (N=1699)
Riddle et al. Diabetes Care 2011;34:2508–14
Targeting FBG and PPG control is essential for optimal clinical outcomes
Data are pooled from six similarly designed, randomized, controlled trials of patients with T2DM suboptimally controlled on OADs
Options for additional control beyond basal insulin
Prandial insulin
Advantages Disadvantages
Effective in controlling PPG Increased risk of hypoglycaemia
Weight gain
GLP-1 receptor agonists
Advantages Disadvantages
Low rates of hypoglycaemia Nausea mainly on initiation
Weight loss in some patients
Effective in controlling PPG
The Goals For T2D Management Today Include
•
Optimal glucose control – A1c, FPG, PPG
•
Minimal hypoglycemia •
Weight loss or no weight gain

Exenatide Added to Insulin Glargine-Treated Patients with Type 2 Diabetes
Richard M Bergenstal, MD; John B Buse, MD, PhD; Leonard C Glass, MD; Cory R Heilmann, PhD; Michelle S Lewis, PhD; Anita YM Kwan, MS;
Byron J Hoogwerf, MD; Julio Rosenstock, MD

Study ObjectivesPrimary ObjectiveExenatide BID plus optimized titration of basal insulin, glargine, (OG+EXE BID) is superior to placebo plus optimized titration of basal insulin, glargine, (OG+PLB BID) as measured by change in A1C from baseline to Week 30
Secondary Endpoints•7-Point self-monitored blood glucose (SMBG) profiles•1,5-Anhydroglucitol•Change in body weight•Change in insulin dose•Self-reported hypoglycemic episodes and treatment-emergent adverse events (TEAEs)

Screening
Insulin Glargine + OAMs
Randomization
OG+EXE BID
OG+PLB BID
Weeks of treatment0 4 30
5μg EXE 10μg EXE
Study End
Study Design
-2

Baseline
Characteristics (ITT)EXE BID PLB BID
N 137 122Female (n [%]) 67 (49) 44 (36)Age (y) 59 ±
9 59 ±
10Weight (kg) 95.4 ±
20.4 93.4 ±
21.2BMI (kg/m2) 33.8 ±
5.8 33.1 ±
6.2A1C (%) 8.32 ±
0.85 8.50 ±
0.96Diabetes duration (y) 12 ±
7 12 ±
7FBG (mmol/L) 7.9 ±
2.1 8.3 ±
2.3Insulin Dose (U/kg) 0.51 ±
0.28 0.50 ±
0.24Systolic BP (mmHg) 130.0 ±
15.9 128.1 ±
13.4Diastolic BP (mmHg) 75.8 ±
9.8 74.5 ±
8.7OAMs (n [%])
NoneMetforminPioglitazoneMetformin+Pioglitazone
21 (15)91 (66)
2 (2)23 (17)
17 (14)91 (75)6 (5)8 (7)

-2
-1.5
-1
-0.5
0
0.5
0 18 30
Axis Tit
le 7.41 0.09%
6.70 0.09%
A1C Change from Baseline
LSMean ±
SE
A1C
Cha
nge
(%)
Weeks
OG+EXE BID (Baseline 8.3
0.1%)OG+PLB BID (Baseline 8.5
0.1%)
**
*
**
**
†
**
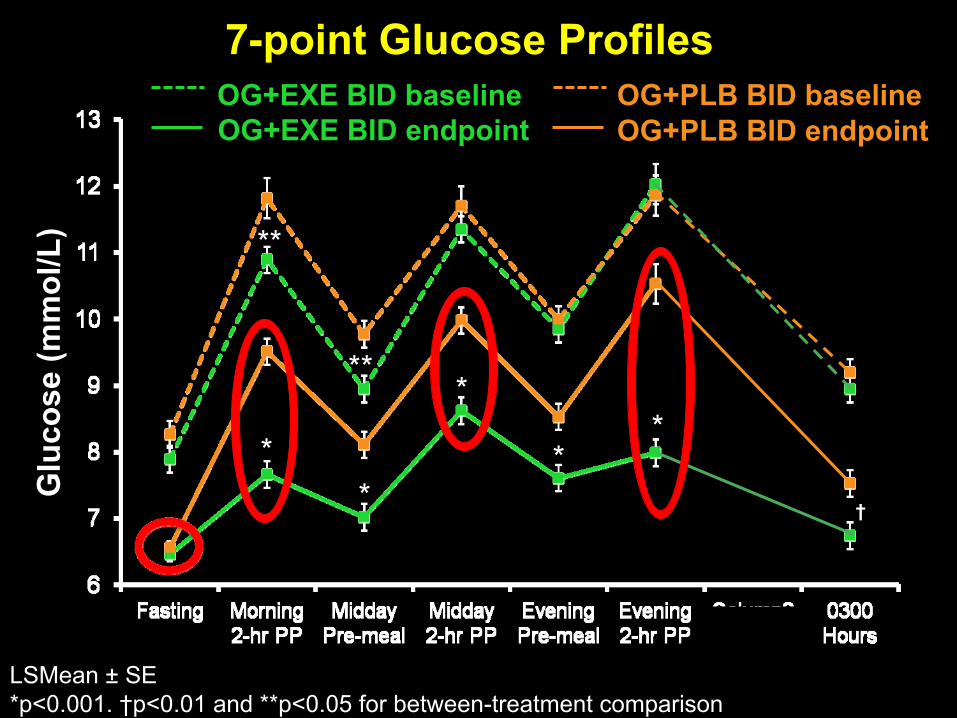
OG+EXE BID baselineOG+EXE BID endpoint
OG+PLB BID baselineOG+PLB BID endpoint
7-point Glucose ProfilesG
luco
se (m
mol
/L)
LSMean ±
SE*p<0.001. †p<0.01 and **p<0.05 for between-treatment comparison
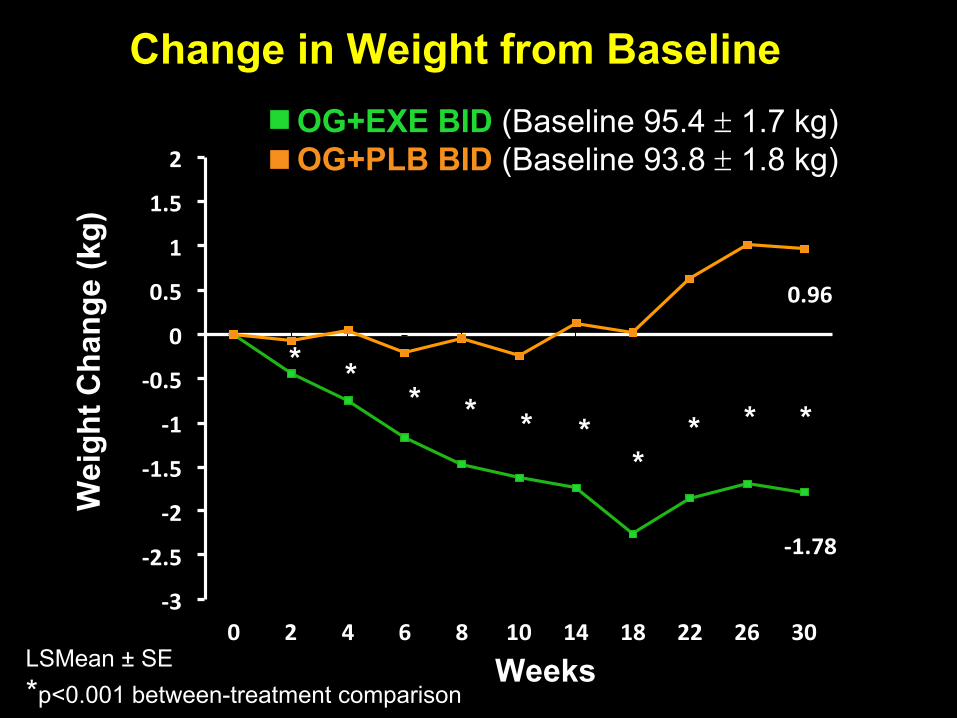
‐1.78
0.96
‐3
‐2.5
‐2
‐1.5
‐1
‐0.5
0
0.5
1
1.5
2
0 2 4 6 8 10 14 18 22 26 30
** * * *
** * *
Change in Weight from BaselineW
eigh
t Cha
nge
(kg)
Weeks
OG+EXE BID (Baseline 95.4
1.7 kg)OG+PLB BID (Baseline 93.8
1.8 kg)
LSMean ±
SE *p<0.001 between-treatment comparison
*

-4 -3 -2 -1 1 2 3 4-15
-10
-5
5
10
15
0
0
-4 -3 -2 -1 1 2 3 4-15
-10
-5
5
10
15
0
0
OG+EXE BID OG+PLB BID
46% 8%
41% 5%
1%
4%
31%
64%
Weight Change vs. A1C Change
Values are for Week 30 completers
A1C Change (%) A1C Change (%)
Wei
ght C
hang
e (%
)
Wei
ght C
hang
e (%
)

Insulin Dose EXE BID PLB BID
Baseline (U/day)
Endpoint (U/day)
49 ±
2
62 ±
2
47 ±
3
69 ±
2
Baseline (U/kg)
Endpoint (U/kg)
0.51 ±
0.02
0.66 ±
0.02
0.51 ±
0.02
0.71 ±
0.02
LSMean ± SE
Change in Insulin Dose from Baseline

EXE BID PLB BIDMinor Hypoglycemia (n [%])
Overall incidence* 34 (25%) 35 (29%)
Rate (episodes/patient/year)* 1.4 1.2Adverse Events
(n [%])
Nausea† 56 (41%) 10 (8%)
Diarrhea† 25 (18%) 10 (8%)
Vomiting† 25 (18%) 5 (4%)
Headache† 19 (14%) 5 (4%) Constipation† 14 (10%) 2 (2%)
One patient in the placebo arm had 2 episodes of major nocturnal
hypoglycemia *No significant differences between groups†
p<0.05, between-group comparison
Safety and Adverse Events

EXE BID PLB BID P-value*
Systolic BP (mmHg)EndpointChange
125.8 ±
1.2-2.7 ±
1.2130.2 ±
1.3+1.7 ±
1.3 0.011
Diastolic BP (mmHg)Endpoint Change
73.3 ±
0.7-1.7 ±
0.776.7 ±
0.7+1.7 ±
0.7 <0.001
Heart Rate (bpm) Endpoint Change
76.7 ±
0.8+2.3 ±
0.873.8 ±
0.8-0.7 ±
0.8 0.008
Change in Blood Pressure and Heart Rate
Data presented as LSMean ±
SE; *
between-group comparison

Lixisenatide, a novel once-daily GLP-1 receptor agonist for the treatment of Type 2 diabetes:
an ideal candidate for combination with basal insulin
Riccardo Perfetti, MD, PhDVice President, Global Medical Affairs
Diabetes Division, Sanofi
Mea
n ch
ange
from
pre
-mea
l pl
asm
a gl
ucos
e (m
g/dL
) SE
M
–30
0
30
60
90
Time after study drug administration (h)4.53.52.52.01.51.0
LIXISENATIDEDay –1 Day –28
LIRAGLUTIDEDay –1 Day –28
Test meal
0.5
Test drug
0 4.03.0
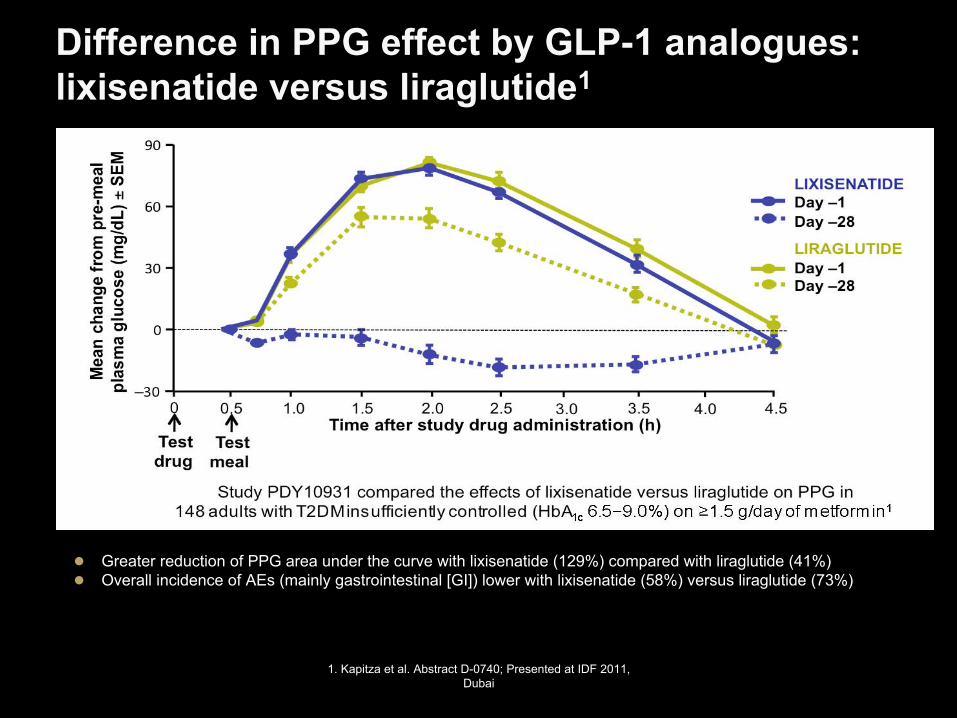
Difference in PPG effect by GLP-1 analogues: lixisenatide versus liraglutide1
26
Study PDY10931 compared the effects of lixisenatide versus liraglutide on PPG in 148 adults with T2DM insufficiently controlled (HbA1c
6.5−9.0%) on ≥1.5 g/day of metformin1
Greater reduction of PPG area under the curve with lixisenatide (129%) compared with liraglutide (41%)
Overall incidence of AEs (mainly gastrointestinal [GI]) lower with lixisenatide (58%) versus liraglutide (73%)
1. Kapitza et al. Abstract D-0740; Presented at IDF 2011, Dubai
SEM=standard
error of the mean; AE=adverse events

Lixisenatide GetGoal clinical trial programme
Study Objectives # of pts
ClinicalTrials.gov Identifier
GetGoal-Mono Efficacy and safety of monotherapy(1-
or 2-step dose increase) 361 NCT00688701
GetGoal-Mono Japan Safety and efficacy of monotherapy in Asian patients (1-
or 2-step dose increase) 69 NCT00905255
GetGoal-M Efficacy and safety in combination with MET 680 NCT00712673
GetGoal-M-Asia Efficacy and safety in combination with MET (+
SU) 391 NCT01169779
GetGoal-F1 Efficacy and safety in combination with MET
(1 or 2-step dose increase) 482 NCT00763451
GetGoal-S Efficacy and safety in combination with SU (+
MET) 859 NCT00713830
GetGoal-P Efficacy and safety in combination with pioglitazone (+
MET) 484 NCT00763815
GetGoal-X Efficacy and safety head-to-head vs exenatide (+
MET) 634 NCT00707031
GetGoal-L Efficacy and safety in combination with basal insulin (+
MET) 496 NCT00715624
GetGoal-L Asia Efficacy and safety in combination with basal insulin (+
SU) 311 NCT00866658
GetGoal-Duo1 Efficacy and safety in combination with insulin glargine + MET (± TZDs) 446 NCT00975286

10 µg
15 µg
10 µg
15 µg
20 µg
20 µg
GetGoal-L-Asia: study design
Lixisenatide + basal insulin ±SU (n=154)
Placebo + basal insulin ±SU (n=157)
Diet and lifestyle counselling every 3 monthsScreening criteria:Asian patients with
T2DM for ≥1 year on stable basal insulin with HbA1c 7–10%, stratified by HbA1c
and SU use
n=311
Seino et al. Diabetes Obes Metab 2012 doi: 10.1111/j.1463-1326.2012.01618.x
R=randomization; ClinicalTrials.gov identifier NCT00866658
R
–3 0–1 1 2 6 8 24
Screening Run-in
4 12 16 20
Primary endpoint
Double-blind period of 24 weeks
Visit week

0.2 +0.1%
–0.8%
0
–0.2
–0.4
–0.6
–0.8
–1.0
LS m
ean
chan
ge in
HbA
1c(%
)
Week 24 LOCF*
p<0.0001
GetGoal-L-Asia primary efficacy endpoint: change in HbA1c
from baseline to Week 24Placebo + basal insulin (n=154)
Seino et al. Diabetes Obes Metab 2012 doi: 10.1111/j.1463-1326.2012.01618.x
Modified intent-to-treat (mITT) population; *LOCF (on treatment value available) analysis for least squared mean or mean change at Week 24
Lixisenatide + basal insulin (n=146)
8.8
Week
8.6
8.4
8.2
8.0
7.8
7.6
7.4
7.2
7.0Baseline 4 8 12 16 20 24
Mea
n H
bA1c
(%) ±
SE
Week 24 LOCF*
8.6%
7.6%
LS mean difference vs placebo: –0.9%
(95% CI: –1.1 to –0.7)

GetGoal-L-Asia: change in 2-hour PPG and glucose excursion at 24 weeks
Placebo + basal insulin (n=142)Lixisenatide + basal insulin (n=131)
Seino et al. Diabetes Obes Metab 2012 doi: 10.1111/j.1463-1326.2012.01618.x
mITT population, LOCF (on treatment value available) analysis for least squared mean change at Week 24; *After a standardized breakfast meal test of Ensure Plus®
Drink (Abbot; contains 600 kilocalories with 54% carbohydrate, 17% protein and 29% fat); †2-hour PPG –
plasma glucose 30 minutes prior to meal test (before study drug administration)
LS mean difference vs placebo: –7.8 mmol/L
(95% CI: –8.9 to –6.8)LS mean difference vs placebo: –7.2 mmol/L
(95% CI: –8.3 to –6.2)
2-hour PPG*1
0
–1
–2
–3
–4
–5
–6
–8
–7
p<0.0001 p<0.0001
Glucose excursion†1
0
–1
–2
–3
–4
–5
–6
–8
–7

GetGoal-L-Asia: change in body weight 24 Weeks
1.
Data on file2.
Seino et al. Diabetes Obes Metab 2012 doi: 10.1111/j.1463-1326.2012.01618.x
mITT population; LS Mean Change from baseline to Week 24 (LOCF)
0
0.2
–2.0
–4.0
p=0.0857
LS m
ean
chan
ge (k
g)
Placebo + basal insulin (n=157)Lixisenatide + basal insulin (n=150)

GetGoal-L-Asia: adverse events over 24 weeks
Adverse event, n (%)
Lixisenatide + basal insulin
(n=154)
Placebo + basal insulin
(n=157)
Any TEAE 137 (89.0) 110 (70.1)
Serious TEAE 10 (6.5) 9 (5.7)
TEAE leading to death 0 1 (0.6)
TEAE leading to discontinuation 14 (9.1) 5 (3.2)
GI disorders (all)NauseaVomitingDiarrhoea
94 (61.0)61 (39.6) 28 (18.2) 10 (6.5)
23 (14.6)7 (4.5 ) 3 (1.9)4 (2.5)
Seino et al. Diabetes Obes Metab 2012 doi: 10.1111/j.1463-1326.2012.01618.x
Data are for the safety population (all patients who received ≥1 dose of study treatment); TEAE=treatment-emergent adverse event

GetGoal-L-Asia: symptomatic hypoglycaemia
All patients
Placebo + basal insulin (n=157)Lixisenatide + basal insulin (n=154)
91
Patients not receiving SU
Seino et al. Diabetes Obes Metab 2012 doi: 10.1111/j.1463-1326.2012.01618.x
•No episodes of severe hypoglycaemia reportedData are for the safety population (all patients who received ≥1 dose of study treatment)
n=13 n=15n=37 n=66

10 µg
15 µg
10 µg
15 µg
20 µg
20 µg
GetGoal-L: study design
Lixisenatide + basal insulin ± metformin (n=329)
Placebo + basal insulin ± metformin (n=167)
Diet and lifestyle counselling every 3 months
Screening Criteria:T2DM for ≥1 year on stable basal insulin with HbA1c 7–10%, stratified by HbA1c
(<8%/≥8%) and metformin use
n=496
Riddle et al. Abstract 983-P; Presented at ADA 2012. Philadelphia, PA
R
Double-blind period of 24 weeks
–3 0–1
Screening Run-In
24
Primary endpoint
1 2 6 84 12 16 20(Phone call visit)
Visit week
ClinicalTrials.gov Identifer NCT00715624

GetGoal-L primary efficacy endpoint: change in HbA1c
from baseline to Week 24
mITT population; *LOCF (on treatment value available) analysis for least squared mean or mean change at Week 24
Lixisenatide + basal insulin (n=304) Placebo + basal insulin (n=158)
Riddle et al. Abstract 983-P; Presented at ADA 2012. Philadelphia, PA
8.6
8.4
8.2
8.0
7.8
7.6
7.4
Mea
n H
bA1c
(%) ±
SE
7.2
Week0 4 8 12 16 20 24 Week 24
LOCF*
LS mean difference vs placebo: –0.4%
(95% CI: –0.6 to –0.2)
8.1%
7.8%
0
–0.2
–0.4
–0.6
–0.8
LS m
ean
chan
ge in
HbA
1c(%
)
Week 24 LOCF*
p<0.001

GetGoal-L: change in 2-hour PPG and glucose excursion at 24 weeks
Lixisenatide + basal insulin (n=235)
2-hour PPG*
–1.7
–5.5
Glucose excursion†
–0.3
–4.1
0
–1
–2
–3
–4
–5
–6
0
–0.5
–1.0
–1.5
–2.0
–2.5
–3.0
–3.5
–4.0
–4.5
mITT population, LOCF (on treatment value available) analysis for least squared mean change at Week 24; *After a standardized breakfast meal test of Ensure Plus®
Drink (Abbot; contains 600 kilocalories with 54% carbohydrate, 17% protein and 29% fat); †2-hour PPG –
plasma glucose 30 minutes prior to meal test (before study drug administration)
Riddle et al. Abstract 983-P; Presented at ADA 2012. Philadelphia, PA
LS mean difference vs placebo: –3.8 mmol/L
(95% CI: –4.7 to –2.9)LS mean difference vs placebo: –3.8 mmol/L
(95% CI: –4.6 to –3.0)
Placebo + basal insulin (n=123)Lixisenatide + basal insulin (n=233)Placebo + basal insulin (n=123)
p<0.0001 p<0.0001

GetGoal-L: change in body weight at Week 24
Placebo + basal insulin (n=161)Lixisenatide + basal insulin (n=311)
mITT population; LS Mean Change from baseline to Week 24 (LOCF)
LS mean difference vs placebo: –1.3 kg
(95% CI: –1.8 to –0.7)
0
–0.5
–1.0
–1.5
–2.0p<0.0001
LS m
ean
chan
ge (k
g)
Riddle et al. Abstract 983-P; Presented at ADA 2012. Philadelphia, PA

GetGoal-L: adverse events over 24 weeks
Adverse event, n (%)
Lixisenatide + basal insulin
(n=328)
Placebo + basal insulin (n=167)
Any TEAE 241 (73.5) 114 (68.3)
Any serious TEAE 12 (3.7) 7 (4.2)
Death 1 (0.3) 0
TEAE leading to discontinuationGastrointestinal disorders
25 (7.6)14 (4.3)
8 (4.8)2 (1.2)
GI disorders (all)NauseaVomitingDiarrhoea
132 (40.2)86 (26.2) 27 (8.2) 24 (7.3)
34 (20.4)14 (8.4) 1 (0.6)9 (5.4)
Data are for the safety population (all patients who received ≥1 dose of study treatment)
Riddle et al. Abstract 983-P; Presented at ADA 2012. Philadelphia, PA

GetGoal-L: symptomatic hypoglycaemia over 24 weeks
Data are for the safety population (all patients who received ≥1 dose of study treatment)
Type, n (%)Lixisenatide
+ basal insulin (n=328)Placebo
+ basal insulin (n=167)Symptomatic hypoglycaemia
Blood glucose <60 mg/dL91 (27.7)87 (26.5)
36 (21.6)35 (21.0)
Severe symptomatic hypoglycaemia Blood glucose <60 mg/dL
4 (1.2)3 (0.9)
00
Riddle et al. Abstract 983-P; Presented at ADA 2012. Philadelphia, PA

GetGoal-Duo1: study design
Rosenstock et al. Abstract 062-OR; Presented at ADA 2012, Philadelphia, PA
*This was changed from ≤126 mg/dL in July 2010; ClinicalTrials.gov Identifer: NCT00975286; MET=metformin
2-weekscreening
Screening Criteria:•T2DM for ≥1 year •MET ≥1.5 g/day ±TZDs ± SU or Glinide•HbA1c
: ≥7.0%
and ≤10%
N=1470
n=898
Glargine titrated to FPG target 80–100 mg/dL
10
15
10
15
20
20
Glargine + metformin + PLACEBO
± TZDs
Glargine + metformin + LIXISENATIDE
± TZDs
12-week
Run-In
Rn=446
n=825
Glargine + metformin (±TZDs) Randomized if criteria met:
• HbA1C
≥7% and ≤9%• Mean FPG ≤140 mg/dL* (7 days end of Run-in)
Lixisenatide titration Lixisenatide maintenance
(n=223)
(n=223)
24-week-double-blind period
Glargine weekly titration;target FPG 80–100 mg/dL

GetGoal-Duo1 primary efficacy endpoint: change in HbA1c
from baseline to Week 24
mITT population; * LOCF (on treatment value available) analysis for least squared mean or mean change at Week 24; SCR=screening
Placebo + insulin glargine + metformin (n=221)Lixisenatide + insulin glargine + metformin (n=215)
Rosenstock et al. Abstract 062-OR; Presented at ADA 2012, Philadelphia, PA
Mea
n H
bA1c
(%) ±
SE
SCR–12 24Week
6.66.8
–8 –4 –1 4 8 16
7.07.27.47.67.88.08.28.4
8.8
0
8.6
7.6
7.6
Glargine + MET (±TZDs) Lixisenatide OR placebo + MET (±TZDs)
Week 24 LOCF*
7.3%
7.0%
LS mean difference vs placebo: –0.3%
(95% CI: –0.5 to –0.2)
0
–0.2
–0.4
–0.6
–0.8
LS m
ean
chan
ge in
HbA
1c(%
)
Week 24 LOCF*
p<0.0001

GetGoal-Duo1: change in 2-hour PPG and glucose excursion at 24 weeks
Placebo + insulin glargine + metformin (n=204)Lixisenatide + insulin glargine + metformin (n=194)
mITT population, LOCF (on treatment value available) analysis for least squared mean change at Week 24; *After a standardized breakfast meal test of Ensure Plus®
Drink (Abbot; contains 600 kilocalories with 54% carbohydrate, 17% protein and 29% fat); †2-hour PPG –
plasma glucose 30 minutes prior to meal test (before study drug administration)
2-hour PPG*+0.1
–3.1
Glucose excursion†
–0.3
–3.4
LS m
ean
chan
ge (m
mol
/L)
0
–0.5
–1.0
–1.5
–2.0
–2.5
–3.0
–3.5
LS m
ean
chan
ge (m
mol
/L)
Rosenstock et al. Abstract 062-OR; Presented at ADA 2012, Philadelphia, PA
LS mean difference vs placebo: –3.2 mmol/L
(95% CI: –4.0 to –2.4)LS mean difference vs placebo: –3.1 mmol/L
(95% CI: –3.8 to –2.3)
p<0.0001

1.2
0.3
0
0.2
0.4
0.6
0.8
1.0
LS m
ean
chan
ge (k
g)1.2
1.4 p=0.0012
GetGoal-Duo1: change in body weight at Week 24
Placebo + insulin glargine + metformin (n=220)Lixisenatide + insulin glargine + metformin (n=217)
mITT population; LS Mean Change from baseline to Week 24 (LOCF)
LS mean difference vs placebo: –0.9 kg
(95% CI: –1.4 to –0.4)
Rosenstock et al. Abstract 062-OR; Presented at ADA 2012, Philadelphia, PA
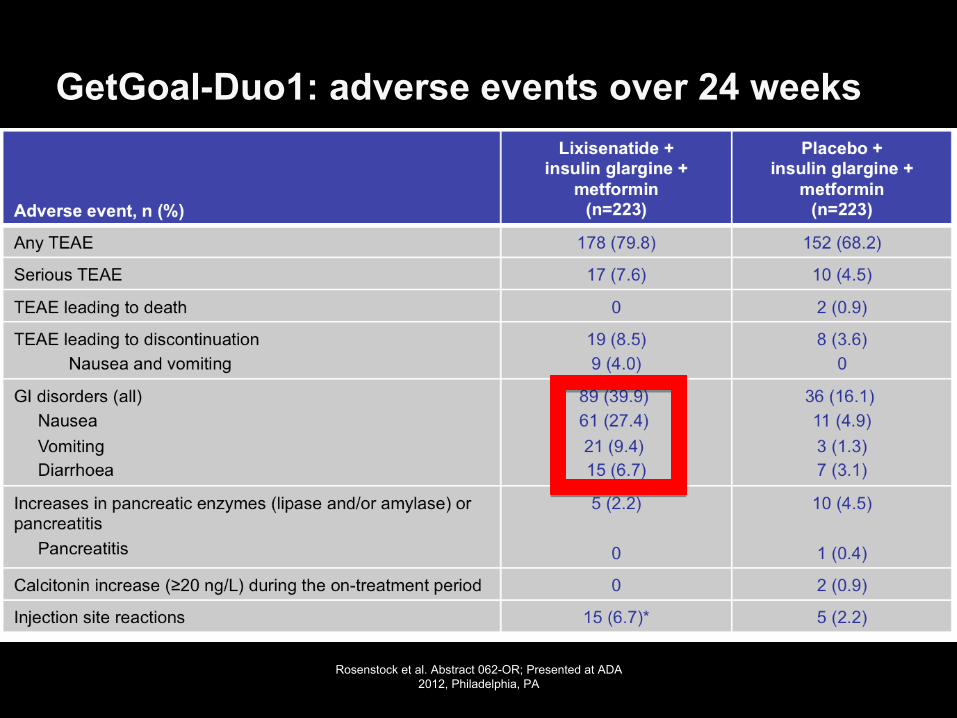
GetGoal-Duo1: adverse events over 24 weeks
Adverse event, n (%)
Lixisenatide + insulin glargine +
metformin
(n=223)
Placebo + insulin glargine +
metformin
(n=223)
Any TEAE 178 (79.8) 152 (68.2)
Serious TEAE 17 (7.6) 10 (4.5)
TEAE leading to death 0 2 (0.9)
TEAE leading to discontinuationNausea and vomiting
19 (8.5)9 (4.0)
8 (3.6)0
GI disorders (all)NauseaVomitingDiarrhoea
89 (39.9)61 (27.4) 21 (9.4) 15 (6.7)
36 (16.1)11 (4.9)3 (1.3)7 (3.1)
Increases in pancreatic enzymes (lipase and/or amylase) or pancreatitis
Pancreatitis
5 (2.2)
0
10 (4.5)
1 (0.4)
Calcitonin increase (≥20 ng/L) during the on-treatment period 0 2 (0.9)
Injection site reactions 15 (6.7)* 5 (2.2)
*Two patients (0.9%) discontinued due to injection site reactions; Data are for the safety population (all patients who received
≥1 dose of study treatment)
Rosenstock et al. Abstract 062-OR; Presented at ADA 2012, Philadelphia, PA
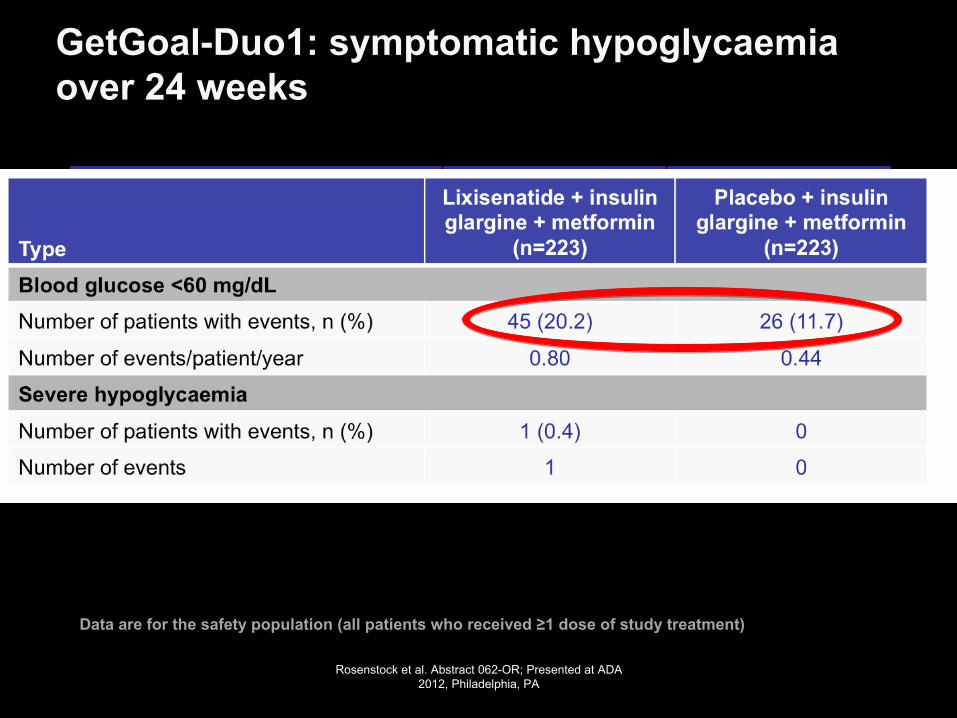
GetGoal-Duo1: symptomatic hypoglycaemia over 24 weeks
Type
Lixisenatide + insulin glargine + metformin
(n=223)
Placebo + insulin glargine + metformin
(n=223)Blood glucose <60 mg/dL
Number of patients with events, n (%) 45 (20.2) 26 (11.7)
Number of events/patient/year 0.80 0.44
Severe hypoglycaemia
Number of patients with events, n (%) 1 (0.4) 0
Number of events 1 0
Data are for the safety population (all patients who received ≥1 dose of study treatment)
Rosenstock et al. Abstract 062-OR; Presented at ADA 2012, Philadelphia, PA

I ned to get these slides

61%
43% of 39%
17% of 39%n=987
n=498
n=162
n=161

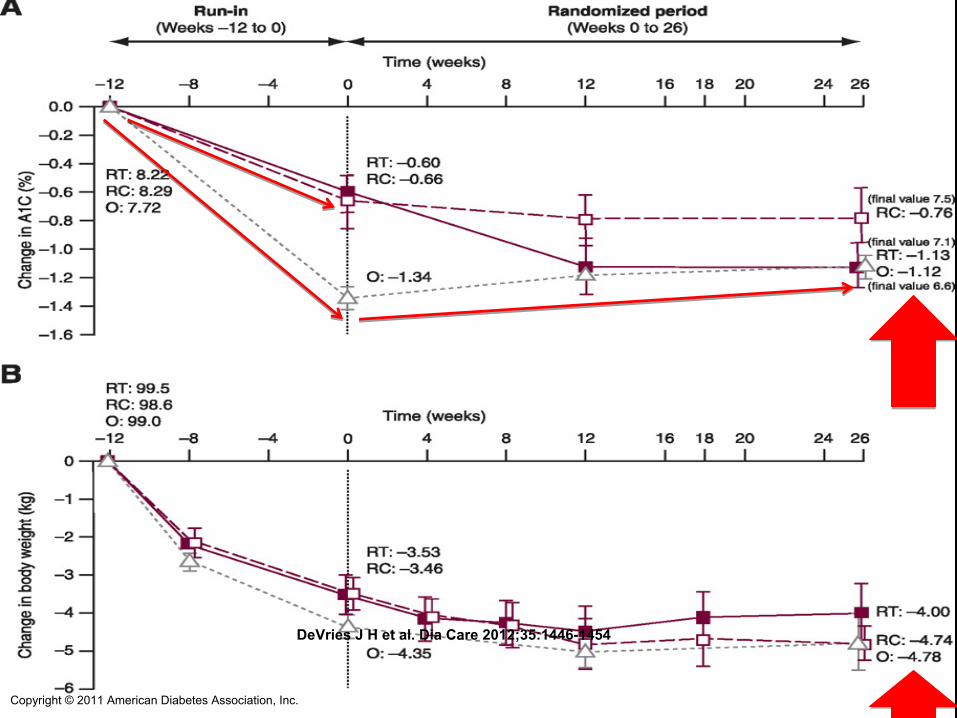
Glycemic efficacy, changes in body weight, and insulin detemir doses.
DeVries J H et al. Dia Care 2012;35:1446-1454
Copyright ©
2011 American Diabetes Association, Inc.


Conclusions: GLP-1 Agonists And Insulin Therapy Works Well Together And Makes Physiologic Sense
Thank You Very [email protected]
Reduce A1cImprove fasting and postprandial glycemiaWeight neurtral
or weight loss
Minimal hypoglycemia