Globalization of the Auto Industry - · PDF fileGlobalization of the Auto Industry ... World...
25
© 2016 IHS Presentation ihs.com IHS AUTOMOTIVE Globalization of the Auto Industry The Race for Competitive Advantage via Global Scale UMTRI Automotive Futures: Globalization of the Auto Industry Ann Arbor, MI | 13 April 2016 Mike Jackson, Senior Executive, Vehicle Production Forecasting +1 248 465 2833 direct [email protected]
Transcript of Globalization of the Auto Industry - · PDF fileGlobalization of the Auto Industry ... World...

© 2016 IHS
Presentation
ihs.com
IHS AUTOMOTIVE
Globalization of the Auto Industry The Race for Competitive Advantage via Global Scale
UMTRI Automotive Futures: Globalization of the Auto Industry
Ann Arbor, MI | 13 April 2016
Mike Jackson,
Senior Executive,
Vehicle Production Forecasting
+1 248 465 2833 direct

© 2016 IHS 2
88 90
92
1.0%
1.5%
2.0%
2.5%
3.0%
3.5%
4.0%
50
60
70
80
90
100
110
200
1
200
3
200
5
200
7
200
9
201
1
201
3
201
5
201
7
201
9
202
1
202
3
World light vehicle sales forecast Market will reach 100 million by end of the decade; growth peak is approaching
Source: IHS Automotive sales forecasts
Annual LV sales (millions)
2
Annual growth (%)
Average growth 3.2%
Growth rate peak
© 2015 IHS 3
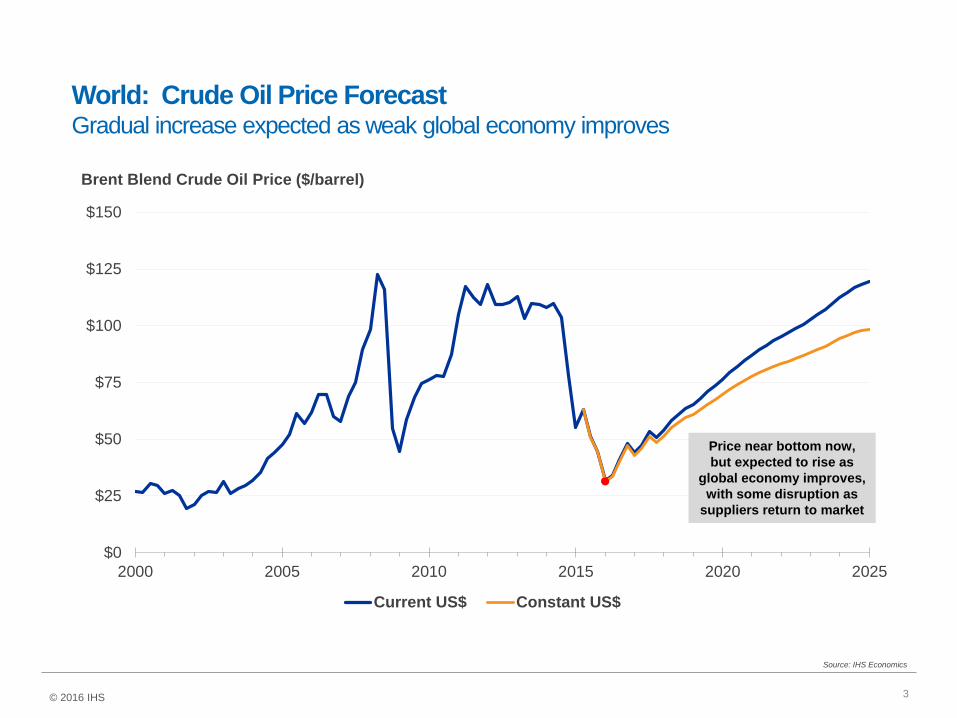
World: Crude Oil Price Forecast Gradual increase expected as weak global economy improves
$0
$25
$50
$75
$100
$125
$150
2000 2005 2010 2015 2020 2025
Current US$ Constant US$
Source: IHS Economics
Brent Blend Crude Oil Price ($/barrel)
Price near bottom now,
but expected to rise as
global economy improves,
with some disruption as
suppliers return to market
© 2016 IHS
© 2016 IHS
0.8
1.0
1.2
1.4
1.6
1.8
2.0
2.2
20
12
20
13
20
14
20
15
20
16
20
17
20
18
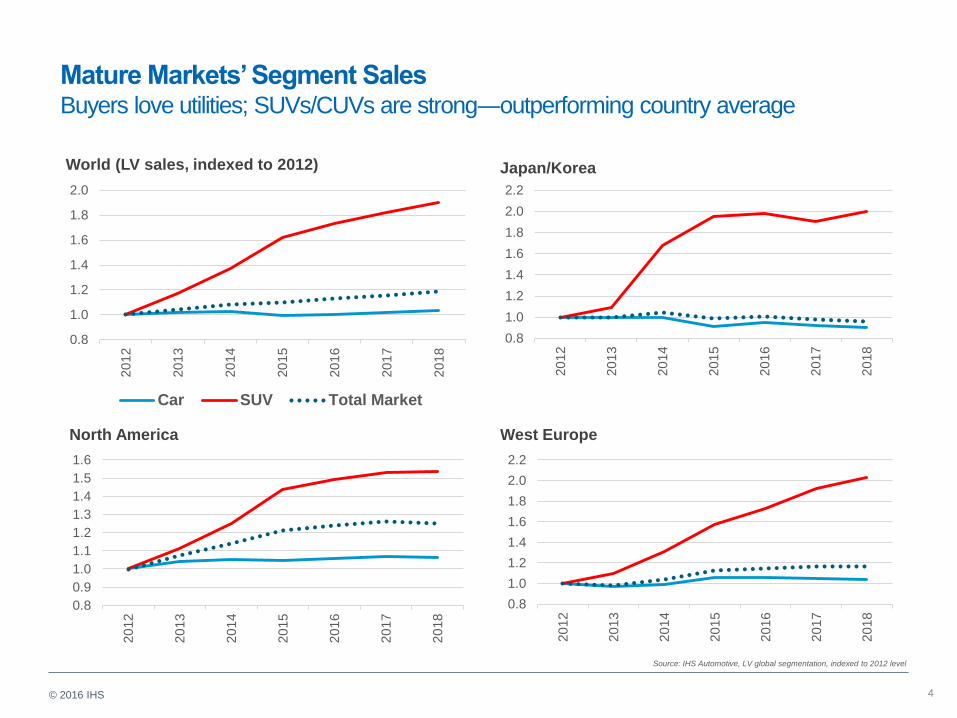
Mature Markets’ Segment Sales Buyers love utilities; SUVs/CUVs are strong―outperforming country average
4
0.8
1.0
1.2
1.4
1.6
1.8
2.0
20
12
20
13
20
14
20
15
20
16
20
17
20
18
Car SUV Total Market
West Europe
Japan/Korea
0.8
1.0
1.2
1.4
1.6
1.8
2.0
2.2
20
12
20
13
20
14
20
15
20
16
20
17
20
18
0.8
0.9
1.0
1.1
1.2
1.3
1.4
1.5
1.6
20
12
20
13
20
14
20
15
20
16
20
17
20
18
North America
World (LV sales, indexed to 2012)
Source: IHS Automotive, LV global segmentation, indexed to 2012 level

19.5 million
Global Production Growth
-.7
.5
.8
.4
2.0
2.9
6.4
-.2
.6
.4
.9
.6
2.5
2.4
Japan/Kor
MEA
S America
N America
Europe
S Asia
G China
89
108
70
75
80
85
90
95
100
105
110
2013 2015 2017 2019 2021 2023
Mil
lio
ns
8.8
5.4
2.6
1.3
1.2
1.1
-0.9 Car Truck
Asia w/o J/K
+14.2M
73% CTG
ROW
+5.3M
27% CTG
Output Growth By Region
2023
© 2016 IHS

Global Production Growth
.4
.4
2.3
2.9
1.3
1.0
2.0
2.0
4.0
3.3
F-FF
C-FF
E
D
C
B
A 1.3
6.2
6.3
2.4
0.3
2.0
1.0
+7.3M
37% CTG
+12.2M
63% CTG
19.5 million
89
108
70
75
80
85
90
95
100
105
110
2013 2015 2017 2019 2021 2023
Mil
lio
ns
Car Truck
Output Growth By Global Segment
2023
© 2016 IHS

© 2015 IHS
Tightening Regulations: Emissions, Fuel Economy Standards What are Automakers to do?
$400 Estimated incremental
spend globally to 2020.
$5–8 billion estimated
average annual per original equipment
manufacturer (OEM).
Penalties
for non-
compliance billion
Brand image as
a leader in
technological
advancements and
environmental
sustainability
Vehicle
profitability
Market
share
*
* IEA World Energy Investment Outlook (International Energy Agency, World Energy Investment Outlook, OECD/IEA, Paris).
60
80
100
120
140
160
180
200
220
240
260
280
2003 2006 2009 2012 2015 2018 2021 2024 2027 2030
US (FTP75/US06)Europe (NEDC)Japan (JC08)China (NEDC)S.Korea (NEDC)
• Global vehicle CO2 targets
are now starting to
converge, allowing for
more global synergy and
analysis
• What’s at stake?
7 © 2016 IHS

© 2015 IHS
Global Super Sets
8
Vehicle
Segment
Market
Global Super Sets
• One to Many Relationship
• Economies of Scale and Scope
• Flexibility: Vehicle, Sourcing
• Development Efficiency
• Bigger, But Fewer Opportunities
• Double Edged Sword:
• Reduced Costs, Increased Scale
• Easier to Shift Sourcing
• Increased Exposure to Defects
• Continuous Development
• Requires time to deploy
© 2016 IHS

© 2015 IHS
Top 10 - Global Sourcing Shares – 2022
9
OEM Units (Millions)
South
Asia
South
America
North
America
M. East
Africa
Japan/
Korea
Greater
China Europe
VW 11.8 4% 6% 8% 1% 0% 35% 46%
GM (w/Wuling) 11.1 4% 6% 32% 1% 3% 42% 13% Toyota 11.0 22% 3% 20% 2% 33% 14% 7%
Ren/Nissan 10.8 10% 5% 17% 6% 11% 16% 36%
Hyundai/Kia 9.1 10% 3% 13% 0% 38% 22% 14% GM 8.5 5% 7% 40% 1% 4% 27% 16%
Ford 7.1 9% 7% 44% 1% 0% 17% 22%
Honda 5.6 20% 4% 36% 0% 15% 23% 2%
FCA 5.4 2% 14% 45% 0% 0% 8% 31%
PSA 3.9 0% 4% 0% 6% 0% 29% 60%
Suzuki 3.6 65% 0% 0% 0% 22% 8% 4%
Unit Vol 12.8 4.0 18.9 3.0 12.5 31.9 23.7
Global Avg 12% 4% 18% 3% 12% 30% 22%
© 2016 IHS

© 2016 IHS
Top 10 OEMs – Bodytype Shares – 2023
10
OEM Units (Millions)
Car SUV Pickup Van MPV
VW 11.8 68% 23% 1% 4% 4%
GM (w/Wuling) 11.1 42% 23% 11% 17% 6%
Toyota 11.0 48% 23% 12% 3% 14%
Ren/Nissan 10.8 52% 30% 4% 6% 7%
Hyundai/Kia 9.1 64% 28% 4% 0% 4%
GM 8.5 55% 28% 12% 3% 3%
Ford 7.1 43% 29% 18% 10% 1%
Honda 5.6 54% 31% 1% 0% 13%
FCA 5.4 33% 39% 14% 9% 5%
PSA 3.9 57% 26% 0% 14% 3%
Suzuki 3.6 47% 18% 9% 6% 20%
Unit Vol 51.3 31.6 10.3 7.7 7.1
Unit Chg 7.3 8.6 1.9 1.1 .6
Global Avg 44% 29% 10% 7% 7%
Car 37% SUV
44%
MPV 3%
Van 6%
Contribution to Growth 2023
Pickup
10%

© 2016 IHS
Global Capacity Utilization Rate Contrast – By Region and OEM
Europe
Greater China
Japan/Korea
Middle East/Africa
North America
South America
South Asia
Global
40%
60%
80%
100%
2013 2015 2017 2019 2021 2023
% s
traig
ht-
tim
e u
tilizati
on
11

Global Program Launches by Region Increased Launch Activity Raises Risk
© 2015 IHS
0
20
40
60
80
100
120
140
160
180
2010 2011 2012 2013 2014 2015 2016 2017 2018 2019 2020
# o
f L
au
nc
he
s
North America Europe Japan/Korea China Other
12
73
115
169
Increased industry pace places pressure on talent,
resources and infrastructure.
© 2016 IHS

© 2016 IHS. ALL RIGHTS RESERVED. 13
Supplier Dynamics Mega Platforms Enable Distributed Production Growth
18% 18%
27%
39% 40% 41%
47%
51%
55%
0.0%
10.0%
20.0%
30.0%
40.0%
50.0%
60.0%
0
20
40
60
80
100
120
2006 2008 2010 2012 2014 2016 2018 2020 2022
% S
ha
re o
f Glo
ba
l Ou
tpu
t P
rod
uc
tio
n (
Mil
lio
ns
of
Un
its
)
1M+ Platform < 1M Platform Share
Cross Segment Application
Speeds Consolidation
© 2016 IHS

© 2014 IHS 14
•NGA to support new front-wheel-drive platforms for B, C and D-segment programs. Major powertrain, braking and steering components will be shared across platforms. Flexibility will be enhanced in areas of exterior and interior styling to deliver broader range of vehicles
•Scale and purpose differentiate; informed by success of IMV
•A platform is a horizontal segmentation; a CMF is a cross-sector concept – Renault-Nissan describing the introduction of new architecture approach
•A Common Module Family is an engineering architecture that covers vehicles form one or more segments, based on the assembly of compatible Big Modules: engine bay, cockpit, front underbody, rear underbody and electrical/electronic architecture
•CMF will generate an average 30-40% reduction in entry cost per model and 20-30% reduction in parts cost for the Alliance.
•Advanced modularity allows for completely new combinations: Four different track widths; Five wheelbases; Two cockpit and cowl solutions; Two rear suspension architectures
• Increased manufacturing flexibility, allowing for up to six rear unit versions on a single line.
•PSA describing EMP2; Efficient Modular Platform
•Standardized fixed technical measures: such as the distance from throttle to the middle of the front wheel, and the fixed transverse engine position
•Variable paramters, such as the wheelbase, track width, vehicle length and wheel sizes
•88% reduction of engine and transmission variations with MQB, this includes all alternative engines, such as CNG, Hybrid or Electric engines.
•Lower weight.
NGA New Global Architecture
EMP Efficient Modular Platform
CMF Common Module Family
MQB Modularer Querbaukasten
Global Architectures The Quest for Platform Efficiency
© 2016 IHS

© 2016 IHS. ALL RIGHTS RESERVED. 15
Supplier Dynamics Top 10 Global Platforms – 2022
0 2 4 6
VW - MQB A/B
Ren/Nissan - CMF-B
Toyota - NGA-C
Hyundai - N
GM - VSS-F B/C
Ren/Nissan - CMF-C/D
VW - MQB A0
Ford - C1/C2
Honda - CCA
Hyundai - HD/KP3
Millions
• Nine of the Top-10
global platforms in
N. America
• Developing markets
push drives growth
• Consolidation in B-
through D-segments
drives gains
• Race for scale favors
larger, diversified OEMs
Segment (Top Nameplate)
North America Exposure
C (Elantra)
C/D (Civic/Accord)
C/D (Focus/Fusion)
B (Polo)
C (Sentra)
B/C (Sonic/Cruze)
C/D (Sonata)
C (Corolla)
B (Versa)
C (Golf)
© 2016 IHS
© 2015 IHS 16
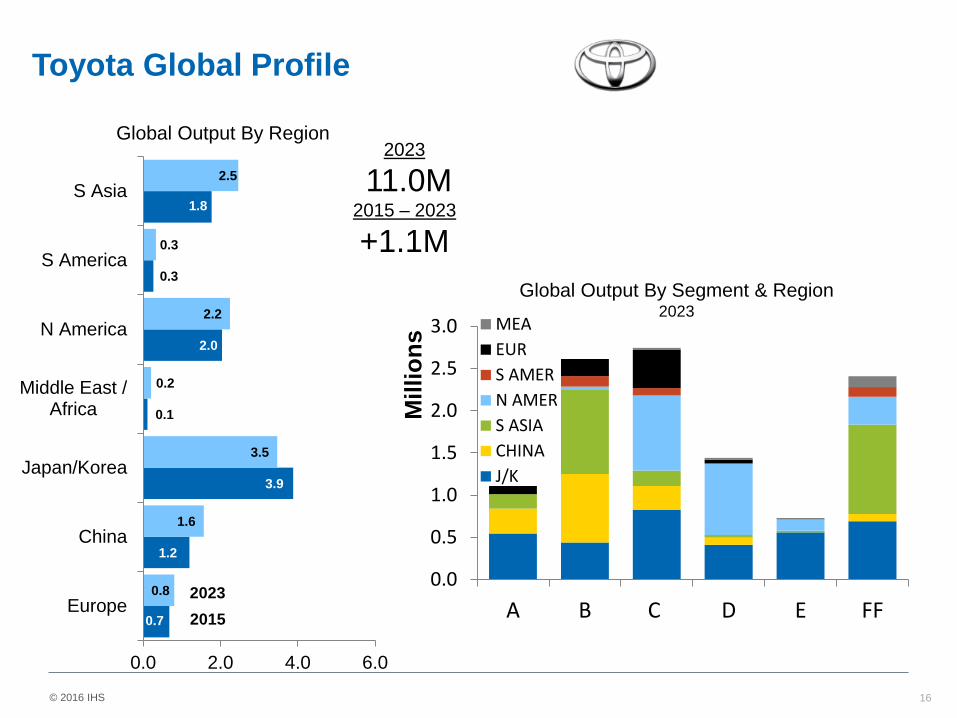
0.7
1.2
3.9
0.1
2.0
0.3
1.8
0.8
1.6
3.5
0.2
2.2
0.3
2.5
0.0 2.0 4.0 6.0
Europe
China
Japan/Korea
Middle East /Africa
N America
S America
S Asia
Global Output By Region 2023
11.0M 2015 – 2023
+1.1M
0.0
0.5
1.0
1.5
2.0
2.5
3.0
A B C D E FF
Mil
lio
ns MEA
EUR
S AMER
N AMER
S ASIA
CHINA
J/K
Global Output By Segment & Region 2023
Toyota Global Profile
2015
2023
© 2016 IHS

© 2015 IHS
Global Architectures Focus to Reduce Platform Counts and Increase Scale
17
Average volume by platform and platform efficiency
© 2015 IHS
0.6
0.5 0.4
0.3
0.4
0.3
0.4 0.4
0.3 0.3 0.3
0.1 0.1
0.2
0.8 0.8 0.7 0.7
0.6
0.5
0.6
0.6
0.5 0.5
0.4
0.2 0.2
0.3 4
3
2 2
4
3
8
3 3
5
6
3
4
2
Average volume per platform in 2014 Average volume per platform in 2022
Number of platforms to support 80% of volume in 2022
© 2016 IHS

© 2015 IHS
Global Platform Dichotomy
18
Regional Global
Increasing centralization of
architecture development
Regional opportunities:
• Development
• Sourcing
• Purchasing

© 2015 IHS
Risk Hedge
19
Currency
Labor Logistics
• Varied Risk Hedges
• Exports
• Localization
• Throughput
• Life Stage
• Growth vs Saturation
• Content Requirements
© 2016 IHS

© 2015 IHS
Innovation Creates Technical Hurdles Advances In Lightweighting
• Varied Strategies
• Aluminum
• Mixed Materials
• CFRP
• Compound effect of
mass reduction
• Parts reduction
• Complexity
• Costs
• Tooling
© 2016 IHS

© 2015 IHS
• Effect of consumer electronics
• Autonomous car considerations
• Impact on cycle, cadence and planning considerations:
21 © 2016 IHS
Autonomous Driving: When, Not If

© 2015 IHS
Global Super Sets
22
IHS Automotive Conference | September 2015
© 2016 IHS

© 2014 IHS
IHS AUTOMOTIVE
23
L4: Full Self-driving
L3: Limited Self-driving
Autonomous Braking: Many Systems
Park Assist
Auto Pilot: Road Train
Autonomy Functionality
Self-Driving & Human-Driven Car
Self-Driving Car Only
L2: Partial Autonomy
Auto Pilot: Highway
Auto Pilot: Traffic Jam
Auto Pilot: Parking
2010 2015 2020 2025 2030
Adaptive Cruise Control
ACC & LKA
L1
L5: Self-driving Only
Self-Driving Car Evolution
Autonomous Driving: When, Not If
© 2016 IHS

© 2015 IHS 24
Summary
• Global Integration
• Varied Growth Trajectories
• Regulatory Compliance Gap
• Innovation Complexity: Light-Weighting & Luxury
• Road to Autonomous
• Increasing Opportunity & Demands
© 2016 IHS

© 2016 IHS
Presentation
ihs.com
IHS AUTOMOTIVE
Detroit 2016
Mike Jackson,
Senior Executive,
Vehicle Production Forecasting
+1 248 465 2833 direct
Thank You!