Globalization of Japanese Firms and its Impact on … Globalization of Japanese Firms and its Impact...
24
1 Globalization of Japanese Firms and its Impact on Domestic Economy 2006 APPC Conference at Seoul, August 17-18, 2006 by Kazuyuki Motohashi 1 Department of Technology Management for Innovation (TMI) University of Tokyo and Research Institute of Economy, Trade and Industry (RIETI) Summary In an era of globalization, it is natural for large firms to seek for attractive market and cost advantage by producing in low labor cost countries. However, large firms’ shifting production site to overseas may have negative impact on SMEs, which do not have enough management resources for overseas production. This is particularly the case for SMEs whose major customer has shifted its production sites. In this paper, the impact of globalization of large firms on domestic economy, particularly on business activities of SMEs, is analyzed, by using firm level data of METI’s BSBSA (Basic Survey of Business Structure and Activity) and SOBA (Survey of Overseas business Activities). It is found that there is no direct evidence of negative impact of globalization on SMEs in this study. More and more SMEs are being involved in global production activities, and complemental relationship between domestic and overseas sales is observed. 1 Professor, Department of Technology Management for Innovation, School of Engineering, University of Tokyo, e-mail: [email protected] . Views expressed in this paper are those of author’s, and not those of his organization. This paper is based on preliminary result of RIETI’s research project on competitiveness of Japanese industry. Author would like to thank for Toshiyuki Matsuura (RIETI) for his inputs to constructing panel datasets of BSBSA and SOBA.
Transcript of Globalization of Japanese Firms and its Impact on … Globalization of Japanese Firms and its Impact...

1
Globalization of Japanese Firms and its Impact on Domestic Economy 2006 APPC Conference at Seoul, August 17-18, 2006
by Kazuyuki Motohashi1
Department of Technology Management for Innovation (TMI) University of Tokyo and
Research Institute of Economy, Trade and Industry (RIETI) Summary
In an era of globalization, it is natural for large firms to seek for attractive market and cost advantage by producing in low labor cost countries. However, large firms’ shifting production site to overseas may have negative impact on SMEs, which do not have enough management resources for overseas production. This is particularly the case for SMEs whose major customer has shifted its production sites.
In this paper, the impact of globalization of large firms on domestic economy, particularly on business activities of SMEs, is analyzed, by using firm level data of METI’s BSBSA (Basic Survey of Business Structure and Activity) and SOBA (Survey of Overseas business Activities). It is found that there is no direct evidence of negative impact of globalization on SMEs in this study. More and more SMEs are being involved in global production activities, and complemental relationship between domestic and overseas sales is observed.
1 Professor, Department of Technology Management for Innovation, School of Engineering, University of Tokyo, e-mail: [email protected]. Views expressed in this paper are those of author’s, and not those of his organization. This paper is based on preliminary result of RIETI’s research project on competitiveness of Japanese industry. Author would like to thank for Toshiyuki Matsuura (RIETI) for his inputs to constructing panel datasets of BSBSA and SOBA.

2
1. Introduction
In the postwar years, the Japanese economy caught up with the United States and Europe at an astonishing speed. Japanese automobiles and electronic products spread worldwide, and in the 1980s, even Made in America, a Massachusetts Institute of Technology (MIT) report on U.S. industrial competitiveness, rated the practices of Japan's auto and semiconductor industries the best in the world (Dertouzos, M.L. et al (1989)). In the late 1980s, the Japanese economy entered its longest postwar expansionary phase. This economic boom, later to be described as the "bubble" economy, ended abruptly in the early 1990s following the 1990 stock market crash and the subsequent tumble in land prices. In the wake of the collapse of the so-called bubble, the 1980s approbation of Japan's industrial competitiveness became the economic gloom of the 1990s.
By facing sluggish domestic market, Japanese firms started looking at international market more seriously. In addition, Japanese firms have to rely on low cost labor in developed countries, in order to meet with intense international market competition. All of these factors contribute to growing trend of globalization activities in Japan. For large multinational companies, globalization is meant for reallocation of their production facilities across boarders. However, structural changes caused by increasing overseas production may have non negligible impacts on domestic production and employment.
In this paper, the impact of globalization of large firms on domestic economy, particularly on business activities of SMEs, is analyzed, by using firm level data of METI’s BSBSA (Basic Survey of Business Structure and Activity) and SOBA (Survey of Overseas business Activities). The relationship between globalization and domestic production depends on the type of overseas production, and the objectives of globalization have been changing over time and regions. Such microstructure of overseas production activities, as well as their impact on SME’s business activities is analyzed.
The structure of paper is as follows. The next section provides am overview of globalization activities of Japanese firms. SOBA’s statistics of overseas production is compared with trade statistics to understand the size of Japanese multinationals’ activities, focusing on electronics industry. In section 3, possible impacts of globalization on domestic economy are discussed. In addition, descriptive statistics comparing global and non-global firms are presented. Then, a section for economic analysis follows. In this section, the relationship between domestic and overseas production is analyzed by econometric models. Finally, this paper concludes with summary and next step of this study.

3
2. Overview of Global activities of Japanese Firms
In an era of globalization, firm’s activities across national boarders such as international trade and investment become more and more important. In the 1980’s, Japan’s manufacturing firms, particularly in electronics and automotive industry, had enjoyed their strong presence in the world market. Growing exporting shares in the world trade volumes triggered political concern by US and European countries, and a series of trade negotiations were initiated. After the economic bubble burst in the early 1990’s, the Japanese economy entered in the slow economic growth period, and the importance of international market has never become smaller.
Reaching an international market can be done not only by export, but also overseas production activities. Japanese firms have increased their overseas activities by foreign direct investments since the middle 1980’s, when the Japanese yen was substantially appreciated due to the 1985 Plaza Accord. Firstly, Japanese manufacturers expanded their production facilities in south east Asian countries such as Thailand and Malaysia. After the 1990’s, many firms set up their production site in China, backed by China’s open door policies.
In this section, global activities by Japanese firms are reviewed by input output tables, trade data and overseas activity statistics. First, Figure 1 shows the impact of international trade on domestic economy by comparing the export shares (the share of export in total production) and the import penetration ratios (the share of import in total domestic demand) between 1990 and 2004, based on the data from input output tables. It is interesting to see that both export share and import penetration ratio have increased in all industries. In some industries, such as textile, apparel and non-ferocious metal, import penetration ratio is relatively greater. In these industries, Japanese manufacturer are not so competitive in global market. On the other hand, in general machinery and transportation machinery, the export share is relatively larger, which implies Japanese firms’ stronger position in the world.
(Figure 1)
It should be noted that both export share and import penetration ratio are relatively high in electronics industries.2 In addition, the import penetration ratio increased faster during the period from 1990 to 2004 than the export share in these industries, which may be due to the fact 2 Here, electronics industries are broken up into three sub-categories, ICT machinery (including computers and communications equipments), Electronics components and electronics machinery (including consumer electronics and industrial electronics machinery)

4
of loosing international competitiveness in Japanese electronics industries. In order to further investigate this point, Figure 2 shows trade specialization indexes (TSIs)3 by commodity level trade statistics. TSI is a typical indicator to assess international competitive of industry. Figure 2 compares TSIs in 1988 and 2001 for trade with East Asia. Notable changes of TSIs in this period can be found, in electronics industries. For example, in final demand products such as computers and TV receivers, export surpluses have turned into import surpluses. Although changes are much smaller for electronic components such as semiconductor devises and ICs, downward trends of TSI can be found. These finding suggest that relative competitive position of Japanese firms went down. Or, the impact of globalization on domestic economy may be greater for electronics industry than for the other industries, because substantial portion of international trade in these sectors can be explained by overseas activities by Japanese firms.
(Figure 2)
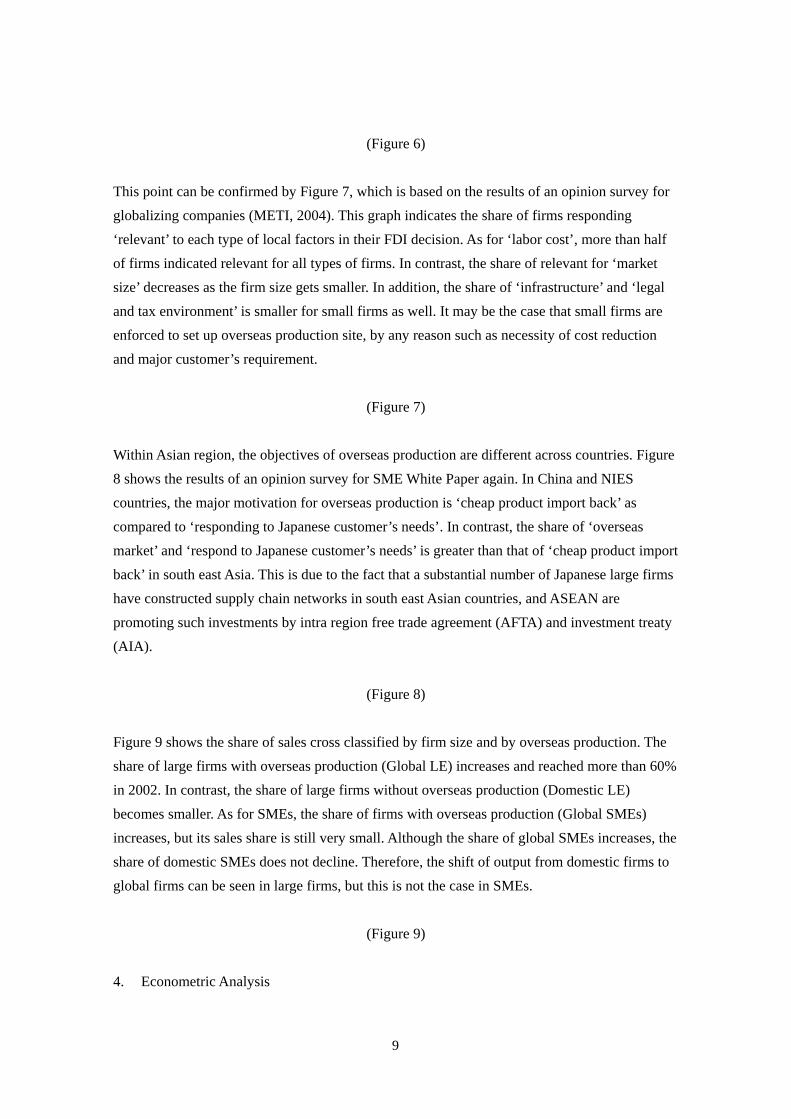
Table 1 show the trade statistics of electronic industries by trading partners. Here, we focus on Asian countries here, because of increasing importance of these countries as a trading counterpart. First, it is found that import grows faster than export, and more than half of imports of electronics industries are coming from Asian countries. Second, within Asian countries, the share of China and ASEAN increases, while that of NIES3 decreases. Particularly, it is noticeable that the share of China is increasing very fast as an import counterpart. Finally, the export of components industries expands faster than that of machinery industries (ICT and electronics machinery), and the share of Asian countries as an exporting countries is relatively smaller than that of importing.
(Table 1)
A glowing international linkage with Asian countries can be found also in overseas activities of Japanese firms. In Figure 3, the trend of overseas production of three electronics sectors is presented, by using the data from Survey of Overseas Business Activities (SOBA). In electronics machinery and components sectors, more than half of overseas production is located in Asian countries. It is also found that the share of production in China is increasing. In contrast, the share of Asian countries in ICT machinery sector is relatively small, while it is gradually increasing.
3 TSI is defined as the ratio of the value of trade surplus (export – import) to the value of total trade (export + import).

5
(Figure 3)
In Table 2, the amount of overseas production is compared with that of domestic production for three electronics sectors. From 1990 to 2004, domestic production of ICT and electronics machinery sectors decreased, while that of electrical components sector increased a little. A dramatic shift from domestic to overseas production is found in ICT machinery sector. In 1990, the amount of overseas production used to be less than half of domestic production, while the size of overseas production are now surpassing that of domestic production in recent years. In general, a machinery producer tends to relocate its production activities to overseas sites as compared to a component producer. In a machinery producer, there are a lot of assembling activities, which are typically labor intensive jobs. Therefore, relocating such activities to Asian countries with relatively cheap labor is economically reasonable. On the other hand, producing electrical components involves a lot of capital intensive works, which can be found in semiconductor factory as a typical example.
(Table 2)
This difference in production location pattern between machinery and component producers affects trade pattern of these products. In Figure 3, a simple diagram is presented for understanding the impact of overseas production on trade statistics. In this framework, there are two sectors, assembly and component. These two sectors used to be located inside one country, but an assembly sector relocates its production to some overseas site. We assume that both domestic demand (Da) and overseas demand (Oa) don’t change. Now, the products made outside country are serving not only for overseas demand (Oa), but also for a part of domestic demand (Da’), taking advantage of low cost overseas production. At the same time, the amount of export, which used to be domestic product serving for overseas demand (Oa), disappears because overseas demand can be met by overseas production site now. Therefore, the export of assembly sector decreases (Oa->0), and its import increases (0->Da’). In addition, the amount of domestic production decreased by the amount of overseas production (Da’+Oa).
(Figure 4)
The impact of component sector is completely different from that of assembly sector. We assume that this sector does not move its production site to overseas, and supply its products only to this assembly sector. By overseas relocation of assembly sector, some of components have to be exported to service for the demand by overseas production site by assembly sector.

6
Therefore, the export of component sector increase (0->Oc’). However, the import and the production amount do not change under this framework. These patterns of assembly and component sector are basically consistent with those which can be presented in Table 2.
In Table 3, the impact of overseas production on trade is presented for three electronics sectors. First, a large portion of import occurred in assembly sector (ICT and electronics machinery here) can be explained by importing back of overseas production to Japan. This figure of component sector (electrical component here) is a little smaller than those of assembly sector. There is no comparable statistics for export, because the data of overseas purchase from Japan (i.e., export derived by overseas production) is aggregated by the sector of output, not by the type of products used in that production. For example, overseas ICT machinery sector purchased 2,714 billion yen from Japan in 2002. A substantial portion of this amount is electronics components used in overseas production, but there may be also others. However, when we compare the size of purchase in all electronics sectors (2,714+1,221+679=4,614) to the amount of electronics component export (6,280), the impact of overseas production on the export amount of this sector is supposed to be non-negligible.
(Table 3)
Japanese companies in the electronics industry have been transferring their production operations, particularly assembly processes, abroad to East Asia. This globalization of business activities by Japanese companies is basically in line with Heckscher-Ohlin model of international trade theory, i.e., global location of production sites depending on factor endowments. By relocating labor intensive works to China and ASEAN countries, with abundant and cheap labor, Japanese manufacturers can achieve higher level of efficiency in its production process.
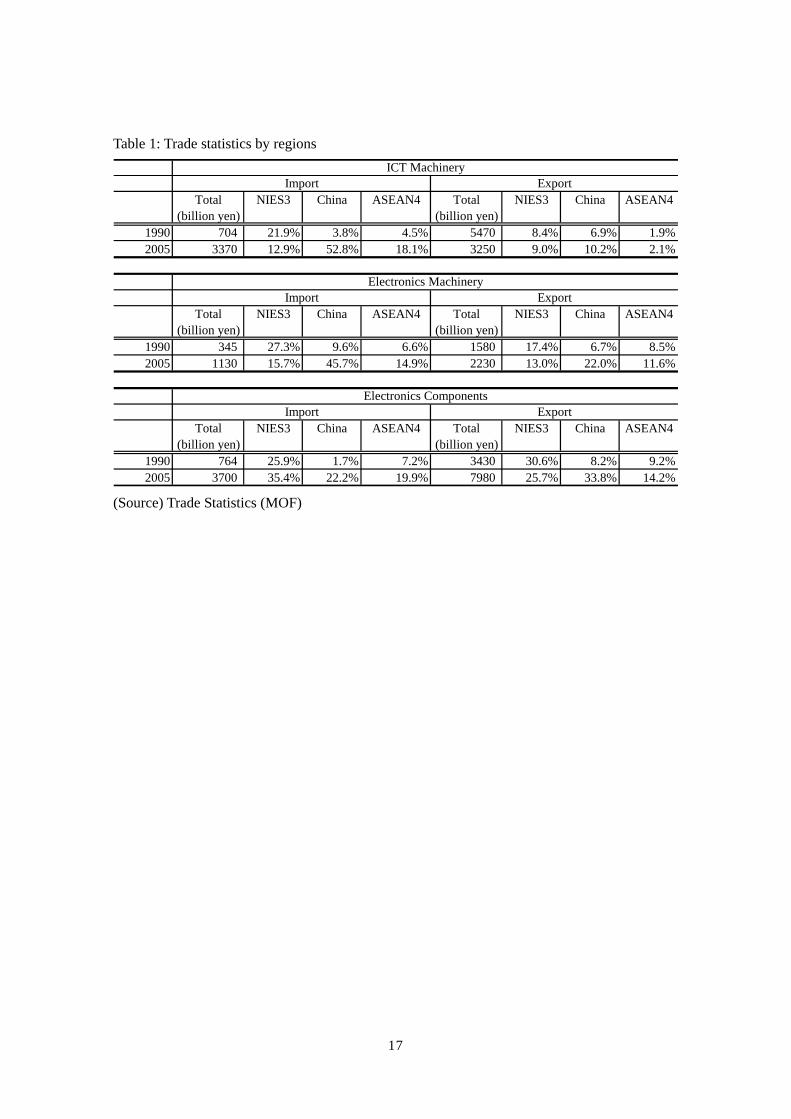
However, what is happening in reality is more complicated than what is predicted by classical trade theory. Figure 5 shows the export share and import penetration ratio for electronics goods, by the most detail level of commodity classification of 2000 input and output table. It is found that these two indices have positive relationship in 2000, which contradicts with classical trade theory’s comparative advantage story. There are a number of literatures to show growing share of intra-industry trade (Fukao et, al, 2003; Miyagawa et. al, 2003). Figure 5 shows this trend can be observed even in the detail level of industry classification.
(Figure 5)

7
Growing intra industry trade suggests increasing degree of differentiation in each commodity, reflecting increasing complexity of product architecture of electronics goods.4 For example, semiconductor chip is now used by almost all of products. The semiconductor chip used by mobile phone is totally different from that used by digital TV, and optimal allocation of different types of semiconductor induces trade within this very narrowly defined industry. In addition, modulalization of product architecture, particularly the case for electronics goods, leads to fragmentation of production activities across boarders.5 The PC is the most obvious illustration: many vendors supply many varieties of, for example, hard-disk drives, but any can be plugged into the computer. Modularization of product architecture leads to unbundling the supply chain, and dividing it among various kinds of players. Advancement of information technology reduces communication costs, which further pushes geographical dispersion of production activities of one product (Motohashi, 2006).
3. Globalization’s Impact on Domestic Economy
There are numerous studies on economic impact of globalization. In terms of structural changes associated with globalization, many studies focus on the impact of labor market. As is found in the previous section, one of major motivations of globalization of Japanese firms is seeking for low labor cost. In this case, presumably, they relocate unskilled workers’ jobs to overseas, and focus on skilled workers’ jobs at home country. This leads to decreasing demand for unskilled labor at home countries, and the difference in wage between skilled and unskilled workers will become wide (Feenstra, 1996: Slaughter 1995). In Japan, Sakurai (2000) addresses this issue by using industry level data. Higuchi and Genda (1999) also show the positive relationship between employment at subsidiaries in developed countries and the share of white collar workers at parent companies in Japan.
However, it is not always the case that increasing globalization activities have negative impact on domestic production and employment. For example, Bloomstrom et. al (1997) shows that FDIs of US firms in developed countries have positive effects on domestic employment, while those in developing countries have negative one. Chen and Ku (2003) also find complemental relationship between domestic production and overseas production in Taiwan multinational 4 New trade theory, taking into account product differentiation and increasing return of scale, supports existence of intra-industry trade by using theoretical model (Helpman and Krugman, 1985) 5 Modular architecture refers to the design of a product (mostly physical, but also some software) using standardized interfaces to allow interchangeability of various specific varieties of a component, and the combining of components into what can be complex systems. (Baldwin and Clark, 2002)

8
companies. Multinationals may be able to gain managerial expertise by accessing to international market, and this will be particularly the case for FDI in developed countries.
These studies suggest that firm’s globalization activity takes various forms, and it is important to take into account its heterogeneity in analyzing economic impacts. Economic implications may be different, not only by host country, but also by various other factors such as organizational form of foreign subsidiary, degree of intra firm transactions and backward linkage with local suppliers. Kimura and Ando (2004) show detail descriptive statistics for Japanese multinationals in order to understand the state of ‘international fragmentation of production sites’. For example, it is found that the share of intra-firm transactions is decreasing for both sales and procurement of foreign subsidiaries in East Asia. This point can be confirmed by Kiyota et. al. (2005) showing that experience at local market is one of important determinant factors of backward linkage with local suppliers.
In terms of globalization’s impact on domestic economy, there is a political concern of “hollowing out”. A large multinational company can relocate its production site to overseas, by taking into account factor cost and market size of host country. However, it may be difficult for small companies to globalize its production facilities due to the lack of managerial resources. In this case, moving out of production activities from Japan induces substantial structural adjustments in particular sector and region. In this section, possible impacts of globalization on domestic are reviewed by focusing on Japanese SMEs in manufacturing sector.
In order to look at the impact of globalization, the data from METI’s BSBSA (Basic Survey of Business Structure and Activities) are used in the following part. BSBSA is a firm level census for manufacturing and wholesale/retail sector with no less than 50 employees or 30 million yen capital amount. This survey started in 1991, and annual survey has been conducted since 1994. Survey items cover a wide range of firm’s structures and activities, such as employment by function, sales by industry, innovation activities, globalization and ownership structure.
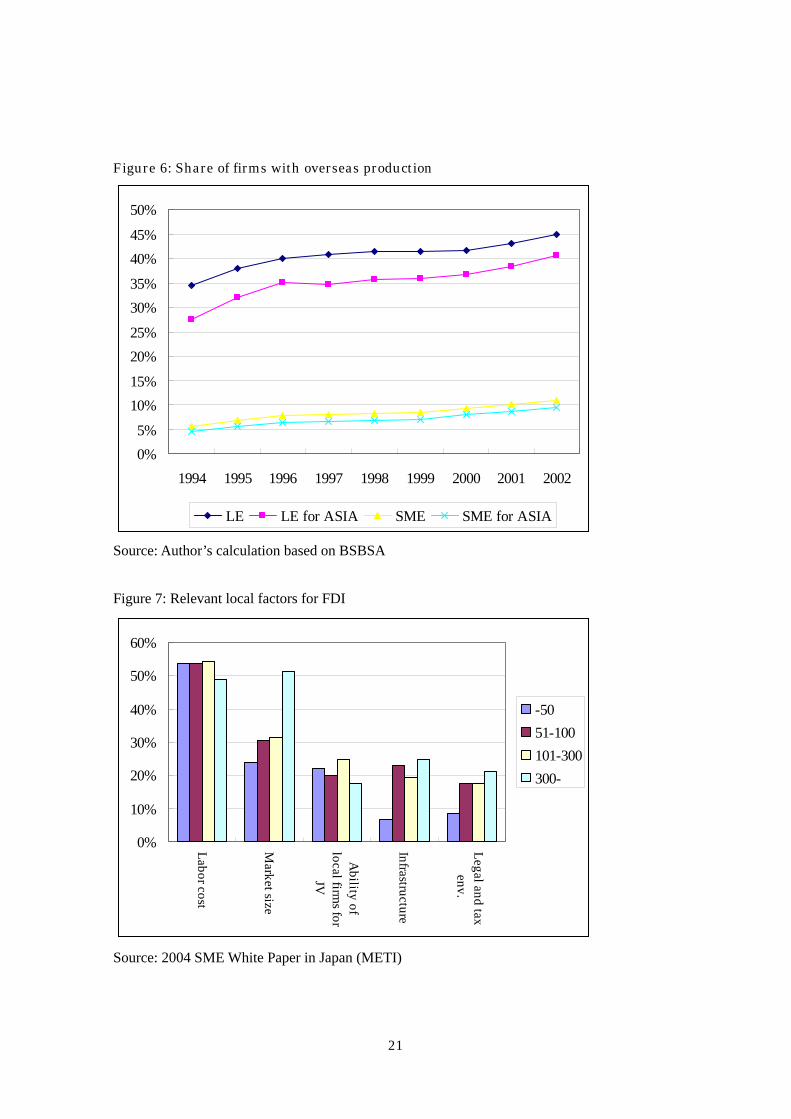
In Figure 6, globalization activities are compares between SMEs and large firms (LEs). For both types of firms, the share of firms with overseas production in any region and that in Asian countries are presented. Globalization activities are increasing for both LEs and SMEs, although the share of SMEs with overseas production is still small. In addition, it is found that the most of SMEs overseas production activities take place in Asia. Presumably, major objective for SMEs overseas production is cutting production cost, instead of seeking for new overseas markets.
9
(Figure 6)
This point can be confirmed by Figure 7, which is based on the results of an opinion survey for globalizing companies (METI, 2004). This graph indicates the share of firms responding ‘relevant’ to each type of local factors in their FDI decision. As for ‘labor cost’, more than half of firms indicated relevant for all types of firms. In contrast, the share of relevant for ‘market size’ decreases as the firm size gets smaller. In addition, the share of ‘infrastructure’ and ‘legal and tax environment’ is smaller for small firms as well. It may be the case that small firms are enforced to set up overseas production site, by any reason such as necessity of cost reduction and major customer’s requirement.
(Figure 7)
Within Asian region, the objectives of overseas production are different across countries. Figure 8 shows the results of an opinion survey for SME White Paper again. In China and NIES countries, the major motivation for overseas production is ‘cheap product import back’ as compared to ‘responding to Japanese customer’s needs’. In contrast, the share of ‘overseas market’ and ‘respond to Japanese customer’s needs’ is greater than that of ‘cheap product import back’ in south east Asia. This is due to the fact that a substantial number of Japanese large firms have constructed supply chain networks in south east Asian countries, and ASEAN are promoting such investments by intra region free trade agreement (AFTA) and investment treaty (AIA).
(Figure 8)
Figure 9 shows the share of sales cross classified by firm size and by overseas production. The share of large firms with overseas production (Global LE) increases and reached more than 60% in 2002. In contrast, the share of large firms without overseas production (Domestic LE) becomes smaller. As for SMEs, the share of firms with overseas production (Global SMEs) increases, but its sales share is still very small. Although the share of global SMEs increases, the share of domestic SMEs does not decline. Therefore, the shift of output from domestic firms to global firms can be seen in large firms, but this is not the case in SMEs.
(Figure 9)
4. Econometric Analysis

10
In this section, quantitative analysis of the relationship between domestic and overseas production is presented. The dataset used in this section is a linked data of BSBSA used in the previous section with a data from Survey of Overseas Business Activity (SOBA) by METI. SOBA is an annual survey conducted from 1971 for all Japanese firms with foreign subsidiaries.6 A survey instrument is sent to parent companies located in Japan, and each parent company is supposed to answer all questions concerning its foreign subsidiaries. The sample size in most recent survey in 2003 fiscal year is about 4,000 firms, and MITI received the data from 2,411 firms (response rate: 64.9%) with 13,856 foreign subsidiaries. In order to investigate the relationship between domestic and overseas production, the data from SOBA for overseas production have to be linked with BSBSA with various parent company’s data. In this study, a panel dataset from 1994 to 2002 for all firms with domestic and international manufacturing activities is constructed with around 1,000 samples for every year.7
Using this dataset, the amount of domestic sales is regressed by that of overseas subsidiaries as well as other factors at firm level. For both BSBSA and SOBA, activity base information (sales by commodity and services) is available, and the data for only manufacturing activities, instead of total amount of figures of firm, is generated. Therefore, the amount of manufacturing sales is a good measure of the size of production activities, and regression results will show how each firm group allocate production activities between domestic and foreign production sites. Explanatory variables for log of domestic sales are as follows,
・ LOS: Log of sales in overseas subsidiaries ・ D-lf: Dummy variable for parent firm with more than 300 employees (large firm dummy) ・ LOS*D-lf: Cross term of LOS and D-lf ・ LRD: Log of R&D in parent company ・ D_Parent: Dummy variable for whether parent company is a subsidiary of another company
6 A foreign subsidiary is defined as a company no less than 10% of whose stocks are owned by a parent company in Japan, or a so-called grandchild company of no less than 50% owned by a child company of no less than 50% owned. All parent companies in Japan, except those in financial services and real estate sector are covered. 7 Sample size for each year is as follows,
year # of firms1994 8711995 8521996 8811997 1,0551998 1,0291999 1,0812000 1,0492001 9182002 842Total 8578

11
Table 4 shows regression results by fixed effect model estimation. LRD is included in this regression model in order to control for time variant unobservable factors for firm’s success (in domestic sales), which cannot be controlled by fixed effect model.
(Table 4)
One of major findings is that overseas production does not substitute for domestic production, but rather these two are in complemental relationship according to positive and statistically significant coefficients to LOS. This result is consistent with those in Chen and Ku (2003) for Taiwan, it can be interpreted that overseas production can strengthen competitive position of whole firm group, which leads to expansion of domestic sales as well. This is the case not only for overseas production in developed countries, but also for that in developing countries such as China.
Positive coefficients to D-lf show that domestic sales in large firms grow faster than those of SMEs. More interestingly, negative and statistical significant coefficients can be found in cross terms of LOS and D-lf for overseas production in Asia, implying that the degree of substitution between domestic and international sales is greater for large firms. In case for China, the effect
of LOS on domestic sales can be described as DlfLOS
domsales *061.0061.0)ln(−=
∂∂
.
Therefore, a positive impact of LOS is offset by Dlf in case of large firms (Dlf=1). It should be noted that this cross term effect can be observed only in Asia, and no difference between large firms and SMEs is found in North America and Europe.
In order to further investigate the linkage of domestic and overseas production, the following explanatory variables are added.
・ %SAJ: Share of overseas sales import back to Japan to total overseas sales in overseas subsidiaries
・ %SUJ: Share of supply of parts and materials to overseas production from Japan to total amount of supply
・ %SAJ*D_lf: cross term of %SAJ and D_lf ・ %SAJ*D_lf: cross term of %SAJ and D_lf Fixed effect estimation results for Asian countries are presented in Table 5.
(Table 5)

12
Negative coefficients are expected to %SAJ, because import back sales of overseas production will compete with domestic production. Conversely, positive coefficients to %SUJ can be expected, because this stimulates export of domestically produced products. From regression results in Table 4, some statistically significant results can be found in %SUJ, but not in %SAJ. Although some of coefficients are not at statistically significant level, the sign of coefficients show that there is a positive relationship between domestic sales and export of domestic parts and materials to overseas production. But this impact is smaller for large firms, according to the coefficients to %SUJ*D_lf. In contrast, import back of overseas production does not reduce domestic sales. This supports a hypothesis of gaining competitiveness by overseas production in a sense that globalization stimulates domestic production more than the size of import back of overseas production.
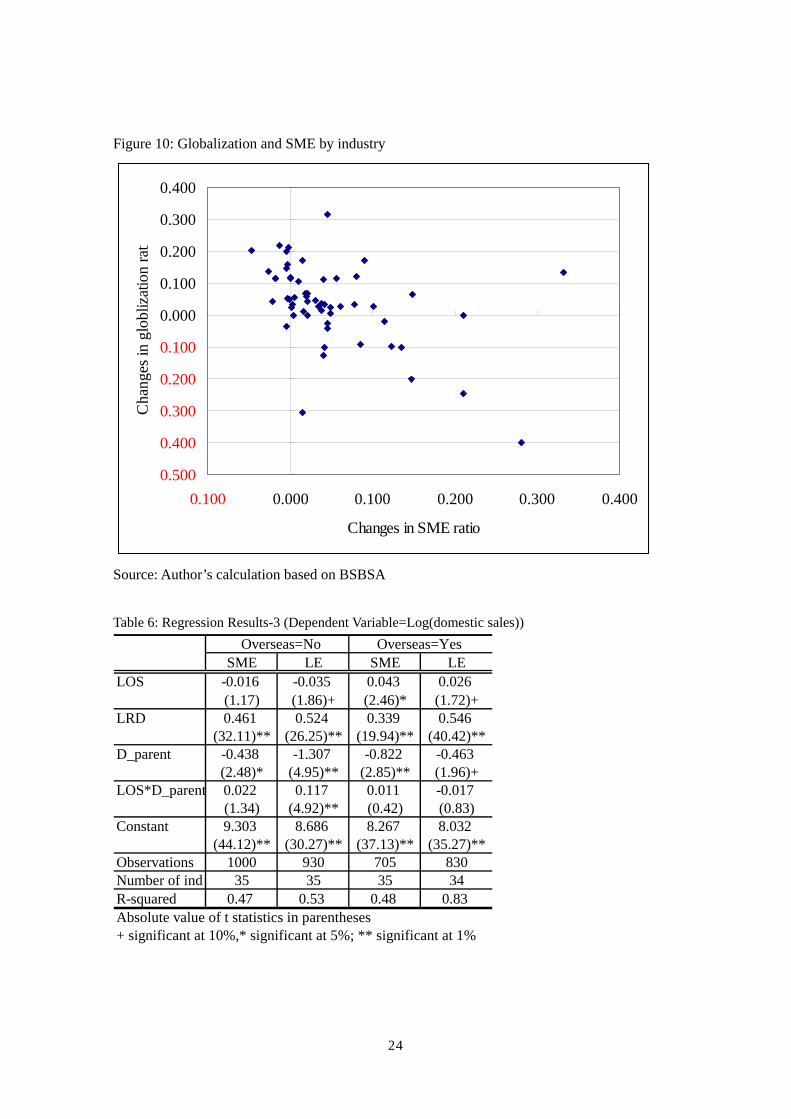
Foregoing discussion is based on the regression results for globalization firms, and it is found that globalization does not have negative impact on domestic activities in general, but it has rather positive impact, particularly for SMEs. Then the next question is what is happening for non globalization firms. Figure 10 shows the changes in globalization ratio (the share of global firms in total sales) and the changes in SME ratio (the share of SMEs in total sales) by industry, based on BSBSA data. The industrial classification is based on the 3 digit industry classification with 58 manufacturing sectors. It can be shown that a negative relationship between these two indicators, i.e., as the globalization ratio increases, the SME ratio decreases.
(Figure 10)
This point is further investigated by using linked dataset of BSBSA and SOBA. Industry level data for domestic and overseas sales is constructed. In order to match industrial classification of BSBSA and SOBA, the number of industries reduces to 35, but this data is cross classified by with or without overseas production, region of overseas production, employment category, and with or without parent company, as well. In total, over 400 observations are available in each year from 1994 to 2002. Table 6 shows the regression results of log of domestic sales as dependent variable, by random effect model. Regressions are conducted separately for 4 groups, i.e non glonalization SME, non globalization LE, globalization SME and glonalization LE.
(Table 6)
A clear contrast between globalization and non globalization group can be found, i.e., negative impact of overseas production in non globalization group, and positive one for globalization

13
group. However, the negative impact of overseas production to non globalization firms is small when it is a subsidiary of other firm, according to positive coefficient to cross term of LOS and D_parent. A coefficient of LOS for non globalized SME is negative, but not statistically significant, in contrast to that for non glonlized LE. Therefore, it can be said that negative impact of globalization on domestic economy is smaller for SMEs.
5. Conclusion
In this paper, economic implications of globalizing industrial activities by Japanese firms are analyzed and discussed. It is observed that overseas production activities of Japanese firms have been increasing steadily since early 1990’s. Growing overseas production, particularly in electronics industries, has significant impact on trade statistics. In addition, it is found that the share of intra-firm trade increases even in very detail industry classification. Modularization of electronics product architecture and decreasing communication costs induce fragmentation of production activities across country boarders.
However, major players in overseas activities are large multinationals, and SME’s position is still limited, even though its rate of growth is very high. Foreign direct investments involve significant business and political risk at host country, and a large amount of capital investment is needed. In this sense, it is natural that such activities are concentrated in large firms. Therefore, there may be a concern over globalization’s negative impacts on SMEs, which does not have enough management resources for overseas production.
However, we cannot find a direct evidence of negative impact of globalization on SMEs in this study. More and more SMEs are being involved in global production activities, and complemental relationship between domestic and overseas sales is observed. As compared to globalization firms, the growth rate of domestic sales is smaller for non globalization firms. Some negative impact of globalization for these firms is found, but this is particularly the case for large firms, instead of SMEs.
Hitomi and Motohashi (2004) provide detail information on how SMEs respond to competition from international markets, by interview survey for 49 Japanese firms. There are some firms which shifted their production sites to China or South East Asian countries to seek for lower cost production. But, there are other firms to stay in Japan and compete against international competition by upgrading manufacturing technology. There are also other SMEs, focusing on product design, and keeping high profit level as a fab-less company. In the U.S., plant level

14
adjustment to relative product demand changes induced by international competition has been analyzed very detail in Bernard et. al (2006). The next step of this study is conducting the same type of systematic analysis about Japanese firms’ responses to globalization, based on more detail dataset such as manufacturing census data, to see the representative-ness of the case studies in Hitomi and Motohashi (2004).
References Baldwin, C. and K. Clark. (2000), Design Rules, The Power of Modularity, MIT Pressm
Cambridge, MA. Bernart, A., Jensen, B. and P. K. Schott (2006), Survival of the best fit: Exposure to low-wage
countries and the (uneven) growth of US manufacturing plants, Journal of International Economics, vol. 68, pp. 219-227
Broomstrom, T., Fors, G. and R. lipsey (1997), Foreign Direct Investment and Emoloyment: Home Country Experience in the United States and Sweden, Economic Journal, 107(445), pp. 1787-97
Chen, T-J and T-H Ku (2003), The Effect of Overseas Investment on Domestic Employment, NBER Working Paper 10156
Dertouzos, M.L. et al (1989), Made in America, MIT Press, Cambridge MA IMD (2002), World Competitiveness Yearbook 2002
Feenstra, R. (1996), Foreign Investment, Outsourcing and Relative Wage, in R. Feenstra and G. Douglas eds, Political Economy of Trade Policy: Essays in Honor of Jagdish Bhagwati, Cambridge MA: MIT Press, pp. 89-127
Fukao, K., Ishido, M., Ito, K. and Y. Yoshiike (2003), Vertical Intra-Industry Trade and Foreign Direct Investment in East Asia, RIETI Discussion Paper 03-J-009, 2003/06, RIETI Tokyo (in Japanese)
Higuchi, Y. and Y. Genda (1999), Globalization of manufacturing SMEs and its impact on labor market, in Sekiguchi and Higuchi ed., Industry and Employment in Global Era, Toyo Keizai Shimpo-sha (in Japanese).
Hitomi, K and K. Motohashi (2004), Survey on Global Location Strategy of Product Base in Manufacturing Sector, Socio-Economic Research Center Rep No. Y03019, CRIEPI, Tokyo, Japan (in Japanese)
Kimura, F. and M. Ando (2004), Two-dimensional Fragmentation in East Asia: Conceptual Framework and Empirics, Forthcoming in International Review of Economics and
Finance Kiyota, K. Matsuura, T., Urata. S. and Y Wei (2005) , Reconsidering the Backward Vertical

15
Linkage of Foreign Affiliates: Evidence from Japanese Multinationals, RIETI Discussion Paper Series 05-E-019
METI (2004), Small Medium Enterprises White Paper 2004, Ministry of Economy, Trade and Industry, Tokyo, Japan
Miyagawa, T, Takeuchi, B. and T. Yoshikawa (2003), Are Asian Countries Threats to Japan? Changes in Trade Structure and International Competitiveness, JCER Review, vol. 52, October 2003 (in Japanese)
Motohashi, K. (2006), The IT Revolution's Implications for the Japanese Economy, in Japan: Moving Toward a More Advanced Knowledge Economy, T. Shibata ed., World Bank Institute, Washington DC, 2006/06
Sakurai, K. (2000), Globalization and Labor Market, Keizai Keiei kenkyu, September 2000, Japan Development Bank (in Japanese)
Slaughter, M. (1995), Multinational Corporations, Outsourcing and American Wage Diversion, NBER Working Paper 5253

16
Figure 1: Export share and import penetration ratio by industry
Export share and import penetration (%)
-60% -40% -20% 0% 20% 40% 60%
FoodTextile and apparel
Pulp and paperChemical
Oil and coal productClay and grass
SteelNon ferocious metal
Metal productGeneral mach.
ICT mach.Electrical comp.
Electronics mach.Transportation mach.
Precision mach.
1990 export 2004 export 1990 import 2004 import
(Source): Input Output Tables (Statistical Bureau and METI) Figure 2: Trade specialization index for Japan-East Asia trade
17
Table 1: Trade statistics by regions
Total NIES3 China ASEAN4 Total NIES3 China ASEAN4(billion yen) (billion yen)
1990 704 21.9% 3.8% 4.5% 5470 8.4% 6.9% 1.9%2005 3370 12.9% 52.8% 18.1% 3250 9.0% 10.2% 2.1%
Total NIES3 China ASEAN4 Total NIES3 China ASEAN4(billion yen) (billion yen)
1990 345 27.3% 9.6% 6.6% 1580 17.4% 6.7% 8.5%2005 1130 15.7% 45.7% 14.9% 2230 13.0% 22.0% 11.6%
Total NIES3 China ASEAN4 Total NIES3 China ASEAN4(billion yen) (billion yen)
1990 764 25.9% 1.7% 7.2% 3430 30.6% 8.2% 9.2%2005 3700 35.4% 22.2% 19.9% 7980 25.7% 33.8% 14.2%
Electronics MachineryImport Export
Electronics ComponentsImport Export
ICT MachineryImport Export
(Source) Trade Statistics (MOF)

18
Figure 3: Overseas Production of Electronics Industries (Unit: billion yen)
ICT Machinery
0
2000
4000
6000
8000
10000
12000
14000
1994 1995 1996 1997 1998 1999 2000 2001 2002
NIES3 CHINA ASEAN4 World
Other Electronics Machinery
0500
1000150020002500300035004000
1994 1995 1996 1997 1998 1999 2000 2001 2002
NIES3 CHINA ASEAN4 World
Electrical Components
010002000300040005000600070008000
1994 1995 1996 1997 1998 1999 2000 2001 2002
NIES3 CHINA ASEAN4 World

19
Table 2: Comparing Domestic and Overseas Production (Unit: billion yen)
Prod. Export Import OverseasProd. Prod. Export Import Overseas
Prod.(*)ICT machinery 12,082 3,342 848 5,551 8,904 2,710 3,214 11,833Electronics machinery 26,524 5,857 1,126 1,992 20,201 7,313 3,319 3,160Electrical components 12,169 2,564 661 2,455 13,329 6,575 3,428 5,632Note: Figures in 2002
1990 2004
(Source) Survey of Overseas Business Activities (METI) Figure 4: Overseas production by assembly firms Table 3: Impact of Overseas Production on Trade Statsitics (Unit: billion yen)
ImportImport byoverseas
prod.(Share) Export
Export byoverseaspuchase
ICT machinery 2,910 1,386 (47.6%) 3,840 2,714Electronics machinery 925 343 (37.1%) 1,840 679Electrical components 2,760 906 (32.8%) 6,280 1,221 (Source) Survey of Overseas Business Activities (METI) and Trade Statistics (MOF)
Assembly(Da+Oa)
Component(Dc)
Export
Domestic demand (Da)
Domestic demand (Dc)
Component(Dc)
Domestic demand(Dc-Oc) Int’t demand (Oc)
Assembly(Da-Da’)
AssemblyOverseas(Da’+Oa)
Country boarder Country boarder
Domestic demand (Da)
Overseas demand(Oa)
Import (Da’)
Overseas demand(Oa)
20
Figure 5: Export Share and Import Penetration Ratio by Detail Commodity Classification
Production, domestic demand and trade
Electronics Industry :1990
0.0%10.0%20.0%30.0%40.0%50.0%60.0%70.0%80.0%90.0%
100.0%
0.0% 20.0% 40.0% 60.0% 80.0% 100.0%
Export/Production
Impo
rt/D
omes
tic d
eman
d
Production, domestic demand and tradeElectronics Industry: 2004
0.0%
10.0%
20.0%
30.0%
40.0%
50.0%
60.0%
70.0%
80.0%
90.0%
100.0%
0.0% 20.0% 40.0% 60.0% 80.0% 100.0%
Export/Production
Impo
rt/D
omes
tic d
eman
d
21
Figure 6: Share of firms with overseas production
0%5%
10%15%
20%25%
30%35%
40%45%
50%
1994 1995 1996 1997 1998 1999 2000 2001 2002
LE LE for ASIA SME SME for ASIA
Source: Author’s calculation based on BSBSA Figure 7: Relevant local factors for FDI
0%
10%
20%
30%
40%
50%
60%
Labor cost
Market size
Ability of
local firms for
JV
Infrastructure
Legal and taxenv.
-5051-100101-300300-
Source: 2004 SME White Paper in Japan (METI)

22
Figure 8: Objectives of overseas production by location
0%
10%
20%
30%
40%
50%
60%
70%
80%
China NIES SE Asia
Cheap product importbackOverseas market
Repond to J. customerneedsSecure prod workers
Source: 2004 SME White Paper in Japan (METI) Figure 9: Sales share by firm size and globalization
0%
10%
20%
30%
40%
50%
60%
70%
80%
90%
100%
1994 2002
Global LE
Global SME
Domestic LE
Domestic SME
Source: Author’s calculation based on BSBSA

23
Table 4: Regression Results-1 (Dependent Variable=Log(domestic sales))
North America Europe NIES ASEAN China OthersLOS 0.055 0.060 0.083 0.067 0.061 -0.029
(2.69)** (1.91) (3.70)** (3.43)** (2.83)** (0.87)D-lf 0.508 0.366 0.590 0.527 0.661 -0.071
(3.31)** (1.79) (3.62)** (3.64)** (4.21)** (0.35)LOS*D-lf -0.039 -0.035 -0.056 -0.045 -0.061 0.046
(1.89) (1.13) (2.42)* (2.25)* (2.73)** (1.35)LRD 0.055 0.065 0.046 0.044 0.041 0.025
(6.98)** (6.64)** (5.45)** (5.68)** (3.40)** (2.09)*D_Parent -0.030 -0.067 0.007 -0.093 -0.042 -0.193
(1.00) (1.51) (0.19) (2.75)** (0.73) (2.44)*Constant 10.037 10.391 9.797 9.932 10.015 11.575
(62.77)** (47.09)** (58.96)** (65.82)** (57.16)** (51.81)**Observations 3768 2359 2987 3913 2413 1319Number of kikatsu 717 457 573 759 533 256R-squared 0.03 0.04 0.03 0.03 0.02 0.02Absolute value of t statistics in parentheses* significant at 5%; ** significant at 1%
Table 5: Regression Results-2 (Dependent Variable=Log(domestic sales))
NIES ASEAN China(1) (2) (3) (4) (5) (6)
LOS 0.097 0.095 0.068 0.073 0.072 0.074(3.72)** (3.65)** (3.31)** (3.48)** (3.17)** (3.26)**
D-lf 0.663 0.711 0.509 0.567 0.745 0.753(3.48)** (3.70)** (3.33)** (3.31)** (4.54)** (4.48)**
LOS*D-lf -0.066 -0.065 -0.041 -0.047 -0.072 -0.075(2.42)* (2.39)* (1.98)* (2.17)* (3.09)** (3.19)**
%SAJ 0.005 -0.092 -0.008 -0.088 0.024 -0.063(0.13) (0.92) (0.26) (0.99) (0.64) (0.64)
%SUJ 0.021 0.171 0.032 0.152 0.066 0.161(0.79) (2.15)* (1.43) (1.92) (2.47)* (2.21)*
%SAJ*D_lf 0.117 0.087 0.098(1.11) (0.96) (0.97)
%SUJ*D_lf -0.167 -0.127 -0.108(2.03)* -1.58 -1.41
LRD 0.048 0.047 0.046 0.046 0.041 0.041(5.20)** (5.12)** (5.49)** (5.50)** (3.25)** (3.21)**
D_Parent 0.007 0.006 -0.098 -0.100 -0.063 -0.062(0.16) (0.16) (2.66)** (2.71)** (0.99) -0.98
Constant 9.532 9.501 9.782 9.726 9.802 9.797(49.62)** (49.13)** (61.46)** (55.85)** (53.66)** (52.93)**
Observations 2561 2561 3423 3423 2057 2057Number of kikatsu 552 552 734 734 515 515R-squared 0.04 0.04 0.03 0.03 0.03 0.03Absolute value of t statistics in parentheses* significant at 5%; ** significant at 1%
24
Figure 10: Globalization and SME by industry
0.500
0.400
0.300
0.200
0.100
0.000
0.100
0.200
0.300
0.400
0.100 0.000 0.100 0.200 0.300 0.400
Changes in SME ratio
Cha
nges
in g
lobl
izat
ion
rati
Source: Author’s calculation based on BSBSA
Table 6: Regression Results-3 (Dependent Variable=Log(domestic sales)) Overseas=No Overseas=Yes SME LE SME LELOS -0.016 -0.035 0.043 0.026
(1.17) (1.86)+ (2.46)* (1.72)+LRD 0.461 0.524 0.339 0.546
(32.11)** (26.25)** (19.94)** (40.42)**D_parent -0.438 -1.307 -0.822 -0.463
(2.48)* (4.95)** (2.85)** (1.96)+LOS*D_parent 0.022 0.117 0.011 -0.017
(1.34) (4.92)** (0.42) (0.83)Constant 9.303 8.686 8.267 8.032
(44.12)** (30.27)** (37.13)** (35.27)**Observations 1000 930 705 830Number of ind 35 35 35 34R-squared 0.47 0.53 0.48 0.83Absolute value of t statistics in parentheses+ significant at 10%,* significant at 5%; ** significant at 1%