Financial Globalization, Growth and Volatility in Developing Countries
Globalization of foodsystems in developingcountries: impact on foodsecurity and nutrition
FAOFOOD ANDNUTRITION
PAPER
83
ISSN 0254-4725
FOOD AND AGRICULTURE ORGANIZATION OF THE UNITED NATIONSRome, 2004
83
Globalization of foodsystems in developingcountries: impact on foodsecurity and nutrition
FAOFOOD ANDNUTRITION
PAPER
ISBN 92-5-105228-X
iii
Contents
Acknowledgements ivForeword vAcronyms vi
I Overview papers
Globalization of food systems in developing countries: a synthesis of country case studies 1 Gina Kennedy, Guy Nantel and Prakash Shetty
Features of urban food and nutrition security and considerations for successful urban programming 27 Marie Ruel and James Garrett
Globalization, urbanization and nutritional change in the developing world 55 Michelle Mendez and Barry Popkin
The growing global obesity problem: some policy options to address it 81 Josef Schmidhuber
II Country case studies
Impact of globalization on food consumption, health and nutrition in Nigeria 99 Kolawole Olayiwola, Adedoyin Soyibo and Tola Atinmo
Globalization, urbanization and nutritional changes in South Africa 119 Mickey Chopra
Impact of globalization on food consumption, health and nutrition in urban areas: a case study of Dar es Salaam, United Republic of Tanzania 135 Joyce Kinabo
Trends in health and nutrition indicators in the urban slums of three cities in Bangladesh, compared to its rural areas 155 Martin Bloem, Regina Moench-Pfanner, Federico Graciano, Gudrun Stalkamp and Saskia de Pee
Urbanization, income and the nutrition transition in China: a case study 169 Michelle Mendez, Shufa Du and Barry Popkin
Globalization, urbanization and nutrition transition in a developing island country: a case study in Fiji 195Jimaima Schultz
Impact of globalization on the food consumption of urban India 215 Swarna Vepa
Globalization, food consumption, health and nutrition in urban areas: a case study from the Philippines 231 Maria Regina Pedro, Corazon Barba and Luz Candelaria
iv
Impact of globalization on food consumption, health and nutrition in urban areas: a case study of Brazil 253 Ana Lydia Sawaya, Paula Andrea Martins and Vinicíus Jose Baccin Martins
Nutrition transition in Chile: a case study 275 Fernando Vio and Cecilia Albala
Impact of globalization on food consumption, health and nutrition in urban areas of Colombia 285Luis Fajardo
Acknowledgements
Special thanks go to all of the authors whose papers appear in this publication. Additionally thanks are due to the following persons for their assistance in reviewing one or more of the papers in this
volume; Ruth Charrondiere, Margarita Flores, Stuart Gillespie, Lawrence Haddad, Yasmeen Khwaja, Tim Lang, Christian Romer Lovendal, Philip McMichael, Carlos Monteiro, Mark
Montgomery, Barry Popkin and Ricardo Uauy. Special note goes to Nicolas Lemery-Nantel for the cover design which was also used as the workshop logo.
v
Foreword
The workshop “Globalization of food systems: impact on food security and nutrition” was held at the headquarters of the Food and Agriculture Organization of the United Nations (FAO) in Rome, Italy from 8 to 10 October 2003. The workshop was convened to gain a better understanding of the influence of globalization and urbanization on food systems (food supply, marketing and distribution) in developing countries and to analyse the effects of these changes on smallholders and small firms, on food consumption patterns and on nutrition and health outcomes. The event was jointly organized by two divisions within FAO, representing two sectors: the Agricultural and Development Economics Division, examining key economic issues, and the Food and Nutrition Division, addressing health and nutrition outcomes. Thus, two parallel themes were explored: i) the transformation of food systems and its effect on small farmers in developing countries and ii) the impact of globalization, largely influenced by urbanization, on dietary patterns and the nutritional status of urban populations. The workshop was partially funded through the FAO-Netherlands Partnership Programme.
This publication examines in detail the second theme, related to features of globalization, changes in dietary patterns and shifts in the burden of malnutrition and diet-related chronic diseases. It comprises a synthesis paper bringing together the salient features of the impact of the globalization process on nutrition and reflecting some of the discussions at the workshop, three overview papers and 11 country case studies that were presented at the workshop. The overview papers describe shifts in food availability, food consumption and food and nutrition security in the urban environment. The topics are further explored through a series of 11 country case studies from Africa (Nigeria, the United Republic of Tanzania and South Africa), Asia (Bangladesh, China, India, and the Philippines) and the Pacific (Fiji) and Latin America (Brazil, Chile and Colombia). Each case study presents unique insights on different aspects of globalization, including urbanization, access to services and technologies, evolution of the workforce and impact of government decentralization on dietary changes and alterations in population health and nutritional status.
The compilation of the 11 case studies represents each individual author’s perspective using the best available national data to highlight those features thought to be most important to changes in food systems, nutrition and health in each country covered. Some case studies explore the issues from an economic perspective (India, Nigeria) while others are more focused on nutrition and health outcomes (Bangladesh, Chile). The purpose of this collection of papers is not to provide a value judgment of the differing forces related to globalization, but to contribute to the body of knowledge by documenting the pace and spread of change.
The overview papers appearing in the first part of this publication will also be published in the electronic Journal of Agriculture and Development Economics, which can be found at www.fao.org/es/ESA/en/ejade.htm/.
Dr Kraisid Tontisirin Director
Food and Nutrition Division
vi
Acronyms
AIDS acquired immunodeficiency syndrome
APIN AIDS Prevention Initiatives in Nigeria
ARMM Administrative Region of Muslim Mindanao
ASFs animal source foods
BMI body mass index
CBN Central Bank of Nigeria
CHD coronary heart disease
CHNS China Health and Nutrition Survey
CHS community health worker
CREN Centro de Recuperação e Educação Nutritional (Centre for Nutritional Recovery and Education) (Brazil)
DALYs disability-adjusted life years
DES dietary energy supply
DHS Demographic and Health Survey
EBF exclusive breastfeeding
FAO Food and Agriculture Organization of the United Nations
FGN Federal Government of Nigeria
FMoH Federal Ministry of Health (Nigeria)
FOS Federal Office of Statistics (Nigeria)
GDP gross domestic product
GNP gross national product
HIES Household Income and Expenditure Survey (Fiji)
HIV human immunodeficiency virus
HKI Helen Keller International
vii
HTN hypertension
ICMR Indian Council of Medical Research
ICT information and communication technologies
IDA iron deficiency anaemia
IDD iodine deficiency disorder
IMR infant mortality rate
IOTF International Obesity Task Force
IPHN Institute of Public Health Nutrition (Bangladesh)
LSMS Living Standards Measurement Study
MDGs Millennium Development Goals
NAFDAC National Agency for Food and Drug Administration and Control
NCDs non-communicable diseases
NCFN National Committee on Food and Nutrition (Nigeria)
NGO non-governmental organization
NPC National Planning Commission (Nigeria)
NSP Nutrition Surveillance Project (Bangladesh)
NSS National Sample Surveys (India)
OECD Organisation for Economic Co-operation and Development
OFW overseas Filipino workers
RDA recommended daily allowance (China)/recommended dietary allowance (Philippines and South Africa)
SAP Structural Adjustment Programme
SES socio-economic status
STDs sexually transmitted diseases
STIs sexually transmitted infections
viii
TTD type-2 diabetes
UNDP United Nations Development Programme
UNICEF United Nations Children’s Fund
UWC University of the Western Cape (South Africa)
VAD vitamin A deficiency
VAT value-added tax
WHO World Health Organization
WTO World Trade Organization
YLL years of life lost
Globalization of food systems in developing countries: impact on food security and nutrition 1
Globalization of food systems in developing countries:
a synthesis of country case studies Gina Kennedy1, Guy Nantel and Prakash Shetty
INTRODUCTIONThe phenomenon of globalization is having a major impact on food systems around the world. Food systems are changing, resulting in greater availability and diversity of food, although access to this food is by no means universal. Many of these changes are closely associated with urbanization, increasing incomes, market liberalization and foreign direct investment. Competition for a market share of food purchases tends to intensify with entry into the system of powerful new players such as large multinational fast food and supermarket chains. The losers tend to be the small local agents and traditional food markets and, to some extent, merchants selling “street foods” as well as other food items. The supermarkets bring with them significant improvements in standards of food quality and safety at competitive prices and convenience, factors which are highly attractive to an increasingly sophisticated consumer. Thus these changes in food systems affect availability and access to food through changes to the food production, procurement and distribution systems and the food trade environment. In turn this is bringing about a gradual shift in food culture (towards a more universal one), with consequent changes in dietary consumption patterns and nutritional status that vary with the socio-economic strata. Indeed, the lower socio-economic population groups drift towards poor-quality, energy-dense but cheap and affordable foods.
The main drivers to changes in food systems and dietary patterns, such as urbanization, increased income, capital flow and market liberalization, have been discussed by others (de Haan et al., 2003; Haddad, 2003; Popkin, 2003; Reardon et al., 2003; Lang and Heasman, in press). This paper looks at the impact of globalization and increasing urbanization on dietary and physical activity patterns and their effect on nutritional status and health.
First a conceptual framework of the determinants of these profound changes to food systems in the societies of developing countries is provided. The remainder of the paper draws upon and summarizes observed dietary changes and their resulting impact on nutritional status from 11 case studies in Latin America (Brazil, Chile and Colombia), Asia (Bangladesh, China, India and the Philippines), Africa (Nigeria, the United Republic of Tanzania and South Africa) and the Pacific (Fiji).
1 Gina Kennedy, Guy Nantel and Prakash Shetty Nutrition Planning, Assessment and Evaluation Service Food and Nutrition Division Food and Agriculture Organization of the United Nations Viale delle Terme di Caracalla Rome, Italy E-mail: [email protected]
2 Globalization of food systems in developing countries: a synthesis of country case studies
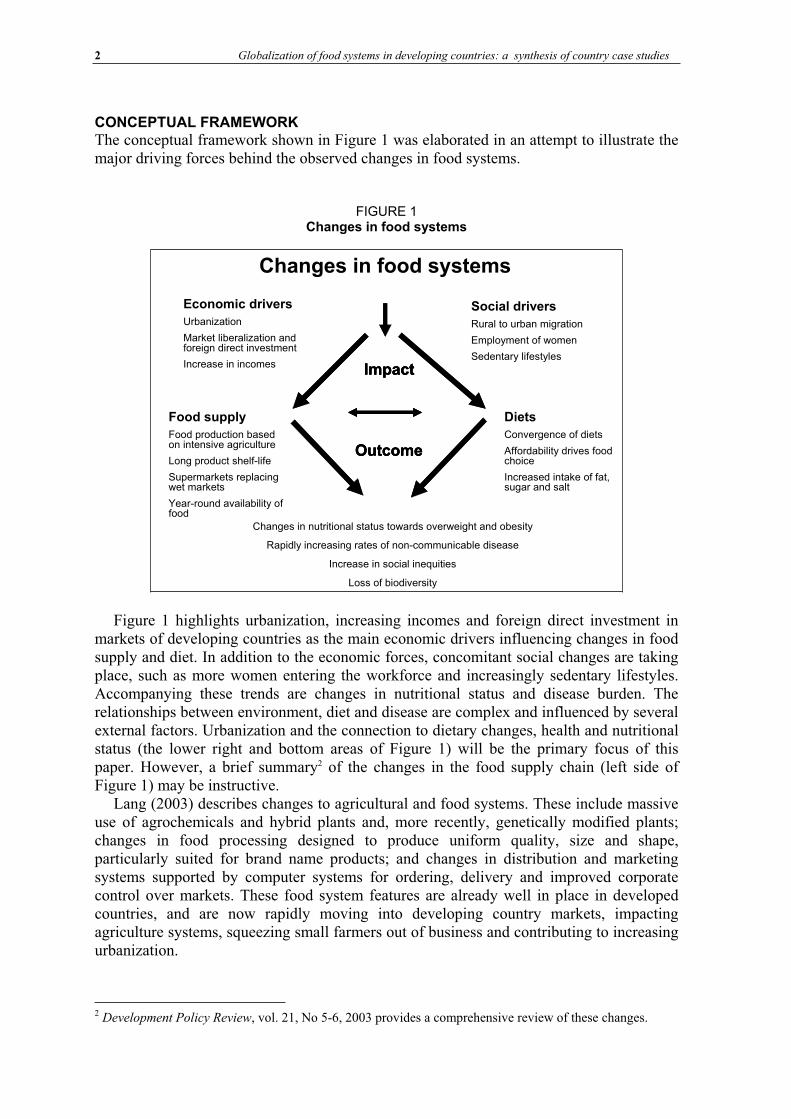
CONCEPTUAL FRAMEWORK The conceptual framework shown in Figure 1 was elaborated in an attempt to illustrate the major driving forces behind the observed changes in food systems.
FIGURE 1 Changes in food systems
Changes in food systems
Economic drivers
Urbanization
Market liberalization and foreign direct investment
Increase in incomes
Food supply
Food production based on intensive agriculture
Long product shelf-life
Supermarkets replacing wet markets
Year-round availability of food
Diets
Convergence of diets
Affordability drives food choice
Increased intake of fat, sugar and salt
Changes in nutritional status towards overweight and obesity
Rapidly increasing rates of non-communicable disease
Increase in social inequities
Loss of biodiversity
Impact
Outcome
Impact
Outcome
Impact
Outcome
Social drivers
Rural to urban migration
Employment of women
Sedentary lifestyles
Figure 1 highlights urbanization, increasing incomes and foreign direct investment in markets of developing countries as the main economic drivers influencing changes in food supply and diet. In addition to the economic forces, concomitant social changes are taking place, such as more women entering the workforce and increasingly sedentary lifestyles. Accompanying these trends are changes in nutritional status and disease burden. The relationships between environment, diet and disease are complex and influenced by several external factors. Urbanization and the connection to dietary changes, health and nutritional status (the lower right and bottom areas of Figure 1) will be the primary focus of this paper. However, a brief summary2 of the changes in the food supply chain (left side of Figure 1) may be instructive.
Lang (2003) describes changes to agricultural and food systems. These include massive use of agrochemicals and hybrid plants and, more recently, genetically modified plants; changes in food processing designed to produce uniform quality, size and shape, particularly suited for brand name products; and changes in distribution and marketing systems supported by computer systems for ordering, delivery and improved corporate control over markets. These food system features are already well in place in developed countries, and are now rapidly moving into developing country markets, impacting agriculture systems, squeezing small farmers out of business and contributing to increasing urbanization.
2 Development Policy Review, vol. 21, No 5-6, 2003 provides a comprehensive review of these changes.
Globalization of food systems in developing countries: impact on food security and nutrition 3
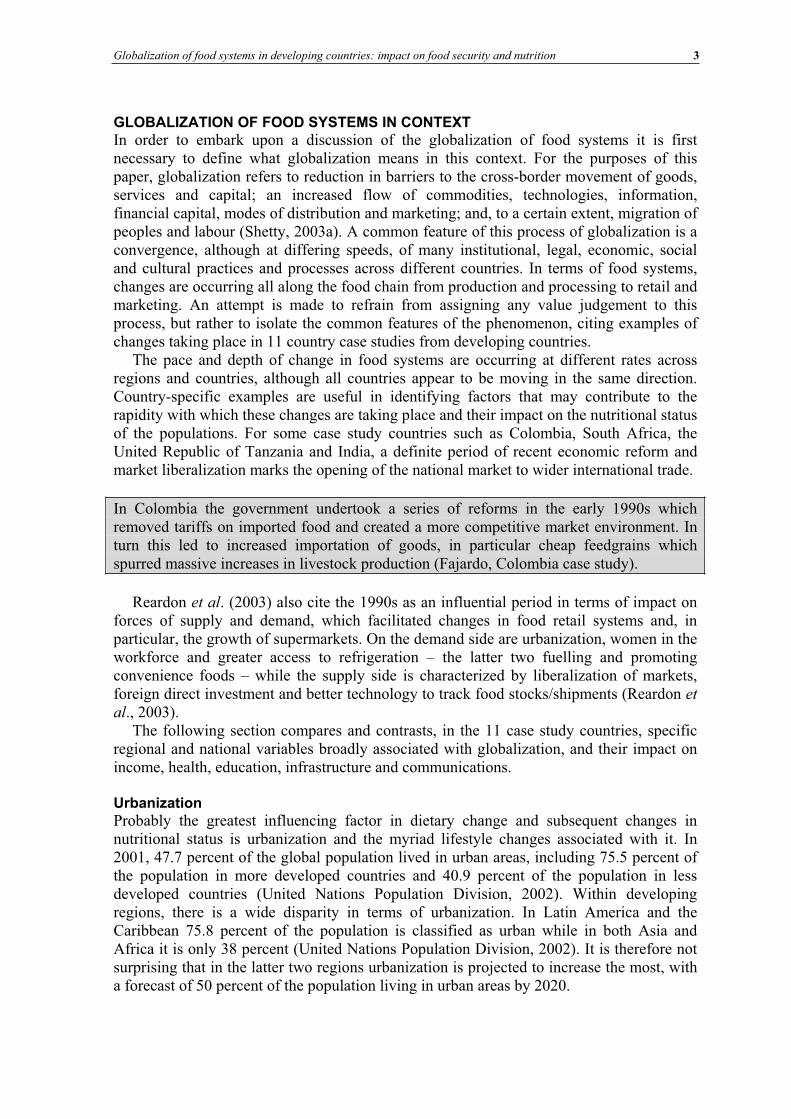
GLOBALIZATION OF FOOD SYSTEMS IN CONTEXT In order to embark upon a discussion of the globalization of food systems it is first necessary to define what globalization means in this context. For the purposes of this paper, globalization refers to reduction in barriers to the cross-border movement of goods, services and capital; an increased flow of commodities, technologies, information, financial capital, modes of distribution and marketing; and, to a certain extent, migration of peoples and labour (Shetty, 2003a). A common feature of this process of globalization is a convergence, although at differing speeds, of many institutional, legal, economic, social and cultural practices and processes across different countries. In terms of food systems, changes are occurring all along the food chain from production and processing to retail and marketing. An attempt is made to refrain from assigning any value judgement to this process, but rather to isolate the common features of the phenomenon, citing examples of changes taking place in 11 country case studies from developing countries.
The pace and depth of change in food systems are occurring at different rates across regions and countries, although all countries appear to be moving in the same direction. Country-specific examples are useful in identifying factors that may contribute to the rapidity with which these changes are taking place and their impact on the nutritional status of the populations. For some case study countries such as Colombia, South Africa, the United Republic of Tanzania and India, a definite period of recent economic reform and market liberalization marks the opening of the national market to wider international trade.
In Colombia the government undertook a series of reforms in the early 1990s which removed tariffs on imported food and created a more competitive market environment. In turn this led to increased importation of goods, in particular cheap feedgrains which spurred massive increases in livestock production (Fajardo, Colombia case study).
Reardon et al. (2003) also cite the 1990s as an influential period in terms of impact on forces of supply and demand, which facilitated changes in food retail systems and, in particular, the growth of supermarkets. On the demand side are urbanization, women in the workforce and greater access to refrigeration – the latter two fuelling and promoting convenience foods – while the supply side is characterized by liberalization of markets, foreign direct investment and better technology to track food stocks/shipments (Reardon et
al., 2003). The following section compares and contrasts, in the 11 case study countries, specific
regional and national variables broadly associated with globalization, and their impact on income, health, education, infrastructure and communications.
UrbanizationProbably the greatest influencing factor in dietary change and subsequent changes in nutritional status is urbanization and the myriad lifestyle changes associated with it. In 2001, 47.7 percent of the global population lived in urban areas, including 75.5 percent of the population in more developed countries and 40.9 percent of the population in less developed countries (United Nations Population Division, 2002). Within developing regions, there is a wide disparity in terms of urbanization. In Latin America and the Caribbean 75.8 percent of the population is classified as urban while in both Asia and Africa it is only 38 percent (United Nations Population Division, 2002). It is therefore not surprising that in the latter two regions urbanization is projected to increase the most, with a forecast of 50 percent of the population living in urban areas by 2020.
4 Globalization of food systems in developing countries: a synthesis of country case studies
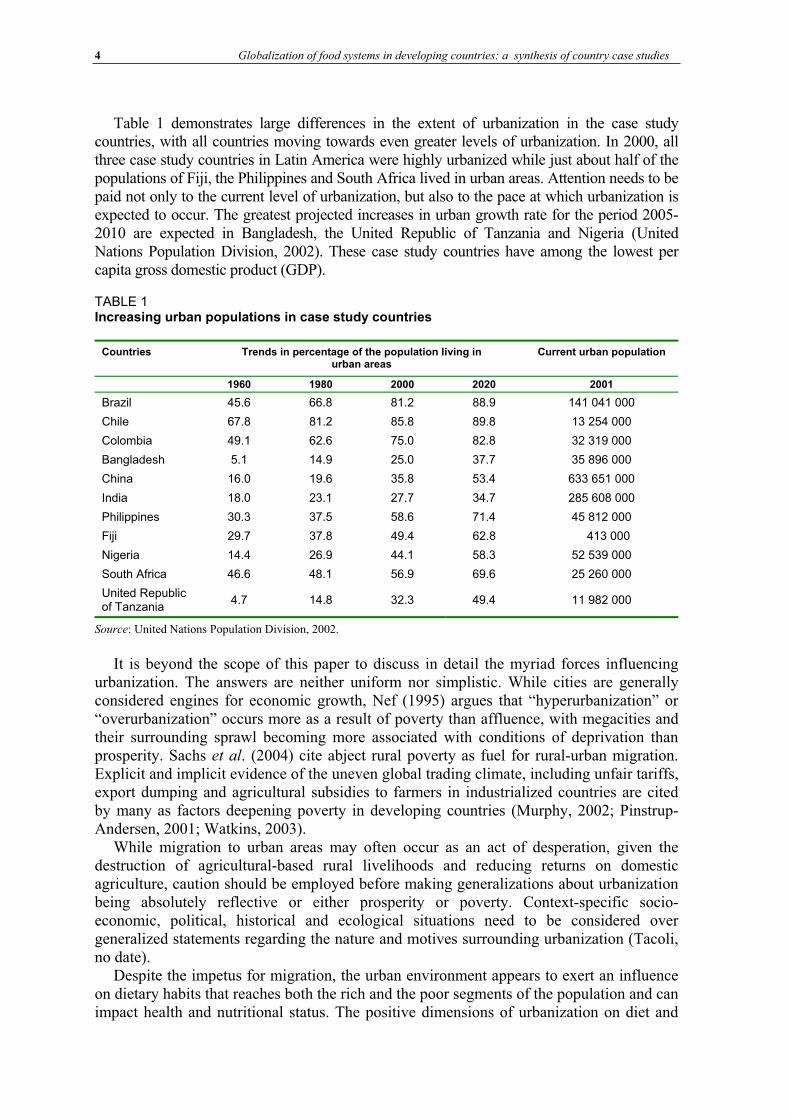
Table 1 demonstrates large differences in the extent of urbanization in the case study countries, with all countries moving towards even greater levels of urbanization. In 2000, all three case study countries in Latin America were highly urbanized while just about half of the populations of Fiji, the Philippines and South Africa lived in urban areas. Attention needs to be paid not only to the current level of urbanization, but also to the pace at which urbanization is expected to occur. The greatest projected increases in urban growth rate for the period 2005-2010 are expected in Bangladesh, the United Republic of Tanzania and Nigeria (United Nations Population Division, 2002). These case study countries have among the lowest per capita gross domestic product (GDP).
TABLE 1 Increasing urban populations in case study countries
Source: United Nations Population Division, 2002.
It is beyond the scope of this paper to discuss in detail the myriad forces influencing urbanization. The answers are neither uniform nor simplistic. While cities are generally considered engines for economic growth, Nef (1995) argues that “hyperurbanization” or “overurbanization” occurs more as a result of poverty than affluence, with megacities and their surrounding sprawl becoming more associated with conditions of deprivation than prosperity. Sachs et al. (2004) cite abject rural poverty as fuel for rural-urban migration. Explicit and implicit evidence of the uneven global trading climate, including unfair tariffs, export dumping and agricultural subsidies to farmers in industrialized countries are cited by many as factors deepening poverty in developing countries (Murphy, 2002; Pinstrup-Andersen, 2001; Watkins, 2003).
While migration to urban areas may often occur as an act of desperation, given the destruction of agricultural-based rural livelihoods and reducing returns on domestic agriculture, caution should be employed before making generalizations about urbanization being absolutely reflective or either prosperity or poverty. Context-specific socio-economic, political, historical and ecological situations need to be considered over generalized statements regarding the nature and motives surrounding urbanization (Tacoli, no date).
Despite the impetus for migration, the urban environment appears to exert an influence on dietary habits that reaches both the rich and the poor segments of the population and can impact health and nutritional status. The positive dimensions of urbanization on diet and
Countries Trends in percentage of the population living in urban areas
Current urban population
1960 1980 2000 2020 2001
Brazil 45.6 66.8 81.2 88.9 141 041 000
Chile 67.8 81.2 85.8 89.8 13 254 000
Colombia 49.1 62.6 75.0 82.8 32 319 000
Bangladesh 5.1 14.9 25.0 37.7 35 896 000
China 16.0 19.6 35.8 53.4 633 651 000
India 18.0 23.1 27.7 34.7 285 608 000
Philippines 30.3 37.5 58.6 71.4 45 812 000
Fiji 29.7 37.8 49.4 62.8 413 000
Nigeria 14.4 26.9 44.1 58.3 52 539 000
South Africa 46.6 48.1 56.9 69.6 25 260 000
United Republic of Tanzania
4.7 14.8 32.3 49.4 11 982 000
Globalization of food systems in developing countries: impact on food security and nutrition 5
health include greater access to education and health care services, and greater availability of diverse foods. However, these advantages may not reach all urban residents. There are also negative or potentially negative features, including diets with greater amounts of fat and sugars or sweeteners, increasingly sedentary lifestyles, environmental pollution, unsanitary and overcrowded living conditions and crime. These features will be discussed in more detail in the following sections.
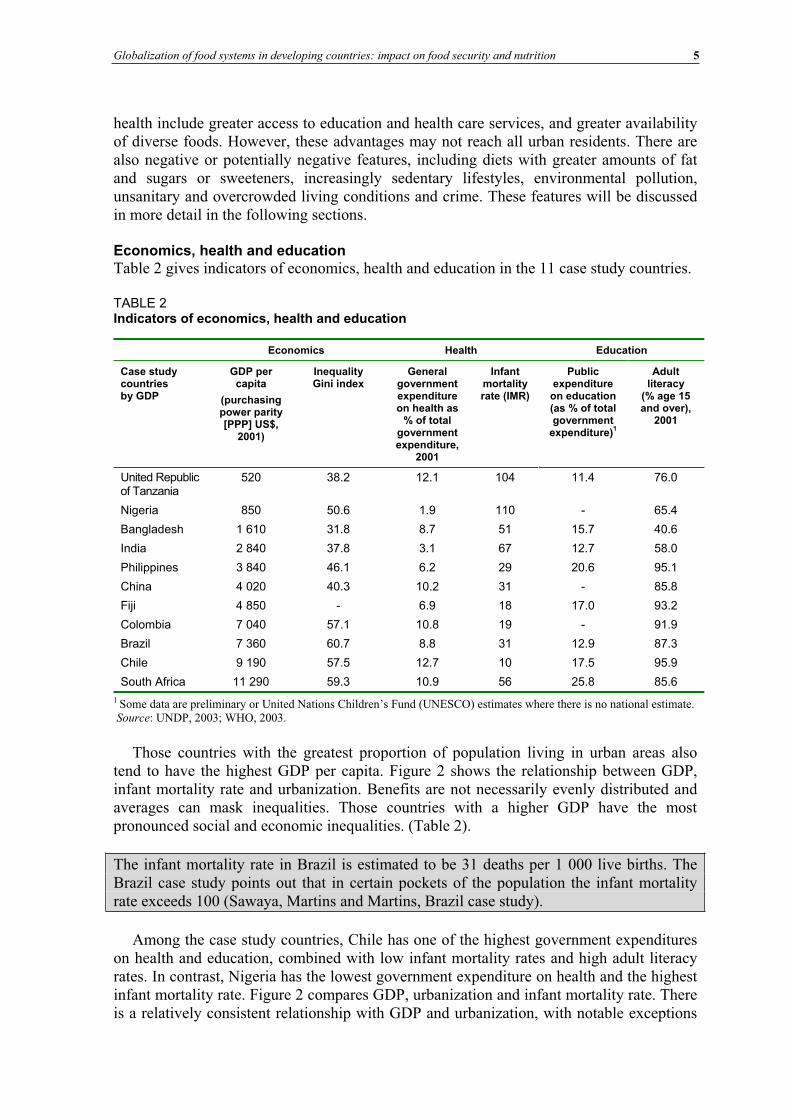
Economics, health and educationTable 2 gives indicators of economics, health and education in the 11 case study countries.
TABLE 2Indicators of economics, health and education
Economics Health Education
Case study countries by GDP
GDP per capita
(purchasing power parity [PPP] US$,
2001)
Inequality Gini index
General government expenditure on health as
% of total government expenditure,
2001
Infant mortality rate (IMR)
Publicexpenditure
on education (as % of total government
expenditure)1
Adult literacy
(% age 15 and over),
2001
United Republic of Tanzania
520 38.2 12.1 104 11.4 76.0
Nigeria 850 50.6 1.9 110 - 65.4
Bangladesh 1 610 31.8 8.7 51 15.7 40.6
India 2 840 37.8 3.1 67 12.7 58.0
Philippines 3 840 46.1 6.2 29 20.6 95.1
China 4 020 40.3 10.2 31 - 85.8
Fiji 4 850 - 6.9 18 17.0 93.2
Colombia 7 040 57.1 10.8 19 - 91.9
Brazil 7 360 60.7 8.8 31 12.9 87.3
Chile 9 190 57.5 12.7 10 17.5 95.9
South Africa 11 290 59.3 10.9 56 25.8 85.6
1 Some data are preliminary or United Nations Children’s Fund (UNESCO) estimates where there is no national estimate. Source: UNDP, 2003; WHO, 2003.
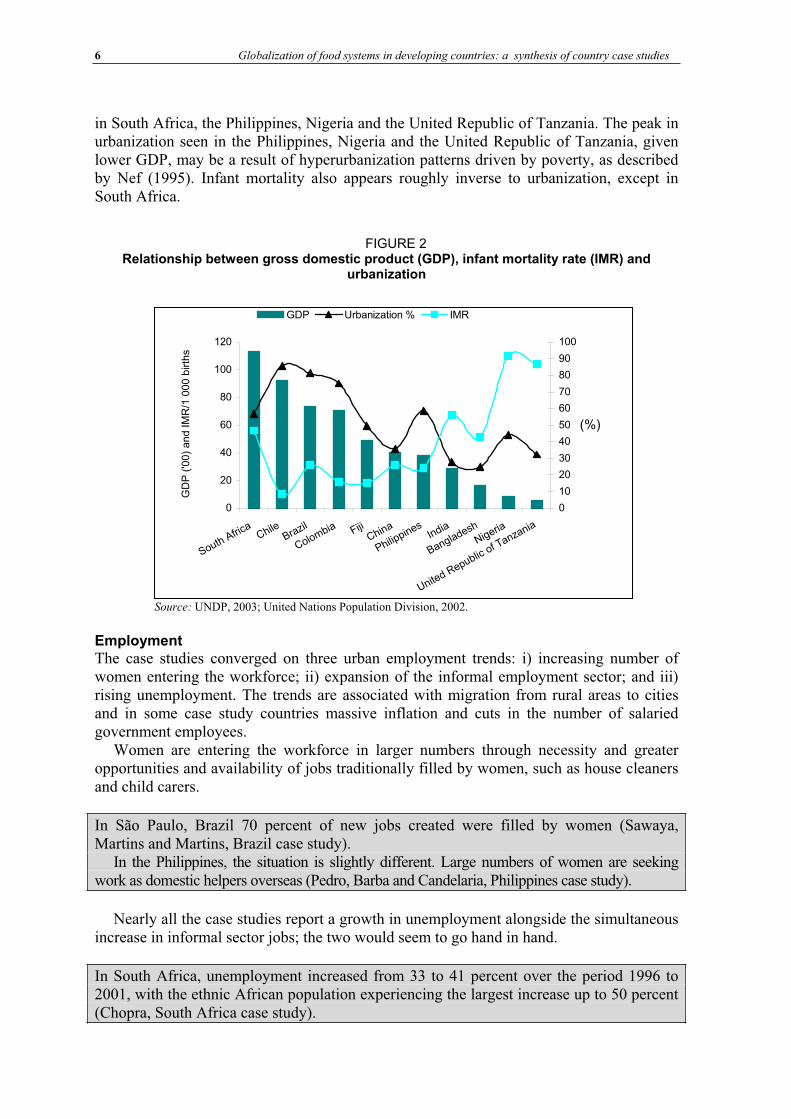
Those countries with the greatest proportion of population living in urban areas also tend to have the highest GDP per capita. Figure 2 shows the relationship between GDP, infant mortality rate and urbanization. Benefits are not necessarily evenly distributed and averages can mask inequalities. Those countries with a higher GDP have the most pronounced social and economic inequalities. (Table 2).
The infant mortality rate in Brazil is estimated to be 31 deaths per 1 000 live births. The Brazil case study points out that in certain pockets of the population the infant mortality rate exceeds 100 (Sawaya, Martins and Martins, Brazil case study).
Among the case study countries, Chile has one of the highest government expenditures on health and education, combined with low infant mortality rates and high adult literacy rates. In contrast, Nigeria has the lowest government expenditure on health and the highest infant mortality rate. Figure 2 compares GDP, urbanization and infant mortality rate. There is a relatively consistent relationship with GDP and urbanization, with notable exceptions
6 Globalization of food systems in developing countries: a synthesis of country case studies
in South Africa, the Philippines, Nigeria and the United Republic of Tanzania. The peak in urbanization seen in the Philippines, Nigeria and the United Republic of Tanzania, given lower GDP, may be a result of hyperurbanization patterns driven by poverty, as described by Nef (1995). Infant mortality also appears roughly inverse to urbanization, except in South Africa.
FIGURE 2 Relationship between gross domestic product (GDP), infant mortality rate (IMR) and
urbanization
0
20
40
60
80
100
120
SouthAfric
aChile
Brazil
Colombia FijiChina
Philippines
India
Bangladesh
Nigeria
United Republic
of Tanzania
GD
P (
'00)
and IM
R/1
000 b
irth
s
0
10
20
30
40
50
60
70
80
90
100
(%)
GDP Urbanization % IMR
Source: UNDP, 2003; United Nations Population Division, 2002.
Employment The case studies converged on three urban employment trends: i) increasing number of women entering the workforce; ii) expansion of the informal employment sector; and iii) rising unemployment. The trends are associated with migration from rural areas to cities and in some case study countries massive inflation and cuts in the number of salaried government employees.
Women are entering the workforce in larger numbers through necessity and greater opportunities and availability of jobs traditionally filled by women, such as house cleaners and child carers.
In São Paulo, Brazil 70 percent of new jobs created were filled by women (Sawaya, Martins and Martins, Brazil case study).
In the Philippines, the situation is slightly different. Large numbers of women are seeking work as domestic helpers overseas (Pedro, Barba and Candelaria, Philippines case study).
Nearly all the case studies report a growth in unemployment alongside the simultaneous increase in informal sector jobs; the two would seem to go hand in hand.
In South Africa, unemployment increased from 33 to 41 percent over the period 1996 to 2001, with the ethnic African population experiencing the largest increase up to 50 percent (Chopra, South Africa case study).
Globalization of food systems in developing countries: impact on food security and nutrition 7
In Nigeria, the government has reduced jobs and unemployment is high. The informal sector is estimated to account for 75 percent of employment (Olayiwola, Soyibo and Atinmo, Nigeria case study).
Much of the growth in the informal sector involves food preparation and retailing. Families engage in food preparation or the sale of street foods since entry into the system is largely unregulated, requires skills that most families already possess and does not require much upfront investment. Complementary to this trend is an increasing demand for meals away from home as commuting distances between residence and employment increase, and working hours are long and often unpredictable.
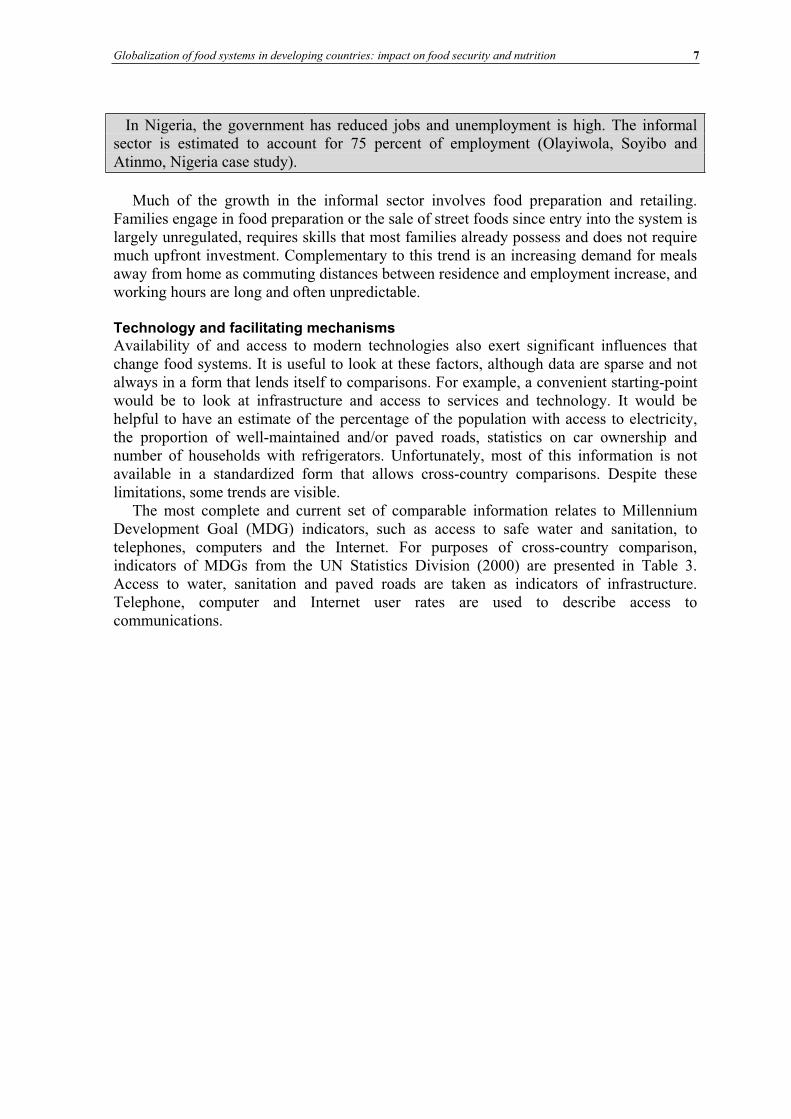
Technology and facilitating mechanisms Availability of and access to modern technologies also exert significant influences that change food systems. It is useful to look at these factors, although data are sparse and not always in a form that lends itself to comparisons. For example, a convenient starting-point would be to look at infrastructure and access to services and technology. It would be helpful to have an estimate of the percentage of the population with access to electricity, the proportion of well-maintained and/or paved roads, statistics on car ownership and number of households with refrigerators. Unfortunately, most of this information is not available in a standardized form that allows cross-country comparisons. Despite these limitations, some trends are visible.
The most complete and current set of comparable information relates to Millennium Development Goal (MDG) indicators, such as access to safe water and sanitation, to telephones, computers and the Internet. For purposes of cross-country comparison, indicators of MDGs from the UN Statistics Division (2000) are presented in Table 3. Access to water, sanitation and paved roads are taken as indicators of infrastructure. Telephone, computer and Internet user rates are used to describe access to communications.
8 Globalization of food systems in developing countries: a synthesis of country case studies
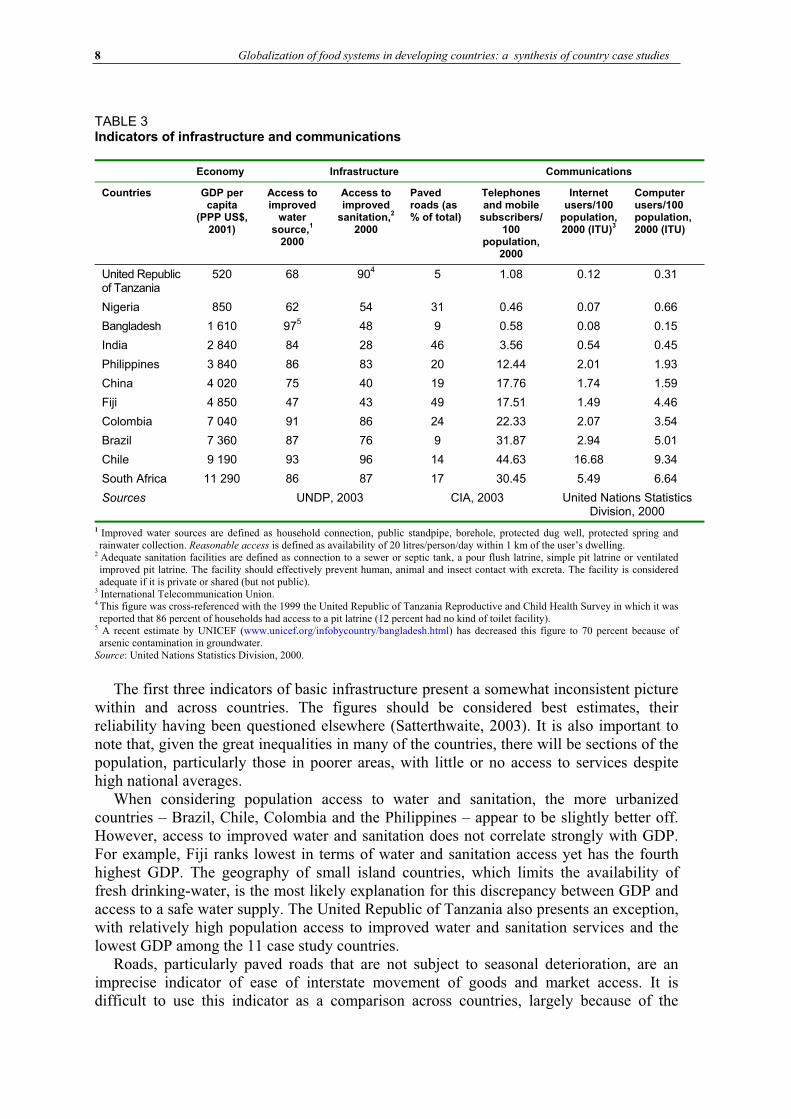
TABLE 3Indicators of infrastructure and communications
Economy Infrastructure Communications
Countries GDP per capita
(PPP US$, 2001)
Access to improved
water source,
1
2000
Access to improved
sanitation,2
2000
Paved roads (as % of total)
Telephones and mobile
subscribers/100
population, 2000
Internet users/100
population, 2000 (ITU)
3
Computer users/100population, 2000 (ITU)
United Republic of Tanzania
520 68 904 5 1.08 0.12 0.31
Nigeria 850 62 54 31 0.46 0.07 0.66
Bangladesh 1 610 975 48 9 0.58 0.08 0.15
India 2 840 84 28 46 3.56 0.54 0.45
Philippines 3 840 86 83 20 12.44 2.01 1.93
China 4 020 75 40 19 17.76 1.74 1.59
Fiji 4 850 47 43 49 17.51 1.49 4.46
Colombia 7 040 91 86 24 22.33 2.07 3.54
Brazil 7 360 87 76 9 31.87 2.94 5.01
Chile 9 190 93 96 14 44.63 16.68 9.34
South Africa 11 290 86 87 17 30.45 5.49 6.64
Sources UNDP, 2003 CIA, 2003 United Nations Statistics Division, 2000
1 Improved water sources are defined as household connection, public standpipe, borehole, protected dug well, protected spring andrainwater collection. Reasonable access is defined as availability of 20 litres/person/day within 1 km of the user’s dwelling.
2 Adequate sanitation facilities are defined as connection to a sewer or septic tank, a pour flush latrine, simple pit latrine or ventilated improved pit latrine. The facility should effectively prevent human, animal and insect contact with excreta. The facility is consideredadequate if it is private or shared (but not public).
3 International Telecommunication Union. 4 This figure was cross-referenced with the 1999 the United Republic of Tanzania Reproductive and Child Health Survey in which it was reported that 86 percent of households had access to a pit latrine (12 percent had no kind of toilet facility).
5 A recent estimate by UNICEF (www.unicef.org/infobycountry/bangladesh.html) has decreased this figure to 70 percent because of arsenic contamination in groundwater.
Source: United Nations Statistics Division, 2000.
The first three indicators of basic infrastructure present a somewhat inconsistent picture within and across countries. The figures should be considered best estimates, their reliability having been questioned elsewhere (Satterthwaite, 2003). It is also important to note that, given the great inequalities in many of the countries, there will be sections of the population, particularly those in poorer areas, with little or no access to services despite high national averages.
When considering population access to water and sanitation, the more urbanized countries – Brazil, Chile, Colombia and the Philippines – appear to be slightly better off. However, access to improved water and sanitation does not correlate strongly with GDP. For example, Fiji ranks lowest in terms of water and sanitation access yet has the fourth highest GDP. The geography of small island countries, which limits the availability of fresh drinking-water, is the most likely explanation for this discrepancy between GDP and access to a safe water supply. The United Republic of Tanzania also presents an exception, with relatively high population access to improved water and sanitation services and the lowest GDP among the 11 case study countries.
Roads, particularly paved roads that are not subject to seasonal deterioration, are an imprecise indicator of ease of interstate movement of goods and market access. It is difficult to use this indicator as a comparison across countries, largely because of the
Globalization of food systems in developing countries: impact on food security and nutrition 9
variations in country sizes. Brazil, for example, has 1.98 million km of road, 9 percent of which are paved. Fiji, on the other hand, has 3 440 km of road, with half paved.
The three indicators of communications seem to follow urbanization closely, with Chile, Brazil and Colombia having the greatest number of telecommunications users, followed by South Africa and the Philippines.
Refrigeration and freezer technology is a primary spark for the transformation of food systems. Extension of cold storage from food processing centres to large or small food outlets and eventually to private homes creates vast potential for changing the patterns of food procurement. A large variety of foods can be stored in a way that maintains quality, and consumers can choose between fresh or frozen (often ready to eat) products. Lack of access to a reliable source of electricity is undoubtedly the greatest barrier to access to refrigeration in many developing countries. According to the International Energy Agency (2002), 56 percent of people in developing countries lack access to electricity. Electrification rates by region show Latin America with 87 percent access, South Asia with 41 percent and sub-Saharan Africa with 23 percent. Thus, a prerequisite for expansion of the frozen food market is household ownership of refrigerators/freezers, which in turn requires access to electricity. Large supermarket chains are still able to establish markets in countries with limited electricity; however, it would be interesting to research any differences in the products sold in areas with different access levels to electricity.
The case study from Brazil indicates that refrigeration capacity is currently reaching individual homes, with over 80 percent of households owning refrigerators and 20 percent owning freezers (Sawaya, Martins and Martins, Brazil case study).
CHANGES IN DIETARY PATTERNS Details of the dynamics of change in diet are provided in the paper in this volume by Mendez and Popkin. Overall, the changes can be described by two distinct phenomena: dietary convergence and dietary adaptation. Dietary convergence is occurring as a result of increased reliance on a narrow base of staple grains, increased consumption of meat and meat products, dairy products, edible oil, salt and sugar, and a lower intake of dietary fibre. Dietary adaptation is characterized by an increased consumption of brand name processed and store-bought foods, an increased number of meals eaten outside the home and consumer behaviours driven by the appeal of new foods available.
Dietary convergence Income and price are the two most influential factors leading to dietary convergence. These in turn are affected by supply and availability. On the price side, low prices for the three dominant global staples – rice, wheat and maize – are largely maintained by subsidies to farmers in producing countries, particularly for wheat and maize. The rice trade has increased dramatically, fuelled by increasing demand in Africa and parts of Asia. World trade in rice reached a historic high of 28 million tonnes in 2002 (FAO, 2003). Dramatic production increases that have driven down cost were made possible as a result of yield improvements and intensive agricultural practices.
Increased consumption of fat, particularly from vegetable oils, is another phenomenon of dietary convergence. Higher fat intakes are now possible at a lower gross national product (GNP). Using GNP values standardized to 1993 US$, Popkin (2003) found that in 1962 an average GNP of $1 475 was necessary to derive 20 percent of energy from fat,
10 Globalization of food systems in developing countries: a synthesis of country case studies
while by 1990 the GNP needed for a diet with 20 percent of energy derived from fat was only half that at $750.
Similar price reductions have been seen for animal source foods (ASFs). Delgado et al.(1999) show dramatic declines in the price of milk and beef and more modest declines in the price of pork and poultry.
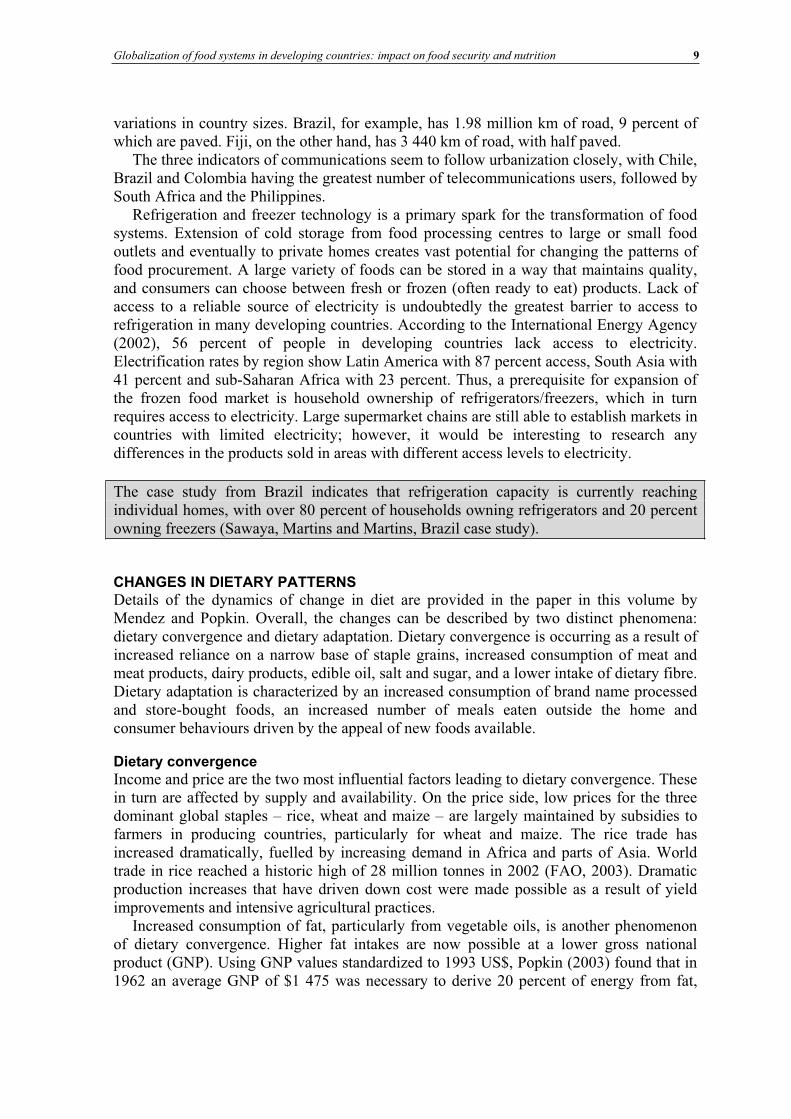
TABLE 4Twenty-year trends in dietary energy supply (DES) and percentage of DES from fat, oil and animal source foods (ASFs)
Countries Total DES
(kcals/per capita/day)
% DES from fat % DES from vegetable oil
% DES from ASFs
1980 2000 1980 2000 1980 2000 1980 2000
Brazil 2 677 3 002 22 26 11 11 15 20
China 2 328 2 974 13 25 3 6 7 20
South Africa 2 819 2 894 21 23 6 11 15 12
Chile 2 665 2 851 20 27 8 9 16 22
Fiji 2 501 2 782 32 33 10 11 20 19
Nigeria 2 030 2 768 25 21 15 12 6 3
Colombia 2 293 2 572 18 23 7 11 14 16
India 2 083 2 492 14 19 6 10 6 8
Philippines 2 221 2 374 15 18 5 6 11 15
Bangladesh 1 976 2 156 7 11 3 7 3 3
United Republic of Tanzania
2 191 1 970 13 13 4 5 6 6
Source: FAO, 2004. FAOSTAT (three-year averages – 1980 (1979-1980), 2000 (1999-2001).
The data in Table 4 do not distinguish between urban and rural availability. Nevertheless, they provide an overall view of the direction and pace of change related to dietary convergence. In all case study countries except the United Republic of Tanzania, the per capita availability of dietary energy has increased. The percentage of dietary energy obtained from fat has consistently risen over time in all but two countries. An increased percentage of dietary energy from vegetable oil is seen in nine of the case study countries, while an increased percentage of dietary energy from ASFs is noted in six countries.
Many of the case studies provide supporting evidence for the trends observed in Table 4.
In China, animal food intake (meat, poultry, fish and eggs) increased on average by 26 g/day from 1991 to 1997. The most dramatic increases were noticed in “less urbanized” urban areas and “more urbanized” rural areas (Mendez, Du and Popkin, China case study).
Significant gains were achieved in poultry production from 1990 to 2001 in Colombia, where increases of 55 percent for chicken meat and 36 percent for egg production were noted. These dramatic increases in poultry production were achieved through importation of cheaper animal feed (Fajardo, Colombia case study).
For urban India as a whole, from 1987-1988 to 1999-2000, consumption of rice and wheat declined marginally. The consumption of milk and eggs records an increase. A substantial increase over the three time periods is seen in the consumption of eggs, tea, biscuits, salted refreshments, prepared sweets, edible oils, sugar and country sugar (jaggary) (Vepa, India case study).
Globalization of food systems in developing countries: impact on food security and nutrition 11
Dietary adaptation Adaptation of diets to include more processed, refined and brand name foods is influenced by dramatic changes in lifestyle which are driven by, among others, demands on time, increased exposure to advertising, availability of new foods and emergence of new food retail outlets. Urban residents are the first to undergo lifestyle and environmental changes, but these eventually filter down into less urbanized areas as well.
Lifestyle changes and adaptation of meal patterns
In urban areas, men and women are driven into the workforce by the overriding need for an increase in income to pay for food, shelter, clothing and other household expenses. Working hours and commuting times are often long and, with growing numbers of family members entering the workforce, there is less time available to prepare food and hence there is a greater desire and necessity to consume meals outside the home.
In Chile the average working day is ten hours, with an additional one to three hours commuting time (Vio and Albala, Chile case study).
These factors have fuelled demand and led to massive market expansion of convenience and fast food options. Traditional meals and meal times are replaced by spontaneous often unplanned food purchases on street corners or in small kiosks. The traditional model of one family member taking responsibility for meal planning and food preparation for the household has fractured in most urban environments. Increasingly it is street food vendors, cafeterias at work or school and child care facilities that provide family members with at least one and often several meals per day. Thus, attention to dietary balance and dietary quality, which was traditionally “intuitive” at the household level, is now subject to wider cultural changes and external influence.
Street foods
In the context of rapid urbanization, street foods are becoming increasingly important as both a cheap and quick meal option and as an income-generating strategy. The meals and snacks served on the streets cater for a wide variety of customer tastes and range from traditional recipes of rice or maize with vegetables and beans, to more modern items including various types of fried or grilled meats, potatoes and bread. Many countries do not regulate street vendors and it is therefore possible to enter into street food vending with a relatively low start-up cost, making this activity attractive to many low-income urban residents.
In the United Republic of Tanzania, street foods account for 70 percent of total caloric intake of low- and middle- income groups (Kinabo, the United Republic of Tanzania case study).
Quality and safety are two common concerns cited with regard to street foods, yet there are very few concrete data on pathogen levels of street foods compared to home-prepared or restaurant food. The WHO Regional Office for Africa has conducted research on bacterial contamination of street food in Ghana. In this study, the microbial quality of most of the 511 food samples was within acceptable limits. Of the 26 types of foods (each food was sampled from multiple vendors) included in the study, four items – salad and macaroni dishes, red pepper and fufu – had total bacterial counts above acceptable limits (Mensah et
al., 2002). Lack of knowledge about sanitary practices, vehicle pollution, absence of
12 Globalization of food systems in developing countries: a synthesis of country case studies
structural insect barriers and scarcity of water for preparation and cleaning up all contribute to the likelihood of street foods being unhygienic.
Street food vending is not limited just to meals but also includes beverages, fruit juices and yoghurt drinks, and various snack foods: a practice that is little discussed in the nutrition community. In contrast to street vending of beverages made from fresh fruit is the continuously growing sale of carbonated beverages such as Coca-Cola and Fanta. Vendors are trained and promoted by multinational beverage companies that also employ and equip them. China, India and Nigeria are listed among the top emerging markets in the Coca-Cola Company’s Annual Report (Coca-Cola Company, 2002) and mobile street vending is one effective promotional technique.
Supermarkets
Reardon and colleagues have documented a phenomenal increase in supermarkets3 in developing countries (Reardon et al., 2003). They may be independently owned, but increasingly are part of larger commercial conglomerates, such as Ahold, Carrefor and Walmart. Supermarkets began to spread through Latin America in the early 1990s followed five to seven years later in Asia, and most recently in Africa. Their share in national retail reached 75 percent in Brazil in 2000 and 50 percent in Chile while in urban China and the Philippines the share in sales of packaged and processed foods reached 48 and 57 percent, respectively (Reardon, Timmer and Berdegue, 2003). An important aspect related to dietary adaptation is the range of products sold. The general pattern of supermarket entry into retail is first to specialize in the sale of packaged and processed foods, followed by fresh or frozen meat and lastly fresh produce. The initial entry into the market using packaged and processed foods exposes consumers to “exotic” food items or those with a long shelf-life such as powdered milk, ramen noodles and many varieties of sweet and savoury snack foods. Many processed foods contain added sodium and sweeteners and are also high in fat.
Fast food industry
The past decade has seen a dramatic increase in convenience food markets in developing countries. In 1985, the McDonald’s restaurant chain operated 9 000 restaurants worldwide; by 2001 this number had expanded to 30 000 restaurants in 121 countries (Ghezan, Mateos and Viteri, 2002). In China, the first foreign fast food company, Kentucky Fried Chicken, opened a restaurant in Beijing in 1987 and, after nine years, the business had expanded to 100 restaurants. Today, 15 years after the opening of the first restaurant, there are 600 Kentucky Fried Chicken outlets in China, the majority in urban centres (Agriculture and Agri-food Canada, 2002). Similarly, in Latin America 15 years ago there were 100 McDonald’s outlets, whereas today there are 1 581, with one-third located in the urban areas of Brazil (Ghezan, Mateos and Viteri, 2002).
Role of advertising
Secondary factors such as marketing, advertising, the appeal of new products, new retail outlets including supermarkets and multinational fast food chains contribute to dietary adaptation and convergence. Aside from the driving force of time constraints, part of the rapid adoption of new foods in the diet stems from successful advertising. The advertising budget of the largest food companies can exceed national expenditures on health promotion and health education by massive proportions (Lang, 2003). For example, British
3 A supermarket outlet is defined as a food retail market of 350-400 m2 in size with three to four or more cash registers.
Globalization of food systems in developing countries: impact on food security and nutrition 13
government expenditure on healthy eating advice is about 5 million per year while the Coca-Cola company spends 27 million per year in the United Kingdom of Great Britain and Northern Ireland alone, and total advertising expenditures by the food industry is just under 0.5 billion (Lang, 2003).
The global marketing of products and lifestyles via television in small island countries such as Fiji has become common. Subtle as well as aggressive advertising by transnational tobacco and alcohol companies in particular, both in print and electronically, appears to be aimed at younger receptive age groups. Generally, these advertisements portray lifestyles that are economically unachievable in local circumstances, generating expectations and a sense of envy and frustration that is deemed to be socially disruptive for individuals and groups (Schultz, Fiji case study).
Increasingly in developing countries television is becoming a good medium for advertising to large audiences and, with the spread of mobile phones and text messages, new channels for reaching consumers are emerging. In Brazil and Chile individuals watch four to five hours of television per day, while in the Philippines children spend on average more than one and a half hours per day in front of the television. Advertisements for food are becoming increasingly predominant and are expected to have greater impact as television audiences grow.
A review of food-related television advertisements in Brazil reported 58 percent of commercials promoting high fat and high sugar products, 9 percent featuring meat, beans or eggs and no advertisements for fresh fruit and vegetables (Sawaya, Martins and Martins, Brazil case study).
Changing attitudes
Value judgements in response to the appeal “to be modern” also influence food purchases and food preparation. In the urban areas of Johannesburg, residents consider fried food to be a sign of modern living and wealth, while food that is boiled is considered inferior and demonstrates outdated customs (Chopra, South Africa case study).
In the Cape Town region of South Africa the notion of farming characterized by physical effort and hardship in general remains an issue for recent migrants to urban slums (South Africa case study). Dwellers of Khayelitsha, an informal settlement of about 750 000 people, are willing to engage in communal gardening only to the extent that they need to do it for survival and have no alternative. They prefer to earn an income and to purchase food instead. Of those who work in the community gardens, the majority leave as soon as they have found a source of revenue. The result is that what were created as “community gardens” to meet the food needs of the Khayelitsha communities are now being transformed into businesses of market gardening and produce is sold to local markets where community dwellers do their food purchasing. Those individuals remaining active in the community gardens now consider themselves as “employees” in some sort of a cooperative arrangement from which they draw revenue.
DIET-RELATED HEALTH AND NUTRITION CHALLENGES It is important to study changing food systems and dietary patterns in order to understand how these alterations affect the health and nutrition of populations. Diet-related factors
14 Globalization of food systems in developing countries: a synthesis of country case studies
such as cholesterol; low fruit and vegetable intake; and iron, zinc and vitamin A deficiency rank among the major risk factors for decreased disability-adjusted life years (DALYs) (WHO, 2002). Health problems related to diet may be caused by a limited intake of dietary energy or micronutrients, an excessive intake of dietary energy, or poorly balanced intakes. There are direct health consequences from nutritional deficiencies such as blindness from severe vitamin A deficiency or mental incapacity as a result of iodine deficiency. Likewise, diet plays a critical albeit more covert role in the development of many other diseases including type-2 diabetes, cardiovascular disease, cancer, dental disease and osteoporosis (WHO/FAO, 2003).
High levels of undernutrition in adults and children in developing countries remain a grave concern and a top priority for public health action in many of the case study countries, as do deaths from communicable diseases such as malaria, diarrhoea, tuberculosis and other respiratory infections. However, the increasing prevalence of obesity and non-communicable diseases (NCDs) in developing countries is rapidly becoming a concern necessitating more attention. The most recent global estimates indicate that as many as 1.7 billion persons could be overweight or obese (IOTF, 2004). The majority of these people live in developed countries; however, overweight and obesity have been increasing exponentially in several regions of the developing world, particularly Latin America and the Caribbean and North Africa (Martorell, 2001). The term “double burden” has been used to describe countries experiencing continuing high prevalence rates of infectious and communicable diseases while at the same time NCDs are on the increase.
Popkin (2003) has defined a set of three stages which he terms the “nutrition transition”. In brief, the stages are: i) receding famine as incomes rise; ii) changes in diet and activity patterns, which increase the incidence of diet-related chronic disease; and iii) a stage of behavioural change where intake and activity are regulated such that health ageing is prolonged as diet-related chronic diseases are better prevented or controlled. The stages are closely linked to demographic and epidemiological shifts.
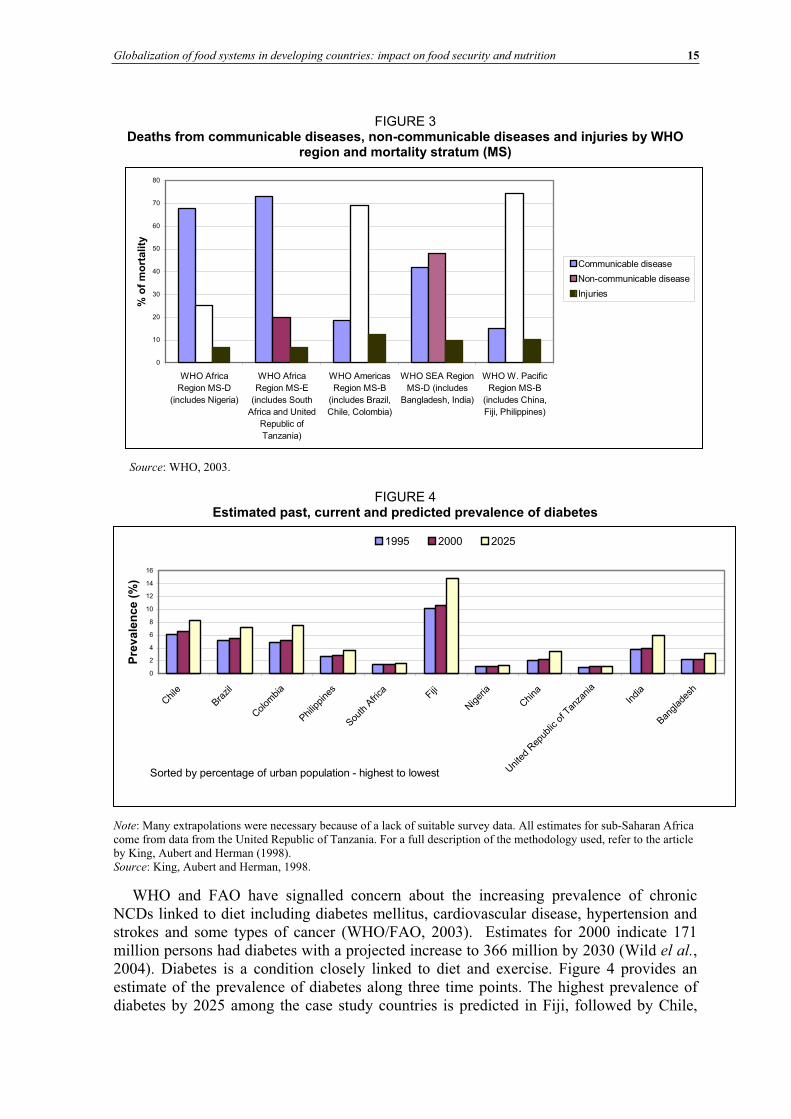
Burden of disease Figure 3 shows the relative percentage of mortality from communicable and non-communicable diseases and injuries based on the WHO mortality classification. The data presented do not correspond to individual countries, but to the WHO region and mortality stratum in which each case study country is located. WHO uses a quintile distribution to classify countries by different levels of child and adult mortality. The WHO mortality stratum classification can be found in the Annex. For further details on the methodology used to derive the mortality strata, the World Health Report 2002 can be consulted (WHO, 2002).
Figure 3 illustrates the largest dual burden of mortality for countries in the WHO Southeast Asia Region, which includes Bangladesh and India. In this regional stratum, deaths caused by communicable and non-communicable diseases are nearly equal. In the America and Pacific regional strata, NCDs account for the majority of mortalities, while the opposite pattern is observed in both WHO Africa mortality strata. Clearly public health strategies will need to be adapted accordingly in the different regions presented.
Globalization of food systems in developing countries: impact on food security and nutrition 15
FIGURE 3 Deaths from communicable diseases, non-communicable diseases and injuries by WHO
region and mortality stratum (MS)
0
10
20
30
40
50
60
70
80
WHO Africa
Region MS-D
(includes Nigeria)
WHO Africa
Region MS-E
(includes South
Africa and United
Republic of
Tanzania)
WHO Americas
Region MS-B
(includes Brazil,
Chile, Colombia)
WHO SEA Region
MS-D (includes
Bangladesh, India)
WHO W. Pacific
Region MS-B
(includes China,
Fiji, Philippines)
% o
f m
ort
ality
Communicable disease
Non-communicable disease
Injuries
Source: WHO, 2003.
FIGURE 4 Estimated past, current and predicted prevalence of diabetes
0
2
4
6
8
10
12
14
16
Chile
Brazil
Colom
bia
Philip
pine
s
South
Afri
ca Fiji
Niger
ia
China
Unite
d Rep
ublic
of T
anza
nia
India
Banglad
esh
Sorted by percentage of urban population - highest to lowest
Pre
va
len
ce
(%
)
1995 2000 2025
Note: Many extrapolations were necessary because of a lack of suitable survey data. All estimates for sub-Saharan Africa come from data from the United Republic of Tanzania. For a full description of the methodology used, refer to the article by King, Aubert and Herman (1998). Source: King, Aubert and Herman, 1998.
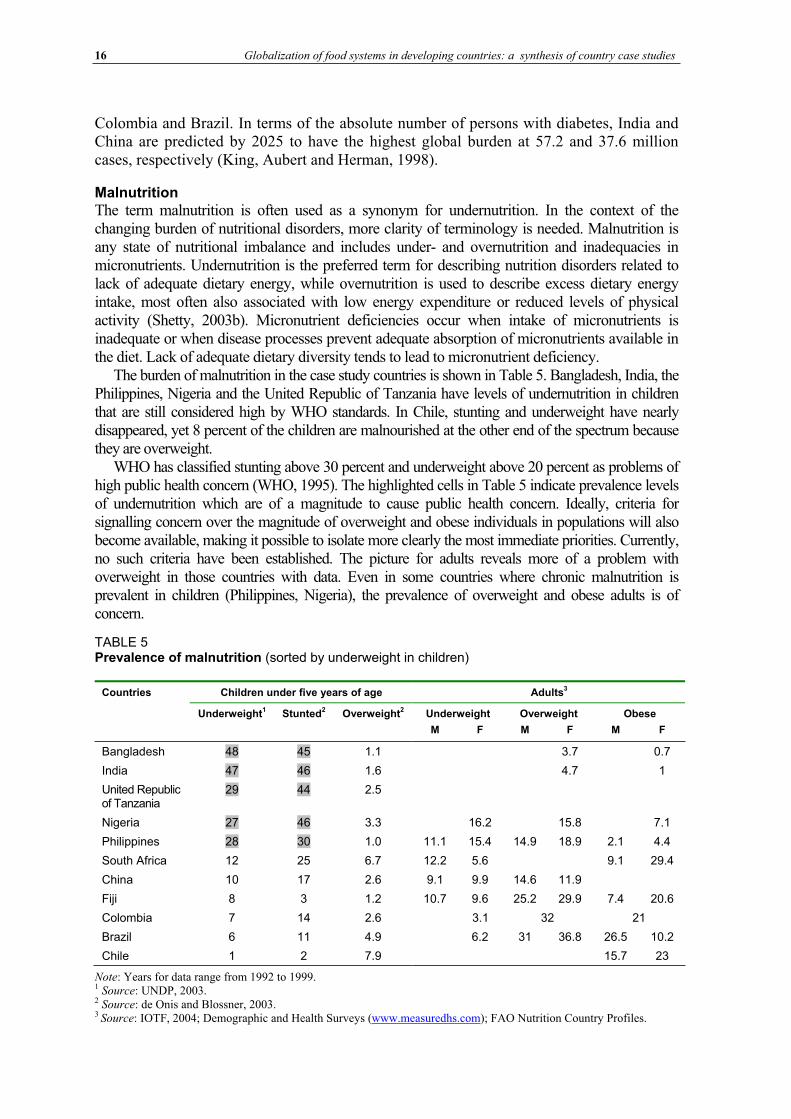
WHO and FAO have signalled concern about the increasing prevalence of chronic NCDs linked to diet including diabetes mellitus, cardiovascular disease, hypertension and strokes and some types of cancer (WHO/FAO, 2003). Estimates for 2000 indicate 171 million persons had diabetes with a projected increase to 366 million by 2030 (Wild el al.,2004). Diabetes is a condition closely linked to diet and exercise. Figure 4 provides an estimate of the prevalence of diabetes along three time points. The highest prevalence of diabetes by 2025 among the case study countries is predicted in Fiji, followed by Chile,
16 Globalization of food systems in developing countries: a synthesis of country case studies
Colombia and Brazil. In terms of the absolute number of persons with diabetes, India and China are predicted by 2025 to have the highest global burden at 57.2 and 37.6 million cases, respectively (King, Aubert and Herman, 1998).
Malnutrition The term malnutrition is often used as a synonym for undernutrition. In the context of the changing burden of nutritional disorders, more clarity of terminology is needed. Malnutrition is any state of nutritional imbalance and includes under- and overnutrition and inadequacies in micronutrients. Undernutrition is the preferred term for describing nutrition disorders related to lack of adequate dietary energy, while overnutrition is used to describe excess dietary energy intake, most often also associated with low energy expenditure or reduced levels of physical activity (Shetty, 2003b). Micronutrient deficiencies occur when intake of micronutrients is inadequate or when disease processes prevent adequate absorption of micronutrients available in the diet. Lack of adequate dietary diversity tends to lead to micronutrient deficiency.
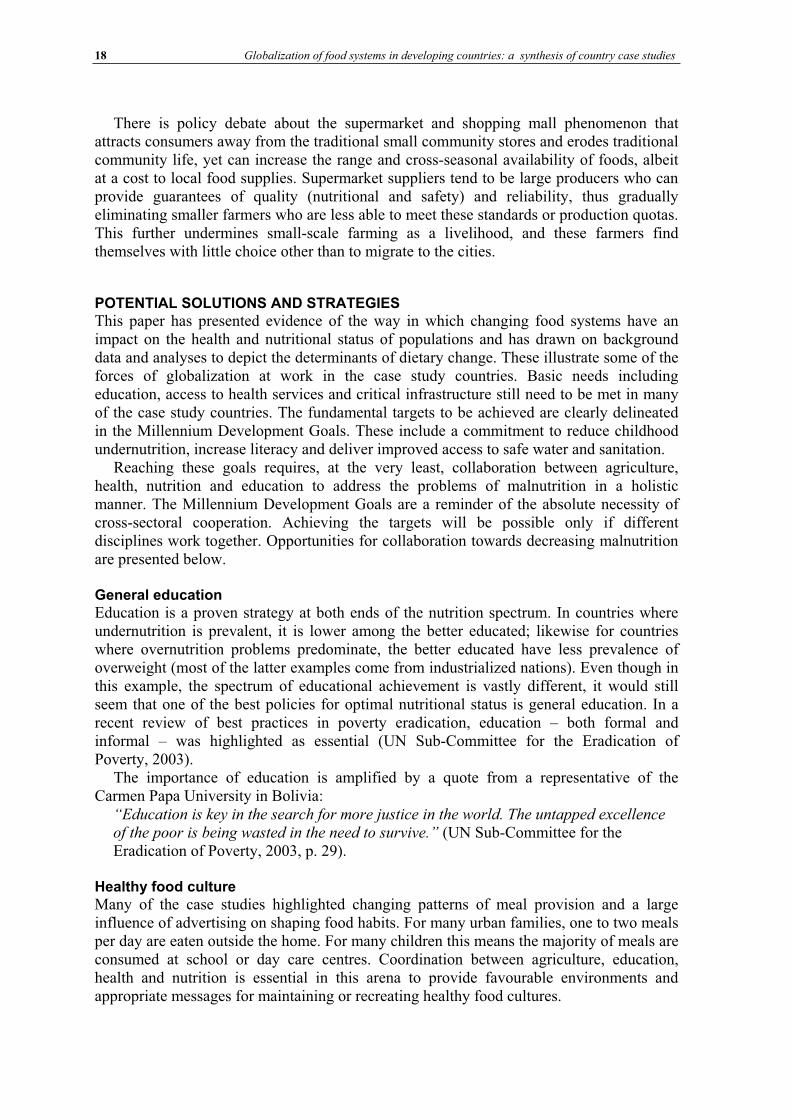
The burden of malnutrition in the case study countries is shown in Table 5. Bangladesh, India, the Philippines, Nigeria and the United Republic of Tanzania have levels of undernutrition in children that are still considered high by WHO standards. In Chile, stunting and underweight have nearly disappeared, yet 8 percent of the children are malnourished at the other end of the spectrum because they are overweight.
WHO has classified stunting above 30 percent and underweight above 20 percent as problems of high public health concern (WHO, 1995). The highlighted cells in Table 5 indicate prevalence levels of undernutrition which are of a magnitude to cause public health concern. Ideally, criteria for signalling concern over the magnitude of overweight and obese individuals in populations will also become available, making it possible to isolate more clearly the most immediate priorities. Currently, no such criteria have been established. The picture for adults reveals more of a problem with overweight in those countries with data. Even in some countries where chronic malnutrition is prevalent in children (Philippines, Nigeria), the prevalence of overweight and obese adults is of concern.
TABLE 5Prevalence of malnutrition (sorted by underweight in children)
Countries Children under five years of age Adults3
Underweight1 Stunted
2 Overweight
2 Underweight Overweight Obese
M F M F M F
Bangladesh 48 45 1.1 3.7 0.7
India 47 46 1.6 4.7 1
United Republic of Tanzania
29 44 2.5
Nigeria 27 46 3.3 16.2 15.8 7.1
Philippines 28 30 1.0 11.1 15.4 14.9 18.9 2.1 4.4
South Africa 12 25 6.7 12.2 5.6 9.1 29.4
China 10 17 2.6 9.1 9.9 14.6 11.9
Fiji 8 3 1.2 10.7 9.6 25.2 29.9 7.4 20.6
Colombia 7 14 2.6 3.1 32 21
Brazil 6 11 4.9 6.2 31 36.8 26.5 10.2
Chile 1 2 7.9 15.7 23
Note: Years for data range from 1992 to 1999.1 Source: UNDP, 2003. 2 Source: de Onis and Blossner, 2003. 3 Source: IOTF, 2004; Demographic and Health Surveys (www.measuredhs.com); FAO Nutrition Country Profiles.
Globalization of food systems in developing countries: impact on food security and nutrition 17
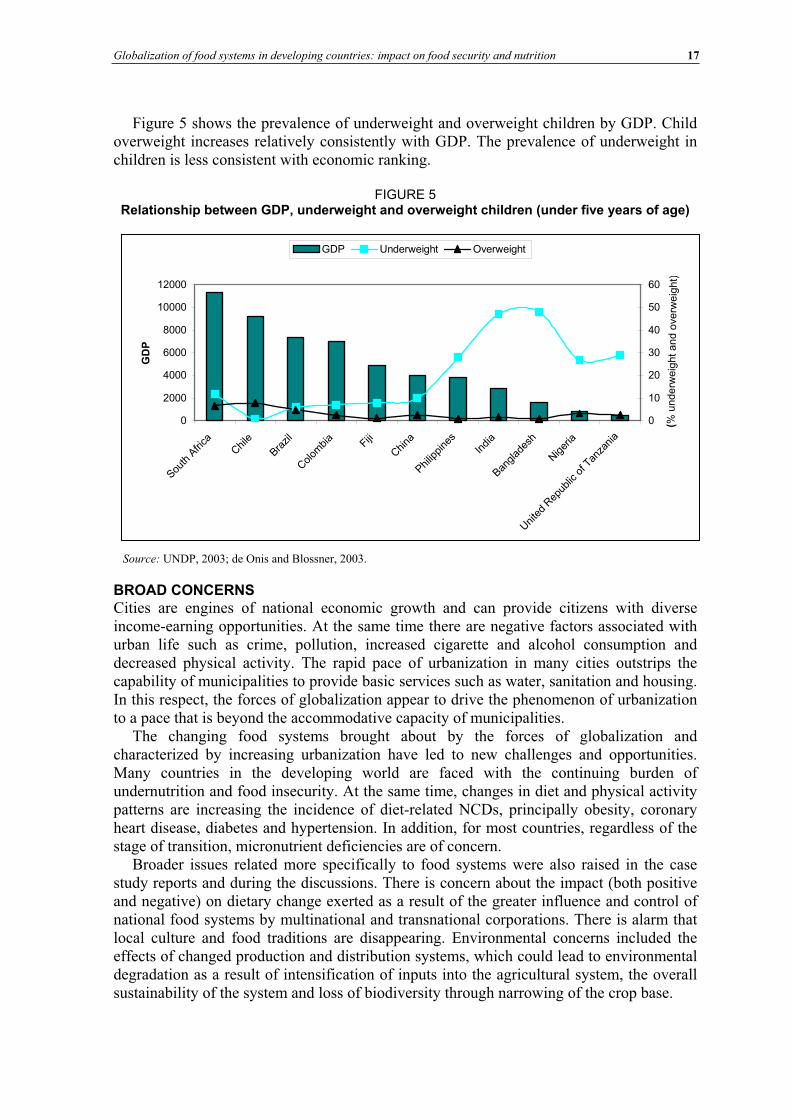
Figure 5 shows the prevalence of underweight and overweight children by GDP. Child overweight increases relatively consistently with GDP. The prevalence of underweight in children is less consistent with economic ranking.
FIGURE 5 Relationship between GDP, underweight and overweight children (under five years of age)
0
2000
4000
6000
8000
10000
12000
South
Afri
caChile
Brazil
Colom
bia
Fiji
China
Philip
pine
sIn
dia
Banglad
esh
Niger
ia
Unite
d Rep
ublic
of T
anza
nia
GD
P
0
10
20
30
40
50
60
( %unde
rweig
htan
dove
rwei g
ht )
GDP Underweight Overweight
Source: UNDP, 2003; de Onis and Blossner, 2003.
BROAD CONCERNS Cities are engines of national economic growth and can provide citizens with diverse income-earning opportunities. At the same time there are negative factors associated with urban life such as crime, pollution, increased cigarette and alcohol consumption and decreased physical activity. The rapid pace of urbanization in many cities outstrips the capability of municipalities to provide basic services such as water, sanitation and housing. In this respect, the forces of globalization appear to drive the phenomenon of urbanization to a pace that is beyond the accommodative capacity of municipalities.
The changing food systems brought about by the forces of globalization and characterized by increasing urbanization have led to new challenges and opportunities. Many countries in the developing world are faced with the continuing burden of undernutrition and food insecurity. At the same time, changes in diet and physical activity patterns are increasing the incidence of diet-related NCDs, principally obesity, coronary heart disease, diabetes and hypertension. In addition, for most countries, regardless of the stage of transition, micronutrient deficiencies are of concern.
Broader issues related more specifically to food systems were also raised in the case study reports and during the discussions. There is concern about the impact (both positive and negative) on dietary change exerted as a result of the greater influence and control of national food systems by multinational and transnational corporations. There is alarm that local culture and food traditions are disappearing. Environmental concerns included the effects of changed production and distribution systems, which could lead to environmental degradation as a result of intensification of inputs into the agricultural system, the overall sustainability of the system and loss of biodiversity through narrowing of the crop base.
18 Globalization of food systems in developing countries: a synthesis of country case studies
There is policy debate about the supermarket and shopping mall phenomenon that attracts consumers away from the traditional small community stores and erodes traditional community life, yet can increase the range and cross-seasonal availability of foods, albeit at a cost to local food supplies. Supermarket suppliers tend to be large producers who can provide guarantees of quality (nutritional and safety) and reliability, thus gradually eliminating smaller farmers who are less able to meet these standards or production quotas. This further undermines small-scale farming as a livelihood, and these farmers find themselves with little choice other than to migrate to the cities.
POTENTIAL SOLUTIONS AND STRATEGIES This paper has presented evidence of the way in which changing food systems have an impact on the health and nutritional status of populations and has drawn on background data and analyses to depict the determinants of dietary change. These illustrate some of the forces of globalization at work in the case study countries. Basic needs including education, access to health services and critical infrastructure still need to be met in many of the case study countries. The fundamental targets to be achieved are clearly delineated in the Millennium Development Goals. These include a commitment to reduce childhood undernutrition, increase literacy and deliver improved access to safe water and sanitation.
Reaching these goals requires, at the very least, collaboration between agriculture, health, nutrition and education to address the problems of malnutrition in a holistic manner. The Millennium Development Goals are a reminder of the absolute necessity of cross-sectoral cooperation. Achieving the targets will be possible only if different disciplines work together. Opportunities for collaboration towards decreasing malnutrition are presented below.
General education Education is a proven strategy at both ends of the nutrition spectrum. In countries where undernutrition is prevalent, it is lower among the better educated; likewise for countries where overnutrition problems predominate, the better educated have less prevalence of overweight (most of the latter examples come from industrialized nations). Even though in this example, the spectrum of educational achievement is vastly different, it would still seem that one of the best policies for optimal nutritional status is general education. In a recent review of best practices in poverty eradication, education – both formal and informal – was highlighted as essential (UN Sub-Committee for the Eradication of Poverty, 2003).
The importance of education is amplified by a quote from a representative of the Carmen Papa University in Bolivia:
“Education is key in the search for more justice in the world. The untapped excellence of the poor is being wasted in the need to survive.” (UN Sub-Committee for the Eradication of Poverty, 2003, p. 29).
Healthy food culture Many of the case studies highlighted changing patterns of meal provision and a large influence of advertising on shaping food habits. For many urban families, one to two meals per day are eaten outside the home. For many children this means the majority of meals are consumed at school or day care centres. Coordination between agriculture, education, health and nutrition is essential in this arena to provide favourable environments and appropriate messages for maintaining or recreating healthy food cultures.
Globalization of food systems in developing countries: impact on food security and nutrition 19
As a direction towards a solution, the United Republic of Tanzania case study suggests that there should be a healthy relationship between the rural and urban communities, pointing out that it is in the interest of both urban and rural areas to maintain linkages. In Dar es Salaam, newly arrived residents from rural areas tend to maintain links with their rural place of origin as insurance in obtaining supplies of fresh produce. This is a frequently occurring pattern with new migrants to cities but, over time, these connections tend to fade. A challenge might be to search for ways of maintaining and nurturing these links. There is a definite need to develop a vision of cities and the rural world as different ends of a sociogeographic spectrum, rather than as individual worlds on their own.
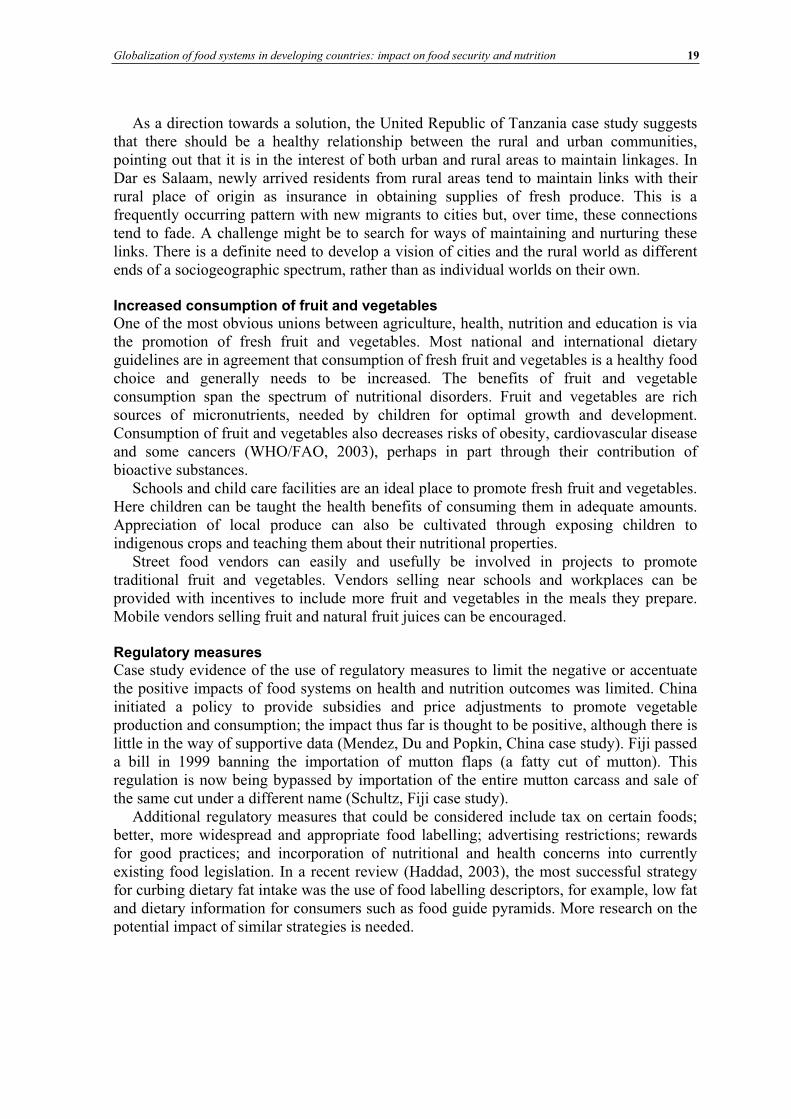
Increased consumption of fruit and vegetables One of the most obvious unions between agriculture, health, nutrition and education is via the promotion of fresh fruit and vegetables. Most national and international dietary guidelines are in agreement that consumption of fresh fruit and vegetables is a healthy food choice and generally needs to be increased. The benefits of fruit and vegetable consumption span the spectrum of nutritional disorders. Fruit and vegetables are rich sources of micronutrients, needed by children for optimal growth and development. Consumption of fruit and vegetables also decreases risks of obesity, cardiovascular disease and some cancers (WHO/FAO, 2003), perhaps in part through their contribution of bioactive substances.
Schools and child care facilities are an ideal place to promote fresh fruit and vegetables. Here children can be taught the health benefits of consuming them in adequate amounts. Appreciation of local produce can also be cultivated through exposing children to indigenous crops and teaching them about their nutritional properties.
Street food vendors can easily and usefully be involved in projects to promote traditional fruit and vegetables. Vendors selling near schools and workplaces can be provided with incentives to include more fruit and vegetables in the meals they prepare. Mobile vendors selling fruit and natural fruit juices can be encouraged.
Regulatory measures Case study evidence of the use of regulatory measures to limit the negative or accentuate the positive impacts of food systems on health and nutrition outcomes was limited. China initiated a policy to provide subsidies and price adjustments to promote vegetable production and consumption; the impact thus far is thought to be positive, although there is little in the way of supportive data (Mendez, Du and Popkin, China case study). Fiji passed a bill in 1999 banning the importation of mutton flaps (a fatty cut of mutton). This regulation is now being bypassed by importation of the entire mutton carcass and sale of the same cut under a different name (Schultz, Fiji case study).
Additional regulatory measures that could be considered include tax on certain foods; better, more widespread and appropriate food labelling; advertising restrictions; rewards for good practices; and incorporation of nutritional and health concerns into currently existing food legislation. In a recent review (Haddad, 2003), the most successful strategy for curbing dietary fat intake was the use of food labelling descriptors, for example, low fat and dietary information for consumers such as food guide pyramids. More research on the potential impact of similar strategies is needed.
20 Globalization of food systems in developing countries: a synthesis of country case studies
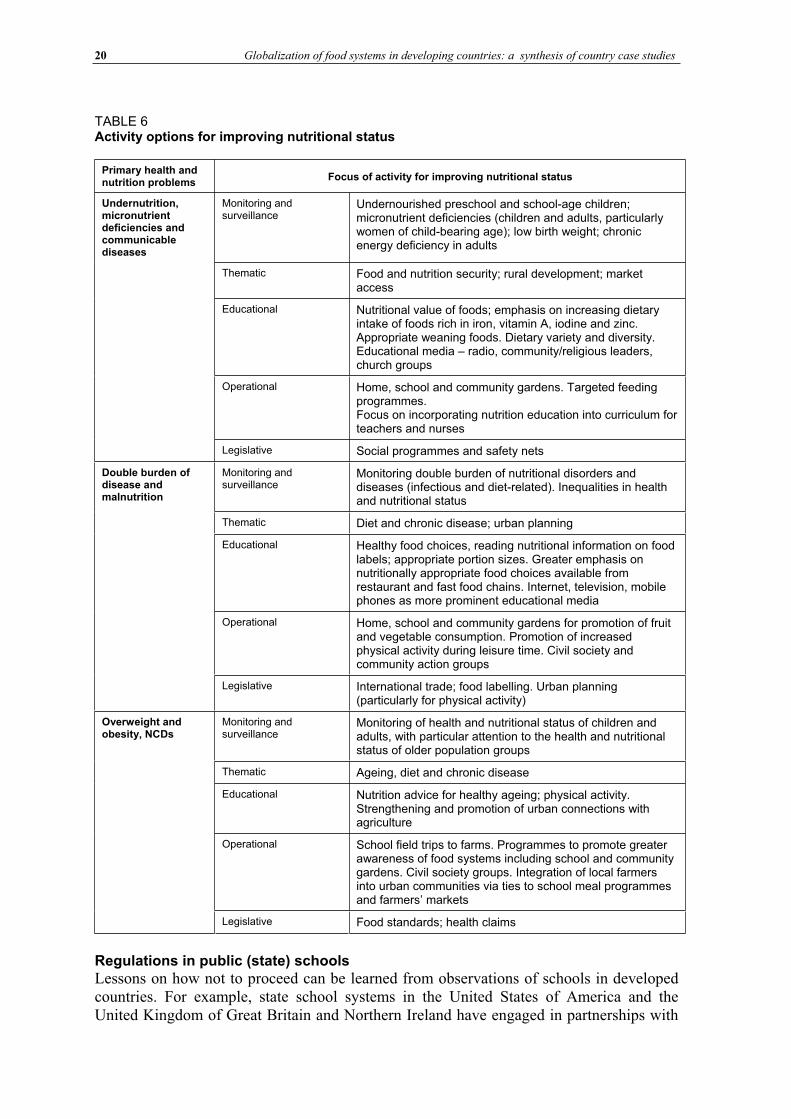
TABLE 6 Activity options for improving nutritional status
Primary health and nutrition problems
Focus of activity for improving nutritional status
Undernutrition, micronutrient deficiencies and communicable diseases
Monitoring and surveillance
Undernourished preschool and school-age children; micronutrient deficiencies (children and adults, particularly women of child-bearing age); low birth weight; chronic energy deficiency in adults
Thematic Food and nutrition security; rural development; market access
Educational Nutritional value of foods; emphasis on increasing dietary intake of foods rich in iron, vitamin A, iodine and zinc. Appropriate weaning foods. Dietary variety and diversity. Educational media – radio, community/religious leaders, church groups
Operational Home, school and community gardens. Targeted feeding programmes. Focus on incorporating nutrition education into curriculum for teachers and nurses
Legislative Social programmes and safety nets
Double burden of disease and malnutrition
Monitoring and surveillance
Monitoring double burden of nutritional disorders and diseases (infectious and diet-related). Inequalities in health and nutritional status
Thematic Diet and chronic disease; urban planning
Educational Healthy food choices, reading nutritional information on food labels; appropriate portion sizes. Greater emphasis on nutritionally appropriate food choices available from restaurant and fast food chains. Internet, television, mobile phones as more prominent educational media
Operational Home, school and community gardens for promotion of fruit and vegetable consumption. Promotion of increased physical activity during leisure time. Civil society and community action groups
Legislative International trade; food labelling. Urban planning (particularly for physical activity)
Overweight and obesity, NCDs
Monitoring and surveillance
Monitoring of health and nutritional status of children and adults, with particular attention to the health and nutritional status of older population groups
Thematic Ageing, diet and chronic disease
Educational Nutrition advice for healthy ageing; physical activity. Strengthening and promotion of urban connections with agriculture
Operational School field trips to farms. Programmes to promote greater awareness of food systems including school and community gardens. Civil society groups. Integration of local farmers into urban communities via ties to school meal programmes and farmers’ markets
Legislative Food standards; health claims
Regulations in public (state) schools Lessons on how not to proceed can be learned from observations of schools in developed countries. For example, state school systems in the United States of America and the United Kingdom of Great Britain and Northern Ireland have engaged in partnerships with
Globalization of food systems in developing countries: impact on food security and nutrition 21
private food industry, leading to promotion and sales of certain food products on the school campus. This policy of sales of foods and beverages of little nutritional value and often with high saturated fat, added sugars and salt has been implicated in the burgeoning overweight population and obese schoolchildren in these countries (American Academy of Pediatrics, 2003; Dalmeny, Hanna and Lobstein, 2003). This issue as a whole has been thoroughly documented recently in an important British parliamentary report (House of Commons, 2004). Governments or school districts that have not yet had to make policy decisions on this issue should formulate guidelines and a position on which types of foods are to be promoted and sold in the schools.
In a national context, the key nutrition strategies to be pursued should be developed based on a thorough assessment of the most pressing national nutritional concerns. A combination of activities listed in the categories in Table 6 could provide useful guidance. The list given is not exhaustive, but rather illustrative of a mixture of interventions that could be used based on the predominant nutritional problems being experienced in the country.
CONCLUSION This paper has attempted to synthesize the main issues raised during the workshop and presented in the individual country papers in this publication. For the sake of completion it has also included some points raised during discussions in the course of the workshop. It is the hope of the authors that the paper has been able to provide an adequate overview of the forces of globalization responsible for bringing about important changes in food systems and lifestyles, and how these are having a major impact on the health and nutritional status of populations of developing countries.
In studying the main drivers of globalization, one is drawn to the observation that the overall political and policy environment is clearly important in making the necessary commitment to strive for adequate health and nutrition of entire populations, both rural and urban, in any country. The provision of infrastructure, including roads and electricity, and education and health care systems, is a basic prerequisite to allow citizens to avail themselves of greater economic opportunities created through market liberalization and increased foreign investment. Greater individual economic prosperity fuels several household-level changes in lifestyles, including greater access to communications technologies, labour-saving devices and entertainment options. The synthesis demonstrates that access to these new technologies varies markedly from country to country and within countries, and certainly also between urban areas. In many instances the forces at work are overloading the capacity of cities to accommodate the large and ever increasing influx of people who are leaving the rural areas to migrate to the cities. A significant part of the reality underlying this phenomenon is that rural areas are no longer able to provide adequate livelihoods for the majority of populations. People move to cities because they are perceived to offer better “survival” opportunities.
The forces of globalization affect economic development and lifestyles in developing countries in a variety of ways. From a health and nutrition point of view, the most obvious changes are those resulting in sedentary lifestyles and adoption of dietary patterns that can lead to high rates of obesity and NCDs. Despite some improvement, undernutrition and micronutrient deficiencies are generally still present. In other words, for the majority of cases, the issue of food and nutrition security has not been resolved, yet another level of complexity is being added to the problem as the incidence of diet-related NCDs increases.
The emergence of supermarkets and fast food chains, while catering to the changing demands of the consumer in terms of convenience, quality and safety, engenders new
22 Globalization of food systems in developing countries: a synthesis of country case studies
problems. These include erosion of food culture and reduction in biodiversity as a result of newly created demand for standardized, uniform produce. Additionally there has been a loss of livelihood opportunities at various stages of the food sector, including agricultural production.
Creating more equitable access to the new opportunities provided through globalization seems unlikely, at least in the short term, without very generous development assistance and a large dose of international good will, including fair access to world markets for agricultural products. A concerted effort to diminish inequalities and focus on delivering positive gains is needed to stem the tide of the increasing double burden of undernutrition and overnutrition coupled with excessive urbanization rates and growing poverty. The challenge for the global community to move smoothly towards a truly sustainable and inclusive “global village” has never been as great as it is at present.
Globalization of food systems in developing countries: impact on food security and nutrition 23
Bibliography
Agriculture & Agri-Food Canada. 2002. Do you want a Big Mac or rice? Report on the fast food industry in China. Agri-Food Trade Service (atn-riae.agr.ca/asia/e3292.htm).American Academy of Pediatrics. 2003. Prevention of pediatric overweight and obesity. Pediatrics, 112(2): 424-430. CIA. 2004. The World Factbook 2003 (www.odci.gov/cia/publications/factbook). Accessed October 2003. Coca-Cola Company. 2002. The Coca-Cola Company Annual Report (www2.coca-cola.com/investors/annualreport/2002/financial.htm). Accessed February 2004. Dalmeny, K., Hanna, E. & Lobstein, T. 2003. Broadcasting bad health. Why food marketing to children
needs to be controlled. International Association of Consumer Food Organizations (IACFO). July. de Haan, H., Stamoulis, K., Shetty, P. & Pingali, P. 2003. The world food economy in the twenty-first century: challenges for international cooperation. Development Policy Rev., 21(5-6): 683-696. Delgado, C., Rosegrant, M., Steinfeld, H., Ehui, S. & Courbois, C. 1999. Livestock to 2020 – the next
food revolution. Food Agriculture and Environment Discussion Paper No. 28. International Food Policy Research Institute (IFPRI). de Onis, M. & Blossner, M. 2003. The World Health Organization global database on child growth and malnutrition: methodology and applications. International J. Epidemiology, 32: 518-526. FAO. 2003. FAO Rice Market Monitor, May. Commodities and Trade Division (www.fao.org/es/esc/common/ecg/23001_en_RMM_May03.pdf). Accessed October 2003. FAO. 2004. FAOSTAT. Last updated February 2004 (apps.fao.org/default.jsp). Ghezan, G., Mateos, M. & Viteri, L. 2002. Impact of the rise of supermarkets and fast-food chains on horticulture in Argentina. Development Policy Rev., 20(4): 389-408.
Haddad, L. 2003. Redirecting the diet transition: what can food policy do? Development Policy Rev., 21(5-6): 599-614. House of Commons. 2004. Obesity. Third Report of Session 2003-4. House of Commons Health Committee. London, The Stationery Office Limited. Printed 10 May 2004. International Energy Agency. 2002. World Energy Outlook 2002( www.worldenergyoutlook.org/pubs/weo2002/EnergyPoverty.pdf). Accessed May 2004. International Obesity Task Force (IOTF). 2004. Call for obesity review as overweight numbers reach 1.7
billion. International Association for the Study of Obesity (IASO) press release, 17 March 2003 (www.iotf.org/).King, H., Aubert, R. & Herman, W. 1998. Global burden of diabetes, 1995-2025. Diabetes Care, 21(9): 1414-1428. Lang, T. 2003. Food industrialization and food power: implications for food governance. Development
Policy Rev., 21(5-6): 555-568. Lang, T. & Heasman, M. 2004 Food wars. London, Earthscan. Martorell, R. 2001. Obesity. An emerging health and nutrition issue in developing countries. In P. Pinstrup-Andersen & R. Pandya-Lorch, eds. The unfinished agenda. Perspectives on overcoming hunger, poverty and
environmental degradation. Washington, DC, IFPRI. Mensah, P., Yeboah-Manu, D., Owusu-Darko, K. & Ablordey, A. 2002. Street foods in Accra, Ghana: how safe are they? Bulletin of the World Health Organization, 80(7): 546-554.Murphy, S. 2002. WTO Agreement on Agriculture: suitable model for a global food system? Foreign Policy
in Focus, 7(8). Nef, J. 1995. Human security and mutual vulnerability. An exploration into the global political economy of development and underdevelopment. First ed. International Development Research Centre (IDRC). 110 pp. Pinstrup-Andersen, P. 2001. Achieving sustainable food security for all: required policy action. Paper prepared for Mansholt Lecture, Wageningen University, the Netherlands, 14 November. Popkin, B. 2003. The nutrition transition in the developing world. Development Policy Rev., 21(5-6): 581-597. Reardon, T., Timmer, P., Barrett, C. & Berdegue, J. 2003. The rise of supermarkets in Africa, Asia and Latin America. American Journal of Agricultural Economics 85(5): 1140-46. Reardon, T., Timmer, P. & Berdegue, J. 2003. The rise of supermarkets in Latin America and Asia: implications for international markets for fruits and vegetables. In A. Regmi & M. Gehlar, eds. Global markets for high value food products. Agriculture Information Bulletin. US Department of Agriculture Economic Research Service (USDA-ERS).
24 Globalization of food systems in developing countries: a synthesis of country case studies
Sachs, J., McArthur, J., Schmidt-Traub, G., Kruk, M., Chandrika Bahadur, C., Faye, M. & McCord, G. 2004. Ending Africa’s poverty trap
(www.med.harvard.edu/chge/course/solutions/globalization/EndingAfricasPovertyTrap.pdf).Satterthwaite, D. 2003. The Millennium Development Goals and urban poverty reduction: great expectations and nonsense statistics. Environment and Urbanization, 15(2): 181-190. Shetty, P. 2003a. Impact of globalization on food and agriculture from the farm to the plate. Presented at Impacts of Globalization on Agricultural Production and Marketing with Focus on Food Quality, 22-24 January, Tokyo. Shetty, P. 2003b. Measures of nutritional status from anthropometric survey data. In International Scientific Symposium on Measurement and Assessment of Food Deprivation and Undernutrition, 26-28 June. Rome, FAO.Tacoli, C. n.d. Urban governance, partnership and poverty. International Development Department Working Papers (www.idd.bham.ac.uk/research/working_papers/urbangov_wp.htm). United Nations Development Programme (UNDP). 2003. Human Development Report 2003
(www.undp.org/hdr2003/). Accessed February 2004. United Nations Population Division. 2002. World Urbanization Prospects: The 2001 Revision.
United Nations Statistics Division. 2000. (unstats.un.org/unsd/demographic/social/inc-eco.htm).United Nations Sub-Committee for the Eradication of Poverty. 2003. Best practices in poverty eradication. NGO Committee for Social Development. Watkins, K. 2003. Farm fallacies that hurt the poor. Development Outreach, July. World Bank Institute. WHO. 1995. Physical status: the use and interpretation of anthropometry. Report of a WHO Expert Committee. WHO Technical Report Series No. 854. Geneva, World Health Organization. WHO. 2002. World Health Report 2002. Reducing risks, promoting healthy life(www.who.int/whr/2002/en/whr_overview_eng.pdf). WHO. 2003. World Health Report 2003. Shaping the future (www.who.int/whr/2003/en/Annex5-en.pdf). Accessed February 2004. WHO/FAO. 2003. Diet, nutrition and the prevention of chronic diseases. Report of a Joint WHO/FAO Expert Consultation. WHO Technical Report Series No. 916. Geneva. Wild, S., Roglic, G., Green, A., Sicree, R. & King, H. 2004. Global prevalence of diabetes. Estimates for the year 2000 and projections for 2030. Diabetes Care, 27(5):1047-1053.
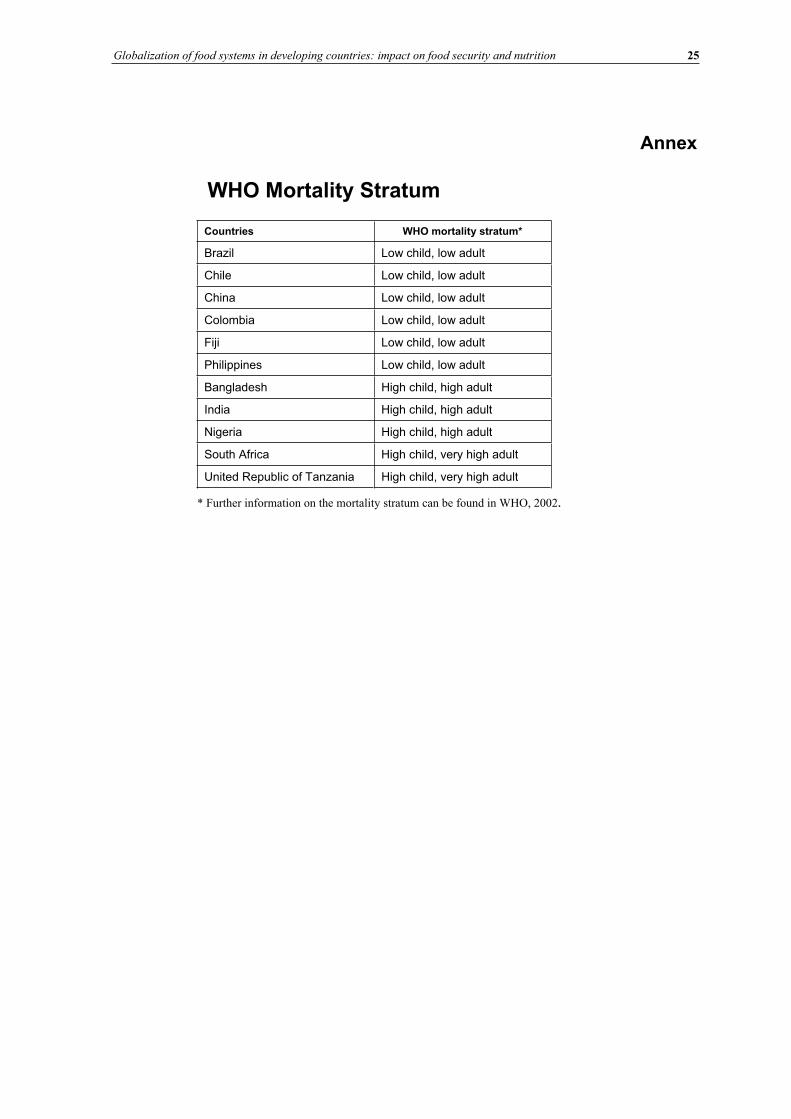
Globalization of food systems in developing countries: impact on food security and nutrition 25
Annex
WHO Mortality Stratum
Countries WHO mortality stratum*
Brazil Low child, low adult
Chile Low child, low adult
China Low child, low adult
Colombia Low child, low adult
Fiji Low child, low adult
Philippines Low child, low adult
Bangladesh High child, high adult
India High child, high adult
Nigeria High child, high adult
South Africa High child, very high adult
United Republic of Tanzania High child, very high adult
* Further information on the mortality stratum can be found in WHO, 2002.

Globalization of food systems in developing countries: impact on food security and nutrition 27
Features of urban food and nutrition security and considerations forsuccessful urban programming
Marie T. Ruel1 and James L. Garrett 2
INTRODUCTIONThis paper updates our earlier reviews of urban food and nutrition security (Ruel, Haddad and Garrett, 1999; Ruel et al., 1998). These earlier pieces reviewed existing knowledge from published literature concerning the unique characteristics of urban food and nutrition security and their determinants, and experience of successful programme and policy responses to alleviate urban food insecurity and malnutrition. The reviews also identified key research gaps.
The present review focuses more on what we have learned on these issues from five years of empirical research and through our collaboration with partners directly involved in the design and implementation of urban programmes in the field. CARE International and some of their country offices have been our main partners to date, and we have also collaborated with the Government of Guatemala in the evaluation of a community day care programme. Our research programme combined primary data collection in a number of countries and secondary analysis of data from the Demographic and Health Surveys (DHS) and the World Bank Living Standards Measurement Surveys (LSMS).
The paper is structured as follows. First we present new information from our empirical research on urban/rural differences in food security and child nutritional status, and on socio-economic differentials within area. Then some of the unique features of urban food security and its determinants are highlighted. The paper concludes with a discussion of lessons learned and implications for urban programming.
URBAN/RURAL DIFFERENCES IN FOOD SECURITY AND CHILD NUTRITIONAL STATUSThis section updates the empirical evidence concerning urban/rural differences in food security and child nutritional status, using newly available data sets from several developing countries.
Urban/rural differences in food security Quantitative data on urban food security are scarce, but a recent analysis of nationally representative consumption/expenditure surveys from ten African countries provides useful
1 Marie T. Ruel International Food Policy Research Institute 2033 K Street, N.W. Washington, DC 20006 E-mail: [email protected]
2 James L. Garrett International Food Policy Research Institute 2033 K Street, N.W. Washington, DC 20006 E-mail:[email protected]
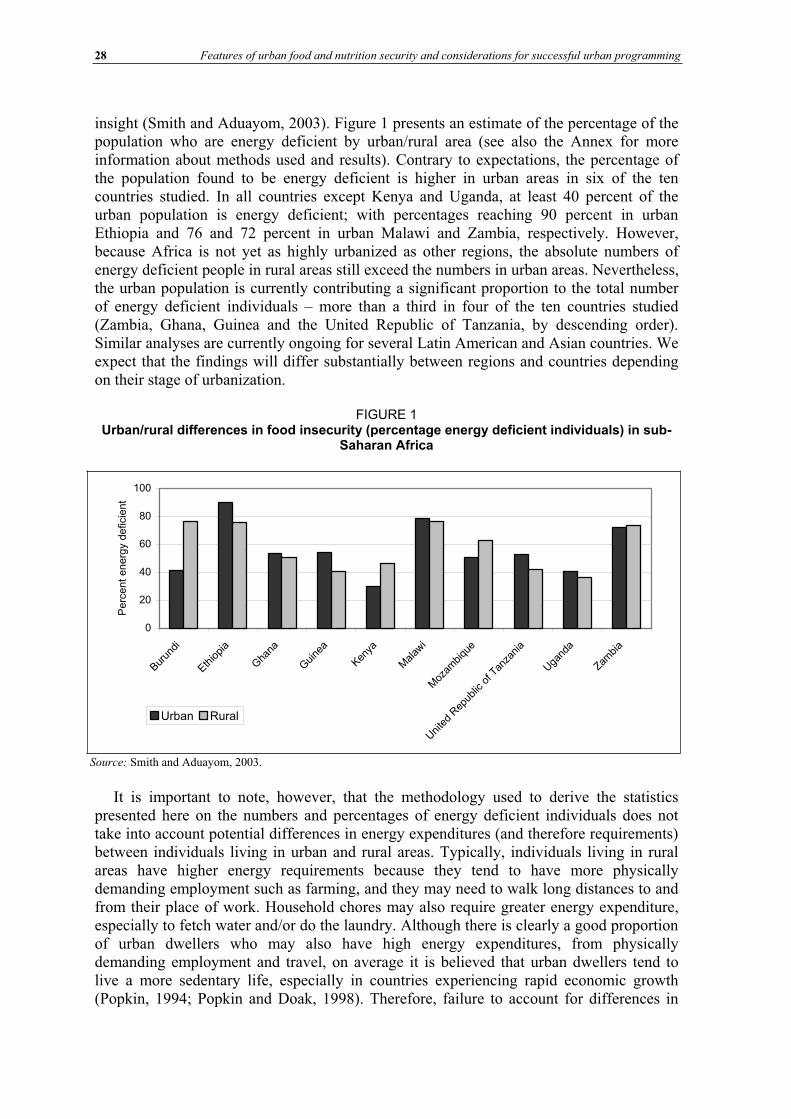
28 Features of urban food and nutrition security and considerations for successful urban programming
insight (Smith and Aduayom, 2003). Figure 1 presents an estimate of the percentage of the population who are energy deficient by urban/rural area (see also the Annex for more information about methods used and results). Contrary to expectations, the percentage of the population found to be energy deficient is higher in urban areas in six of the ten countries studied. In all countries except Kenya and Uganda, at least 40 percent of the urban population is energy deficient; with percentages reaching 90 percent in urban Ethiopia and 76 and 72 percent in urban Malawi and Zambia, respectively. However, because Africa is not yet as highly urbanized as other regions, the absolute numbers of energy deficient people in rural areas still exceed the numbers in urban areas. Nevertheless, the urban population is currently contributing a significant proportion to the total number of energy deficient individuals – more than a third in four of the ten countries studied (Zambia, Ghana, Guinea and the United Republic of Tanzania, by descending order). Similar analyses are currently ongoing for several Latin American and Asian countries. We expect that the findings will differ substantially between regions and countries depending on their stage of urbanization.
FIGURE 1 Urban/rural differences in food insecurity (percentage energy deficient individuals) in sub-
Saharan Africa
0
20
40
60
80
100
Burun
di
Ethiopia
Gha
na
Guine
a
Kenya
Malaw
i
Moz
ambiqu
e
Uni
ted
Rep
ublic
of T
anza
nia
Uga
nda
Zambia
Perc
ent
energ
y d
eficie
nt
Urban Rural
It is important to note, however, that the methodology used to derive the statistics presented here on the numbers and percentages of energy deficient individuals does not take into account potential differences in energy expenditures (and therefore requirements) between individuals living in urban and rural areas. Typically, individuals living in rural areas have higher energy requirements because they tend to have more physically demanding employment such as farming, and they may need to walk long distances to and from their place of work. Household chores may also require greater energy expenditure, especially to fetch water and/or do the laundry. Although there is clearly a good proportion of urban dwellers who may also have high energy expenditures, from physically demanding employment and travel, on average it is believed that urban dwellers tend to live a more sedentary life, especially in countries experiencing rapid economic growth (Popkin, 1994; Popkin and Doak, 1998). Therefore, failure to account for differences in
Source: Smith and Aduayom, 2003.
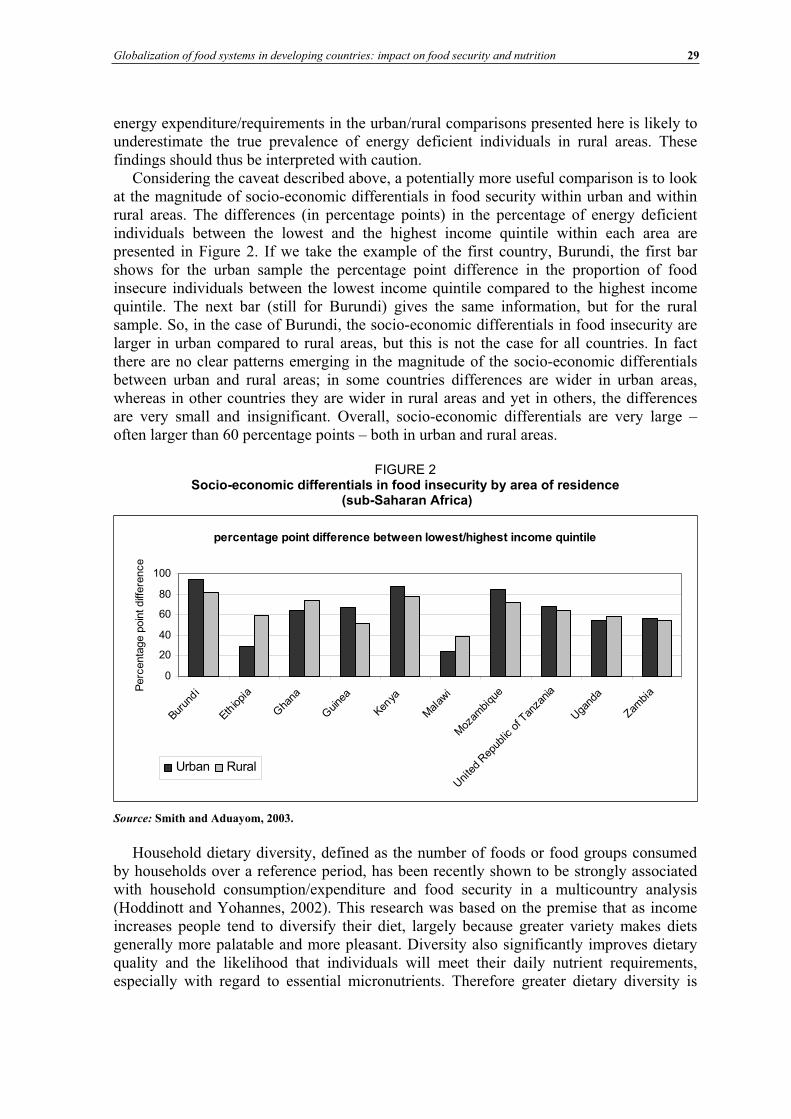
Globalization of food systems in developing countries: impact on food security and nutrition 29
energy expenditure/requirements in the urban/rural comparisons presented here is likely to underestimate the true prevalence of energy deficient individuals in rural areas. These findings should thus be interpreted with caution.
Considering the caveat described above, a potentially more useful comparison is to look at the magnitude of socio-economic differentials in food security within urban and within rural areas. The differences (in percentage points) in the percentage of energy deficient individuals between the lowest and the highest income quintile within each area are presented in Figure 2. If we take the example of the first country, Burundi, the first bar shows for the urban sample the percentage point difference in the proportion of food insecure individuals between the lowest income quintile compared to the highest income quintile. The next bar (still for Burundi) gives the same information, but for the rural sample. So, in the case of Burundi, the socio-economic differentials in food insecurity are larger in urban compared to rural areas, but this is not the case for all countries. In fact there are no clear patterns emerging in the magnitude of the socio-economic differentials between urban and rural areas; in some countries differences are wider in urban areas, whereas in other countries they are wider in rural areas and yet in others, the differences are very small and insignificant. Overall, socio-economic differentials are very large – often larger than 60 percentage points – both in urban and rural areas.
FIGURE 2 Socio-economic differentials in food insecurity by area of residence
(sub-Saharan Africa)
percentage point difference between lowest/highest income quintile
0
20
40
60
80
100
Burun
di
Ethiopi
a
Gha
na
Guine
a
Kenya
Mal
awi
Moz
ambi
que
Uni
ted
Rep
ublic
of T
anza
nia
Uga
nda
Zambi
aPerc
enta
ge p
oin
t diff
ere
nce
Urban Rural
Source: Smith and Aduayom, 2003.
Household dietary diversity, defined as the number of foods or food groups consumed by households over a reference period, has been recently shown to be strongly associated with household consumption/expenditure and food security in a multicountry analysis (Hoddinott and Yohannes, 2002). This research was based on the premise that as income increases people tend to diversify their diet, largely because greater variety makes diets generally more palatable and more pleasant. Diversity also significantly improves dietary quality and the likelihood that individuals will meet their daily nutrient requirements, especially with regard to essential micronutrients. Therefore greater dietary diversity is
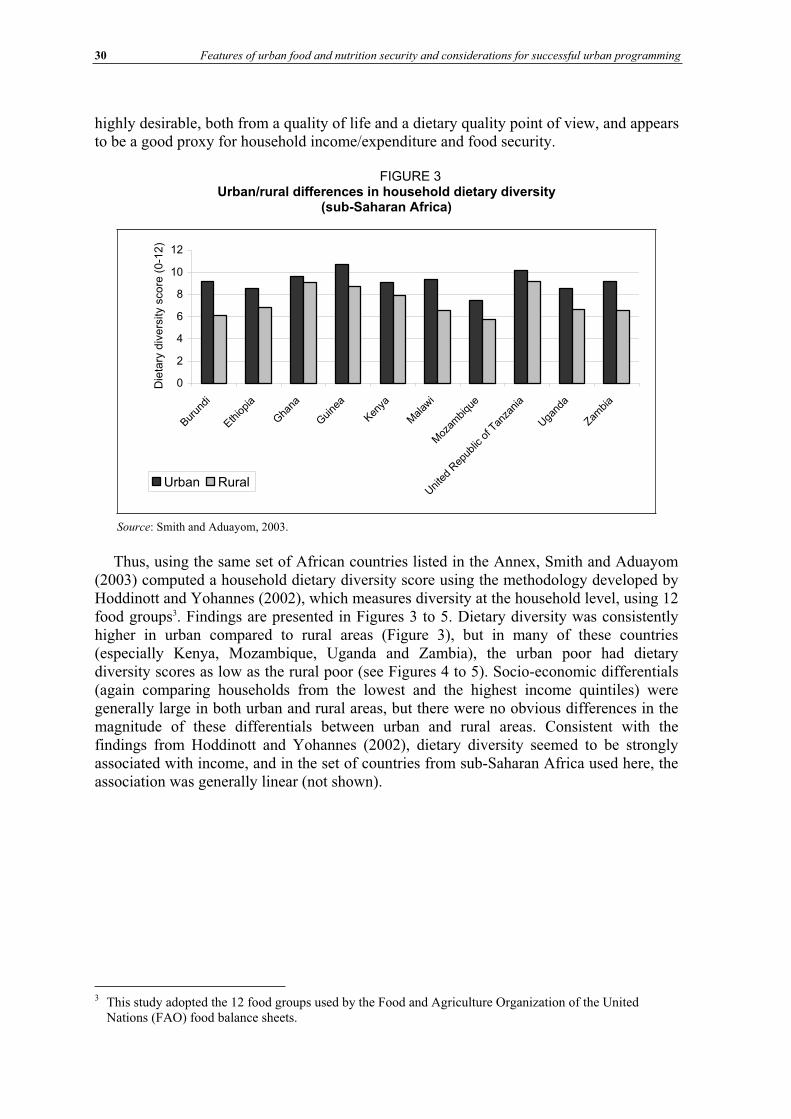
30 Features of urban food and nutrition security and considerations for successful urban programming
highly desirable, both from a quality of life and a dietary quality point of view, and appears to be a good proxy for household income/expenditure and food security.
FIGURE 3 Urban/rural differences in household dietary diversity
(sub-Saharan Africa)
0
2
4
6
8
10
12
Burun
di
Ethiopia
Gha
na
Guine
a
Kenya
Malaw
i
Moz
ambiqu
e
Uni
ted
Rep
ublic
of T
anza
nia
Uga
nda
Zambia
Die
tary
div
ers
ity s
co
re (
0-1
2)
Urban Rural
Source: Smith and Aduayom, 2003.
Thus, using the same set of African countries listed in the Annex, Smith and Aduayom (2003) computed a household dietary diversity score using the methodology developed by Hoddinott and Yohannes (2002), which measures diversity at the household level, using 12 food groups3. Findings are presented in Figures 3 to 5. Dietary diversity was consistently higher in urban compared to rural areas (Figure 3), but in many of these countries (especially Kenya, Mozambique, Uganda and Zambia), the urban poor had dietary diversity scores as low as the rural poor (see Figures 4 to 5). Socio-economic differentials (again comparing households from the lowest and the highest income quintiles) were generally large in both urban and rural areas, but there were no obvious differences in the magnitude of these differentials between urban and rural areas. Consistent with the findings from Hoddinott and Yohannes (2002), dietary diversity seemed to be strongly associated with income, and in the set of countries from sub-Saharan Africa used here, the association was generally linear (not shown).
3 This study adopted the 12 food groups used by the Food and Agriculture Organization of the United Nations (FAO) food balance sheets.
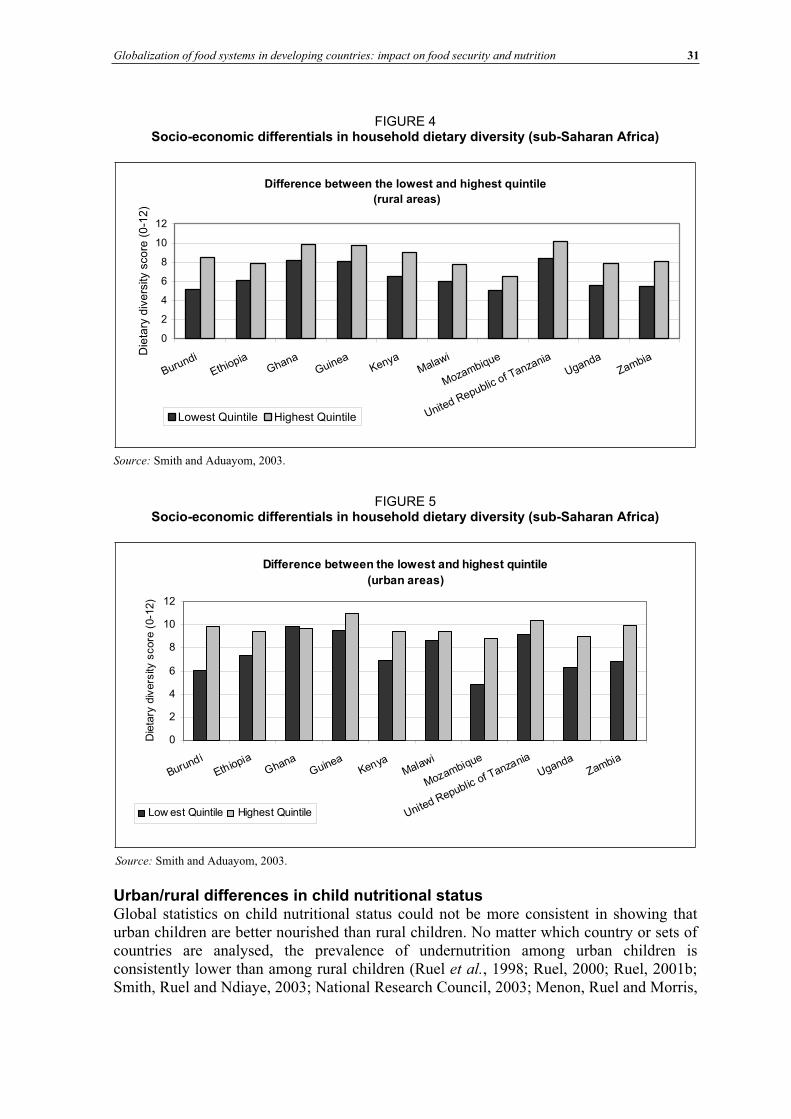
Globalization of food systems in developing countries: impact on food security and nutrition 31
FIGURE 4 Socio-economic differentials in household dietary diversity (sub-Saharan Africa)
Difference between the lowest and highest quintile
(rural areas)
0
2
4
6
8
10
12
Burundi
EthiopiaGhana
GuineaKenya
Malawi
Mozambique
United Republicof Tanzania
UgandaZambia
Die
tary
div
ers
ity s
co
re (
0-1
2)
Lowest Quintile Highest Quintile
Source: Smith and Aduayom, 2003.
FIGURE 5 Socio-economic differentials in household dietary diversity (sub-Saharan Africa)
Difference between the lowest and highest quintile
(urban areas)
0
2
4
6
8
10
12
Burundi
EthiopiaGhana
GuineaKenya
Malawi
Mozambique
United Republicof Tanzania
UgandaZambia
Die
tary
div
ers
ity s
core
(0-1
2)
Low est Quintile Highest Quintile
Source: Smith and Aduayom, 2003.
Urban/rural differences in child nutritional status Global statistics on child nutritional status could not be more consistent in showing that urban children are better nourished than rural children. No matter which country or sets of countries are analysed, the prevalence of undernutrition among urban children is consistently lower than among rural children (Ruel et al., 1998; Ruel, 2000; Ruel, 2001b; Smith, Ruel and Ndiaye, 2003; National Research Council, 2003; Menon, Ruel and Morris,
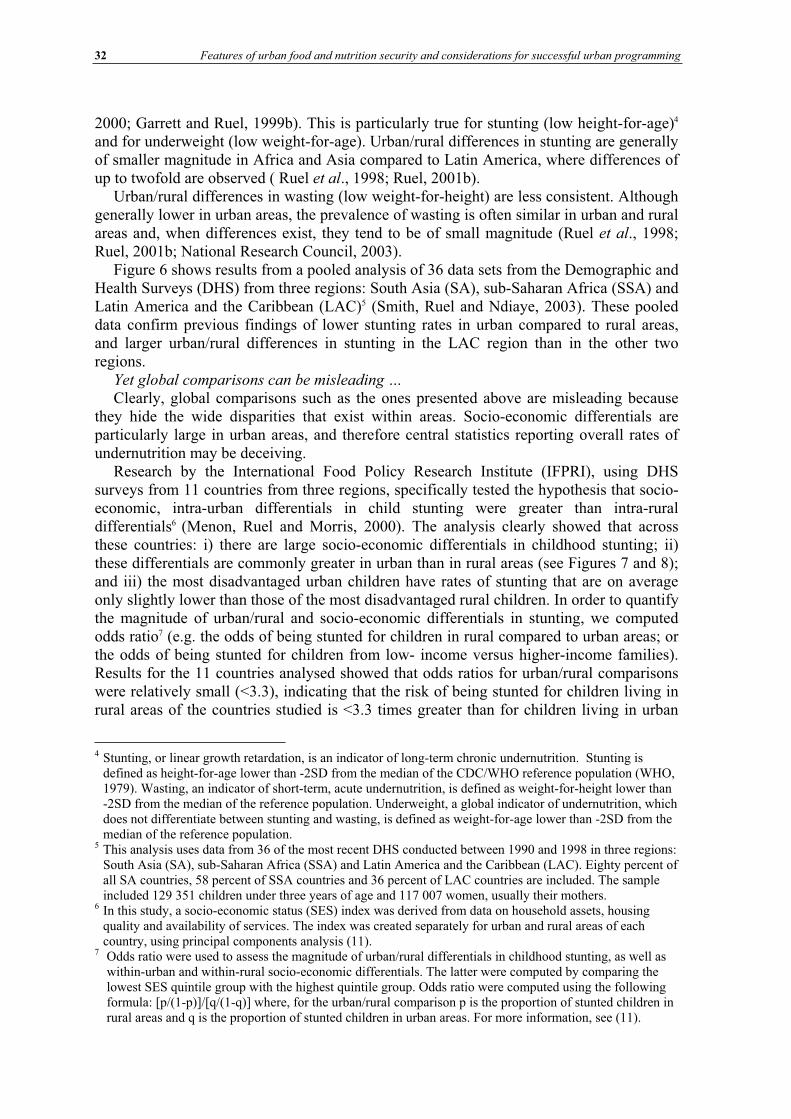
32 Features of urban food and nutrition security and considerations for successful urban programming
2000; Garrett and Ruel, 1999b). This is particularly true for stunting (low height-for-age)4
and for underweight (low weight-for-age). Urban/rural differences in stunting are generally of smaller magnitude in Africa and Asia compared to Latin America, where differences of up to twofold are observed ( Ruel et al., 1998; Ruel, 2001b).
Urban/rural differences in wasting (low weight-for-height) are less consistent. Although generally lower in urban areas, the prevalence of wasting is often similar in urban and rural areas and, when differences exist, they tend to be of small magnitude (Ruel et al., 1998; Ruel, 2001b; National Research Council, 2003).
Figure 6 shows results from a pooled analysis of 36 data sets from the Demographic and Health Surveys (DHS) from three regions: South Asia (SA), sub-Saharan Africa (SSA) and Latin America and the Caribbean (LAC)5 (Smith, Ruel and Ndiaye, 2003). These pooled data confirm previous findings of lower stunting rates in urban compared to rural areas, and larger urban/rural differences in stunting in the LAC region than in the other two regions.
Yet global comparisons can be misleading … Clearly, global comparisons such as the ones presented above are misleading because
they hide the wide disparities that exist within areas. Socio-economic differentials are particularly large in urban areas, and therefore central statistics reporting overall rates of undernutrition may be deceiving.
Research by the International Food Policy Research Institute (IFPRI), using DHS surveys from 11 countries from three regions, specifically tested the hypothesis that socio-economic, intra-urban differentials in child stunting were greater than intra-rural differentials6 (Menon, Ruel and Morris, 2000). The analysis clearly showed that across these countries: i) there are large socio-economic differentials in childhood stunting; ii) these differentials are commonly greater in urban than in rural areas (see Figures 7 and 8); and iii) the most disadvantaged urban children have rates of stunting that are on average only slightly lower than those of the most disadvantaged rural children. In order to quantify the magnitude of urban/rural and socio-economic differentials in stunting, we computed odds ratio7 (e.g. the odds of being stunted for children in rural compared to urban areas; or the odds of being stunted for children from low- income versus higher-income families). Results for the 11 countries analysed showed that odds ratios for urban/rural comparisons were relatively small (<3.3), indicating that the risk of being stunted for children living in rural areas of the countries studied is <3.3 times greater than for children living in urban
4 Stunting, or linear growth retardation, is an indicator of long-term chronic undernutrition. Stunting is defined as height-for-age lower than -2SD from the median of the CDC/WHO reference population (WHO, 1979). Wasting, an indicator of short-term, acute undernutrition, is defined as weight-for-height lower than -2SD from the median of the reference population. Underweight, a global indicator of undernutrition, which does not differentiate between stunting and wasting, is defined as weight-for-age lower than -2SD from the median of the reference population.
5 This analysis uses data from 36 of the most recent DHS conducted between 1990 and 1998 in three regions: South Asia (SA), sub-Saharan Africa (SSA) and Latin America and the Caribbean (LAC). Eighty percent of all SA countries, 58 percent of SSA countries and 36 percent of LAC countries are included. The sample included 129 351 children under three years of age and 117 007 women, usually their mothers.
6 In this study, a socio-economic status (SES) index was derived from data on household assets, housing quality and availability of services. The index was created separately for urban and rural areas of each country, using principal components analysis (11).
7 Odds ratio were used to assess the magnitude of urban/rural differentials in childhood stunting, as well as within-urban and within-rural socio-economic differentials. The latter were computed by comparing the lowest SES quintile group with the highest quintile group. Odds ratio were computed using the following formula: [p/(1-p)]/[q/(1-q)] where, for the urban/rural comparison p is the proportion of stunted children in rural areas and q is the proportion of stunted children in urban areas. For more information, see (11).
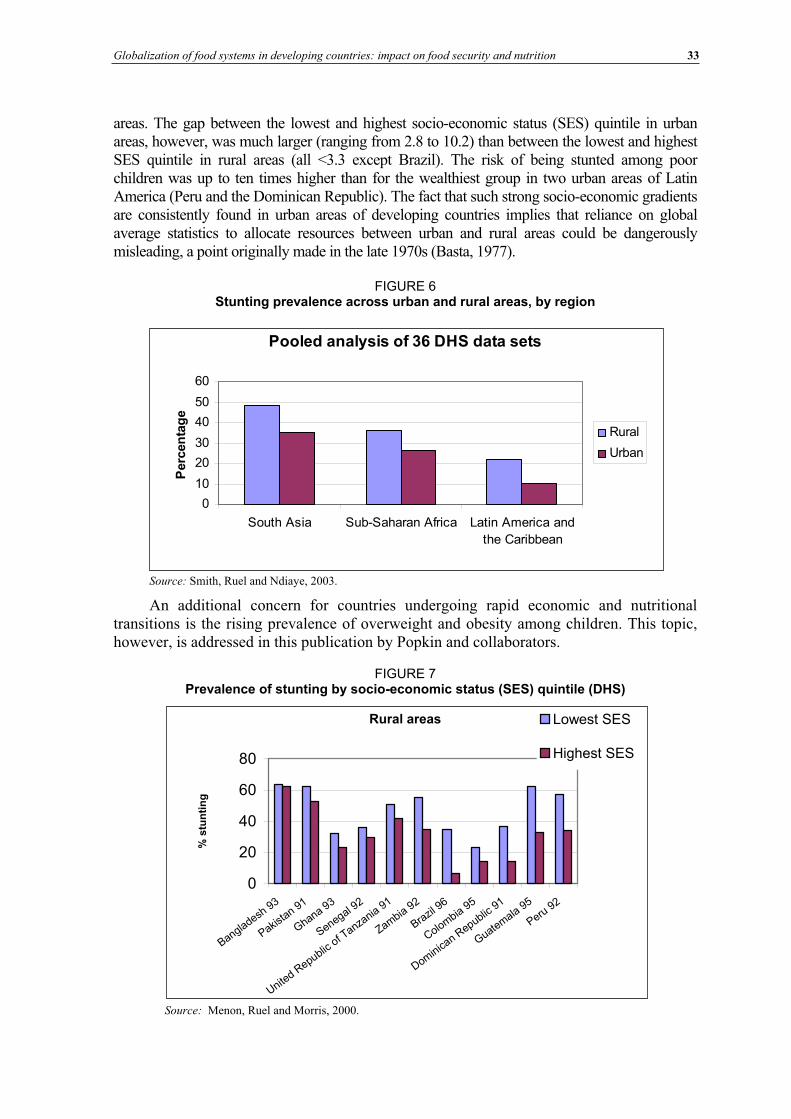
Globalization of food systems in developing countries: impact on food security and nutrition 33
areas. The gap between the lowest and highest socio-economic status (SES) quintile in urban areas, however, was much larger (ranging from 2.8 to 10.2) than between the lowest and highest SES quintile in rural areas (all <3.3 except Brazil). The risk of being stunted among poor children was up to ten times higher than for the wealthiest group in two urban areas of Latin America (Peru and the Dominican Republic). The fact that such strong socio-economic gradients are consistently found in urban areas of developing countries implies that reliance on global average statistics to allocate resources between urban and rural areas could be dangerously misleading, a point originally made in the late 1970s (Basta, 1977).
FIGURE 6 Stunting prevalence across urban and rural areas, by region
Pooled analysis of 36 DHS data sets
0
10
20
30
40
50
60
South Asia Sub-Saharan Africa Latin America and
the Caribbean
Perc
en
tag
e
Rural
Urban
Source: Smith, Ruel and Ndiaye, 2003.
An additional concern for countries undergoing rapid economic and nutritional transitions is the rising prevalence of overweight and obesity among children. This topic, however, is addressed in this publication by Popkin and collaborators.
FIGURE 7 Prevalence of stunting by socio-economic status (SES) quintile (DHS)
Rural areas
0
20
40
60
80
Bangladesh93
Pakista
n91
Ghana93
Senegal 92
United
Republicof Tanza
nia91
Zambia
92
Brazil
96
Colombia95
Dominica
n Republic91
Guatem
ala95
Peru92
% s
tun
tin
g
Lowest SES
Highest SES
Source: Menon, Ruel and Morris, 2000.
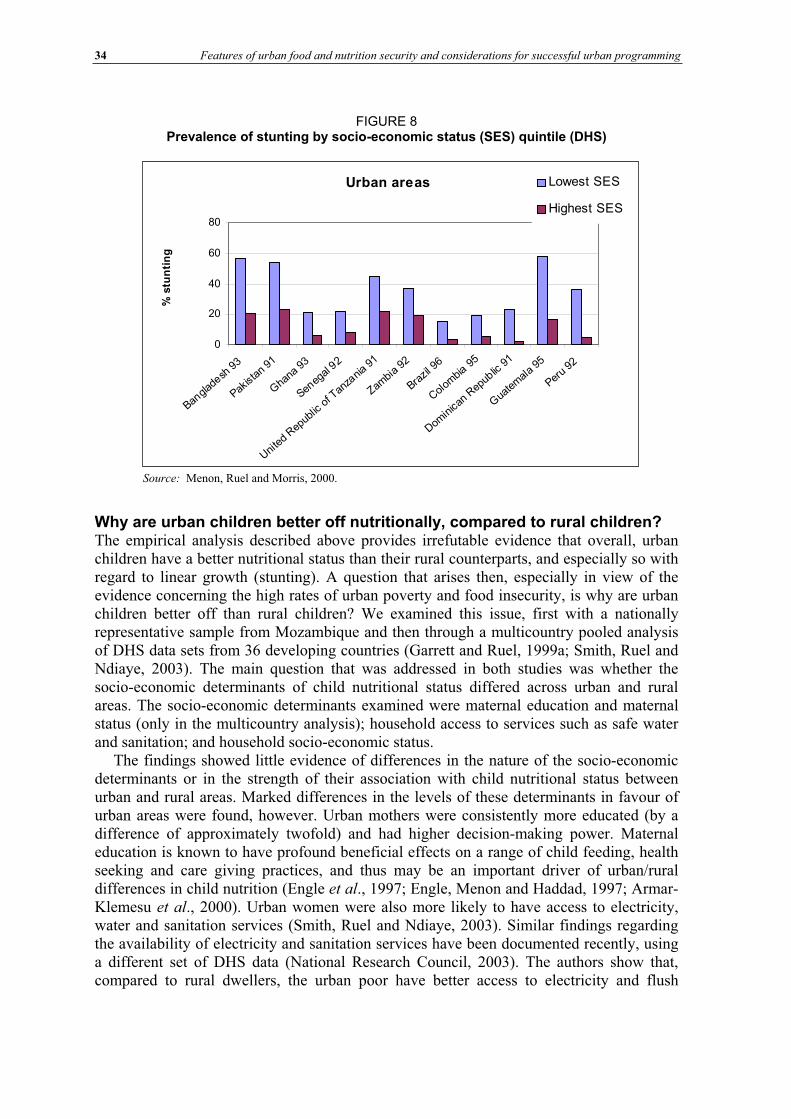
34 Features of urban food and nutrition security and considerations for successful urban programming
FIGURE 8 Prevalence of stunting by socio-economic status (SES) quintile (DHS)
Urban areas
0
20
40
60
80
Bangla
desh
93
Pakist
an91
Gha
na93
Seneg
al92
Unite
dRep
ublic
ofTan
zania
91
Zambi
a92
Brazil
96
Colom
bia95
Domin
ican
Repub
lic91
Gua
tem
ala
95
Peru
92
% s
tun
tin
g
Lowest SES
Highest SES
Source: Menon, Ruel and Morris, 2000.
Why are urban children better off nutritionally, compared to rural children? The empirical analysis described above provides irrefutable evidence that overall, urban children have a better nutritional status than their rural counterparts, and especially so with regard to linear growth (stunting). A question that arises then, especially in view of the evidence concerning the high rates of urban poverty and food insecurity, is why are urban children better off than rural children? We examined this issue, first with a nationally representative sample from Mozambique and then through a multicountry pooled analysis of DHS data sets from 36 developing countries (Garrett and Ruel, 1999a; Smith, Ruel and Ndiaye, 2003). The main question that was addressed in both studies was whether the socio-economic determinants of child nutritional status differed across urban and rural areas. The socio-economic determinants examined were maternal education and maternal status (only in the multicountry analysis); household access to services such as safe water and sanitation; and household socio-economic status.
The findings showed little evidence of differences in the nature of the socio-economic determinants or in the strength of their association with child nutritional status between urban and rural areas. Marked differences in the levels of these determinants in favour of urban areas were found, however. Urban mothers were consistently more educated (by a difference of approximately twofold) and had higher decision-making power. Maternal education is known to have profound beneficial effects on a range of child feeding, health seeking and care giving practices, and thus may be an important driver of urban/rural differences in child nutrition (Engle et al., 1997; Engle, Menon and Haddad, 1997; Armar-Klemesu et al., 2000). Urban women were also more likely to have access to electricity, water and sanitation services (Smith, Ruel and Ndiaye, 2003). Similar findings regarding the availability of electricity and sanitation services have been documented recently, using a different set of DHS data (National Research Council, 2003). The authors show that, compared to rural dwellers, the urban poor have better access to electricity and flush
Globalization of food systems in developing countries: impact on food security and nutrition 35
toilets, but they are at a clear disadvantage when compared to other wealthier urban dwellers.
In our pooled analysis, large gaps in favour of urban areas were also found in the levels of key proximate determinants of child nutritional status in all three regions (see Table 1). This was true especially for access and use of preventive maternal and child health care (e.g. maternal prenatal and birthing care and child immunization), and the timing and quality of complementary feeding. The only exceptions were practices related to breastfeeding, which were more likely to be optimal among rural compared to urban women (i.e. exclusive for the first six months and continued for up to 24 months).
Other evidence supporting the advantage of urban children over their rural counterparts is provided by country-level analyses. The findings are consistent with the pooled analyses; they show that: i) urban children tend to have better access to health services, which in turn is reflected by higher immunization rates (Ruel et al., 1998); ii) urban households are also more likely to have access to water and sanitation facilities, although they may come at high cost, especially for the poor (World Resource Institute, 1996); and iii) except for breastfeeding practices, which are more likely to be optimal among rural mothers, children’s diets in urban areas are generally more diverse and more likely to include nutrient-rich foods such as meat, dairy products and fresh fruit and vegetables (Ruel, 2000; Arimond and Ruel, 2002). Examples from IFPRI’s analysis of 11 most recent DHS surveys show the consistently higher intake of milk and meat products by toddlers in urban compared to rural areas (Arimond and Ruel, 2004) (see Figures 9 to 10). Foods of animal origin are of critical importance in young children’s diets because they provide essential micronutrients such as iron, zinc and vitamin A, which promote health, growth and motor and cognitive development.
Thus, the better nutritional status of urban children appears to be the result of the cumulative effect of a series of more favourable socio-economic conditions, which in turn seem to lead to better caring practices for children and their mothers. As cautioned previously, however, global comparisons between urban and rural areas can be misleading because they do not take into account the large heterogeneity within area.
Finally, it is also important to recognize that although urbanization seems to bring about positive improvements in young children’s diets, it also brings a number of unhealthy diet changes such as increased consumption of saturated and trans fats, sugars, salt and processed foods that contain excessive amounts of these components. This, combined with more sedentary lifestyles is causing dramatic increases in the prevalence of overweight/obesity and risk factors for a number of chronic diseases such as diabetes, cardiovascular diseases and certain forms of cancer (WHO/FAO, 2003). Although these dietary changes affect mostly adults at first, they rapidly trickle down to other age groups such as schoolchildren and adolescents and eventually reach young children as well. This topic is addressed by Popkin and collaborators in this publication.
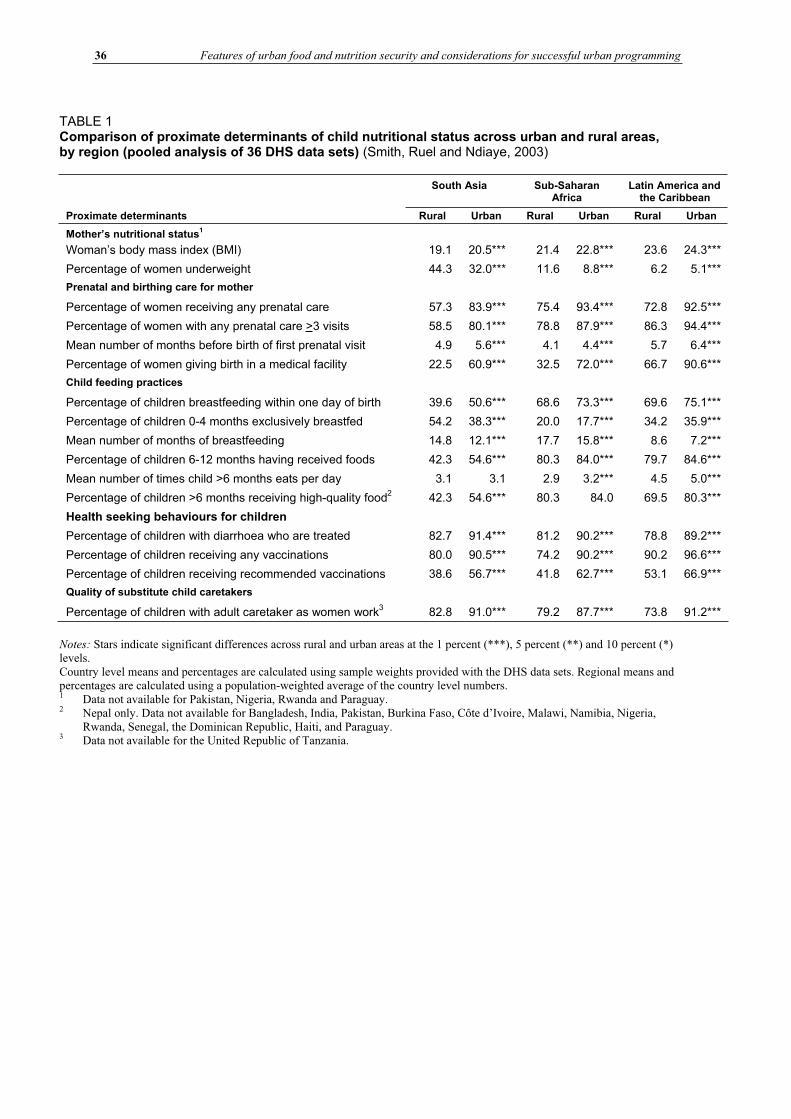
36 Features of urban food and nutrition security and considerations for successful urban programming
TABLE 1 Comparison of proximate determinants of child nutritional status across urban and rural areas, by region (pooled analysis of 36 DHS data sets) (Smith, Ruel and Ndiaye, 2003)
South Asia Sub-Saharan Africa
Latin America and the Caribbean
Proximate determinants Rural Urban Rural Urban Rural Urban
Mother’s nutritional status1
Woman’s body mass index (BMI) 19.1 20.5*** 21.4 22.8*** 23.6 24.3***
Percentage of women underweight 44.3 32.0*** 11.6 8.8*** 6.2 5.1***
Prenatal and birthing care for mother
Percentage of women receiving any prenatal care 57.3 83.9*** 75.4 93.4*** 72.8 92.5***
Percentage of women with any prenatal care >3 visits 58.5 80.1*** 78.8 87.9*** 86.3 94.4***
Mean number of months before birth of first prenatal visit 4.9 5.6*** 4.1 4.4*** 5.7 6.4***
Percentage of women giving birth in a medical facility 22.5 60.9*** 32.5 72.0*** 66.7 90.6***
Child feeding practices
Percentage of children breastfeeding within one day of birth 39.6 50.6*** 68.6 73.3*** 69.6 75.1***
Percentage of children 0-4 months exclusively breastfed 54.2 38.3*** 20.0 17.7*** 34.2 35.9***
Mean number of months of breastfeeding 14.8 12.1*** 17.7 15.8*** 8.6 7.2***
Percentage of children 6-12 months having received foods 42.3 54.6*** 80.3 84.0*** 79.7 84.6***
Mean number of times child >6 months eats per day 3.1 3.1 2.9 3.2*** 4.5 5.0***
Percentage of children >6 months receiving high-quality food2 42.3 54.6*** 80.3 84.0 69.5 80.3***
Health seeking behaviours for children
Percentage of children with diarrhoea who are treated 82.7 91.4*** 81.2 90.2*** 78.8 89.2***
Percentage of children receiving any vaccinations 80.0 90.5*** 74.2 90.2*** 90.2 96.6***
Percentage of children receiving recommended vaccinations 38.6 56.7*** 41.8 62.7*** 53.1 66.9***
Quality of substitute child caretakers
Percentage of children with adult caretaker as women work3 82.8 91.0*** 79.2 87.7*** 73.8 91.2***
Notes: Stars indicate significant differences across rural and urban areas at the 1 percent (***), 5 percent (**) and 10 percent (*) levels. Country level means and percentages are calculated using sample weights provided with the DHS data sets. Regional means and percentages are calculated using a population-weighted average of the country level numbers. 1 Data not available for Pakistan, Nigeria, Rwanda and Paraguay.
2 Nepal only. Data not available for Bangladesh, India, Pakistan, Burkina Faso, Côte d’Ivoire, Malawi, Namibia, Nigeria, Rwanda, Senegal, the Dominican Republic, Haiti, and Paraguay. 3 Data not available for the United Republic of Tanzania.
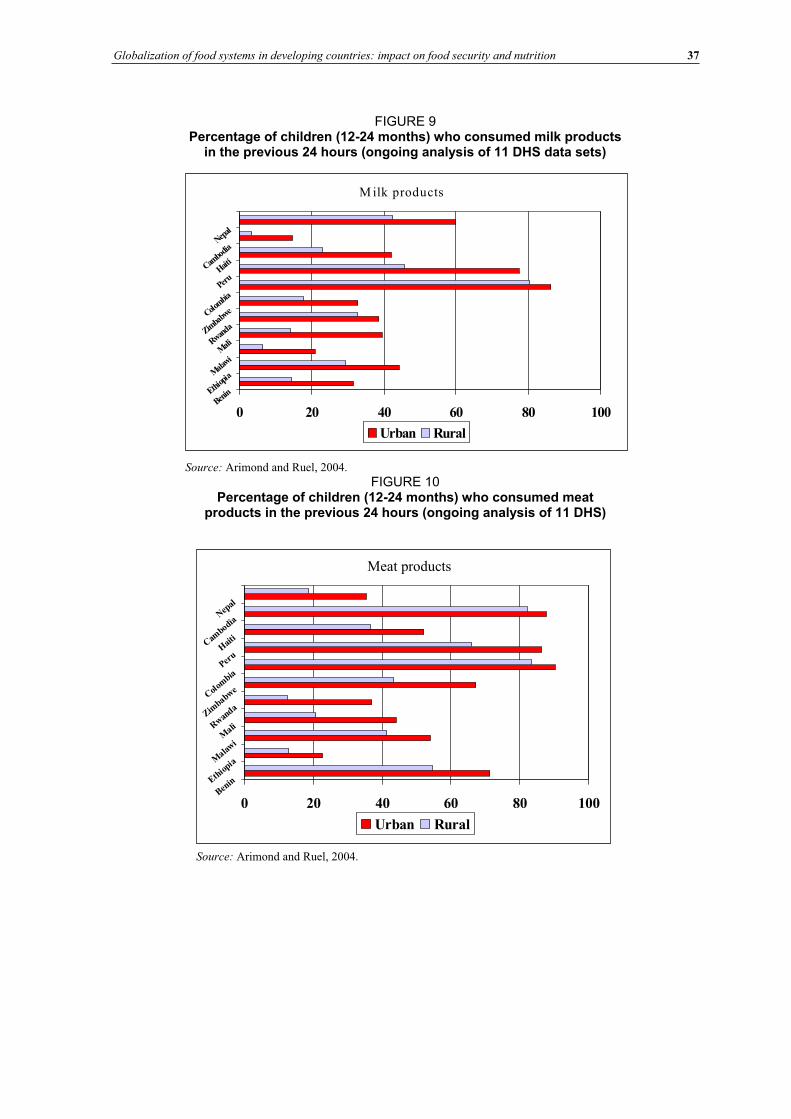
Globalization of food systems in developing countries: impact on food security and nutrition 37
FIGURE 9 Percentage of children (12-24 months) who consumed milk products
in the previous 24 hours (ongoing analysis of 11 DHS data sets)
M ilk products
0 20 40 60 80 100Ben
inEthiop
iaM
alawi
MaliRwanda
Zimba
bweColo
mbia
Peru
Haiti
Cambo
diaNep
al
Urban Rural
Source: Arimond and Ruel, 2004.
FIGURE 10 Percentage of children (12-24 months) who consumed meat
products in the previous 24 hours (ongoing analysis of 11 DHS)
Meat products
0 20 40 60 80 100Ben
inEthio
piaMala
wi
MaliR
wan
daZim
babwe
Col
ombia
Peru
Hai
tiCam
bodiaN
epal
Urban Rural
Source: Arimond and Ruel, 2004.
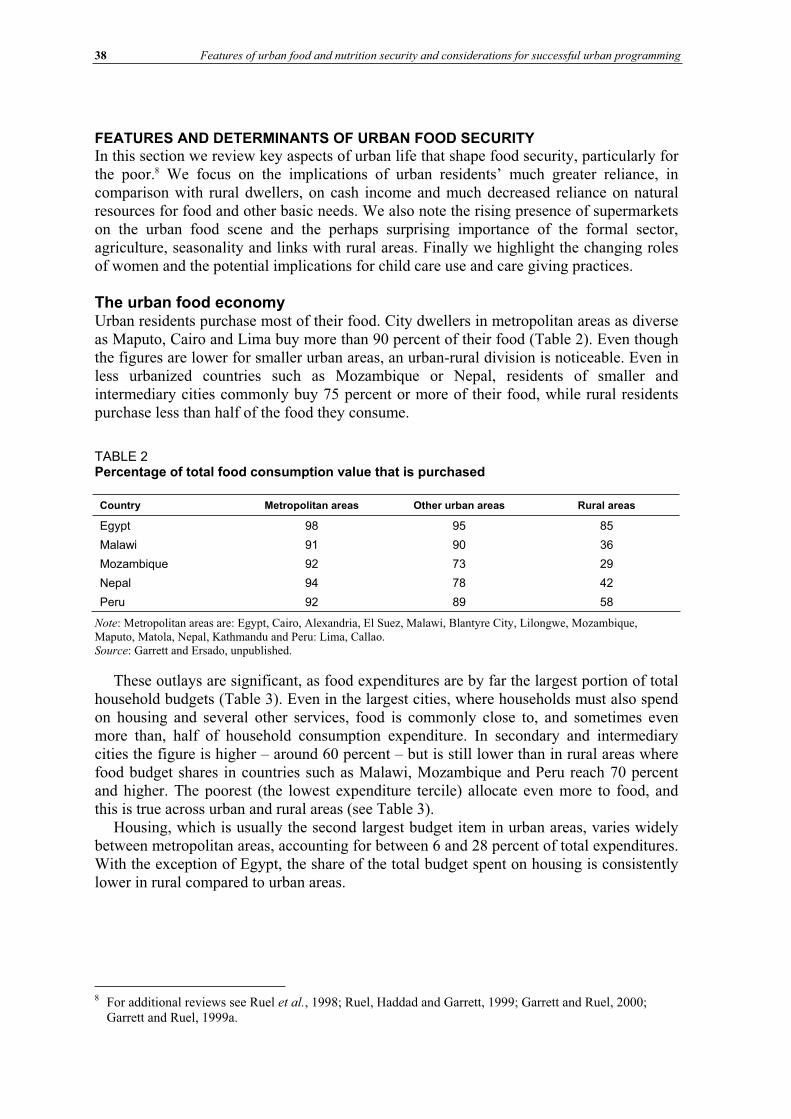
38 Features of urban food and nutrition security and considerations for successful urban programming
FEATURES AND DETERMINANTS OF URBAN FOOD SECURITY In this section we review key aspects of urban life that shape food security, particularly for the poor.8 We focus on the implications of urban residents’ much greater reliance, in comparison with rural dwellers, on cash income and much decreased reliance on natural resources for food and other basic needs. We also note the rising presence of supermarkets on the urban food scene and the perhaps surprising importance of the formal sector, agriculture, seasonality and links with rural areas. Finally we highlight the changing roles of women and the potential implications for child care use and care giving practices.
The urban food economy Urban residents purchase most of their food. City dwellers in metropolitan areas as diverse as Maputo, Cairo and Lima buy more than 90 percent of their food (Table 2). Even though the figures are lower for smaller urban areas, an urban-rural division is noticeable. Even in less urbanized countries such as Mozambique or Nepal, residents of smaller and intermediary cities commonly buy 75 percent or more of their food, while rural residents purchase less than half of the food they consume.
TABLE 2Percentage of total food consumption value that is purchased
Country Metropolitan areas Other urban areas Rural areas
Egypt 98 95 85
Malawi 91 90 36
Mozambique 92 73 29
Nepal 94 78 42
Peru 92 89 58
Note: Metropolitan areas are: Egypt, Cairo, Alexandria, El Suez, Malawi, Blantyre City, Lilongwe, Mozambique, Maputo, Matola, Nepal, Kathmandu and Peru: Lima, Callao. Source: Garrett and Ersado, unpublished.
These outlays are significant, as food expenditures are by far the largest portion of total household budgets (Table 3). Even in the largest cities, where households must also spend on housing and several other services, food is commonly close to, and sometimes even more than, half of household consumption expenditure. In secondary and intermediary cities the figure is higher – around 60 percent – but is still lower than in rural areas where food budget shares in countries such as Malawi, Mozambique and Peru reach 70 percent and higher. The poorest (the lowest expenditure tercile) allocate even more to food, and this is true across urban and rural areas (see Table 3).
Housing, which is usually the second largest budget item in urban areas, varies widely between metropolitan areas, accounting for between 6 and 28 percent of total expenditures. With the exception of Egypt, the share of the total budget spent on housing is consistently lower in rural compared to urban areas.
8 For additional reviews see Ruel et al., 1998; Ruel, Haddad and Garrett, 1999; Garrett and Ruel, 2000; Garrett and Ruel, 1999a.
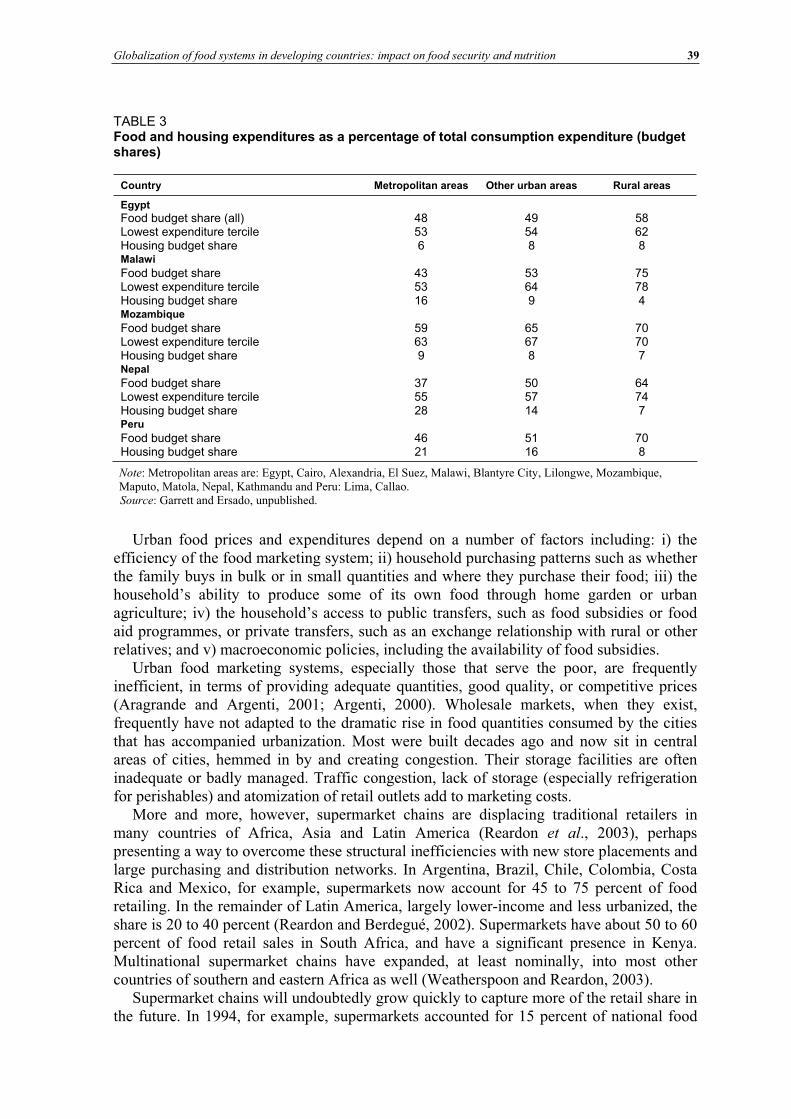
Globalization of food systems in developing countries: impact on food security and nutrition 39
TABLE 3 Food and housing expenditures as a percentage of total consumption expenditure (budget shares)
Country Metropolitan areas Other urban areas Rural areas
Egypt Food budget share (all) 48 49 58 Lowest expenditure tercile 53 54 62 Housing budget share 6 8 8 Malawi Food budget share 43 53 75 Lowest expenditure tercile 53 64 78 Housing budget share 16 9 4 Mozambique Food budget share 59 65 70 Lowest expenditure tercile 63 67 70 Housing budget share 9 8 7 Nepal Food budget share 37 50 64 Lowest expenditure tercile 55 57 74 Housing budget share 28 14 7 Peru Food budget share 46 51 70 Housing budget share 21 16 8
Note: Metropolitan areas are: Egypt, Cairo, Alexandria, El Suez, Malawi, Blantyre City, Lilongwe, Mozambique, Maputo, Matola, Nepal, Kathmandu and Peru: Lima, Callao. Source: Garrett and Ersado, unpublished.
Urban food prices and expenditures depend on a number of factors including: i) the efficiency of the food marketing system; ii) household purchasing patterns such as whether the family buys in bulk or in small quantities and where they purchase their food; iii) the household’s ability to produce some of its own food through home garden or urban agriculture; iv) the household’s access to public transfers, such as food subsidies or food aid programmes, or private transfers, such as an exchange relationship with rural or other relatives; and v) macroeconomic policies, including the availability of food subsidies.
Urban food marketing systems, especially those that serve the poor, are frequently inefficient, in terms of providing adequate quantities, good quality, or competitive prices (Aragrande and Argenti, 2001; Argenti, 2000). Wholesale markets, when they exist, frequently have not adapted to the dramatic rise in food quantities consumed by the cities that has accompanied urbanization. Most were built decades ago and now sit in central areas of cities, hemmed in by and creating congestion. Their storage facilities are often inadequate or badly managed. Traffic congestion, lack of storage (especially refrigeration for perishables) and atomization of retail outlets add to marketing costs.
More and more, however, supermarket chains are displacing traditional retailers in many countries of Africa, Asia and Latin America (Reardon et al., 2003), perhaps presenting a way to overcome these structural inefficiencies with new store placements and large purchasing and distribution networks. In Argentina, Brazil, Chile, Colombia, Costa Rica and Mexico, for example, supermarkets now account for 45 to 75 percent of food retailing. In the remainder of Latin America, largely lower-income and less urbanized, the share is 20 to 40 percent (Reardon and Berdegué, 2002). Supermarkets have about 50 to 60 percent of food retail sales in South Africa, and have a significant presence in Kenya. Multinational supermarket chains have expanded, at least nominally, into most other countries of southern and eastern Africa as well (Weatherspoon and Reardon, 2003).
Supermarket chains will undoubtedly grow quickly to capture more of the retail share in the future. In 1994, for example, supermarkets accounted for 15 percent of national food
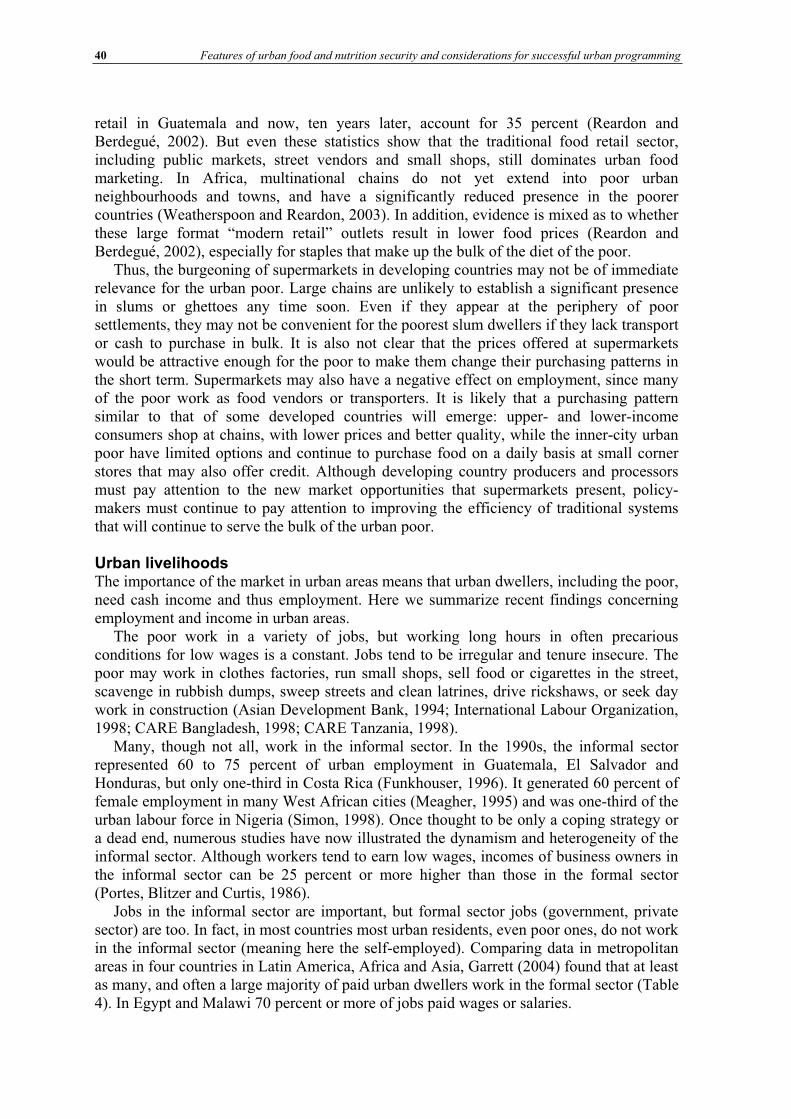
40 Features of urban food and nutrition security and considerations for successful urban programming
retail in Guatemala and now, ten years later, account for 35 percent (Reardon and Berdegué, 2002). But even these statistics show that the traditional food retail sector, including public markets, street vendors and small shops, still dominates urban food marketing. In Africa, multinational chains do not yet extend into poor urban neighbourhoods and towns, and have a significantly reduced presence in the poorer countries (Weatherspoon and Reardon, 2003). In addition, evidence is mixed as to whether these large format “modern retail” outlets result in lower food prices (Reardon and Berdegué, 2002), especially for staples that make up the bulk of the diet of the poor.
Thus, the burgeoning of supermarkets in developing countries may not be of immediate relevance for the urban poor. Large chains are unlikely to establish a significant presence in slums or ghettoes any time soon. Even if they appear at the periphery of poor settlements, they may not be convenient for the poorest slum dwellers if they lack transport or cash to purchase in bulk. It is also not clear that the prices offered at supermarkets would be attractive enough for the poor to make them change their purchasing patterns in the short term. Supermarkets may also have a negative effect on employment, since many of the poor work as food vendors or transporters. It is likely that a purchasing pattern similar to that of some developed countries will emerge: upper- and lower-income consumers shop at chains, with lower prices and better quality, while the inner-city urban poor have limited options and continue to purchase food on a daily basis at small corner stores that may also offer credit. Although developing country producers and processors must pay attention to the new market opportunities that supermarkets present, policy-makers must continue to pay attention to improving the efficiency of traditional systems that will continue to serve the bulk of the urban poor.
Urban livelihoods The importance of the market in urban areas means that urban dwellers, including the poor, need cash income and thus employment. Here we summarize recent findings concerning employment and income in urban areas.
The poor work in a variety of jobs, but working long hours in often precarious conditions for low wages is a constant. Jobs tend to be irregular and tenure insecure. The poor may work in clothes factories, run small shops, sell food or cigarettes in the street, scavenge in rubbish dumps, sweep streets and clean latrines, drive rickshaws, or seek day work in construction (Asian Development Bank, 1994; International Labour Organization, 1998; CARE Bangladesh, 1998; CARE Tanzania, 1998).
Many, though not all, work in the informal sector. In the 1990s, the informal sector represented 60 to 75 percent of urban employment in Guatemala, El Salvador and Honduras, but only one-third in Costa Rica (Funkhouser, 1996). It generated 60 percent of female employment in many West African cities (Meagher, 1995) and was one-third of the urban labour force in Nigeria (Simon, 1998). Once thought to be only a coping strategy or a dead end, numerous studies have now illustrated the dynamism and heterogeneity of the informal sector. Although workers tend to earn low wages, incomes of business owners in the informal sector can be 25 percent or more higher than those in the formal sector (Portes, Blitzer and Curtis, 1986).
Jobs in the informal sector are important, but formal sector jobs (government, private sector) are too. In fact, in most countries most urban residents, even poor ones, do not work in the informal sector (meaning here the self-employed). Comparing data in metropolitan areas in four countries in Latin America, Africa and Asia, Garrett (2004) found that at least as many, and often a large majority of paid urban dwellers work in the formal sector (Table 4). In Egypt and Malawi 70 percent or more of jobs paid wages or salaries.
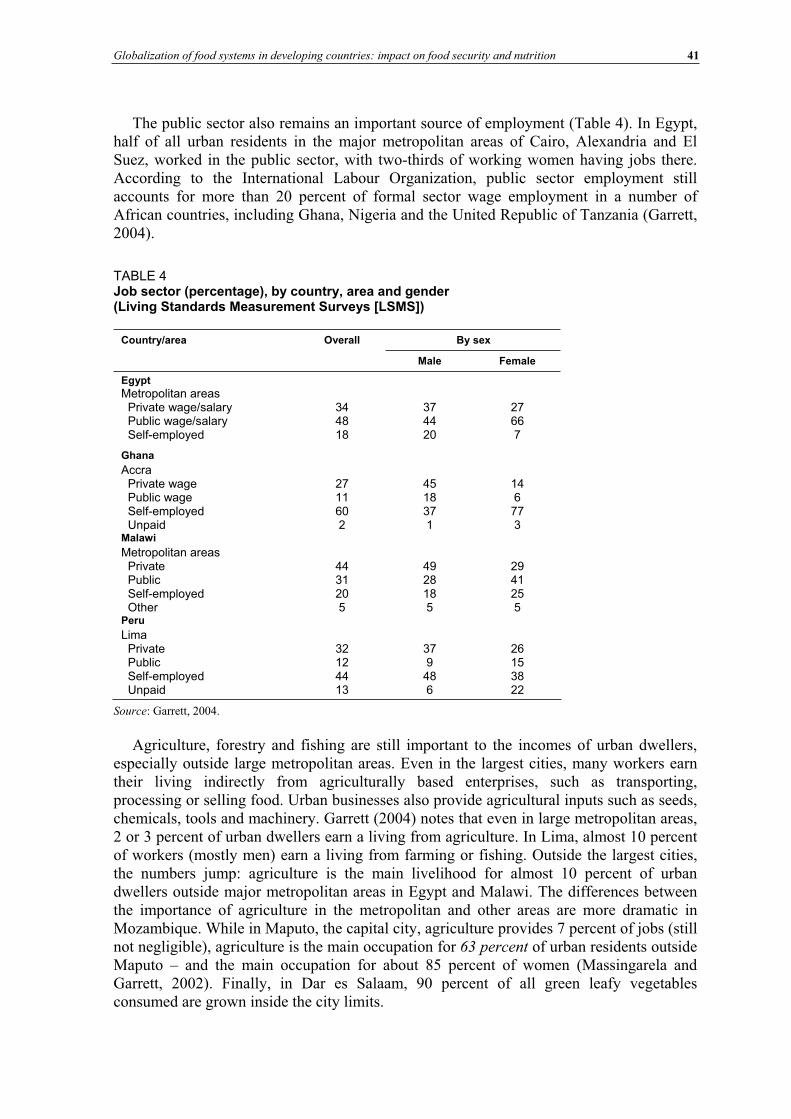
Globalization of food systems in developing countries: impact on food security and nutrition 41
The public sector also remains an important source of employment (Table 4). In Egypt, half of all urban residents in the major metropolitan areas of Cairo, Alexandria and El Suez, worked in the public sector, with two-thirds of working women having jobs there. According to the International Labour Organization, public sector employment still accounts for more than 20 percent of formal sector wage employment in a number of African countries, including Ghana, Nigeria and the United Republic of Tanzania (Garrett, 2004).
TABLE 4Job sector (percentage), by country, area and gender (Living Standards Measurement Surveys [LSMS])
By sex Country/area Overall
Male Female
Egypt
Metropolitan areas Private wage/salary Public wage/salary Self-employed
344818
374420
27667
Ghana
Accra Private wage Public wage Self-employed Unpaid
2711602
4518371
146773
Malawi
Metropolitan areas Private Public Self-employed Other
4431205
4928185
2941255
Peru
Lima Private Public Self-employed Unpaid
32124413
379486
26153822
Source: Garrett, 2004.
Agriculture, forestry and fishing are still important to the incomes of urban dwellers, especially outside large metropolitan areas. Even in the largest cities, many workers earn their living indirectly from agriculturally based enterprises, such as transporting, processing or selling food. Urban businesses also provide agricultural inputs such as seeds, chemicals, tools and machinery. Garrett (2004) notes that even in large metropolitan areas, 2 or 3 percent of urban dwellers earn a living from agriculture. In Lima, almost 10 percent of workers (mostly men) earn a living from farming or fishing. Outside the largest cities, the numbers jump: agriculture is the main livelihood for almost 10 percent of urban dwellers outside major metropolitan areas in Egypt and Malawi. The differences between the importance of agriculture in the metropolitan and other areas are more dramatic in Mozambique. While in Maputo, the capital city, agriculture provides 7 percent of jobs (still not negligible), agriculture is the main occupation for 63 percent of urban residents outside Maputo – and the main occupation for about 85 percent of women (Massingarela and Garrett, 2002). Finally, in Dar es Salaam, 90 percent of all green leafy vegetables consumed are grown inside the city limits.
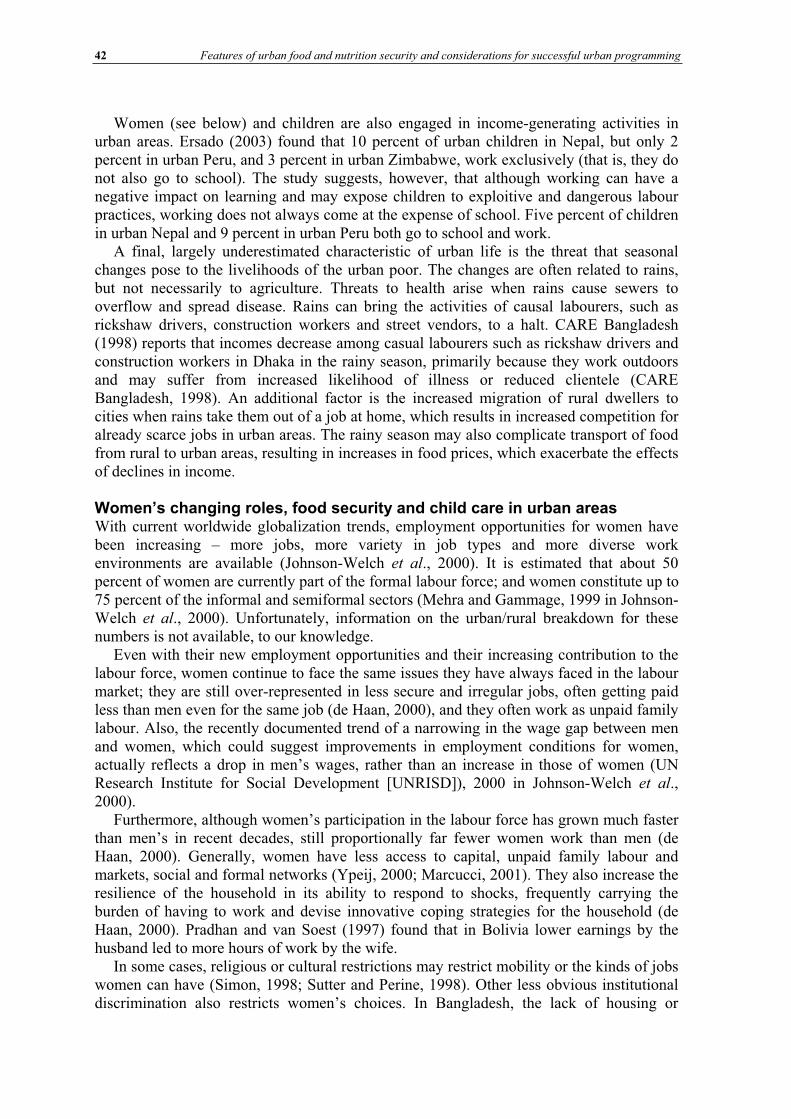
42 Features of urban food and nutrition security and considerations for successful urban programming
Women (see below) and children are also engaged in income-generating activities in urban areas. Ersado (2003) found that 10 percent of urban children in Nepal, but only 2 percent in urban Peru, and 3 percent in urban Zimbabwe, work exclusively (that is, they do not also go to school). The study suggests, however, that although working can have a negative impact on learning and may expose children to exploitive and dangerous labour practices, working does not always come at the expense of school. Five percent of children in urban Nepal and 9 percent in urban Peru both go to school and work.
A final, largely underestimated characteristic of urban life is the threat that seasonal changes pose to the livelihoods of the urban poor. The changes are often related to rains, but not necessarily to agriculture. Threats to health arise when rains cause sewers to overflow and spread disease. Rains can bring the activities of causal labourers, such as rickshaw drivers, construction workers and street vendors, to a halt. CARE Bangladesh (1998) reports that incomes decrease among casual labourers such as rickshaw drivers and construction workers in Dhaka in the rainy season, primarily because they work outdoors and may suffer from increased likelihood of illness or reduced clientele (CARE Bangladesh, 1998). An additional factor is the increased migration of rural dwellers to cities when rains take them out of a job at home, which results in increased competition for already scarce jobs in urban areas. The rainy season may also complicate transport of food from rural to urban areas, resulting in increases in food prices, which exacerbate the effects of declines in income.
Women’s changing roles, food security and child care in urban areas With current worldwide globalization trends, employment opportunities for women have been increasing – more jobs, more variety in job types and more diverse work environments are available (Johnson-Welch et al., 2000). It is estimated that about 50 percent of women are currently part of the formal labour force; and women constitute up to 75 percent of the informal and semiformal sectors (Mehra and Gammage, 1999 in Johnson-Welch et al., 2000). Unfortunately, information on the urban/rural breakdown for these numbers is not available, to our knowledge.
Even with their new employment opportunities and their increasing contribution to the labour force, women continue to face the same issues they have always faced in the labour market; they are still over-represented in less secure and irregular jobs, often getting paid less than men even for the same job (de Haan, 2000), and they often work as unpaid family labour. Also, the recently documented trend of a narrowing in the wage gap between men and women, which could suggest improvements in employment conditions for women, actually reflects a drop in men’s wages, rather than an increase in those of women (UN Research Institute for Social Development [UNRISD]), 2000 in Johnson-Welch et al.,2000).
Furthermore, although women’s participation in the labour force has grown much faster than men’s in recent decades, still proportionally far fewer women work than men (de Haan, 2000). Generally, women have less access to capital, unpaid family labour and markets, social and formal networks (Ypeij, 2000; Marcucci, 2001). They also increase the resilience of the household in its ability to respond to shocks, frequently carrying the burden of having to work and devise innovative coping strategies for the household (de Haan, 2000). Pradhan and van Soest (1997) found that in Bolivia lower earnings by the husband led to more hours of work by the wife.
In some cases, religious or cultural restrictions may restrict mobility or the kinds of jobs women can have (Simon, 1998; Sutter and Perine, 1998). Other less obvious institutional discrimination also restricts women’s choices. In Bangladesh, the lack of housing or
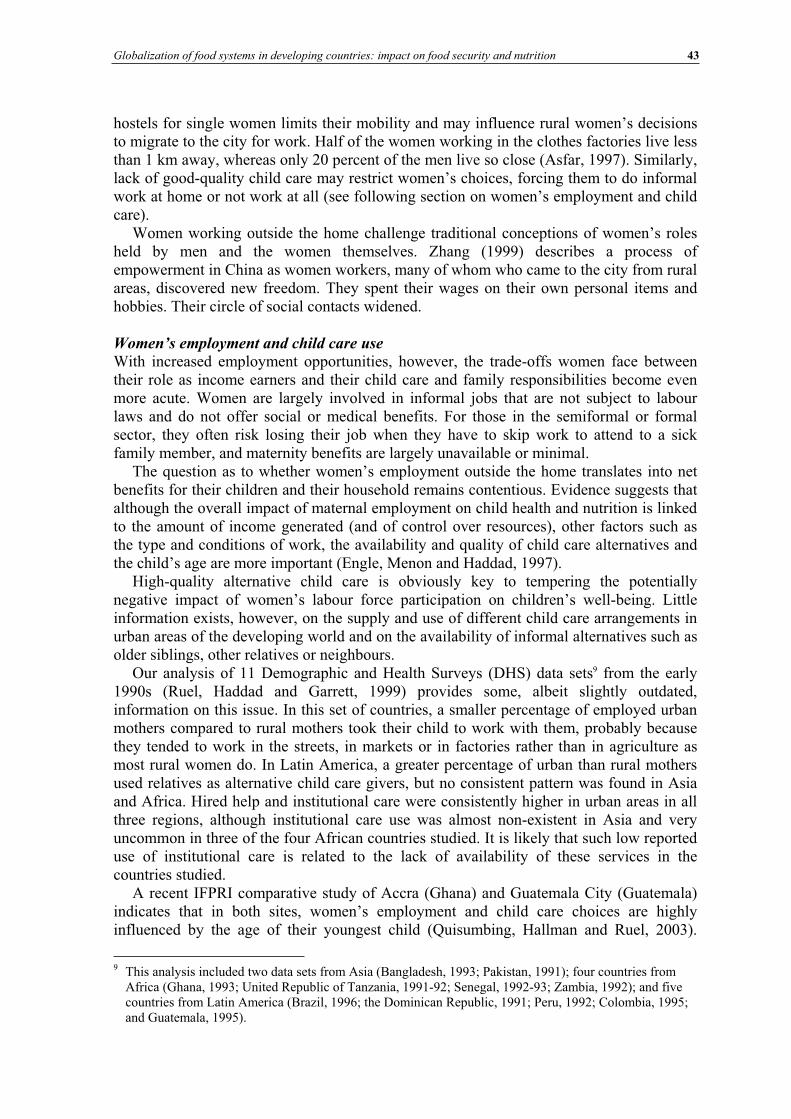
Globalization of food systems in developing countries: impact on food security and nutrition 43
hostels for single women limits their mobility and may influence rural women’s decisions to migrate to the city for work. Half of the women working in the clothes factories live less than 1 km away, whereas only 20 percent of the men live so close (Asfar, 1997). Similarly, lack of good-quality child care may restrict women’s choices, forcing them to do informal work at home or not work at all (see following section on women’s employment and child care).
Women working outside the home challenge traditional conceptions of women’s roles held by men and the women themselves. Zhang (1999) describes a process of empowerment in China as women workers, many of whom who came to the city from rural areas, discovered new freedom. They spent their wages on their own personal items and hobbies. Their circle of social contacts widened.
Women’s employment and child care use
With increased employment opportunities, however, the trade-offs women face between their role as income earners and their child care and family responsibilities become even more acute. Women are largely involved in informal jobs that are not subject to labour laws and do not offer social or medical benefits. For those in the semiformal or formal sector, they often risk losing their job when they have to skip work to attend to a sick family member, and maternity benefits are largely unavailable or minimal.
The question as to whether women’s employment outside the home translates into net benefits for their children and their household remains contentious. Evidence suggests that although the overall impact of maternal employment on child health and nutrition is linked to the amount of income generated (and of control over resources), other factors such as the type and conditions of work, the availability and quality of child care alternatives and the child’s age are more important (Engle, Menon and Haddad, 1997).
High-quality alternative child care is obviously key to tempering the potentially negative impact of women’s labour force participation on children’s well-being. Little information exists, however, on the supply and use of different child care arrangements in urban areas of the developing world and on the availability of informal alternatives such as older siblings, other relatives or neighbours.
Our analysis of 11 Demographic and Health Surveys (DHS) data sets9 from the early 1990s (Ruel, Haddad and Garrett, 1999) provides some, albeit slightly outdated, information on this issue. In this set of countries, a smaller percentage of employed urban mothers compared to rural mothers took their child to work with them, probably because they tended to work in the streets, in markets or in factories rather than in agriculture as most rural women do. In Latin America, a greater percentage of urban than rural mothers used relatives as alternative child care givers, but no consistent pattern was found in Asia and Africa. Hired help and institutional care were consistently higher in urban areas in all three regions, although institutional care use was almost non-existent in Asia and very uncommon in three of the four African countries studied. It is likely that such low reported use of institutional care is related to the lack of availability of these services in the countries studied.
A recent IFPRI comparative study of Accra (Ghana) and Guatemala City (Guatemala) indicates that in both sites, women’s employment and child care choices are highly influenced by the age of their youngest child (Quisumbing, Hallman and Ruel, 2003).
9 This analysis included two data sets from Asia (Bangladesh, 1993; Pakistan, 1991); four countries from Africa (Ghana, 1993; United Republic of Tanzania, 1991-92; Senegal, 1992-93; Zambia, 1992); and five countries from Latin America (Brazil, 1996; the Dominican Republic, 1991; Peru, 1992; Colombia, 1995; and Guatemala, 1995).
44 Features of urban food and nutrition security and considerations for successful urban programming
Mothers with children under three years of age are less likely to be working and, if they do work, they are less likely to use formal child care compared to mothers with older children. In Guatemala City, another important determinant of women’s decision to work is the presence of an adult woman (a potential alternative child care giver) in the household. In Ghana, where most urban women work in the informal sector, those who have to resume work for economic reasons when their infant is still young usually take the infant along to their workplace. Depending on the work environment, this may or may not be positive for the child, but at least it is likely to help preserve breastfeeding, which should confer important nutritional benefits to the child.
These findings confirm that women do adapt their work patterns to their specific family circumstances and that the well-being of their children is the overriding force behind their decisions to work and to use child care alternatives. These “adaptive strategies” by which mothers stop working, or work fewer hours, or even take their infant to work if they have to work, may be successful in protecting their infant. They may, however, seriously jeopardize the mothers’ ability to generate income and to protect their household’s livelihood and food security, especially if they are the sole income earner. Effective programmes and policies are urgently needed in developing countries to support working women, especially women with young children who have limited or no access to extended family networks or other affordable, yet reliable substitute child care options.
Women’s employment and care giving practices
Evidence on the effect of women’s employment on care giving practices such as breastfeeding, complementary feeding, preventive and curative health seeking behaviour, and psychosocial care is mixed (Engle, Menon and Haddad, 1997). But overall, there is little evidence that maternal labour supply has a negative effect on these practices or on children’s health and nutritional status (Blau, Guilkey and Popkin, 1997; Glick and Sahn, 1988). For example, studies have shown that, contrary to general belief, maternal employment was not a main determinant of breastmilk substitute use in developing countries (Hight-Laukaran et al., 1996) nor was it systematically related to shorter breastfeeding duration (Winikoff, Castle and Hight-Laukaran, 1988).
Our study in Accra documented that child feeding, hygiene or health seeking behaviours were not affected by maternal employment (Amar-Klemesu et al., 2000). In this context, the key factor that was consistently associated with better care giving practices was higher maternal schooling, which in Accra is not related to whether or not mothers work. In this large urban centre, the majority of women do work, irrespective of their educational level, and they work mostly in the informal sector in petty trade, street food processing and vending. As noted above, mothers of young infants in Accra are more likely to take their young infant along when they have to resume work soon after delivery, than leave the child with an alternate care giver. This is probably the main reason why maternal employment has not resulted in poorer child care practices.
Additional, indirect evidence that women’s employment in urban areas may not necessarily have a negative impact on child care practices again comes from global urban/rural comparisons. We showed previously that, with the exception of breastfeeding, child feeding practices are substantially better in urban compared to rural areas, in spite of the fact that a larger proportion of women in most developing countries are engaged in income-generating activities, often away from home (see section on why urban children are better off nutritionally than rural children, p. 38).
Overall, mothers appear to be amazingly efficient at combining their income-generating activities and their child care responsibilities, and at buffering the potentially negative
Globalization of food systems in developing countries: impact on food security and nutrition 45
impacts of their employment patterns on their children’s well-being. But at what cost – for themselves and for their household food and livelihood security? This question remains largely unanswered because whether the food security situation of poor working women is alleviated or aggravated by their participation in the labour force largely depends on their specific set of resources and constraints.
LESSONS LEARNED AND IMPLICATIONS FOR URBAN PROGRAMMING What have we learned from this research and what are the implications for urban programming? This section summarizes our key findings with a focus on their implications for the design and implementation of effective urban programmes. We also draw from our collaborative work with CARE International on urban livelihoods in Bangladesh, Ethiopia and Peru (Garrett, 2002) and from our experience with the government-sponsored Community Daycare Program in Guatemala (Ruel et al., 2002)10 and suggest some approaches to addressing the challenges and opportunities of urban programming.
Lessons learned and challenges and opportunities for urban programming Here we provide a brief overview of some of the challenges and opportunities of urban programming, based on the results of our research and our experience collaborating with CARE in the implementation of the programmes noted above.
Heterogeneity and mobility: where are the poor, food insecure and malnourished?
Urban areas are immensely diverse and our findings confirm the wide disparities that exist in childhood malnutrition and food insecurity within an area. This heterogeneity may add complexity to the design, targeting and implementation of programmes, as social mores and networks, conditions, cultural practices and livelihood strategies change from household to household and neighbourhood to neighbourhood. The fact that the poor and the rich live side by side also complicates programme targeting. Community targeting, a popular and generally effective programme targeting approach in rural areas, may not be effective in urban areas where the poor do not necessarily cluster geographically (Morris et
al., 2002).Livelihood strategies are also equally diverse and programme strategies must take this
heterogeneity into account. Programmes to raise employment and income, for instance, will probably be more effective if they focus on providing the context for growth (training to increase worker productivity; policies to provide firms with credit and encourage them to identify and respond to market demand; and good communications and transportation networks), rather than pursuing a sector focus, such as might be done in rural areas.
Mobility of urban residents can also add complexity to programme targeting and reduce programme impact. Evictions can erase gains due to projects, and projects may completely miss those who are most vulnerable if they are the most mobile (the homeless, for instance). But the general perception that urban residents are so mobile that projects cannot provide them with any beneficial effects seems misguided. A large proportion of the urban poor in our case study countries, for example, were not recent migrants; they were residents who sought stability and an inviting environment to establish their roots. In Peru, many of the residents interviewed in the CARE programme areas had been in the area for
10 These programmes all aim to reduce urban food and nutrition insecurity, although they differ in their specific approach, components and operational aspects. They all involve some type of food aid, whether monetized or used directly as food.
46 Features of urban food and nutrition security and considerations for successful urban programming
15 to 20 years and had since been fighting for land and for later improvements, such as in water and sanitation. In Bangladesh, about 80 percent of residents in the two areas studied (one a suburb of Dhaka, the other, a good-size city) had been in the area for more than five years. In Ethiopia, with government ownership of land, there was very little movement in or out of the communities. In addition, the extent to which mobility matters depends mostly on the specific nature of the project. Infrastructure projects and community kitchens, for example, meet the needs of the community, regardless of how mobile the population is.
What can programmes do to reduce childhood malnutrition in urban areas?
Our data confirm that, although on average childhood malnutrition is lower in urban compared to rural areas, the rates of malnutrition among poor urban children often rival those of their rural counterparts. Moreover, we demonstrated that the factors responsible for poor child nutritional outcomes are the same in urban and rural areas. Thus, the same programme framework and sets of interventions developed for rural areas can be used to address childhood malnutrition in urban areas. As indicated above, however, it is likely that programme targeting will have to be done differently, i.e. either at the individual level or at the group level, but probably not at the community (geographic) level. Poor urban children deserve as much attention in the development agenda as rural children, because their health and development are equally key to national human capital formation and growth. Advocacy efforts should continue to highlight inequalities in urban areas and the heavy toll that poverty and food insecurity exert on urban children, so that resources can be mobilized to address the needs of this highly vulnerable group.
Urban livelihoods: employment and income, and women’s work and child care
Livelihood security in urban areas depends on a complex set of interrelated factors, of which employment and income are crucial. Our empirical data also confirm that most food consumed by urban dwellers is purchased and that food expenditures account for more than half of the urban household budget. Thus, programmes aiming at reducing the cost of food for the urban poor – such as food aid, food subsidies, urban agriculture, technology and food policies to reduce the cost of food – are likely to be particularly important for urban livelihoods. Similarly, employment is essential because urban dwellers need money for most of their basic needs. For women, however, employment brings about yet another basic need to be fulfilled, i.e. the need for support with child care.
Our empirical data concerning women, employment and child care point to an apparently widespread and effective system of maternal buffering, by which mothers adapt their working patterns to the special needs of their children. Mothers use a variety of mechanisms to protect their child while they work: they work part-time; they take their child along; they work at home; or they work in the informal sector to have more flexible schedules. But at what cost do these coping strategies have for them (in terms of stress, time, famine, physical and mental health, and household food security) and for their young child (in terms of safety of the environment, and time and quality of care received)? Clearly, more research in this area is needed, but there is no doubt that urban mothers, and especially single income earners, need support with child care responsibilities. An example of a successful programme that specifically addresses the needs of urban working mothers is the government-sponsored Community Daycare Program in Guatemala (see Box on p. 55 for details). This type of programme, which is highly popular in Latin America, has the double advantage of providing affordable and reliable child care for extended hours, and allowing women to secure a more formal employment and receive employment benefits.
Globalization of food systems in developing countries: impact on food security and nutrition 47
Land and housing security
Land and housing security are critical to project success. Infrastructure improvements, for example, may lead to increases in rent, thereby forcing the programme’s beneficiaries to move to cheaper housing. Tenure security is also critical for a variety of social programmes. For example, in the context of the community kitchen programme in Peru, local authorities have on occasion tried to take over the kitchen, claiming it was a government organization that belonged to them. But by owning their own space and officially incorporating the kitchen as a community organization, the women used the legal system to defend ownership of the kitchen against these encroachments.
Tenure security is also important for employment and livelihood. Field (2003) shows that introduction of title reform in eight cities in Peru increased the numbers of hours worked by households by 17 percent on average, as a result of families no longer having to leave a member safeguarding the homestead for fear of eviction.
Crime and violence
Slums are often perceived, sometimes fairly, as centres of crime and violence. Violent crimes take away lives and livelihoods, undermine social unity and threaten project staff. In Lima, communities had to deal with local youth gangs and terrorism in the shape of Sendero Luminoso. In Guatemala City, the Community Daycare Program was unable to open day care centres in some areas because of security issues. Crime, however, is not rampant in all urban areas. In Bangladesh, outside the major metropolitan areas, violent crime appears to be rare, with petty crimes such as theft being somewhat more common. Crime in many areas tends to illegal smuggling (alcohol, for example) and prostitution. In study sites in Bangladesh domestic violence is prevalent and practically accepted by the women themselves as a legitimate way for men to express their frustrations. In developing and operating projects, working with community residents, who live with the community’s crime and violence every day, can help to outline a strategy to confront crime and reduce risks to beneficiaries and project staff.
Poor social networks and lack of cohesion
All these factors (diversity, tenure insecurity, mobility and crime), may weaken community cohesion and social networks. Programmes that depend on community interest or peer pressure, such as credit groups, may fail. Projects may also suffer, if residents have limited knowledge of other members of their community.
Although it is true that some aspects of urban living encourage “independence”, others, such as relatively high education levels and relative ease of communication, may actually encourage group action. Urban protests against structural adjustment policies are solid evidence that urban residents can form effective groups quickly. In cities, social relations extend beyond the geographic bounds of the community. They are founded in ethnicity and kinship as well as politics, social issues, culture, religion, sports and employment. Illegal activities also form common connections among slum dwellers. Urban dwellers do have social networks. They may be different, but they are not necessarily weaker than those in rural areas.
Urban dwellers also usually have at least some experience in working together. In Peru, the women who ran the community kitchens had decades earlier joined together to invade the land and demand public services such as water and electricity. Funeral societies are common in Addis Ababa. Projects can take advantage of the structure, or at least the experiences, that these organizations provide.
48 Features of urban food and nutrition security and considerations for successful urban programming
Finally, just as projects depend on community cohesion to work, they may also be important means to strengthen community ties. As with mobility, the importance of that cohesion may vary with the project. Social unity may make little difference to individually targeted programmes, for instance, but may matter a great deal to community-based maintenance of infrastructure.
Projects and politics
The nature of urban living – the crowded conditions, scarcity of natural resources and investments required for public services – practically requires government intervention. In urban areas, government authorities tend to play larger roles in daily life than in rural areas. In cities, informing local authorities and organizations about project activities is vital. Actively involving them can also be beneficial, and can help leverage resources they may have. Projects should not overlook informal authorities, including crime lords and community and religious leaders, who often exert substantial influence on community activities.
For the most part, CARE’s programmes in the case study countries dealt effectively with potentially troublesome local political relations. They kept government authorities at all levels involved and informed, even taking them on as partners. Maintaining good relations with local stakeholders and educating politicians and bureaucrats about the project can counter upheaval at the top. Legal agreements clearly outlined institutional roles, responsibilities and commitments.
The project’s design and management should also be flexible enough to accommodate change. Project managers should assess how potential economic and political changes can affect the project, and incorporate an ability to respond into project management. Staff should be aware of continuously evolving economic, political and social conditions, and adjust the project as necessary. Changes by donors in funding priorities proved to be the biggest challenge to the operation and sustainability of projects reviewed, not local political changes.
Responses to programmatic challenges11
The final part of this paper presents a series of insights from our collaborative work with CARE into potential strategic responses to challenges in urban programming. It tries to illustrate that while urban livelihoods are complex, the complexities are manageable when actions follow some general principles. These principles also permit adaptation of the programme to respond to the challenges noted above.
Adapt to challenges by appropriately identifying needs, constraints, resources and levers
Programmes should enter communities cautiously. An institutional analysis can explore the influence of different community organizations, non-governmental organizations (NGOs) and political actors and the resources – human, financial and physical – available. This allows a programme to navigate more easily tricky political relations, focus on strategic interventions, facilitate processes and mobilize community and household human and financial resources. Use of a holistic analytical framework, such as a livelihoods approach that emphasizes connections among livelihood security areas, will help programmers get out of sectoral boxes in framing problems and devising solutions.
11 Additional information on CARE’s programmes can be found on IFPRI’s Web site (www.ifpri.org).
Globalization of food systems in developing countries: impact on food security and nutrition 49
Reduce complexity by focusing on a limited set of objectives, activities and location, and
exploit comparative advantages
Urban “complexity” stays manageable when programmes refrain from attempting to address all problems of poor communities and instead try to unravel the complexity by focusing on a strategically chosen strand. Organizations must identify their own strategic niche and adapt to local conditions and the leverage resources it has. In Ethiopia, for instance, CARE understood that its comparative advantage was in building and maintaining roads, while other organizations such as World Vision were more experienced in building houses. In partnership, World Vision and CARE could bring both better housing and roads to these communities, instead of working against one another.
Manage diversity complexity by starting small, scaling up, learning and being flexible
Even if programmes understand the local environment and have an initially limited focus, conditions change and programmes must develop over time. Successful programmes, then, will start small and scale up as they learn-by-doing. Management processes, however, must exist to support such an approach, which involves institutional learning and flexibility to respond to new situations as they arise. Sustainable programmes will also welcome input, support and collaboration from beneficiaries and other stakeholders, and build capacity. CARE utilized these principles in Peru. Staff and beneficiaries learned together. The programme started by using the skills that the women already had (for example, how to cook) and built capacity in other aspects over time (such as staffing and inventory management).
Confront issues of sustainability and political uncertainty by involving and empowering
stakeholders, tending to facilitation, not implementation
Experience now demonstrates that empowerment of local partners and of beneficiaries improves the probability of success and sustainability of programmes. Communities and local institutions should implement projects, with outsiders serving primarily as change agents and initial sources of expertise and financial resources. Beneficiaries in Ethiopia and Peru emphasized that they valued the fact that project staff respected them and believed in their capacities, even though they were poor. They also highlighted the importance of establishing well-known, fair rules that were enforced, and not favouring one individual or another because of greater wealth or political connections.
Ensure that donors and organizations help to create the economic, political and legal
environment and project monitoring systems that promote such facilitation and
sustainability12
Developing community capacity to manage programmes and access outside resources takes time, as does helping authorities recognize their own responsibilities to vulnerable populations and to the democratic process. Creating conditions for others to implement a project usually takes longer than if the organization simply implemented a project itself, but this latter approach does not create capacity or enhance the prospects for long-term sustainability.
Innovative financial arrangements should bring funding agencies closer to communities. Generally, donor aid goes through or must be approved by a national government, providing an obstacle to true decentralization and the building of design and management capacity at the local level. Project development guidelines and monitoring and evaluation
12 See the special issue of Environment & Urbanization (Brief 3, April 2001) on Rethinking aid to urban poverty reduction: lessons for donors.
50 Features of urban food and nutrition security and considerations for successful urban programming
tools, such as logical frameworks, generally reflect an assumption that the recipient of the funds will implement, not facilitate, the project. Donors must change this approach to promote facilitation. They should pay greater attention to time frames needed for capacity building, employ phased indicators appropriate to the time frame, identify new indicators of process, facilitation and capacity building, and incorporate flexibility in the design of the project.
The Community Daycare Program in Guatemala: an example of an effective urban programme to assist working mothers and their children
The Community Daycare Program in Guatemala was designed to assist working parents, single mothers in particular, with low-cost, quality child care within their community. In this programme a group of parents select a woman from the neighbourhood and designate her as the care provider. She then provides care, hygiene and food for up to ten children in her own home in return for a small stipend provided jointly by the parents and the programme administration. The programme also provides cash to purchase food for beneficiary children, which is complemented by monthly food donations from the World Food Programme (WFP). These are usually 44 lb (approximately 20 kg) of maize, 1 gallon (approximately 4.5 litres) of cooking oil, and 13 lb (approximately 6 kg) of black beans – or six cans of fish).
IFPRI’s evaluation of the programme in Guatemala City found that overall it was operating quite effectively, in spite of a few operational constraints. These included the lack of participation of the beneficiary parents (related to their heavy work and commuting schedule), and the extra demands on the care providers to go to receive their monthly payments and the food donations. The programme, however, proved to be an effective food aid targeting mechanism because it allowed poor working parents and their children to participate in spite of their busy schedule. The programme was also found to have a substantial positive impact on the diet of beneficiary children who consumed on average 20 percent more energy, protein and iron, and 50 percent more vitamin A than non-participants. There was no evidence of substitution at home and therefore the net benefits on the quality of the diet of participating children are substantial.
The programme also seemed to reach its targeted beneficiaries, i.e. poor urban working parents, and especially single mothers. Beneficiary mothers were slightly less educated, had fewer assets, lived in more precarious conditions, and were more likely to be single, compared to non-beneficiary working mothers from the same neighbourhoods. Probably as a result of their participation in the programme, beneficiary mothers were more likely to be employed in the formal sector and to receive work-related social and medical benefits. Their income was 30 percent higher than the income of working mothers who used other child care alternatives.
The Community Daycare Program is a feasible and efficient mechanism to target and deliver food assistance to poor urban children. It is clearly a type of programme with great potential and, if implemented successfully as it is in Guatemala City, can have a significant nutritional impact on children and on their family’s food security. Moreover, the programme does effectively support working parents’ efforts to seek and secure paid employment away from home, which in urban areas is essential to livelihood security. Its success in reaching single women also contributes to reinforcing these women’s efficiency in managing their dual role as income generators and child care givers. Thus, the model of the Guatemala Community Daycare Program is particularly well suited for an urban environment because it addresses the unique characteristics of urban livelihoods.
A constraint often overlooked in urban programming is the inability of working parents to participate in programmes that require attendance or regular contacts with programme staff during the daytime when they are at work. Typical food assistance programmes that operate through maternal and child health programmes, for example, are likely systematically to exclude the working poor and even more important, single mothers. Urban programming needs to pay more attention to the particular needs of poor working women and design innovative approaches that will help them complement their basic livelihood strategies, rather than interfere with them.
13
13 Additional information on IFPRI’s evaluation of the Community Daycare (Hogares Comunitarios)Program can be found in Ruel et al., 2002; Ruel, 2001a; and on IFPRI’s Web site (www.ifpri.org).
Globalization of food systems in developing countries: impact on food security and nutrition 51
Bibliography
Aragrande, M. & Argenti, O. 2001. Studying food supply and distribution systems to cities in developing countries and countries in transition. Methodological and operational guide. Rome, FAO. Argenti, O. 2000. Feeding the cities: food supply and distribution. Brief No. 5. In J. Garrett & M.T. Ruel, eds. Achieving urban food and nutrition security in the developing world. IFPRI 2020 Vision Focus 3. Washington, DC, International Food Policy Research Institute. Arimond, M. & Ruel, M.T. 2002. Progress in developing an infant and child feeding index: an example
using the Ethiopia Demographic and Health Survey 2000. Food Consumption and Nutrition Division Discussion Paper No. 143. Washington, DC, International Food Policy Research Institute. Arimond, M. & Ruel, M.T. 2004. Dietary diversity, dietary quality and child nutritional status: evidence
from eleven Demographic and Health Surveys. Washington, DC, Food and Nutrition Technical Assistance Project (FANTA). Armar-Klemesu, M., Ruel, M.T., Maxwell, D., Levin, C. & Morris, S. 2000. Poor maternal schooling is the main constraint to good child care practices in Accra. J. Nutrition, 130: 1597-1607. Asfar, R. 1997. Onus of poverty on women in the poorest settlements of Dhaka City. In K. Salahuddin, R. Jahan & M. Islam, eds. Women and poverty. Dhaka, Bangladesh, Women for Women. Asian Development Bank (ADB). 1994. Asian Development Outlook 1994. New York, USA., Oxford University Press. Basta, S. 1977. Nutrition and health in low income urban areas of the third world. Ecology of Food and Nutrition, 6: 113-24. Blau, D.M., Guilkey, D.K & Popkin, B.M. 1997. Infant health and the labor supply of mothers. J. Human
Resources, 31: 90-139. CARE Bangladesh. 1998. Urban livelihood security assessment in Bangladesh. Report. Dhaka, Bangladesh. CARE Tanzania. 1998. Dar es Salaam urban livelihood security assessment. Summary report. Dar es Salaam, United Republic of Tanzania. de Haan, A. 2000. Urban livelihoods and labor markets. Brief No. 4. In J. Garrett & M.T. Ruel, eds. Achieving urban food and nutrition security in the developing world. IFPRI 2020 Vision Focus 3. Washington, DC, International Food Policy Research Institute. Engle, P.L., Menon, P., Garrett, J. & Slack, A. 1997. Urbanization and caregiving: a framework for analysis and examples from Southern and Eastern Africa. Environment and Urbanization, 9(2): 253-270. Engle, P.L., Menon, P. & Haddad, L. 1997. Care and nutrition: concepts and measurement. Occasional Paper No. 18. Washington, DC, International Food Policy Research Institute. Ersado, L. 2003. Child labor and school decisions in urban and rural areas: cross-country evidence. Food Consumption and Nutrition Division Discussion Paper No. 145. Washington, DC, International Food Policy Research Institute. Field, E. 2003. Entitled to work: urban property rights and labor supply in Peru. Harvard University. December. (www.dartmouth.edu/~economic/seminar%20papers/Fieldproplabor.pdf).Funkhouser, E. 1996. The urban informal sector in Central America: household survey evidence. World
Development, 24: 1737-51. Garrett, J. 2002. Livelihoods in the city: challenges and options for the urban poor. Toward Eliminating Urban Poverty Seminar Series. Washington, DC, US Agency for International Development (USAID). Garrett, J. 2004. Living life: overlooked aspects of urban employment. Food Consumption and Nutrition Division Discussion Paper No.171. Washington, DC, International Food Policy Research Institute. Garrett, J. & Ersado, L. n.d. A rural-urban comparison of cash and consumption expenditure. Food Consumption and Nutrition Division Discussion Paper. Washington, DC, Food Consumption and Nutrition Division, International Food Policy Research Institute. (unpublished) Garrett, J. & Ruel, M.T. 1999a. Are determinants of rural and urban food security and nutritional status different? Some insights from Mozambique. World Development, 27: 1955-76. Garrett, J. & Ruel, M.T. 1999b. Food and nutrition in an urbanizing world. Choices, 10-15. Garrett, J. & Ruel, M.T. 2000. Achieving urban food and nutrition security in the developing world. IFPRI 2020 Vision Focus 3. Glick, P. & Sahn, D.E. 1998. Maternal labour supply and child nutrition in West Africa. Oxford Bulletin of
Economics and Statistics, 60(3): 325-55. Hight-Laukaran, V., Rutstein, S.O., Peterson, A.E. & Labbok, M.H. 1996. The use of breast milk substitutes in developing countries: the impact of women's employment. American J. Public Health, 86: 1235-40. Hoddinott, J. & Yohannes, Y. 2002. Dietary diversity as a food security indicator. Food Consumption and Nutrition Division Discussion Paper No. 136. Washington, DC, International Food Policy Research Institute.
52 Features of urban food and nutrition security and considerations for successful urban programming
International Labour Organization. 1998. The future of urban employment. Geneva, ILO. Johnson-Welch, C., Bonnard, P., Strickland, R. & Sims, M. 2000. They can't do it all: a call for expanded
investments in childcare. Washington, DC, International Center for Research on Women. (unpublished) Marcucci, P. 2001. Jobs, gender and small enterprises in Africa and Asia: lessons drawn from Bangladesh,
the Philippines, Tunisia and Zimbabwe. SEED Working Paper No. 18. Geneva, International Labour Organization. Massingarela, C. & Garrett, J. 2002. Perfil de emprego nas zonas urbanas de Mozambique. Maputo, Mozambique, Ministerio dos Planos e Financas. Meagher, K. 1995. Crisis, informalization and the urban informal sector in sub-Saharan Africa. Development and Change, 26: 259-84. Menon, P., Ruel, M.T. & Morris, S.S. 2000. Socio-economic differentials in child stunting are consistently larger in urban than in rural areas. Food and Nutrition Bulletin, 21: 282-9. Morris, S.S., Levin, C.E, Armar-Klemesu, M., Maxwell, D. & Ruel, M.T. 2002. Does geographic
targeting of nutrition interventions make sense in cities? Evidence from Abidjan and Accra. Food Consumption and Nutrition Division Discussion Paper No. 61. Washington, DC, International Food Policy Research Institute. National Research Council. 2003. Cities transformed: demographic change and its implications in the
developing world. Panel on Urban Population Dynamics. Washington, DC, The National Academies Press. Popkin, B.M. 1994. The nutrition transition in low-income countries: an emerging crisis. Nutrition Reviews,
52: 285-98. Popkin, B.M. & Doak, C.M. 1998. The obesity epidemic is a worldwide phenomenon. Nutrition Reviews,56: 106-14. Portes, A., Blitzer, S. & Curtis, J. 1986. The urban informal sector in Uruguay: its internal structure, characteristics and effects. World Development, 14: 727-41. Pradhan, M. & van Soest, A. 1997. Household labor supply in urban areas of Bolivia. Economic J., 79: 300-10. Quisumbing, A., Hallman, K. & Ruel, M.T. 2003. Maquiladoras and market mamas: women's work and
childcare in Guatemala City and Accra. Food Consumption and Nutrition Division Discussion Paper No.153. Washington, DC, International Food Policy Research Institute. Reardon, T. & Berdegué, J. 2002. The rapid rise of supermarkets in Latin America: challenges and opportunities for development. Development Policy Rev., 20: 371-88.Reardon, T., Timmer, P., Barrett, C. & Berdegué, J. 2003. The rise of supermarkets in Africa, Asia and Latin America. American J. Agricultural Economics, 85(5): 1140-1146. Ruel, M.T. 2000. Urbanization in Latin America: constraints and opportunities for child feeding and care.Food and Nutrition Bulletin, 21: 12-24. Ruel, M.T. 2001a. Do subsidized child care programmes work? An operations evaluation in Guatemala City. Food, Nutrition and Agriculture, 29: 44-52. Food and Agriculture Organization of the United Nations (FAO). Ruel, M.T. 2001b. The natural history of growth failure: importance of intrauterine and postnatal periods. InR. Martorell & F. Haschke, eds. Nutrition and growth. Philadelphia, USA., Nestlé Nutrition Workshop Series, Pediatric Program, Vol. 47, p. 123-58. Nestec Ltd, Vevey/Lippincott Williams & Wilkins. Ruel, M.T., de la Briere, B., Hallman, K., Quisumbing, A. & Coj, N. 2002. Does subsidized childcare help poor working women in urban areas? Evaluation of a government-sponsored program in Guatemala City. Food Consumption and Nutrition Division Discussion Paper No. 131. Washington, DC, International Food Policy Research Institute.Ruel, M.T., Garrett, J., Morris, S.S., Maxwell, D., Oshaug, O., Engle, P., Menon, P., Slack, A. & Haddad, L. 1998. Urban challenges to food and nutrition security: a review of food security, health, and caregiving in the cities. Food Consumption and Nutrition Division Discussion Paper No. 51. Washington, DC, International Food Policy Research Institute.Ruel, M.T., Haddad, L. & Garrett, J. 1999. Some urban facts of life: implications for research and policy. World Development, 11: 1917-38. Simon, P.B. 1998. Informal responses to crises of urban employment: an investigation into the structure and relevance of small-scale informal retailing in Kaduna, Nigeria. Regional Studies, 32: 547-57. Smith, L.C. & Aduayom, D. 2003. Measuring food insecurity using household expenditure surveys: new
estimates from sub-Saharan Africa. Paper prepared for presentation at the Workshop on Food Security Measurement in a Developing World Context with a Focus on Africa. 25th International Conference of Agricultural Economists, Durban, South Africa. Smith, L.C., Ruel M.T. & Ndiaye, A. 2003. Why is child malnutrition lower in urban than rural areas?
Evidence from 36 developing countries. Food Consumption and Nutrition Division Discussion Paper No. 176. Washington, DC, International Food Policy Research Institute.
Globalization of food systems in developing countries: impact on food security and nutrition 53
Sutter, P. & Perine, C. 1998. Urban livelihoods security assessment in Bangladesh. Vol. 1, Main Report. Dhaka, Bangladesh, CARE Bangladesh. Weatherspoon, D. & Reardon, T. 2003. The rise of supermarkets in Africa: implications for agrifood systems and the rural poor. Development Policy Rev., 21: 333-55. WHO/FAO. 2003. Diet, nutrition and the prevention of chronic diseases. Report of a Joint WHO/FAO Expert Consultation. Geneva, World Health Organization. Winikoff, B., Castle, M.A. & Hight-Laukaran, V. 1988. Feeding infants in four societies. Contributions in Family Studies, No. 14. New York, USA., Greenwood Press. World Health Organization (WHO). 1979. Measurement of nutritional impact. Geneva. World Health Organization (WHO). 1985. Energy and protein requirements. Technical Report Series No. 724. Geneva. World Resource Institute, United Nations Environment Programme, United Nations Development
Programme & World Bank. World Resources 1996-97. A guide to the global environment. The urban
environment. New York, USA., Oxford University Press. Ypeij, A. 2000. Producing against poverty: female and male micro-entrepreneurs in Lima, Peru.Amsterdam, Amsterdam University Press. Zhang, H.X. 1999. Female migration and urban labour markets in Tianjin. Development and Change, 30: 21-41.
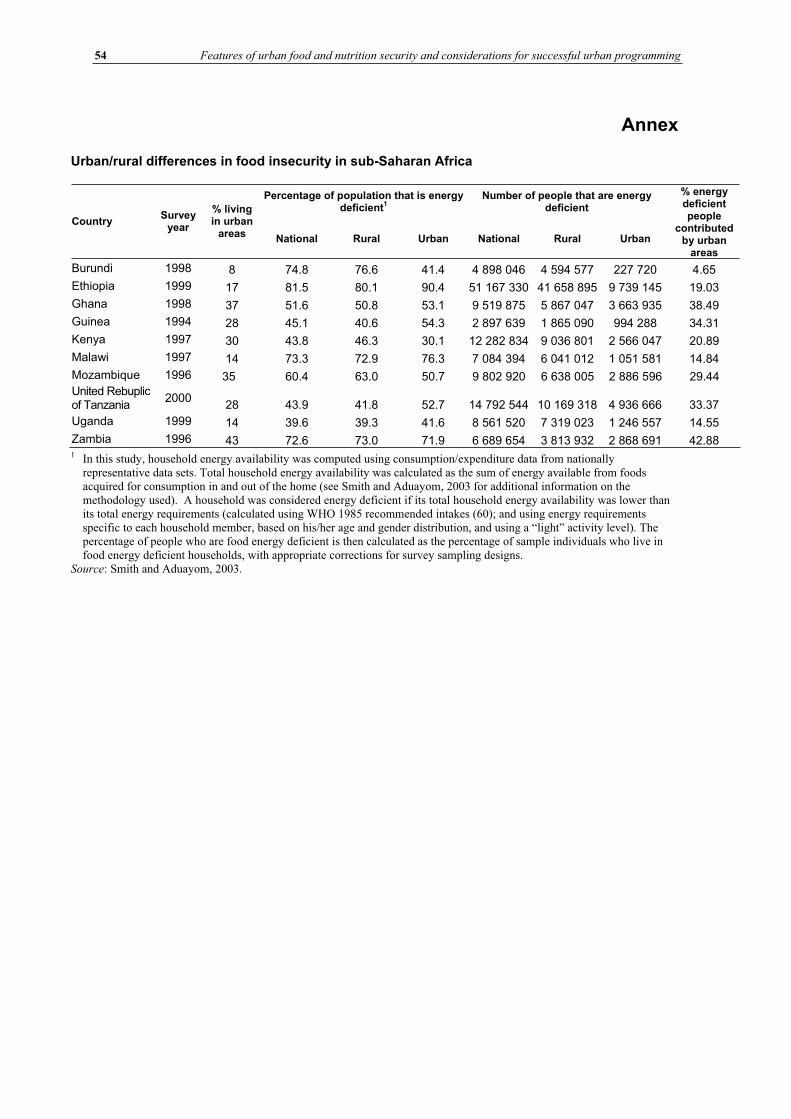
54 Features of urban food and nutrition security and considerations for successful urban programming
Annex
Urban/rural differences in food insecurity in sub-Saharan Africa
Percentage of population that is energy deficient
1Number of people that are energy
deficient
Country Survey
year
% living in urban
areas National Rural Urban National Rural Urban
% energy deficient people
contributed by urban
areas
Burundi 1998 8 74.8 76.6 41.4 4 898 046 4 594 577 227 720 4.65
Ethiopia 1999 17 81.5 80.1 90.4 51 167 330 41 658 895 9 739 145 19.03
Ghana 1998 37 51.6 50.8 53.1 9 519 875 5 867 047 3 663 935 38.49
Guinea 1994 28 45.1 40.6 54.3 2 897 639 1 865 090 994 288 34.31
Kenya 1997 30 43.8 46.3 30.1 12 282 834 9 036 801 2 566 047 20.89
Malawi 1997 14 73.3 72.9 76.3 7 084 394 6 041 012 1 051 581 14.84
Mozambique 1996 35 60.4 63.0 50.7 9 802 920 6 638 005 2 886 596 29.44 United Rebuplic of Tanzania
2000 28 43.9 41.8 52.7 14 792 544 10 169 318 4 936 666 33.37
Uganda 1999 14 39.6 39.3 41.6 8 561 520 7 319 023 1 246 557 14.55
Zambia 1996 43 72.6 73.0 71.9 6 689 654 3 813 932 2 868 691 42.88 1 In this study, household energy availability was computed using consumption/expenditure data from nationally
representative data sets. Total household energy availability was calculated as the sum of energy available from foods acquired for consumption in and out of the home (see Smith and Aduayom, 2003 for additional information on the methodology used). A household was considered energy deficient if its total household energy availability was lower than its total energy requirements (calculated using WHO 1985 recommended intakes (60); and using energy requirements specific to each household member, based on his/her age and gender distribution, and using a “light” activity level). The percentage of people who are food energy deficient is then calculated as the percentage of sample individuals who live in food energy deficient households, with appropriate corrections for survey sampling designs.
Source: Smith and Aduayom, 2003.
Globalization of food systems in developing countries: impact on food security and nutrition 55
Globalization, urbanization andnutritional change inthe developing world
Michelle A. Mendez and Barry M. Popkin1
INTRODUCTIONOver the past 15 years, there has been increasing evidence that the structure of dietary intakes and the prevalence of obesity around the developing world have been changing at an increasingly rapid pace (Popkin, 2002b). While there is some evidence to link urbanization with these changes, less is understood about the role of globalization. Urbanization is accompanied by shifts in a broad array of elements such as access to mass media, modern technologies related to work and leisure and transportation, and enhanced access to a variety of foods across all seasons of the year. Many of these changes may be attributable as well to the increased flow of goods, services and information associated with globalization. Increased globalization may bring shifts in occupational structures as industries develop and expand in response to world markets; greater access to internationalmass media programming; and enhanced access to non-traditional foods as a result of changing prices and production practices as well as trade. Because of the multiple shared paths through which urbanization and globalization may influence food availability and choices in developing countries, it is difficult to unravel the effects of the two sets of forces on diet and health.
The clustering of populations in urban centres affects dietary patterns by changing the way that people interact with their environments, as well as by changing the environments themselves in ways that transform food production and distribution systems. For example, urban living is associated with occupational patterns less compatible with home food production and consumption, and often with limited land availability for cultivation. Urbanization brings infrastructure and resources such as improved transportation and refrigeration systems. Today, in developing countries undergoing rapid urbanization combined with globalization, the process includes changes in the sociocultural environment such as mass media marketing and the widespread availability of less traditional foods, which play an important role in influencing tastes and preferences (Chopra, Galbraith and Darnton-Hill, 2002; Lang, 1999; Evans et al., 2001). Growing foreign investment has contributed to the rise of fast food restaurants and western-style supermarkets, which may also influence consumer food choices by offering greater variety, quality, convenience and competitive prices in high-value added foods, in addition to
1 Barry M. Popkin, Ph.D.
Professor of Nutrition Carolina Population Center CB # 8120 University Square University of North Carolina at Chapel Hill Chapel Hill, NC 27516-3997 Tel.: (919) 966-1732 Fax: 919-966-9159 (backup: 6638) E-mail: [email protected]
56 Globalization, urbanization and nutritional change in the developing world
perceived higher social desirability (Regmi and Gehlar, 2001; Reardon, Timmer and Berdegue, 2003). These changes in the food environment are occurring at a rapid pace. As developing countries become more urbanized, the changes are expanding beyond large urban centres and into smaller cities and towns, mirroring the pattern that occurred over time in industrialized countries. For example, in China, western-style supermarkets are now found in smaller cities and towns along the eastern coast and in the interior (Reardon, Timmer and Berdegue, 2003).
Several studies in developing countries have shown in the past that, compared with rural diets, urban diets tended to include higher levels of milled and polished grains (e.g. rice or wheat, rather than corn or millet), foods higher in fat (more animal products), sugar, food prepared away from the home, and processed foods (Popkin and Bisgrove, 1988). Over time, migrants to urban areas tend to adopt urban dietary patterns, although the timing of such changes has not been studied (Popkin and Bisgrove, 1988). However, as infrastructure and resources typical of urban areas become more widespread, the extent to which "urban" dietary patterns are being adopted in rural towns is not known. Residents of many rural areas are likely to be increasingly exposed to environmental factors that affect food choices, particularly in highly urbanized countries. To understand fully the nutritional effects of urbanization and globalization, it may become increasingly important to examine trends in diet and overweight in evolving rural environments as well as in urban communities. Multidimensional measures that more directly capture heterogeneity and change in levels of "urbanicity" may provide insights into the effects of urbanized ecologies on diet beyond those that can be gained using prevailing measures such as static urban-rural designations or population size and density (Mendez et al., 2003).
Little is known about how urbanization and globalization are affecting dietary patterns in lower-income groups (Drewnowski and Popkin, 1997; Popkin, 2002a). These forces may have positive effects on the poor by increasing incomes and reducing the prevalence of inadequate energy intakes and undernutrition (Sachs and Warner, 1995; Dollar, 2001). However, these effects may not be universal: several studies suggest that the benefits of globalization have been unequal, and that in some countries globalization has had little impact on poverty alleviation (Cook and Kirkpatrick, 1997; Cornia, 2001). Furthermore, along with reduced undernutrition, rising obesity has been observed in low-income groups in some developing countries (Monteiro, Wolney and Popkin, 2002; Monteiro et al., 2003). This suggests that the poor are increasingly adopting obesogenic diet and activity patterns, but there are few data about the nature of changing dietary behaviour, or the extent to which behavioural changes may be attributable to living in urban or urbanizing environments. Understanding the health and nutrition effects of urban environments on the poor is increasingly important, as the process of urbanization in many developing countries has included a massive shift of less advantaged groups to urban areas. In fact, in some countries, as urban populations surpass rural ones, the number of persons defined as living in poverty is greater in urban compared to rural areas (Haddad, Ruel and Garrett, 1999). In this paper, we examine the types of shifts in food availability, dietary intake patterns and obesity that have taken place in developing countries during a period of rapid globalization and urbanization.
Between 1960 and 2000 the proportion of the developing country population living in urban areas doubled, from 21.6 to 40.4 percent (United Nations Population Division, 2002). Recent changes have been particularly rapid in China, where the urban population increased by 39.8 percent between 1980 and 1990 (from 19.6 to 27.4 percent) and by another 20.7 percent from 1990 to 2000 (reaching 35.8 percent). In the Middle East, Latin America and Oceania, the pace of urbanization is slower, but 65-75 percent of the population in these regions resided in urban areas by the year 2000. These population shifts
Globalization of food systems in developing countries: impact on food security and nutrition 57
have been accompanied by accelerated globalization, as illustrated by factors such as large increases in foreign direct investment (from US$24 billion to $170 billion in 1990-98), and a doubling of merchandise exports and imports in the past two decades (World Bank, 2001).
The first part of this paper presents shifts in the availability of key food groups during this period of rapid change. We present information on regional shifts in edible oils, animal source foods (ASFs), fresh fruit and vegetables, and added sugars. Using case study data from China, we examine changes in food group intakes in greater detail, assessing the extent to which potentially obesogenic dietary patterns are emerging in rural as well as in urban areas. To illustrate better the effects of urbanizing environments, we present data on dietary patterns in urban and rural areas that differ in terms of infrastructure and resources. This case study also explores how food group consumption patterns have changed in low- and high-income groups in urban and rural settings. Finally, we assess some implications of these global dietary shifts by describing levels of under- and overweight in women living in urban and rural areas of developing countries. We describe how the prevalence of each type of malnutrition varies across countries at different levels of urbanization, as well as how prevalence in low versus high socio-economic status (SES) groups varies with urbanization. Aspects of urbanization and globalization that influence physical activity in addition to diet play a major role in the ongoing transition from underweight to overnutrition, but are not the focus of this paper.
DATA AND METHODS Global shifts in food available for consumption, 1961-2000Changes in global food availability were calculated using food balance sheet data and population estimates for developing countries between 1961 and 2000. These data were obtained from the Food and Agriculture Organization of the United Nations (FAO, 2001) (apps.fao.org). For each year, 1961, 1970, 1980, 1990 and 2000, the mean food availability per capita was calculated for each region. This was based on 118 countries of the developing world: 44 in sub-Saharan Africa, 15 in the Middle East, 34 in Latin America and the Caribbean and 25 in the Far East (including China). The added sugar category includes sugars and sweeteners; fruit excludes wine; vegetables exclude potatoes; edible oils are vegetable oils; dairy includes milk, yoghurt and cheese; meat includes bovine, sheep, pig, goat, poultry and other (but excludes animal source fats such as lard); fish includes fish and seafood. Animal source foods combine eggs, meat and poultry, fish and dairy products, but exclude animal source fats such as lard.
The China case study The case study uses data from the China Health and Nutrition Survey (CHNS) from 1991 to 1997. The CHNS was conducted in eight provinces across China. Multistage cluster sampling was used to select communities from areas that differ substantially with respect to economic and health status, as well as geography. Details on the sample and data collection methods have been published elsewhere (Entwisle et al., 1995; Guo et al.,1999), and are available online (www.cpc.unc.edu/projects/china/). Individual-level dietary intake data, collected using three consecutive 24-hour recalls, are used to estimate consumption trends in key food groups among Chinese adults aged 20 to 45 years. Added caloric sweetener data are not available as they are not found in the food composition table for China. Anthropometric data collected by trained interviewers were used to calculate body mass index (BMI) (weight in kg/height in m2), with which participants were
categorized as overweight or obese (BMI 25.0) or as underweight (BMI 18.5). Income was estimated based on earnings from market and non-market activities as well as
58 Globalization, urbanization and nutritional change in the developing world
subsidies. Urbanicity was characterized using the China urbanization index, a multidimensional index of infrastructure and resources in ten categories: population size, population density, access to markets, transportation, communications/media, economic factors, environment/sanitation, health, education, and housing quality (Mendez et al.,2003). The index was developed using data from community surveys, supplemented with household level information.
Nutritional status changes To analyse changes in under- and overweight, we used national data sets from surveys conducted between 1992 and 2000 in 36 developing countries: 20 in sub-Saharan Africa, eight in Latin America and the Caribbean (including Brazil and Mexico), five in Asia (including China and India), and three in North Africa and the Middle East. Many demographic health survey (DHS) data sets are not used because of a lack of appropriate maternal anthropometry data. The China and Mexico data sets are from national health and nutrition surveys conducted by these countries in 1997 and 1999, respectively (see for references on these two survey systems: Rivera et al., 2002; Popkin et al., 1993). All other national data sets correspond to standardized USAID/Macro DHSs conducted between 1992 and 2000 (Boerma and Sommerfelt, 1993). We used only the most recent data for countries in which two or more DHSs were conducted in this period. DHS data sets were downloaded from www.macroint.com/dhs/ or obtained directly from the state statistical offices (SSOs) that conducted the surveys.
We restricted analyses in all data sets to non-pregnant women aged 20 to 49 years. The average sample size was 4 266, ranging from 1 460 in Bolivia to 21 171 in Peru, with a total of 157 844 women studied. Average non-response rates were less than 0.2 percent for weight and height measurements and less than 0.7 percent for questions on SES. In the case of the DHS data, most women were mothers of children under five years of age. All analyses presented in this article were age-adjusted to allow for differences in age distribution between, and within, countries (Ahmad et al., 1999).
The overall prevalence of underweight (BMI 18.5) and overweight-plus-obesity (BMI > 25) was calculated for women in each country based on weight and height measurements. Prevalences were estimated for both urban and rural areas. We also calculated the social distribution of underweight and overweight-plus-obesity for each country, using country-specific indicators of SES – namely, the country’s quartiles of the women’s years of formal education. Since years of education are a numeric non-continuous variable, close to 25 percent of women in each country fall in the education quartiles. However, in some countries, women were highly concentrated in some education categories, and it was necessary to combine one or more quartiles. Prevalence figures were age-adjusted by the direct method, using the age distribution of the world population as a reference (Ahmad et al., 1999). We used survey-specific sample weights, so all estimates are nationally representative (except for the China survey, which only represents eight provinces).
We first tested the significance of differences in overweight (and underweight) prevalence in urban versus rural areas. Next, we tested the differences in overweight versus underweight prevalence within both urban and rural areas. Finally, we examined the magnitude and direction of the associations between SES and prevalence of malnutrition (underweight or overweight-plus-obesity) in each country, by calculating age-adjusted prevalence ratios (with 95 percent confidence intervals), comparing the highest to the lowest education quartile within urban and rural areas.
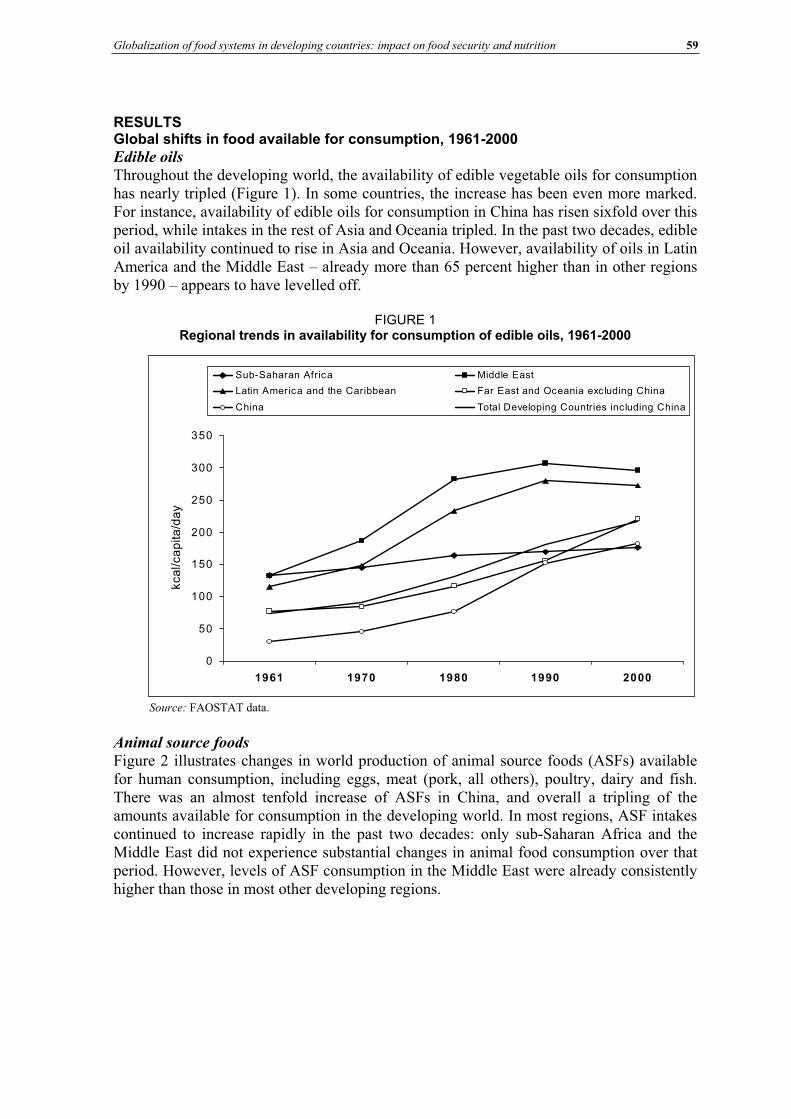
Globalization of food systems in developing countries: impact on food security and nutrition 59
RESULTS Global shifts in food available for consumption, 1961-2000
Edible oils
Throughout the developing world, the availability of edible vegetable oils for consumption has nearly tripled (Figure 1). In some countries, the increase has been even more marked. For instance, availability of edible oils for consumption in China has risen sixfold over this period, while intakes in the rest of Asia and Oceania tripled. In the past two decades, edible oil availability continued to rise in Asia and Oceania. However, availability of oils in Latin America and the Middle East – already more than 65 percent higher than in other regions by 1990 – appears to have levelled off.
FIGURE 1 Regional trends in availability for consumption of edible oils, 1961-2000
Source: FAOSTAT data.
Animal source foods
Figure 2 illustrates changes in world production of animal source foods (ASFs) available for human consumption, including eggs, meat (pork, all others), poultry, dairy and fish. There was an almost tenfold increase of ASFs in China, and overall a tripling of the amounts available for consumption in the developing world. In most regions, ASF intakes continued to increase rapidly in the past two decades: only sub-Saharan Africa and the Middle East did not experience substantial changes in animal food consumption over that period. However, levels of ASF consumption in the Middle East were already consistently higher than those in most other developing regions.
0
50
100
150
200
250
300
350
1961 1970 1980 1990 2000
kca
l/ca
pita
/da
y
Sub-Saharan Africa Middle East
Latin America and the Caribbean Far East and Oceania excluding China
China Total Developing Countries including China
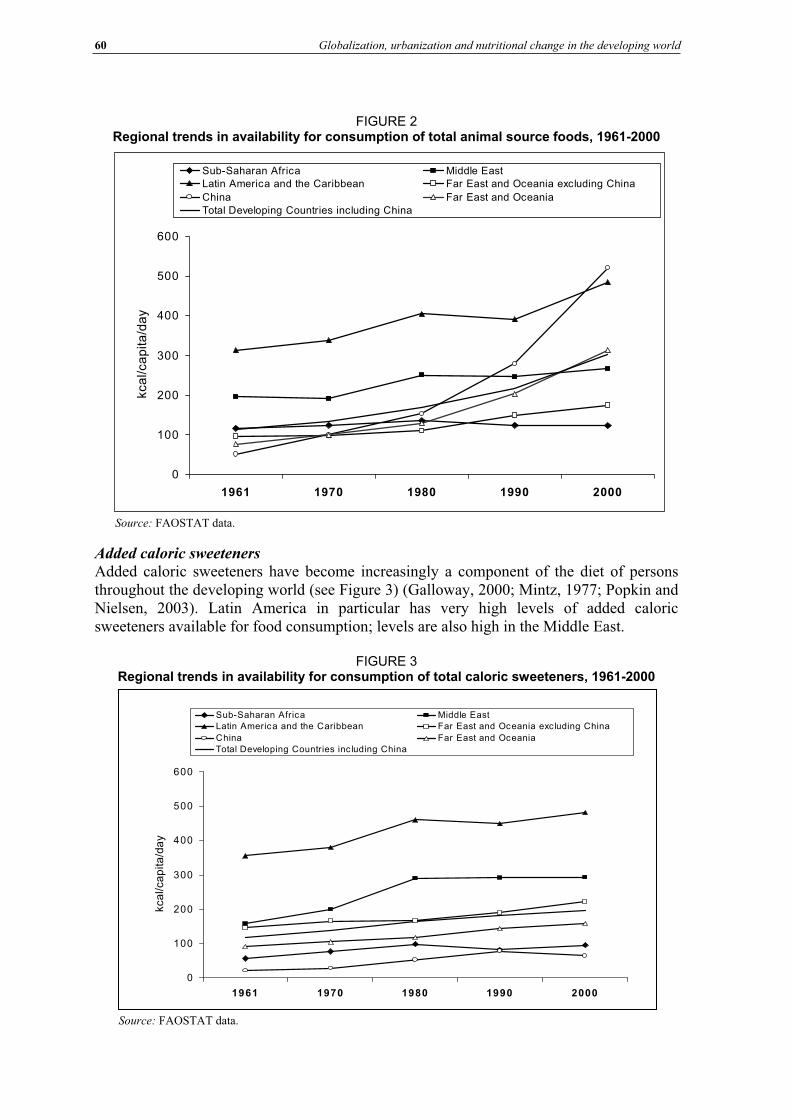
60 Globalization, urbanization and nutritional change in the developing world
FIGURE 2 Regional trends in availability for consumption of total animal source foods, 1961-2000
Source: FAOSTAT data.
Added caloric sweeteners
Added caloric sweeteners have become increasingly a component of the diet of persons throughout the developing world (see Figure 3) (Galloway, 2000; Mintz, 1977; Popkin and Nielsen, 2003). Latin America in particular has very high levels of added caloric sweeteners available for food consumption; levels are also high in the Middle East.
FIGURE 3 Regional trends in availability for consumption of total caloric sweeteners, 1961-2000
0
100
200
300
400
500
600
1961 1970 1980 1990 2000
kca
l/ca
pita
/da
y
Sub-Saharan Africa Middle East Latin America and the Caribbean Far East and Oceania excluding China
China Far East and Oceania
Total Developing Countries inc luding China
Source: FAOSTAT data.
0
100
200
300
400
500
600
1961 1970 1980 1990 2000
kca
l/ca
pita
/da
y
Sub-Saharan Africa Middle East Latin America and the Caribbean Far East and Oceania excluding China
China Far East and Oceania
Total Developing Countries including China
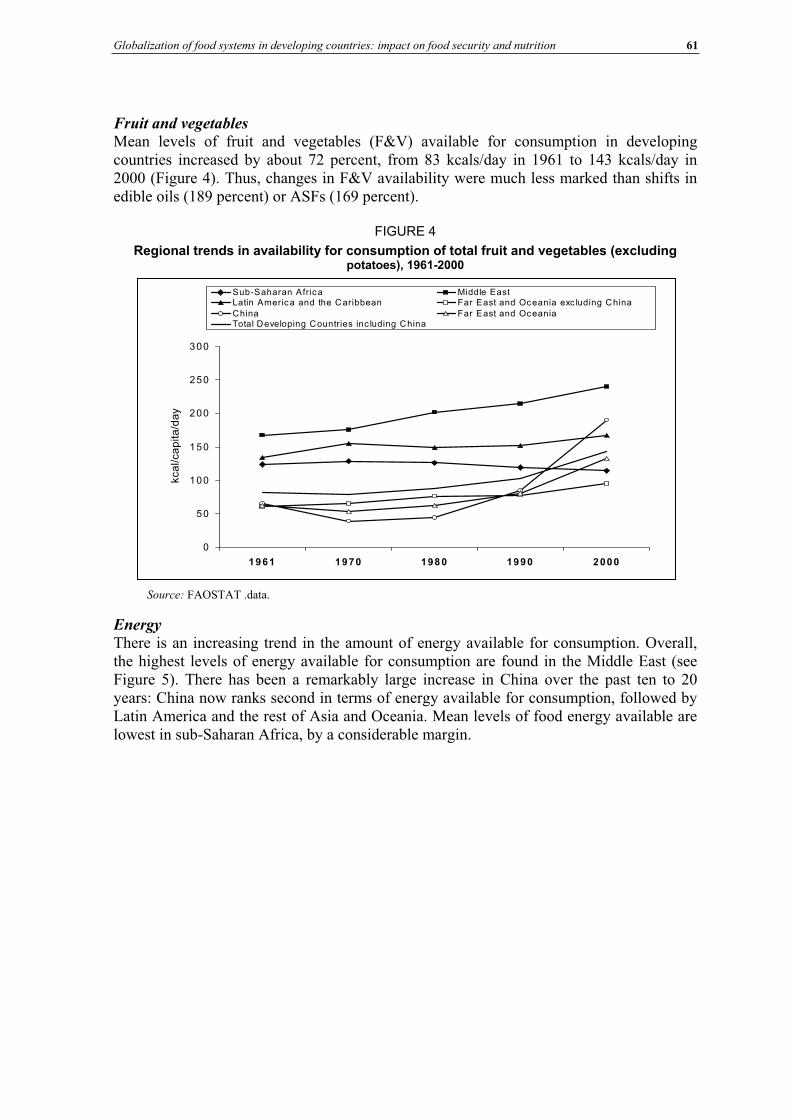
Globalization of food systems in developing countries: impact on food security and nutrition 61
Fruit and vegetables
Mean levels of fruit and vegetables (F&V) available for consumption in developing countries increased by about 72 percent, from 83 kcals/day in 1961 to 143 kcals/day in 2000 (Figure 4). Thus, changes in F&V availability were much less marked than shifts in edible oils (189 percent) or ASFs (169 percent).
FIGURE 4
Regional trends in availability for consumption of total fruit and vegetables (excluding potatoes), 1961-2000
0
50
100
150
200
250
300
1961 1 970 198 0 1990 2000
kca
l/ca
pita
/da
y
Sub-Saharan Africa Middle East Latin America and the Caribbean Far East and Oceania exc luding ChinaChina Far East and OceaniaTotal Developing Countries inc luding China
Energy
There is an increasing trend in the amount of energy available for consumption. Overall, the highest levels of energy available for consumption are found in the Middle East (see Figure 5). There has been a remarkably large increase in China over the past ten to 20 years: China now ranks second in terms of energy available for consumption, followed by Latin America and the rest of Asia and Oceania. Mean levels of food energy available are lowest in sub-Saharan Africa, by a considerable margin.
Source: FAOSTAT .data.
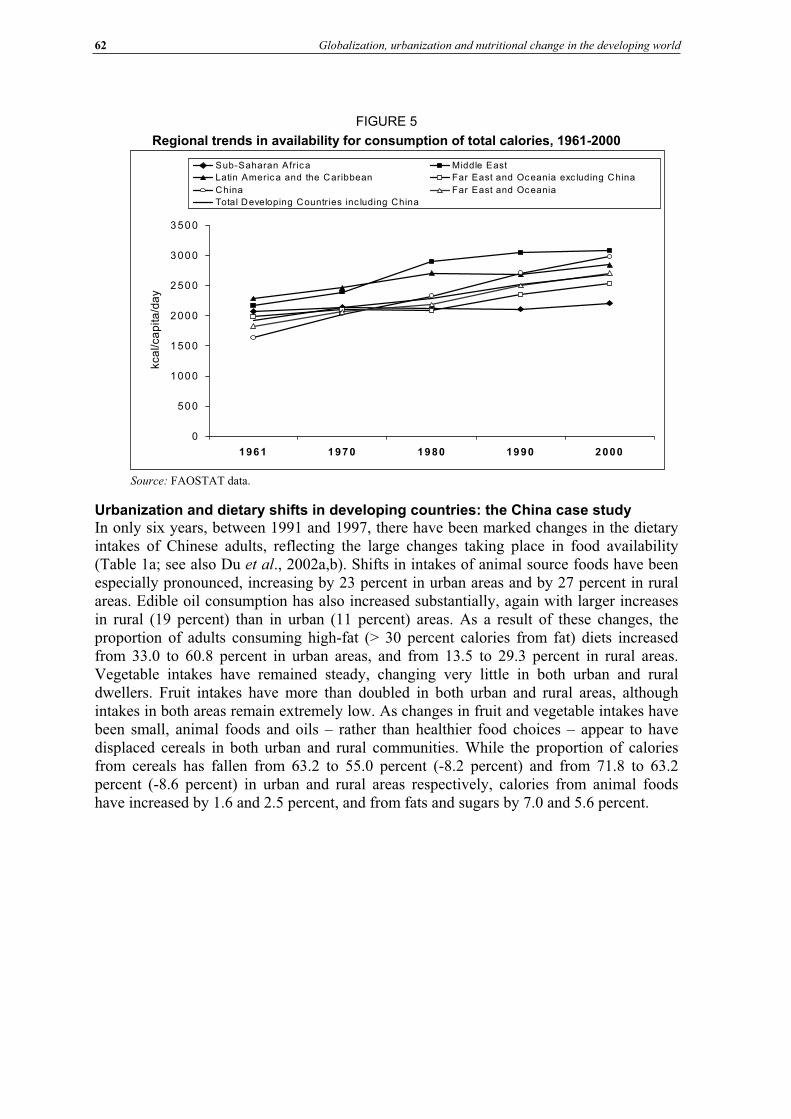
62 Globalization, urbanization and nutritional change in the developing world
FIGURE 5
Regional trends in availability for consumption of total calories, 1961-2000
Source: FAOSTAT data.
Urbanization and dietary shifts in developing countries: the China case study In only six years, between 1991 and 1997, there have been marked changes in the dietary intakes of Chinese adults, reflecting the large changes taking place in food availability (Table 1a; see also Du et al., 2002a,b). Shifts in intakes of animal source foods have been especially pronounced, increasing by 23 percent in urban areas and by 27 percent in rural areas. Edible oil consumption has also increased substantially, again with larger increases in rural (19 percent) than in urban (11 percent) areas. As a result of these changes, the proportion of adults consuming high-fat (> 30 percent calories from fat) diets increased from 33.0 to 60.8 percent in urban areas, and from 13.5 to 29.3 percent in rural areas. Vegetable intakes have remained steady, changing very little in both urban and rural dwellers. Fruit intakes have more than doubled in both urban and rural areas, although intakes in both areas remain extremely low. As changes in fruit and vegetable intakes have been small, animal foods and oils – rather than healthier food choices – appear to have displaced cereals in both urban and rural communities. While the proportion of calories from cereals has fallen from 63.2 to 55.0 percent (-8.2 percent) and from 71.8 to 63.2 percent (-8.6 percent) in urban and rural areas respectively, calories from animal foods have increased by 1.6 and 2.5 percent, and from fats and sugars by 7.0 and 5.6 percent.
0
500
1000
1500
2000
2500
3000
3500
1961 1970 1980 1990 2000
kca
l/ca
pita
/da
ySub-Saharan Africa Middle East
Latin Americ a and the Caribbean Far East and Oceania exc luding China
China Far East and Oceania
Total Developing Countr ies inc luding China
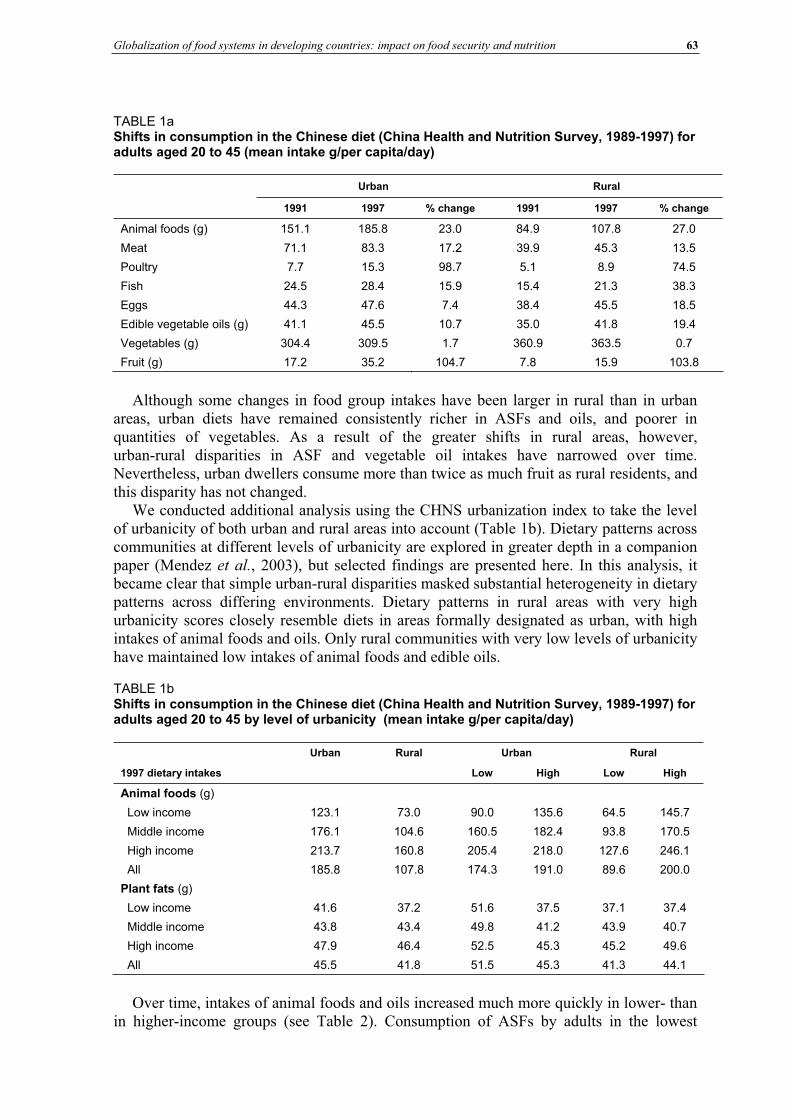
Globalization of food systems in developing countries: impact on food security and nutrition 63
TABLE 1aShifts in consumption in the Chinese diet (China Health and Nutrition Survey, 1989-1997) for adults aged 20 to 45 (mean intake g/per capita/day)
Urban Rural
1991 1997 % change 1991 1997 % change
Animal foods (g) 151.1 185.8 23.0 84.9 107.8 27.0
Meat 71.1 83.3 17.2 39.9 45.3 13.5
Poultry 7.7 15.3 98.7 5.1 8.9 74.5
Fish 24.5 28.4 15.9 15.4 21.3 38.3
Eggs 44.3 47.6 7.4 38.4 45.5 18.5
Edible vegetable oils (g) 41.1 45.5 10.7 35.0 41.8 19.4
Vegetables (g) 304.4 309.5 1.7 360.9 363.5 0.7
Fruit (g) 17.2 35.2 104.7 7.8 15.9 103.8
Although some changes in food group intakes have been larger in rural than in urban areas, urban diets have remained consistently richer in ASFs and oils, and poorer in quantities of vegetables. As a result of the greater shifts in rural areas, however, urban-rural disparities in ASF and vegetable oil intakes have narrowed over time. Nevertheless, urban dwellers consume more than twice as much fruit as rural residents, and this disparity has not changed.
We conducted additional analysis using the CHNS urbanization index to take the level of urbanicity of both urban and rural areas into account (Table 1b). Dietary patterns across communities at different levels of urbanicity are explored in greater depth in a companion paper (Mendez et al., 2003), but selected findings are presented here. In this analysis, it became clear that simple urban-rural disparities masked substantial heterogeneity in dietary patterns across differing environments. Dietary patterns in rural areas with very high urbanicity scores closely resemble diets in areas formally designated as urban, with high intakes of animal foods and oils. Only rural communities with very low levels of urbanicity have maintained low intakes of animal foods and edible oils.
TABLE 1b Shifts in consumption in the Chinese diet (China Health and Nutrition Survey, 1989-1997) for adults aged 20 to 45 by level of urbanicity (mean intake g/per capita/day)
Urban Rural Urban Rural
1997 dietary intakes Low High Low High
Animal foods (g)
Low income 123.1 73.0 90.0 135.6 64.5 145.7
Middle income 176.1 104.6 160.5 182.4 93.8 170.5
High income 213.7 160.8 205.4 218.0 127.6 246.1
All 185.8 107.8 174.3 191.0 89.6 200.0
Plant fats (g)
Low income 41.6 37.2 51.6 37.5 37.1 37.4
Middle income 43.8 43.4 49.8 41.2 43.9 40.7
High income 47.9 46.4 52.5 45.3 45.2 49.6
All 45.5 41.8 51.5 45.3 41.3 44.1
Over time, intakes of animal foods and oils increased much more quickly in lower- than in higher-income groups (see Table 2). Consumption of ASFs by adults in the lowest
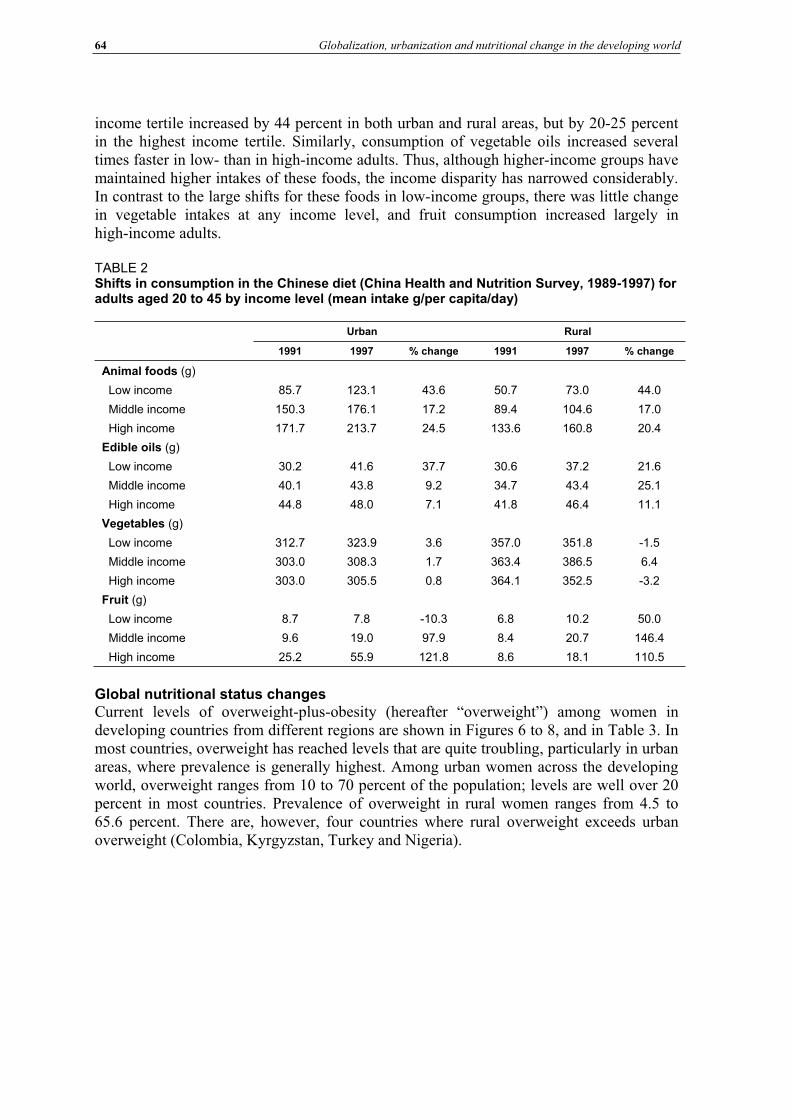
64 Globalization, urbanization and nutritional change in the developing world
income tertile increased by 44 percent in both urban and rural areas, but by 20-25 percent in the highest income tertile. Similarly, consumption of vegetable oils increased several times faster in low- than in high-income adults. Thus, although higher-income groups have maintained higher intakes of these foods, the income disparity has narrowed considerably. In contrast to the large shifts for these foods in low-income groups, there was little change in vegetable intakes at any income level, and fruit consumption increased largely in high-income adults.
TABLE 2 Shifts in consumption in the Chinese diet (China Health and Nutrition Survey, 1989-1997) for adults aged 20 to 45 by income level (mean intake g/per capita/day)
Urban Rural
1991 1997 % change 1991 1997 % change
Animal foods (g)
Low income 85.7 123.1 43.6 50.7 73.0 44.0
Middle income 150.3 176.1 17.2 89.4 104.6 17.0
High income 171.7 213.7 24.5 133.6 160.8 20.4
Edible oils (g)
Low income 30.2 41.6 37.7 30.6 37.2 21.6
Middle income 40.1 43.8 9.2 34.7 43.4 25.1
High income 44.8 48.0 7.1 41.8 46.4 11.1
Vegetables (g)
Low income 312.7 323.9 3.6 357.0 351.8 -1.5
Middle income 303.0 308.3 1.7 363.4 386.5 6.4
High income 303.0 305.5 0.8 364.1 352.5 -3.2
Fruit (g)
Low income 8.7 7.8 -10.3 6.8 10.2 50.0
Middle income 9.6 19.0 97.9 8.4 20.7 146.4
High income 25.2 55.9 121.8 8.6 18.1 110.5
Global nutritional status changes Current levels of overweight-plus-obesity (hereafter “overweight”) among women in developing countries from different regions are shown in Figures 6 to 8, and in Table 3. In most countries, overweight has reached levels that are quite troubling, particularly in urban areas, where prevalence is generally highest. Among urban women across the developing world, overweight ranges from 10 to 70 percent of the population; levels are well over 20 percent in most countries. Prevalence of overweight in rural women ranges from 4.5 to 65.6 percent. There are, however, four countries where rural overweight exceeds urban overweight (Colombia, Kyrgyzstan, Turkey and Nigeria).
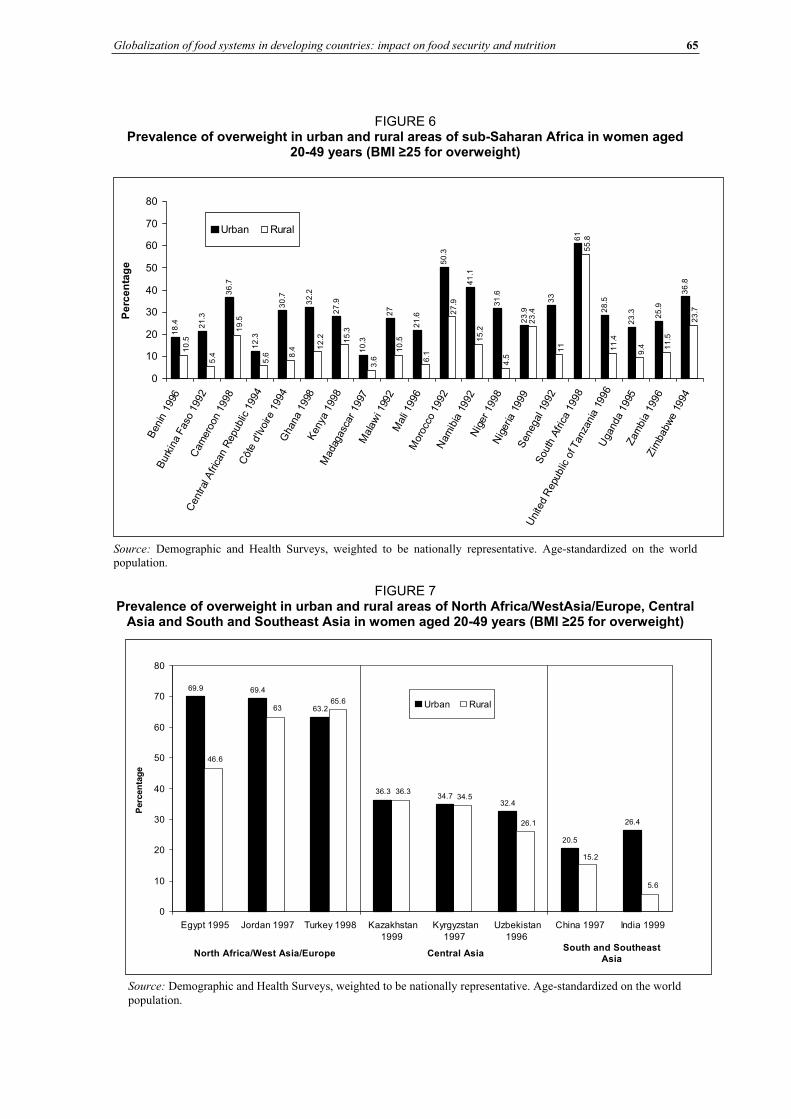
Globalization of food systems in developing countries: impact on food security and nutrition 65
FIGURE 6 Prevalence of overweight in urban and rural areas of sub-Saharan Africa in women aged
20-49 years (BMI 25 for overweight)
18
.4 21
.3
36
.7
12
.3
30
.7
32
.2
27
.9
10
.3
27
21
.6
50
.3
41
.1
31
.6
23
.9
33
61
28
.5
23
.3 25
.9
36
.8
23
.4
19
.5
5.4
10
.5
23
.7
11
.5
9.411
.4
55
.8
11
4.5
15
.2
27
.9
6.1
3.6
15
.3
12
.2
8.4
5.6
10
.5
0
10
20
30
40
50
60
70
80
Ben
in19
96
Bur
kina
Fas
o19
92C
amer
oon
1998
Cen
tral
Afric
anR
epub
lic19
94
Côt
ed'
Ivoi
re19
94G
hana
1998
Ken
ya19
98M
adag
asca
r19
97M
alaw
i 199
2M
ali 1
996
Mor
occo
1992
Nam
ibia
1992
Nig
er19
98N
iger
ia19
99S
eneg
al19
92S
outh
Afric
a19
98
Uni
ted
Rep
ublic
ofTan
zani
a19
96U
gand
a19
95Zam
bia
1996
Zim
babw
e19
94
Pe
rce
nta
ge
Urban Rural
Source: Demographic and Health Surveys, weighted to be nationally representative. Age-standardized on the world population.
FIGURE 7 Prevalence of overweight in urban and rural areas of North Africa/WestAsia/Europe, Central
Asia and South and Southeast Asia in women aged 20-49 years (BMI 25 for overweight)
69.9 69.4
63.2
36.334.7
32.4
20.5
26.4
65.663
46.6
5.6
15.2
26.1
34.536.3
0
10
20
30
40
50
60
70
80
Egypt 1995 Jordan 1997 Turkey 1998 Kazakhstan
1999
Kyrgyzstan
1997
Uzbekistan
1996
China 1997 India 1999
Perc
en
tag
e
Urban Rural
North Africa/West Asia/Europe Central AsiaSouth and Southeast
Asia
Source: Demographic and Health Surveys, weighted to be nationally representative. Age-standardized on the world
population.
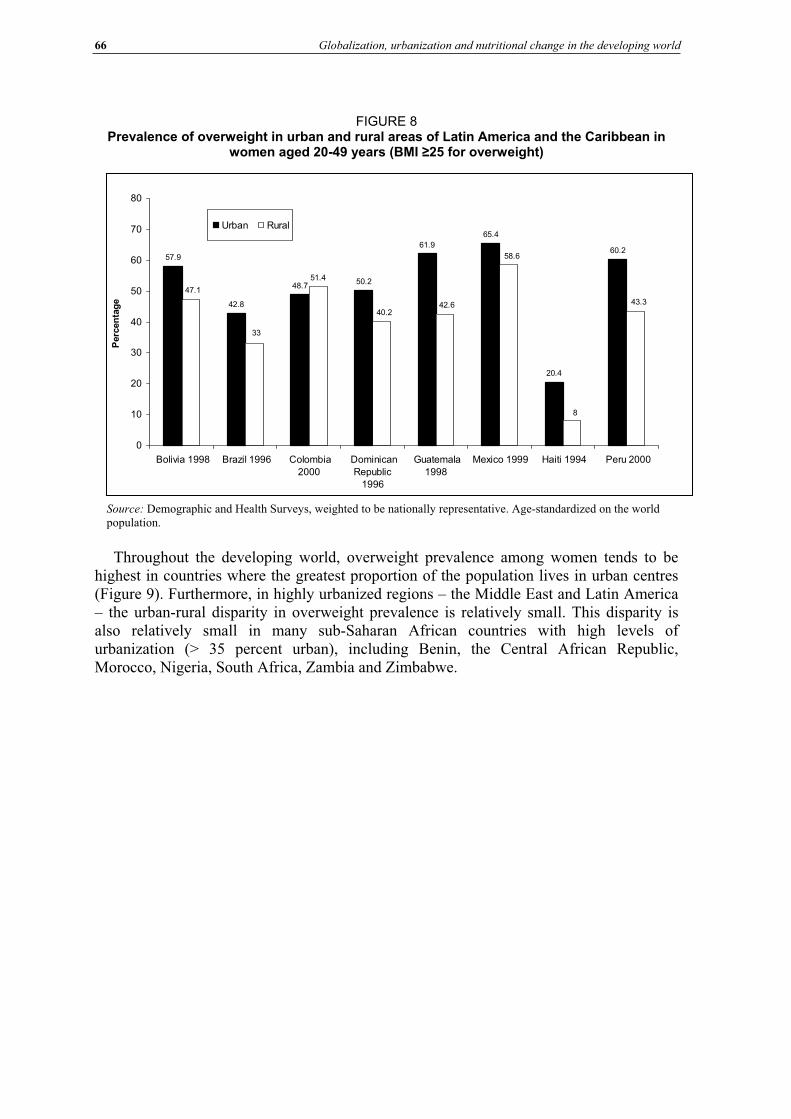
66 Globalization, urbanization and nutritional change in the developing world
FIGURE 8 Prevalence of overweight in urban and rural areas of Latin America and the Caribbean in
women aged 20-49 years (BMI 25 for overweight)
57.9
42.8
48.750.2
61.9
65.4
20.4
60.2
51.4
33
47.1
43.3
8
58.6
42.640.2
0
10
20
30
40
50
60
70
80
Bolivia 1998 Brazil 1996 Colombia
2000
Dominican
Republic
1996
Guatemala
1998
Mexico 1999 Haiti 1994 Peru 2000
Perc
en
tag
e
Urban Rural
Source: Demographic and Health Surveys, weighted to be nationally representative. Age-standardized on the world population.
Throughout the developing world, overweight prevalence among women tends to be highest in countries where the greatest proportion of the population lives in urban centres (Figure 9). Furthermore, in highly urbanized regions – the Middle East and Latin America – the urban-rural disparity in overweight prevalence is relatively small. This disparity is also relatively small in many sub-Saharan African countries with high levels of urbanization (> 35 percent urban), including Benin, the Central African Republic, Morocco, Nigeria, South Africa, Zambia and Zimbabwe.
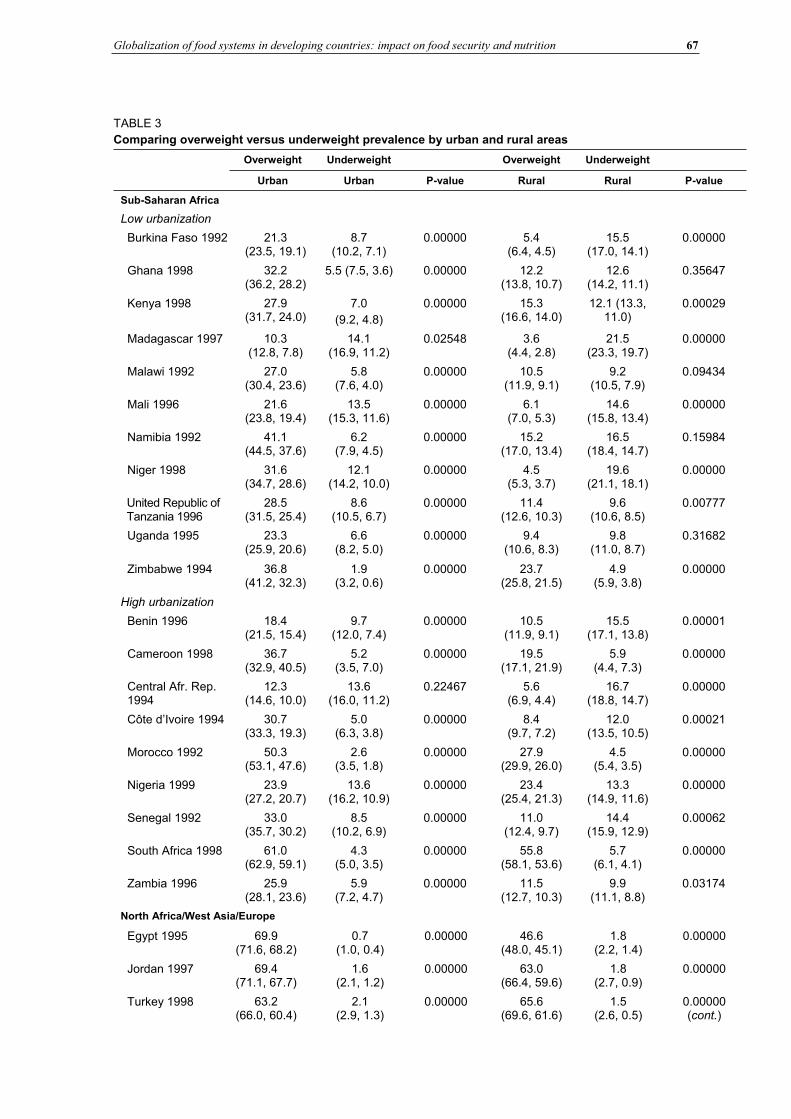
Globalization of food systems in developing countries: impact on food security and nutrition 67
TABLE 3
Comparing overweight versus underweight prevalence by urban and rural areas
Overweight Underweight Overweight Underweight
Urban Urban P-value Rural Rural P-value
Sub-Saharan Africa
Low urbanization
Burkina Faso 1992 21.3(23.5, 19.1)
8.7(10.2, 7.1)
0.00000 5.4(6.4, 4.5)
15.5(17.0, 14.1)
0.00000
Ghana 1998 32.2(36.2, 28.2)
5.5 (7.5, 3.6) 0.00000 12.2(13.8, 10.7)
12.6(14.2, 11.1)
0.35647
Kenya 1998 27.9(31.7, 24.0)
7.0
(9.2, 4.8)
0.00000 15.3(16.6, 14.0)
12.1 (13.3, 11.0)
0.00029
Madagascar 1997 10.3(12.8, 7.8)
14.1(16.9, 11.2)
0.02548 3.6(4.4, 2.8)
21.5(23.3, 19.7)
0.00000
Malawi 1992 27.0(30.4, 23.6)
5.8(7.6, 4.0)
0.00000 10.5(11.9, 9.1)
9.2(10.5, 7.9)
0.09434
Mali 1996 21.6(23.8, 19.4)
13.5(15.3, 11.6)
0.00000 6.1(7.0, 5.3)
14.6(15.8, 13.4)
0.00000
Namibia 1992 41.1(44.5, 37.6)
6.2(7.9, 4.5)
0.00000 15.2(17.0, 13.4)
16.5(18.4, 14.7)
0.15984
Niger 1998 31.6(34.7, 28.6)
12.1(14.2, 10.0)
0.00000 4.5(5.3, 3.7)
19.6(21.1, 18.1)
0.00000
United Republic of Tanzania 1996
28.5(31.5, 25.4)
8.6(10.5, 6.7)
0.00000 11.4(12.6, 10.3)
9.6(10.6, 8.5)
0.00777
Uganda 1995 23.3(25.9, 20.6)
6.6(8.2, 5.0)
0.00000 9.4(10.6, 8.3)
9.8(11.0, 8.7)
0.31682
Zimbabwe 1994 36.8(41.2, 32.3)
1.9(3.2, 0.6)
0.00000 23.7(25.8, 21.5)
4.9(5.9, 3.8)
0.00000
High urbanization
Benin 1996 18.4(21.5, 15.4)
9.7(12.0, 7.4)
0.00000 10.5(11.9, 9.1)
15.5(17.1, 13.8)
0.00001
Cameroon 1998 36.7(32.9, 40.5)
5.2(3.5, 7.0)
0.00000 19.5(17.1, 21.9)
5.9(4.4, 7.3)
0.00000
Central Afr. Rep. 1994
12.3(14.6, 10.0)
13.6(16.0, 11.2)
0.22467 5.6(6.9, 4.4)
16.7(18.8, 14.7)
0.00000
Côte d’Ivoire 1994 30.7(33.3, 19.3)
5.0(6.3, 3.8)
0.00000 8.4(9.7, 7.2)
12.0(13.5, 10.5)
0.00021
Morocco 1992 50.3(53.1, 47.6)
2.6(3.5, 1.8)
0.00000 27.9(29.9, 26.0)
4.5(5.4, 3.5)
0.00000
Nigeria 1999 23.9(27.2, 20.7)
13.6(16.2, 10.9)
0.00000 23.4(25.4, 21.3)
13.3(14.9, 11.6)
0.00000
Senegal 1992 33.0(35.7, 30.2)
8.5(10.2, 6.9)
0.00000 11.0(12.4, 9.7)
14.4(15.9, 12.9)
0.00062
South Africa 1998 61.0(62.9, 59.1)
4.3(5.0, 3.5)
0.00000 55.8(58.1, 53.6)
5.7(6.1, 4.1)
0.00000
Zambia 1996 25.9(28.1, 23.6)
5.9(7.2, 4.7)
0.00000 11.5(12.7, 10.3)
9.9(11.1, 8.8)
0.03174
North Africa/West Asia/Europe
Egypt 1995 69.9(71.6, 68.2)
0.7(1.0, 0.4)
0.00000 46.6(48.0, 45.1)
1.8(2.2, 1.4)
0.00000
Jordan 1997 69.4(71.1, 67.7)
1.6(2.1, 1.2)
0.00000 63.0(66.4, 59.6)
1.8(2.7, 0.9)
0.00000
Turkey 1998 63.2(66.0, 60.4)
2.1(2.9, 1.3)
0.00000 65.6(69.6, 61.6)
1.5(2.6, 0.5)
0.00000 (cont.)
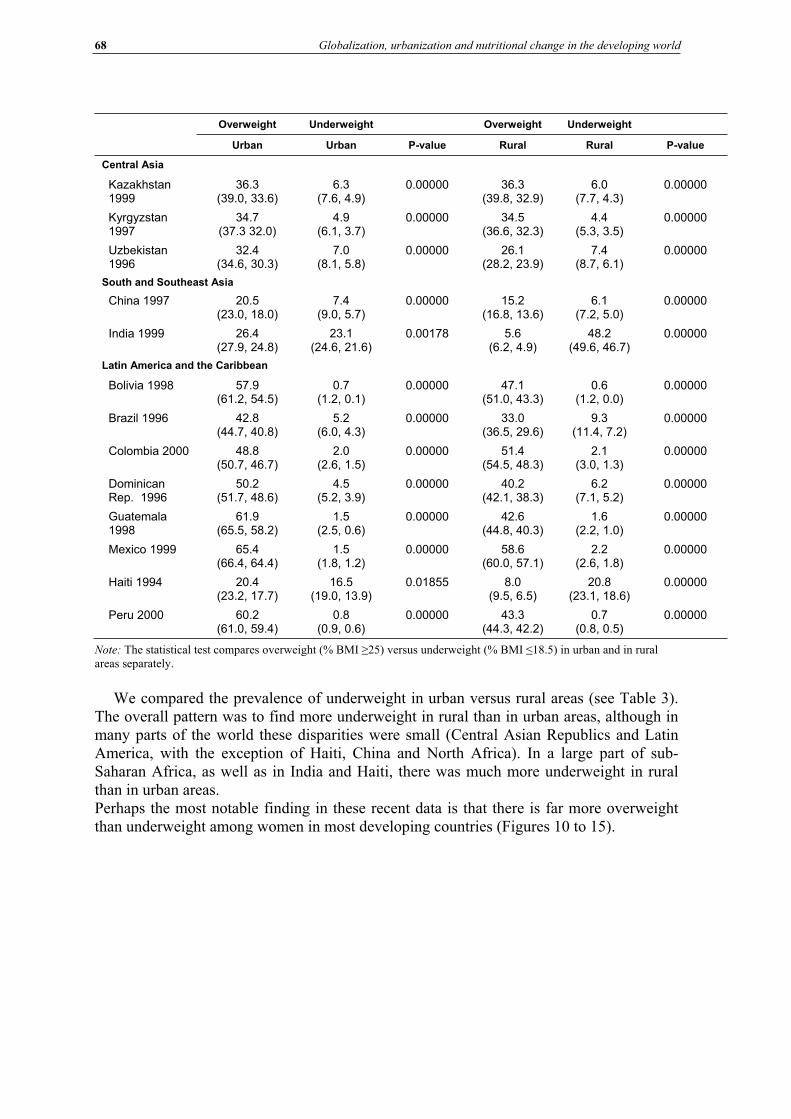
68 Globalization, urbanization and nutritional change in the developing world
Overweight Underweight Overweight Underweight
Urban Urban P-value Rural Rural P-value
Central Asia
Kazakhstan 1999
36.3(39.0, 33.6)
6.3(7.6, 4.9)
0.00000 36.3(39.8, 32.9)
6.0(7.7, 4.3)
0.00000
Kyrgyzstan 1997
34.7(37.3 32.0)
4.9(6.1, 3.7)
0.00000 34.5(36.6, 32.3)
4.4(5.3, 3.5)
0.00000
Uzbekistan 1996
32.4(34.6, 30.3)
7.0(8.1, 5.8)
0.00000 26.1(28.2, 23.9)
7.4(8.7, 6.1)
0.00000
South and Southeast Asia
China 1997 20.5(23.0, 18.0)
7.4(9.0, 5.7)
0.00000 15.2(16.8, 13.6)
6.1(7.2, 5.0)
0.00000
India 1999 26.4(27.9, 24.8)
23.1(24.6, 21.6)
0.00178 5.6(6.2, 4.9)
48.2(49.6, 46.7)
0.00000
Latin America and the Caribbean
Bolivia 1998 57.9(61.2, 54.5)
0.7(1.2, 0.1)
0.00000 47.1(51.0, 43.3)
0.6(1.2, 0.0)
0.00000
Brazil 1996 42.8(44.7, 40.8)
5.2(6.0, 4.3)
0.00000 33.0(36.5, 29.6)
9.3(11.4, 7.2)
0.00000
Colombia 2000 48.8(50.7, 46.7)
2.0(2.6, 1.5)
0.00000 51.4(54.5, 48.3)
2.1(3.0, 1.3)
0.00000
Dominican Rep. 1996
50.2(51.7, 48.6)
4.5(5.2, 3.9)
0.00000 40.2(42.1, 38.3)
6.2(7.1, 5.2)
0.00000
Guatemala 1998
61.9(65.5, 58.2)
1.5(2.5, 0.6)
0.00000 42.6(44.8, 40.3)
1.6(2.2, 1.0)
0.00000
Mexico 1999 65.4(66.4, 64.4)
1.5(1.8, 1.2)
0.00000 58.6(60.0, 57.1)
2.2(2.6, 1.8)
0.00000
Haiti 1994 20.4(23.2, 17.7)
16.5(19.0, 13.9)
0.01855 8.0(9.5, 6.5)
20.8(23.1, 18.6)
0.00000
Peru 2000 60.2(61.0, 59.4)
0.8(0.9, 0.6)
0.00000 43.3(44.3, 42.2)
0.7(0.8, 0.5)
0.00000
Note: The statistical test compares overweight (% BMI 25) versus underweight (% BMI 18.5) in urban and in rural areas separately.
We compared the prevalence of underweight in urban versus rural areas (see Table 3). The overall pattern was to find more underweight in rural than in urban areas, although in many parts of the world these disparities were small (Central Asian Republics and Latin America, with the exception of Haiti, China and North Africa). In a large part of sub-Saharan Africa, as well as in India and Haiti, there was much more underweight in rural than in urban areas.Perhaps the most notable finding in these recent data is that there is far more overweight than underweight among women in most developing countries (Figures 10 to 15).
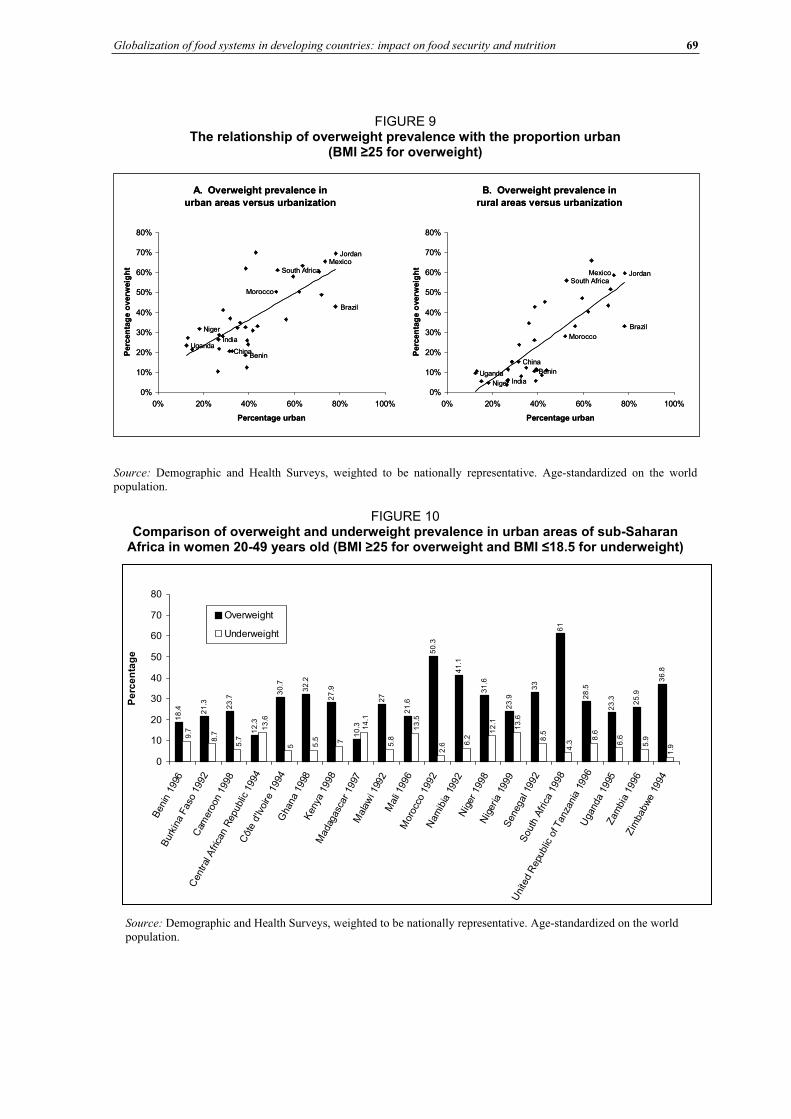
Globalization of food systems in developing countries: impact on food security and nutrition 69
FIGURE 9 The relationship of overweight prevalence with the proportion urban
(BMI 25 for overweight)
A. Overweight prevalence in
urban areas versus urbanization
China
JordanMexico
Brazil
Benin
Morocco
South Africa
India
Niger
Uganda
0%
10%
20%
30%
40%
50%
60%
70%
80%
0% 20% 40% 60% 80% 100%
Percentage urban
Perc
en
tag
e o
verw
eig
ht
B. Overweight prevalence in
rural areas versus urbanization
Uganda
Niger India
South Africa
Morocco
Benin
Brazil
Mexico Jordan
China
0%
10%
20%
30%
40%
50%
60%
70%
80%
0% 20% 40% 60% 80% 100%
Percentage urbanP
erc
en
tag
e o
verw
eig
ht
Source: Demographic and Health Surveys, weighted to be nationally representative. Age-standardized on the world population.
FIGURE 10 Comparison of overweight and underweight prevalence in urban areas of sub-Saharan
Africa in women 20-49 years old (BMI 25 for overweight and BMI 18.5 for underweight)
18
.4 21
.3
23
.7
12
.3
30
.7
32
.2
27
.9
10
.3
27
21
.6
50
.3
41
.1
31
.6
23
.9
33
61
28
.5
23
.3 25
.9
36
.81
.9
7 5.96.68
.6
4.3
8.5
13
.6
12
.1
6.2
2.6
13
.5
5.8
14
.1
5.5
5
13
.6
5.78
.79.7
0
10
20
30
40
50
60
70
80
Ben
in19
96
Bur
kina
Fas
o19
92C
amer
oon
1998
Cen
tral
Afric
anR
epub
lic19
94
Côt
ed'
Ivoi
re19
94G
hana
1998
Ken
ya19
98M
adag
asca
r19
97M
alaw
i 199
2M
ali 1
996
Mor
occo
1992
Nam
ibia
1992
Nig
er19
98N
iger
ia19
99S
eneg
al19
92S
outh
Afric
a19
98
Uni
ted
Rep
ublic
ofTan
zani
a19
96U
gand
a19
95Zam
bia
1996
Zim
babw
e19
94
Pe
rce
nta
ge
Overweight
Underweight
Source: Demographic and Health Surveys, weighted to be nationally representative. Age-standardized on the world population.
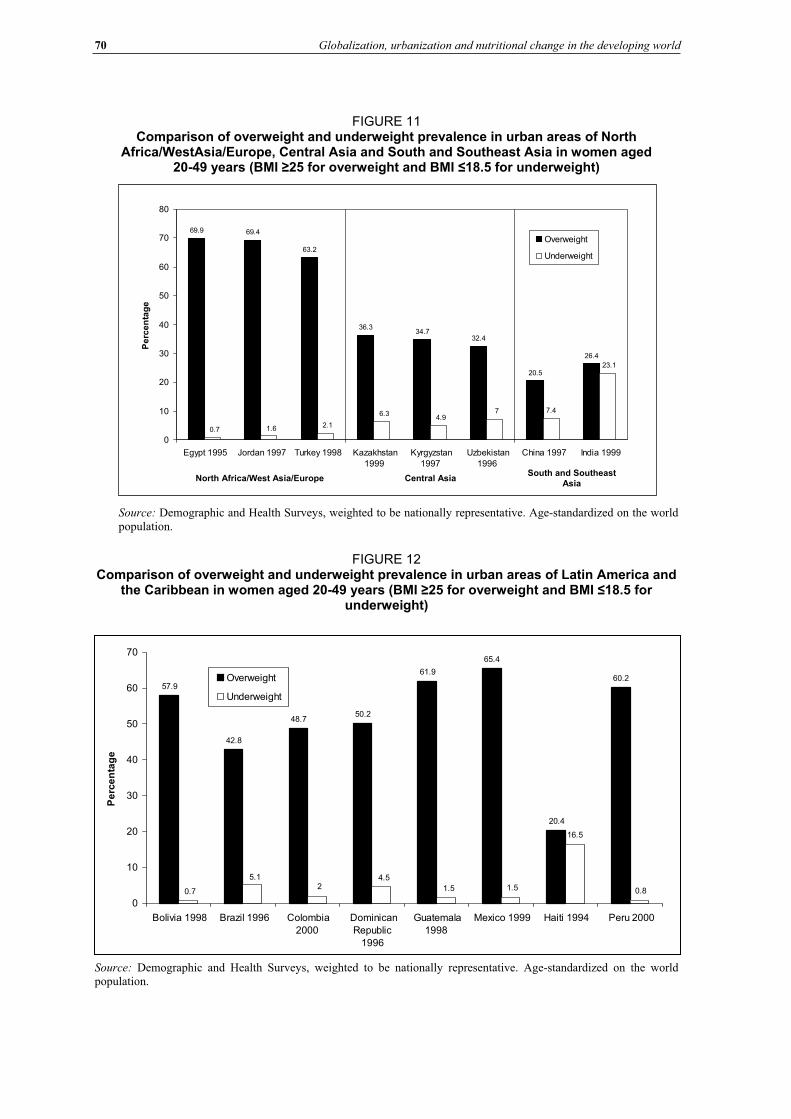
70 Globalization, urbanization and nutritional change in the developing world
FIGURE 11 Comparison of overweight and underweight prevalence in urban areas of North
Africa/WestAsia/Europe, Central Asia and South and Southeast Asia in women aged 20-49 years (BMI 25 for overweight and BMI 18.5 for underweight)
69.9 69.4
63.2
36.334.7
32.4
20.5
26.4
7.4
23.1
74.9
6.3
2.11.60.7
0
10
20
30
40
50
60
70
80
Egypt 1995 Jordan 1997 Turkey 1998 Kazakhstan
1999
Kyrgyzstan
1997
Uzbekistan
1996
China 1997 India 1999
Pe
rce
nta
ge
Overweight
Underweight
North Africa/West Asia/Europe Central AsiaSouth and Southeast
Asia
Source: Demographic and Health Surveys, weighted to be nationally representative. Age-standardized on the world population.
FIGURE 12 Comparison of overweight and underweight prevalence in urban areas of Latin America and
the Caribbean in women aged 20-49 years (BMI 25 for overweight and BMI 18.5 for underweight)
57.9
42.8
48.750.2
61.9
65.4
20.4
60.2
16.5
0.81.51.5
4.52
5.1
0.7
0
10
20
30
40
50
60
70
Bolivia 1998 Brazil 1996 Colombia
2000
Dominican
Republic
1996
Guatemala
1998
Mexico 1999 Haiti 1994 Peru 2000
Pe
rce
nta
ge
Overweight
Underweight
Source: Demographic and Health Surveys, weighted to be nationally representative. Age-standardized on the world population.
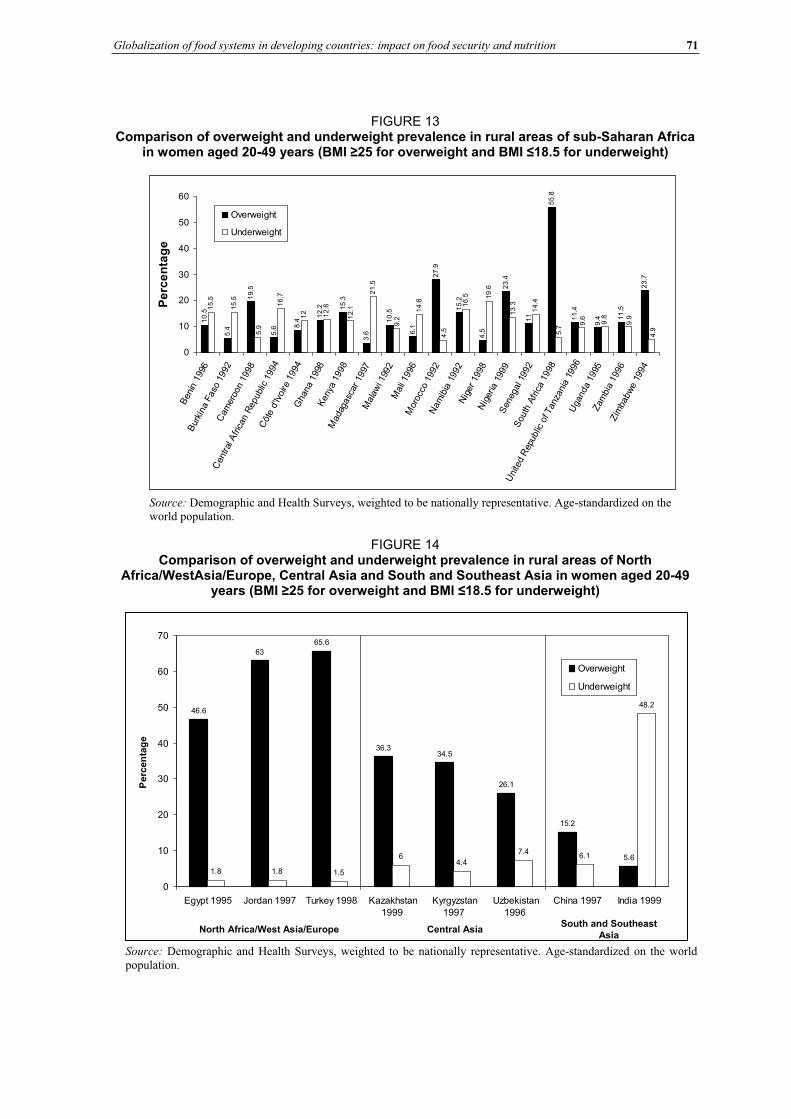
Globalization of food systems in developing countries: impact on food security and nutrition 71
FIGURE 13 Comparison of overweight and underweight prevalence in rural areas of sub-Saharan Africa
in women aged 20-49 years (BMI 25 for overweight and BMI 18.5 for underweight)
10
.5
5.4
19
.5
5.6 8
.4
12
.2 15
.3
3.6
10
.5
6.1
27
.9
15
.2
4.5
23
.4
11
55
.8
11
.4
9.4 1
1.5
23
.7
15
.5
15
.5
16
.7
12 12
.6
21
.5
14
.6 16
.5 19
.6
14
.4
9.8
5.9
12
.1
9.2
4.5
13
.3
5.7
9.6
9.9
4.9
0
10
20
30
40
50
60
Ben
in199
6
Bur
kina
Faso
1992
Cam
eroo
n19
98
Cen
tral
Afric
anR
epub
lic19
94
Côt
ed'
Ivoire
1994
Gha
na
1998
Keny
a19
98
Mad
agasc
ar19
97 M
ala
wi 1
992
Mal
i 199
6M
oroc
co19
92N
am
ibia
1992
Nig
er19
98 N
iger
ia19
99S
eneg
al19
92
Sou
thAfric
a19
98
Uni
ted
Rep
ublic
of T
anza
nia
1996
Uga
nda
1995
Zam
bia
199
6Zim
babw
e19
94
Pe
rce
nta
ge
Overweight
Underweight
Source: Demographic and Health Surveys, weighted to be nationally representative. Age-standardized on the world population.
FIGURE 14 Comparison of overweight and underweight prevalence in rural areas of North
Africa/WestAsia/Europe, Central Asia and South and Southeast Asia in women aged 20-49 years (BMI 25 for overweight and BMI 18.5 for underweight)
46.6
63
65.6
36.334.5
26.1
15.2
5.6
1.8 1.8 1.5
64.4
7.46.1
48.2
0
10
20
30
40
50
60
70
Egypt 1995 Jordan 1997 Turkey 1998 Kazakhstan
1999
Kyrgyzstan
1997
Uzbekistan
1996
China 1997 India 1999
Pe
rce
nta
ge
Overweight
Underweight
North Africa/West Asia/Europe Central AsiaSouth and Southeast
Asia
Source: Demographic and Health Surveys, weighted to be nationally representative. Age-standardized on the world population.
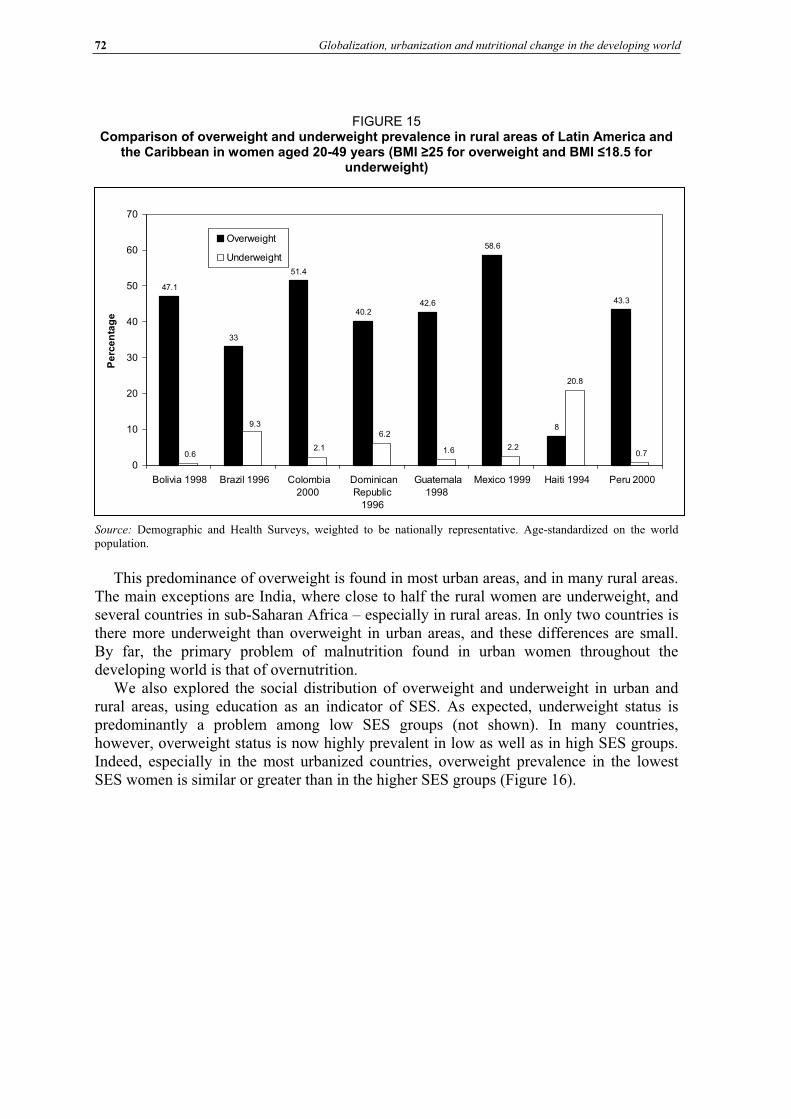
72 Globalization, urbanization and nutritional change in the developing world
FIGURE 15 Comparison of overweight and underweight prevalence in rural areas of Latin America and
the Caribbean in women aged 20-49 years (BMI 25 for overweight and BMI 18.5 for underweight)
47.1
33
51.4
40.242.6
58.6
8
43.3
20.8
0.72.21.6
6.2
2.1
9.3
0.6
0
10
20
30
40
50
60
70
Bolivia 1998 Brazil 1996 Colombia
2000
Dominican
Republic
1996
Guatemala
1998
Mexico 1999 Haiti 1994 Peru 2000
Pe
rce
nta
ge
Overweight
Underweight
Source: Demographic and Health Surveys, weighted to be nationally representative. Age-standardized on the world population.
This predominance of overweight is found in most urban areas, and in many rural areas. The main exceptions are India, where close to half the rural women are underweight, and several countries in sub-Saharan Africa – especially in rural areas. In only two countries is there more underweight than overweight in urban areas, and these differences are small. By far, the primary problem of malnutrition found in urban women throughout the developing world is that of overnutrition.
We also explored the social distribution of overweight and underweight in urban and rural areas, using education as an indicator of SES. As expected, underweight status is predominantly a problem among low SES groups (not shown). In many countries, however, overweight status is now highly prevalent in low as well as in high SES groups. Indeed, especially in the most urbanized countries, overweight prevalence in the lowest SES women is similar or greater than in the higher SES groups (Figure 16).
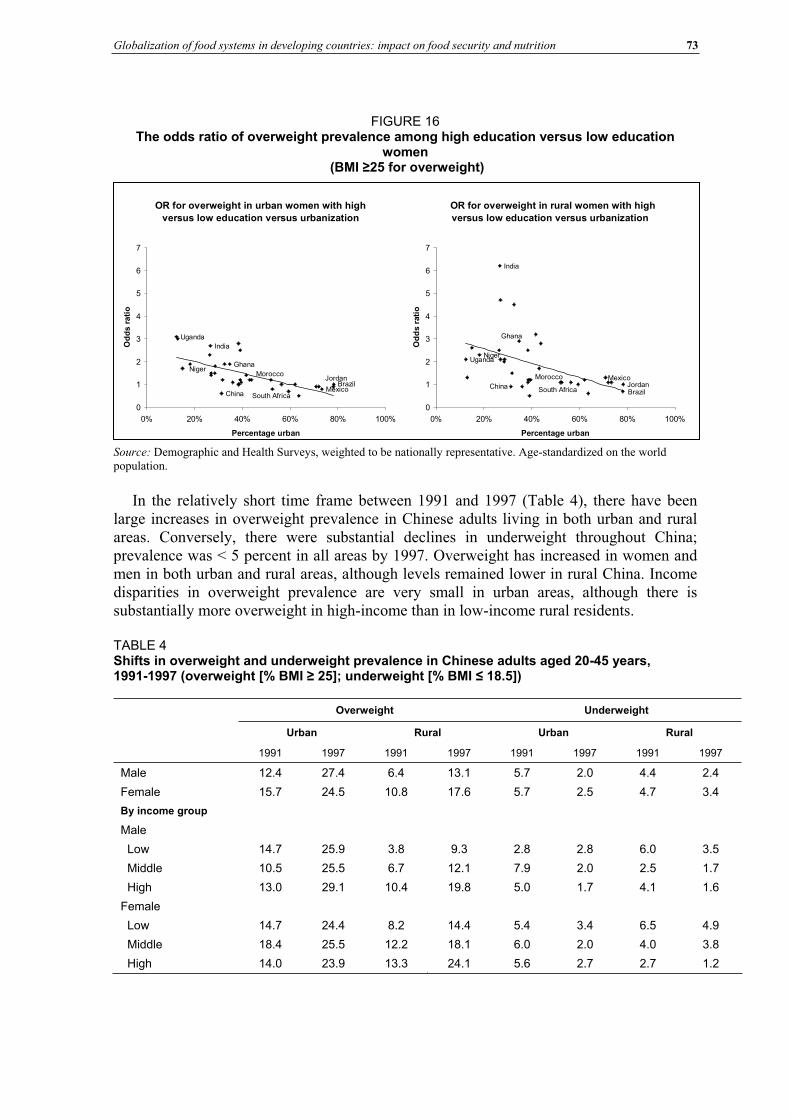
Globalization of food systems in developing countries: impact on food security and nutrition 73
FIGURE 16 The odds ratio of overweight prevalence among high education versus low education
women (BMI 25 for overweight)
OR for overweight in urban women with high
versus low education versus urbanization
Ghana
China
Jordan
MexicoBrazil
Morocco
South Africa
India
Niger
Uganda
0
1
2
3
4
5
6
7
0% 20% 40% 60% 80% 100%
Percentage urban
Od
ds r
ati
o
OR for overweight in rural women with high
versus low education versus urbanization
UgandaNiger
India
South Africa
Morocco
Brazil
MexicoJordanChina
Ghana
0
1
2
3
4
5
6
7
0% 20% 40% 60% 80% 100%
Percentage urban
Od
ds r
ati
o
Source: Demographic and Health Surveys, weighted to be nationally representative. Age-standardized on the world population.
In the relatively short time frame between 1991 and 1997 (Table 4), there have been large increases in overweight prevalence in Chinese adults living in both urban and rural areas. Conversely, there were substantial declines in underweight throughout China; prevalence was < 5 percent in all areas by 1997. Overweight has increased in women and men in both urban and rural areas, although levels remained lower in rural China. Income disparities in overweight prevalence are very small in urban areas, although there is substantially more overweight in high-income than in low-income rural residents.
TABLE 4 Shifts in overweight and underweight prevalence in Chinese adults aged 20-45 years, 1991-1997 (overweight [% BMI 25]; underweight [% BMI 18.5])
Overweight Underweight
Urban Rural Urban Rural
1991 1997 1991 1997 1991 1997 1991 1997
Male 12.4 27.4 6.4 13.1 5.7 2.0 4.4 2.4
Female 15.7 24.5 10.8 17.6 5.7 2.5 4.7 3.4
By income group
Male
Low 14.7 25.9 3.8 9.3 2.8 2.8 6.0 3.5
Middle 10.5 25.5 6.7 12.1 7.9 2.0 2.5 1.7
High 13.0 29.1 10.4 19.8 5.0 1.7 4.1 1.6
Female
Low 14.7 24.4 8.2 14.4 5.4 3.4 6.5 4.9
Middle 18.4 25.5 12.2 18.1 6.0 2.0 4.0 3.8
High 14.0 23.9 13.3 24.1 5.6 2.7 2.7 1.2
74 Globalization, urbanization and nutritional change in the developing world
CONCLUSIONS AND POLICY RECOMMENDATIONS The effects of urbanization and globalization on dietary patterns and nutritional status in developing countries are complex. These forces are associated with potentially beneficial dietary shifts such as increases in energy sufficiency and greater consumption of fruit, but also appear to promote potentially obesogenic shifts such as increased intakes of edible oils, animal foods and caloric sweeteners. While there have been substantial reductions in undernutrition in this period of rapid development and social change, overweight has become an increasing problem. Among adult women, overweight now exceeds underweight in almost all developing countries, particularly in the most urbanized ones. Food availability and intake data suggest that adverse shifts in dietary composition are taking place at a much higher speed than potentially beneficial changes: there has been relatively little change in the levels of fruit and vegetables, but very large increases in edible oils, ASFs and added sugar and caloric sweeteners over short periods of time. Numerous studies have shown that consumption of energy-dense (high-fat, added sugar) foods tend to promote excessive energy intakes (Rolls, 2000). These adverse dietary shifts have undoubtedly contributed to the rise in overweight and obesity observed throughout the developing world.
Case study data from China indicate that consumption patterns closely reflect changes in food availability. There were large increases in dietary fats, oils and ASFs in the 1990s. As a result of these changes, mean intakes of ASFs in China have reached levels similar to the maximum amounts recommended in the United States guidelines and food pyramid (United States Department of Agriculture [USDA], 2000). In contrast, intakes of fruit and vegetables fall below recommendations, which would be in the range of 500-700 g/day (authors’ calculations based on three fruit and four vegetable servings/day) – levels comparable to those reported for some Mediterranean countries (Moreno, Sarría and Popkin, 2002). In the past two decades, levels of fruit and vegetable availability in most regions have been relatively flat, with the exception of large increases reported for China. However, it is not clear to what extent the rise in reported availability of fruit and vegetables in China reflects patterns of human consumption. Between 1991 and 1997, fruit and vegetable availability in China nearly doubled, increasing from 324 to 580 g/day (88 to 152 kcals/day), while reported consumption in adults in the CHNS changed very little – from 354 to 369 g/day. This raises questions about the accuracy of the Chinese fruit and vegetable availability data. Worldwide, current availability of fruit and vegetables, especially in sub-Saharan Africa and the Far East, remains well below availability levels in Mediterranean countries such as Spain (249 kcals/day) and Greece (359 kcals/day) (FAO, 2001).
With globalization, many developing countries are experiencing large shifts in food imports. Between 1990 and 1998, there were large increases in trade in processed grain products, while trade in unprocessed bulk grains has declined (Regmi and Gehlar, 2001). Similarly, there have been large increases in trade in oils (Williams, 1984). At the same time, foreign direct investment in the food industry, notably supermarkets and fast food restaurants, has expanded several-fold in many countries (Reardon, Timmer and Berdegue, 2003; Bolling and Somwaru, 2001). For example, between 1989 and 1998, sales by food processing affiliates owned by the United States in South America grew from US$5 billion to $15 billion, and sales in Asia increased from $5 billion to $20 billion (Bolling and Somwaru, 2001). These shifts have been accompanied by marketing of brands and shifts in cultural norms that have influenced tastes (Chopra, Galbraith and Darnton-Hill, 2002). Urbanization is associated with occupations that involve spending more time away from home (Popkin and Bisgrove, 1988). Thus, in many urbanized countries, intakes of processed foods, ready-to-eat meals and snacks, and street vendor, restaurant and fast food
Globalization of food systems in developing countries: impact on food security and nutrition 75
meals have increased (Regmi and Gehlar, 2001). These eating patterns are associated with higher intakes of fat, sugars and energy.
Some of the reasons for the large shifts in edible oil consumption in developing countries have been written about elsewhere (Drewnowski and Popkin, 1997). Technological breakthroughs in the development of high-yield oilseeds and in the refining of high-quality vegetable oils greatly reduced the cost of baking and frying fats, margarine, butter-like spreads, and salad and cooking oils in relation to animal-based products (Williams, 1984). Worldwide demand for vegetable fats was fuelled by health concerns regarding the consumption of animal fats and cholesterol. Furthermore, a number of major economic and political initiatives led to the development of oil crops not only in Europe and the United States, but also in Southeast Asia (palm oils) and in Brazil and Argentina (soybean oils) (USDA, 1966).
Delgado has written perceptively about the ASF revolution in low-income developing countries, or the increase in demand for and production of meat, fish and milk (Delgado et
al., 1999, 2001; Delgado, 2003). As relative commodity prices decrease and incomes increase, people usually diversify their diets and shift towards higher priced commodities and processed convenience foods. While average income growth explains overall growth, urbanization and population growth also helps to explain the greater increase in ASF demand in developing countries relative to developed countries. From 1975 to 1999, animal products drove the expansion of production in developing countries, which now account for more than half of the world’s meat production (Delgado, 2003). In contrast, growth in ASF production in the developed world is now flat – the market is saturated. Given that 81 percent of the world’s people live in developing countries, small shifts in their diets result in huge changes in the world market. Since 1970, relative prices of food have dropped considerably, most dramatically for beef (Delgado, 2003). Because of market saturation and technological changes that increase productivity, the ASF revolution is projected to level off by 2020.
In many countries, large increases in the consumption of sugar have also been observed. Sugar is the world’s predominant sweetener but there are marked increases in the consumption of high fructose corn syrup as well (Bray, Nielsen and Popkin, 2004). Increasing sugar and sweetener use has been linked with industrialization, and with the proliferation of processed foods and beverages that have sugar added to them (e.g. tea, coffee, cocoa and soft drinks). Elsewhere we review in far more detail the way the world’s diet has changed with respect to added caloric sweeteners (Popkin and Nielsen, 2003).
As shown using data from China these emerging, potentially adverse dietary patterns are especially marked in urban areas. Compared to rural dwellers, urban residents continue to consume higher levels of fats and animal foods, together with lower intakes of vegetables. However, the dietary effects of urbanization and globalization appear to be expanding into areas designated as rural. With marked increases in oils and ASF consumption in rural areas, the disparity between urban and rural intakes has become smaller over time. Rural consumption of these foods is particularly high in areas that are highly urbanized in terms of infrastructure and resources. In a companion paper, we explore dietary patterns in different urban contexts in greater detail (Mendez et al., 2003). Only areas with very low levels of urbanicity have maintained traditional diets that are low in fat and animal source foods. “Urban” dietary patterns are likely to become more common throughout developing countries as the process of rural development, or increased urbanicity in rural areas, continues.
Disturbingly, there is evidence that the adverse changes in dietary intakes associated with urbanization are taking place at all levels of SES, and probably contribute to the rising levels of low-income obesity observed in some developing countries. In China, although
76 Globalization, urbanization and nutritional change in the developing world
low-income adults consumed lower levels of animal foods and oils than higher-income adults, the rate of increase in ASFs and edible oil consumption is, overall, faster in low-income groups. Relatively high levels of overweight were observed in low SES women in numerous developing countries, resulting in relatively small disparities in overweight between high and low SES groups.
These dietary shifts have occurred together with increased sedentarism in occupational activity and commuting, as well as in the nature of leisure-time activity (e.g. from increased television watching) (Bell, Ge and Popkin, 2001, 2002; Hu et al., 2002; Tudor-Locke et al., 2002). Because of their tendency to promote overconsumption, the dietary changes currently taking place in developing countries may help to explain energy imbalance and obesity, as individuals fail to adapt their energy intakes to match reduced energy expenditure levels. Together, these shifts in diet and activity have contributed to the rising obesity observed throughout the developing world at all income levels and increasingly in rural areas. The high speed of change is also a concern, as individuals exposed to undernutrition earlier in life are also making these dietary shifts. Individuals with very poor nutrition in early life may be at greater risk of adverse consequences, including diabetes, cardiovascular disease or weight gain (Barker, 2001; Schroeder, Martorell and Flores, 1999; Sawaya et al., 2003; Reddy, 2002).
In addition to obesity, the dietary changes associated with urbanization and globalization are of great concern because of the implications for risk of obesity-related chronic disease. Large increases in the prevalence of numerous obesity-related chronic diseases have been documented around the developing world, including diabetes and cardiovascular diseases (Kumanyika et al., 2002; Yusuf et al., 2001). A large body of evidence, including data from clinical trials, shows that diets lower in meats and fats, and richer in fruit and vegetables, reduce blood pressure and risk of diabetes incidence as much or more than costly pharmacological treatments (Knowler et al., 2002; Vollmer, Sacks and Svetkey, 2001).
Researchers working in many developing countries have begun to move beyond documenting shifts in obesity to documenting the dietary and activity shifts underlying the ongoing nutrition transition as well. Studies in several other developing countries have described dietary trends similar to those described here (e.g. Shetty, 2002; Kosulwat, 2002). The need to develop policies appropriate for the current nutrition climate, in which overweight has become a major health issue in developing countries, has been highlighted (Uauy and Kain, 2002). In a few countries, policies and programmes to shift dietary practices in developing countries to address obesity in addition to undernutrition are being put in place, although the effectiveness of these efforts is as yet unknown (Coitinho, Monteiro and Popkin, 2002; Zhai et al., 2002).
As part of its National Plan of Action for Nutrition, China has developed important educational tools such as the “Chinese pagoda”, a set of dietary guidelines for Chinese residents (Zhai et al., 2002). Schools have been asked to increase time allotted to physical activity. The government has used subsidies to promote urban vegetable consumption in northern areas of China, and to promote rural gardens. Promotion of pulse consumption has been identified as a strategy for maintaining protein quality, while providing an alternative to meat as a source of protein (Leterme and Carmenza Munoz, 2002). As part of its nutrition plan, China has developed policies to increase soybean production and consumption (Zhai et al., 2002). While meat production has nearly kept pace with rising demand and consumption, increases in soybean production and consumption to date have been relatively small (Geissler, 1999). Despite the large shifts in consumption and availability, meat imports were 1.7 percent of the total supply in 1990, and 3.6 percent in 2001 (FAO, 2001). Meanwhile, estimated availability of pulses in China remains fairly low
Globalization of food systems in developing countries: impact on food security and nutrition 77
(36.6 g/capita/day in 2001; FAO, 2001), similar to mean reported intakes of pulses in recent surveys (39 g/day in 1991 and 44.6 g/day in 1997, among CHNS adults).
Brazil has also developed a new national food nutrition policy, addressing the emergence of obesity rather than underweight as the major problem of adult malnutrition (Coitinho, Monteiro and Popkin, 2002; Monteiro, Conde and Popkin, 2004). In addition to continuing efforts to combat malnutrition, components of this policy include development of nutrition labels, regulation of health claims about foods, and the regulation of school meals, but their effectiveness remains unknown. However, even before these policies were implemented, there was a marked decline in the rates of increase in obesity among high SES women (Monteiro et al., 2000). The researchers suggested that intensive mass media attention paid to the epidemic of obesity may have contributed to the decline. Television and print media programmes provided extensive information on the consequences of obesity, as well as on obesity prevention measures.
Developing countries may benefit from preventive measures that minimize further adverse shifts in diet, rather than attempting to reverse shifts after new dietary patterns are even more established as cultural norms. Given that adverse dietary and activity patterns appear to be widespread geographically and socio-economically, strategies with broad outreach are appropriate, for example by exploiting the use of mass media. The experience in Brazil suggests that mass media nutrition education efforts may be effective in reaching some population groups. Another important component of obesity prevention may involve working with the food industry. In the United States, increases in portion sizes in commercial food products may have contributed to higher intakes of energy-dense foods and exceed standard serving sizes (Young and Nestle, 2003; Nielsen and Popkin, 2003). Working with or regulating the restaurant and supermarket industries to maintain appropriate portion sizes may help to minimize excess intakes. Pricing has also been shown to play a key role in food choices in both developed and developing countries (French, 2003; Guo et al., 1999). The use of subsidies or other incentives to ensure that fresh fruit and vegetables are affordable may help to promote healthier food choices. Since high intakes of meat are associated with increased risk of hypertension and cardiovascular disease, developing countries should continue to explore more effective agricultural and educational policies that promote the production and consumption of pulses as protein substitutes. Tastes and preferences begin to be established in early life (Hill, 2002). Therefore, schools may provide an important opportunistic venue through which preferences for more healthy options can be encouraged. Workplaces also provide an opportunity to encourage or provide opportunities for exercise and healthier diets, and efforts in some countries have targeted work sites (Doak, 2002). Dietary policies should be accompanied by programmes to address country-specific barriers to maintaining high levels of physical activity, such as efforts to facilitate safe active commuting, and the promotion of physical activity during leisure time.
78 Globalization, urbanization and nutritional change in the developing world
Bibliography
Ahmad, O.B., Boschi-Pinto, C., Lopez, A.D., Murray, C., Lozano, R. & Inoue, M. 1999. Age
standardization of rates: a new WHO standard. GPE Discussion Paper Series No. 31. Geneva, World Health Organization. Barker, D., ed. 2001. Fetal origins of cardiovascular and lung disease. New York, USA., Marcel Dekker, Inc. Bell, C., Ge, K. & Popkin, B.M. 2001.Weight gain and its predictors in Chinese adults. Int. J. Obes., 25: 1079-1086. Bell, A.C., Ge, K. & Popkin, B.M. 2002. The road to obesity or the path to prevention? Motorized transportation and obesity in China. Obes. Res., 10: 277-283. Boerma, J.T. & Sommerfelt, A.E. 1993. Demographic and Health Surveys (DHS): contributions and limitations. World Health Statistics Qtly, 46: 222-226. Bolling, C. & Somwaru, A. 2001. US food companies access foreign markets though direct investment. Food Rev., 24(3): 23-28 (www.ers.usda.gov/publications/FoodReview/septdec01/). Bray, G.A., Nielsen, S.J. & Popkin, B.M. 2004. Consumption of high-fructose corn syrup in beverages may play a role in the epidemic of obesity. Am. J. Clin. Nutr., 79(4): 537-543.Chopra, M., Galbraith, S. & Darnton-Hill, I. 2002. A global response to a global problem: the epidemic of overnutrition. Bull. World Health Org., 80: 952-958. Coitinho, D., Monteiro, C.A. & Popkin, B.M. 2002. What is Brazil doing to promote healthy diets and active lifestyles? Public Health Nutr., 5(1A): 263-267. Cook, P. & Kirkpatrick, C. 1997. Globalization, regionalization and third world development. Regional
Studies, 31(1): 55-66. Cornia, G.A. 2001. Globalization and health: results and options. Bull. World Health Org., 79: 834-841. Delgado, C.L. 2003. Rising consumption of meat and milk in developing countries has created a new food revolution. J. Nutr., 133: 3907S-3910S. Delgado, C., Rosegrant, M., Steinfeld, H., Ehui, S. & Courbois, C. 2001. Livestock to 2020: the next food revolution. Outlook on Agr., 30(1): 27-29. Delgado, C., Rosegrant, M., Steinfeld, H., Ehui, S. & Courbois, C. 1999. Livestock to 2020: the next food
revolution. Food, Agriculture and the Environment Discussion Paper No. 28. Washington, DC, International Food Policy Research Institute (IFPRI). Doak, C. 2002. Large-scale interventions and programmes addressing nutrition-related chronic diseases and obesity: examples from 14 countries. Public Health Nutr., 5(1A): 275-277. Dollar, D. 2001. Is globalization good for your health? Bull. World Health Org., 79: 927-833. Drewnowski, A. & Popkin, B.M. 1997. The nutrition transition: new trends in the global diet. Nutr. Rev.,
55: 31-43. Du, S., Lu, B., Zhai, F. & Popkin, B. 2002a. A new stage of the nutrition transition in China. Public Health
Nutr., 5(1A): 169-174. Du, S., Lu, B., Zhai, F. & Popkin, B. 2002b. The nutrition transition in China: a new stage of the Chinese diet. In B. Caballero & B.M. Popkin, eds. The nutrition transition: diet and disease in the developing world.London, Academic Press. Entwisle, B., Henderson, G.E., Short, S., Bouma, J. & Fengying, Z. 1995. Gender and family businesses in Rural China. Am. Sociol. Rev., 60: 36-57. Evans, M., Sinclair, R.C., Fusimalohi, C. & Liava’a, V. 2001. Globalization, diet and health: an example from Tonga. Bull. World Health Org., 79(9): 856-862. Food and Agriculture Organization of the United Nations (FAO). 2001. Food balance sheets
(apps.fao.org). Accessed June 2002. French, S.A. 2003. Pricing effects on food choices. J. Nutr., 133(3): 841S-843S. Galloway, J.H. 2000. Sugar. In K.F. Kiple & K.C. Ornelas, eds. The Cambridge World History of Food, p. 437-449. Vol. I. New York, USA., Cambridge University Press. Geissler, C. 1999. China: the soyabean-pork dilemma. Proc. Nutr. Soc., 58(2): 345-353. Guo, X., Popkin, B.M., Mroz, T.A. & Zhai, F. 1999. Food price policy can favorably alter macronutrient intake in China. J. Nutr., 129: 994-1001. Haddad, L., Ruel, M.T. & Garrett, J.L. 1999. Are urban poverty and undernutrition growing? Some newly assembled evidence. World Dev., 27: 1891-1904. Hill, A.J. 2002. Developmental issues in attitudes to food and diet. Proc. Nutr. Soc., 61(2): 259-266. Hu, G., Pekkarinen, H., Hanninen, O., Yu, Z., Huiguang, T., Zeyu, G. & Nissinen, A. 2002. Physical activity during leisure and commuting in Tianjin, China. Bull. World Health Org., 80(12): 933-938.
Globalization of food systems in developing countries: impact on food security and nutrition 79
Knowler, W.C., Barrett-Connor, E., Fowler, S.E., Hamman, R., Lachin, J., Walker, E. & Nathan, D. 2002. Reduction in the incidence of type 2 diabetes with lifestyle intervention or metformin. Diabetes Prevention Program Group. N. Engl .J. Med., 346(6): 393-403.Kosulwat, V. 2002. The nutrition and health transition in Thailand. Public Health Nutr., 5(1A): 183-189. Kumanyika, S., Jeffery, R.W., Morabia, A., Ritenbaugh, C. & Antipatis, V. 2002. Obesity prevention: the case for action. Int. J. Obes. Relat. Metab. Disord., 26(3): 425-436. Lang, T. 1999. Diet, health and globalization: five key questions. Proceedings of the Nutrition Society,58(2): 335-343. Leterme, P. & Carmenza Munoz, M.L. 2002. Factors influencing pulse consumption in Latin America. Br.J. Nutr., 88 (Suppl 3): S251-255. Mendez, M,, Stookey, J.D., Adair, L.S. & Popkin, B. 2003. Measuring urbanization and its potential
impact on health: the China case. Chapel Hill, North Carolina, United States. (unpublished manuscript) Mendez, M., Du, S. & Popkin, B.M. Urbanization, income and the nutrition transition in China: a case
study. Paper prepared for the FAO Technical Workshop on Globalization of Food Systems: Impacts on Food Security and Nutrition, 8-10 October 2003, Rome. Mintz, S. 1977. Time, sugar and sweetness. In C. Counihan & P. Van Esterik, eds. Food and culture: a
reader, 77: 357-369. New York, USA., Routledge. Monteiro, C.A., Conde, W.L., Lu, B. et al. 2003. Is obesity fueling inequities in health in the developing world? (submitted for publication) Monteiro, C.A., Conde, W.L. & Popkin, B.M. 2004. The burden of disease due to under- and overnutrition in countries undergoing rapid nutrition transition: a view from Brazil. Am. J. Public Health, 94(3): 433-4. Monteiro, C.A., Wolney, L.C. & Popkin, B.M. 2002. Is obesity replacing or adding to undernutrition? Evidence from different social classes in Brazil. Publ. Health Nutr., 5(1A): 105-112. Monteiro, C. A., Benicio, M.H.D.A., Conde, W.L. & Popkin, B.M. 2000. Shifting obesity trends in Brazil. Eur. J. Clin. Nutr., 54: 342-346. Moreno, L.A., Sarría, A. & Popkin, B.M. 2002. The nutrition transition in Spain: a European Mediterranean country. Eur. J. Clin. Nutr., 56: 992-1003. Nielsen, S.J. & Popkin, B.M. 2003. Patterns and trends in food portion sizes, 1977-1998. JAMA, 289(4): 450-453. Popkin, B.M. 2002a. An overview on the nutrition transition and its health implications: the Bellagio meeting. Publ. Health Nutr., 5(1A): 93-103. Popkin, B.M. 2002b. The shift in stages of the nutrition transition in the developing world differs from past experiences! Publ. Health Nutr., 5(1A): 205-214. Popkin, B.M. & Nielsen, S.J. 2003. The sweetening of the world's diet. Obes. Res., 11: 1325-1332. Popkin, B.M. & Bisgrove, E.Z. 1988. Urbanization and nutrition in low-income countries. Food Nutr. Bull.,10 (1): 3-23. Popkin, B.M. & Du, S. 2003. Dynamics of the nutrition transition toward the animal foods sector in China and its implications: a worried perspective. J. Nutr., 133: 3898S-3906S. Popkin, B.M., Keyou, G., Zhai, F., Guo, X., Ma, H. & Zohoori, N. 1993. The nutrition transition in China: a cross-sectional analysis. Eur. J. Clin. Nutr., 47: 333-346. Reardon, T., Timmer, C.P. & Berdegue, J.A. 2003. The rise of supermarkets in Latin America and Asia: implications for international markets for fruits and vegetables. In A. Regmi & M. Gehlhar, eds. Global
markets for high value food products. Agricultural Information Bulletin, USDA, Economic Research Service. Washington, DC. (in press)Reddy, K.S. 2002. Cardiovascular diseases in the developing countries: dimensions, determinants, dynamics and directions for public health action. Publ. Health Nutr., 5(1A): 231-237. Regmi, A. & Gehlar, M. 2001. Consumer preferences and concerns shape global food trade. Food Rev.,
24(3): 2-8. Rivera, J.A., Barquera, S., Campirano, F., Campos, I., Safdie, M. & Tovar, V. 2002. Epidemiological and nutritional transition in Mexico: rapid increase of non-communicable chronic diseases and obesity. Publ.
Health Nutr., 5(1A): 113-122. Rolls, B.J. 2000. The role of energy density in the overconsumption of fat. J. Nutr., 30(2S): 268S-271S. Sachs, J.D. & Warner, A. 1995. Economic reform and the process of global integration. Brookings Papers
on Economic Activity, 25th Anniversary Issue, 1: 1-64. Sawaya, A.L., Martins, P., Hoffman, D. & Roberts, S. 2003. The link between childhood undernutrition and risk of chronic diseases in adulthood: a case study of Brazil. Nutr. Rev., 61(5 Part 1): 168-75. Schroeder, D.G., Martorell, R., & Flores, R. 1999. Infant and child growth and fatness and fat distribution in Guatemalan adults. Am. J. Epidemiol., 149(2): 177-185. Shetty, P.S. 2002. Nutrition transition in India. Publ. Health Nutr., (1A): 175-182.
80 Globalization, urbanization and nutritional change in the developing world
Tudor-Locke, C., Neff, L.J., Ainsworth, B.E., Addy C. & Popkin B. 2002. Omission of active commuting to school and the prevalence of children's health-related physical activity levels: the Russian Longitudinal Monitoring Study. Child Care Health Dev., 28(6): 507-512. Uauy, R. & Kain, J. 2002. The epidemiological transition: need to incorporate obesity prevention into nutrition programmes. Public Health Nutr., 5(1A): 223-229. United Nations Population Division. 2002. World urbanization prospects: the 2001 revision.(www.un.org/esa/population/publications/wup2001/WUP2001Annextab.pdf). Accessed 19 July 2003. US Department of Agriculture (USDA). 1966. US fats and oils statistics, 1909-65. Statistical Bulletin No. 376. Economic Research Service. Washington, DC. US Department of Agriculture (USDA). 2000. Dietary guidelines for Americans. Center for Nutrition Policy and Promotion (www.health.gov/dietaryguidelines/dga2000/document/contents.htm).Vollmer, W.M., Sacks, F.M. & Svetkey, L.P. 2001. New insights into the effects on blood pressure of diets low in salt and high in fruits and vegetables and low-fat dairy products. Curr. Control Trials Cardiovasc.
Med., 2(2): 71-74. Williams, G.W. 1984. Development and future direction of the world soybean market. Q. J. Intl. Agr., 23: 319-337. World Bank. 2001. World Development Report 2000/2001: attacking poverty. New York, USA., Oxford University Press. Young, L.R. & Nestle, M. 2003. Expanding portion sizes in the US marketplace: implications for nutrition counseling. J. Am. Diet. Assoc., 103(2): 231-234. Yusuf, S., Reddy, S., Ounpuu, S. & Anand, S. 2001. Global burden of cardiovascular diseases. Part I. General considerations, the epidemiologic transition, risk factors, and impact of urbanization. Circulation,
104(22): 2746-2753. Zhai, F., Fu, D., Du, S., Ge, K., Chen, C. & Popkin, B. 2002. What is China doing in policy-making to push back the negative aspects of the nutrition transition? Public Health Nutr., 5(1A): 269-273.
Globalization of food systems in developing countries: impact on food security and nutrition 81
The growing global obesity problem: some policy options to address it
Josef Schmidhuber 1
INTRODUCTIONThe last two centuries have seen a fundamental transformation of diets in essentially all affluent countries. At the beginning of this transformation was the agro-industrial revolution of the nineteenth century, which provided people with the expertise to produce more, the income to consume more, and increasingly sophisticated food products. The modernization of agriculture has played a pivotal role in bringing about change. The rigorous application of scientific advances to traditional agriculture, mechanization, genetic improvements and the development of fertilizers and pesticides enabled a doubling and redoubling of food production within the time span of a few decades. In fact, productivity growth was so strong that growth in production comfortably exceeded growth in demand and afforded a rapidly growing population more and better food at declining real prices. Agricultural productivity growth also promoted the industrialization of the then largely agrarian societies. It helped accumulate capital, free up labour and provide ever more and more nutritious food. Eventually, a virtuous circle was created where productivity growth, rising incomes and better nutrition became mutually supportive and thus spurred overall economic development2. At least for the nineteenth century, however, these developments remained largely limited to industrial countries.
It took more than a century before the agro-industrial revolution started to reach the first developing countries. With the beginning of the 1960s, the same factors that had initiated the agro-industrial revolution in the developed world in the previous century got a foothold in the food and agricultural sectors of parts of the developing world. The combination of modern varieties, expansion of irrigation, more and improved input supplies and the widespread mechanization of production made more food available to consumers in developing countries. Since the early 1960s, the average calorie availability in the developing world has increased from about 1 950 to 2 680 kcals/person/day while protein availability nearly doubled from about 40 to 70 g/person/day. The prevalence of undernourishment declined from 37 percent in 1970 to 17 percent in 2000 and, while more than 840 million of people (FAO, 2003) are still food insecure, this is more often the result of adverse local production conditions, war and civil strife, a lack of income and of access to food rather than the inability of the world as a whole to produce and provide enough food.
1 Josef Schmidhuber Global Perspectives Studies Unit Economic and Social Department Food and Agriculture Organization of the United Nations Tel.: (39) 06 5705-6264
E-mail: [email protected] Fogel (1994) estimates that half of the overall economic growth in France and England in the nineteenth
century was a result of better nutrition.
82 The growing global obesity problem: some policy options to address it
As in the industrial world of the nineteenth century, consumers in developing countries have benefited the most from advances in agricultural productivity. In real terms, food prices have declined to the lowest levels in history and, together with gains in broader economic growth, have enabled consumers today to eat better while spending less and less of their budget on food. However, not all countries and regions have benefited from these advances. In parts of the developing word, notably in sub-Saharan Africa, these advances have not even started to yield a meaningful impact. But in many developing countries, the progress in access to providing more, better and cheaper food has been impressive.3 The rapid decline in real food prices has allowed consumers in developing countries to embark on food consumption patterns that were reserved for consumers in industrialized countries at much higher gross domestic product (GDP) levels. Today, a consumer in a developing country can purchase more calories than ever before and more than consumers in industrialized countries ever could at comparable income levels. In China, for instance, consumers today have about 3 000 kcals/day and 50 kg of meat per year (FAO, 2004) at their disposal – at less than US$1 000 nominal income per year (World Bank, 2002).
In addition to falling real prices of food, rapid urbanization has affected and will continue to affect consumption patterns. Essentially the entire population growth over the next 30 years will be urban. Urbanization creates a new and improved marketing and distribution infrastructure; attracts supermarkets and their sophisticated food handling systems (cold chains, etc.); makes for better roads and ports, thus improving the access of foreign suppliers and the importance of imports in the overall food supply; and, all in all, will promote a globalization of dietary patterns. Most important from a nutrition perspective, these changes include not only a shift towards higher food energy supplies but also a shift towards more fats and oils and more animal-based foodstuffs, and thus higher intakes of saturated fat and cholesterol.
The shifts in consumption patterns and lifestyles have resulted in a rapid increase in the prevalence of obesity and related non-communicable diseases (NCDs) in developed countries. Many developing countries are in the process of undergoing a similar nutrition transition (see WHO, 2003), with probably even more adverse health impacts. The main compounding factor of these nutritional changes is a phenotypic and genotypic predisposition towards developing obesity and NCDs. The phenotypic predisposition is the result of rapid transition from hunger and undernourishment towards overnutrition and affluence. There is ample empirical evidence that hunger and malnutrition “programme” the next generation to develop a more efficient energy metabolism and thus to have a higher propensity to develop obesity and related NCDs (see Delisle, 2002 for a comprehensive discussion). In addition, populations of developing countries have on average a genetic predisposition towards developing obesity and NCDs (thrifty genotype,
Miller and Colagiuri, 1994). The combination of: (i) the rapid nutrition transition with a rapidly declining share of
expenditure on food as a percentage of total expenditure/income; (ii) urbanization; (iii) the shift in diet towards more animal products; and (iv) the phenotypic and genotypic predisposition towards a more efficient metabolism and NCDs could spark a rapid increase in the prevalence of obesity and NCDs in developing countries over the next generations.
3 While not all developing countries have benefited from rapid income growth and nor have they experienced the same rapid socio-economic transformations that come with rapid industrialization and urbanization, the number of countries that are in the process of a profound transformation of their food economies is steadily increasing. As population giants such as China, India, Indonesia, Brazil and Mexico are among the most rapid transformers, the nutrition transition affects a large and growing share of the developing world’s population.
Globalization of food systems in developing countries: impact on food security and nutrition 83
The human and economic toll could be dramatic and, for many, the exit from food poverty may be associated with a straight entry into health poverty. This means that, while fewer people will suffer from hunger and chronic undernourishment, more will have health problems related to obesity and NCDs. The impacts will be felt more strongly than in developed countries as fewer consumers in developing countries will be able to afford the needed medical treatment even if they can afford more food. Many NCDs have a lethal impact if left untreated.
The rapid increase of NCDs also suggests that some of these concerns have already become a reality, at least in developed countries. Phenotypic and genotypic predisposition for obesity and NCDs in developing countries, in conjunction with the rapid nutrition transition towards higher calorie availabilities in general and more livestock products in particular, suggest that their populations may have to cope with an even bigger problem in a shorter period of transition. The policy messages emerging from these links are straightforward. First, all efforts that help fight hunger today and improve the nutritional situation of women of child-bearing age have the potential to yield an extra dividend for coming generations. Second, nutritional education and supplementary feeding programmes for pregnant women that ensure a balanced and healthy diet are even more important than hitherto assumed.4 Third, policy-makers in developed and developing countries alike have to think about possible policy measures that can help contain a growing obesity problem without thwarting progress in fighting hunger.
As far as the fight against hunger is concerned, there is no shortage of programmes and projects that could provide or at least promise success. But policy approaches that could help contain or reverse the global obesity problem are rather new. The various proposals and their pros and cons are being discussed at the moment in many developed countries (for example, Australia, the United States of America and the United Kingdom of Great Britain and Northern Ireland).5 The remainder of this paper aims to shed some light on the various proposals and will also try to assess possible interactions and incompatibilities with other policy measures. It will first look at the effects of price interventions, both at the level of primary commodities and final consumer goods (tax on fat food), then examine the possibilities of tax on excess body weight (tax on fat people), and finally present some experience gathered with a combination of various measures in integrated nutritional programmes. The discussion of the various policy options includes an examination of their effectiveness and efficiency, and an evaluation of their pros and cons and their compatibility with other policies. However, the presentation and discussion of possible policy measures will be limited to a few instruments; the focus will be placed on policy measures that have received particular prominence in the current public discussion in developed countries and in developing countries in rapid economic and nutrition transition; no claim is being made that the selection of instruments is comprehensive or representative.
4 They could be of critical importance in those developing countries where the prospects for a rapid increase in calorie availability combined with a more efficiently “programmed” metabolism could result in a disproportionate increase in obesity and related NCDs.
5 For the United Kingdom, see for instance: news.bbc.co.uk/1/hi/uk/2988314.stm; for the United States: www.usatoday.com/life/2002/2002-02-19-diet.htm; for Australia: www.consumerfreedom.com/headline_detail.cfm?HEADLINE_ID=1960.
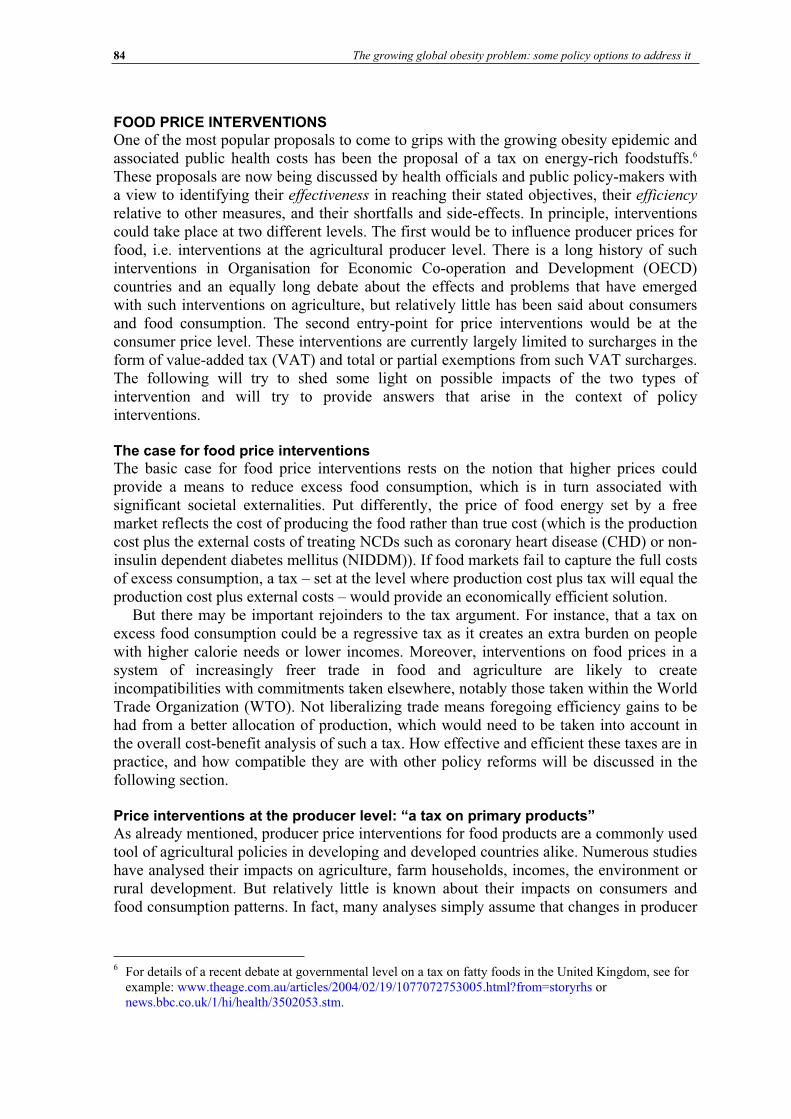
84 The growing global obesity problem: some policy options to address it
FOOD PRICE INTERVENTIONS One of the most popular proposals to come to grips with the growing obesity epidemic and associated public health costs has been the proposal of a tax on energy-rich foodstuffs.6
These proposals are now being discussed by health officials and public policy-makers with a view to identifying their effectiveness in reaching their stated objectives, their efficiency
relative to other measures, and their shortfalls and side-effects. In principle, interventions could take place at two different levels. The first would be to influence producer prices for food, i.e. interventions at the agricultural producer level. There is a long history of such interventions in Organisation for Economic Co-operation and Development (OECD) countries and an equally long debate about the effects and problems that have emerged with such interventions on agriculture, but relatively little has been said about consumers and food consumption. The second entry-point for price interventions would be at the consumer price level. These interventions are currently largely limited to surcharges in the form of value-added tax (VAT) and total or partial exemptions from such VAT surcharges. The following will try to shed some light on possible impacts of the two types of intervention and will try to provide answers that arise in the context of policy interventions.
The case for food price interventions The basic case for food price interventions rests on the notion that higher prices could provide a means to reduce excess food consumption, which is in turn associated with significant societal externalities. Put differently, the price of food energy set by a free market reflects the cost of producing the food rather than true cost (which is the production cost plus the external costs of treating NCDs such as coronary heart disease (CHD) or non-insulin dependent diabetes mellitus (NIDDM)). If food markets fail to capture the full costs of excess consumption, a tax – set at the level where production cost plus tax will equal the production cost plus external costs – would provide an economically efficient solution.
But there may be important rejoinders to the tax argument. For instance, that a tax on excess food consumption could be a regressive tax as it creates an extra burden on people with higher calorie needs or lower incomes. Moreover, interventions on food prices in a system of increasingly freer trade in food and agriculture are likely to create incompatibilities with commitments taken elsewhere, notably those taken within the World Trade Organization (WTO). Not liberalizing trade means foregoing efficiency gains to be had from a better allocation of production, which would need to be taken into account in the overall cost-benefit analysis of such a tax. How effective and efficient these taxes are in practice, and how compatible they are with other policy reforms will be discussed in the following section.
Price interventions at the producer level: “a tax on primary products” As already mentioned, producer price interventions for food products are a commonly used tool of agricultural policies in developing and developed countries alike. Numerous studies have analysed their impacts on agriculture, farm households, incomes, the environment or rural development. But relatively little is known about their impacts on consumers and food consumption patterns. In fact, many analyses simply assume that changes in producer
6 For details of a recent debate at governmental level on a tax on fatty foods in the United Kingdom, see for example: www.theage.com.au/articles/2004/02/19/1077072753005.html?from=storyrhs or news.bbc.co.uk/1/hi/health/3502053.stm.
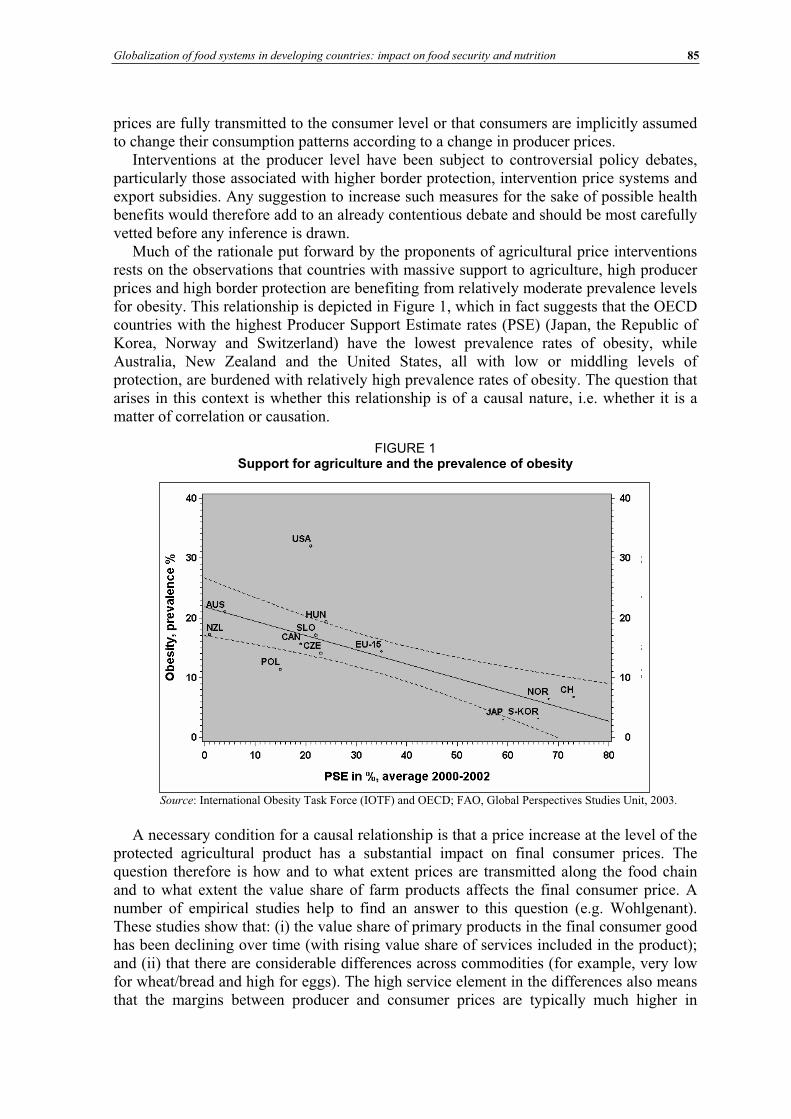
Globalization of food systems in developing countries: impact on food security and nutrition 85
prices are fully transmitted to the consumer level or that consumers are implicitly assumed to change their consumption patterns according to a change in producer prices.
Interventions at the producer level have been subject to controversial policy debates, particularly those associated with higher border protection, intervention price systems and export subsidies. Any suggestion to increase such measures for the sake of possible health benefits would therefore add to an already contentious debate and should be most carefully vetted before any inference is drawn.
Much of the rationale put forward by the proponents of agricultural price interventions rests on the observations that countries with massive support to agriculture, high producer prices and high border protection are benefiting from relatively moderate prevalence levels for obesity. This relationship is depicted in Figure 1, which in fact suggests that the OECD countries with the highest Producer Support Estimate rates (PSE) (Japan, the Republic of Korea, Norway and Switzerland) have the lowest prevalence rates of obesity, while Australia, New Zealand and the United States, all with low or middling levels of protection, are burdened with relatively high prevalence rates of obesity. The question that arises in this context is whether this relationship is of a causal nature, i.e. whether it is a matter of correlation or causation.
FIGURE 1 Support for agriculture and the prevalence of obesity
Source: International Obesity Task Force (IOTF) and OECD; FAO, Global Perspectives Studies Unit, 2003.
A necessary condition for a causal relationship is that a price increase at the level of the protected agricultural product has a substantial impact on final consumer prices. The question therefore is how and to what extent prices are transmitted along the food chain and to what extent the value share of farm products affects the final consumer price. A number of empirical studies help to find an answer to this question (e.g. Wohlgenant). These studies show that: (i) the value share of primary products in the final consumer good has been declining over time (with rising value share of services included in the product); and (ii) that there are considerable differences across commodities (for example, very low for wheat/bread and high for eggs). The high service element in the differences also means that the margins between producer and consumer prices are typically much higher in
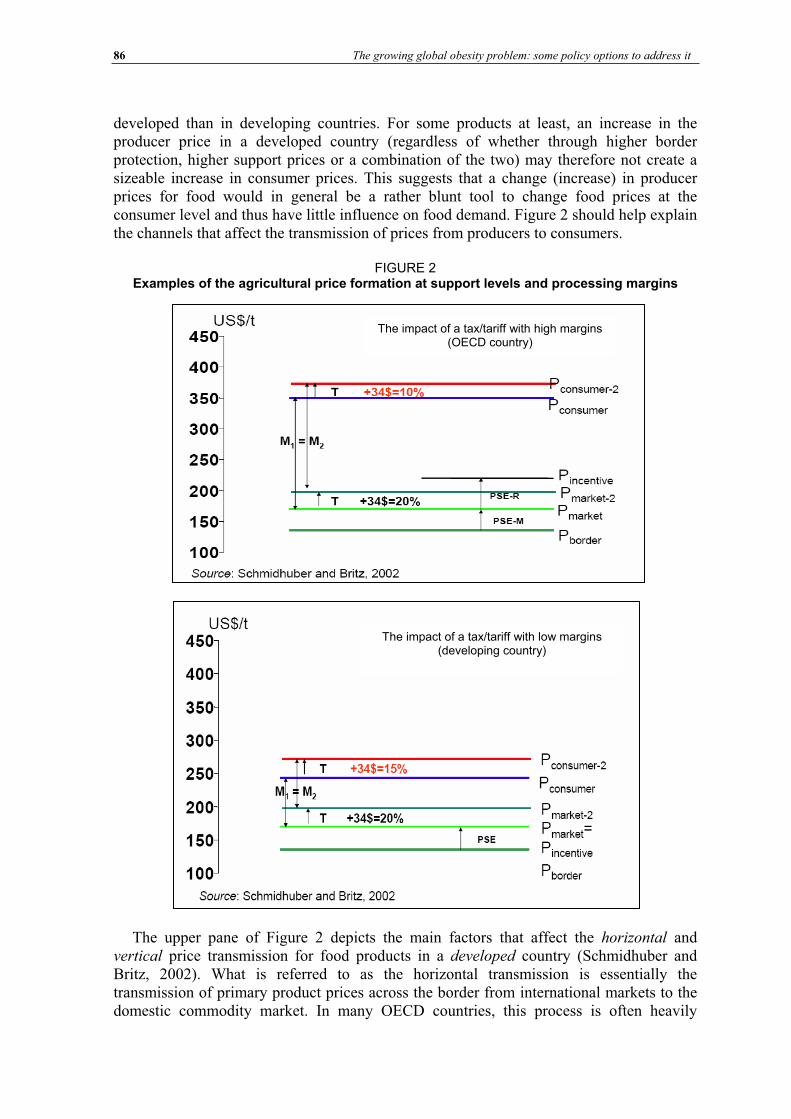
86 The growing global obesity problem: some policy options to address it
developed than in developing countries. For some products at least, an increase in the producer price in a developed country (regardless of whether through higher border protection, higher support prices or a combination of the two) may therefore not create a sizeable increase in consumer prices. This suggests that a change (increase) in producer prices for food would in general be a rather blunt tool to change food prices at the consumer level and thus have little influence on food demand. Figure 2 should help explain the channels that affect the transmission of prices from producers to consumers.
FIGURE 2 Examples of the agricultural price formation at support levels and processing margins
The upper pane of Figure 2 depicts the main factors that affect the horizontal and vertical price transmission for food products in a developed country (Schmidhuber and Britz, 2002). What is referred to as the horizontal transmission is essentially the transmission of primary product prices across the border from international markets to the domestic commodity market. In many OECD countries, this process is often heavily
The impact of a tax/tariff with high margins (OECD country)
The impact of a tax/tariff with low margins (developing country)
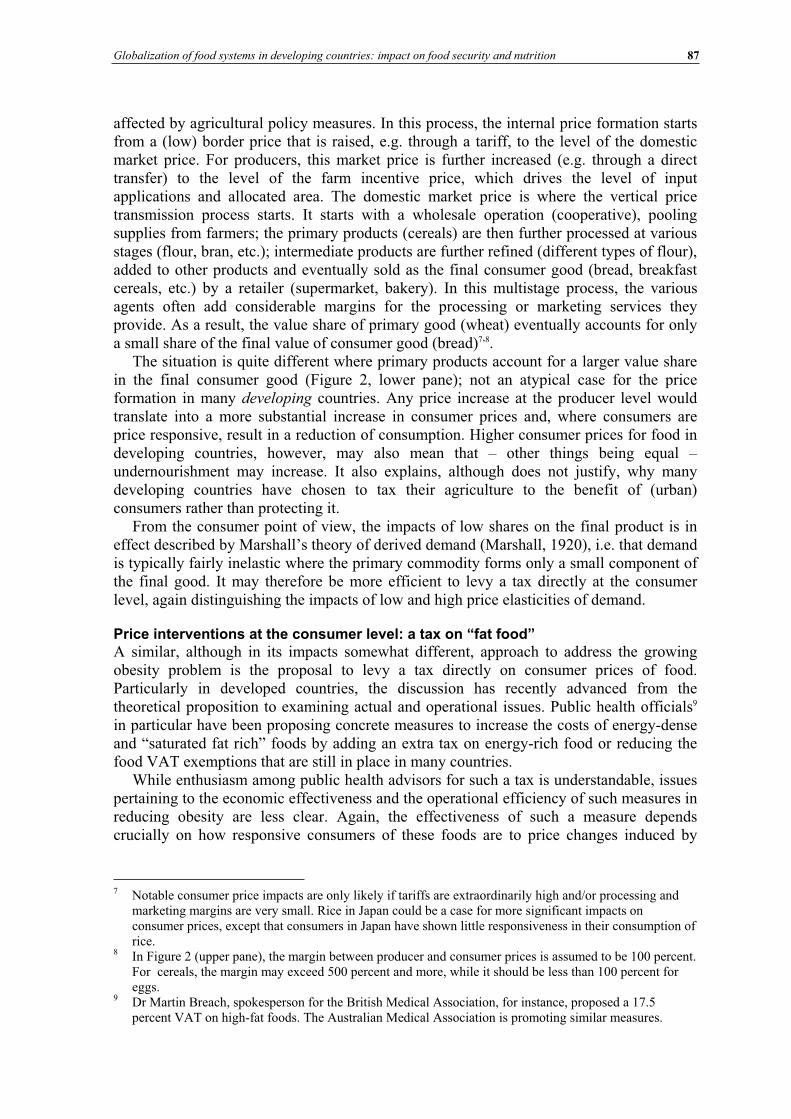
Globalization of food systems in developing countries: impact on food security and nutrition 87
affected by agricultural policy measures. In this process, the internal price formation starts from a (low) border price that is raised, e.g. through a tariff, to the level of the domestic market price. For producers, this market price is further increased (e.g. through a direct transfer) to the level of the farm incentive price, which drives the level of input applications and allocated area. The domestic market price is where the vertical price transmission process starts. It starts with a wholesale operation (cooperative), pooling supplies from farmers; the primary products (cereals) are then further processed at various stages (flour, bran, etc.); intermediate products are further refined (different types of flour), added to other products and eventually sold as the final consumer good (bread, breakfast cereals, etc.) by a retailer (supermarket, bakery). In this multistage process, the various agents often add considerable margins for the processing or marketing services they provide. As a result, the value share of primary good (wheat) eventually accounts for only a small share of the final value of consumer good (bread)7,8.
The situation is quite different where primary products account for a larger value share in the final consumer good (Figure 2, lower pane); not an atypical case for the price formation in many developing countries. Any price increase at the producer level would translate into a more substantial increase in consumer prices and, where consumers are price responsive, result in a reduction of consumption. Higher consumer prices for food in developing countries, however, may also mean that – other things being equal – undernourishment may increase. It also explains, although does not justify, why many developing countries have chosen to tax their agriculture to the benefit of (urban) consumers rather than protecting it.
From the consumer point of view, the impacts of low shares on the final product is in effect described by Marshall’s theory of derived demand (Marshall, 1920), i.e. that demand is typically fairly inelastic where the primary commodity forms only a small component of the final good. It may therefore be more efficient to levy a tax directly at the consumer level, again distinguishing the impacts of low and high price elasticities of demand.
Price interventions at the consumer level: a tax on “fat food” A similar, although in its impacts somewhat different, approach to address the growing obesity problem is the proposal to levy a tax directly on consumer prices of food. Particularly in developed countries, the discussion has recently advanced from the theoretical proposition to examining actual and operational issues. Public health officials9
in particular have been proposing concrete measures to increase the costs of energy-dense and “saturated fat rich” foods by adding an extra tax on energy-rich food or reducing the food VAT exemptions that are still in place in many countries.
While enthusiasm among public health advisors for such a tax is understandable, issues pertaining to the economic effectiveness and the operational efficiency of such measures in reducing obesity are less clear. Again, the effectiveness of such a measure depends crucially on how responsive consumers of these foods are to price changes induced by
7 Notable consumer price impacts are only likely if tariffs are extraordinarily high and/or processing and marketing margins are very small. Rice in Japan could be a case for more significant impacts on consumer prices, except that consumers in Japan have shown little responsiveness in their consumption of rice.
8 In Figure 2 (upper pane), the margin between producer and consumer prices is assumed to be 100 percent. For cereals, the margin may exceed 500 percent and more, while it should be less than 100 percent for eggs.
9 Dr Martin Breach, spokesperson for the British Medical Association, for instance, proposed a 17.5 percent VAT on high-fat foods. The Australian Medical Association is promoting similar measures.
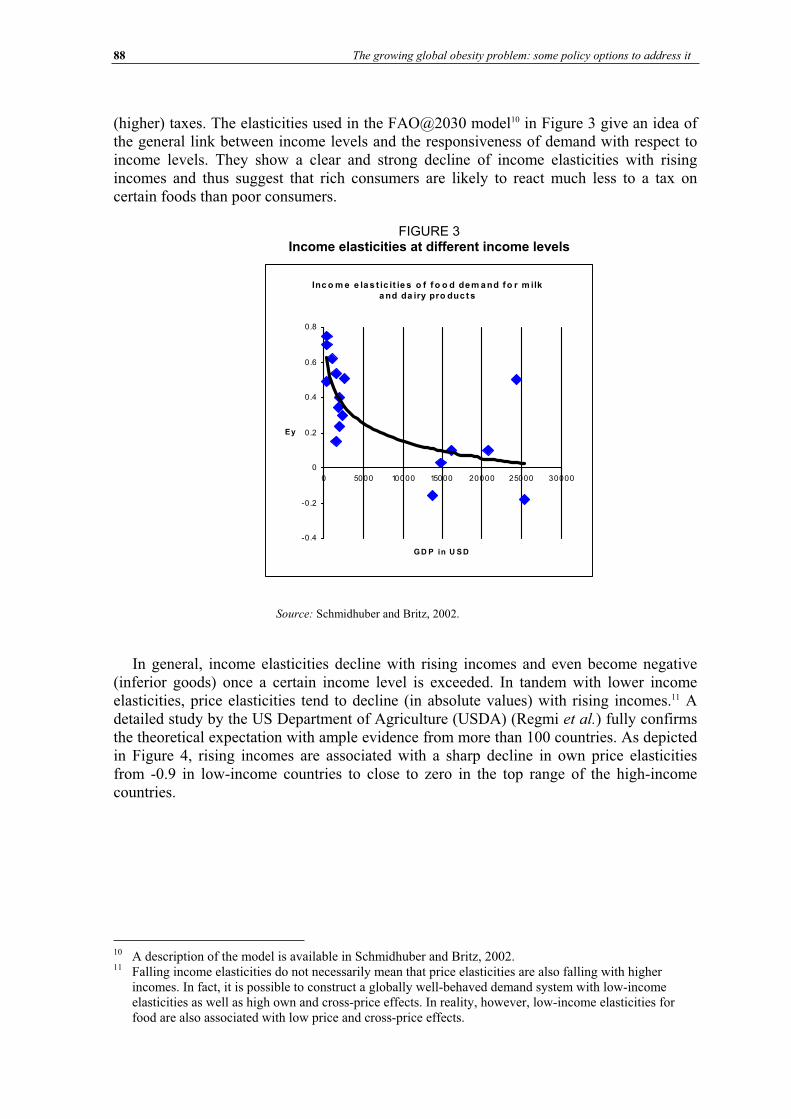
88 The growing global obesity problem: some policy options to address it
(higher) taxes. The elasticities used in the FAO@2030 model10 in Figure 3 give an idea of the general link between income levels and the responsiveness of demand with respect to income levels. They show a clear and strong decline of income elasticities with rising incomes and thus suggest that rich consumers are likely to react much less to a tax on certain foods than poor consumers.
FIGURE 3 Income elasticities at different income levels
In general, income elasticities decline with rising incomes and even become negative (inferior goods) once a certain income level is exceeded. In tandem with lower income elasticities, price elasticities tend to decline (in absolute values) with rising incomes.11 A detailed study by the US Department of Agriculture (USDA) (Regmi et al.) fully confirms the theoretical expectation with ample evidence from more than 100 countries. As depicted in Figure 4, rising incomes are associated with a sharp decline in own price elasticities from -0.9 in low-income countries to close to zero in the top range of the high-income countries.
10 A description of the model is available in Schmidhuber and Britz, 2002. 11 Falling income elasticities do not necessarily mean that price elasticities are also falling with higher
incomes. In fact, it is possible to construct a globally well-behaved demand system with low-income elasticities as well as high own and cross-price effects. In reality, however, low-income elasticities for food are also associated with low price and cross-price effects.
Inc o m e e la s t ic it ie s o f f o o d dem a nd fo r m ilk a nd da iry pro duc t s
-0.4
-0.2
0
0.2
0.4
0.6
0.8
0 5000 10000 15000 20000 25000 30000
GD P in U SD
Ey
Source: Schmidhuber and Britz, 2002.
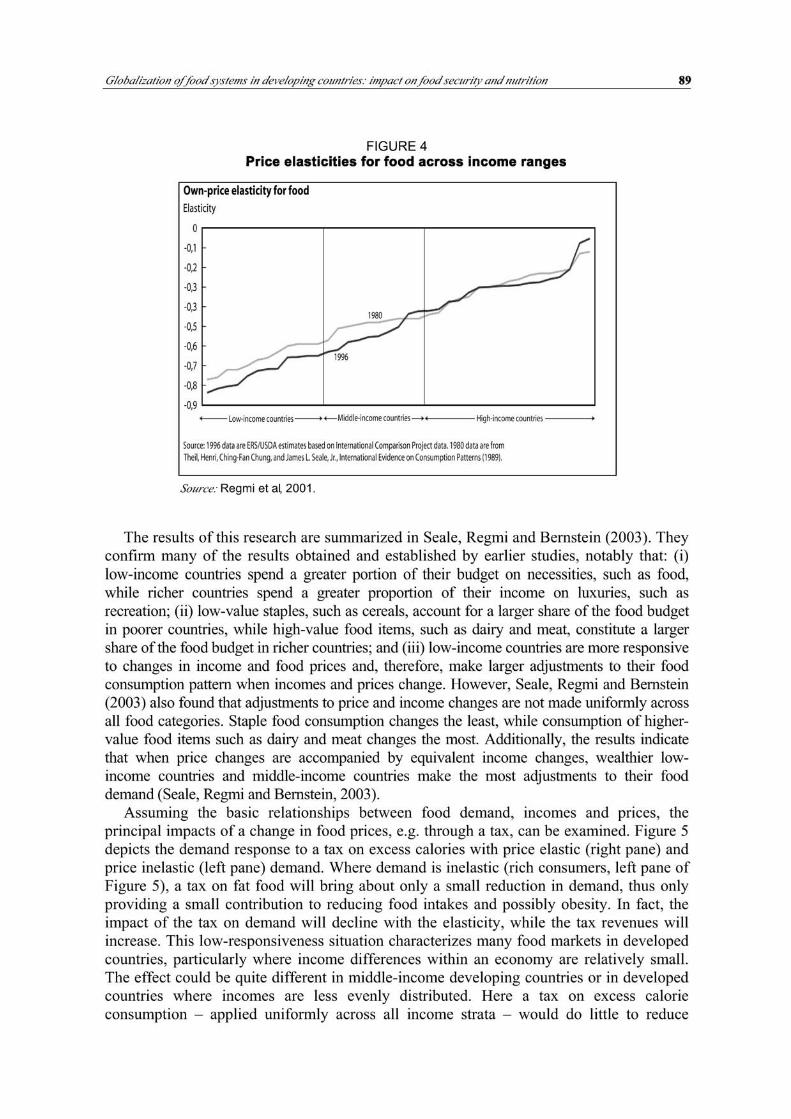
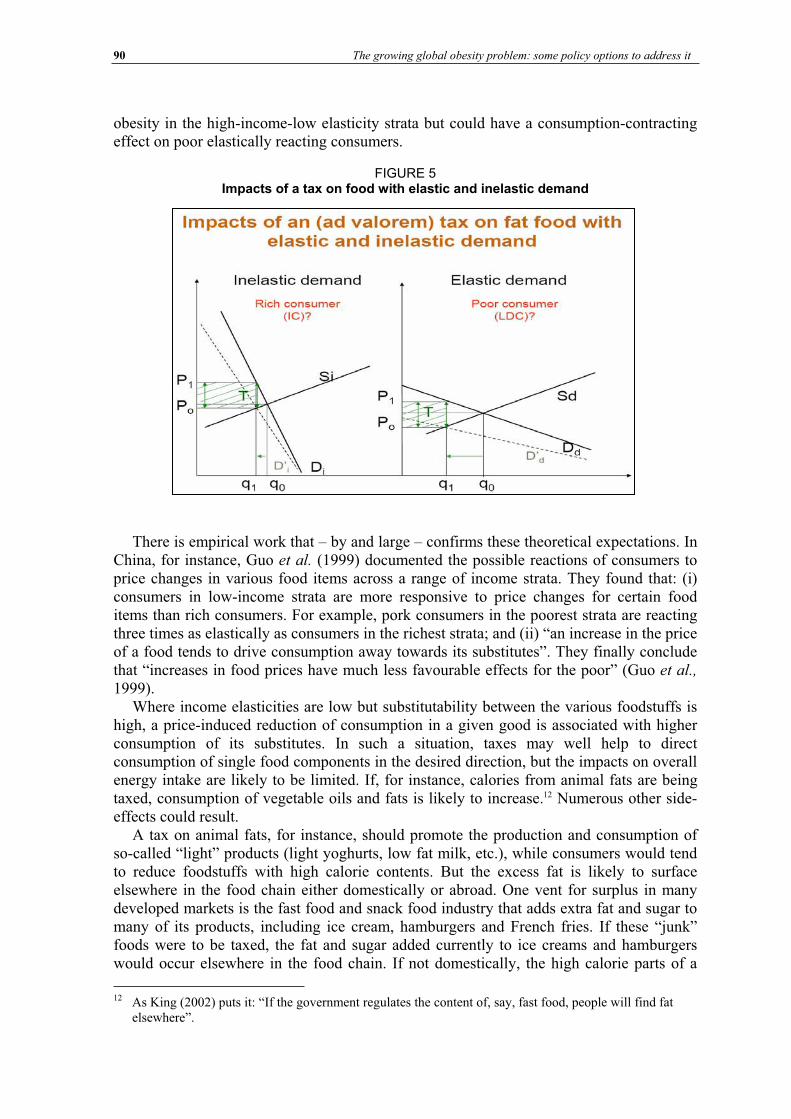
90 The growing global obesity problem: some policy options to address it
obesity in the high-income-low elasticity strata but could have a consumption-contractingeffect on poor elastically reacting consumers.
FIGURE 5 Impacts of a tax on food with elastic and inelastic demand
There is empirical work that – by and large – confirms these theoretical expectations. In China, for instance, Guo et al. (1999) documented the possible reactions of consumers to price changes in various food items across a range of income strata. They found that: (i) consumers in low-income strata are more responsive to price changes for certain food items than rich consumers. For example, pork consumers in the poorest strata are reacting three times as elastically as consumers in the richest strata; and (ii) “an increase in the price of a food tends to drive consumption away towards its substitutes”. They finally conclude that “increases in food prices have much less favourable effects for the poor” (Guo et al.,
1999).Where income elasticities are low but substitutability between the various foodstuffs is
high, a price-induced reduction of consumption in a given good is associated with higher consumption of its substitutes. In such a situation, taxes may well help to direct consumption of single food components in the desired direction, but the impacts on overall energy intake are likely to be limited. If, for instance, calories from animal fats are being taxed, consumption of vegetable oils and fats is likely to increase.12 Numerous other side-effects could result.
A tax on animal fats, for instance, should promote the production and consumption of so-called “light” products (light yoghurts, low fat milk, etc.), while consumers would tend to reduce foodstuffs with high calorie contents. But the excess fat is likely to surface elsewhere in the food chain either domestically or abroad. One vent for surplus in many developed markets is the fast food and snack food industry that adds extra fat and sugar to many of its products, including ice cream, hamburgers and French fries. If these “junk” foods were to be taxed, the fat and sugar added currently to ice creams and hamburgers would occur elsewhere in the food chain. If not domestically, the high calorie parts of a
12 As King (2002) puts it: “If the government regulates the content of, say, fast food, people will find fat elsewhere”.
Globalization of food systems in developing countries: impact on food security and nutrition 91
foodstuff could be exported and end up in developing countries. A case in point is poultry meat, where rich economies already consume predominantly the lean parts (breasts), while the fattier parts (leg quarters, wings) are primarily exported, with possible adverse effects on the food consumption patterns and agricultural economies of those countries that import them.
Another problem with a tax on excess calorie consumption is that in practice such a tax would have to be imposed on food items rather than on nutrients (energy) directly. As food items typically contain a group of different nutrients, a tax on a food item rather than on a nutritional component could bring about undesired side-effects. Guo et al. (1999), for instance, found that higher pork prices in China may indeed help reduce the intake of energy and saturated fatty acids of rich consumers but may cause an undesired fall in protein consumption by the poor.
A look at excess body weights and dietary energy supply (DES) levels across countries seems to confirm the described impacts of a food tax on overweight and obesity. The left pane of Figure 6 depicts the DES levels and male overweight13,14 in those countries for which OECD and the International Obesity Task Force (IOTF) provide information. It may help to illustrate a number of different issues that characterize the relationship between dietary energy supplies and excess body weight across different populations. First, it suggests that a considerable overweight/obesity problem can exist even where food supply levels are low on average. Second, the prevalence of excess body weight increases with the average food availability. Third, once the DES exceeds a certain level (about 3 300 kcals/person/day), there is no more increase in the prevalence of overweight. In fact, if obesity estimates were included, the curve would be flatter. The latter reflects the fact that a large share of calories above 3 300 calories is likely to be wasted. All in all, the relationship between food availability and excess body weight resembles a typical input-output function (agricultural production function, diminishing production increments per unit of additional applications of an input, e.g. fertilizer, beyond a certain level).
The tax on fat food (input) – in the context of an input-output function – helps to illustrate the possible impact of a change in input prices (tax on fat food) on the level of output (excess body weight). The right pane of Figure 6 combines the impacts of a tax on excess food energy intake in the input market with the likely effects on the output market (excess body weight). It underlines that the small impacts of the tax on actual food availability are even further reduced as the tax is effective in the flat part of the food energy/body weight curve. The flat part of the curve reflects the fact that a high DES is associated with high levels of waste; societies with more than 3 300 kcals also waste a lot more food and may thus not experience such a rapid increase in the prevalence of excess body weight.
13 Male overweight was chosen because of the larger sample size, which also included low-income countries.
14 A look at the prevalence of excess body weight across different income strata within a country would have been preferable, but was – in the absence of data - impossible.
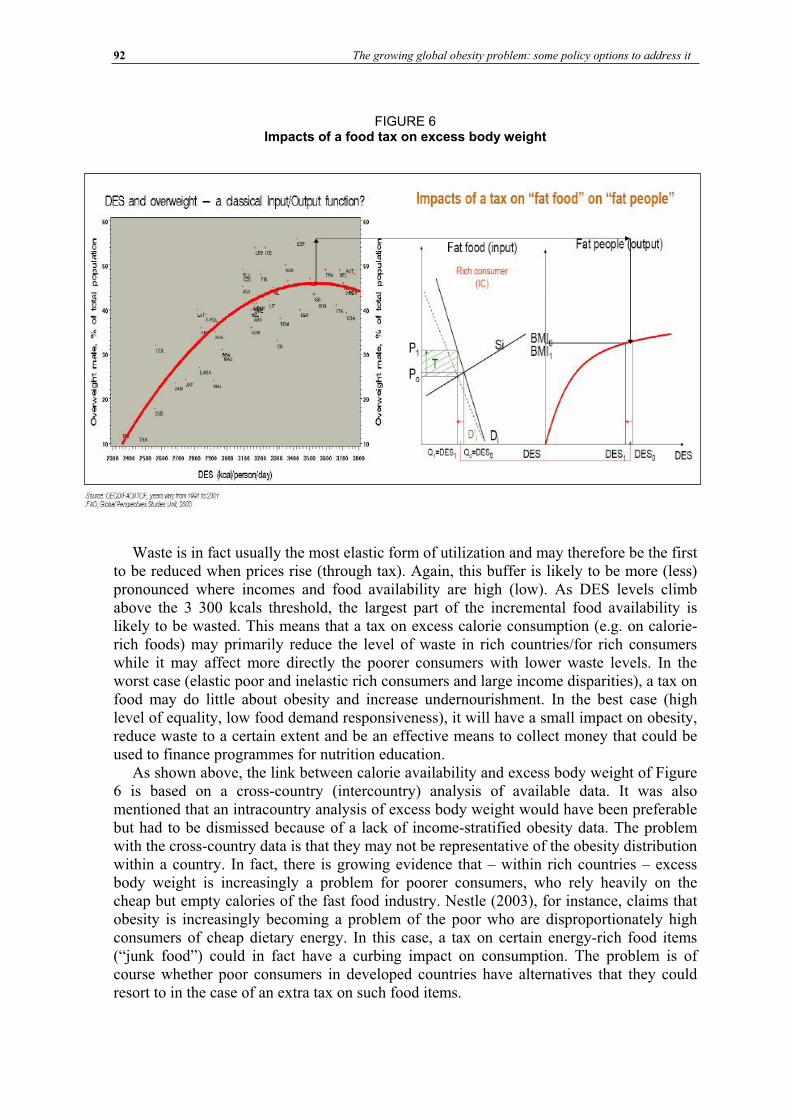
92 The growing global obesity problem: some policy options to address it
FIGURE 6 Impacts of a food tax on excess body weight
Waste is in fact usually the most elastic form of utilization and may therefore be the first to be reduced when prices rise (through tax). Again, this buffer is likely to be more (less) pronounced where incomes and food availability are high (low). As DES levels climb above the 3 300 kcals threshold, the largest part of the incremental food availability is likely to be wasted. This means that a tax on excess calorie consumption (e.g. on calorie-rich foods) may primarily reduce the level of waste in rich countries/for rich consumers while it may affect more directly the poorer consumers with lower waste levels. In the worst case (elastic poor and inelastic rich consumers and large income disparities), a tax on food may do little about obesity and increase undernourishment. In the best case (high level of equality, low food demand responsiveness), it will have a small impact on obesity, reduce waste to a certain extent and be an effective means to collect money that could be used to finance programmes for nutrition education.
As shown above, the link between calorie availability and excess body weight of Figure 6 is based on a cross-country (intercountry) analysis of available data. It was also mentioned that an intracountry analysis of excess body weight would have been preferable but had to be dismissed because of a lack of income-stratified obesity data. The problem with the cross-country data is that they may not be representative of the obesity distribution within a country. In fact, there is growing evidence that – within rich countries – excess body weight is increasingly a problem for poorer consumers, who rely heavily on the cheap but empty calories of the fast food industry. Nestle (2003), for instance, claims that obesity is increasingly becoming a problem of the poor who are disproportionately high consumers of cheap dietary energy. In this case, a tax on certain energy-rich food items (“junk food”) could in fact have a curbing impact on consumption. The problem is of course whether poor consumers in developed countries have alternatives that they could resort to in the case of an extra tax on such food items.
Globalization of food systems in developing countries: impact on food security and nutrition 93
Nevertheless, the disadvantages of food price interventions are likely to outweigh their advantages in reducing or reversing the trend towards a higher prevalence of obesity. For rich consumers, inelastic demand will limit the desired impacts on food demand, while for poor consumers high prices may create an added food insecurity problem. That said, targeted price interventions at the consumer level can have an impact on food consumption patterns if: (i) they are targeted; (ii) demand is reasonably elastic; and (iii) consumers have a choice to shift to healthier foods. Where marketing and processing costs are high and taxes are applied to the final consumer good, the tax revenues could be considerable, the impacts on primary agriculture would be small and thus the trade distortions would be minimal. Where processing margins are small and demand is elastic, tax revenues would be small and the risk of creating adverse impacts on food security could be considerable.
A TAX ON EXCESS BODY WEIGHT: “TAX ON FAT PEOPLE” The low effectiveness and efficiency of a tax on energy-dense foods in reducing excess body weight in affluent societies, its potential for creating added trade problems and the risk of increasing food insecurity in poor societies or poor segments of rich societies pose the question of a more effective alternative. One of the most frequently discussed options is a tax on excess body weight rather than on excess calorie consumption. Colloquially, this proposal is being referred to as a tax on “fat people” as opposed to a tax on “fat food”.
While such a proposal may sound exotic at first, in practice it is not. In fact, there are already various forms of incentives or disincentives in place that aim to reduce excess body weight (or prevent increases in excess body weight). However, none of these measures are referred to as a tax on fat people. Health insurances, for instance, offer discounts on premiums for clients with normal body weights. Car insurers have started to offer discounts to normal weight customers as there is growing evidence that obese drivers have a higher risk of causing an accident. Even fast food chains introduce implicit taxes on overweight people by rejecting obese job applicants (Greenhouse, 2003). On the incentive side, employers offer free access to gyms to their employees even during working hours as there is ample evidence that excess body weight reduces the productivity of their staff and increases disability and sick leave claims (Figure 7). In the United States, probably the most important incentive to reduce excess body weight was brought about by a new policy of the Internal Revenue Service (IRS, 2002), stating that "obesity is medically accepted to be a disease in its own right". For taxpayers, this now means that treatment specifically for obesity can be claimed as a medical tax deduction.15
15 "Uncompensated amounts paid by individuals for participation in a weight-loss program as treatment for a specific disease or diseases (including obesity) diagnosed by a physician are expenses for medical care that are deductible under §213, subject to the limitations of that section."
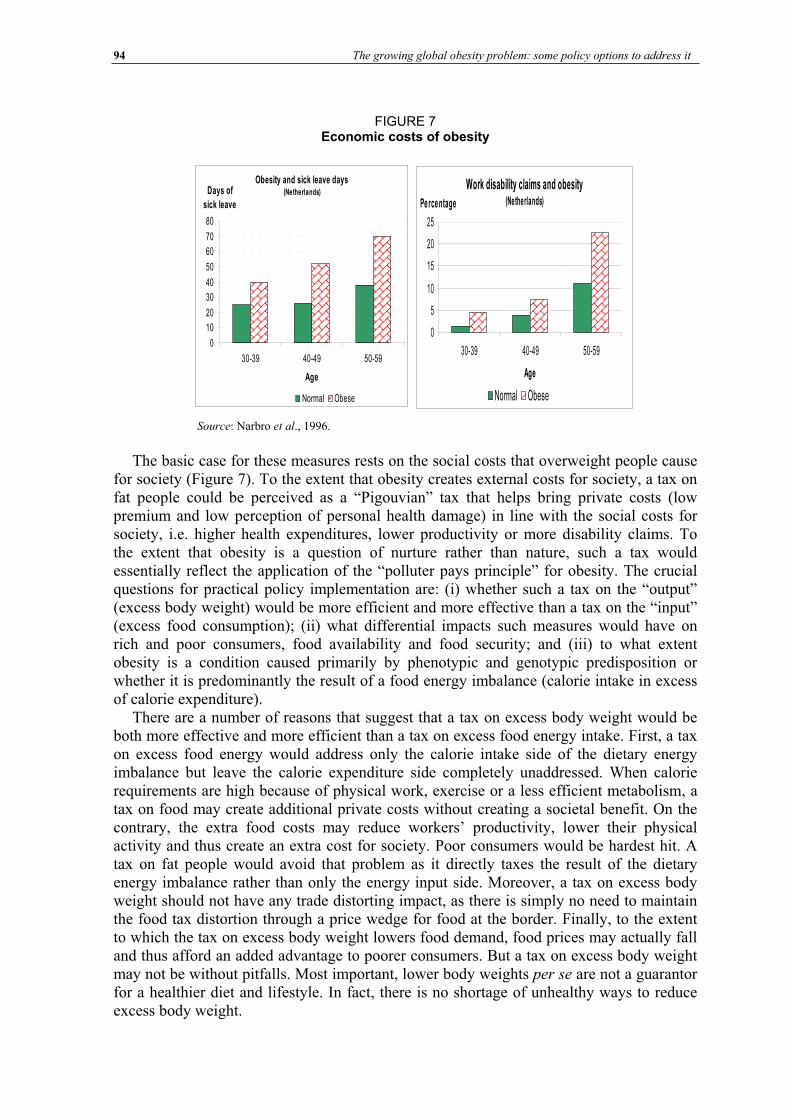
94 The growing global obesity problem: some policy options to address it
FIGURE 7 Economic costs of obesity
Source: Narbro et al., 1996.
The basic case for these measures rests on the social costs that overweight people cause for society (Figure 7). To the extent that obesity creates external costs for society, a tax on fat people could be perceived as a “Pigouvian” tax that helps bring private costs (low premium and low perception of personal health damage) in line with the social costs for society, i.e. higher health expenditures, lower productivity or more disability claims. To the extent that obesity is a question of nurture rather than nature, such a tax would essentially reflect the application of the “polluter pays principle” for obesity. The crucial questions for practical policy implementation are: (i) whether such a tax on the “output” (excess body weight) would be more efficient and more effective than a tax on the “input” (excess food consumption); (ii) what differential impacts such measures would have on rich and poor consumers, food availability and food security; and (iii) to what extent obesity is a condition caused primarily by phenotypic and genotypic predisposition or whether it is predominantly the result of a food energy imbalance (calorie intake in excess of calorie expenditure).
There are a number of reasons that suggest that a tax on excess body weight would be both more effective and more efficient than a tax on excess food energy intake. First, a tax on excess food energy would address only the calorie intake side of the dietary energy imbalance but leave the calorie expenditure side completely unaddressed. When calorie requirements are high because of physical work, exercise or a less efficient metabolism, a tax on food may create additional private costs without creating a societal benefit. On the contrary, the extra food costs may reduce workers’ productivity, lower their physical activity and thus create an extra cost for society. Poor consumers would be hardest hit. A tax on fat people would avoid that problem as it directly taxes the result of the dietary energy imbalance rather than only the energy input side. Moreover, a tax on excess body weight should not have any trade distorting impact, as there is simply no need to maintain the food tax distortion through a price wedge for food at the border. Finally, to the extent to which the tax on excess body weight lowers food demand, food prices may actually fall and thus afford an added advantage to poorer consumers. But a tax on excess body weight may not be without pitfalls. Most important, lower body weights per se are not a guarantor for a healthier diet and lifestyle. In fact, there is no shortage of unhealthy ways to reduce excess body weight.
Obesity and sick leave days (Netherlands)
0
10
20
30
40
50
60
70
80
30-39 40-49 50-59
Age
Days of
sick leave
Normal Obese
Work disability claims and obesity(Netherlands)
0
5
10
15
20
25
30-39 40-49 50-59
Age
Pe rce ntage
Normal Obese
Globalization of food systems in developing countries: impact on food security and nutrition 95
The discussion on the various price and tax intervention mechanisms suggests that there are considerable differences in the efficiency and effectiveness of these measures in helping to reduce the prevalence of obesity. Probably the least efficient and least effective measure would be an intervention at the producer price level. It would also be the measure least compatible with other policy objectives, notably freer trade. While probably more efficient, a tax on consumer prices of food may also cause undesirable side-effects, notably where income inequality is large and where low-income strata react elastically to changes in food prices. A direct tax on excess body weight should be the most efficient and effective measure, but will not be sufficient on its own.
There is also growing evidence (Barker, 1994) that the effect of a phenotypic or genotypic predisposition can crucially affect the occurrence and degree of obesity. Moreover, a high prevalence of obesity in a given generation can be the result of a higher prevalence of undernourishment in the parent generation, and countries that undergo a rapid nutrition transition may suffer most. In this case, the “polluter pays” principle would certainly not apply and could in fact represent a grossly unfair policy measure.
INTEGRATED HEALTH AND NUTRITION PROGRAMMES The preceding discussion suggested that there is no simple or single solution. Instead, there is growing evidence that it will take a combination of policy instruments to address the problem of obesity and related NCDs successfully. Such an integrated programme has, for instance, been launched in Norway and has – overall – yielded very positive results. The details of the programme are available from Norum (1997). Without repeating the details, the correlates of success were: (i) a strong legal and institutional foundation of a population-wide effort in a national organization, i.e. the National Nutritional Council (NNC); (ii) a robust scientific and empirical backing;16 and (iii) a combination of measures (from food price interventions to nationwide food education programmes) embracing a great number of stakeholders. Practical experience in Norway also suggests that there can be a considerable time-lag between the implementation of various measures and the first measurable success.
The Republic of Korea provides another example of a successful nutrition programme. Details are available from Lee, Popkin and Kim (2002). Kim, Moon and Popkin (2000) find that food energy intake and obesity levels in the Republic of Korea are approximately half of what might be expected in a country at that economic level, while vegetable intake is much higher than might be expected. Lee, Popkin and Kim (2002) suggest that a number of factors have contributed to this outcome. First, there has been a strong movement to retain traditional diets and food preparations. At the heart of this movement is a training programme, which has been offered by the Rural Development Administration since the 1980s. The Home Management Division of the Rural Living Science Institute (Suwon, Republic of Korea) has trained thousands of extension workers to provide monthly training sessions in cooking methods for traditional Korean foods, such as rice, kimchi (pickled and fermented cabbage) and fermented soybean products. The programme appears to reach a significant component of the newly married women in the Republic of Korea, but exact statistics are not available. At least to a certain extent, food consumption was also curbed by higher food prices, which were backed by domestic producer price support and border measures. The same combination of food traditions, educational programmes and higher food prices may help to explain the positive nutritional outcome in Japan where, as in
16 For example, the “Oslo Study” or the health surveys of the National Health Screening Service.
96 The growing global obesity problem: some policy options to address it
Norway and the Republic of Korea, the prevalence of obesity and NCDs remained much lower than in other countries of comparable development and income levels (see Figure 1).
SUMMARY AND CONCLUSIONS This paper has analysed some of the currently discussed policy options to reduce or avoid food-related causes of excess body weight and NCDs. The analysis included various options, from food price interventions at various levels to integrated nutrition programmes. Interventions at the producer price level have been identified as the least efficient and the least effective in changing nutritional outcomes and reducing excess body weight. They are also unlikely to be compatible with efforts to liberalize agricultural trade. Consumer price interventions are likely to be more efficient – at least in developed countries – particularly as their effects are not diluted by huge processing margins. But what plagues all price interventions is the fact that those consumers who should reduce excess energy intake are likely to be the least responsive to price increases and will thus not alter their consumption patterns only because food is more expensive. Alas, the opposite holds for poor countries or poor consumers in rich countries where higher food costs could bring about or aggravate undernourishment problems.
Probably more effective and efficient than a tax on food would be a direct tax on excess body weight, i.e. a tax on obesity itself. In fact, many developed countries have already instituted such taxes, mostly in the form of penalties for extra body weight or incentives (premiums/tax brakes) to lose excess body weight. The main advantages are: (i) no negative side-effects on food markets; (ii) compatibility with other policy measures; and (iii) no penalty for consumers who need high-energy intake levels because of a higher calorie expenditure. Moreover, the tax would not only have fewer side-effects but be more effective and efficient as it addresses the excess body weight problem from both sides of the energy balance: the calorie intake side and the calorie expenditure side. The main drawbacks are possible difficulties in the actual implementation and the fact that a lower body weight in itself is no guarantor for a healthier diet.
The discussion of the various price intervention mechanisms also underlined that there is no single measure that is sufficient to address the problem. Where progress towards a healthier diet – and in the sequel a healthier population – has become reality, the underlying policy changes included a broad spectrum of measures. These measures encompassed not only price interventions and premiums but also measures to enhance nutrition transparency and education. But even for such integrated programmes, progress is not immediate and even in developed countries decades may pass before tangible impacts are produced. The diversity and complexity of successful approaches, the time-lag between policy measures and their impacts, the accelerating nutrition transition and predisposition to develop obesity and NCDs underline the urgency for action in developing countries.
Globalization of food systems in developing countries: impact on food security and nutrition 97
Bibliography
Barker, D.J.P. 1994. Mothers, babies and disease in later life. London, BMJ Publishing Group. Barker, D.J.P. 1995. Fetal origins of coronary heart disease. British Medical Journal, 311: 171-174. Bruinsma, J., ed. 2003. World agriculture: towards 2015/2030. An FAO perspective. Rome, FAO and London, Earthscan. Delisle, H. 2002. Programming of chronic disease by impaired fetal nutrition. Evidence and implications for
policy and intervention strategies. WHO Report. WHO/NHD/02.3. Geneva, World Health Organization. FAO. 2003. The State of Food Insecurity in the World 2003. Rome.
FAO. 2004. FAOSTAT data (faostat.fao.org). Fogel, R. 1994. Economic growth, population theory and physiology: the bearing of long-term processes on the making of economic policy. American Economic Rev., 84(3): 369-95. Greenhouse, S. 2003. Obese people are taking their bias claims to court. New York Times, 3 August. Guo, X., Popkin, B.M., Mroz, T.A. & Zhai, F. 1999. Food price policy can favorably alter macronutrient intake in China. J. Nutrition, 129: 994-1001. Internal Revenue Service (IRS). 2002. Ruling 2002-19. Part 1, Section 213 – Medical, dental, etc. expenses. 26 CFR 1.213-1 (also §262; 1.262-1.) and Rev. Ruling 2002-19.Kim, S., Moon, S. & Popkin, B.M. 2000. The nutrition transition in South Korea. American J. Clinical Nutrition, 71: 44-53. King, A. 2002. A tax on fat? EconLog, 17 November. Kynge, J. & Dickie, M. 2003. China encourages mass urban migration. Financial Times, 27 November.Lee, M-J., Popkin, B.M. & Kim, S. 2002. The unique aspects of the nutrition transition in South Korea: the retention of healthful elements in their traditional diet. Public Health Nutrition, 5: 197-203. Marshall, A. 1920. Principles of economics. 8th ed. Book 5, Chapter 6: (2). London, Macmillan. Miller, J. & Colagiuri, S. 1994. The carnivore connection: dietary carbohydrate in the evolution of NIDDM. Diabetologia, 37: 1280-1286. Narbro, K., Jonsson, E., Larsson, B., Waaler, H., Wedel, H. & Sjöstrom, L. 1999. Sick leave and disability pension before and after treatment for obesity. A report from the Swedish Obese Subjects (SOS) study. Int. J. Obesity, 23(6): 619-624. Nestle, M. 2003. Have fat, will sue. Financial Times (suppl.), 14 December. Norum, K.R. 1997. Some aspects of Norwegian nutrition and food policy. In P.S. Shetty & K. McPherson, eds. Diet, nutrition and chronic disease. Lessons from contrasting worlds. Wiley. Popkin, B.M. 1993. Nutritional patterns and transition. Population and Development Rev., 19: 138-157. Regmi, A., Deepak, M.S., Seale, J.L. & Bernstein, J. 2001. Cross-country analysis of food consumption patterns. In Changing structure of global food consumption and trade. Agriculture and Trade Report. WRS-01-1. Market and Trade Economics Division, Economic Research Service, US Department of Agriculture. Schmidhuber, J. & Britz, W. 2002. The impacts of OECD policy reform on international agricultural commodity markets: first results of a quantitative assessment based on the @2030 model. Schriften der Gesellschaft für Wirtschafts- und Sozialwissenschaften des Landbaues e.V., Band 36, Münster-Hiltrup. Seale, J.L., Regmi, A. & Bernstein, J. 2003. International evidence on food consumption patterns. Electronic Report from the Economic Research Service (ERS). Technical Bulletin No. 1904, October. Shetty, P.S. 1997. Diet, lifestyle and chronic disease. Lessons from contrasting worlds. In P.S. Shetty & K. McPherson, eds. Diet, nutrition and chronic disease. Lessons from contrasting worlds. Wiley. Smil, V. 2000. Feeding the world – A challenge for the twenty-first century. Cambridge, Massachusetts and London, MIT Press. UN-HABITAT. 2003. Challenge of slums. Global Report on Human Settlements in 2003. United Nations Human Settlements Programme and London, Earthscan. World Bank. 2002. World Development Indicators. CD-ROM. World Health Organization (WHO). 2003. Nutrition in transition: globalization and its impact on nutrition
patterns and diet-related diseases (www.who.int/nut/trans.htm).