Globalization (or Globalisation) Describes an Ongoing Process by Which Regional

C E P A L R E V I E W 9 5 • A U G U S T 2 0 0 8
103
Globalization and regional development: the economicperformance of Chile’s
regions, 1990-2002
Juan Carlos Ramírez J. and Iván Silva Lira
C loser integration of the Chilean economy into the world economy,
based primarily on use of the country’s comparative advantages, has
contributed significantly to the changes observed in the performance and
the relative positioning of the regions of Chile. This article examines and
compares the dynamics of growth in these regions and explains their
differing performance. The faster-growing regions have become integrated
into the world economy thanks to their renewable and non-renewable
natural resources, the development of agro-industrial exports and the
presence of cities that have linkages with the global economy as providers
of financial and commercial services. Growth in some of the regions has
not necessarily translated into social improvements, and this demonstrates
the need for explicit social policies.
K E Y W O R D S
Globalization
Economic liberalization
Economic growth
Regional development
Exports
Foreign direct investment
Gross domestic product
Comparative analysis
Economic indicators
Chile
Juan Carlos Ramírez J.
Director, Latin American and
Caribbean Institute for Economic
and Social Planning (ILPES)
Iván Silva Lira
Chief, Area for Management
of Local and Regional
Development, ILPES

104 C E P A L R E V I E W 9 5 • A U G U S T 2 0 0 8
GLOBALIZATION AND REGIONAL DEVELOPMENT: THE ECONOMIC PERFORMANCE OF CHILE’S REGIONS, 1990-2002 • JUAN CARLOS RAMÍREZ J. AND IVÁN SILVA LIRA
The success with which the Chilean economy has become integrated with the global economy is one of the key factors behind the changes in the performance and relative positioning of the regions of Chile. This integration has been achieved primarily through use of the country’s comparative advantages. Exports, based essentially on primary and semi-processed products, have become the engine of economic growth. The share of exports in gross domestic product (GDP) rose on average from 20% in 1970 to 40% by the late 1990s.
One component of the economic cycle and its behaviour is the existence of innovative geographic focal points or “clusters”. These have generated changes which, to varying degrees, have had spillover effects in their respective region: in some regions that effect has been intense, in others marginal, and in still others it has been totally missing. Spillover effects make themselves felt through geographic diffusion processes that have characteristic patterns. During these processes of spillover and diffusion, the different
components of the whole (the city, the region or the nation) are transformed at varying paces either through convergence (when less-developed territories progress faster than the more developed) or through divergence (when the opposite occurs).
This article seeks to analyse and compare the growth dynamics of the Chilean regions, using various techniques of regional analysis, to determine which regions are doing well or poorly, and on this basis to explain these differing performances. It attempts ultimately to ascertain why, since the 1990s, there have been no indications of convergence, even if disparities do not seem to have increased.
In both cases (convergence and divergence) the article looks for common factors that infl uence the capacity for growth, to see whether spillover effects can be predicted or whether they are phenomena that depend on other objective conditions of development, accompanied by region-specifi c policies.
The authors are grateful for the valuable collaboration of Luiz Riffo Pérez, especially in processing and analysing growth and external trade data for the regions.
IIntroduction
IIThe external integration of Chile’s regions
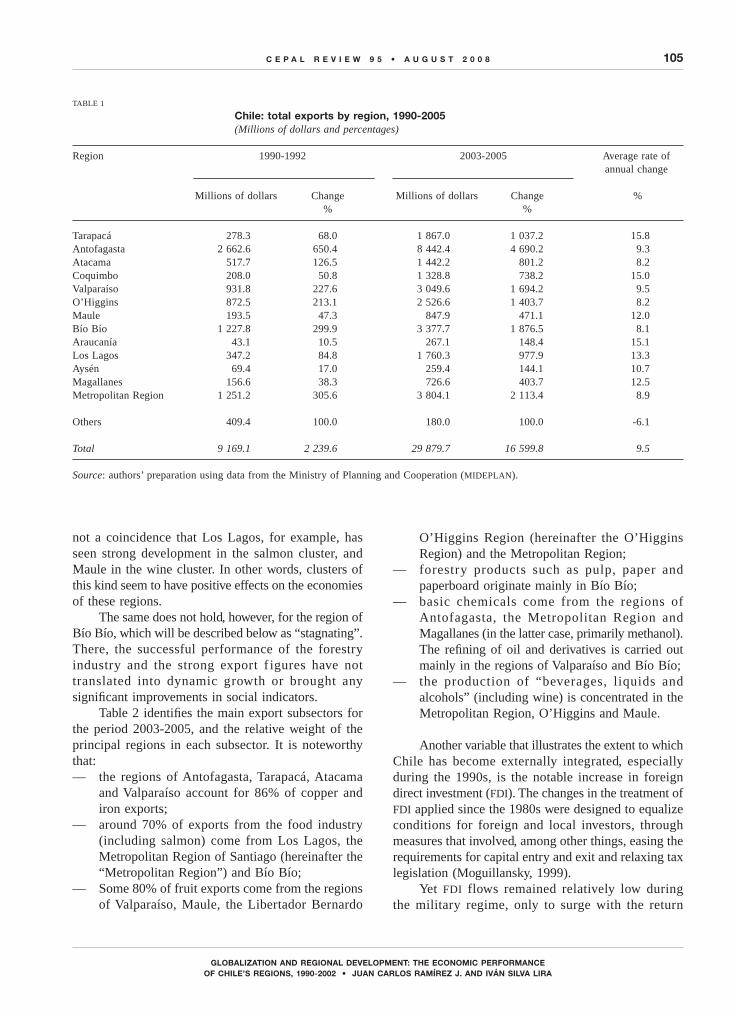
In regional terms, the relative intensity of export development can be seen in the fact that, during 1990-1992, only three regions exported more than US$1 billion, while in 2003-2005 nine regions exceeded that fi gure (table 1).
This process has been particularly intense in regions with commodity export industries, including copper mining, fruit growing, forest products (e.g. pulp and wood chips) and, more recently, fi sheries. In some sectors, studies have shown that the organization of production involves close interaction among stakeholders in the form of clusters. A classic example
of such clusters can be found in the salmon industry, but there are also signifi cant examples in the wine and forestry sectors.1
As will be described below, the “winning” regions, in particular Antofagasta, have seen strong growth in the export mining sector, linked to the mining cluster. That industry has made great efforts to improve materials purchasing and handling, and to bring suppliers into the chain, the aim being to achieve efficiency gains in terms of cost, quality and time which would have a favourable impact on the regional economy. In the “converging” regions (those growing at rates faster than the national average) it is probably
1 See Múñoz (2008).
105C E P A L R E V I E W 9 5 • A U G U S T 2 0 0 8
GLOBALIZATION AND REGIONAL DEVELOPMENT: THE ECONOMIC PERFORMANCE OF CHILE’S REGIONS, 1990-2002 • JUAN CARLOS RAMÍREZ J. AND IVÁN SILVA LIRA
not a coincidence that Los Lagos, for example, has seen strong development in the salmon cluster, and Maule in the wine cluster. In other words, clusters of this kind seem to have positive effects on the economies of these regions.
The same does not hold, however, for the region of Bío Bío, which will be described below as “stagnating”. There, the successful performance of the forestry industry and the strong export f igures have not translated into dynamic growth or brought any signifi cant improvements in social indicators.
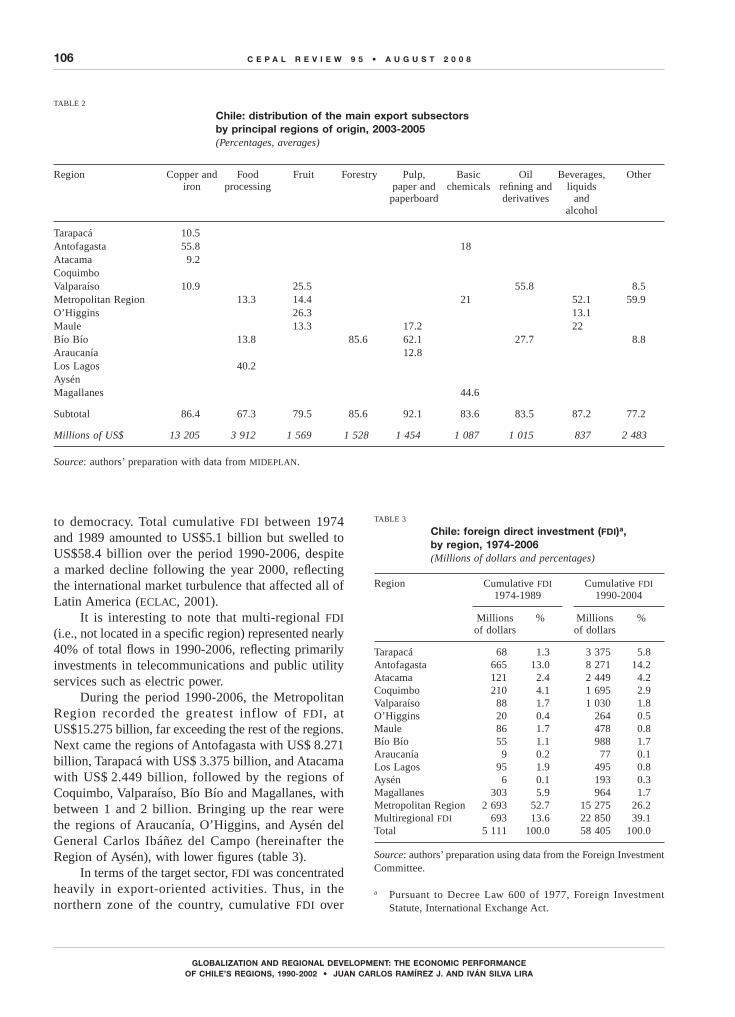
Table 2 identifi es the main export subsectors for the period 2003-2005, and the relative weight of the principal regions in each subsector. It is noteworthy that: — the regions of Antofagasta, Tarapacá, Atacama
and Valparaíso account for 86% of copper and iron exports;
— around 70% of exports from the food industry (including salmon) come from Los Lagos, the Metropolitan Region of Santiago (hereinafter the “Metropolitan Region”) and Bío Bío;
— Some 80% of fruit exports come from the regions of Valparaíso, Maule, the Libertador Bernardo
O’Higgins Region (hereinafter the O’Higgins Region) and the Metropolitan Region;
— forestry products such as pulp, paper and paperboard originate mainly in Bío Bío;
— basic chemicals come from the regions of Antofagasta, the Metropolitan Region and Magallanes (in the latter case, primarily methanol). The refi ning of oil and derivatives is carried out mainly in the regions of Valparaíso and Bío Bío;
— the production of “beverages, liquids and alcohols” (including wine) is concentrated in the Metropolitan Region, O’Higgins and Maule.
Another variable that illustrates the extent to which Chile has become externally integrated, especially during the 1990s, is the notable increase in foreign direct investment (FDI). The changes in the treatment of FDI applied since the 1980s were designed to equalize conditions for foreign and local investors, through measures that involved, among other things, easing the requirements for capital entry and exit and relaxing tax legislation (Moguillansky, 1999).
Yet FDI flows remained relatively low during the military regime, only to surge with the return
TABLE 1
Chile: total exports by region, 1990-2005(Millions of dollars and percentages)
Region 1990-1992 2003-2005 Average rate of annual change
Millions of dollars Change Millions of dollars Change % % %
Tarapacá 278.3 68.0 1 867.0 1 037.2 15.8Antofagasta 2 662.6 650.4 8 442.4 4 690.2 9.3Atacama 517.7 126.5 1 442.2 801.2 8.2Coquimbo 208.0 50.8 1 328.8 738.2 15.0Valparaíso 931.8 227.6 3 049.6 1 694.2 9.5O’Higgins 872.5 213.1 2 526.6 1 403.7 8.2Maule 193.5 47.3 847.9 471.1 12.0Bío Bío 1 227.8 299.9 3 377.7 1 876.5 8.1Araucanía 43.1 10.5 267.1 148.4 15.1Los Lagos 347.2 84.8 1 760.3 977.9 13.3Aysén 69.4 17.0 259.4 144.1 10.7Magallanes 156.6 38.3 726.6 403.7 12.5Metropolitan Region 1 251.2 305.6 3 804.1 2 113.4 8.9
Others 409.4 100.0 180.0 100.0 -6.1
Total 9 169.1 2 239.6 29 879.7 16 599.8 9.5
Source: authors’ preparation using data from the Ministry of Planning and Cooperation (MIDEPLAN).
106 C E P A L R E V I E W 9 5 • A U G U S T 2 0 0 8
GLOBALIZATION AND REGIONAL DEVELOPMENT: THE ECONOMIC PERFORMANCE OF CHILE’S REGIONS, 1990-2002 • JUAN CARLOS RAMÍREZ J. AND IVÁN SILVA LIRA
to democracy. Total cumulative FDI between 1974 and 1989 amounted to US$5.1 billion but swelled to US$58.4 billion over the period 1990-2006, despite a marked decline following the year 2000, refl ecting the international market turbulence that affected all of Latin America (ECLAC, 2001).
It is interesting to note that multi-regional FDI (i.e., not located in a specifi c region) represented nearly 40% of total fl ows in 1990-2006, refl ecting primarily investments in telecommunications and public utility services such as electric power.
During the period 1990-2006, the Metropolitan Region recorded the greatest inflow of FDI, at US$15.275 billion, far exceeding the rest of the regions. Next came the regions of Antofagasta with US$ 8.271 billion, Tarapacá with US$ 3.375 billion, and Atacama with US$ 2.449 billion, followed by the regions of Coquimbo, Valparaíso, Bío Bío and Magallanes, with between 1 and 2 billion. Bringing up the rear were the regions of Araucanía, O’Higgins, and Aysén del General Carlos Ibáñez del Campo (hereinafter the Region of Aysén), with lower fi gures (table 3).
In terms of the target sector, FDI was concentrated heavily in export-oriented activities. Thus, in the northern zone of the country, cumulative FDI over
TABLE 2
Chile: distribution of the main export subsectors by principal regions of origin, 2003-2005(Percentages, averages)
Region Copper and Food Fruit Forestry Pulp, Basic Oil Beverages, Other iron processing paper and chemicals refi ning and liquids paperboard derivatives and alcohol
Tarapacá 10.5 Antofagasta 55.8 18 Atacama 9.2 Coquimbo Valparaíso 10.9 25.5 55.8 8.5Metropolitan Region 13.3 14.4 21 52.1 59.9O’Higgins 26.3 13.1 Maule 13.3 17.2 22 Bío Bío 13.8 85.6 62.1 27.7 8.8Araucanía 12.8 Los Lagos 40.2 Aysén Magallanes 44.6
Subtotal 86.4 67.3 79.5 85.6 92.1 83.6 83.5 87.2 77.2
Millions of US$ 13 205 3 912 1 569 1 528 1 454 1 087 1 015 837 2 483
Source: authors’ preparation with data from MIDEPLAN.
TABLE 3
Chile: foreign direct investment (FDI)a,by region, 1974-2006(Millions of dollars and percentages)
Region Cumulative FDI Cumulative FDI 1974-1989 1990-2004
Millions % Millions % of dollars of dollars
Tarapacá 68 1.3 3 375 5.8Antofagasta 665 13.0 8 271 14.2Atacama 121 2.4 2 449 4.2Coquimbo 210 4.1 1 695 2.9Valparaíso 88 1.7 1 030 1.8O’Higgins 20 0.4 264 0.5Maule 86 1.7 478 0.8Bío Bío 55 1.1 988 1.7Araucanía 9 0.2 77 0.1Los Lagos 95 1.9 495 0.8Aysén 6 0.1 193 0.3Magallanes 303 5.9 964 1.7Metropolitan Region 2 693 52.7 15 275 26.2Multiregional FDI 693 13.6 22 850 39.1Total 5 111 100.0 58 405 100.0
Source: authors’ preparation using data from the Foreign Investment Committee.
a Pursuant to Decree Law 600 of 1977, Foreign Investment Statute, International Exchange Act.

107C E P A L R E V I E W 9 5 • A U G U S T 2 0 0 8
GLOBALIZATION AND REGIONAL DEVELOPMENT: THE ECONOMIC PERFORMANCE OF CHILE’S REGIONS, 1990-2002 • JUAN CARLOS RAMÍREZ J. AND IVÁN SILVA LIRA
the period 1990-2006 was concentrated primarily in mining, to the extent of 93% in Antofagasta, 98% in Tarapacá, 99% in Atacama, and 94% in Coquimbo (table 4).
In the central zone of the country, FDI infl ows targeted mainly the Metropolitan Region, and went primarily to mining and fi nancial services, although there was also signifi cant investment in food, chemicals, electricity, gas and water, and retail trade. In second place came the region of Valparaíso, where FDI was concentrated in electricity, gas and water. The third largest recipient was Bío Bío, which received cumulative FDI primarily in electricity, gas and water and in wood and paper. Bringing up the rear were the Region of Maule, where FDI was concentrated in wood
and paper, electricity, gas and water, and construction; and O’Higgins, where it was channelled mainly into the foods, beverages and tobacco sectors.
Lastly, in the southern zone the greatest fl ows went to the “Magallanes and Antártica Chilena” Region (hereinafter Magallanes Region), and were concentrated in the chemical industry, primarily methanol. Next came Los Lagos, where FDI fl ows were more diversifi ed, distributed between foods, beverages and tobacco, fi sheries and aquaculture, wood and paper, forestry, and agriculture. In third place stood Aysén, with FDI concentrated primarily in mining. Fourth and last was Araucanía, where FDI fl ows went primarily into wood and paper.
TABLE 4
Chile: share of the main subsectors in actual FDI,a by region, cumulative fi gures for 1990-2006(Percentages)
Sector/Region I II III IV V VI VII VIII IX X XI XII MR Multi- Total regional
Agriculture 8.1 5.7
Forestry 5.2 9.0 15.0 5.9
Fisheries and aquaculture 23.2 9.1
Mining and quarries 98.3 93.2 99.7 94.6 69.0 17.5 32.0
Food, beverages and tobacco 56.8 5.0 28.6 27.0 7.2
Wood and paper 44.5 11.8 82.4 22.0
Chemicals, rubber and plastics 8.3 94.4 7.4
Other industries 9.9 12.2 13.6
Electricity, gas and water 69.6 17.5 28.7 26.9 7.8 45.1 21.9
Construction 13.3 8.9
Retail trade 7.1
Transportation and warehousing 8.7 6.1
Communications 26.2 10.7
Financial services and insurance 28.3 14.5 13.1
Other services 9.5 Subtotal 98.3 93.2 99.7 94.6 91.6 92.3 92.2 94.0 97.1 87.2 97.7 94.4 84.7 85.7 77.7
Total (US$ millions ) 3 375 8 271 2 449 1 695 1 030 264 478 988 77 495 193 964 15 275 22 850 58 404
Source: prepared with data from the Foreign Investment Committee.
a Pursuant to Decree Law 600 of 1977, Foreign Investment Statute, International Exchange Act.

108 C E P A L R E V I E W 9 5 • A U G U S T 2 0 0 8
GLOBALIZATION AND REGIONAL DEVELOPMENT: THE ECONOMIC PERFORMANCE OF CHILE’S REGIONS, 1990-2002 • JUAN CARLOS RAMÍREZ J. AND IVÁN SILVA LIRA
Between 1990 and 2004 the Chilean economy grew at an average annual rate of 5%. The distribution of that growth among the regions of the country was highly differentiated.2 In fact a first group of regions, all located in the North, showed growth rates exceeding 6% (regions of Tarapacá, Atacama and Antofagasta). In the intermediate range, with average annual growth rates of between 5% and 6%, came the Metropolitan Region, Los Lagos, and the regions of Aysén, Maule and Coquimbo. The regions of Valparaíso, O’Higgins and Araucanía had below-average growth rates of
between 4% and 5%. Bío Bío and Magallanes turned in lower average growth rates , of 3.8%, , and just 2.1%, respectively (fi gure 1).
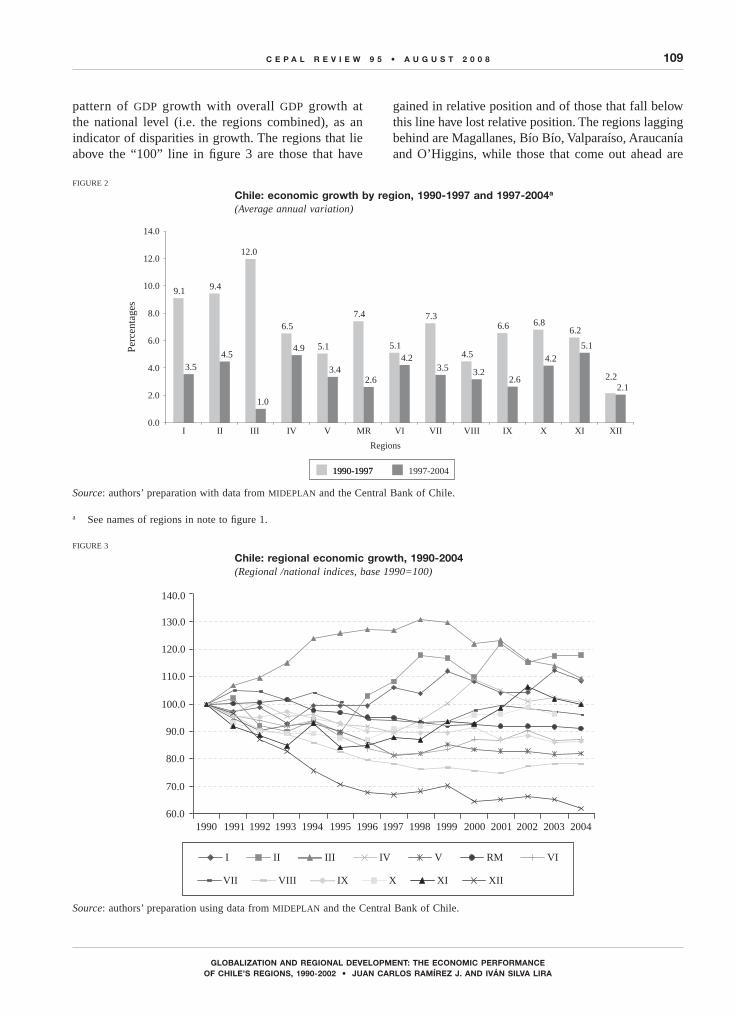
Chile’s overall economic performance in the period 1990-2004 should be analysed bearing in mind that the “Asian crisis” that shook the world economy in 1997 divides this period into two distinct phases. While the Chilean economy grew at an annual average of 7% between 1990 and 1997, it recorded only 3.1% between 1997 and 2004. The loss of momentum observed after 1997 translated into lower average growth rates in all regions of the country, especially in the north and above all in Atacama. The Metropolitan Region, Maule and Araucanía also recorded signifi cantly weaker growth rates (fi gure 2).
Another way of looking at the economic performance of the regions is to compare each region’s
IIIRegional economic performance, 1990-2004
2 Information on regional GDP, prepared by the Central Bank of Chile, is available only to the year 2004 in total terms, and to 2003 in sectoral terms.
FIGURE 1
Chile: regional economic growth, 1990-2004a
(Average annual variation)
Source: authors’ preparation using data from MIDEPLAN and the Central Bank of Chile
a I Region of Tarapacá; II Region of Antofagasta; III Region of Atacama; IV Region of Coquimbo; V Region of Valparaíso; VI Region of O’Higgins; VII Region of Maule; VIII Region of Bío Bío; IX Region of la Araucanía; X Region of los Lagos; XI Region of Aysén; XII Region of Magallanes and XIII Metropolitan Region.
6.3
6.9
6.3
5.7
4.2
5.0
4.7
5.4
3.8
4.6
5.55.7
2.1
0.0
1.0
2.0
3.0
4.0
5.0
6.0
7.0
8.0
I II III IV V MR VI VII VIII IX X XI XII
Per
cent
ages
Regions
National growth rate
109C E P A L R E V I E W 9 5 • A U G U S T 2 0 0 8
GLOBALIZATION AND REGIONAL DEVELOPMENT: THE ECONOMIC PERFORMANCE OF CHILE’S REGIONS, 1990-2002 • JUAN CARLOS RAMÍREZ J. AND IVÁN SILVA LIRA
FIGURE 2
Chile: economic growth by region, 1990-1997 and 1997-2004a
(Average annual variation)
pattern of GDP growth with overall GDP growth at the national level (i.e. the regions combined), as an indicator of disparities in growth. The regions that lie above the “100” line in fi gure 3 are those that have
gained in relative position and of those that fall below this line have lost relative position. The regions lagging behind are Magallanes, Bío Bío, Valparaíso, Araucanía and O’Higgins, while those that come out ahead are
FIGURE 3
Chile: regional economic growth, 1990-2004(Regional /national indices, base 1990=100)
Source: authors’ preparation with data from MIDEPLAN and the Central Bank of Chile.
a See names of regions in note to fi gure 1.
Source: authors’ preparation using data from MIDEPLAN and the Central Bank of Chile.
9.1 9.4
12.0
6.5
5.1
7.4
5.1
7.3
4.5
6.6 6.86.2
2.23.5
4.5
1.0
4.9
3.42.6
4.23.5 3.2
2.6
4.2
5.1
2.1
0.0
2.0
4.0
6.0
8.0
10.0
12.0
14.0
I II III IV V MR VI VII VIII IX X XI XII
1990-19971990-1997 1997-2004
Per
cent
ages
Regions
60.0
70.0
80.0
90.0
100.0
110.0
120.0
130.0
140.0
1990 1991 1992 1993 1994 1995 1996 1997 1998 1999 2000 2001 2002 2003 2004
I II III IV V RM VI
VII VIII IX X XI XII

110 C E P A L R E V I E W 9 5 • A U G U S T 2 0 0 8
GLOBALIZATION AND REGIONAL DEVELOPMENT: THE ECONOMIC PERFORMANCE OF CHILE’S REGIONS, 1990-2002 • JUAN CARLOS RAMÍREZ J. AND IVÁN SILVA LIRA
Antofagasta, Tarapacá, Atacama, Coquimbo, Maule, Aysén and Los Lagos. Since 1997, the Metropolitan Region has tended to converge towards the national average growth rate.
These disparate regional growth performances have not in fact appreciably changed the pattern of concentration of the Chilean economy, but there have been three important shifts in the distribution of national GDP. In the fi rst place, the regions of the North, and Antofagasta and Tarapacá in particular, have increased their relative weight in total GDP. Second, the regions of Bío Bío and Valparaíso, which are the two largest ones after the Metropolitan Region, have been losing relative weight systematically, and have now dropped below 10%. Lastly, in the south of the country, only the Los Lagos region has shown a signifi cant increase (table 5).
TABLE 5
Chile: share in total GDP, 1980-2004(Percentages)
Region 1980-1982 1990-1992 2002-2004
Tarapacá 3 3.0 3.5Antofagasta 6 6.1 7.9Atacama 2 1.6 1.9Coquimbo 2 2.1 2.4Valparaíso 11 9.7 9.0O’Higgins 2 1.9 1.4Maule 5 4.5 4.5Bío Bío 3 3.7 3.8Araucanía 12 11.1 9.7Los Lagos 3 2.8 2.7Aysén 4 4.5 5.0Magallanes 1 0.5 0.6Metropolitan Region 47 48.5 47.8Total 100 100.0 100.0
Source: authors’ preparation using data from MIDEPLAN and the Central Bank of Chile.
IVClassifi cation of regional economies
by growth dynamics
In order to interpret the performance of the regional economies, these have been classif ied using four quadrants (fi gure 4), constructed as follows:
All of a country’s regions are placed on a plane of coordinates that allows them to be classifi ed into four categories according to their relative per capita GDP and their relative per capita GDP growth. The regions that fall to the right have a per capita GDP higher than the national average, and are above the national growth rate, while those that fall to the left are in the inverse situation. The intersection of these two dimensions forms four quadrants. This classification looks for explanations for regional economic performance, and in this respect a proper interpretation is likely to require further information.
The four quadrants shown in fi gure 4 correspond to winning, converging, stagnating or declining regions.(i) Winning regions: dynamic economies with high
per capita GDP. These are the regions that have grown faster than the national average and that also have a per capita GDP higher than the national average. They are thus the regions that are doing
best in economic terms and can be considered to be performing most successfully in the face of globalization. However, the fact that these regions are the “winners” today, because of economic circumstances, does not necessarily mean that their position will be the same tomorrow. If they are to remain successful they will require very proactive policies and attitudes in dealing with the globalized world economy.
(ii) Converging regions: dynamic economies with low per capita GDP. These are regions that have grown at rates above the national average but where per capita GDP is below the national average. The term “converging” indicates that, while they may be relatively poor and trailing behind the other regions (with lower per capita GDP), they have a satisfactory growth rate and they are converging, i.e. they are catching up with the richer regions. They too are “winners”, even if they do not exceed the average national per capita GDP.
(iii) Stagnating regions: sluggish economies with low per capita GDP. These are the regions that have grown more slowly than the national average

111C E P A L R E V I E W 9 5 • A U G U S T 2 0 0 8
GLOBALIZATION AND REGIONAL DEVELOPMENT: THE ECONOMIC PERFORMANCE OF CHILE’S REGIONS, 1990-2002 • JUAN CARLOS RAMÍREZ J. AND IVÁN SILVA LIRA
and whose per capita GDP also falls below the national average. They are “stagnating” because their sluggish economic performance has left them at the rear of the pack, and if they do not take explicit measures their situation is likely to worsen: consequently, they are considered “losers”. Within this quadrant a distinction can be drawn between those that sank into this situation recently and those that have always been there: the latter are economically excluded regions.
(iv) Declining regions: sluggish economies with high per capita GDP. These are the regions that have grown more slowly than the national average, although their per capita GDP is higher than the national average. In the past they may have done well and achieved high levels of per capita GDP, but they have fallen into a period of slow economic growth which has put their relative position at risk.On the basis of available information, fi gure 5
summarizes this four-way classifi cation of the 13 regions into which Chile was divided until 2007.3
FIGURE 5
Chile: classifi cation of regions by quadrants
FIGURE 4
Quadrants plotting regional economic performance
Source: authors’ preparation.
3 Today Chile has 15 regions. Laws 20.174 and 20.175, of March 2007 and October 2007, respectively, created the Region of Los Rios and the Region of Arica and Parinacota. The fi rst was formed from
provinces of the Region of Los Lagos, and the second from provinces of the Region of Tarapacá.
Quadrant -+:converging
Quadrant ++:winning
MauleLos LagosCoquimbo
AntofagastaTarapacáAtacamaAysén
AraucaníaO’HigginsValparaíso
Bío Bío
Metropolitan RegionMagallanes
Quadrant --:stagnating
Quadrant +-:declining
Source: authors’ preparation.
0
1
2
3
4
-1
-2
-3
-4
100 110 120 130 140 150 16090807060504030
2
Converging regions:dynamic economies with
low per capita GDP
1
Winning regions:dynamic economies with
high per capita GDP
4
Declining regions:sluggish economies with
high per capita GDP
3
Stagnating regions:sluggish economies with
low per capita GDP
Dev
iati
on f
rom
ave
rage
nat
iona
l gr
owth
rat
e (p
erce
ntag
e po
ints
)
Index of average national per capita GDP
170

112 C E P A L R E V I E W 9 5 • A U G U S T 2 0 0 8
GLOBALIZATION AND REGIONAL DEVELOPMENT: THE ECONOMIC PERFORMANCE OF CHILE’S REGIONS, 1990-2002 • JUAN CARLOS RAMÍREZ J. AND IVÁN SILVA LIRA
The available information can be further analyzed using the “shift-share” method to classify different regions in light of their economic performance, and then to seek different interpretations of that performance.
The shift-share method compares the observed change in a variable —in this case GDP— over a period of time, in each region and in the country as a whole, against the change that would have occurred in each of the regions if GDP performance had been identical in all regions and in the country as a whole. Figure 6 ranks the regions of Chile in accordance with a shift-share analysis for 1990-2002. The diagonal line in the fi gure distinguishes two categories of regions: those that are above the diagonal show a positive total effect (they are dynamic), while those below the line show a negative total effect (they are lagging). This total effect can be broken down into a differential effect and a structural effect.4
For each of these situations we can posit three alternatives. Thus we have six groups of regions:(i) Dynamic, with good performance and sound
structure: regions that have been winners in all aspects: their economic sectors have outperformed the same sectors at the national level, and their
structural mix is specialized in activities that have been growing rapidly at the national level.
(ii) Dynamic, with good performance and poor structure: regions where specific sectors have outperformed the same sectors at the national level, but where the structural mix, particularly in the base year, was not specialized in fast-growing sectors.
(iii) Dynamic, with poor performance and sound structure: regions where sectoral performance has fallen short of national averages, but where the structural effect has been able to offset that poor performance thanks to a specialization in sectors that are growing rapidly at the national level.
(iv) Lagging, with poor performance and poor structure: regions that have lost ground in every respect, because growth in their sectors at the regional level has been slower than the average growth in those sectors at the national level, and because their structural mix has not been specialized in activities exhibiting fast growth at the national level.
(v) Lagging, with poor performance and good structure: regions where sectoral performance has fallen short of national averages for the same sectors but which, because they are specialized in sectors that are growing rapidly, have been able to offset this decline in part, although not enough to avoid losing ground.
(vi) Lagging, with good performance and poor structure: regions that have performed respectably but not
4 Following is a more detailed explanation of each of these effects:Total effect: this is the difference (positive or negative) between the current value of a region’s GDP and the hypothetical value it would have if it had grown at the same pace as the country. Consequently, a positive effect indicates that the region is more dynamic than the country as a whole.Differential effect: this is the difference in GDP growth of each regional sector versus the value that GDP would have achieved if the sector had grown regionally at the same rate as nationally. The sum of the sectoral differences may be positive or negative, which will determine the sign of the differential effect. This factor explains the portion of the total difference attributable to different regional rates of growth (or contraction), which means that a given activity may show different rates of change at the regional and national level.Structural effect: this is obtained mathematically as the difference between the total effect and the differential effect. Its importance lies in explaining that portion of the total difference attributable to whether the region specializes or not in activities which, at the national level, have behaved very differently from the average for the entire economy. In other words, this factor explains what portion of the (hypothetical) difference can be attributed to the fact that the regional structure is different from (or similar to) the national structure. For example, a positive effect would mean that the region is specialized in activities that have grown rapidly at the national level. Consequently, when we speak of the region’s good performance and sound structure, what we mean is that its economic sectors have grown, on average, more than those same sectors have grown at the national level and that, in terms of structure, it is specialized in sectors which, at the national level, have grown rapidly.
FIGURE 6
Chile: classifi cation of regions by growth dynamics, using the shift-share method, 1990-2002a
DE+ DE-
SE+
SE-
TarapacáAntofagastaAtacamaCoquimbo
MauleLos LagosMetropolitanAysén
O’HigginsBío Bío
Araucanía
ValparaísoMagallanes
Source: authors’ preparation.
a DE = differential effect. SE = structural effect.
113C E P A L R E V I E W 9 5 • A U G U S T 2 0 0 8
GLOBALIZATION AND REGIONAL DEVELOPMENT: THE ECONOMIC PERFORMANCE OF CHILE’S REGIONS, 1990-2002 • JUAN CARLOS RAMÍREZ J. AND IVÁN SILVA LIRA
well enough to lift them above national averages, because they are specialized in sectors that have been growing slowly at the national level.Figure 5 above is based on the per capita GDP
trend, and fi gure 6 on the total GDP trend. By cross-referencing the data from the two fi gures, we see that the same regions emerge from both as “winners”. Thus, the regions that appear in the “winning” quadrant in fi gure 5 normally exhibit a positive overall effect when analysed via the shift-share method, i.e. they are above the diagonal in fi gure 6, even if they do not exhibit all three positive effects.
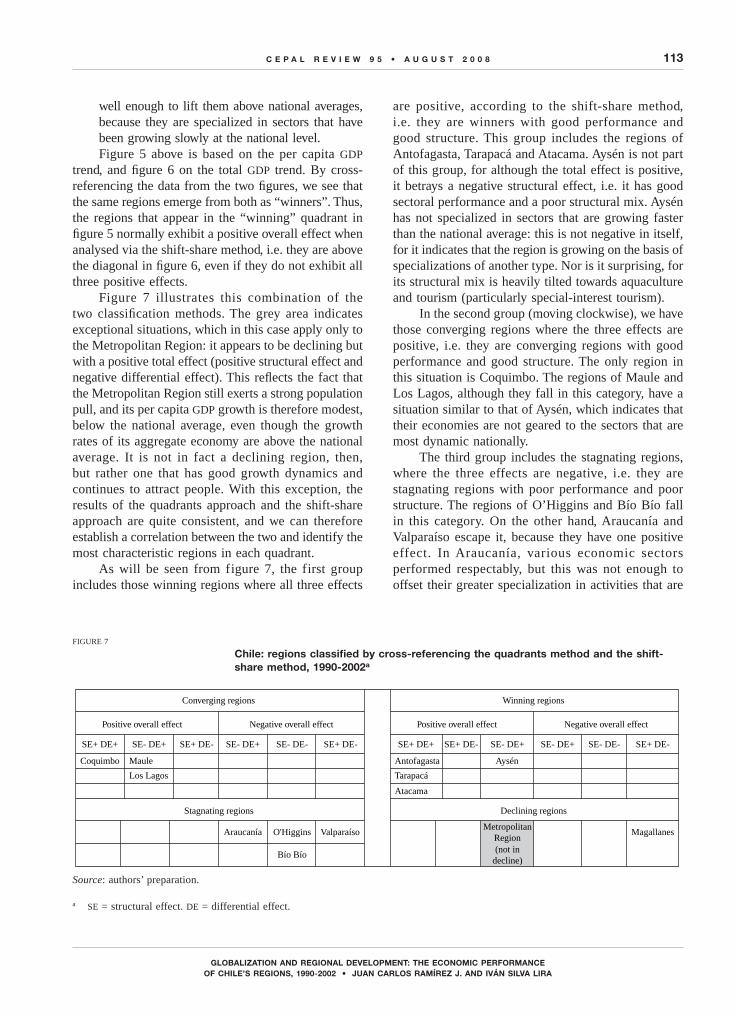
Figure 7 illustrates this combination of the two classifi cation methods. The grey area indicates exceptional situations, which in this case apply only to the Metropolitan Region: it appears to be declining but with a positive total effect (positive structural effect and negative differential effect). This refl ects the fact that the Metropolitan Region still exerts a strong population pull, and its per capita GDP growth is therefore modest, below the national average, even though the growth rates of its aggregate economy are above the national average. It is not in fact a declining region, then, but rather one that has good growth dynamics and continues to attract people. With this exception, the results of the quadrants approach and the shift-share approach are quite consistent, and we can therefore establish a correlation between the two and identify the most characteristic regions in each quadrant.
As will be seen from figure 7, the first group includes those winning regions where all three effects
are positive, according to the shift-share method, i.e. they are winners with good performance and good structure. This group includes the regions of Antofagasta, Tarapacá and Atacama. Aysén is not part of this group, for although the total effect is positive, it betrays a negative structural effect, i.e. it has good sectoral performance and a poor structural mix. Aysén has not specialized in sectors that are growing faster than the national average: this is not negative in itself, for it indicates that the region is growing on the basis of specializations of another type. Nor is it surprising, for its structural mix is heavily tilted towards aquaculture and tourism (particularly special-interest tourism).
In the second group (moving clockwise), we have those converging regions where the three effects are positive, i.e. they are converging regions with good performance and good structure. The only region in this situation is Coquimbo. The regions of Maule and Los Lagos, although they fall in this category, have a situation similar to that of Aysén, which indicates that their economies are not geared to the sectors that are most dynamic nationally.
The third group includes the stagnating regions, where the three effects are negative, i.e. they are stagnating regions with poor performance and poor structure. The regions of O’Higgins and Bío Bío fall in this category. On the other hand, Araucanía and Valparaíso escape it, because they have one positive effect. In Araucanía, various economic sectors performed respectably, but this was not enough to offset their greater specialization in activities that are
FIGURE 7
Chile: regions classifi ed by cross-referencing the quadrants method and the shift-share method, 1990-2002a
Source: authors’ preparation.
a SE = structural effect. DE = differential effect.
Converging regions
Stagnating regions
Positive overall effect Negative overall effect
SE+ DE+ SE- DE+ SE+ DE- SE- DE+ SE- DE- SE+ DE-
Winning regions
Declining regions
Positive overall effect Negative overall effect
SE+ DE+ SE+ DE- SE- DE+
Coquimbo Maule Antofagasta
Los Lagos Tarapacá
Atacama
Aysén
SE- DE+ SE- DE- SE+ DE-
Araucanía O'Higgins
Bío Bío
ValparaísoMetropolitan
Region(not in
decline)
Magallanes

114 C E P A L R E V I E W 9 5 • A U G U S T 2 0 0 8
GLOBALIZATION AND REGIONAL DEVELOPMENT: THE ECONOMIC PERFORMANCE OF CHILE’S REGIONS, 1990-2002 • JUAN CARLOS RAMÍREZ J. AND IVÁN SILVA LIRA
sluggish at the national level. In the case of Valparaíso, its structural mix cannot offset the poor performance of its sectors.
In the fourth group are the declining regions, for which the three effects are negative, i.e. they are declining regions with poor performance and poor structure. None of Chile’s regions falls into this category. The region of Magallanes has a positive structural effect, which compensates, to some extent, for the poor sectoral performance.
Figure 8 presents a typology for the regions allocated to each quadrant. The regions from each quadrant can be classified as to the type of sector (primary or secondary) that is most representative of economic changes in each region.
This typology makes it clear that the winning regions owe their growth primarily to primary industries, in this case mining and fi sheries, which typically involve the exploitation of an exportable natural or semi-processed resource. Among the converging regions, there are some (Coquimbo and Los Lagos) where the primary sector, which accounts for their better performance has in recent years grown faster or produced greater value and also involves exportable natural resources. In others, the greatest boost to growth comes from manufacturing (i.e., the secondary sector): thus, in Maule, manufacturing is closely linked to the forestry and food industries, which are highly integrated into the world economy. Among the stagnating regions, some are still dominated by traditional, low-productivity primary industries normally geared to domestic markets and with few prospects of restructuring (O’Higgins and Araucanía). In others there is a recognized manufacturing tradition which, as the result of liberalization and restructuring, has been losing its capacity to generate wealth: this is the case in Valparaíso and also in Bío Bío, where the textile industry in particular has fallen on hard times. In the declining regions, some have lost ground in terms of their competitiveness because of depletion of resources or collapse in the primary sector: this is what has happened with the oil and coal industries on which
FIGURE 8
Chile: typology of regions by nature of their most important economic sectora
Source: authors’ preparation.
a The numbers shown to the right of each region are an index of its position vis-à-vis the national average (index 100).
Magallanes based most of its growth expectations. The Metropolitan Region, despite relatively robust growth, has been de-industrializing because of changes in national incentives policies or opening up of the economy, or both: its industries, geared primarily to the domestic market, are consequently becoming uncompetitive. Moreover, as noted earlier, this region continues to attract great numbers of people, and this drives down per capita GDP.
The following sections offer a more detailed analysis of each of the quadrants and the regions they contain.
Quadrant -+:Converging regions
Quadrant ++:Winning
Most representative sector:Primary representative
Coquimbo
PrimaryLos Lagos 72.5
SecondaryMaule 64.1
Most representative sector:primary representative
Antofagasta 250.7Tarapacá 128.4Atacama 104.8
PrimaryAysén 100.5
Most representative sector:primary representative
O’Higgins 88.0
PrimaryAraucanía 47.2
Most representative sector:secondary representative
Bío Bío 76.1
SecondaryValparaíso 88.5
PrimaryMagallanes 136.2
SecondaryR.Metropolitana 118.7
Quadrant - -:Stagnating
Quadrant +-:Declining

115C E P A L R E V I E W 9 5 • A U G U S T 2 0 0 8
GLOBALIZATION AND REGIONAL DEVELOPMENT: THE ECONOMIC PERFORMANCE OF CHILE’S REGIONS, 1990-2002 • JUAN CARLOS RAMÍREZ J. AND IVÁN SILVA LIRA
These regions are “winners” that are expanding their lead over the relatively less developed regions. We can distinguish at least three situations to explain their relatively fast-rising per capita GDP.
1. Regions of Tarapacá and Antofagasta
Both regions are heavily dependent on exportable mining resources, primarily copper, and their relatively greater dynamism reflects that specialization. The degree of specialization in both regions is high: the exportable mining sector represents 25.1% of regional GDP in Tarapacá, and 62.7% in Antofagasta.5 When analysed using the shift-share method, these regions reveal a positive total effect, refl ecting primarily a high percentage of positive gains in the sectors of specialization (table 6). Both regions have made the most of their very clear and strong competitive advantage in mining, which has attracted foreign and domestic investment, and they have succeeded in projecting themselves to the world through their exports, in an environment of openness fostered by national economic policies. It may be said that globalization is favourable
and opportune for regions that compete essentially on the basis of a natural advantage.
The importance of copper mining is expressed in terms of the value of copper exports, which expanded from US$ 5 million in 1990 to US$ 3.5 billion in 2006 in the case of Tarapacá, and from US$ 2.1 billion to US$ 17.4 billion in Antofagasta during the same period. Between 1990 and 2006 Tarapacá attracted US$ 3.3 billion in FDI to the mining industry, and Antofagasta US$ 7.8 billion.
Social indicators in both regions have exceeded the national average. Antofagasta had the lowest proportion of people living in poverty (11.2%) in 2003. Household incomes are at or above the national average. In other indicators of social performance, such as average length of schooling, both regions are again ahead of the national average.
Yet it remains to be seen whether the mix of production and services in these regions can be strengthened and diversif ied apace with mining development so that the latter can contribute even more strongly to their economies. These regions are winners today, but will they be able to build further competitive
VWinning regions: dynamic economies
with high per capita GDP
TABLE 6
Chile: Winning regions and sectors with the greatest impact
Sector Regions Principal product % of regional GDP Specialization % of total effect quotient due to sector
Mining Tarapacá Copper 25.1 2.9 162.1 Antofagasta Copper 62.7 7.3 38.8
Fisheries Aysén Wild and farmed fi sh 27.9 16.2 149.9
Electricity, gas and water Atacama Electricity 6.8 2.1 67.5
Source: authors’ preparation.
5 Table 6 includes a specialization indicator which, in regional analysis techniques, is known as the location coeffi cient. If the coeffi cient for a given industry is greater than unity, the region is said to be specialized in that industry. The indicator is defi ned as the industry’s percentage contribution to regional GDP divided by the
same industry’s percentage contribution to national GDP. In Aysén, for example, the quotient of 16.2 (fi gure 6) indicates that the weight of the fi sheries industry is 16.2 times as high in that region as at the national level. This is an extraordinarily high value, indicating a very high degree of specialization.

116 C E P A L R E V I E W 9 5 • A U G U S T 2 0 0 8
GLOBALIZATION AND REGIONAL DEVELOPMENT: THE ECONOMIC PERFORMANCE OF CHILE’S REGIONS, 1990-2002 • JUAN CARLOS RAMÍREZ J. AND IVÁN SILVA LIRA
advantages that will ensure sustainable development over time? It must be remembered that, during the Asian crisis, it was these regions that suffered the highest increases in unemployment, a fact that suggests the need for greater diversifi cation.
2. Region of Aysén
Aysén is growing vigorously, thanks to a booming fi sheries industry that represents about 30% of regional GDP and reveals a very high specialization coeffi cient of 16.2. Around 80% of total growth in the region between 1990 and 2002 may be attributed to the fisheries industry, which is heavily export-oriented. Food exports, primarily of fi sh, rose from US$ 51 million in US$ 1990 to around US$ 270 million in 2006.
In recent years this region has been one of the primary areas of geographic expansion for the salmon industry, which today holds second place in the country’s basket of exports. As in Los Lagos, the salmon business in Aysén faces some important challenges with respect to its environmental impact, and these could frustrate the tourism development strategies and initiatives that are now being explored and pursued in the region.
The region’s economic growth, together with a strong injection of public funds per capita, has improved social conditions, raising household incomes and reducing the proportion of people living in poverty. Yet certain social indicators, such as average years of schooling, still fall short of the national average.
3. Region of Atacama
Like Tarapacá and Antofagasta, this is predominantly a mining region. Here, the mining industry makes its weight felt indirectly, as it is the electricity, gas and
water sector that has contributed most to regional growth. The greatest boost has come from electricity, in particular with the construction of a new power plant for which the region’s major mining companies are in fact the main customers.
The region experienced its greatest boom in the fi rst half of the 1990s, when its average growth rate (12%) was the highest in the country, thanks largely to copper megaprojects such as La Candelaria and some big electricity projects. There was also signifi cant expansion of fruit growing for export (primarily grapes), and this helped to sustain the economy when it was hit by fl uctuations in world markets for mining products. Those fl uctuations were enough in fact to cut the annual average growth rate in the second half of the 1990s from 12% to only 1%. Recent years have seen renewed interest in mining projects, especially for gold and silver, and this has sparked a heavy infl ow of foreign investment. One of the largest projects of this kind is Pascua Lama.
Volatility in the mining industry has produced major swings in the region’s social indicators. Thus, between 1996 and 1998 Atacama was the only region in the country where poverty increased, and in 2003 it was still one of the four regions of Chile with the highest percentage of poor people.
In conclusion, it can be argued that in this group of regions, international integration based on natural resources (minerals and fi sh) has had a positive impact on their economic and social development prospects. Yet if their development is to be sustainable they will need to make greater efforts to diversify production and generate sectoral linkages —especially in the case of mining, which relies on resources that are not renewable over the long term— and to deal more aggressively with the environmental risks associated with these activities.
VIConverging regions: dynamic economies with
low per capita GDP
While these regions have a per capita GDP below that of the country, they are in a promising position because they could narrow the gap with the more advanced regions if they can maintain their relative dynamism over time.
Table 7 summarizes information on the regions of Coquimbo, Los Lagos and Maule, and identifi es three situations that explain their stronger performance.

117C E P A L R E V I E W 9 5 • A U G U S T 2 0 0 8
GLOBALIZATION AND REGIONAL DEVELOPMENT: THE ECONOMIC PERFORMANCE OF CHILE’S REGIONS, 1990-2002 • JUAN CARLOS RAMÍREZ J. AND IVÁN SILVA LIRA
1. Region of Coquimbo
In recent years, this region has joined the copper boom, with development of the Los Pelambres mining project. The fact that mining accounts for 25.1% of regional GDP , and that the region’s specialization quotient is around 3 attests to the importance of this sector for the regional economy. Indeed, mining contributes as much as 87% to the total impact. Between 1990 and 2006, the mining sector accounted for nearly 70% of the total value of regional exports and absorbed almost 95% of FDI infl ows to the region, which stood at a cumulative amount of some US$ 1.7 billion.
Despite its growing specialization in mining, Coquimbo’s economy is more diversified than that of Tarapacá, Antofagasta or Atacama. Of particular importance here is the production of fruit for export: fruit exports jumped from US$ 26 million in 1990 to close to US$ 220 million in 2006.
There has also been expansion in activities related to tourism, a sector of growing importance in the global economy. This expansion is refl ected in such activities as transportation and communications, retail trade, restaurants and hotels, where growth rates exceed the region’s average pace of growth.
This sound economic performance explains in part the signifi cant improvement in social conditions. Between 1990 and 2003, Coquimbo achieved the greatest reduction in poverty of any region in the country —from 45.3% to 21.5%— and household incomes improved, narrowing from 25% to 16% the gap between the regional and national averages.
2. Region of Los Lagos
This region is heavily involved in the fi sheries sector, and appears to have exploited its signifi cant comparative advantage in primary industries. It is highly specialized in fi sheries, as refl ected in a specialization quotient of 10.8. Compared to the mining regions, its sectors
of specialization have lesser weight (18.6%) in regional GDP.
Fisheries activity is geared above all to the industrial-scale production of salmon, which has greatly transformed the regional economy. Fish production rose from 4.3% of regional GDP in 1990 to nearly 19% in 2002. At the same time, forestry and agriculture saw their share of regional GDP decline from 17% to 10.6%. The effects of this shift can be seen in the region’s productive mix, its labour market, and its human capital.
The establishment of the salmon industry in Chile is worthy of study for several reasons: for its economic importance, for the speed with which, as an industry new to the country, it was able to move along the learning curve to achieve aquaculture production on a massive scale, for the way it has integrated itself into a globalized business sector, and for the manner in which, from the outset, it has incorporated itself into the regional economy. Salmon farming, as it has taken shape in Los Lagos, constitutes what in the specialized literature is known as a cluster, i.e. a concentration of producing fi rms that pursue certain competitive advantages to maintain a position in the world market.6
Salmon exports, originating largely in this region, rose from US$ 38 million in 1989 to US$ 1.721 billion in 2005, when they represented 4.4% of Chilean exports. Virtually all output from salmon and trout farming in Chile is destined for external markets and, contrary to what one might think and to what has happened with other businesses dependent on natural resources, salmon farming in Chile has become a topic of interest because of the technological learning curve it has followed on its way to large-scale production, which is an essential condition for developing competitive capacities, particularly at the regional level.
TABLE 7
Chile: converging regions and sectors of greatest impact
Sector Regions Principal product % of regional GDP Specialization % of total effect quotient due to sector
Mining Coquimbo Copper 25.1 2.9 87.0Fisheries Los Lagos Wild and farmed fi sh 18.6 10.8 170.1Industry Maule Wood pulp 20.5 1.2 110.1
Source: authors’ preparation.
6 See Muñoz (2008) and Montero (2004).

118 C E P A L R E V I E W 9 5 • A U G U S T 2 0 0 8
GLOBALIZATION AND REGIONAL DEVELOPMENT: THE ECONOMIC PERFORMANCE OF CHILE’S REGIONS, 1990-2002 • JUAN CARLOS RAMÍREZ J. AND IVÁN SILVA LIRA
3. Region of Maule
This region has experienced vigorous growth, thanks primarily to the strong performance of the manufacturing sector and the forestry and agriculture sector, both of which increased their share in regional GDP over the period 1990-2002 and have determined the region’s export bias. In forestry and agriculture, the most important factor has been the increased value of fruit exports, from slightly under US$ 40 million in US$ 1990 to US$ 217 million in 2006. Wood pulp and wines have been the most dynamic manufacturing segments: between 1990 and 2006, pulp exports rose from US$ 72 million to US$ 270 million, and wines from US$ 4 million to US$ 212 million. The wine industry is a particularly interesting phenomenon, because of its great potential for productive linkages and its capacity to generate innovation. These advantages are less apparent in pulp production, where there are fewer spillover effects: yet between 1990 and 2006 this industry received the largest share of FDI fl ows, amounting to US$ 212 million and representing 45% of the regional total.
Despite its very dynamic economy, Los Lagos continues to lag in social terms. While poverty dropped from 43% to 23.1% between 1990 and 2003, average household incomes declined: they were 30% below the national average in 2003, compared to a gap of 15% in 1990.
The average number of years of schooling in the region is still well below the national average, moving from 7.5 years in 1990 to 8.7 years in 2003, compared with national fi gures of 9 years and 10.2 years, respectively.
In conclusion, the regions in this group have initiated interesting growth processes associated with recent successes with industrial restructuring. In some cases, with the revolution in technology and communications (the basis of the new wave of globalization), they have begun to exploit latent competitive advantages, such as an economy based essentially on exports of primary products or the presence of local resources to which they can add value through processing. These regions could be characterized, then, as potential winners which, in the face of globalization, have put latent local assets to good use.
VIIStagnating regions: sluggish economies
and low per capita GDP
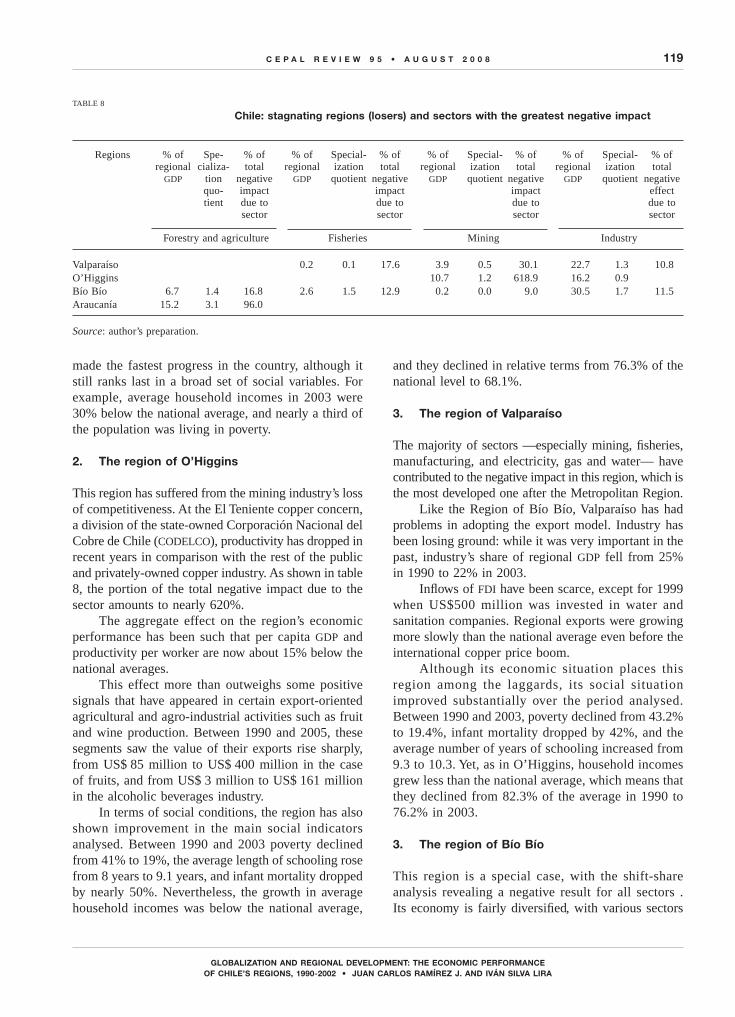
This group consists of the regions that are considered “losers”: not only is their per capita GDP below the national average, but they also exhibit weak economic growth (table 8). If these trends continue, they will fi nd themselves lagging even further behind the most advanced regions.
1. The region of Araucanía
Highly specialized in the forestry and agriculture sector, this region, has experienced a signifi cant decline in economic activity, betraying in general a productive structure that exports little and is oriented to the domestic market. Consequently, it has had to deal with the pressure of imported products from a very uncompetitive position.
This situation has caused a major loss of share for the forestry and agriculture sector in regional GDP and a decline in its specialization quotient, meaning
that the region is no longer especially focused on this activity. In fact, its share in regional GDP shrank from 20% to around 15% from the early 1990s to the date of the latest statistics.
At the aggregate level, the region’s GDP and its per capita productivity are more than 50% below the respective national averages.
In terms of international integration, the region has received almost no FDI in recent decades, and its export levels (together with those of Aysén) are the lowest in the country. Those levels have risen in recent years, thanks mainly to the establishment of a pulp plant that accounts for nearly 70% of regional exports.
The region’s weak economic condition goes hand in hand with a fragile social situation. Yet, like the other regions, it has made substantial progress over the last 15 years, as expressed for example in lower infant mortality and a sharp increase in average years of schooling. In these aspects the region has
119C E P A L R E V I E W 9 5 • A U G U S T 2 0 0 8
GLOBALIZATION AND REGIONAL DEVELOPMENT: THE ECONOMIC PERFORMANCE OF CHILE’S REGIONS, 1990-2002 • JUAN CARLOS RAMÍREZ J. AND IVÁN SILVA LIRA
made the fastest progress in the country, although it still ranks last in a broad set of social variables. For example, average household incomes in 2003 were 30% below the national average, and nearly a third of the population was living in poverty.
2. The region of O’Higgins
This region has suffered from the mining industry’s loss of competitiveness. At the El Teniente copper concern, a division of the state-owned Corporación Nacional del Cobre de Chile (CODELCO), productivity has dropped in recent years in comparison with the rest of the public and privately-owned copper industry. As shown in table 8, the portion of the total negative impact due to the sector amounts to nearly 620%.
The aggregate effect on the region’s economic performance has been such that per capita GDP and productivity per worker are now about 15% below the national averages.
This effect more than outweighs some positive signals that have appeared in certain export-oriented agricultural and agro-industrial activities such as fruit and wine production. Between 1990 and 2005, these segments saw the value of their exports rise sharply, from US$ 85 million to US$ 400 million in the case of fruits, and from US$ 3 million to US$ 161 million in the alcoholic beverages industry.
In terms of social conditions, the region has also shown improvement in the main social indicators analysed. Between 1990 and 2003 poverty declined from 41% to 19%, the average length of schooling rose from 8 years to 9.1 years, and infant mortality dropped by nearly 50%. Nevertheless, the growth in average household incomes was below the national average,
and they declined in relative terms from 76.3% of the national level to 68.1%.
3. The region of Valparaíso
The majority of sectors —especially mining, fi sheries, manufacturing, and electricity, gas and water— have contributed to the negative impact in this region, which is the most developed one after the Metropolitan Region.
Like the Region of Bío Bío, Valparaíso has had problems in adopting the export model. Industry has been losing ground: while it was very important in the past, industry’s share of regional GDP fell from 25% in 1990 to 22% in 2003.
Infl ows of FDI have been scarce, except for 1999 when US$500 million was invested in water and sanitation companies. Regional exports were growing more slowly than the national average even before the international copper price boom.
Although its economic situation places this region among the laggards, its social situation improved substantially over the period analysed. Between 1990 and 2003, poverty declined from 43.2% to 19.4%, infant mortality dropped by 42%, and the average number of years of schooling increased from 9.3 to 10.3. Yet, as in O’Higgins, household incomes grew less than the national average, which means that they declined from 82.3% of the average in 1990 to 76.2% in 2003.
3. The region of Bío Bío
This region is a special case, with the shift-share analysis revealing a negative result for all sectors . Its economy is fairly diversifi ed, with various sectors
TABLE 8
Chile: stagnating regions (losers) and sectors with the greatest negative impact
Regions % of regional
GDP
Spe-cializa-
tion quo-tient
% of total
negative impact due to sector
% of regional
GDP
Special-ization
quotient
% of total
negative impact due to sector
% of regional
GDP
Special-ization
quotient
% of total
negative impact due to sector
% of regional
GDP
Special-ization
quotient
% of total
negative effect due to sector
Forestry and agriculture Fisheries Mining Industry
Valparaíso 0.2 0.1 17.6 3.9 0.5 30.1 22.7 1.3 10.8O’Higgins 10.7 1.2 618.9 16.2 0.9 Bío Bío 6.7 1.4 16.8 2.6 1.5 12.9 0.2 0.0 9.0 30.5 1.7 11.5Araucanía 15.2 3.1 96.0
Source: author’s preparation.

120 C E P A L R E V I E W 9 5 • A U G U S T 2 0 0 8
GLOBALIZATION AND REGIONAL DEVELOPMENT: THE ECONOMIC PERFORMANCE OF CHILE’S REGIONS, 1990-2002 • JUAN CARLOS RAMÍREZ J. AND IVÁN SILVA LIRA
of specialization, but they have been growing slowly and there were losses to regional GDP in all economic sectors during the period 1990-2002. Productivity growth was a mere 1.7% per year, far below the national average increase, and by 2001 it had fallen short of that average by 25%. Regional exports on the other hand have expanded strongly, recording an average annual growth rate of 9% between 1990 and 2000, and accounting for 14% of total national exports in 2000. Foreign investment, which in cumulative terms appears signifi cant, at US$ 288 per capita over the period 1990-2000, is in fact far below the fl ows to other regions, and well short of the national per capita average for that period (US$ 2,513). Likewise, public investment remains below the national per capita average despite impressive growth over the period 1994-2004.
Household incomes also rose more slowly than the national average, and in 2003 were 28% below the average. Poverty declined from 47.5% in 1990 to 28% in 2003, but remained far higher than the national average: the improvement may have been due in part to social spending, which rose here much more than in the other regions. Other social indicators were also unfavourable. It can be said that the region exhibited a
basic contradiction, which translated into low economic growth and a strong export performance, with little improvement in social indicators.
To summarize the fi ndings for the stagnant regions, two characteristic situations may be observed:(i) Regions with industrial structures that have
typically been highly protected, with steadily declining activity. They have been unable to restructure their productive apparatus and they have been demoralized by freer trade and globalization, although there are local pockets of activities where change and innovation could be successful. In short, these regions are losers that have been de-industrializing and have not managed to restructure their local economies.
(ii) Traditional agricultural regions which have regularly lagged behind, some of them with a large indigenous population, calling for explicit government policies to halt the decline and specifi c recovery programmes for each concrete situation. These regions may be classed as losers, with low-productivity rural economies and little human capital, which have failed to make inroads in the global economy
VIIIDeclining regions: sluggish economies
and high per capita GDP
This group covers those regions that are in a privileged position with respect to per capita GDP but that exhibit slow growth. If that trend persists, they will lose ground and will become more like the less developed regions. Thus they are regions that are becoming less competitive and that need signifi cant efforts at reactivation (table 9).
1. Region of Magallanes
Fishing, mining and, more recently, industrial activity are the mainstays of this region’s economy. Economic growth over the period 1990-2002 was very limited. This poor performance is attributable in large part to the loss of momentum experienced in the mining sector due mainly to depletion of the region’s
hydrocarbon reserves. Yet in per capita terms, its exports, which account for approximately 25% of the country’s total exports, have been growing steadily at a rate well above the national average.
Over the period 1990-2000, FDI per capita far exceeded national averages, and was heavily concentrated in chemicals (specifically methanol). Similarly, public investment was 2.5 times the national average in per capita terms. This is not surprising, because this region, located at the southern tip of the country, enjoys special advantages.
Household incomes also remained above national averages, as did social spending and other social indicators. Between 1990 and 2003, poverty reduction was the highest in the country. The poverty rate fell from 30% to only 12.3%, the lowest in the country. It

121C E P A L R E V I E W 9 5 • A U G U S T 2 0 0 8
GLOBALIZATION AND REGIONAL DEVELOPMENT: THE ECONOMIC PERFORMANCE OF CHILE’S REGIONS, 1990-2002 • JUAN CARLOS RAMÍREZ J. AND IVÁN SILVA LIRA
is paradoxical that this region, which had experienced a notable economic decline, has been able to maintain its social indicators or even to improve them substantially, in contrast to the regions that have enjoyed sustained growth. The explanation surely lies in the explicit government policies pursued in this region at the extreme south of Chile.
In short, the region of Magallanes has lost dynamism following the depletion of some of its natural resources. The loss of its comparative advantages may be temporary or permanent, depending on its success in promoting new local economic activities.
2. The Metropolitan Region
The inclusion of the Metropolitan Region in the group of stagnating regions merits some special considerations, as it is the region in which the greatest proportion of the country’s population and economic activity is concentrated.
In the shift-share analysis, the Metropolitan Region shows a relatively signifi cant decline in certain sectors (such as construction and manufacturing) which are geared mainly to the domestic market.
This decline has been offset by signifi cant gains in tertiary activities, which are crucial in the context of globalization, such as fi nancial services, transportation and communications. The negative results observed in construction and manufacturing may be attributed in part to the fact that the Asian crisis of 1997-1999 impacted the region most strongly in these sectors.
Nevertheless, during the period 1990-2006 this was the region that received the most FDI: US$ 15.3 billion (excluding the multiregional component) i.e., nearly a third of total FDI fl ows to the country over those years. These FDI fl ows went primarily to tertiary activities.
Moreover, the Metropolitan Region has also stepped up its export drive, and over the three years 2003-2005 it ranked second (after Antofagasta) among Chilean regions by value of exports. It also has a more diversifi ed export basket, which includes products that are more highly processed and hence have greater value added.
In terms of social conditions, in 2003 the region had one of the lowest percentages of poverty in the country (13.1%) and household incomes were 34% above the national average (18% above in 1990).
TABLE 9
Chile: declining regions and their sectors of greatest negative impact
Regions % of Specializa- % of total % of Specializa- % of total % of Specializa- % of total regional tion negative regional tion negative regional tion negative GDP quotient impact GDP quotient impact GDP quotient impact due to due to due to sector sector sector
Mining Industry Construction
Magallanes 9.75 5.7 93.0 Metropolitan Region 18.4 1.0 303.5 7.2 0.8 289.4
Source: author’s preparation.
IXConclusions
From the analysis and information presented above it will be seen that the regions that are doing well in Chile are those that have been able to integrate themselves successfully into the world economy, whether by means of their renewable or non-renewable natural resources,
export efforts based on (mainly light) manufacturing, or metropolitan centres with linkages to the global economy for the provision of fi nancial and commercial services.
In all of these situations, the prevailing policy has been one of macroeconomic integration, and this has
122 C E P A L R E V I E W 9 5 • A U G U S T 2 0 0 8
GLOBALIZATION AND REGIONAL DEVELOPMENT: THE ECONOMIC PERFORMANCE OF CHILE’S REGIONS, 1990-2002 • JUAN CARLOS RAMÍREZ J. AND IVÁN SILVA LIRA
indeed become an objective frame of reference for each region. That policy has favoured some regions strongly, at least in terms of growth, while it has affected others unfavourably, depending on their own capacities for international integration.
We may say, then, that in none of the successful cases of regional growth has there been any explicit and deliberate regional development policy guided by the State. If a region has done well, it was not because the State promoted regional development policies. Nor do there seem to have been any explicit policies of a compensatory and clearly regional thrust to overcome disparities, targeted at depressed regions that show no signs of revival over the short or medium term.
A fundamental conclusion, then, and one that continues to evoke a certain frustration, must be that over the last two decades Chile does not seem to have pursued any explicit regional development policies, at least at a national scale. Nevertheless, the generalized if unequal progress in economic and social conditions in the regions of Chile may be due to a set of sectoral policies applied in recent years (in areas such as transportation infrastructure, investment in education, health and housing, and expanded access to these services) which, while not really regional, have impacted the regions in different ways.
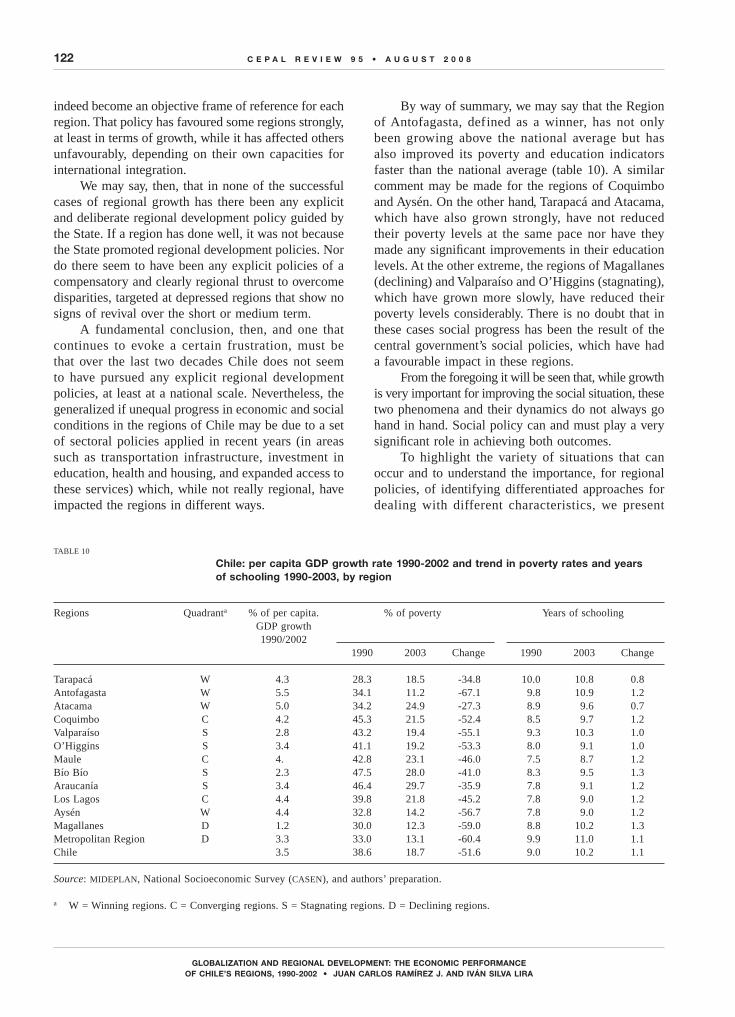
By way of summary, we may say that the Region of Antofagasta, defined as a winner, has not only been growing above the national average but has also improved its poverty and education indicators faster than the national average (table 10). A similar comment may be made for the regions of Coquimbo and Aysén. On the other hand, Tarapacá and Atacama, which have also grown strongly, have not reduced their poverty levels at the same pace nor have they made any signifi cant improvements in their education levels. At the other extreme, the regions of Magallanes (declining) and Valparaíso and O’Higgins (stagnating), which have grown more slowly, have reduced their poverty levels considerably. There is no doubt that in these cases social progress has been the result of the central government’s social policies, which have had a favourable impact in these regions.
From the foregoing it will be seen that, while growth is very important for improving the social situation, these two phenomena and their dynamics do not always go hand in hand. Social policy can and must play a very signifi cant role in achieving both outcomes.
To highlight the variety of situations that can occur and to understand the importance, for regional policies, of identifying differentiated approaches for dealing with different characteristics, we present
TABLE 10
Chile: per capita GDP growth rate 1990-2002 and trend in poverty rates and years of schooling 1990-2003, by region
Regions Quadranta % of per capita. % of poverty Years of schooling GDP growth 1990/2002 1990 2003 Change 1990 2003 Change
Tarapacá W 4.3 28.3 18.5 -34.8 10.0 10.8 0.8Antofagasta W 5.5 34.1 11.2 -67.1 9.8 10.9 1.2Atacama W 5.0 34.2 24.9 -27.3 8.9 9.6 0.7Coquimbo C 4.2 45.3 21.5 -52.4 8.5 9.7 1.2Valparaíso S 2.8 43.2 19.4 -55.1 9.3 10.3 1.0O’Higgins S 3.4 41.1 19.2 -53.3 8.0 9.1 1.0Maule C 4. 42.8 23.1 -46.0 7.5 8.7 1.2Bío Bío S 2.3 47.5 28.0 -41.0 8.3 9.5 1.3Araucanía S 3.4 46.4 29.7 -35.9 7.8 9.1 1.2Los Lagos C 4.4 39.8 21.8 -45.2 7.8 9.0 1.2Aysén W 4.4 32.8 14.2 -56.7 7.8 9.0 1.2Magallanes D 1.2 30.0 12.3 -59.0 8.8 10.2 1.3Metropolitan Region D 3.3 33.0 13.1 -60.4 9.9 11.0 1.1Chile 3.5 38.6 18.7 -51.6 9.0 10.2 1.1
Source: MIDEPLAN, National Socioeconomic Survey (CASEN), and authors’ preparation.
a W = Winning regions. C = Converging regions. S = Stagnating regions. D = Declining regions.

123C E P A L R E V I E W 9 5 • A U G U S T 2 0 0 8
GLOBALIZATION AND REGIONAL DEVELOPMENT: THE ECONOMIC PERFORMANCE OF CHILE’S REGIONS, 1990-2002 • JUAN CARLOS RAMÍREZ J. AND IVÁN SILVA LIRA
below a characterization of the regions derived from our analysis:• Winning regions with exportable natural
resources— Mining regions that have the characteristics
of enclave economies with doubtful scope for interaction with the local economy. Nevertheless, those capacities will determine their development prospects. The regions of Tarapacá, Antofagasta, Atacama and Coquimbo fi t this description.
— Agro-exporting regions that have successfully modernized a portion of their agricultural sector. There are still concerns (although they are different from those in the mining regions) about the ability of these sectors to generate positive synergies (linkages) with the rest of the local economic fabric. The region of Maule is in this situation.
• Winning regions that have taken advantage of latent local assets, typically primary resources such as salmon in Los Lagos, where the challenge
is to base the regional economy on a more dynamic sector.
• Winning regions with metropolitan areas, such as the Metropolitan Region of Santiago, which are heavily oriented towards fi nancial activities and services.
• Loser regions with low-productivity rural economies. These regions have traditionally been poor and they are still poor, as is the region of Araucanía. The essential question here is to identify policies, typically of a compensatory nature, which will have some impact (and hopefully a multiplier effect) on these depressed economies. These measures would probably start with steps to strengthen human capital and infrastructure.
• Loser regions that have undergone a sharp deindustrialization, such as Bío Bío and Valparaíso. In the past they became heavily industrialized, and they have been unable to restructure and adapt to the opening of the economy.
(Original: Spanish)
Bibliography
ECLAC (Economic Commission for Latin America and the Caribbean) (2001): Foreign Investment in Latin America and the Caribbean. 2000 Report, LC/G.2125-P, Santiago, Chile. United Nations publication, Sales No. E.01.II.G.12.
Moguillansky, Graciela (1999): La inversión en Chile: ¿el fi n de un ciclo en expansión? Santiago, Chile, Fondo de Cultura Económica/ECLAC.
Montero, Cecilia (2004): Formación y desarrollo de un cluster globalizado: el caso de la industria del salmón en Chile, Desarrollo productivo series, No. 145, LC/L.2061-P, Santiago, Chile. United Nations publication, Sales No. S.04.II.G.5.
Muñoz, Oscar (2008): Globalización y desarrollo exportador chileno: el rol de los clusters de recursos naturales, Santiago, Chile.