
Globalization, Internationalization and the Knowledge Society

Globalization, Food and Nutrition Transitions 1
Globalization and Health Knowledge Network: Research Papers
WHO Commission onSocial Determinants of Health
Globalization, Foodand Nutrition Transitions
Globalization Knowledge Network
Corinna Hawkes

PrefaceThe Globalization Knowledge Network (GKN) was formed in 2005 with the purpose of examining how contemporary globalization was influencing social determinants of health. It was one of nine Knowledge Networks providing evidence-informed guidance to the work of the World Health Organization’s Commission on Social Determinants of Health (2005-2008): like most of the Knowledge Networks, its operations were financed by an external funder (in this case, the International Affairs Directorate of Health Canada, Canada’s national ministry of health). The GKN conducted two face-to-face meetings to debate, discuss, outline and review its work, and produced thirteen background papers and a Final Report. These papers and the Final Report underwent extensive internal and external peer review to ensure that their findings and policy inferences accurately reflected available evidence and scholarship.
This GKN publication series was prepared under the general editorship of Ronald Labonté, with assistance from Vivien Runnels and copy-editing provided by Wayne Harding. All views expressed are exclusively those of the authors. A complete list of titles in the publication series appears on the inside back cover of this monograph.
Globalization Knowledge NetworkRonald Labonté (Chair)Ted Schrecker (Hub Coordinator)
Layout and Design:Rhonda Carscadden: rhocaDESIGNS.com

Globalization and Health Knowledge Network:
Research Papers
Globalization, Foodand Nutrition Transitions
WHO Commission onSocial Determinants of Health
Lead author and coordinator:Corinna HawkesInternational Food Policy Research Institute
Case studies:Mickey ChopraSharon FrielCorinna HawkesTim LangAnne Marie Thow
August 23, 2007

4 Globalization and Health Knowledge Network
Table of contentsPreface 2 Table of acronyms 8
Executive summary 9
1. Introduction 15 1.1 The Problem 15
1.2 Paper objective. approach, methods and structure 20
2. Conceptual framework 21 2.1 Adaptation of the uNICEF framework of
the causes of childhood malnutrition 21
2.2 The “nutrition transition” model 22
3. Literature review: the policies and processes of globalization and their nutritional implications 24 3.1 Objective 24
3.2 Methods 24
3.3 What is known about how globalization affects the nutrition transition? 25
3.3.1 Nature of the literature 25
3.3.2 Globalization as a driver of changing food demand 25
3.3.3 Globalization as a driver of changing food supply 26
3.3.3.1 Key processes 26
3.3.3.2 Growth of transnational food companies (TFCS) 27
3.3.3.3 Growth of transnational supermarkets 31
3.3.3.4 Foreign direct investment (FDI) 31
3.3.3.5 Global food advertising and promotion 34
3.3.3.6 Liberalization of international food trade 39
3.3.3.7 Liberalization and commercialisation of domestic agricultural markets 42
3.3.3.8 Technology and transportation 42
3.3.3.9 Cultural influences 43
3.4 What is known about how globalization affects under-nutrition? 44
3.4.1 Nature of the literature 44
3.4.2 International trade liberalization and under-nutrition 44
3.4.3 Domestic agricultural liberalization and commercialization 47
3.4.4 Growth of transnational food companies 47
3.4.5 Financial flows, including FDI, technology and transport: 48

Globalization, Food and Nutrition Transitions 5
4. Case studies 49 4.1 Objectives 49
4.2 Methods 49
4.3 Trade liberalization and food availability in Central America 50
4.3.1 The nutritional situation in Central America 50
4.3.2 Globalization policies in Central America 51
4.3.3 Links between trade liberalization and food availability 54
4.3.4 Implications for the nutrition transition 56
4.4 Liberalization of trade and FDI and
food availability, price and access in India 56
4.4.1 The nutritional situation in India 56
4.4.2 Globalization policies in India 58
4.4.3 urbanization in India 59
4.4.4 The links between agricultural trade liberalization,
FDI and consumption of vegetable oils, pulses, and processed foods 60
4.4.5 Implications for the nutrition transition 64
4.5 Globalization, the food supply, and employment in South Africa 64
4.5.1 The nutritional situation in South Africa 64
4.5.2 Globalization policies in South Africa 64
4.5.3 Globalization and changes in the food supply and employment 65
4.5.4 Implications for the nutrition transition 66
4.6 Globalization and under-nutrition in Bangladesh and uganda 68
4.6.1 The nutritional situation in Bangladesh and uganda 68
4.6.2 Trade liberalization policies in Bangladesh and uganda 68
4.6.3 Impact of trade liberalization on
the food supply and financial resources in Bangladesh 68
4.6.4 Trade liberalization, employment,
income, food availability and food prices in uganda 69
5. Conclusions and recommendations 72 5.1 Conclusions 72
5.2 Recommendations 74
6. Appendices 76

6 Globalization and Health Knowledge Network
List of figures
Figure 1: Overweight and obesity among women
aged 45-59 years, by WHO region 17
Figure 2: Prevalence of overweight and underweight
in urban and rural areas of developing countries 18
Figure 3: Conceptual framework: globalization and
the social determinants of nutrition, with an emphasis on food 22
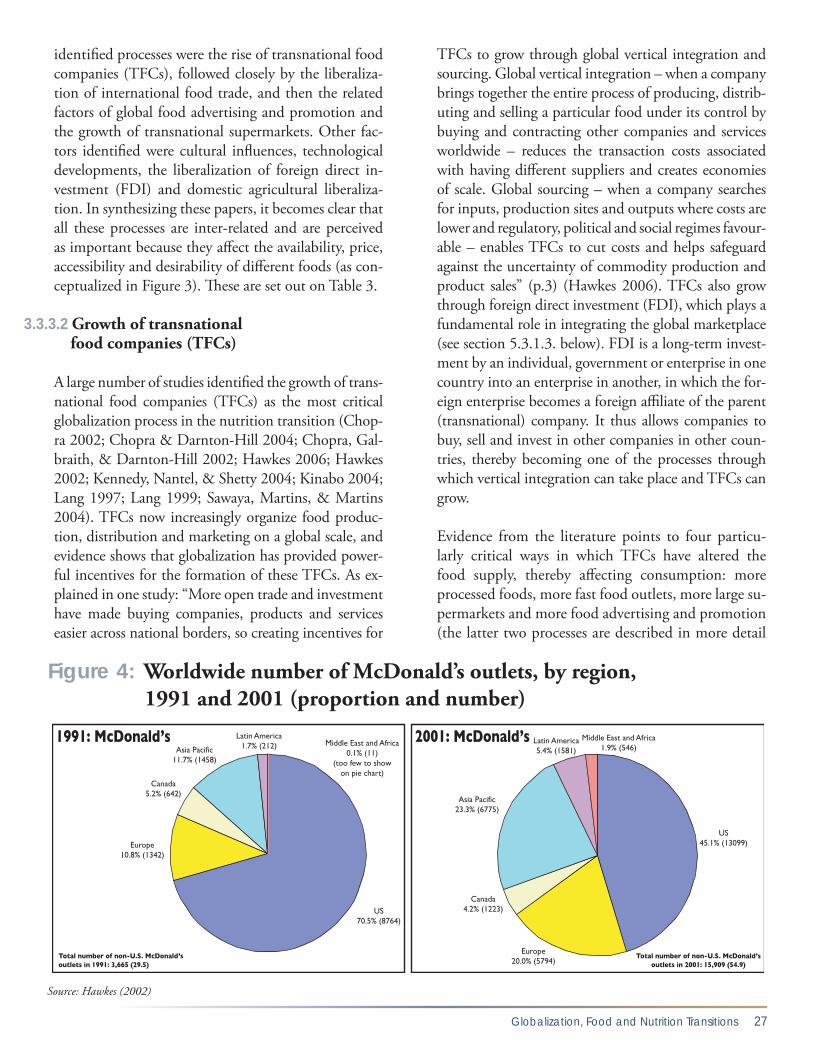
Figure 4: Worldwide number of McDonald’s outlets,
by region, 1991 and 2001 (proportion and number) 27
Figure 5: Number of transactions at chained burger
and chicken outlets in selected countries, 1995 and 1999 28
Figure 6: uS / non-uS media spending by Coca-Cola
and McDonald’s, 1994 - 2000 35
Figure 7: Retail sales of sweet and savoury snacks in Thailand, 1999-2004 38
Figure 8: Tracing the pathways between
globalization and nutrition in the Central America 51
Figure 9: Poultry meat availability, import and production in Guatemala. 53
Figure 10: Imports of processed meats (‘bovine meat, other prep’,
‘pig meat, other prep’, pig meat, sausages’, ‘poultry meat,
other prep’) into Central American countries. 53
Figure 11: Apples: availability, import and production in Central America 55
Figure 12: Income segments—proportion of the population. 55
Figure 13: Tracing the pathways between globalization
and nutrition in the India case study 58
Figure 14: Imports of major agricultural commodities, India, 1980-2004 60
Globalization, Food and Nutrition Transitions 7
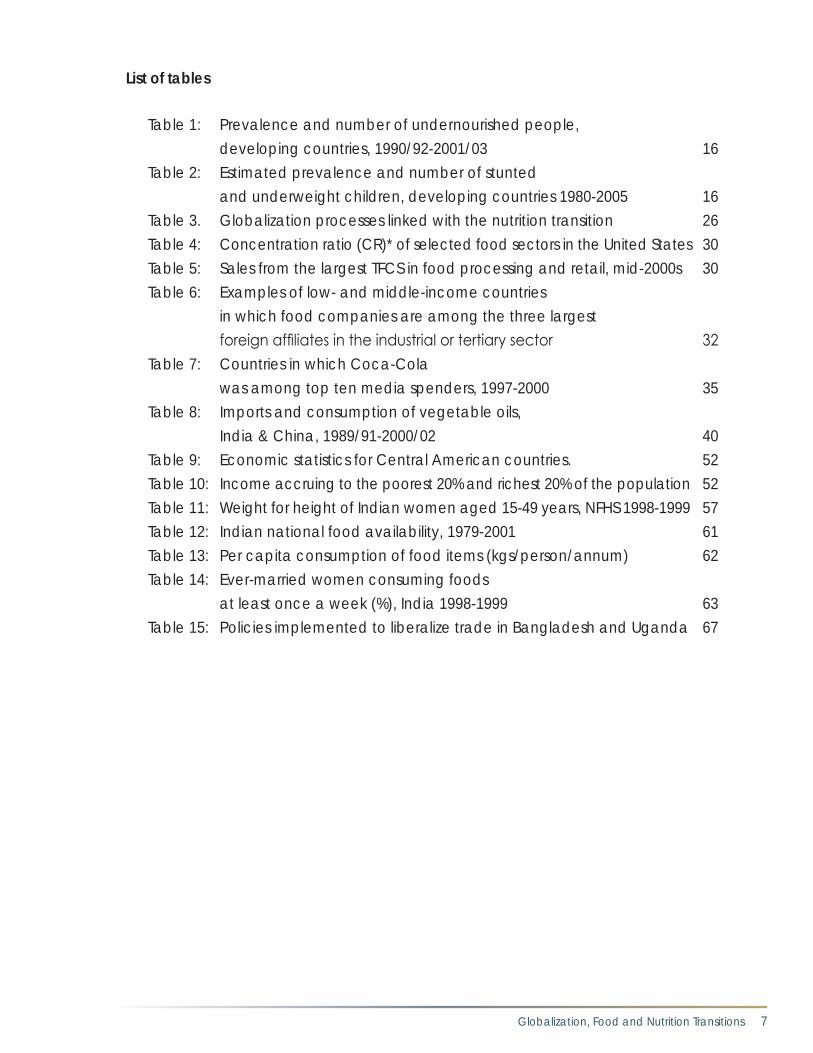
List of tables
Table 1: Prevalence and number of undernourished people,
developing countries, 1990/92-2001/03 16
Table 2: Estimated prevalence and number of stunted
and underweight children, developing countries 1980-2005 16
Table 3. Globalization processes linked with the nutrition transition 26
Table 4: Concentration ratio (CR)* of selected food sectors in the united States 30
Table 5: Sales from the largest TFCS in food processing and retail, mid-2000s 30
Table 6: Examples of low- and middle-income countries
in which food companies are among the three largest
foreign affiliates in the industrial or tertiary sector 32
Table 7: Countries in which Coca-Cola
was among top ten media spenders, 1997-2000 35
Table 8: Imports and consumption of vegetable oils,
India & China, 1989/91-2000/02 40
Table 9: Economic statistics for Central American countries. 52
Table 10: Income accruing to the poorest 20% and richest 20% of the population 52
Table 11: Weight for height of Indian women aged 15-49 years, NFHS 1998-1999 57
Table 12: Indian national food availability, 1979-2001 61
Table 13: Per capita consumption of food items (kgs/person/annum) 62
Table 14: Ever-married women consuming foods
at least once a week (%), India 1998-1999 63
Table 15: Policies implemented to liberalize trade in Bangladesh and uganda 67

8 Globalization and Health Knowledge Network
Table of Acronyms ASEAN Association of Southeast Asian Nations BMI Body Mass Index CAFTA Central American Free Trade Agreement CEO Chief Executive Officer CVD Cardiovascular Disease DALY Disability Adjusted Life Year DRCD Diet-Related Chronic Disease FAO Food and Agricultural Organization of the United Nations FAOSTAT Food and Agricultural Organization Statistical Databases (United Nations) FCTC Framework Convention on Tobacco Control FDI Foreign Direct Investment FTA Free Trade Agreement GATT General Agreement of Tariffs and Trade GDP Gross Domestic Product GNI Gross National Income GNP Gross National Product HIV/AIDS Human Immunodeficiency Virus/Acquired Immunodeficiency Syndrome IMF International Monetary Fund KN Knowledge Network MERCOSUR Mercado Común Sudamericano. Mercado Comun del Cono Sur (Southern Cone Common Market) MESH Medical Subject Headings NAFTA North American Free Trade Agreement NFHS National Family Health Survey NGO Non-Governmental Organization QR Quantitative Restrictions SAFTA South Asia Free Trade Area SAP Structural Adjustment Program SES Socio-Economic Status TFC Transnational Food Company TNC Transnational Corporation UNSCN United Nations Standing Committee on Nutrition UNCTAD United Nations Conference on Trade and Development UNICEF United Nations Children’s Fund UPPAP Uganda Participatory Poverty Assessment Project US United States WHO World Health Organization WTO World Trade Organization

Globalization, Food and Nutrition Transitions 9
Globalization, Foodand Nutrition Transitions
Introduction
During the era of intense economic globalization – the early 1980s to the present – there have been two clear nutrition trends. First, there was a decline in the proportion of undernourished children and adults in the world, but with absolute numbers remaining high and the proportional rate of decline slow. In Africa the actual number of undernourished people rose. Secondly, the number of overweight/obese people, and those with associated diet-related chronic dis-eases (DRCDS), rose significantly. The increase was particularly rapid in developing countries, where the burden of overweight/obesity is also shifting towards groups of lower socio-economic status. This is related to what is often termed the “nutrition transition” – the increasing consumption of fats, sweeteners, ener-gy-dense foods, and highly processed foods compared to traditional diets characterized by higher intake of cereals. The result is a series of nutritional inequities in many nations, communities, and households.
This paper aims to examine the evidence on the link-ages between globalization and these nutritional trends. It uses this information to address the ques-tion: can nutritional trends be somehow attributed to the globalization of the world economy, and the policies and processes that drive it? It then draws on this analysis to make recommendations to policy makers and other stakeholders on potential levers for policy interventions to improve nutrition in a globalizing world. The paper focuses on food as a determinant of nutrition, with a particular focus on the nutrition transition, and it is set within a social determinants framework.
The research was pursued in the following stages: (i) Development of a conceptual framework on the link-ages between globalization and the social determinants of nutrition; (ii) Literature review of existing evidence on the linkages between globalization and nutrition;
Executive Summary

10 Globalization and Health Knowledge Network
(iii) Case studies to explore the pathways between glo-balization and the social determinants of nutrition, as set out in the conceptual framework.
Conceptual framework
The conceptual framework was developed following the UNICEF conceptual framework on the causes of child malnutrition. Globalization is conceptualised as a basic social determinant of nutrition. Globalization policies and processes affect the food supply and finan-cial resources available for good nutrition. In turn, these affect the underlying social causes of nutritional status at the household level, including access to food.
What is known about howglobalization affects nutrition?
The aim of the literature review was to identify what has already been learned about the links between glo-balization and nutrition. Yet the review revealed that the literature on the linkages between globalization and nutrition is neither substantive nor well-advanced methodologically. Specific studies that directly mea-sure or model the association between globalization and diet and nutritional outcomes are not available. Still, the evidence is sufficient to identify how certain processes of globalization affect nutrition.
A certain consensus emerged from the literature about the globalization processes perceived to play a role in nutrition: the growth of transnational food companies (TFCs); the development of transnational supermar-kets; liberalization of foreign direct investment; global food advertising and promotion; the liberalization of international food trade; liberalization and commercial-ization of domestic agricultural markets; technological developments; and cultural influences. These globaliza-tion processes are driving changes in the food supply and the availability of financial resources, thus affecting both the nutrition transition and under-nutrition.
The nutrition transition
It is widely accepted that globalization is playing an important role in the development of dietary patterns linked with the nutrition transition and the subse-quent growth of diet-related chronic diseases in the developing world.
The development of these dietary patterns has been in-fluenced by changes in food demand and food supply. On the demand side, income growth, urbanization and changes in employment are important. National income growth and urbanization are associated with increased consumption of fats and sweeteners, and a higher body mass index.
On the supply side, the processes listed above are driv-ers of a changing food supply. The most commonly identified process is the growth of TFCs, which have grown as a process of, and response to, globalization. TFCs have altered the food supply by increasing the availability of processed and fast foods, making them more accessible through large transnational supermar-kets, and making them more desirable through the use of advertising and promotion. Despite their marked effect on supply and sales of these foods, snacks, fast foods and soft drinks manufactured by these compa-nies still form a relatively low proportion of dietary in-take in developing countries, though they are becom-ing more important. TFCs are likely having a more important impact on diet indirectly, since their rising power in the marketplace affects the dynamics of the food market as a whole. This affects the availability, price and desirability of food from all sources and ac-tors in the food market.
Out of all the categories of TFCs, the most rapid growth in the 1990s was among transnational super-markets. Supermarkets are playing two roles in the nutrition transition: shifting demand for home-pro-duced foods or foods purchased in open markets to increased dependence on store-bought foods supplied by TFCs; and expanding available choices of packaged and processed foods.
Foreign direct investment is playing an important role in shaping the growing global market for processed foods by leading to the greater availability of processed foods. It is also likely to stimulate sales by lowering prices, providing the means of growth for transnation-al supermarkets, and creating incentives for advertis-ing and promotion.
Food advertising and promotion drive globalization by increasing demand and speeding the flow of food products into the global marketplace. In turn, global-ization has stimulated more advertising and promotion
Globalization, Food and Nutrition Transitions 11
by bringing to the developing world the advertis-ing and marketing agencies with the most expertise in designing marketing campaigns – as well as the TFCs that advertise. Expenditure on food advertis-ing is high and increasing in developing countries; a significant proportion of this advertising is for en-ergy-dense processed foods targeted at children and youth. The objective of this advertising is to encour-age greater consumption, and two major systematic reviews (using evidence from western countries) have now concluded that advertising does influence food choices.
Trade liberalization has been at the forefront of poli-cies to implement globalization. The liberalization and commercialization of domestic agricultural markets are also essential components to a more open food trad-ing regime, since domestic markets need to be open in order to function internationally and a more com-mercial agricultural sector is better able to compete in the world market. These processes of liberalization have led to changes in the types of food produced, and an increase in the amounts of food imported into developing countries, which affects the relative avail-ability and prices of different foods. The most com-pelling evidence comes from the Pacific Islands where increasing imports of fatty foods are associated with increased fat consumption.
Technology and transportation throughout the food supply chain have facilitated the production and dis-tribution of foods associated with the nutrition transi-tion, while cultural influences have introduced new foods into developing countries and shaped the desire for those foods.
Under-nutrition
A more limited number of globalization processes were identified as important to under-nutrition. By far the most important was trade liberalization, which was conceptualised as being important to under-nutrition via its effects on food security and poverty. Other pro-cesses identified were the growth of TFCs, domestic agricultural liberalization and commercialisation and financial liberalization. These globalization processes present both opportunities and risks for under-nutri-tion, but in general, the evidence is less clear relative to the nutrition transition.
Trade liberalization affects under-nutrition via its ef-fects on employment of populations at risk of under-nutrition (particularly rural dwellers and women), household income, food prices and food imports and exports. These factors affect income and food availability, and the time and resources available for breastfeeding and other forms of child care.
Rising incomes, where they arise from trade liberal-ization, can help explain declines in childhood un-der-nutrition, especially if the share of women’s wage payments rises with trade expansion. But there are also risks for under-nutrition associated with wom-en’s entry into the labour force if it is not accompa-nied by the development of adequate child-caring institutions. Women’s work in export-oriented ag-riculture is very energy-intensive, and provides cash income more likely to be accrued by men. This may compromise women’s nutritional status and that of their children. Importantly, too, women’s entry into the labour force is associated with the cessation of one of the practices most associated with alleviating childhood under-nutrition: breastfeeding. There is also concern in the nutrition community that TFCs present a threat to international efforts to eliminate the marketing of breastmilk substitutes.
The evidence on food availability suggests that trade liberalization can play a positive role in improving the reliability of supply. However, at the same time, international markets are too volatile to be relied upon and have the effect of undermining the in-comes of rural dwellers at risk from under-nutrition. Financial liberalization may also be important be-cause it affects exchange rates, and thus real house-hold incomes and the country’s ability to purchase food imports.
Domestic agricultural commercialisation in the form of cash crops was a precursor to more specific efforts to liberalize trade in developing countries in the 1990s. Conversion to cash cropping generally leads to higher household incomes and spending on food but has a relatively small impact on overall en-ergy intake, and in most cases, little or no impact on childhood under-nutrition. Where positive impacts of childhood nutritional status have been identified, this is associated with greater control of income by women.
12 Globalization and Health Knowledge Network
Case studies
The aim of the case studies is to build on what has been learned about the linkages between globalization and nutrition by linking information about changes in food consumption patterns to specific globalization policies and processes. Each case study is set in a different re-gional/country context, focused on a specific set of glo-balization processes, and on one or more of the social determinants identified in the conceptual framework.
The first set of case studies examines globalization and the nutrition transition in Central America, India and South Africa. These three regions/countries are char-acterized by a “double burden” of malnutrition and nutritional inequities. In Central America and South Africa, the burden of under- and over-nutrition falls on groups of lower socio-economic status, while in In-dia the poor have a huge burden of under-nutrition, and over-nutrition is mainly experienced by wealthier groups. The second briefer set of case studies examines globalization and under-nutrition in Bangladesh and Uganda where rates of under-nutrition are very high.
Central America
The countries of Central America implemented poli-cies to liberalize trade in the 1990s, albeit some show-ing a greater tendency towards liberalization than oth-ers. In 2006/7, all the countries made a significant step towards greater liberalization by implementing the Central American Free Trade Agreement (CAFTA) with the United States.”
Food imports into Central America increased during the period of liberalization. Between 1990 and 2004, imported foods trebled into Guatemala, El Salvador and Costa Rica, quadrupled for Honduras, and nearly doubled for Nicaragua.
An examination of specific foods shows the association between changing trade policies and food imports. For example, trade barriers to chicken and processed meat imports were decreased to the greatest degree in Guatemala, and chicken imports have increased rela-tively faster than other foods in other countries. Im-ports of processed foods have also increased as tariffs have declined. These imports are targeted at different socio-economic groups.
India
In India the onset of economic globalization was marked by the new economic reform process in 1991, compris-ing measures to liberalize domestic and international markets, and, to a more limited extent, FDI. The pro-cess is attributed with increasing national wealth. This wealth, however, is heavily concentrated in the cities, which have been steadily growing in population for de-cades.
The resultant liberalized trade regime led to greater food imports, especially of vegetable oils, pulses and fruits and vegetables. During this same period, consumption of vegetable oils increased, while consumption of pulses declined, reflecting the importance of the impact of im-ports on relative food prices. Imported vegetable oils are priced much lower than domestically produced oils, and make up a far greater proportion of total supply (around 50 per cent relative to less than 15 per cent). This has had a stronger deflationary effect relative to pulses. The higher price of pulses is also a reflection of domestic ag-ricultural policy.
Although relatively limited, FDI by TFCs concerned with the manufacturer of foods and drinks has led to increased availability and consumption of pro-cessed foods, particularly among wealthier groups in urban areas. In fact, consumption of edible oils and pulses is also higher among these groups, reflecting the huge inequities in food consumptions between wealthy groups in urban areas with slum and rural dwellers.
Given rapid urbanization and growing wealth in India, coupled with changing food availability and prices, it is likely that the trend towards increased consumption of fats and processed foods will continue among wealthier groups in India, so moving towards a diet associated with DRCDs. These diets will become more desirable among lower-income groups. At the same time, the poor will remain at risk from under-nutrition unless they share in the growing wealth accruing in the country.
South Africa
In the early 1990s the South African government im-plemented policies to open up the economy to global capital and markets. Measures included a reduction
Globalization, Food and Nutrition Transitions 13
in tariffs, agricultural trade liberalization and the in-creasing export orientation and commercialization of domestic agriculture.
These policies had a discernible affect on food supply and demand. Agricultural production and the food in-dustry became far more concentrated, and TFCs have grown. This has affected prices – the price of bread, for example, rose after deregulation, making it less afford-able to poor families. There have also been important changes in demand, as unemployment has risen and inequities in socio-economic status have grown. Over-all, the changes in globalization policies, coupled with changes in food demand, are associated with signifi-cant increases of fat consumption.
Bangladesh
As part of structural adjustment, Bangladesh imple-mented policies to globalize its economy in the 1980s-1990s. This included the creation of export processing zones, and measures to liberalize agricultural trade. In Bangladesh agricultural trade liberalization led to an increase in the availability of rice, declining prices and a more stable supply in times of crisis, thus increasing access to food, with positive implications for under-nutrition. Liberalization also had the effect of boost-ing employment and income among populations with access to technologies made available through import liberalization, but poverty remained high in agricul-tural populations overall, and the nutritional impacts are unclear.
In urban Bangladesh, export liberalization helped stimulate the conditions for the growth of the ready-made-garment industry, and thus employment among women. The evidence suggests that this reduces pov-erty and improves dietary intake. However, translation into improved nutritional status is likely compromised owing to the poor health conditions of the factories.
Uganda
In the late 1980s Uganda became one of the first countries in Africa to implement a program aimed at globalizing its economy. This included the removal of state trading monopolies, and measures to liberal-ize agricultural trade. In Uganda export liberalization stimulated employment and higher incomes in ex-
port-oriented agricultural sectors in the 1980s-90s, a trend which was attributed to decreasing income-poverty in the country. However, declines in under-nutrition have been much slower than declines in poverty.
This is likely due to the importance of health to im-proved nutrition (Uganda having a high rate of infec-tious diseases, including HIV/AIDS), but also other (related) effects of export-oriented agriculture and cash cropping: the poorest farmers accrue relatively little income benefit; farmers are exposed to the vola-tility of world agricultural prices; women’s labour in cash cropping detracts from their income and food production for the home; and availability of locally produced nutritional foods, such as fish, declines. Thus export liberalization has provided the means to improve nutrition – income and employment – but this has not proportionally translated into nutritional gains partly as a result of other associated effects of export liberalization.
Conclusions
These conclusions aim to address the question: can nutritional trends be somehow attributed to the glo-balization of the world economy, and the policies and processes that drive it?
The evidence presented here suggests the nutrition transition and the growth of DRCDs can be partly attributed to processes of globalization. Globaliza-tion processes affect the supply and demand for foods associated with the nutrition transition and DRCDs. Key supply-side drivers are the growth TFCs; the liberalization of international food trade; global food advertising and promotion; the develop-ment of supermarkets; cultural influences; the liber-alization of foreign direct investment; technological developments; and domestic agricultural liberaliza-tion. Key demand-side drivers are income and em-ployment, set in the context of urbanization. The supply-side drivers have made high-calorie, nutrient poor foods, especially processed foods, more readily available, accessible and acceptable to a greater pro-portion of the world’s population. The demand-side drivers have increased the opportunity for popula-tions, especially in urban areas, to desire and con-sume such foods.

14 Globalization and Health Knowledge Network
Yet, as shown by the case studies, the specific im-pacts of globalization processes and policies depend on many factors including the specifics of the trade agreement, the foodstuff, and the domestic policy and societal context. Thus the implications of globaliza-tion for the nutrition transition and DRCDs should always be examined in these contexts.
It is less clear whether the decreasing prevalence – but continuing persistence – of under-nutrition can be at-tributed to globalization of the world economy, since the globalization processes identified as important to under-nutrition pose risks and opportunities to un-der-nutrition. Still, it can be concluded that the in-fluence of globalization processes on under-nutrition depends on the interplay between these different ef-fects, and the domestic context in which the process is operating.
Many of these dynamics relate to the balance be-tween income generation and other contributors to preventing under-nutrition. For example, trade lib-eralization can have the effect of both boosting and undermining the incomes of groups at risk of under-nutrition. But the evidence suggests that, while in-come is associated with lower under-nutrition at a national level, income does not necessarily lead to improved nutrition, since it depends on who con-trols that income, and the benefits maybe compro-mised by worsening maternal and child caring prac-tices (e.g. breastfeeding), or declining availability of locally produced nutritious foods. In urban areas low-waged workers may benefit from better incomes and dietary intakes, but potential health gains may be offset by poor conditions in the workplace.
The evidence presented suggests that the inequities of these conditions between and within societies can be partly attributed to processes driving globaliza-tion. First, in the context of under-nutrition, popu-lations and communities already experiencing more favourable conditions – such as owning a large plot of land, or possessing sufficient capital to invest in agricultural technology – are more likely to accrue the potential benefits for nutrition presented by glo-balization, while those already disadvantaged – the landless, rural women – are less likely to benefit. Thus there are winners and losers within societies and between them.
Secondly, there are inequities between those at risk of over- and under-nutrition associated with global-ization, although these emerge along a spectrum. At earlier stages of the nutrition transition, wealthier groups have more opportunity to consume foods as-sociated with DRCDs, and consume diets adequate or excessive in energy, while poorer groups remain at risk from under-nutrition. Later on in the transition, the wealthier groups begin to desire, and have more access to healthier foods, as the less nutritious, energy-dense foods become more desirable and accessible to groups of lower socio-economic status.
Thirdly, in the context of the nutrition transition and DRCDs, it is now more evident that there is no con-tradiction between globalization as a homogenizing and a diversifying dietary force, since the nature of globalization facilitates both processes. The diversify-ing nature of globalization processes has positive im-plications, but also raises the policy concern that these processes may encourage the uneven development of new dietary habits between rich and poor. As high-in-come groups in developing countries accrue the ben-efits of a more dynamic marketplace, lower-income groups may either continue to face inadequate access to food, or to experience convergence towards poor quality obesogenic diets, as has been observed in west-ern countries. People of low socio-economic status (albeit not the poorest of the poor) are more likely to be influenced – over the long term – by the converg-ing trends of the global marketplace, while the more affluent and educated move onto the more expensive “healthy market” niches. Thus much of the influence of globalization on diet will depend on the context in which its policies and processes are operating.

Globalization, Food and Nutrition Transitions 15
1.1 The problem
Increasing international economic interaction and glob-al market integration – a process often referred to as glo-balization – has been one of the most defining character-istics of the past 25 years. Globalization involves many different components but to date has been primarily an economic activity. Globalization is an amorphous concept that can be identified in a number of ways, in-cluding by the processes that drive it, and the effects it has. Each of these processes is affected by what can be termed “globalization policies”: policies that aim to, in some way, integrate local, national or regional econo-mies further into the global marketplace. These policies can be implemented at a range of scales – from local to global – by a wide range of stakeholders.
As globalization proceeded through the 1980s to the 2000s, there were two clear nutritional trends. First, the proportion of undernourished children and adults in
the world declined, but the proportional rate of decline was slow, the numbers remained high, and, in Africa, the actual number of undernourished people rose (Ta-bles 1 and 2).1 The Food and Agricultural Organization (FAO) of the United Nations estimates that in 2001/03, 854 million people worldwide were undernourished: 820 million in developing countries, 25 million in tran-sition countries and 9 million in industrialized countries (FAO 2006b). In developing countries, this represents a decline of just 3 million people since 1990/92 (Table 1), and in fact incorporates an increase of 23 million between 2000-2003 (offsetting a decline of 26 million 1990/92 - 1995/97). By far the largest number of under-nourished people live in Asia (mainly South Asia), but it is only in Africa where the number of undernourished people has increased since 1990/92 (mainly concentrat-ed in Central Africa) (FAO 2006b). The proportion and number of stunted2 and underweight3 children in de-
Globalization, Foodand Nutrition Transitions
1. Introduction
1 A declining proportion implies that nutritional improvement has kept pace with population growth; an increase in numbers even where proportion has declined reflects arapid rate of population increase.
2 Measure of height-for-age, which reflects cumulative effects of inadequate nutrition.3 Measure of weight-for-age, which is a composite of stunting and wasting (weight-for-height, reflecting severe and acute weight loss).

16 Globalization and Health Knowledge Network
Table 1: Prevalence and number of undernourished people, developing countries, 1990/92-2001/03
FAO Region Prevalence of undernourished (%) Number undernourished (million)
1990/92 2001/03 1990/92 2001/03Developing countries
20 17 823.1 820.2
Sub-Saharan Africa
35 32 169.0 206.2
Near East & North Africa
8 9 25.0 37.6
Asia 20 6 569.7 524.0Latin America / Caribbean
13 10 59.6 52.4
Source: (FAO 2006b)
Table 2: Estimated prevalence and number of stunted and underweight children, developing countries, 1980-2005
UN Region Prevalence of stunting (%) Number stunted (million)
1980 2005 1980 2005Developing countries
47.1 29.0 221.35 164.70
Africa 40.5 33.8 34.78 49.40Asia 52.2 29.9 173.37 110.19Latin America / Caribbean
25.6 9.3 13.19 5.11
Prevalence of underweight (%) Number underweight (million)
Developing countries
37.4 24.3 175.74 137.95
Africa 26.2 29.1 22.47 42.45Asia 43.9 25.3 145.95 93.16Latin America / Caribbean
14.2 4.3 7.32 2.35
Source: (UN SCN 2000)

Globalization, Food and Nutrition Transitions 17
veloping countries declined between 1980 and 2005, but in Africa the number of stunted children increased, as did the proportion and number of underweight (Ta-ble 2). There were an estimated 164.79 million stunted and 137.95 million underweight children in develop-ing countries in 2005.
By numbers, micronutrient deficiency is an even larger problem. Iron deficiency and anaemia affect more than 3.5 billion people in the developing world; more than 740 million people are affected by goitre (a result of iodine de-ficiency), and more than 2 billion are at risk for dietary iodine deficiency; between 78 and 254 million people are
estimated to suffer from vitamin A deficiency; large num-bers also suffer from zinc deficiency (UN SCN 2000). The second major nutritional trend occurring during the same time period as globalization is the rise in the proportion and number of adults and children who are overweight or obese. According to the World Health Organization (WHO), in 2005 approximately 1.6 bil-lion adults (age 15+) worldwide were overweight, at least 400 million of whom were obese (WHO 2006). In addition, at least 20 million children under the age of five years were overweight. WHO further projects that by 2015, approximately 2.3 billion adults will be
Figure 1: Overweight and obesity among women aged 45-59 years, by WHO region*
Source: (James et al. 2004). Data collected between 1990-2000* Africa D comprises northern and western parts of sub-Saharan Africa e.g. Nigeria, Ghana
Africa E comprises central, eastern and southern parts of sub-Saharan Africa e.g. Kenya, Mozambique America A comprises North America and Cuba America B comprises the Caribbean and some Latin American countries e.g. Mexico, Venezuela America D comprises some Latin American countries e.g. Guatemala, Peru Eastern Med B comprises much of the Middle East and some of North Africa e.g. Tunisia, Saudi Arabia Eastern Med D comprises countries in the Middle East, North Africa and Asia, e.g. Egypt, Morocco Europe A comprises most of Western Europe Europe B comprises some of Eastern Europe and Central Asia Europe B comprises the rest of Eastern Europe and Central Asia Southeast Asia B comprises Indonesia, Sri Lanka and Thailand Southeast Asia D comprises most of South Asia e.g. Bangladesh, India Western Pacific A comprises Australia, New Zealand, Singapore, Japan and Brunei Western Pacific B comprises the China, some countries of East Asia, e.g. Vietnam, and the Pacific Islands

18 Globalization and Health Knowledge Network
overweight and more than 700 million will be obese. Regional estimates of overweight and obesity for wom-en are provided in Figure 1.
Obesity has become an important global public health concern because it is a core risk factor for the devel-opment of diet-related chronic diseases (DRCDs) such as cardiovascular diseases (CVD), diabetes and some cancers, as well as the associated risk factors of high blood pressure and cholesterol. According to the WHO, chronic diseases are the largest cause of death in the world, led by CVD (17 million deaths in 2002, mainly from ischemic heart disease and stroke) and followed by cancer (7 million deaths), chronic lung diseases (4 million), and diabetes mellitus (almost 1 million) (Yach et al. 2004). Although chronic diseases have been the leading causes of death in developed
countries for decades, 80 per cent of deaths from chronic diseases now occur in developing countries; cardiovascular disease is the leading cause of mortal-ity in developing countries (WHO 2005). The global prevalence of these leading chronic diseases is project-ed to increase substantially over the next two decades. For example, the number of individuals with diabetes is estimated to rise from 171 million (2.8 per cent of the world’s population) in 2000, to 366 million (6.5 per cent) in 2030, 298 million of whom will live in developing countries (Wild et al. 2004).
Likewise, the number of people who are overweight/obese is growing particularly rapidly in developing countries, from Brazil to Morocco, India to China, Saudi Arabia to Thailand (Popkin & Gordon-Larsen 2004; Prentice 2006; WHO 1999). As shown in Figure
Figure 2: Prevalence of overweight and underweight in urban and rural areas of developing countries
Prevalence of Under and Over-weight in Urban Areas
0 10 20 30 40 50 60 70 80
Madagascar
Benin
Burkina Faso
Mali
Uganda
Nigeria Zambia
Malawi
Kenya
Tanzania
Cote dʼIvoire
Niger Ghana
Senegal Cameroon
Zimbabwe
Namibia
South Africa
Morocco
Turkey Jordan
Egypt
Uzbekistan
Kyrgyz Republic
Kazakhstan
China India
Haiti
Brazil
Colombia
Dominican Republic
Bolivia Peru
Guatemala
Mexico
Percent
% Overweight % Underweight
Prevalence of Under and Over-weight in Rural Areas
0 10 20 30 40 50 60 70
Madagascar
Benin Burkina Faso
Mali
Uganda
Nigeria
Zambia
Malawi
Kenya Tanzania
Cote dʼIvoire Niger
Ghana
Senegal
Cameroon
Zimbabwe
Namibia South Africa
Morocco
Turkey
Jordan
Egypt
Uzbekistan Kyrgyz Republic
Kazakhstan
China
India
Haiti
Brazil
Colombia Dominican Republic
Bolivia
Peru
Guatemala
Mexico
Percent
% Overweight % Underweight Cited in (Mendez, Monteiro and Popkin 2005).

Globalization, Food and Nutrition Transitions 19
2, the prevalence of overweight is considerably higher in urban areas in the developing world but, in Latin America, the Middle East, and South Africa, overweight is also higher than underweight in rural areas.
Moreover, the situation found in high-income coun-tries, where obesity and related disease fall dispropor-tionately on the groups of lower socio-economic status (SES), is beginning to repeat itself in middle-income countries. A recent review of the evidence concluded that as gross national product (GNP) increases in devel-oping countries, the burden of obesity tends to shift to-wards groups of lower SES; after countries have crossed over a GNP threshold of about US$2,500 per capita, women of low SES tend to have proportionally higher rates of obesity (Monteiro et al. 2004). In other words, obesity starts out as a problem among groups of higher SES, but as national economies grow, the risk moves towards groups of lower SES.
Under- and over-nutrition also co-exist within the same household, as first reported in the academic literature in 2000 from China, Brazil and Russia (Doak et al. 2000). Since then, more and more examples of the close proximity of the two types of malnutrition have been emerging (Hawkes et al. 2005). For example, a study in a low-income community in northeast Brazil estimated that 10 per cent of children were underweight, and 11 per cent of adolescents and 25 per cent of adults were stunted. Yet over 5 per cent of girls and 25 per cent of adults were overweight and overweight and under-nu-trition co-exist in 30 per cent of households. In a sub-urb in northern India, the evidence showed that 16 per cent of people were underweight while 28 per cent were overweight. Another study from one of Latin Ameri-ca’s poorest countries, Bolivia, showed that more than one quarter of infants were stunted, but between 1994 and 1998 the number of overweight women increased nine percentage points, with the greatest increases seen among women with less education. In Jamaica over-weight in adolescents approaches levels found in the United States, while 10 per cent are underweight. In Egypt over 10 per cent of households contain a stunted child and an overweight mother.
The world thus faces a problem of a dual burden of malnutrition, between countries, within countries, in communities, and sometimes even within households. The burden of under-nutrition falls disproportionately
on groups of lower SES, and the same trend is emerg-ing for over-nutrition. This is a stark reminder of the depth and seriousness of nutritional inequities. It is also a reminder that nutritional inequities are also social in-equities: as the wealthier grow larger, the poorest of the poor still either lack food or, where energy availability is sufficient, consume monotonous diets low in micro-nutrients.
Given these trends, the question arises: can the decreas-ing prevalence – but continuing persistence – of under-nutrition, the rising prevalence of over-nutrition, and the inequities of these conditions between and within societies be somehow attributed to the globalization of the world economy, and the policies and processes that drive it? That question is the subject of this paper.
In debates about food, social inequities and globaliza-tion, the latter tends to be presented as a process that affects national food security and poverty, with nutri-tional outcomes relegated to the status of subsequent consequence. Overall there is little clarity on how glo-balization at the macro-scale works its way through the system to affect malnutrition among different groups under real world conditions. Globalization acts at the macro-level through complex and poorly understood pathways each with a strong potential for unpredict-able and unintended effects to influence nutrition at the household and individual level (UN SCN 2004). At the level of the household and individual, global-ization involves interactions among numerous path-ways, with both positive and negative effects that change over time as the institutions, households and individuals adjust in response. Separating out the dif-ferent effects of globalization on nutritional outcomes is a challenge when there are so many other variables involved (Pinstrup-Andersen 1987). The effects of other factors such as existing social policies (e.g. na-tional health policy), political upheavals (e.g. war), epidemics (e.g. HIV/AIDS) and historical structures (e.g. landownership) further mediate the effects of globalization. Moreover, different globalization pro-cesses may push in the same or opposing direction and either reinforce or counteract each other. There is also the issue of the lag time between implementing economic and social policies and their effects, to say nothing about the difficulties in assessing nutritional outcomes that may vary significantly over different spatial and temporal scales.
20 Globalization and Health Knowledge Network
Well-structured evidence on these complex mecha-nisms is sparse – and difficult to measure. Yet reflecting Lee’s comment about the links between globalization and health in general: “we need to recognise and un-derstand far better the micro-macro linkages between globalization and the health of specific individuals and population groups” (p.619) (Lee 2001).
1.2 Paper objective, approach, methods and structure
This paper examines the links between globalization, food, nutrition, and the social determinants that link them. The primary focus of the paper is on food. As the only paper in the WHO Knowledge Networks (KN) dealing with food and nutrition4, this is a deliberate fo-cus. And clearly food is a critical risk factor for both under- and over-nutrition (though not the only one). The paper is primarily concerned with globalization as it affects changing nutritional outcomes through the dynamic of the “nutrition transition”. In order to high-light nutritional inequities, it does so in the context of the persistence of under-nutrition and the rising burden of over-nutrition among groups of lower SES.
The paper has three interlinked objectives:
• To bring together and synthesize available evidence on the links between globalization, food and nutrition.
• To use this information to address the question already posed: can the decreasing prevalence – but continuing persistence – of under-nutri-tion, the rising prevalence of over-nutrition, and the inequities of these conditions between and within societies be somehow attributed to the globalization of the world economy, and the policies and processes that drive it?
• To draw on this analysis to make recommenda-tions to policy makers and other stakeholders on potential levers for policy interventions to improve nutrition in a globalizing world.
The paper follows the basic aim of the Globalization Knowledge Network (GKN): to identify specific path-ways between globalization and health outcomes, keep-ing an inequity focus at the forefront. However, as al-ready explained, tracing the links between globalization and specific dietary changes is a challenge: there are no
specific studies that directly measure or model the as-sociation between globalization and diet or nutrition outcomes. To ease this methodological challenge while still fulfilling the objective of collating the relevant evi-dence, the paper uses three methods. It first develops a conceptual framework setting out the pathways that link globalization, food as a social determinant and nu-trition. The aim of this process is to identify the dif-ferent steps in the pathways between globalization and nutrition. Second, it presents a synthesis of a review of the evidence in existing literature on the links between globalization and nutrition. The aim of the review is to identify what has already been learned about the links between globalization and nutrition, specifically to identify the evidence on what is known about how globalization affects the nutrition transition and under-nutrition. To ensure fair representation of the often dif-ferent perspectives in this area, the review was conduct-ed using systematic methods. The third method used is the development of case studies. The aim of these case studies is to bring together information on the different steps in the pathways between globalization and nutri-tion, as set out in the conceptual framework. The case studies thus do not aim to present direct evidence, but to trace different steps in the pathway, which then come together to link globalization and nutrition. The case studies likewise do not aim to systematically prove the effects of globalization but to illustrate its dynamics in different contexts under different conditions. The first series of three case studies – on Central America, India and South Africa – focus on globalization, the nutri-tion transition and the emergence of the dual burden. The second set of three case studies considers whether globalization policies and processes have played a role in under-nutrition.
The research was thus pursued in the following stages:
• Development of a conceptual framework on the linkages between globalization and the social determinants of nutrition
• A literature review of existing evidence on the linkages between globalization and nutrition
• Case studies to explore the pathways between globalization and the social determinants of nutrition, as set out in the conceptual framework.
• Conclusions and recommendations
4 The Globalization Knowledge Network paper on Trade Liberalization deals with food security in light of free trade agreements, but not with nutrition per se.

Globalization, Food and Nutrition Transitions 21
2.1 Adaptation of the UNICEF framework of the causes of childhood malnutrition
The conceptual framework used for this paper is an adaptation of the UNICEF conceptual framework on the causes of child under-nutrition. The frame-work is explicitly concerned with the social determi-nants of nutrition at two scales: basic determinants (in society), and household determinants (as socially conditioned). Globalization is not explicitly referred to in the original framework, but is implicitly in-cluded as a basic determinant in society (Figure 3). The framework can be readily expanded to include all forms of nutrition among children and adults, and has the advantage that it is widely accepted by the international nutrition community as a whole, including the WHO.
Figure 3 presents the adaptation of the framework for the purposes of this paper. At the top are the ba-sic potential resources in society available for good nutrition: food, people, environment and technol-ogy. The framework then inserts globalization ex-plicitly as a “basic social cause” of nutrition (i.e. an
economic, political and cultural force that affects society) that affects how these resources are made available to society for good nutrition. Globaliza-tion policies and processes affect the translation of these basic resources into the food supply (how available and accessible it is, how much it costs, and how desirable it is) and into financial resources that affect people’s ability to feed themselves (income and employment). The food supply and financial resources then affect the underlying causes of nu-trition (access to food, maternal and child caring practices, and access to water/sanitation and health services), which in turn affect the immediate causes (dietary intake, disease), which then affects the out-come: nutritional status.
The social determinants of nutrition in this paper are therefore defined as globalization and its effects on the food supply and financial resources (at a ba-sic level), and on access to food, water/sanitation and health services and maternal and child caring practices (at the underlying level). At the underly-ing level, access to health services, water/sanitation, and maternal and child caring practices (women’s
Globalization, Foodand Nutrition Transitions
2. Conceptual framework

22 Globalization and Health Knowledge Network
employment and breastfeeding) are only included where under-nutrition is concerned.5
2.2 The “nutrition transition” model
Another model referred to throughout this paper is the “nutrition transition” model. The model, first pro-posed by Drewnowski and Popkin (1997) suggests that dietary changes proceed in five temporal stages (Drewnowski & Popkin 1997; Popkin 2002a):
• Collecting food (when diets were high in carbohydrates and fibre and low in fat);
• Famine (which still characterizes diets in some low income countries);
• Receding famine (consumption of fruit, vege-tables and animal protein increases, and starchy staples become less important in the diet);
• Dietary patterns associated with diet-related
chronic diseases (increase of fats, sweeteners, decline of fibre – the stage popularly referred to as “the nutrition transition”);
• Behavioural change (when populations desire a healthier diet and change accordingly).
Of concern in this paper is the stage commonly known as the “nutrition transition” – the increasing consump-tion of fats, sweeteners, energy-dense foods, and highly processed foods compared to traditional diets charac-terized by higher intake of cereals. Transitions to diets higher in fats, sweeteners and highly-processed foods have been ongoing in industrialized countries since the industrial revolution (Grigg 1995). In England it is estimated that the per-person consumption of fat and refined carbohydrates increased five- to ten-fold over the past two centuries, while the consumption of fibre-rich grains declined substantially (Uusitalo, Pietinen, & Puska 2002). Today a similar shift in diets
Figure 3: Conceptual framework: Globalization and the social determinants of nutrition, with an emphasis on food
5 These determinants also may be important for over-nutrition, but their consideration was not possible given the timescale available for the paper.

Globalization, Food and Nutrition Transitions 23
is taking place in middle- and low-income countries but at a much faster rate (Popkin 2002b). This shift typically begins with major increases in domestic pro-duction and imports of oilseeds and vegetable oils (Drewnowski & Popkin 1997). Consumption then increases of animal source foods (meat, milk), and processed foods such as snacks, soft drinks, breakfast cereals and processed dairy products. The transition is also characterized by increased consumption of foods away from home, such as street foods and fast foods. Characteristics of the nutrition transition in different countries are described in Box 1.
The transition is of particular interest here because its effects are being experienced on a global scale and are frequently attributed to “globalization” (Popkin 2006). The model also highlights the inequity between di-etary patterns associated with excess consumption of calories, and the “famine” stage, where people have inadequate access to food.
This model is widely used and cited, but has recently been criticized for being oversimplified. Two perspec-tives suggest that the nutrition transition model does not fully incorporate the range of different dynamics. Hawkes (2006) points out that the model assumes that diets converge in the nutrition transition, while in fact the transition is also characterized by a degree of diet diversification within and between groups: not every-one experiences the transition in the same way (a point actually made by Drewnowski and Popkin (1997)). Meanwhile, Lang and Rayner (2007) argue that the nutrition transition stresses the inevitability of dietary change due to changes in income, and underplays less inevitable cultural aspects of change, and how diets are managed in societies as a whole (Lang & Rayner 2007). They point out that in fact there are numerous transi-tions – economic, technological, cultural and psychoso-cial transitions – which influence why people are con-suming different foods in the context of globalization.
Still the simple descriptive nature of the nutrition transition model renders it useful as a basic organizing concept, if not an all embracing explanation of dietary change. For it is clear that diets are becoming more sim-ilar across the world. The FAO has measured the degree of consumption convergence between countries at dif-fering stages of globalization (Bruinsma 2003). Over a period of 70 years (1961 to 203), they compared con-
sumption (measured as national food availability) of 29 primary food products between 150 countries and the United States, finding that since 1960, diets have converged everywhere. The FAO in fact conclude that: “The forces of globalisation… have resulted in a grow-ing convergence of consumption patterns…and open-ness to trade and investments, geographic location, in-come levels and growth, and TNC activity are almost always associated with a rapid convergence in food con-sumption patterns” (p.288) (Bruinsma 2003).Box 1
Characteristics of the nutrition transition in four countries
In China, intake of animal foods increased rapidly after the economic reforms of the 1980s (Du et al. 2002). The overall proportion of energy from fat also rose quickly, reaching an overall average of 27.3 per cent and 32.8 per cent for urban residents in 1997. By 1997, over a third of all Chinese adults and 60.1 per cent of those in urban areas consumed over 30 per cent of their energy from fat. These changes are linked with rapid increases of overweight, obesity and DRCDs in China.
In Indonesia, expenditure on meat, eggs, milk and prepared food has risen significantly since the 1970s, while expenditure on cereal products has fallen (Lipoeto et al. 2004). Nutrient proportions have changed from carbohydrate to fat and protein, and there has been a dramatic shift in causes of death from infectious to chronic diseases.
In Chile, fat consumption has been increasing since the 1980s (Albala et al. 2002). Malnutrition decreased during the 1980s, but obesity increased rapidly in all age groups. In adults, currently about 25 per cent of women are obese, particularly those from low socio-economic levels. Among preschoolers, obesity is now 10 per cent while in six-year-old children it is 17.5 per cent.
In Morocco, the intake of animal products has risen considerably since the 1980s, while that of cereals and sugar has remained relatively high (Benjelloun 2002). Among adults, overweight increased from 26 per cent in 1984 to 36 per cent in 1998.

24 Globalization and Health Knowledge Network
Globalization, Foodand Nutrition Transitions
3. Literature review: the policies and processesof globalization and their nutritional implications
3.1 Objective
The objective of the literature review is to identify what has already been learned about the links between glo-balization and nutrition.6 It aims to answer two ques-tions:
• What is known about how globalization affects the nutrition transition?
• What is known about how globalization affects under-nutrition?
The literature review focused specifically on food and nutrition rather than food security or other determi-nants of malnutrition, such as maternal and child car-ing practices. In the absence of epidemiological studies directly measuring the association between “globaliza-tion” and nutritional outcomes, the review includes papers dealing with how globalization could affect nu-trition (the inclusions and exclusion criteria are set out in Appendix A). It is limited to the studies that address
the link between globalization and nutrition, rather than comprehensively covering all the separate path-ways identified in the conceptual framework between globalization, food and nutrition (Figure 3).
3.2 Methods
The literature review followed a systematic approach. Separate searches were carried out for “globalization” and “trade liberalization” given the important role of trade liberalization in globalization. These search terms were subject to extensive pre-testing to ensure they captured the relevant literature. The precise terms used are listed in Appendix A. In total, three databases were searched, selected to cover the medical, health and nu-trition literature (PubMed), the social science literature (ISI Web of Science), and the health and economics literature from developing countries (CAB Direct). Literature searched include all published between
6 The literature review does not deal explicitly with food security, which is discussed in the paper on Trade Liberalization .

Globalization, Food and Nutrition Transitions 25
1980 and the date of the search (July 14, 2006). Fol-lowing this search, the “grey literature” was searched using Google Scholar.
In total, when the searches in the databases (not includ-ing Google Scholar) were combined and duplicates ac-counted for, a total of 751 papers were retrieved and subject to a title and abstract scan. Papers were then subject to screening on the basis of some general inclu-sion and exclusion criteria (Appendix A). Because the existing literature lacked methodological rigor of the type found in high quality medical and epidemiologi-cal studies, these criteria were set quite broadly. After screening for these criteria, a total of 43 papers were included in the review. In addition, nine papers were selected for full paper review from Google Scholar and two selected for inclusion in the final review. Thus the total number of articles reviewed was 45.
As noted in the introduction, the evidence base in this area is not very strong. In order to present the results of this rather challenging evidence base most usefully, a synthesis of the results of the literature review is pro-vided here.
3.3 What is known about how globalization affects the nutrition transition?
3.3.1 Nature of the literature
The majority of papers covering the nutrition transi-tion consider that the nutrition transition is deeply rooted in the processes of globalization. However, the literature on globalization and the nutrition transition is neither substantive nor well advanced methodologi-cally. This likely reflects the fact that, “it is impossible at this time, with the available databases, to fully link each aspect of globalization exactly to each one of these elements [of diet]” (p.555) (Popkin 2006). Moreover, many of the papers reflected little understanding of how the different aspects of globalization operate. Still the evidence is sufficient to be able to identify the globalization processes that affect the nutrition transi-tion.
Different studies emphasized what economists term the “demand” and “supply” sides of the linkage (i.e. how “consumer” demand may be influencing change, versus systematic changes in the food supply). Most of
the literature dealt with the supply side – and that is the focus here given this is the main food-related link.
3.3.2 Globalization as a driver of changing food demand
On the demand side, the role of globalization in the nutrition transition is intertwined with that of income growth, urbanization and changes in employment. As put by Mendez and Popkin (2004), “because of the multiple shared paths through which urbanization and globalisation may influence food availability and choic-es in developing countries, it is difficult to unravel the effects of the two sets of forces on diet” (p.55) (Mendez & Popkin 2004) (and the same applies to changing incomes and employment). Evidence from two cross-country studies shows that increasing national income per capita and urbanization are associated with dif-ferent diets and greater body mass index (BMI). The first was a regression analysis of national food avail-ability (of the FAO), GNP and the proportion of the population residing in urban areas in that year (Popkin 1999). The results showed that countries with higher GNPs, and with more urbanized populations (as de-pendent and independent variables), consume greater amounts of energy from fats, sweeteners and protein. Simulations of the dietary effects of urbanization also revealed that a shift from 25 per cent to 75 per cent urban population in very low income countries is asso-ciated with an increase of approximately four percent-age points of total energy from fat and an additional 12 percentage points of energy from sweeteners. The second study compared data from over 100 countries, finding that the age-standardized mean population levels of BMI (along with systolic blood pressure and total cholesterol) increases with national income until about I$5,000 (international dollars) and then levels off. BMI increases continuously with greater urbaniza-tion between countries (Ezzati et al. 2005). No specific evidence was identified on how changing employment affects diets or associated DRCDs and risk factors.
Given this type of evidence, many studies and com-mentaries (particularly by economists) posit that the importance of globalization in the nutrition transition is via its effects on income, urbanization and employ-ment: since globalization drives up incomes, encour-ages urbanization and changes the labour market, it leads to different lifestyles and provides more money

26 Globalization and Health Knowledge Network
for people to purchase different foods (Regmi, Bal-lenger, & Putnam 2004). Under this scenario, the role of globalization in the nutrition transition is therefore limited to its role in altering food demand through changing “lifestyles”.
Yet other evidence indicates a need to look beyond in-come, urbanization and employment as the sole nexus of the globalization-nutrition transition link. First, the relationship between globalization, income, urbaniza-tion and employment is not straightforward. Impor-tantly, many have disputed whether globalization re-ally does lead to higher household incomes for all. The impacts of globalization on urbanization and labour market are complex. And it has already been shown that in some countries, people of lower SES consume more obseogenic diets, indicating that the relation-ship with income is not direct. Secondly, another body of literature suggests that while income provides the means, and urban living the incentive, the globaliza-tion of the food supply chain is an important influence on food consumption patterns. As Kennedy, Nantel
and Shetty (2004) explain, “globalisation is having a major impact on food systems around the world...[which] affect availability and access to food through changes to food production, procurement and distri-bution...in turn bringing about a gradual shift in food culture, with consequent changes in dietary consump-tion patterns and nutritional status that vary with the socio-economic strata” (Kennedy, Nantel, & Shetty 2004). In other words, globalization is changing the food resources available to society – its availability, ac-cessibility, price and desirability – by radically altering the nature of food systems. Thus the supply side of the equation should not be ignored.
3.3.3 Globalization as a driver of changing food supply
3.3.3.1 Key processes
A certain consensus emerged from the literature about the globalization processes perceived to play a role in the nutrition transition. The most commonly
Table 3: Globalization processes linked with the nutrition transition
Globalization process Nutritional implication following the conceptual frameworkGrowth of transnational food companies (TFCs) Increases availability of processed foods (fast foods, snacks,
soft drinks) through growth of fast food outlets, supermarkets and food advertising/promotion; driven by trade and FDI
Liberalization of international food trade Imports change availability of foods and/or their priceGlobal food advertising and promotion Shapes food preferences by affecting
desirability of different foodsDevelopment of supermarkets Growth of transnational supermarkets changes food
availability (increases diversity of available products), accessibility, price, and way food is marketed
Cultural influences Migration, TNCs, and tourism introduce and popularize new foods (changes food availability and desirability)
Liberalization of foreign direct investment (FDI) Changes type of foods available, their price and the way they are sold and marketed
Technological developments Affects ability to transport, store and process foods, which affects their availability, accessibility and price
Liberalization and commercialization of domestic agricultural markets
Changes way food is produced, type of foods available, their price and the way they are sold and marketed
* Listed according to how often they are mentioned in the papers included in the literature review.
Globalization, Food and Nutrition Transitions 27
identified processes were the rise of transnational food companies (TFCs), followed closely by the liberaliza-tion of international food trade, and then the related factors of global food advertising and promotion and the growth of transnational supermarkets. Other fac-tors identified were cultural influences, technological developments, the liberalization of foreign direct in-vestment (FDI) and domestic agricultural liberaliza-tion. In synthesizing these papers, it becomes clear that all these processes are inter-related and are perceived as important because they affect the availability, price, accessibility and desirability of different foods (as con-ceptualized in Figure 3). These are set out on Table 3.
3.3.3.2 Growth of transnational food companies (TFCs)
A large number of studies identified the growth of trans-national food companies (TFCs) as the most critical globalization process in the nutrition transition (Chop-ra 2002; Chopra & Darnton-Hill 2004; Chopra, Gal-braith, & Darnton-Hill 2002; Hawkes 2006; Hawkes 2002; Kennedy, Nantel, & Shetty 2004; Kinabo 2004; Lang 1997; Lang 1999; Sawaya, Martins, & Martins 2004). TFCs now increasingly organize food produc-tion, distribution and marketing on a global scale, and evidence shows that globalization has provided power-ful incentives for the formation of these TFCs. As ex-plained in one study: “More open trade and investment have made buying companies, products and services easier across national borders, so creating incentives for
TFCs to grow through global vertical integration and sourcing. Global vertical integration – when a company brings together the entire process of producing, distrib-uting and selling a particular food under its control by buying and contracting other companies and services worldwide – reduces the transaction costs associated with having different suppliers and creates economies of scale. Global sourcing – when a company searches for inputs, production sites and outputs where costs are lower and regulatory, political and social regimes favour-able – enables TFCs to cut costs and helps safeguard against the uncertainty of commodity production and product sales” (p.3) (Hawkes 2006). TFCs also grow through foreign direct investment (FDI), which plays a fundamental role in integrating the global marketplace (see section 5.3.1.3. below). FDI is a long-term invest-ment by an individual, government or enterprise in one country into an enterprise in another, in which the for-eign enterprise becomes a foreign affiliate of the parent (transnational) company. It thus allows companies to buy, sell and invest in other companies in other coun-tries, thereby becoming one of the processes through which vertical integration can take place and TFCs can grow.
Evidence from the literature points to four particu-larly critical ways in which TFCs have altered the food supply, thereby affecting consumption: more processed foods, more fast food outlets, more large su-permarkets and more food advertising and promotion (the latter two processes are described in more detail
Source: Hawkes (2002)
Figure 4: Worldwide number of McDonald’s outlets, by region, 1991 and 2001 (proportion and number)

28 Globalization and Health Knowledge Network
Figure 5: Number of transactions at chained burger and chicken outlets in selected countries, 1995 and 1999
Source: Hawkes (2002)
in subsequent sections). The largest foreign affiliates of TFCs in developing countries are often food com-panies specializing in some form of processed foods (Table 6). The assumed results are greater availability, increased accessibility, lower prices, and greater desir-ability for energy-dense processed and fast foods. The increasing number of fast food outlets was cited par-ticularly widely as evidence of change. Figure 4 de-picts the increase in the number of McDonald’s out-lets worldwide between 1991 and 2001. As shown, while the number of McDonald’s increased rapidly, the proportion of outlets outside the US increased at an even faster rate. Thus the transnational nature of the US-based fast food chain increased significantly during the time period. Other data shows that even in countries like Tanzania where the number of fast food outlets remains quite small, their presence and popularity is rising fast, propelled by advertising and promotion (Kinabo 2004).
But what is the evidence of how these TFCs actually affect dietary patterns? Figure 5 shows that the num-ber of transactions from fast food chains is increasing in countries all over the world, and Box 2 that sales from supermarkets are growing. Sales of packaged foods – the type sold by TFCs – are also growing: be-tween 2000 and 2005, sales increased from US$1.095 billion to US$1.455 billion (Euromonitor 2006). Globally, fastest growth was of snack bars (68 per cent value growth 2000-2005), followed by ready meals (45 per cent). There is also evidence from the United States that TFCs deliberately try to increase consump-tion of these foods. These efforts have been categor-ised by Chopra and Darnton-Hill (2004) as follows: advertising and promotion; large serving sizes; price inducements; aggressive entry into markets in devel-oping countries, and by what they term “substitution” (the progressive reduction of agricultural products to simple industrial inputs that allows replacements by
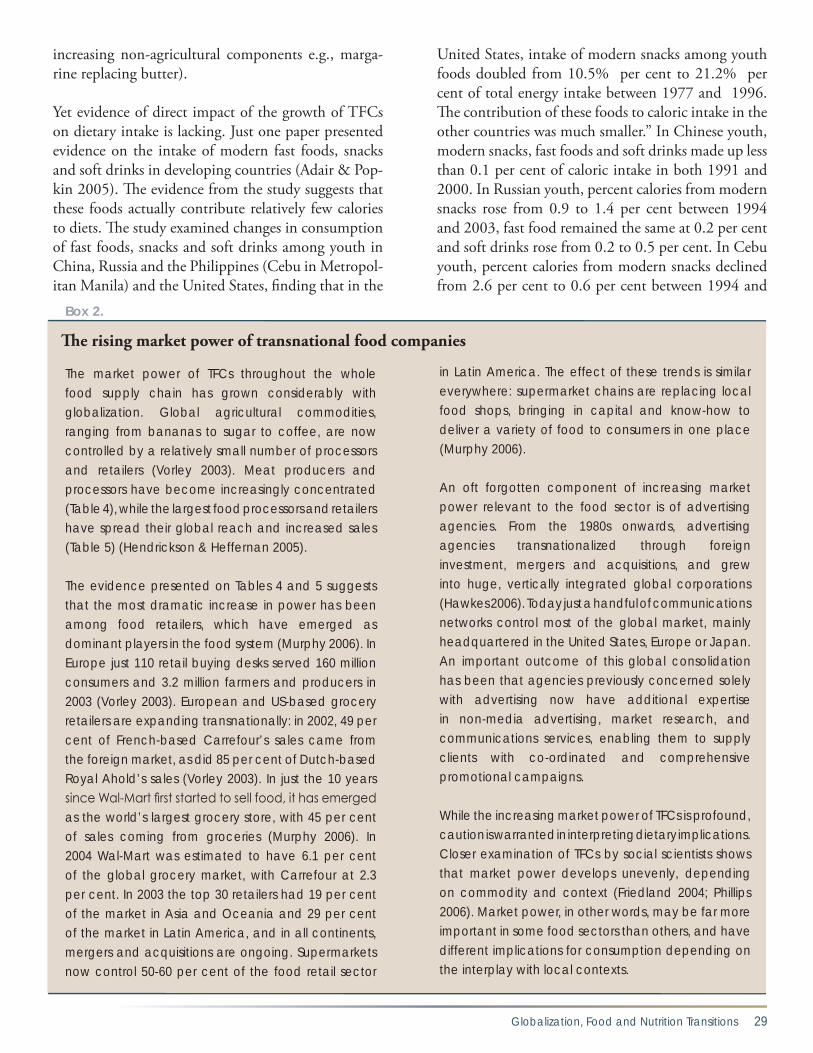
Globalization, Food and Nutrition Transitions 29
increasing non-agricultural components e.g., marga-rine replacing butter).
Yet evidence of direct impact of the growth of TFCs on dietary intake is lacking. Just one paper presented evidence on the intake of modern fast foods, snacks and soft drinks in developing countries (Adair & Pop-kin 2005). The evidence from the study suggests that these foods actually contribute relatively few calories to diets. The study examined changes in consumption of fast foods, snacks and soft drinks among youth in China, Russia and the Philippines (Cebu in Metropol-itan Manila) and the United States, finding that in the
United States, intake of modern snacks among youth foods doubled from 10.5% per cent to 21.2% per cent of total energy intake between 1977 and 1996. The contribution of these foods to caloric intake in the other countries was much smaller.” In Chinese youth, modern snacks, fast foods and soft drinks made up less than 0.1 per cent of caloric intake in both 1991 and 2000. In Russian youth, percent calories from modern snacks rose from 0.9 to 1.4 per cent between 1994 and 2003, fast food remained the same at 0.2 per cent and soft drinks rose from 0.2 to 0.5 per cent. In Cebu youth, percent calories from modern snacks declined from 2.6 per cent to 0.6 per cent between 1994 and
Box 2.
The market power of TFCs throughout the whole food supply chain has grown considerably with globalization. Global agricultural commodities, ranging from bananas to sugar to coffee, are now controlled by a relatively small number of processors and retailers (Vorley 2003). Meat producers and processors have become increasingly concentrated (Table 4), while the largest food processors and retailers have spread their global reach and increased sales (Table 5) (Hendrickson & Heffernan 2005).
The evidence presented on Tables 4 and 5 suggests that the most dramatic increase in power has been among food retailers, which have emerged as dominant players in the food system (Murphy 2006). In Europe just 110 retail buying desks served 160 million consumers and 3.2 million farmers and producers in 2003 (Vorley 2003). European and uS-based grocery retailers are expanding transnationally: in 2002, 49 per cent of French-based Carrefour’s sales came from the foreign market, as did 85 per cent of Dutch-based Royal Ahold’s sales (Vorley 2003). In just the 10 years since Wal-Mart first started to sell food, it has emerged as the world’s largest grocery store, with 45 per cent of sales coming from groceries (Murphy 2006). In 2004 Wal-Mart was estimated to have 6.1 per cent of the global grocery market, with Carrefour at 2.3 per cent. In 2003 the top 30 retailers had 19 per cent of the market in Asia and Oceania and 29 per cent of the market in Latin America, and in all continents, mergers and acquisitions are ongoing. Supermarkets now control 50-60 per cent of the food retail sector
in Latin America. The effect of these trends is similar everywhere: supermarket chains are replacing local food shops, bringing in capital and know-how to deliver a variety of food to consumers in one place (Murphy 2006).
An oft forgotten component of increasing market power relevant to the food sector is of advertising agencies. From the 1980s onwards, advertising agencies transnationalized through foreign investment, mergers and acquisitions, and grew into huge, vertically integrated global corporations (Hawkes 2006). Today just a handful of communications networks control most of the global market, mainly headquartered in the united States, Europe or Japan. An important outcome of this global consolidation has been that agencies previously concerned solely with advertising now have additional expertise in non-media advertising, market research, and communications services, enabling them to supply clients with co-ordinated and comprehensive promotional campaigns.
While the increasing market power of TFCs is profound, caution is warranted in interpreting dietary implications. Closer examination of TFCs by social scientists shows that market power develops unevenly, depending on commodity and context (Friedland 2004; Phillips 2006). Market power, in other words, may be far more important in some food sectors than others, and have different implications for consumption depending on the interplay with local contexts.
The rising market power of transnational food companies
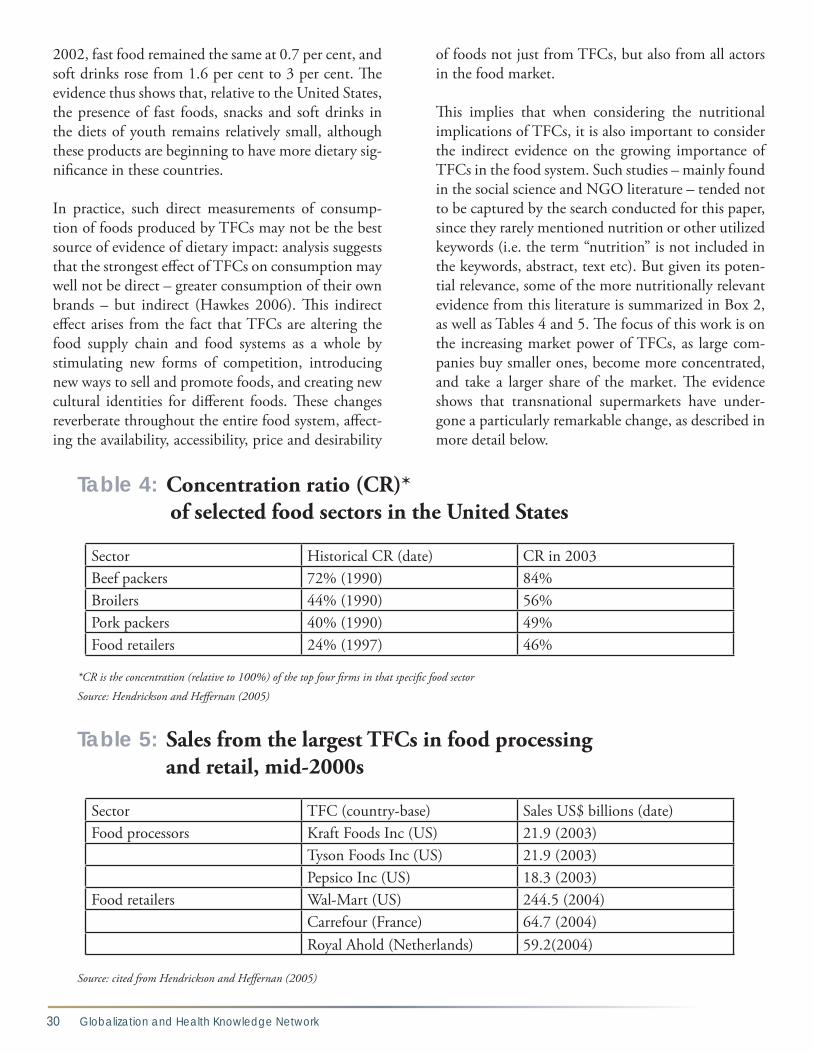
30 Globalization and Health Knowledge Network
2002, fast food remained the same at 0.7 per cent, and soft drinks rose from 1.6 per cent to 3 per cent. The evidence thus shows that, relative to the United States, the presence of fast foods, snacks and soft drinks in the diets of youth remains relatively small, although these products are beginning to have more dietary sig-nificance in these countries.
In practice, such direct measurements of consump-tion of foods produced by TFCs may not be the best source of evidence of dietary impact: analysis suggests that the strongest effect of TFCs on consumption may well not be direct – greater consumption of their own brands – but indirect (Hawkes 2006). This indirect effect arises from the fact that TFCs are altering the food supply chain and food systems as a whole by stimulating new forms of competition, introducing new ways to sell and promote foods, and creating new cultural identities for different foods. These changes reverberate throughout the entire food system, affect-ing the availability, accessibility, price and desirability
of foods not just from TFCs, but also from all actors in the food market.
This implies that when considering the nutritional implications of TFCs, it is also important to consider the indirect evidence on the growing importance of TFCs in the food system. Such studies – mainly found in the social science and NGO literature – tended not to be captured by the search conducted for this paper, since they rarely mentioned nutrition or other utilized keywords (i.e. the term “nutrition” is not included in the keywords, abstract, text etc). But given its poten-tial relevance, some of the more nutritionally relevant evidence from this literature is summarized in Box 2, as well as Tables 4 and 5. The focus of this work is on the increasing market power of TFCs, as large com-panies buy smaller ones, become more concentrated, and take a larger share of the market. The evidence shows that transnational supermarkets have under-gone a particularly remarkable change, as described in more detail below.
Table 4: Concentration ratio (CR)* of selected food sectors in the United States
Sector Historical CR (date) CR in 2003Beef packers 72% (1990) 84%Broilers 44% (1990) 56%Pork packers 40% (1990) 49%Food retailers 24% (1997) 46%
*CR is the concentration (relative to 100%) of the top four firms in that specific food sector
Source: Hendrickson and Heffernan (2005)
Table 5: Sales from the largest TFCs in food processing and retail, mid-2000s
Sector TFC (country-base) Sales US$ billions (date)Food processors Kraft Foods Inc (US) 21.9 (2003)
Tyson Foods Inc (US) 21.9 (2003)Pepsico Inc (US) 18.3 (2003)
Food retailers Wal-Mart (US) 244.5 (2004)Carrefour (France) 64.7 (2004)Royal Ahold (Netherlands) 59.2(2004)
Source: cited from Hendrickson and Heffernan (2005)
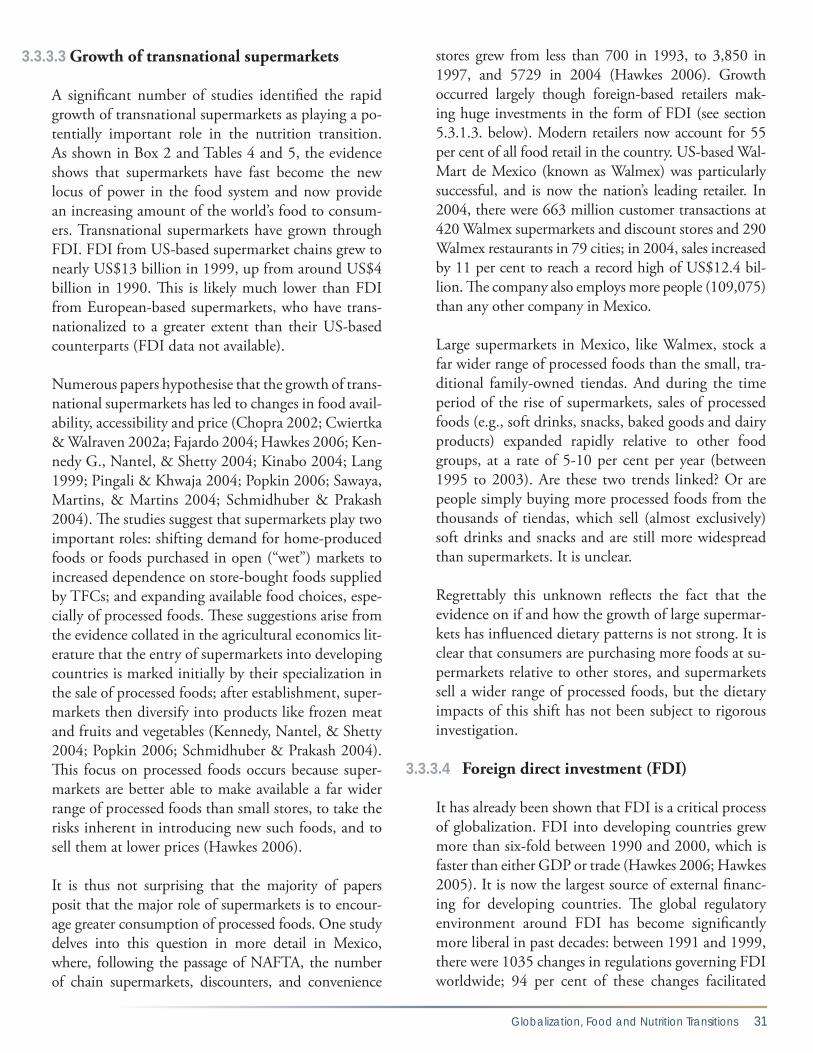
Globalization, Food and Nutrition Transitions 31
3.3.3.3 Growth of transnational supermarkets
A significant number of studies identified the rapid growth of transnational supermarkets as playing a po-tentially important role in the nutrition transition. As shown in Box 2 and Tables 4 and 5, the evidence shows that supermarkets have fast become the new locus of power in the food system and now provide an increasing amount of the world’s food to consum-ers. Transnational supermarkets have grown through FDI. FDI from US-based supermarket chains grew to nearly US$13 billion in 1999, up from around US$4 billion in 1990. This is likely much lower than FDI from European-based supermarkets, who have trans-nationalized to a greater extent than their US-based counterparts (FDI data not available).
Numerous papers hypothesise that the growth of trans-national supermarkets has led to changes in food avail-ability, accessibility and price (Chopra 2002; Cwiertka & Walraven 2002a; Fajardo 2004; Hawkes 2006; Ken-nedy G., Nantel, & Shetty 2004; Kinabo 2004; Lang 1999; Pingali & Khwaja 2004; Popkin 2006; Sawaya, Martins, & Martins 2004; Schmidhuber & Prakash 2004). The studies suggest that supermarkets play two important roles: shifting demand for home-produced foods or foods purchased in open (“wet”) markets to increased dependence on store-bought foods supplied by TFCs; and expanding available food choices, espe-cially of processed foods. These suggestions arise from the evidence collated in the agricultural economics lit-erature that the entry of supermarkets into developing countries is marked initially by their specialization in the sale of processed foods; after establishment, super-markets then diversify into products like frozen meat and fruits and vegetables (Kennedy, Nantel, & Shetty 2004; Popkin 2006; Schmidhuber & Prakash 2004). This focus on processed foods occurs because super-markets are better able to make available a far wider range of processed foods than small stores, to take the risks inherent in introducing new such foods, and to sell them at lower prices (Hawkes 2006).
It is thus not surprising that the majority of papers posit that the major role of supermarkets is to encour-age greater consumption of processed foods. One study delves into this question in more detail in Mexico, where, following the passage of NAFTA, the number of chain supermarkets, discounters, and convenience
stores grew from less than 700 in 1993, to 3,850 in 1997, and 5729 in 2004 (Hawkes 2006). Growth occurred largely though foreign-based retailers mak-ing huge investments in the form of FDI (see section 5.3.1.3. below). Modern retailers now account for 55 per cent of all food retail in the country. US-based Wal-Mart de Mexico (known as Walmex) was particularly successful, and is now the nation’s leading retailer. In 2004, there were 663 million customer transactions at 420 Walmex supermarkets and discount stores and 290 Walmex restaurants in 79 cities; in 2004, sales increased by 11 per cent to reach a record high of US$12.4 bil-lion. The company also employs more people (109,075) than any other company in Mexico.
Large supermarkets in Mexico, like Walmex, stock a far wider range of processed foods than the small, tra-ditional family-owned tiendas. And during the time period of the rise of supermarkets, sales of processed foods (e.g., soft drinks, snacks, baked goods and dairy products) expanded rapidly relative to other food groups, at a rate of 5-10 per cent per year (between 1995 to 2003). Are these two trends linked? Or are people simply buying more processed foods from the thousands of tiendas, which sell (almost exclusively) soft drinks and snacks and are still more widespread than supermarkets. It is unclear.
Regrettably this unknown reflects the fact that the evidence on if and how the growth of large supermar-kets has influenced dietary patterns is not strong. It is clear that consumers are purchasing more foods at su-permarkets relative to other stores, and supermarkets sell a wider range of processed foods, but the dietary impacts of this shift has not been subject to rigorous investigation.
3.3.3.4 Foreign direct investment (FDI)
It has already been shown that FDI is a critical process of globalization. FDI into developing countries grew more than six-fold between 1990 and 2000, which is faster than either GDP or trade (Hawkes 2006; Hawkes 2005). It is now the largest source of external financ-ing for developing countries. The global regulatory environment around FDI has become significantly more liberal in past decades: between 1991 and 1999, there were 1035 changes in regulations governing FDI worldwide; 94 per cent of these changes facilitated

32 Globalization and Health Knowledge Network
Table 6: Example of low- and middle-income countries in which food companies are among the three largest foreign affiliates in the industrial or tertiary sectorCountry Sector (rank 1-3 by sales) Company name
(country base)Sales (US$ millions)*
AfricaAlgeria Food, dairy (1) Laiterie Djurdjura (France) 29.8Cape Verde Beverages, beer/
soft drinks (1)Ceris-Soc CV Cerveja Ref (Luxembourg)
1.8
Kenya Food, packaged (3) Unilever Kenya (UK) 141.0Morocco Food, packaged (3) Nestlé´Maroc
(Switzerland)88.4
Rwanda Beverages, beer/soft drinks (1)
Brasseries et Limonaderies (Netherlands)
28.6
Zimbabwe Food, meat (1) Meat Importers (UK) 25.0Asia / PacificCambodia Beverages, soft (2) Cambodia Beverage
Company (Coca-Cola) (Singapore)
Not known
Samoa Beverages, beer / soft drinks (2)
Samoa Breweries (Japan) Not known
Central& Eastern EuropeAlbania Beverages, soft (2) Coca-Cola Bottling
Enterprises (USA)Not known
Bosnia-Herzegovina Beverages, soft (3) Coca Cola (USA) Not knownCroatia Beverages, beer (1) Zagrebacka Pivovara
DD (Belgium)49.4
Estonia Food, meat processing (3) Rakvere Lihakombinaat AS (Finland)
72.8
Kazakhstan Diversified, including food (1)
Procter & Gamble (USA) 150.0
Moldova Food, dairy (2) Alba (USA) Not knownRomania Retail, including food (1) Metro Cash and Carry
SRI (Germany)359.8
Ukraine Beverages, soft (3) Coca-Cola Beverages Ukraine Ltd Co. (USA)
42.0
Latin AmericaBrazil Retail, including food (2) Carrefour Comercio
E Industria (France)4412.0
Costa Rica Food, fruit production (3) Standard Fruit Company de Costa Rica (USA)
173.0
Ecuador Food, packaged (2) Nestlé´ Ecuador (Switzerland)
102.0
Mexico Retail, including food (1) Wal-Mart de Mexico (USA)
9607.0
*Data are taken from 1999, 2000, 2001 or 2002. Source: Hawkes (2005). Original data from UNCTAD

Globalization, Food and Nutrition Transitions 33
FDI by decreasing disincentives or increasing incen-tives. Many of the new regulations were forged in trade agreements and investment treaties: the number of bi-lateral investment treaties rose from 181 at the end of 1980 to 1,856 at the end of 1999. This rapid growth of FDI has facilitated the growth of TFCs, including transnational supermarkets (see section 5.3.1.1).
Just four studies highlighted the importance of FDI in the nutrition transition (Connor 1994; Hawkes 2005; Hawkes 2006; Vepa 2004). Evidence from these stud-ies suggests that FDI has played a particularly impor-tant role in shaping the growing global market for processed foods. Food processing is now the most im-portant recipient of FDI relative to other parts of the food system, and FDI is more important in the global processed foods market than trade. US FDI into for-eign food processing companies grew from US$9 bil-lion in 1980 to US$36 billion in 2000. Sales by those companies increased from US$39.2 billion in 1982 to US$150 billion in 2000 (trade, by contrast, gener-ated a relatively small US$30 billion in processed food sales in 2000). While a high proportion of this FDI is still targeted at high-income countries, an increas-ing proportion is entering developing and transition markets, notably Latin America, Asia and Central and Eastern Europe. Table 6 shows examples of low- and middle-income countries in which food companies are amongst the three largest foreign affiliates in the industrial or tertiary sector. The evidence also shows that as FDI has risen, the al-location of investment has shifted away from products for export to the home market and products produced by primary processing, towards highly processed foods for sale in the host market. In 1998, 74 per cent of the sales of affiliates of US food companies remained in the host market. The tendency to allocate investment into highly processed foods is illustrated by the economies of Central and Eastern Europe and the Baltic states, which attracted soaring rates of FDI in the food sec-tor in the 1990s. Investment has concentrated on soft drinks and confectionery. The confectionery sector in Poland, for example, attracted FDI of US$963 million between 1990 and 1999, more than the FDI in meat, fish, flour, pasta, bread, sugar, potato products, fruits, vegetables, vegetable oils and fats put together. On a global scale, this trend has led to the dominance of foreign investors in the highly processed food sector.
In China, for example, there are numerous nationally and locally based food companies, some of which have successfully out-competed foreign companies. But in packaged foods, such as instant noodles, soft drinks, snacks, sweet biscuits and fast foods, foreign investors dominate.
Further evidence comes from Mexico (Hawkes 2006). In 1994 Mexico, the United States and Canada signed the North American Free Trade Agreement (NAFTA). The agreement contained key provisions designed to facilitate foreign investment, and stimulated a rapid acceleration of FDI from the United States into Mexi-can food processing. Between 1983 and 1993, US FDI into the Mexican food processing industry increased from US$210 million to US$2.3 billion. Five years af-ter NAFTA, FDI into the Mexican food industry from the United States had risen to US$5.3 billion, nearly three-quarters of which went into the production of processed foods. And, as already described, sales of pro-cessed foods has been increasing in Mexico (see section 5.3.1.2).
This is not to underestimate the importance of do-mestic investment in the processed foods industry, as shown by evidence from India. In India the con-sumer food industry remains relatively small but has been growing since 1990, notably in packaged bread and biscuits. Consumption of these products has increased. Yet a relatively small proportion of this growth came from foreign relative to domestic in-vestment: of the US$156 billion of investment in the Indian processed foods industry between 1991 and 2002, just US$2 billion was from FDI (Vepa 2004).
But what is the evidence on how these increases in FDI, and in some cases domestic investment, affect the nutrition transition? Clearly, as already discussed, the impact of FDI is felt through the impact of the growth of TFCs, and the studies reviewed here show that FDI has led to greater availability of processed foods. FDI is also likely to have stimulated the sales of processed foods by lowering prices, creating new incentives for more advertising and promotion and, as already dis-cussed, creating modern retail outlets amenable to the sale of a wide variety of processed foods. Although di-rect measurable evidence is non-existent, evidence on the sales of processed foods provides further insights. Sales of processed foods in developing countries are

34 Globalization and Health Knowledge Network
lower than in developed countries (one quarter or less of all food expenditures, compared with almost half ) (Hawkes 2005). And sales of primary processed foods (e.g. fats and oils) relative to highly processed foods are greater. Yet annual sales growth of all processed foods is around 29 per cent in low- to middle-income countries compared with 7 per cent in upper- to mid-dle-income countries. As well, the market for highly processed foods is expanding quickly. In Brazil growth in real volume sales of hamburgers, biscuits, ready-to-eat desserts, yogourts and flavoured milk amounted to an average 27 per cent between 1993 and 1997, compared with 5 per cent for vegetable oils, marga-rines, beef, poultry and pork meat. Sales of breakfast cereals are registering double- and triple-digit growth in many developing countries, while sales growth of ready-to-eat meals has been dramatic in Eastern Eu-rope and Latin America. Soft drinks sales are growing rapidly in Eastern Europe, Asia and Latin America. Vietnam, China and Indonesia are expected to be the fastest-growing markets for packaged food retail sales over the coming years, with growth rates forecast at 11, 10 and 8 per cent respectively. Korea, Thailand, India and the Philippines rank among the top 10 growing markets, with total packaged food retail sales expected to grow by 5 to 7 per cent annually.
Thus it appears clear that FDI has played a role in the nutrition transition by increasing the amount of highly processed foods in the global diet. But less clear is exactly how increased consumption of highly pro-cessed foods has affected diet and nutrition as a whole – and whether the process has been primarily driven by demand or supply.
3.3.3.5 Global food advertising and promotion
Proportionally the globalization process identified as driving the nutrition transition by the third largest number of studies reviewed was global food advertis-ing and promotion. Food advertising and promotion drive globalization by speeding the flow of food prod-ucts into the global marketplace (Hawkes 2006). It does this by attracting attention to new products, cre-ating perceived differences between similar products, and improving the apparent value and desirability of products. In so doing, marketing encourages more consumers to consume the products, and more pro-ducers to produce them, thus advancing the cycle of
global market exchange and integration (i.e. globaliza-tion). And just as marketing facilitates globalization, globalization facilitates marketing. As described in Box 2, globalization brought to the developing world the advertising and marketing agencies with the most expertise in designing marketing campaigns – as well as the TFCs that advertise.
The evidence shows clearly that expenditure on food advertising is high and increasing in developing countries. Total global advertising expenditure rose from US$216 billion to US$512 billion between 1980 and 2004 (World Watch, cited in Hawkes 2006). In the United States, the food industry is es-timated to spend around US$30 billion on advertis-ing and promotion, more than any other industry (Chopra & Darnton-Hill 2004). But evidence sug-gests that the food industry is allocating more ad-vertising expenditure to developing countries. Figure 6 shows that expenditure by two leading US-based brands declined in the United States in the 1990s, but increased outside the United States, while Table 7 shows that Coca-Cola is not among the top 10 largest spenders in the United States or Western Eu-ropean countries, but is in developing and transi-tional countries. In other words, spending is greatest where the companies are attempting to significantly grow their markets.
Evidence from western countries shows that a signifi-cant proportion of food advertising and promotion is targeted at children and youth, and much of it is for high-calorie, nutrient-poor foods (Hastings et al. 2003; McGinnis, Gootman, & Kraak 2006). Evi-dence available from developing countries shows the same pattern. In Brazil close to 60 per cent of all food advertisements in 2002 were for foods high in fats and sweeteners (Sawaya, Martins, & Martins 2004). In Asia food makes up a significant proportion of adver-tising targeted at children, ranging from 25 per cent in South Korea, to 40-50 per cent in India, 50-75 per cent in Pakistan and the Philippines, and 70 per cent in Malaysia (Escalante de Cruz et al. 2004). The over-whelming majority of food advertising aimed at chil-dren is for foods and beverages high in sugars, fat and/or salt (the study by Escalante de Cruz et al. does not indicate if this was actually measured). A recent sys-tematic literature review came to similar conclusions (Hastings et al. 2007). The review involved a search
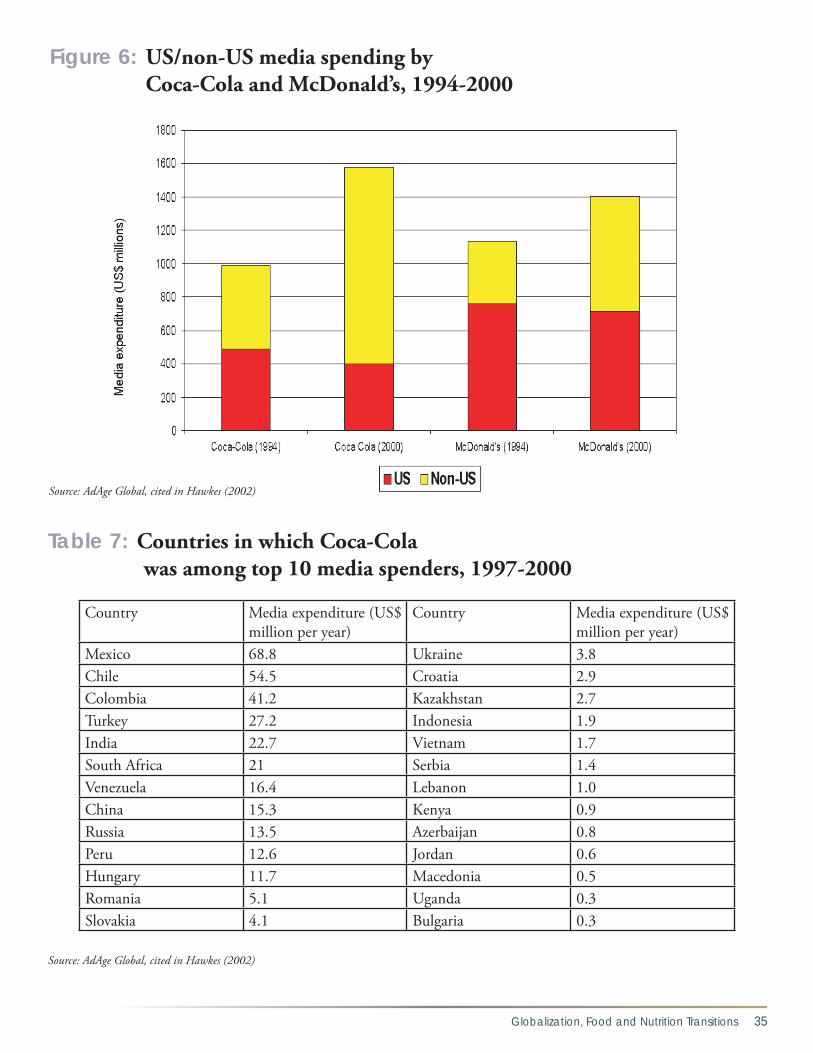
Globalization, Food and Nutrition Transitions 35
Figure 6: US/non-US media spending by Coca-Cola and McDonald’s, 1994-2000
Source: AdAge Global, cited in Hawkes (2002)
Table 7: Countries in which Coca-Cola was among top 10 media spenders, 1997-2000
Country Media expenditure (US$
million per year)Country Media expenditure (US$
million per year)Mexico 68.8 Ukraine 3.8Chile 54.5 Croatia 2.9Colombia 41.2 Kazakhstan 2.7Turkey 27.2 Indonesia 1.9India 22.7 Vietnam 1.7South Africa 21 Serbia 1.4Venezuela 16.4 Lebanon 1.0China 15.3 Kenya 0.9Russia 13.5 Azerbaijan 0.8Peru 12.6 Jordan 0.6Hungary 11.7 Macedonia 0.5Romania 5.1 Uganda 0.3Slovakia 4.1 Bulgaria 0.3
Source: AdAge Global, cited in Hawkes (2002)

36 Globalization and Health Knowledge Network
of 11 databases, which identified 15 studies from de-veloping countries on food promotion in developing countries, including Chile, Thailand and Venezuela. These studies provided evidence that there is a great deal of food promotion to children in these countries, particularly in the form of television advertising, and that advertising is typically for highly processed, en-ergy dense foods.
There is also evidence that the objective of food ad-vertising and promotion is to encourage more types of people to consume a product, more frequent con-sumption of that product, and more of the product at one time (Hawkes 2002). Companies use a wide range of techniques to deliberately encourage children and youth to adopt regular and frequent consumption of these products in developing countries (evidence is
Box 3.
TFCs use the “4ps” of marketing to advertising and promote their food: price, package, promotions and public relations.
PRICE AND PACKAGE: Processed foods products are often priced out of the reach of the mass market. To expand their consumer base, TFCs use a joint price/package marketing strategy of selling smaller and cheaper drinks in newer/poorer/rural markets. To expand volume, they size up portions and packages in more affluent urban areas.
PRODUCT: TFCs adapt their products to provide products preferred by local people and develop menu items specifically to appeal to children and youth.
PROMOTION: To advertise their products, TFCs utilize a huge range of techniques including signage, television advertising, sales promotions and websites.• Television advertisements are designed to
encourage consumers to emotionally bond with the product, via association with a special or magical moment, strong family values, fun and excitement or local traditions. Commercials purvey glamour, and often feature young children, good-looking teens and young adults, celebrities and animation.
• Premium, prize and discount sales promotions target children and youth. Notable examples include free/discounted toys with meals, and gifts available to collectors of product packag-ing. In some countries, TFCs have set up Kid’s Clubs enabling children access to more sales promotions.
• Websites provide information about promotional campaigns and feature interactive promotions, games and downloadable goods.
PUBLIC RELATIONS: Includes service-related marketing, TV and movie tie-ins, sports sponsorship, music, event, product sponsorship, educational competitions, phi-lanthropy. • Service-related marketing by fast food companies
includes the provision of services to attract children (such as play areas and birthday parties) and teens (such as Internet access and computer games).
• Sports sponsorship is a major promotional vehicle for TFCs, ranging from the global scale – such as the World Cup and Olympic game – to the grassroots level, such as community sports train-ing programmes. The sports sponsored are those most popular in specific countries and those popular with youth.
• Sponsorship of children’s and youth television shows and movies
• Sponsorship of music, events and products as a means of attracting teens, expanding product availability and signage, and identifying the brand with local culture. They also run a range of educa-tional competitions, including environmental aware-ness campaigns and youth achievement awards.
• Philanthropy extends marketing by identifying the brand with good deeds and local concerns. TFCs operate on a large scale via foundations and links with international organizations, as well as at a local level, focusing on causes such as children, education and health.
Source: Hawkes 2002
The Strategies used by TFCs to encourage consumption ofhigh-calorie, nutrient-poor foods among children worldwide

Globalization, Food and Nutrition Transitions 37
summarized in Box 3). In Latin America, for example, soft drinks companies took steps in the late 1990s to “increase consumption in schools” by selling products in schools in “attractive combo” packages in Mexico and Colombia, and in Costa Rica “creating new points of sale in strategic areas of each institution”. These strategies were said to boost sales to school children by 50 per cent. In India a leading soft drinks company used celebrity advertising as a means of “making sure people are made to want to drink more of our drinks.” In China the popularity of fast food with children was encouraged by the provision of facilities for birthday parties, play areas and educational activities. This lat-ter finding is supported by anthropological evidence from Asia that advertising and promotion are used to create a cultural identification with new, western foods (Watson 1997). In all these developing markets, promotional activity is destined to grow given the ex-pansion of media communications, the liberalization
of rules on international advertising services, and the increasing number of children’s television channels.
But what is the evidence on how food advertising and promotion actually affect food consumption patterns? Two major systematic reviews have now concluded that food advertising targeted at children and youth does influence food choices (Hastings et al. 2003, Stead, McDermott, Forsyth, MacKintosh, Rayner, Godfrey, Caraher, & Angus 2003; McGinnis et al. 2006, Gootman, & Kraak 2006). The review by Hast-ings et al (2003) was updated in 2006 and came to the same conclusions (Hastings et al. 2007, McDermott, Angus, Stead, & Thomson 2007). The reviews used standard systematic review methodologies, with clear inclusion and exclusion criteria and ratings for quality. Hastings et al. (2003, 2007) searched 11 databases, while McGinnis et al. (2006) searched 15 databases. The reviews covered the literature on the effects of food
Box 4.
From Hastings et al (2003) and supported by the later findings of Hastings et al (2007)• Food promotion is unlikely to influence general
perceptions of what constitutes a healthy diet, but does have a modest effect on certain types of nutritional knowledge.
• Food promotion influences food preferences for both brand and category effects.
• Food promotion strongly influences children’s food purchases and purchase-related behaviour.
• Food promotion can, in some contexts, influence children’s food consumption behaviour.
• There is evidence of small but significant associa-tions between television viewing and diet and television viewing and obesity.
• Food promotion has a significant influence on children’s food behaviour and diet that is inde-pendent of other factors.
• Food promotion causes both brand switching and category effects.
From McGinnis et al (2006)• There is strong evidence that television advertis-
ing influences the food and beverage prefer-ences of children aged 2–11 years (insufficient evidence for 12-18 year olds).
• There is strong evidence that television advertis-ing influences the food and beverage purchase requests of children aged 2–11 years (insufficient evidence for 12-18 year olds).
• There is moderate evidence that television advertising influences the food and beverage beliefs of children aged 2–11 years (insufficient evidence for 12-18 year olds).
• There is strong evidence that television advertis-ing influences the short-term consumption of children ages 2–11 years (insufficient evidence for 12-18 year olds).
• There is moderate evidence that television advertising influences the usual dietary intake of younger children ages 2–5 years and weak evidence that it influences the usual dietary intake of older children ages 6–11 years. There is also weak evidence that it does not influence the usual dietary intake of teenagers aged 12–18 years.
• Statistically, there is strong evidence that expo-sure to television advertising is associated with adiposity in children ages 2–11 years and teen-agers aged 12–18 years.
Sources: Hastings et al., 2003; McGinnis, Gootman and Kraak, 2006
Evidence on the impact of food promotion on children’s diets

38 Globalization and Health Knowledge Network
promotion on three outcome variables: dietary intake, precursors to dietary intake (e.g., nutritional knowl-edge, food preferences and choices) and diet-related health (e.g., obesity, cholesterol). After accounting for the inclusion/exclusion criteria, the Hastings et al. re-view published in 2003 included 55 papers describing 51 studies on the effects of food promotion. The 2006 update by Hastings et al. (2007) included a further 19 studies on the effects published between 2003 and 2006. With similarly stringent inclusion and exclu-sion criteria, McGinnis et al. (2006) included a larger number of studies – a total of 123 studies. The conclu-sion from both reviews was clear: food promotion has a significant influence on children’s food behaviour and diet independent of other factors. More detailed results are described in Box 4. However, the evidence is limited in certain respects. First, it does not allow a determination of whether the influence of such targeted food advertising is greater or weaker in shaping food choices than are other fac-tors, such as parental influence. Secondly, the evidence is limited to television advertising, not other forms of promotion. Thirdly, the evidence that television ad-
vertising is associated with obesity does not convinc-ingly rule out other possible explanations for the asso-ciation, and therefore is not sufficient to arrive at any finding about a causal relationship. And last but not least, none of the evidence on causality comes from developing countries.
As already pointed out, the second review by Hastings et al (2007) did attempt to identify papers specifically from developing countries. The 15 identified studies were limited to studies that examined how children respond to food promotion. The result from these studies was, however, clear: children recall, enjoy and engage with food advertising in developing countries. Still evidence on whether food advertising and pro-motion has driven specific dietary changes in develop-ing countries is not available. Some limited evidence is available from a study of the impact of advertising of snacks to children in Thailand (Hawkes 2006). The advertising and promotions industry in Thailand is among the most developed and dynamic in Asia: from 1987 to 1996, advertising expenditures grew nearly 800 per cent, and advertising revenues have grown at double digit figures in recent years. Foreign ownership
Figure 7: Retail sales of sweet and savoury snacks in Thailand, 1999-2004
Source: Hawkes (2006)

Globalization, Food and Nutrition Transitions 39
trade polices as a condition for loans from interna-tional financial institutions such as the International Monetary Fund (IMF). In some countries, trade liberalization was adopted as a domestic, unilateral strategy. The pace of reform accelerated in the 1990s as many countries liberalized food trade via global, re-gional and bilateral agreements. The most important global agreement was the Agreement on Agriculture (1994) of the Uruguay Round of the General Agree-ment of Tariffs and Trade (GATT) – representing the first time food had been brought into an international trade agreement. The GATT was superseded by the World Trade Organization (WTO), which continues to be the major global negotiating mechanisms for the reduction of tariffs, export subsidies and domes-tic agricultural support. Regional free trade agree-ments (FTAs) and bilateral agreements have also become increasingly important in the drive to lib-eralize trade. These include the North America Free Trade Agreement (NAFTA), the Mercado Común Sudamericano (MERCOSUR), and Association of South-East Asian Nations (ASEAN), and the Cen-tral American Free Trade Agreement (CAFTA) Re-gional trade agreements, signed at a steady but slow pace through the 1970s and ‘80s, soared at a rate of 15 per year in the 1990s. This range of policy shifts over the past 20 to 30 years has led to a more liberal marketplace for international food trade (although it cannot yet be described as “open” since high levels of protection still exist in various forms).
Evidence shows that food imports have increased with globalization. The global value of food trade grew from US$224 billion in 1972 to US$438 billion in 1998. Food now accounts for 11 per cent of global trade, a proportion higher than that of fuel (Chopra, Galbraith, & Darnton-Hill 2002; Pinstrup-Andersen & Babinard 2001). In developing countries, food im-port bills as a share of gross domestic product (GDP) more than doubled between 1974 and 2004, and the amount of trade made up of processed agricultural products rose much faster than primary agricultural products (FAO 2004, cited in Hawkes 2006).
Many studies identified in the literature review posited that increasing food imports have nutritional implica-tions by altering food availability and/or food prices,
of advertising/marketing agencies is not restricted and, while advertising is regulated to some degree, campaigns are not subject to restrictions like maxi-mum foreign content requirements. This relatively open market has encouraged TFCs to enter Thailand and to use the network of global marketing and com-munications agencies to develop highly sophisticated marketing campaigns using a wide variety of promo-tional techniques.
Evidence from a US-based company, Frito-Lay, shows that advertising does appear to increase sales, in this case, of snacks (Figure 7). When Frito-Lay first con-solidated their presence in the country in 1999/2000, per capita snack consumption was still relatively low (one kg per person per year in 1999 compared with three kg in Mexico and 10kg in the United States). The company developed an aggressive strategy to in-crease consumption, and more than doubled their promotional spending between 1999 and 2003. Fri-to-Lay’s share of the total snack market subsequently grew from the low single digits in the mid 1990s to 30 per cent by 2003. More importantly from a di-etary perspective, the entry of Frito-Lay into the mar-ket also had the affect of stimulating total snack sales. Snacks sales grew particularly rapidly from 1999 to 2004, the period of most intensive marketing, and sales volumes of the most heavily promoted products (chips and extruded snacks) increased by the largest amount (Figure 7). This indicates – though does not prove – that advertising and promotion played an im-portant role in encouraging sales and consumption of snacks.
3.3.3.6 Liberalization of international food trade
Many studies identified the increasing amount of in-ternational food trade – especially imports – as an important process in the nutrition transition. Elimi-nating quotas, lowering tariffs and privatizing state trading agencies has been at the forefront of poli-cies developed to implement globalization.7 Trade liberalization and the domestic reforms required to achieve it were a core focus of “structural adjustment programmes” (SAPs) in many developing countries during the 1970s and ‘80s. This process involved the implementation of market-oriented agriculture and
7 For more details about trade liberalization policies, see the companion KN paper by Blouin et al, 2007.

40 Globalization and Health Knowledge Network
thus shaping food preferences (Chopra 2002; Chopra, Galbraith, & Darnton-Hill 2002). Greater imports may also reflect increased demand for the imported products (Regmi, Ballenger, & Putnam 2004). But what is the evidence on the nutritional impact of these food imports? The evidence presented on whether food imports have actually changed the food supply, rather than just substituting for foods previously produced domestically, is regrettably rather thin. For example, evidence from the Philippines shows that imports (as of 1999) contributed to over 50 per cent of the total supply of milk and milk products, but it is not clear if this represents an addition to the existing milk supply, or a substitution for domestically produced milk (Pe-dro, Barba, & Candelaria 2004). Likewise, evidence
presented from Colombia shows that the proportion of calories from imported foods has risen over time (available energy from several key imported foods was 40 per cent in 2000 and imports of vegetable oils as a percentage of total availability increased from 8.52 per cent to 57.31 per cent between 1990 and 2001), but not whether this has contributed to increased energy availability. Moreover, these studies do not address the issue of the impact on food prices – one of the very aims of higher food imports is to lower food prices (see companion KN paper by Blouin et al. 2007).
More compelling evidence comes from India where market liberalization in the mid-1990s led to a rapid increase in imports of low-priced vegetable
Table 8: Imports and consumption of vegetable oils, China & India, 1989-2002
1989-1991* 2000-2002*INDIAImports of soybeans (Mt) 102 432Imports of soybean oil (Mt) 25,944 1,055,083Calories available from soybean oil/cap/day
11 48
Imports of palm oil (Mt) 353,790 3,317,333Calories available from palm oil/cap/day
7 66
Calories available from peanut, cottonseed and rapeseed oils/cap/day
107 76
Calories available from all vegetable oils/cap/day
158 231
Soybean oil as percentage of calories available from all vegetable oils (%)
7 21
Palm oil as percentage of calories available from all vegetable oils (%)
4 28
CHINAImports of soybeans (Mt) 1,961,944 14,368,805Imports of soybean oil (Mt) 435,735 736,254Calories available from soybean oil/cap/day
27 78
Calories available from all vegetable oils/cap/day
141 213
Soybean oil as percentage of calories available from all vegetable oils (%)
19 37
*The numbers are 3-year averages around 1990 and 2001. Source: Hawkes (2006)

Globalization, Food and Nutrition Transitions 41
oils (Hawkes 2006). As shown on Table 8, evidence shows that this led directly to increased consumption. It also led to a switch in the type of oils consumed, away from the traditional peanut, rapeseed and cot-tonseed oils, and towards the imported palm and soybean oils. Thus trade liberalization led directly to the greater importance of vegetable oils in the Indian diet. This is a good example of the how the nutri-tion transition typically begins with major increases in imports of oilseeds and vegetable oils, as proposed by Drewnowski and Popkin (1997). A similar process occurred in China. During the 1990s, China imple-mented new tax and import regulations to encourage soybean imports. Subsequently, imports of soybeans and soybean oil increased and the amount of calo-ries from vegetable oils available for consumption in China increased relative to what would have been produced domestically (Table 8). Household survey data also suggest that vegetable oil consumption has increased significantly throughout China in the past 15 years. Still, it remains unclear if the increase in vegetable oil imports is driving increased consump-tion, or if it is increased consumer demand that is driving increased imports?
The most significant body of evidence on the role played by trade in the nutrition transition comes from the Pacific Islands. Four different studies pres-ent evidence that imported foods have altered the “traditional” diet, particularly by increasing fat con-sumption (Cassels 2006; Evans et al. 2001; Hughes & Lawrence 2005; Schultz 2004). Many of these changes actually preceeded the modern era of eco-nomic globalization. Before 1945, each Pacific Is-land was essentially food self-sufficient, with nutri-tionally adequate diets comprising locally produced staples, fish and fruits. After 1945, Europeans colo-nized the islands and foods began to be imported. This marked a specific change in the foods available on the islands: people began to consume increasing amounts of imported foods, so changing their source of calories. The increases of imports continue to this day. For example, in Fiji, total energy supply derived from imported foods rose from 43 per cent to 60 per cent between 1985 and 1996 (Schultz 2004). There is evidence that Australia and New Zealand now use the islands to “dump” their high fat meat cuts, known as “mutton flaps” and “turkey tails” on the islands.
Evidence indicates that increasing imports have stimulated a change from “healthy” locally sourced foods (pre-imports) to “unhealthy” fatty foods (post-imports). In Tonga meat imports rose from 3,389 to 5,559 tonnes between 1989 and 1999, mainly of high-fat chicken parts (Evans et al. 2001, Sinclair, Fusimalohi, & Liava’a 2001). Given that the popula-tion of the island increased from 96,000 to 100,000 during the time period (Populstat 2007)., this repre-sents an increase of availability from 0.035 to 0.056 tonnes per capita (35-56 kilograms), an increase of 57 per cent. In seven of the islands between 1963 and 2000, the total fat supply increased by between 5 per cent and 80 per cent, the largest increases in the most economically advanced islands (80 per cent in French Polynesia, 65 per cent in Fiji) (Hughes & Lawrence 2005). This is because imported fats and oils have added to existing sources of fats, such as coconut oil: individual imported foods providing fat include vegetable oils, margarine, butter, meat and chickens, canned meat and canned fish. A survey on the island country of Vanuatu conducted in 1998 showed that the proportion of energy as fat consumed from im-ported foods was 44.8 per cent for urban populations compared with 8.4 per cent for rural and semi-rural populations. People who consumed fats from import-ed foods rather than traditional fats were 2.2 times more likely to be obese and 2.4 times likely to be dia-betic.
A further study provides some limited evidence of the role of food imports in the Federated States of Micronesia (Cassels 2006). There the initial massive dietary changes started in the 1960s and 1970s when the United States began to provide subsidies to the islands. Imported foods became more accessible and available, and a US-subsidised school feeding pro-gram encouraged the consumption of tinned foods and rice. Overweight and obesity rose on the islands during the same time period. A particularly important policy change occurred in 1981 with the sale of local fishing rights to the Japanese. After this, consumption of local tuna declined and consumption of tinned fish increased.
In contrast to the majority of studies, one study characterizes trade liberalization as playing a role in meeting increased demand for specific foods, rather than supply creating demand, as suggested by the
42 Globalization and Health Knowledge Network
afore-described studies (Regmi, Ballenger, & Put-nam 2004). The study examined trends in food consumption patterns in the United States and worldwide, finding that consumption of products associated with a “Mediterranean diet” are increas-ing (i.e. olive oil, pasta and cheese), a process the study attributes to growing incomes, GDP and ur-banization. The study presents evidence that this demand is being met by increased trade in these products, although trade continues to be hampered by high trade barriers and high transportation costs. Another study also shines a more positive light on trade liberalization, noting that the process has fa-cilitated the availability of fruits and vegetables in Tanzania (Kinabo 2004).
3.3.3.7 Liberalization and commercialization of domestic agricultural markets
Only two studies identified the liberalization and commercialization of domestic agriculture as a process of globalization important to the nutrition transition. Yet market-orientated domestic agricultural policies are an essential accompaniment to international trade liberalization. Markets need to be open domestically in order to function internationally (Hawkes 2006). In fact, a major component of “structural adjustment” involved increasing the market-orientation of domes-tic food markets. A “modern” agricultural sector is likewise important. It utilizes intensive and industrial methods to produce food efficiently at a low price, which therefore can compete on the world market and take advantage of cheaper imported agricultural inputs.
Evidence on the role of liberalization and commer-cialization of domestic agricultural markets in the nutrition transition is limited. One study provides evidence from Brazil on how liberalization of poli-cies on vegetable oils was an essential precursor to increased international trade (Hawkes 2006). In the 1990s, in line with the globalization agenda, the Bra-zilian government opened up its soybean market by restructuring farm income taxes, lowering import tariffs on fertilizers, eliminating the soybean export tax and reducing restrictions on foreign investment. Along with the advantage of plentiful and cheap land, the results were a 67 per cent increase in Brazil-ian soybean oil production between 1990 and 2001,
one of the lowest soybean oil prices worldwide, and a more than doubling of exports. These exports be-came the source of the aforementioned increased im-ports to India and China, as well as other countries around the world.
A second example comes from Colombia (Fajardo 2004) (also see Hawkes, 2007). The number of chick-ens in Colombia rose from 21 million to over 110 million between 1980 and 2003. During the same time period, chicken prices declined sharply relative to beef – chicken now selling at half the price of either beef or pork. Liberalization and commercialization of the domestic poultry industry played an essential role in this process. Investment in technology and infra-structure to promote productivity – in new breeds, feeds and (intensive) production facilities – began in the 1980s under policies aimed at modernizing the agricultural sector. Chicken productivity increased significantly. This process was then complemented by trade liberalization in the early 1990s, which relaxed imports on feed ingredients and reduced import du-ties. Imports of corn from the United States for ani-mal feed increased dramatically, from almost zero in the late 1980s/early 1990s, corn imports rose to 1,553 tonnes in 1995/97 and 2,023 tonnes in 2002/04. Al-though the subsequent increase in chicken consump-tion relative to beef has some positive aspects from a dietary perspective (lower fat content), the rise of cheap chicken is associated with greater overall meat consumption in Colombia – and the greater con-sumption of fast food.
3.3.3.8 Technology and transportation
A small number of papers identified technology and transportation as globalization processes important in the nutrition transition (Drewnowski & Popkin 1997; Kennedy G., Nantel, & Shetty 2004; Muller-Wille 2001; Popkin 2006). Technological factors identified as particularly important were transporta-tion networks to transport and trade food, car own-ership encouraging different shopping patterns, access to electricity and electric devices, such as refrigeration used by TNCs and in households, and food processing technologies. Evidence on the importance of technol-ogy comes from the increasing global availability of vegetable oils (Popkin 2006). Prior to 1945, the ma-jority of fats available for human consumption were

Globalization, Food and Nutrition Transitions 43
animal fats, milk, butter, and meat. Subsequently, a technological revolution in the production and pro-cessing of oilseed-based fats occurred, which greatly reduced the cost of baking and frying fats, marga-rine, butter-like spreads, salad oils, and cooking oils in relation to animal-based products. Along with a number of major economic and political initiatives in oilseed production and trade, these technologi-cal developments contributed to an almost fourfold increase in vegetable oil production in the United States between 1945 and 1965 (in contrast to an in-crease in animal fat production increased of 11 per cent), and a tripling in the global availability of the vegetable oils between 1961 and 1990.
3.3.3.9 Cultural influences
A process of globalization of quite a different nature is cultural influence. A number of studies emphasized the importance of cultural change in the nutrition transition through its role in introducing new foods, and shaping the desire for those foods (Chopra 2002; Cwiertka & Walraven 2002b; Lang 1997; Lang 1999; Leatherman & Goodman 2005; McKay 2004; Men-nell 2000; Tullao 2002; Watson 1997). These cultural influences operate as part of the economic processes already described. Notably the growth of TFCs was identified as a key cultural influence. According to Lang (1997, 1999) and Cwiertka and Walraven (2002), TFCs encourage the transfer of tastes, prefer-ences and habits from highly developed to developing countries, especially through advertising and promo-tion, leading to changes in patterns of eating and local traditions.
One of the most important studies on the interac-tion between of TFCs and cultural change is of Mc-Donald’s in East Asia (Watson 1997). The results of the studies found that McDonalds has successfully adapted to – but also nurtured and encouraged – changes in family values in the region during the 1980/90s and, in so doing, encouraged children to adopt fast food as a social norm. For example, in China McDonald’s appeared at a time when family values were changing, with young couples taking far greater control of their own lives, and increasing at-tention paid to the “Little Emperors” – single chil-dren demanding undivided attention from their par-ent. At the same time, there was a trend for all things
“American”. McDonald’s met these new aspirations: an American company where children could go for a treat, and young couples enjoy a meal out in a clean environment with good service. McDonald’s not only responded to cultural change, but also introduced in-novations to deliberately appeal to children, youth and young adults. These promotional efforts took the form of hostesses, to establish “friendships” with children, birthday parties with games, free gifts and party food, the provision of play areas and children’s furniture such as low sinks and chairs, and educa-tional services, such as paper and pens for drawing pictures and essay contests. These activities helped attract and habituate young children to McDonald’s. Thus McDonald’s not only met the demand aris-ing from cultural change, but also created its own form of cultural change. The nutritional implications of these changes are not directly discussed, but the evidence clearly shows that McDonald’s is aiming to embed the experience of their fast food empire into the everyday lives of East Asians – thus encouraging regular dietary intake of fast food.
Another form of global cultural influence identified as important in the nutrition transition was tourism, although just one study was identified that examined this factor (Leatherman & Goodman 2005). The study compares dietary intake between two coastal villages dominated by tourism in the Yucatan region of Mexico, a third village characterized by a strong tourist trade by inland, and a fourth village little af-fected by tourism (although some inhabitants mi-grated to work in tourism). The study found that the populations in the coastal villages (i.e., those most affected by tourism) had greater dietary diversity, but this diversity was characterized by a replacement of the traditional “tortillas” by soft drinks, snack foods and meat, along with greater fruit intake. In terms of nutrients, coastal communities consumed more fats, high quality protein, and micronutrients. In all villages, soft drinks, snacks and sugar account-ed for the third largest proportion of calories con-sumed relative to other food groups; transnational soft drink and snack food brands were widely avail-able in local stores. Overall the evidence from this study is rather limited because of the small sample sizes, but it does show the perhaps obvious outcome that people exposed to more food from TFCs will consume more.

44 Globalization and Health Knowledge Network
3.4 What is known about how globalization affects under-nutrition?
3.4.1 Nature of the literature
The literature review on globalization and under-nutrition focused on nutrition, not food security or poverty. The issue of trade liberalization and food se-curity is covered by a companion GKN paper (Blouin et al. 2007). The literature on the impact of trade lib-eralization on food security was also reviewed in 2001 (Madeley 2001), and was the subject of an extensive overview by FAO in 2003 (FAO 2003).
Unlike the body of evidence on food security and poverty, there are surprisingly few studies that have examined the relationship between globalization and the growth or decline of under-nutrition: there are no cross-country analyses testing whether or not more liberalized economies have less under-nutrition, nor any quantitative surveys or qualitative studies which have actually traced the links between globalization and the decline or persistence of under-nutrition. Even studies on the relationship between particular components of globalization – such as trade liberal-ization, domestic agricultural liberalization and com-mercialization – and nutrition are very few. And while nutritional implications can be drawn from studies on the links between globalization with poverty, health, gender, and, in particular, food security, it cannot be assumed that the associations are direct. For example, while under-nutrition is likely to decline with increas-ing income, it may not, and the relationship will be dependent on the method and scale of measurement. Thus it is not possible to use these published studies to draw direct conclusions about nutritional outcomes. There are, however, a limited number of conceptual (not empirical) studies that (as for the literature on globalization and the nutrition transition) identify the globalization processes considered important from the standpoint of under-nutrition. This literature is char-acterized by distinctly different perspectives: on the one hand, that globalization can help address under-nutrition; and on the other, that globalization has been responsible for the lack of more significant improve-ments of nutritional status.8 These processes are the
same as those identified as important to the nutrition transition, namely, international trade liberalization, domestic agricultural liberalization and commercial-ization, the growth of TFCs, financial flows, including FDI and developments in technology and transport.
The conceptual links between these processes and nu-trition are described below. In the absence of a more comprehensive and necessarily extremely extensive lit-erature review, the evidence on the effects of each of the different processes is not presented (e.g. between income and nutrition; between gender and control of income). Rather the effects of these processes are sum-marized, often in the words of previous reviews.
One aspect of one process of globalization – domes-tic agricultural liberalization and commercialization – has, unusually, been examined directly from a nu-tritional standpoint: the commercialization of agri-culture in the developing world to involve more cash cropping, a process that characterized earlier phases of globalization. This subject is therefore covered a little more extensively. The globalization process most commonly identified as critical to nutrition was trade liberalization.
3.4.2 International trade liberalization and under-nutrition
Five aspects of trade liberalization were identified as important, in theory, to under-nutrition. These theories have been articulated by Pinstrup-Andersen and Babinard (Babinard & Pinstrup-Andersen 2001; Pinstrup-Andersen 1987; Pinstrup-Andersen & Babi-nard 2001) and in the UN Standing Committee on Nutrition Fifth Report on the World Nutrition Situ-ation (UN SCN 2004). The theories are based on the linkages between trade liberalization and food security and poverty as follows:
• Trade liberalization affects the employment and labour markets of population groups at risk of under-nutrition in rural areas. It does this by encouraging exports, which create markets – and thus sources of income for the rural poor. Trade liberalization brings
8 As described in earlier sections, there are also divisions in the literature around globalization and the nutrition transition, with some considering globalization as the driver of change, with others considering that globalisation processes are simply responding to changes in consumer demand. But this difference is not as strongly apparent in the current body of literature relative to the division in the literature on under-nutrition.
Globalization, Food and Nutrition Transitions 45
also employment opportunities for non-farm income, promising new avenues for exports and non-farm work, and thus new income sources.
• Trade liberalization affects the employment and labour markets for women, thus their nutritional status and that of their children
• Trade liberalization fosters economic growth, thus increasing household income, and also increasing government resources available to purchase food imports by increasing foreign exchange through agricultural exports.
• Trade liberalization affects the price of food. International trade is a tool that allows the lowest-cost producers to set world prices, thus leading to cheaper food.
• Trade liberalization affects the distribution of that food. It reduces fluctuations in food supply and price, thus steadying the availabil-ity of food for import. And with more open borders, food markets can be more responsive to consumer demand, and thus supply food to people in need more efficiently.
These aspects of trade liberalization are considered im-portant for nutrition because they have the potential to affect food availability, and the time and resources for maternal and child caring practices, thus affecting the nutritional status of individuals (UN SCN 2004). Yet despite their theoretical basis, these pathways are not necessarily positive and likely to involve both winners and losers (UN SCN 2004). The evidence available to support or dispute these theories is mixed in terms of quality and quantity and, as already stated, overall rath-er thin. Studies have paid some attention to the role of income – a component of many of the above theories – women’s employment, food prices and distribution, and the trade in breastmilk substitutes. On income, a disputed study indicating that trade lib-eralization raises incomes among the poor, also posits that “since there is a large literature linking income of the poor to health status, we can be reasonably con-fident that globalisation has indirect positive effects on nutrition” (p.827) (Dollar 2001). The basis of this statement is evidence that higher incomes are associ-ated with better nutrition, as shown by the example of Vietnam. According to the study, as Vietnam opened up to global market integration, it experienced a large
increase in per capita income and no significant change in inequality. Thus, income of the poor rose dramati-cally, and the level of absolute poverty dropped sharp-ly, from 75 per cent of the population in 1988 to 37 per cent in 1998. The study does not explore the link between income and nutrition, but assumes that these positive trends are an explanatory variable in rates of malnutrition: Between 1992 and 1998 the percent-age share of children stunted through malnutrition in Vietnam declined from 51 per cent to 34 per cent.
The income benefit of trade liberalization is also cited as a potential benefit for women in combination with changing labour markets, since the growth in eco-nomic activity by women arising from trade liberaliza-tion could have nutritional benefits owing to higher incomes. As put by Fontana et al (1998):
“As women’s share of total wage payments rises with trade expansion, child nutritional status and other human resource development indicators may be expected to rise and the livelihood basis of households with women wage workers be more securely founded to survive adverse circumstances. In particular, improvement in women’s demonstrated income-earning capability strengthens the incentive for investment in the human capital of girls, with all the wider benefits that the education of girls brings” (p.49).
The potential positives and negatives of women’s greater integration into the labour market as a result of trade liberalization has been summarized by (Cornia 2001):
“Globalisation may affect child health… through an increase in women’s participation in the labour force. In East and South-East Asia, up to 80 per cent of the workforce in export-processing zones is female. In Bangladesh the number of garment factories increased from 4 in 1978 to 2400 in 1995, when they employed 1.2 million workers, 90 per cent of whom were women below 25 years of age. If freely chosen, greater female participation in market production can generate strong positive effects on family incomes and the bargaining position of women in the family, and, through them, of their children. If, however, growth in economic activity by women is not

46 Globalization and Health Knowledge Network
accompanied by the development of adequate child care institutions there may be an increase in injury and malnutrition among children despite a rise in family incomes” (p.837).
Problems with greater integration into labour markets may arise because of its effect on breastfeeding – a critical component of good child nutrition. As sum-marized by UN SCN (2005):
“The need to return to work is the reason most often given for stopping or not initiating breast-feeding. Apart from the obvious interference with breastfeeding, when working mothers leave infants and young children in the care of other household members, crucial aspects of feeding and care may also be neglected. This is particularly alarming given that infancy is a period when the occurrence of growth falter-ing and the need for care is greatest. Despite international recognition of the right to mater-nity protection, codified in the Convention on Maternity Protection of 1952 and in national maternity protection legislation in 144 coun-tries, provisions for maternal leave are often in-adequate and poorly enforced. The availability of day care can greatly affect women’s formal labour market participation. Urban women in Brazil cited lack of childcare options as a pri-mary cause of unemployment. If trade liberal-ization creates jobs in the formal sector, then women with young infants to care for (a high proportion of working women) may be exclud-ed for lack of child care or forced to accept low-er paid work in the informal sector” (p.52).
Demands on women’s labour have further implica-tions in the case of agriculture. As concluded by a review on the gender issues affected by global trade expansion (Fontana, Joekes, & Masika 1998):
“Increasing demands on women’s labour contribution to export cash crop production (where they generally work as unpaid family labour for male relatives) can lower their nutritional status and of that of their families, where income is appropriated by men and not spent on food, or else drain women’s energies if they keep up production for own consumption.
Women farmers – particularly female heads of households – may find it difficult to become independently involved in the production of newer export crops because of limited access to credit, technology and marketing channels. Many women have found employment in agro-industry but this may not have improved their status as much as in manufacturing, as the work is highly seasonal and dependent on yields” (p.11).
Some studies also explored the evidence on trade lib-eralizations potential benefits of ensuring a more reli-able and cheaper food supply. An oft-cited example of the benefits of a more liberal import regime is that of Bangladesh in the context of a damaging flood of 1998 (del Ninno & Dorosh 2001). (Also see discus-sion by Blouin et al. 2007). The study reported that:
“The 1998 flood in Bangladesh caused a shortfall of 2.2 million tonnes in the rice production and threatened the food security of tens of millions of households. Despite the best efforts of donors and the government, the public distribution of rice and wheat was only 188,000 t more than originally planned for July 1998 to April 1999. However, a major food crisis was averted as private imports, made possible by trade liberalization in the early 1990s, stabilized market prices and supplies. The government’s direct distribution programs, though small compared to private imports, nonetheless increased access to food by poor households. Household survey data indicate that immediate relief efforts were well targeted to flood-affected households, as were transfers from NGOs. Vulnerable Group Feeding, a medium-term program, was not targeted well to households directly exposed to the flood, though the program was relatively well targeted to poor households. More broadly, the Bangladesh experience with the 1998 flood shows that in a liberalised trade regime, where private imports respond to price signals, food aid’s contribution to the total availability of food may be minimal. However, foreign assistance in kind or in cash, can provide resources for subsidised, targeted distribution to food-insecure households – assistance not possible otherwise under tight government budget constraints”(p.337).

Globalization, Food and Nutrition Transitions 47
Through examining the literature as a whole, how-ever, the GKN companion paper on trade liberaliza-tion comes to more cautious conclusions. The paper examines whether removing the barriers to entry of foreign agricultural products can improve food secu-rity in developing countries, for instance by reducing the price of food. It concludes that (Blouin et al. 2007, Bhushan, Murphy, & Warren 2007):
“The review of the literature highlights that international agricultural markets are too volatile to guarantee food security and that import liberalization can only be one minor element in ensuring a reliable and affordable supply of food. Moreover, cheaper food through import liberalization is not a good trade-off for damaging the livelihood of domestic producers who cannot compete with the new imported products, especially in developing countries where the majority of the population’s livelihood is directly linked to agriculture”.
This caution reflects broader concerns about trade liberalization and food security often voiced by civil society, namely that the greater imports and exports will reduce national and household food self-suffi-ciency, and, therefore less national and household food security and, by implication, nutrition (Mad-eley 2000).
3.4.3 Domestic agricultural liberalization and commercialization
As noted, market-oriented domestic agricultural policies are essential accompaniments to interna-tional trade liberalization, Markets need to be open domestically in order to function internationally (section 5.3.7). In order to operate within a com-petitive international environment, a commercial domestic agricultural sector is needed to produce food efficiently and at a low price, and be in a po-sition to take advantage of cheaper imported agri-cultural inputs. An early component of domestic agricultural commercialization was the shift away from subsistence farming to cash cropping. In the 1970s and 1980s developing countries adopted poli-cies to encourage farmers to sell food to domestic and international markets rather than keeping it for home consumption. This led to greater reliance on
the global market and the increasing importance of cash (relative to in-kind income, such as food) in rural economies.
The shift to cash cropping has been evaluated from a nutritional perspective. Studies by the International Food Policy Research Institute in the 1980s examined the nutritional impact of a series of cash cropping schemes in 10 developing countries. The results were mixed. They suggested that cash cropping generally results in higher incomes and spending on food, but has a relatively small impact on energy intake and, in most cases, little or no impact on childhood under-nutrition (von Braun 1995; von Braun & Kennedy 1986; von Braun & Kennedy 1994). Potato produc-tion in Rwanda and a technological change to maize production in Zambia are two schemes that lowered malnutrition among children aged five or under in participating households through higher incomes. But more than half the selected projects had no or even negative impacts on nutrition. Studies in Kenya and the Philippines show that a doubling of income resulted in just a 4-7 per cent increase in energy in-take among preschoolers. In Sierra Leone the chil-dren of commercial farmers were nutritionally worse off than subsistence farmers. These differences were attributed in part to the control of income within the household. Female-controlled incomes were related to higher levels of caloric intakes among children, as women are more likely than men to allocated re-sources to food, thus highlighting the importance of gender in this area.
3.4.4 Growth of transnational food companies
For decades, there has been significant concern in the nutrition community about TFCs involved in the production and marketing of breastmilk substitutes. Of most concern is that globalization will undermine efforts to control the marketing of breastmilk sub-stitutes by TFCs, as codified in the WHO Code on Marketing of Breastmilk Substitutes (“WHO Code”). One oft-cited case study on this issue comes from Guatemala (Wallach & Sforza 1999). In 1983 Gua-temala passed a law designed to encourage mothers to breastfeed. The regulations implemented some of the components of the WHO Code, including a prohibi-tion on the use of visual symbols on labels and packag-ing that idealize the use of bottle-feeding. To comply
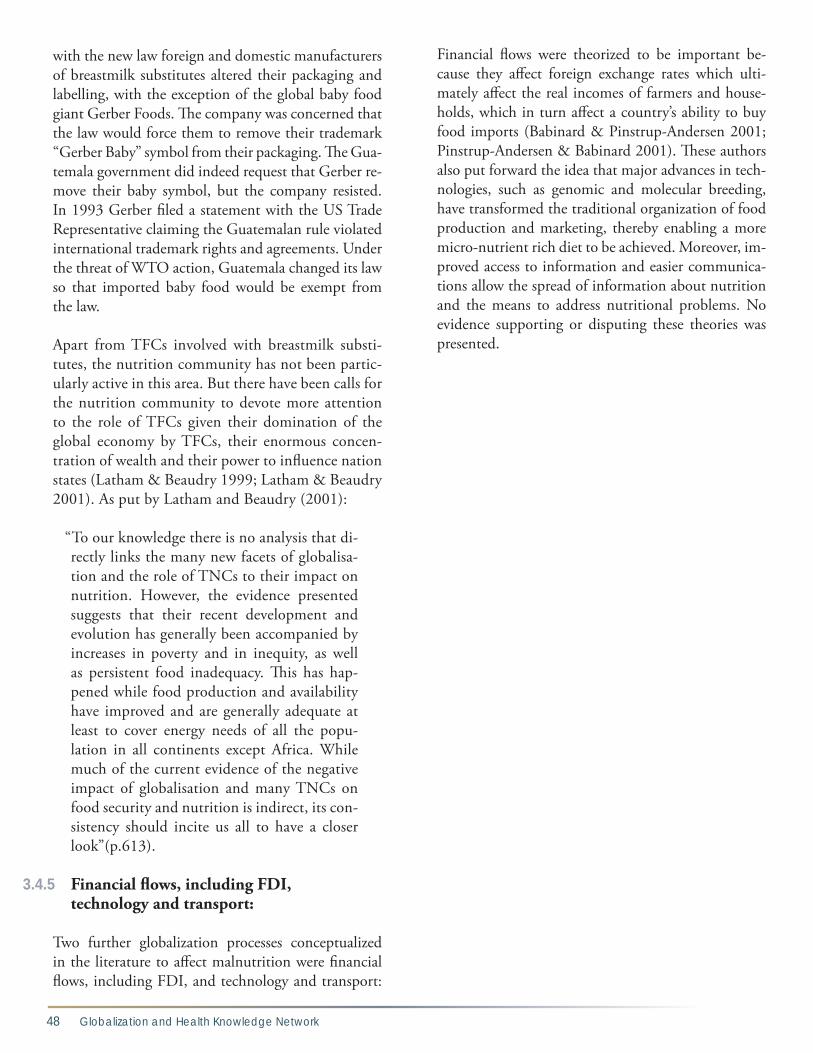
48 Globalization and Health Knowledge Network
with the new law foreign and domestic manufacturers of breastmilk substitutes altered their packaging and labelling, with the exception of the global baby food giant Gerber Foods. The company was concerned that the law would force them to remove their trademark “Gerber Baby” symbol from their packaging. The Gua-temala government did indeed request that Gerber re-move their baby symbol, but the company resisted. In 1993 Gerber filed a statement with the US Trade Representative claiming the Guatemalan rule violated international trademark rights and agreements. Under the threat of WTO action, Guatemala changed its law so that imported baby food would be exempt from the law.
Apart from TFCs involved with breastmilk substi-tutes, the nutrition community has not been partic-ularly active in this area. But there have been calls for the nutrition community to devote more attention to the role of TFCs given their domination of the global economy by TFCs, their enormous concen-tration of wealth and their power to influence nation states (Latham & Beaudry 1999; Latham & Beaudry 2001). As put by Latham and Beaudry (2001):
“To our knowledge there is no analysis that di-rectly links the many new facets of globalisa-tion and the role of TNCs to their impact on nutrition. However, the evidence presented suggests that their recent development and evolution has generally been accompanied by increases in poverty and in inequity, as well as persistent food inadequacy. This has hap-pened while food production and availability have improved and are generally adequate at least to cover energy needs of all the popu-lation in all continents except Africa. While much of the current evidence of the negative impact of globalisation and many TNCs on food security and nutrition is indirect, its con-sistency should incite us all to have a closer look”(p.613).
3.4.5 Financial flows, including FDI, technology and transport:
Two further globalization processes conceptualized in the literature to affect malnutrition were financial flows, including FDI, and technology and transport:
Financial flows were theorized to be important be-cause they affect foreign exchange rates which ulti-mately affect the real incomes of farmers and house-holds, which in turn affect a country’s ability to buy food imports (Babinard & Pinstrup-Andersen 2001; Pinstrup-Andersen & Babinard 2001). These authors also put forward the idea that major advances in tech-nologies, such as genomic and molecular breeding, have transformed the traditional organization of food production and marketing, thereby enabling a more micro-nutrient rich diet to be achieved. Moreover, im-proved access to information and easier communica-tions allow the spread of information about nutrition and the means to address nutritional problems. No evidence supporting or disputing these theories was presented.

Globalization, Food and Nutrition Transitions 49
4.1 Objectives
The aim of the case studies was to build on what has been learned about the links between globalization processes and nutrition, and begin to the fill the key research gap: linking information about changes in food consumption patterns to specific globalization policies and processes.
These case studies thus bring together information on the different pathways between globalization, food and the social determinants of nutrition, as set out in the conceptual framework (Figure 1). They trace se-lected components of the pathways in the framework, rather than the entire linkage direct from globaliza-tion to nutritional outcome. They first describe the globalization processes and the nutritional situation in the selected regions/countries, and then how the two may be linked by changes in the social determinants, such as food supply, employment, income and urban-ization. The case studies do not aim to systematically prove the effects of globalization, but rather to illus-trate its dynamics in different contexts under different conditions.
4.2 Methods
The case studies were structured to highlight differ-ent aspects of the pathways in terms of: 1) different country/regional context, 2) emphasis on a particular globalization policy or process, and 3) emphasis on particular social determinants. First, each case study was set in a different country context.
The basis of choosing the countries was as follows:
• Inclusion of the major developing world regions
• Larger countries in those regions which contrib-ute to a relatively large burden of malnutrition
• Countries with different types of nutritional burden
• Countries from where high quality informa-tion is available and contacts are able to review/provide input into the papers.
Secondly, each case study focuses on a particular policy or process of globalization, e.g. financial liber-alization, trade liberalization. Thirdly, they focus on
Globalization, Foodand Nutrition Transitions
4. Case studies
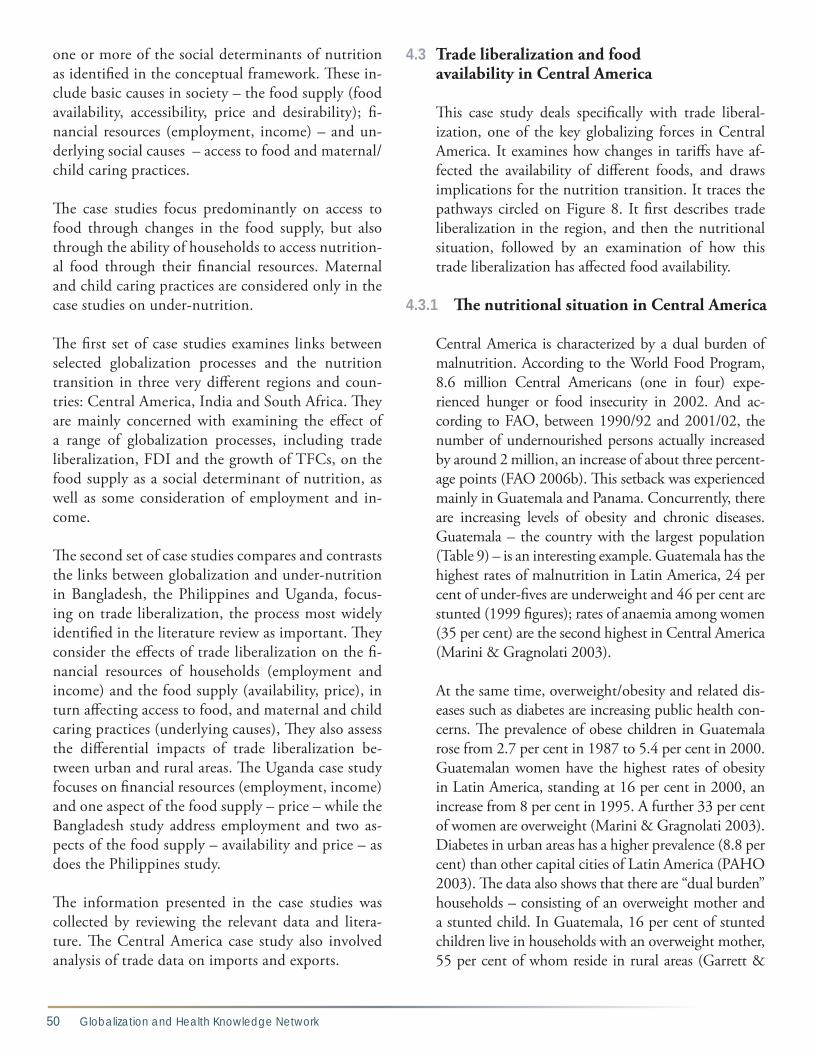
50 Globalization and Health Knowledge Network
one or more of the social determinants of nutrition as identified in the conceptual framework. These in-clude basic causes in society – the food supply (food availability, accessibility, price and desirability); fi-nancial resources (employment, income) – and un-derlying social causes – access to food and maternal/child caring practices.
The case studies focus predominantly on access to food through changes in the food supply, but also through the ability of households to access nutrition-al food through their financial resources. Maternal and child caring practices are considered only in the case studies on under-nutrition.
The first set of case studies examines links between selected globalization processes and the nutrition transition in three very different regions and coun-tries: Central America, India and South Africa. They are mainly concerned with examining the effect of a range of globalization processes, including trade liberalization, FDI and the growth of TFCs, on the food supply as a social determinant of nutrition, as well as some consideration of employment and in-come.
The second set of case studies compares and contrasts the links between globalization and under-nutrition in Bangladesh, the Philippines and Uganda, focus-ing on trade liberalization, the process most widely identified in the literature review as important. They consider the effects of trade liberalization on the fi-nancial resources of households (employment and income) and the food supply (availability, price), in turn affecting access to food, and maternal and child caring practices (underlying causes), They also assess the differential impacts of trade liberalization be-tween urban and rural areas. The Uganda case study focuses on financial resources (employment, income) and one aspect of the food supply – price – while the Bangladesh study address employment and two as-pects of the food supply – availability and price – as does the Philippines study.
The information presented in the case studies was collected by reviewing the relevant data and litera-ture. The Central America case study also involved analysis of trade data on imports and exports.
4.3 Trade liberalization and food availability in Central America
This case study deals specifically with trade liberal-ization, one of the key globalizing forces in Central America. It examines how changes in tariffs have af-fected the availability of different foods, and draws implications for the nutrition transition. It traces the pathways circled on Figure 8. It first describes trade liberalization in the region, and then the nutritional situation, followed by an examination of how this trade liberalization has affected food availability.
4.3.1 The nutritional situation in Central America
Central America is characterized by a dual burden of malnutrition. According to the World Food Program, 8.6 million Central Americans (one in four) expe-rienced hunger or food insecurity in 2002. And ac-cording to FAO, between 1990/92 and 2001/02, the number of undernourished persons actually increased by around 2 million, an increase of about three percent-age points (FAO 2006b). This setback was experienced mainly in Guatemala and Panama. Concurrently, there are increasing levels of obesity and chronic diseases. Guatemala – the country with the largest population (Table 9) – is an interesting example. Guatemala has the highest rates of malnutrition in Latin America, 24 per cent of under-fives are underweight and 46 per cent are stunted (1999 figures); rates of anaemia among women (35 per cent) are the second highest in Central America (Marini & Gragnolati 2003).
At the same time, overweight/obesity and related dis-eases such as diabetes are increasing public health con-cerns. The prevalence of obese children in Guatemala rose from 2.7 per cent in 1987 to 5.4 per cent in 2000. Guatemalan women have the highest rates of obesity in Latin America, standing at 16 per cent in 2000, an increase from 8 per cent in 1995. A further 33 per cent of women are overweight (Marini & Gragnolati 2003). Diabetes in urban areas has a higher prevalence (8.8 per cent) than other capital cities of Latin America (PAHO 2003). The data also shows that there are “dual burden” households – consisting of an overweight mother and a stunted child. In Guatemala, 16 per cent of stunted children live in households with an overweight mother, 55 per cent of whom reside in rural areas (Garrett &

Globalization, Food and Nutrition Transitions 51
Ruel 2005). In Nicaragua, the figure is 6.9 per cent, 45 per cent of whom live in rural areas. Overweight and obesity is a problem among groups of lower SES.
4.3.2 Globalization policies in Central America
Central America is undergoing widespread economic reform and growth. As shown in Table 9, Gross Nation-al Income (GNI) and GDP per capita have increased in all countries over past decades. During this period, the contribution of agriculture as a percentage of GDP has decreased, and the amount of imported goods and ser-vices increased. Income distribution is highly unequal. Between 50 and 60 per cent of income accrues to the richest 20 per cent of the population, while the poorest 20 per cent receive only 2-6 per cent (Table 10).
Trade liberalization has been an important compo-nent of the economic reform in the region, particu-larly since 1990. In 1991 the Central American na-tions agreed in concert to reduce tariffs (Pettrie 1995), and in 1993 unrestricted movement of virtually all commodities was allowed in the region (Gonzalez and Heinen 1997). Over the next 15 years, the countries implemented a range of trade policies for agricultural/food products:
Figure 8: Tracing the pathways between globalization and nutrition in Central America
• El Salvador maintained a primarily protec-tionist policy until 2003 when tariffs were reduced and customs procedures streamlined (Herrera, Iglesias, & Huete 2003)
• Honduras progressively reduced tariffs from 1997 to 2001 (Gonzalez & Heinen 1997; Gonzalez & Heinen 1999).
• Guatemala actively pursued a trade liberaliza-tion policy from 1996 (Aguilar, Gonzalez, & Heinen 1997; Orellana, Vasquez, & Huete 2004) and by 2001 the use of non-tariff bar-riers was limited (WTO Trade Policy Review Body 2001)
• Costa Rica removed most non-tariff barriers in conjunction with GATT implementation in 1994 (Gonzalez, Quiros, & Bleggi 1995), but trade policies fluctuated (e.g. in 1996 additional taxes on imports were imposed) (Quiros & Bleggi 1996).
• Nicaragua reduced tariffs, eliminated non-tariff trade barriers and relaxed foreign exchange controls from 1990 (Castellon, Ramirez, & Bertsch 1996) and further reduced and limited tariffs in 2001 (Leiva & Hrapsky 2004).
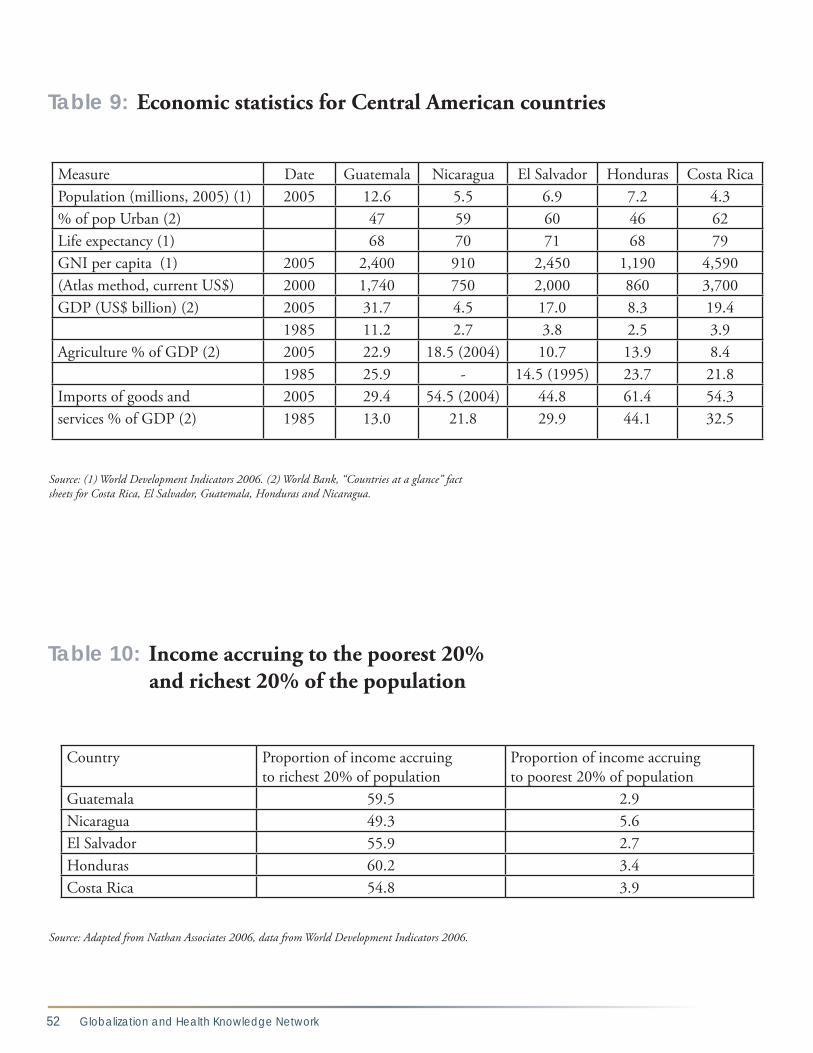
52 Globalization and Health Knowledge Network
Measure Date Guatemala Nicaragua El Salvador Honduras Costa RicaPopulation (millions, 2005) (1) 2005 12.6 5.5 6.9 7.2 4.3% of pop Urban (2) 47 59 60 46 62Life expectancy (1) 68 70 71 68 79GNI per capita (1) 2005 2,400 910 2,450 1,190 4,590(Atlas method, current US$) 2000 1,740 750 2,000 860 3,700GDP (US$ billion) (2) 2005 31.7 4.5 17.0 8.3 19.4
1985 11.2 2.7 3.8 2.5 3.9Agriculture % of GDP (2) 2005 22.9 18.5 (2004) 10.7 13.9 8.4
1985 25.9 - 14.5 (1995) 23.7 21.8Imports of goods and 2005 29.4 54.5 (2004) 44.8 61.4 54.3services % of GDP (2) 1985 13.0 21.8 29.9 44.1 32.5
Source: (1) World Development Indicators 2006. (2) World Bank, “Countries at a glance” fact sheets for Costa Rica, El Salvador, Guatemala, Honduras and Nicaragua.
Country Proportion of income accruing to richest 20% of population
Proportion of income accruing to poorest 20% of population
Guatemala 59.5 2.9Nicaragua 49.3 5.6El Salvador 55.9 2.7Honduras 60.2 3.4Costa Rica 54.8 3.9
Source: Adapted from Nathan Associates 2006, data from World Development Indicators 2006.
Table 9: Economic statistics for Central American countries
Table 10: Income accruing to the poorest 20% and richest 20% of the population

Globalization, Food and Nutrition Transitions 53
In addition, a number of bilateral free trade agree-ments (FTAs) were signed in the 1990s and 2000s be-tween different countries, including the Canada-Costa Rica FTA (2002) and the Chile-Central America FTA (2002). Most recently, in 2005 the Central America countries plus the Dominican Republic signed the Central America Free Trade Agreement with the
United States (CAFTA) which was implemented in 2006/2007. CAFTA reduces tariffs and quotas, and requires changes to a range of administrative, regula-tory and legal measures relating to trade. These stipu-lations include customs procedures, investment guar-antees, improved competition policy and government transparency, protection of intellectual property rights
Figure 9: Poultry meat availability, import and production in Guatemala
Source: FAO Food Balance Sheets, FAO trade data, FAO production data.
Figure 10: Imports of processed meats (‘bovine meat, other prep’, ‘pig meat, sausages’, ‘poultry meat, other prep’) into Central American countries
Source: FAO detailed trade data
Metric Tonnes

54 Globalization and Health Knowledge Network
and enforcement of labour laws (ECLAC 2006). The changes represent greater openness in the trade and investment climate in the region. In addition, CAF-TA also opens up opportunities for advertising and for the import of food processing, storage and pack-aging equipment (USTR 2004).
As a result, CAFTA has the potential to increase over-all imports into these countries. The United States is a major trading partner and Central American coun-tries are seen as having huge potential for growth in sales of imported foods (Herrera, Orellana, & Suazo 2001; International Trade Services Corpora-tion 2004). In particular the market for value-added products is expected to increase as Central Ameri-can consumers become “increasingly sophisticated” (USDA FAS 2004). A recent assessment by the Gro-cery Manufacturers Association (USA) highlighted a range of opportunities for exports to Central Amer-ica with the implementation of CAFTA, including ice cream, processed cheese, sausages, deli meats, breakfast cereals, cookies and sweet biscuits (Inter-national Trade Services Corporation 2004). It is also likely that CAFTA implementation will increase FDI in the food sector.
4.3.3 Links between trade liberalization and food availability
How have these changes in trade policy affected the social determinants of nutrition in the region? One of these, the food supply measured as food availabil-ity, is considered here. Food imports into Central America increased during the period of liberalization. Between 1990 and 2004, imported food trebled in Guatemala, El Salvador and Costa Rica, quadrupled for Honduras, and nearly doubled for Nicaragua.
An examination of specific foods shows the associa-tion between changing trade policies and food im-ports. Chicken is a case in point. Guatemala has a liberal trade policy regarding chicken: the tariff is low and the Tariff Rate Quota on chicken imports into Guatemala was suspended in 2001 (Tay & Huete 2006). In contrast, El Salvador and Honduras have maintained non-tariff barriers and Costa Rica and Nicaragua high tariffs. For these countries, chicken availability mirrors domestic production. Yet in Gua-temala availability has risen as a result of increased
imports – notably since 2001 (Figure 9). The main source of imports is the United States, which exports chicken leg quarters with little or no market in the US, and are essentially a by-product of the produc-tion of the white chicken meat preferred by US con-sumers (Dyck & Nelson 2003). While whole fresh or chilled chicken is traditionally favoured by Gua-temalan consumers, chicken leg quarters are popu-lar due to their lower price (Tay & Huete 2006). It is not clear whether chicken imports have displaced domestic production, but the higher rate of increase of availability post-2001 suggests that imports have led directly to the increased availability of chicken. A similar story emerges for processed meats. Imports of processed meat have increased quite dramatically into all countries since the mid-1990s, but were sig-nificantly higher in Guatemala and lower in Costa Rica (Figure 10). As of 2005 Guatemalan tariffs on these products were only 15 per cent, while Costa Rica had the highest tariffs on processed meats of any Central American country (up to 151 per cent for some products). For the other countries, tariffs ranged from 15 to 40 per cent.
Imports of various processed foods have also increased as tariffs have declined. Imports of french fries from the United States increased from almost zero in the early 1990s to over 14,000 metric tonnes per year in 2005 (USDA FAS data, 2006). Although no data on total availability of frozen potatoes was identified, the availability of all potatoes has increased, suggesting that frozen imports have played a role in stimulating availability. The increase has occurred in line with the expansion of fast food restaurants in the region. Imports of pastries, cakes and biscuits increased by a factor of 20 between 1990 and 2004, from around 4,500 metric tonnes per year to 90,000 metric tonnes per year (FAOSTAT detailed trade data, 2006). Most of these imports came from other Central American countries, especially Guatemala, which has the most well developed food processing sector in the region.
Fruit imports present another example. Availability of imported apples and grapes increased dramatically throughout Central America in the 1990s, in line with imports in general (Figure 11). These fruits are perceived as “luxury” items in these countries and are marketed to middle and high income families (Hrapsky 2004). The
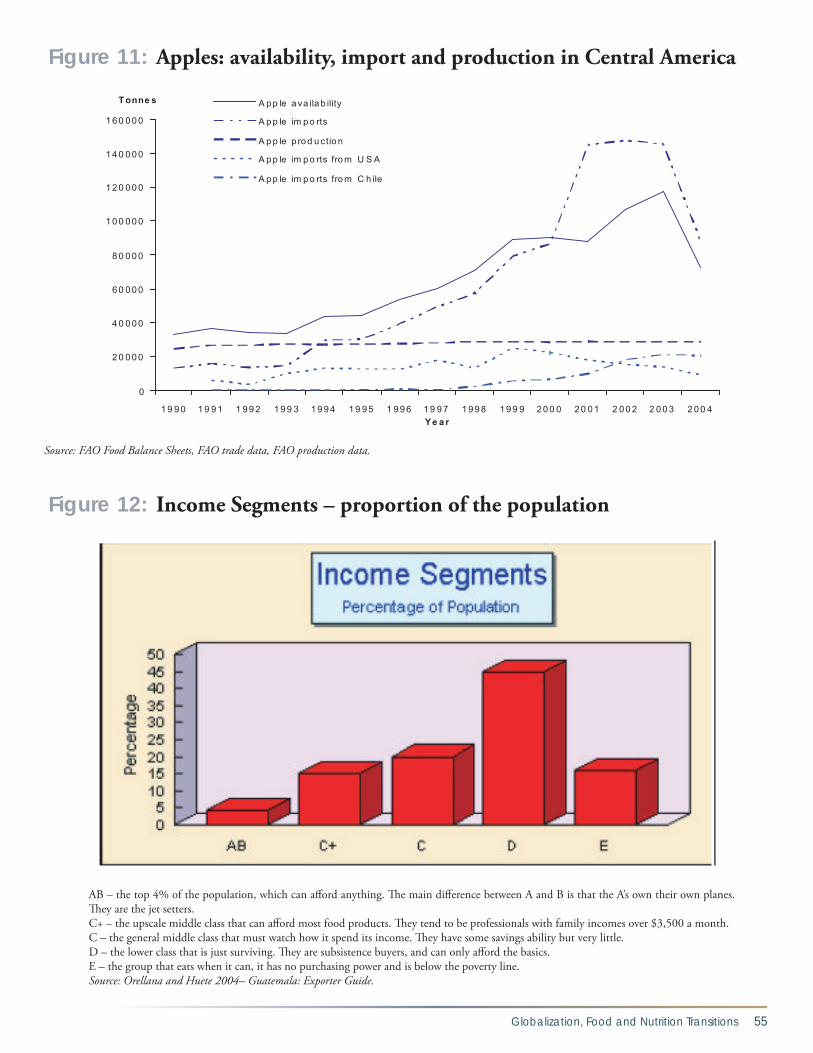
Globalization, Food and Nutrition Transitions 55
Figure 11: Apples: availability, import and production in Central America
Source: FAO Food Balance Sheets, FAO trade data, FAO production data.
Figure 12: Income Segments – proportion of the population
AB – the top 4% of the population, which can afford anything. The main difference between A and B is that the A’s own their own planes. They are the jet setters.C+ – the upscale middle class that can afford most food products. They tend to be professionals with family incomes over $3,500 a month.C – the general middle class that must watch how it spend its income. They have some savings ability but very little.D – the lower class that is just surviving. They are subsistence buyers, and can only afford the basics.E – the group that eats when it can, it has no purchasing power and is below the poverty line.Source: Orellana and Huete 2004– Guatemala: Exporter Guide.

56 Globalization and Health Knowledge Network
case shows the influence of FTAs: just after the sign-ing of the Chile-Central America FTA and its imple-mentation in 2002 (23), imports from the United States to most Central America countries levelled off or declined while imports from Chile increased (Fig-ure 11).
4.3.4 Implications for the nutrition transition
This case study shows that measures implemented to liberalize trade have stimulated food imports into Cen-tral America. What implications does this have for the nutrition transition in the region? It is difficult to gen-eralize, since: (i) some of the imported products are “healthy” such as fruit, while others are clearly energy-dense but nutrient poor (e.g. french fries, cakes); and (ii) some products may displace locally produced prod-ucts, thus affecting the nutritional status of domestic producers through affecting their incomes and employ-ment. What is clear is that exporters from the United States are targeting different foods to different groups. High-value products such as grapes are being marketed to upper income groups; the opposite applies to chick-en leg quarters. Figure 12 shows the advice provided by the US-government to US exporters to Guatemala. The advice delineates the purchasing power of the different segments of the population, suggesting that the import-ers target different foods to different groups.
US-exports are targeted largely to three different mar-kets: the AB population of high income (e.g. high qual-ity imports), the C+ population of the upper middle in-come (e.g. convenience products, as more women enter the workforce), and the C population of lower middle income, who purchase snacks and other convenience products, but have to watch their spending (e.g. Gomez & Huete 2003, Orellana & Huete 2004). In other words, the aim of the increased exports is not to feed the poor with no purchasing power, but to habituate groups with purchasing power to imported products, so that they become “necessities” in the diet, much as soft drinks have become in the United States. In the mean-time, as the AB and C+ groups become more aware of the need to consume a healthy diet, exporters will tar-get them with healthy, niche market foods sold at high prices. To improve the evidence base, further analysis is needed to examine how the prices and actual supply of exported products have changed, and how different groups of consumers are responding.
4.4 Liberalization of trade and FDI and food availability, price and access in India
This case study deals specifically with the two major globalizing forces on the supply side (country/regional context): the liberalization of trade and FDI (global-ization processes), plus urbanization which is one force intertwined with globalization on the demand side. It examines the effect of these processes on the availabil-ity and price of specific foods – vegetable oils, pulses and processed foods, and how changes in consump-tion are associated with urbanization (basic cause) and income (social determinant). It traces the pathways circled on Figure 13.
4.4.1 The nutritional situation in India
Like Central America, India faces a double burden of nutrition and disease. The country is home to 214 mil-lion food insecure people and a third of all undernour-ished children in the developing world (FAO 2003). Although the number of undernourished children is not increasing, it has only declined modestly in recent years. In all age groups, over 30 per cent of women are underweight, with particularly high rates among groups with low education and living in rural areas (Table 11). Micronutrient deficiencies are also high. Although anaemia rates as a whole dropped from 74 per cent in 1992-93 to 52 per cent in 1998-99, rates remain high, particularly among women of lower SES (Table 11). Vitamin A and riboflavin status is also in-adequate in most districts.
At the same time, in urban areas overweight/obesity is rising. As shown in Figure 2 and Table 11, there are more overweight women in urban India than under-weight women. In New Delhi, the nation’s capital, one-fifth of all children are estimated to overweight or obese (Sengupta 2006). But unlike Central Amer-ica, over-nutrition has not yet become a major issue among groups of lower SES. Higher levels of over-weight or obesity exist among older urban females with higher levels of education and standard of living compared to their more socially disadvantaged coun-terparts. Alongside the overweight/obesity among the more affluent urbanites, though, slum children have high levels of protein energy malnutrition, vita-min A deficiency, iron deficiency anaemia and iodine deficiency disorders than the rural average. The poor

Globalization, Food and Nutrition Transitions 57
% Underweight % Overweight % Obese % AnaemiaAge (years)
15–19 38.8 1.7 0.1 56 20–24 41.8 3.6 0.4 53.8 25–29 39.1 7.3 1.2 51.4 30–34 35 11.7 2.4 50.5 35–49 31.1 16.8 3.9 50.5Marital status
Currently married 35.6 10.6 2.2 51.5 Not currently married 39.3 10.3 2.1 55.5Residence
Urban 22.6 23.5 5.8 45.7Rural 40.6 5.9 0.9 53.9Education
Illiterate 42.6 5.1 0.9 55.8Literate, < middle school complete 32.6 12.9 2.7 50.1Middle school complete 28 15.7 3.2 48High school complete and above 17.8 26 6.4 40.3Religion
Hindu 36.9 9.6 2 52.4Muslim 34.1 12.4 2.8 49.6 Christian 24.6 17.6 3.4 47.1Sikh 16.4 30.1 8 39.6Jain 15.8 33.7 9.8 42.5Buddhist/Neo-Buddhist 33.3 10.5 2.8 48.6 Other 49.4 7.0 0.4 75.7No religion 34.5 13.8 3.4 59.5Caste/tribe
Scheduled caste 42.1 5.8 0.9 56Scheduled tribe 46.3 3.3 0.5 64.9 Other backward class 35.8 9.4 1.7 50.7 Other 30.5 15.4 3.7 47.6Work status
Working in family farm/business 41.9 5.2 0.8 53.1Employed by someone else 44.3 6.4 1.2 54.9Self-employed 35 12.1 2.5 52.2
Not worked in past 12 months 31.6 13.1 2.9 50.4Standard of living index
Low 48.1 2.6 0.3 60.2 Medium 35.6 8.6 1.5 50.3 High 17.3 27.2 6.8 41.9Total 35.8 10.6 2.2 51.8
*Underweight = BMI < 18.5 kg/m2, overweight = BMI of 25.0 kg/m2 or more, Obese = BMI of 30 kg/m2 or more
Table 11: Weight for height of Indian women aged 15-49, NFHS 1998-1999

58 Globalization and Health Knowledge Network
quality of available food, recurrent diarrhea due to poor environment and housing conditions, absence of responsible adult caregiver due to employment pres-sures and the lack of adequate services, each serve to increase a child’s risk of poor nutritional status (Ghosh & Shah 2004).
India also faces a dual burden of disease. Although successful eradication and control of major com-municable diseases has led to significant improve-ments in India’s population health (Cassen & Visaria 1999), current disability adjusted life years (DALYs) lost due to communicable disease account for around 50 per cent of the total disease burden. And the bur-den of chronic diseases and injuries has grown to ac-count for 33 per cent and 17 per cent respectively of the disease burden (WHO 2002). If the transition continues as expected, by the year 2020 the balance of disease burden will shift to 25 per cent from com-municable disease and over 57 per cent due to non-communicable disease (Gupte, Ramachandran & RK 2001). Current coronary heart disease rates are among the highest in the world, particularly in urban
areas, and adult-onset diabetes is now more than four times the prevalence of two decades ago. Diet plays a substantial role in the country’s burden of lung, esophagus, stomach, cervix, breast, and ovary cancer (Sinha, Anderson, McDonald & Greenwald 2003).
These demographic and epidemiological changes have taken place unevenly across the country and among different social groups within states. The continuing burden of infectious diseases, often due to childhood under-nutrition, is worse in the four northern states (Bihar, Madhya Pradesh, Rajasthan and Uttar Pradesh) and Orissa in the east. The south-ern and western states in the country are faced with an increasing prevalence of chronic diseases (Hus-sain, Cassen & Dyson 2006).
4.4.2 Globalization policies in India
Since 1997 the Indian economy has grown on average by 5.4 per cent each year, resulting in a burgeoning urban middle class that is roughly the same size as the whole of the United States. (India’s entire population
Figure 13: Tracing the pathways between globalization and nutrition in the India case study

Globalization, Food and Nutrition Transitions 59
is over one billion.) Depending on the source, India is now somewhere between the fourth and seventh largest economy in the world, with a GDP per capita (PPP) of $2,600 in 2002. (Reil-Muller & Patel 2004). Incomes generally have been rising since the 1980s and real per capita expenditure has increased. Howev-er, juxtaposing the national wealth is the persistently high rates of poverty which, while declining, remain a very serious problem in rural and urban slum areas. It is estimated that 35-40 per cent of the population live below the poverty line, and 53 per cent live on less than $1 per day (Gupte, Ramachandran and RK 2001).
India’s emergence as one of today’s most rapidly grow-ing economic forces can be attributed partly to global-ization. In the late 1980s the government shifted away from its historical commitment to non-alignment and self-reliance, to economic reform characterized by lib-eralization of international trade, direct foreign invest-ment, the financial sector, and restrictions on large en-terprises. The process was embodied in the economic policy reform process of 1991. There were two particu-larly major policy shifts: • Liberalization of domestic and international agri-
cultural markets: Before globalization around 65 per cent of domestic agricultural products were protected with import barriers (Sharma 2005). In 1991 India began the process of liberal-izing domestic and international agricultural markets. The process intensified in 1994 when India signed onto the 1994 Agreement on Agriculture of the GATT. Trade barriers were further decreased during the mid-late 1990s. By 1998 trade barriers had been removed on all over two-thirds of goods, and the maximum tariff imposed was 45 per cent (Panagariya 1999). By 2001 all barriers to agricultural imports were lifted and tariffs further reduced. The intention was to turn international trade in favour of Indian agriculture. This would be done through a devaluation of the currency and increase in agriculture output prices, thereby helping to guarantee a secure livelihood for over 600 million farmers and ensuring national food
security (Sharma 2005). Between the late 1990s and mid-2000s specific bilateral and regional agreements were also revised or signed, includ-ing the Asia Pacific Trade Agreement (2005, revised from 1975), the Agreement on South Asia Free Trade Area (SAFTA) and the India-Sri Lanka Free Trade Agreement (1998).
• Liberalization of foreign direct investment and the rise of TFCs: India’s Industrial Policy of 1991 led to some liberalization of India’s foreign-investment regime. Of note was the lifting of restrictions on the use of foreign brand names in the domestic market, removal of restrictions on entry and expansion of FDI into consumer goods (Chalapati-Rao & Murthy 2006). However, the FDI regime still remains quite restrictive in some areas, notably in retail.
4.4.3 Urbanization in India
Closely linked to population growth and economic development is the process of urbanization, either through expansion of existing urban settlements with rural-urban migration, or urbanization of rural lo-calities. It is estimated that by 2026, 36 per cent of India’s population will be living in urban areas9, and that Greater Mumbai and Delhi could each contain almost 30 million persons (Hussain, Cassen & Dyson 2006).
The rate of urbanization increased steadily but mod-estly, from 17.3 per cent in the 1950s to 28.3 per cent in 1997, but with a decline in the rate of growth observed throughout the 1980s. Not all areas of In-dia have undergone the same degree of urbanization. Mookherjee (2003) demonstrates that between 1951 and 1961, the large cities were growing at a higher rate than intermediate and smaller cities, although the gap decreased in the next decade. Between 1981 and 1991 it was the intermediate cities that increased most in size. It has been suggested that this was due to satura-tion in the largest cities, development of infrastruc-ture in smaller centres coupled with the emergence of efficient transport systems, and reduction in rural-urban migration due to successful rural development programs.
9 Definition of urban according to 1991 Indian Census: First, all places with some sort of local governmental organisation, a municipality, corporation, cantonment board or notified town committee. Second, all other places with a minimum population size of 5,000, a concentration of at least 75% of the male workforce in non-agricultural occupation and a minimum density of 400 persons per square mile.

60 Globalization and Health Knowledge Network
The degree and nature of urbanization has promoted, and been supported by, economic reforms and techno-logical developments. Urban areas tend to have a greater concentration of energy efficient industrial and service sectors. This is because labour, infrastructure and ma-terials are more readily available and because of larger numbers of consumers and other factors. Mumbai alone generates one-sixth of India’s GDP (Jack 2006).
4.4.4 The links between agricultural trade liberalization, FDI and consumption of
vegetable oils, pulses, and processed foods
How have these changes in trade policy affected the social determinants of nutrition in India? This case study examines the impact on the food supply (food availability, prices) and, to a limited extent, the finan-cial resources available to households (income).
As for Central America, changes on agricultural trade policy are associated with increasing food imports. In the more liberalized environment of the mid-late 1990s, agricultural trade was strongly influenced by the fall of international food prices in 1996/97, along-side changes in the foreign exchange rate. This led both to a decline of agricultural exports from India and also an increase of imports. The policy response was to further decrease import barriers. As a result, as shown by Figure 14, food-related imports to India
escalated, much of this accounted for by vegetable oils, fruits and vegetables and pulses. In 1998, India be-came the world’s largest importer of edible oil (Dohl-man, Persaud, & Landes 2003), and between 1995 and 2001 the country was the world’s largest importer of pulses (Price, Landes, & Govidan 2003).
During the same time period there were clear changes in the consumption of edible vegetable oils, pulses and fruits and vegetables. As shown in Table 12, during the 1990s calories available per capita per day from vegetable oils increased by 50 per cent, from fruits 50 per cent, vegetables 29 per cent, but pulses declined by -18 per cent. Household level data also suggests a strong increase of edible oil, vegetable and fruit con-sumption, and a decline or stabilizing of the consump-tion of pulses (Table 13). Overall during the 1990s, the amount of dietary energy available for consump-tion increased and the nutritional content of the foods available for consumption shifted towards higher fat and lower carbohydrate.
There are marked differences between urban and ru-ral areas. Data from the National Family Health Sur-vey (NFHS) 1998-1999 of over 90,000 ever-married women age 15-49 years from 26 states in India (IIPS 2000) show that women are more likely to consume pulses and vegetables if they live in an urban area, have a higher level of education and a higher standard of
Figure 14: Imports of major agricultural commodities, India, 1980-2004
Source: FAO STAT archived trade data

Globalization, Food and Nutrition Transitions 61
10 Fruits and vegetables are also an interesting case, but not examined in further detail here.
living index (Table 14). No data was available on veg-etable oil consumption, but it is likely to follow the pattern of other foods groups: greater consumption in urban areas, among those with greater education, and with a higher standard of living. The increase in vegetable oil consumption reflected increased imports, but the decrease in pulse consump-tion did not.10 This is likely a reflection of differences
in demand, but also of the impact of food imports on relative prices, and the domestic agricultural policy environment.
The wholesale price of vegetable oils fell by -1.0 per cent per year between 1980 and 2000, while prices for pulses rose by 2.1 per cent per year (Price, Landes & Govidan 2003). The Indian government has ac-tually permitted unrestricted imports of pulses with
1979-81
(cal/cap/day)1989-91
(cal/cap/day)1999-01
(cal/cap/day)% Change during 80s
% Change during 90s
Grand Total 2083 2365 2492 14 5Total animal product 120 163 196 36 20
Animal fats 23 28 47 22 68 Aquatic products, other 0 0 0 Eggs 3 5 6 67 20 Fish, seafood 5 7 8 40 14 Meat 16 20 22 25 10 Milk, excluding butter 71 102 111 44 9 Offals, edible 2 2 2 0 0Total vegetable/cereal product 1963 2202 2296 12 4 Alcoholic beverages 5 8 11 60 38 Cereals 1368 1508 1470 10 -3 Fruits- Excluding Wine 31 34 51 10 50 Oil crops 25 37 43 48 16 Pulses 120 133 109 11 -18 Rice (milled equivalent) 670 779 751 16 -4 Spices 11 14 17 27 21 Starchy roots 41 40 49 -2 23 Stimulants 1 1 1 0 0 Sugar & sweeteners 193 221 247 15 12 Sugar crops 8 9 11 13 22 Tree nuts 3 4 5 33 25 Vegetable oils 127 158 239 24 51 Vegetables 32 35 45 9 29 Wheat 390 461 493 18 7
Adapted from (Pingali and Khwaja 2004)
Table 12: Indian national food availability, 1979-2001

62 Globalization and Health Knowledge Network
Item 1977 1987 1993 1999RURALRice 86.5 88.1 85.4 81.0Wheat 49.4 61.6 53.5 53.9Coarse cereals 56.7 29.8 24.1 17.7Total cereals 192.6 179.5 163.0 152.6Pulses 8.7 11.5 9.2 10.1Milk & milk products 24.6 58.0 51.4 50.5Edible oils 2.7 4.3 4.6 6.0Vegetables 24.7 50.8 53.2 66.0Fruits 2.6 10.3 9.8 17.0Meat, eggs, fish 2.7 3.3 4.1 5.0Sugar and gur 13.5 11.0 9.2 10.1URBANRice 67.6 68.1 64.2 62.5Wheat 64.6 60.4 57.4 55.4Coarse cereals 14.8 10.6 7.7 7.1Total cereals 147.0 139.1 129.3 125.0Pulses 11.7 12.2 10.5 12.0Milk & milk products 39.7 64.9 68.3 72.4Edible oils 4.8 6.8 6.3 8.6Vegetables 39.7 66.4 63.1 70.0Fruits 5.9 18.8 20.1 19.0Meat, eggs, fish 4.8 4.9 6.3 6.8Sugar and gur 17.1 12.3 11.8 12.0
Source Kumar, cited in (Joshi et al. 2003)
Table 13: Per capita consumption of food items - India (kgs/person/annum)
low duties for about 10 years as a means of facilitating steady supplies for the poor. But imported pulses are not significantly cheaper, and have remained a small component of supply and consumption relative to do-mestic production. Imports comprise around 13.2 per cent of total supply, according to FAOSTAT Food Bal-ance Sheets, which is not enough to pose a real threat to domestic producers (Price, Landes & Govidan 2003). The higher price of pulses is also related to domestic agricultural policies. Unlike wheat and rice, pulses were never targeted by breeding programs for high yield, and the minimum support prices for pulses are in general rarely below market prices, so government assistance is seldom triggered. Thus farmers have few incentives to produce pulses relative to other crops with higher
yield and lower minimum support prices, which leads to lower availability and higher prices. In contrast, even though trade barriers to vegetable oils are higher than to pulses, imports of vegetable oils comprise a signifi-cant component of supply and consumption (49.6 per cent in 2003, according to FAOSTAT Food Balance Sheets). This is enough to negatively affect the liveli-hoods of domestic producers of oilseeds (Dohlman, Persaud & Landes 2003). And importantly the prices of these vegetable oils are much lower than those pro-duced domestically.
A second globalization process of importance in India is the increase in FDI into TFCs. Since the policy change to encourage FDI in 1991, there has been a

Globalization, Food and Nutrition Transitions 63
major increase in overall FDI, from $0.15 billion in 1990-91 to $2.7 billion in 1996-97, although it re-mains relatively modest at only 5.9 per cent of GDP in 2004 (Chalapati-Rao & Murthy 2006). Between 1991 and 1998 food and agriculture products occu-pied seventh position across sectors of all approved FDI (6.3 per cent). Although relatively modest, FDI was dominated by TFCs like Coca-Cola, Pepsi, Kel-logg, Heinz and Seagram, often coming into the coun-try through takeovers of Indian companies (Chalapa-ti-Rao KS, Murthy MR & Ranganathan KVK 1999). Monopolies have started to emerge in consumer goods such as ice cream, soft drinks, soups and biscuits, with more than two thirds of electronic and print media advertising space being purchased by the TFCs deal-ing in these products. In addition, many unbranded producers of ready-made, highly processed foods have flooded the Indian market, aimed at higher income groups mainly in urban areas.
Soft drinks manufacturers are the largest group in the TFC food processing industry and the largest foreign investors (Vepa 2004). In 2001-2002, 6.6 billion bottles of soft drinks were produced for the domes-tic market. The leading TFC, Coca-Cola, has made
significant efforts to increase consumption through increasing availability. As the CEO of Coca-Cola In-dia put it in 2002: “Availability at home and in retail outlets is the key thing. You make sure that you make your drink available to more people…Availability will drive consumption” (Hawkes 2002). The company opened 50,000 new outlets in the early 2000s, which contributed to a 34 per cent sales growth in 2002. To encourage increased consumption in rural areas, the company invested Rs196 crore (about US$40 mil-lion) in a small 200ml glass bottle with a Rs5-7 price tag, significantly lower than the Rs10 for the tradi-tional 300ml bottle, which led to greater acceptance of Coca-Cola in the rural market. There has also been considerable entry to the market by fast food TFCs. As shown on Table 5, the number of transactions at chained burger and chicken outlets increased from 22 to 72 in just four years between 1995 and 1999.
Dietary data indicates that consumption of these products has increased, particularly in urban areas. Ac-cording to the National Sample Survey Organization, consumption of sweet biscuits increased from 0.07 kg/month per capita in 1987/88 to 2.06 kg/month/cap-ita in 1999/2000, while salted refreshments increased
Milk or curd Pulses Green leafy veg Other veg Fruits Eggs Chicken, Meat, FishAge 15-24 53.3 88.1 85.5 92.7 30.8 28.2 31.3 25-34 55.4 87.7 85.5 93.2 34 28.6 32.5 35-49 55.8 87.6 84.8 93.3 33.7 26.7 31.8Residence Urban 65.3 92.8 88.4 95 53.9 39.7 41.7 Rural 51.3 86 84.1 92.4 25.6 23.6 28.5Education Illiterate 46.5 85 83.8 91.6 20.8 22.5 25.9 Literate, < middle school complete 57.3 90.1 85.6 94.5 37.6 34.4 41.2 Middle school complete 65.4 91.8 87.8 95.3 47.5 35.9 41.5 High school complete and above 80.2 93.8 89.3 96.3 68.4 36.1 38.5Standard of living index Low 35 81.4 82.1 91.6 17 23.8 29.1 Medium 58.1 89.4 85.3 93.1 31.5 28.6 33.1 High 80 94.3 90 95.7 62 32.3 33.6
Table 14: Ever-married women consuming foods at least once a week (%), India 1998-1999

64 Globalization and Health Knowledge Network
from 0.04 to 1.36 and prepared sweets from 0.11 to 0.40 (Vepa 2004). Consumption is strongly concen-trated in upper income groups. In urban areas the top twelfth wealthiest proportion of the population con-sumed 427.41 g/day of beverages and processed foods, relative to just 35.33 g/day in the poorest twelfth. Av-erage consumption of processed foods amounts to be-tween 100-427 g/capita/day.
4.4.5 Implications for the nutrition transition
While supply side forces have clearly affected availability and price of imported food and foods subject to invest-ment, the strong consumption bias in favour of more affluent urbanites indicates an increase in demand from these groups. Given that migrant populations tend to adopt the lifestyle practices, including diet, and acquire the disease patterns of native groups the scale of urban-ization expected has major health implications (Shetty 2002). New systems of food provision have developed in cities: the growth of domestic “supermarkets spe-cializing in processed foods, the development of new restaurants and a range of styles of fast foods (Caplan 2002). Female participation in the workforce also tends to change with economic growth. An anthropologi-cal study in Madras, for example, showed that the fe-male urban middle class is shifting away from intensive food preparation in the home, to greater cultural ac-ceptance – and therefore consumption – of processed foods, and meals outside the home (Caplan 2002). Still, it is not clear if this relates to urbanization per se or is simply the result of income growth among the exist-ing urban classes. Much of the urbanization during the 1990s (which, as already described, was slower than the 1980s) involved the rise of casual, unprotected labour and the growth of urban slums, not the creation of new wealth. With wages not indexed to inflation, this grow-ing group is disproportionately affected by rising food prices, leading not only to stark differences in consump-tion patterns between urban and rural, but also within urban populations (Ghosh 2002).
This case study shows that measures implemented to liberalize trade and FDI have acted in concert with domestic policies and changing lifestyles (urban liv-ing, higher incomes, different employment) to alter food consumption patterns. That the changes in con-sumption are far higher among urban, higher income and more educated groups show that the economic
changes have been enjoyed by a relatively small group in society who experienced substantial increases in income. These middle class professionals and skilled workers have helped to fuel increases in market de-mand for high value foods such as processed foods and edible oils, increased availability of which is driven by imports and investment in TFCs. As a result, the In-dian upper middle class is now more at risk of DRCDs than ever before. In India, at least, the profound differ-ence in nutritional status between rich and poor looks to become even wider, as globalization leads the rich towards more chronic diseases, and the poor remain at risk from under-nutrition.
4.5 Globalization, the food supply, and employment in South Africa
4.5.1 The nutritional situation in South Africa
Like Central America and India, South Africa has a double burden of malnutrition. Unlike India, but to an even greater extent than Central America, the bur-den of both under-nutrition and over-nutrition falls on groups in low SES. (Over-nutrition is also experi-enced by more affluent groups, while under-nutrition is not.) Recent analysis of the first national diet and nutritional survey among children shows that the prevalence of combined overweight and obesity (17.1 per cent) is nearly the same as that for stunting (21.6 per cent) (Steyn et al. 2005). Furthermore, stunting was associated with an increased risk (OR = 1.80, CI = 1.48– 2.20) of being overweight (BMI > 25). The most recent Demographic Health Survey data on overweight and obesity in adults indicate that more than 40 per cent of women aged 35 years and over are obese, and more than 20 per cent of all women are overweight. At 12.9 per cent and 5.6 per cent, re-spectively, for men and women, the prevalence rate of underweight (BMI < 18.5) in adults is far lower than those of overweight and obesity (Puoane et al. 2004).
4.5.2 Globalization policies in South Africa
Owing to its unique history, South Africa presents a unique case of globalization. Until the late 1980s the apartheid political regime placed extensive restric-tions on the ability of the non-white population to live in many urban centres. Abhorrence of the racist political system also meant that South Africa became

Globalization, Food and Nutrition Transitions 65
11 Bound tariff rates serve as tariff ceilings above which tariffs cannot go 12 A restriction on trade, usually imports, limiting the quantity of the good or service that is traded; a quota is the most common QR
a pariah nation sheltered from many of the forces of globalization impacting on most other countries. But this changed dramatically in the early 1990s, when changes in economic, trade, agricultural and social policies were implemented. South Africa became ex-posed to the forces of global capital and markets after the government implemented economic policy closely following the advice of the international financial in-stitutions (the IMF, World Bank and regional devel-opment banks). While the political transformation in South Africa has received the most international at-tention, it is this economic transformation that has probably most affected the lives of ordinary South Af-ricans.
Key elements of the policy reform program include:
• reducing industrial tariffs, averaging one-third by 2000
• binding 98 per cent of tariffs lines11 • rationalizing the number of tariff lines• converting quantitative restrictions12 and
formula duties to tariffs• terminating export subsidies (which took
effect in July 1997).
The steep decline in tariffs in manufacturing costs was a notable component of globalization. The coun-try also pursued an aggressive policy of international agricultural trade liberalization, along with domestic agricultural commercialization. Agriculture became increasingly export oriented. About one third of total production is now exported. Between 1994 and 1999, the average import tariff level was lowered by one-third. Most forms of support to commercial farmers were withdrawn, and the input and services markets provided deregulated. The agricultural sector was also modernized through high levels of capital investment and the creation of economies of scale. Despite South Africa’s active land redistribution program, the aver-age size of farms has actually increased in the last five years. A minority of 45,000 farmers own 86 per cent of all agricultural land, 50 per cent of farmers own 6 per cent and just over a quarter (26 per cent) of farmers earn 81 per cent of agricultural income (Nieu-woudt and Groenewald 2003).
4.5.3 Globalization and changes in the food supply and employment
How have these changes in globalization policies af-fected the social determinants of nutrition in South Africa? This case study examines the impact on the food supply (food availability, prices) and the financial resources available to households (employment).
Globalization policies have had important impacts on both the food supply and demand for that food (largely through employment). On the supply side, globalization has contributed to changing the struc-ture of the food supply system. The decline of tariffs on agricultural products, the withdrawal of support to most commercial farmers and the deregulation of the input and services markets created both adjustment pressures and benefits. Overall they increased the de-gree of concentration in the food system. The follow-ing trends are particularly noteworthy:
• shift of production out of grain to livestock in marginal production areas, and an increase in intensive farming in high potential areas, particularly horticultural production
• more farmer involvement in risk management by means of storage, forward contracts and diversification
• strengthening the role of organized markets and producer responsiveness to price signals
• accelerating the establishment of new enter-prises in agriculture and downstream food processing sectors and foreign trade.
On the supply side, the post-apartheid era has also been marked by the (re-)entry of TFCs. South Africa is the most important African market for Coca-Cola and one of their largest markets in the world (Coca Cola 2002). Available in the country for over 60 years, Coke never really left during the sanctions and the apartheid era, simply moving its concentrate plant to Swaziland and selling off its bottling interests, but con-tinuing to sell and advertise its products. After apart-heid ended, Coca-Cola became a leading investor in the country and now has around 85 per cent of the carbonated soft drinks market. This is supported by

66 Globalization and Health Knowledge Network
a multi-million dollar advertising campaigns making Coca-Cola one of the top 10 advertisers in the country (Table 7). Along with the increased presence of TFCs, domestic investment has led to increasing concen-tration in food retailing. Supermarkets that now sell more than 70 per cent of retailed food but source 98 per cent of this food from commercial farms. Super-market leaders Pick and Pay (annual turnover 2005 = US$4 million and 74 stores nationally) and Shoprite (turnover 2005 = US$4 million and 286 stores) are also now expanding into neighbouring countries.
South Africa is also the only sub-Saharan African country with multinational fast food chains. Even be-fore international brands entered the market, South Africa had well-established fast food chains, such Nando’s (chicken) and Steers (burgers). South Africa is also the seventh largest Kentucky Fried Chickens market with 414 outlets (YUM 2006). McDonald’s opened its first outlet in 1995 in Johannesburg. Their outlet expansion program over the following two years was more rapid than any other country. In 26 months 30 outlets opened. Now there are 95 in all parts of the country but nearly always in urban settings (McDon-alds 2005). Though Steers remains more popular, the entry of McDonald’s stimulated the fast food market to become more competitive as a whole.
Concurrent with these changes on the supply side, changes in employment affected demand. The rapid dismantling of tariffs has resulted in sharp declines in employment, especially in the textile and manufac-turing sector. Change has also occurred in the food industry, where there has been widespread outsourc-ing of low-skilled and skilled work to labour brokers. For example, employment in large-scale wheat mills declined by approximately 25 per cent between 1992 and 1999. On the other hand the depreciation of the currency has led to increases in some sectors such as tourism. But overall it has been estimated that over 1 million jobs have been lost, predominantly artisan and unskilled jobs. This has led to a significant growth in unemployment from 33.0 per cent in 1996 to 41 per cent in 2001 (Statistics South Africa 2003). It is pres-ently estimated to be around 40 per cent. This increase has disproportionately affected the majority African population with unemployment increasing from 42.5 per cent to over 50 per cent in just five years. The loss of jobs in the formal sector is giving rise to so-called
informal sector jobs, such as hawking, food retailing and home-based manufacturing.
These changes in supply and demand have combined to affect the availability and accessibility of food. Take the example of the changes in the wheat industry (the second largest arable crop in South Africa, after maize). Trends in ownership and control of wheat farms are not well documented, but anecdotal evidence suggests an increased role for large white family farms as op-posed to other models of production. Milling has also become increasingly concentrated. Following deregu-lation, ownership and control of enterprises involved in baking has shifted substantially. These changes have affected food prices: the price of bread has increased dramatically in real terms, making it very difficult for the majority of the low-income earners to afford bread. Bread has also become less available in rural areas.
4.5.4 Implications for the nutrition transition
These changes have stimulated dietary changes, par-ticularly an increase in the consumption of fat, and increasing differences between urban and rural diets. FAO food balance sheets show that the per capita available energy supply increased from 2,603 kcal/day in 1962 to 2,921 kcal in 2001, available protein supplies increased from 68.4 g to 75.1 g, fat from 61.2 g to 79 g, and available carbohydrate supplies from 445 g to 478 g. Until a couple of decades ago the African population consumed a typical tradition-al diet in whch the fat intake was only 16 per cent of the total calories. By 1990 the fat intake in an urban African community had increased to 26 per cent (Mollentze et al. 1993). When these data were analyzed further, it was shown that those people who had lived in cities for most of their lives already con-sumed a typical westernized diet with 30 per cent of calories from total fat, while those who had spent less than 20 per cent of their lives in the city only consumed 22.5 per cent of calories from total fat (Bourne et al. 1999). Remarkably similar findings have been reported recently from the North West Province. The proportion energy from fat in the diet ranges from 22 per cent in rural population to 31 per cent in the settled urban population (MacIntyre et al. 2002). Other studies report fat intakes of 34 per cent (Langenhoven et al. 1988) and 40 per cent (Vorster et al. 1997) in African urban populations.
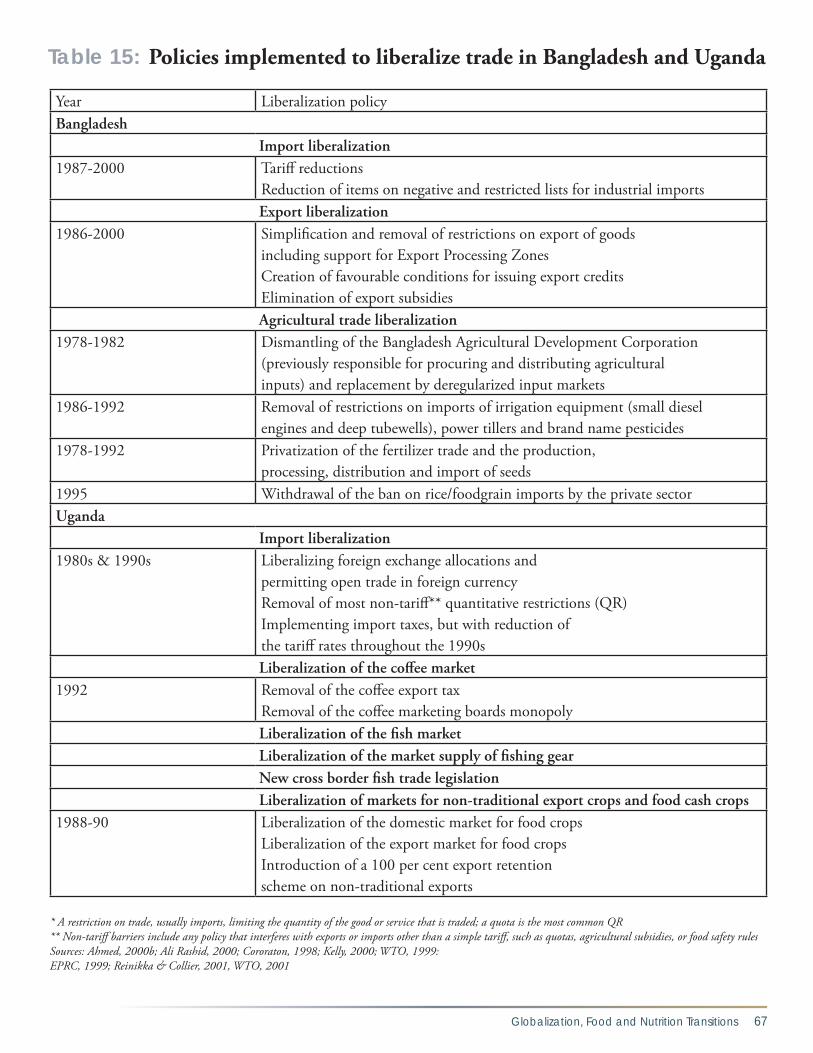
Globalization, Food and Nutrition Transitions 67
Year Liberalization policyBangladesh Import liberalization1987-2000 Tariff reductions
Reduction of items on negative and restricted lists for industrial imports Export liberalization1986-2000 Simplification and removal of restrictions on export of goods
including support for Export Processing Zones Creation of favourable conditions for issuing export creditsElimination of export subsidies
Agricultural trade liberalization1978-1982 Dismantling of the Bangladesh Agricultural Development Corporation
(previously responsible for procuring and distributing agricultural inputs) and replacement by deregularized input markets
1986-1992 Removal of restrictions on imports of irrigation equipment (small diesel engines and deep tubewells), power tillers and brand name pesticides
1978-1992 Privatization of the fertilizer trade and the production, processing, distribution and import of seeds
1995 Withdrawal of the ban on rice/foodgrain imports by the private sectorUganda Import liberalization1980s & 1990s
Liberalizing foreign exchange allocations and permitting open trade in foreign currencyRemoval of most non-tariff** quantitative restrictions (QR) Implementing import taxes, but with reduction of the tariff rates throughout the 1990s
Liberalization of the coffee market1992
Removal of the coffee export tax Removal of the coffee marketing boards monopoly
Liberalization of the fish market Liberalization of the market supply of fishing gear New cross border fish trade legislation Liberalization of markets for non-traditional export crops and food cash crops1988-90 Liberalization of the domestic market for food crops
Liberalization of the export market for food cropsIntroduction of a 100 per cent export retention scheme on non-traditional exports
* A restriction on trade, usually imports, limiting the quantity of the good or service that is traded; a quota is the most common QR** Non-tariff barriers include any policy that interferes with exports or imports other than a simple tariff, such as quotas, agricultural subsidies, or food safety rulesSources: Ahmed, 2000b; Ali Rashid, 2000; Cororaton, 1998; Kelly, 2000; WTO, 1999: EPRC, 1999; Reinikka & Collier, 2001, WTO, 2001
Table 15: Policies implemented to liberalize trade in Bangladesh and Uganda
68 Globalization and Health Knowledge Network
4.6 Globalization and under-nutrition in Bangladesh and Uganda
4.6.1 The nutritional situation in Bangladesh and Uganda
In Bangladesh, with its population of 133.4 million, the proportion of malnutrition has declined in past decades. But stunting remains high – around 54.6 per cent of the under-five age group. Under-nutrition among women is extremely high and shows little evi-dence of declining (de Onis, Frongillo, & Blossner 2000; FAO 1999a). High rates of diarrheal and in-fectious diseases also persist in the country (WHO South East Asia, a; WHO South East Asia, b).
Uganda is often touted as a rare sub-Saharan Africa success story (Reinikka & Collier, 2001). Among its 22.2 million population, consumption-based poverty declined from 56 per cent in 1992/3 to 35 per cent in 1999/2000, an annual mean real increase of pri-vate consumption per adult of 4.7 per cent (Appleton 2001).13 However, when Uganda’s decade-long eco-nomic progress is considered, nutritional outcomes for children are not improving as rapidly as might be expected (Hutchinson 2001). Stunting declined among the under-fives from 44.4 per cent in 1988/89 to 38.3 per cent in 1995, while the prevalence of un-derweight children has increased (de Onis, Frongillo, & Blossner 2000; Hutchinson 2001). Undernourish-ment among the total population increased from 23 per cent in 1990/92 to 30 per cent in 1996/98 (FAO 2001), indicating that declines in poverty have not translated into improved nutrition.
4.6.2 Trade liberalization policies in Bangladesh and Uganda
As described on Table 15, Bangladesh and Uganda have both implemented a range of trade policies as a means of globalizing their economies. In Bangladesh trade liberalization policies were implemented primar-ily as part of a World Bank/IMF supported Structural Adjustment Program (SAP) in the 1980s and 1990s.
The first measures were introduced in 1982, with more intensive implementation in the 1990s. In Uganda trade liberalization was a central part of the Economic Recovery Program implemented by the newly elected National Resistance Movement in 1987. Until then, export taxes and non-tariff trade barriers had charac-terized the country’s trading regime.
The outcome of the policies has been to open up the trading economy significantly. In Bangladesh, tariffs fell by more than half, from an average of 58 per cent in 1992/93 to 22 per cent in 1999/2000, and the number of trade-related quantitative restrictions* has also been reduced (WTO 2000). Uganda now has one of the lowest tariff structures in Africa. The average rate of tariff protection declined from 34 per cent in 1994 to 15 per cent in 1999 (WTO 2001).
4.6.3 Impact of trade liberalization on the food supply and financial resources in Bangladesh
How have these trade policies affected the social de-terminants of nutrition in Bangladesh? This case study examines the impact on the food supply (food avail-ability, agricultural prices) and the financial resources available to households (income, employment) among agricultural and urban populations.
• Food supply: Under the more liberal trading regime, imports of irrigation equipment have risen and costs fallen (Murshid 2001). Irrigation coverage subsequently expanded and rice production increased (Ahmed 2000b). Rice availability per capita rose modestly but significantly, and rice prices fell for consumers (Ahmed 2000a; Dorosh 2000). The subsequent impact on nutrition is difficult to measure because rice takes up around 64 per cent of the income of poor households. However, this shift is likely to have improved access to food: in countries with a low per-capita dietary energy supply such as Bangladesh. This is because an increase in per capita availability very likely leads to nutritional improvements (Smith &
13 The declining poverty reported by the Appleton (2001) are somewhat inconsistent with that obtained from a participatory approach of measuring poverty in the country, by the Uganda Participatory Poverty Assessment Project (UPPAP). To begin with, the language of poverty is different since, as the UPPAP report states “nowhere did [local] people talk only about income poverty, or consumption shortfall, when analysing poverty trends.” Rather people involved in the participatory process also assessed poverty in terms of access to services, health status and food security (ROU, 2001) Overall, UPPAP reported that though many local people felt the 1990s was a better decade than the 1980s, they also though that poverty was worsening. Overall, local people reported more movement deeper into poverty than out of it.

Globalization, Food and Nutrition Transitions 69
14 These findings have been disputed by Rashid, 2002
Haddad 2001). Facilitating rice imports has also had nutritional benefits. As described in section 3.4.2, the ability to import rice quickly minimized the threat of acute malnutrition in Bangladesh during the floods in 1998 (del Ninno & Dorosh 2001).
Financial resources: One of the aims of policies imple-mented to liberalize agricultural trade in Bangladesh was to lift the income level of the majority agricultural population (76.5 million, 59 per cent of the total pop-ulation). Removing import duties on irrigation equip-ment and fertilizers was intended to lower the inputs required to grow high-yield rice varieties, thus facilitat-ing entry into the commercial rice market and boost-ing demand for waged labour (Ahmed 2000b). Since liberalization, labour demand has grown in high-yield rice growing areas and surveys show that farmers in these areas report being better off than before (Ahmed 2000a; Murshid 2001). Overall, though, agricultural employment and real wages in the country stagnated or declined, and poverty declined insignificantly in ru-ral areas (Ravallion 1994; World Bank 1999; Murshid, 2001).14 Poverty remains concentrated among landless people, and liberalization has not turned around the trend toward landlessness (FAO, 1997; World Bank, 1999). The effects of these employment and income dynamics on malnutrition are therefore unclear. Data on the effect of income shifts on access to food, access to health services and maternal and child caring prac-tices could not be identified. Thus the employment/income effects of trade liberalization on malnutrition remain inconclusive.
In urban Bangladesh, export liberalization has also af-fected employment by stimulating the conditions for the growth of the ready-made garment industry. Now Bangladesh’s principal export earner, the industry pro-vides 1.3 million jobs (ILO a). Compared with a 7 per cent employment rate in the non-export sector, 90 per cent of these jobs are filled by women. Women are fa-voured for this work because they are considered cheap and less likely to organize around grievances. Women also favour such jobs because of the cash income and relative independence they provide (Paul-Majumber & Begum 2001). A typical woman working in the gar-ment industry comes from a poor (but not very poor)
and landless rural family, and has migrated specifically for a garment industry job. Usually she’s unmarried and childless. Thus by generating female-oriented jobs, gar-ment factories have created an opportunity for women to earn and control their own income, and potentially improve their nutritional status. The evidence suggests that garment workers have better dietary intake than most people living in poverty (Paul-Majumber & Be-gum 2001). But translating this diet into improved nutritional status is compromised owing to the poor health conditions of the factories. Only 10 per cent of garment workers are in good health, compared to 30 per cent of women in non-export industries. Workers receive no health care or housing benefits and there are strict limits on taking breaks. Garment factory employ-ment is also very insecure.
4.6.4 Trade liberalization, employment, income, food availability and food prices in Uganda
How have these trade policies affected the social de-terminants of nutrition in Uganda? This case study examines the impact on the food supply (food avail-ability, agricultural prices) and the financial resources available to households (income, employment) among agricultural populations.
Around 80 per cent of Uganda’s 27.36 million pop-ulation work in agriculture (FAO 2006a). Although most are subsistence smallholders, around 5 million are cash croppers (Oxfam 2002b; Uganda Bureau of Statistics 2001). The main traditional cash crop is cof-fee, Around one-fourth of the population depends on coffee for their livelihood (Oxfam 2002a). Combined with other traditional exports – tobacco, cotton, tea – coffee makes up about 40 per cent of the country’s to-tal merchandise exports (FAO 2006a). Non-tradition-al export crops include fish and cut flowers, and make up 21 per cent. One aim of trade liberalization was to boost the income level of these cash croppers and encourage more farmers to grow such crops. Export liberalization did indeed boost income and employ-ment in these agricultural sectors, as follows:
• Coffee: Since liberalization, the amount of coffee produced, procured and exported has increased (FAOSTAT). Removal of the state
70 Globalization and Health Knowledge Network
trading monopoly in coffee meant that by the late 1990s Ugandan farmers were receiv-ing 70-80 per cent of the price paid for their coffee on the world market, compared with 20 per cent in 1990/91 (Geske Dijkstra & Kees van Donge 2001). They are also paid more promptly. Driven by the increase of coffee prices on the world market up until the early 2000s, this produced higher incomes for many coffee farmers (Appleton 2001).
• Fish: Since the liberalization of the fish export market, fisheries have become a major indus-trial sector in Uganda, and now account for eight per cent of GDP (EPRC 1999; Waniala & Muramira 1999). This has boosted employ-ment in the fisheries industry to between half and a million people (FAO 1999b; Waniala & Muramira, 1999; EPRC 1999). Export prices have also risen, again resulting in higher income levels (EPRC 1999).
• Land-based non-traditional export crops: By 1992 more than 25 per cent of women farmers had adopted new food export crops and 48 per cent of all women farmers were producing non-traditional export crops (Elson & Evers 1997). It was apparently easier for them to increase their incomes by switching to new export crops from more traditional crops such as coffee.
These changes are associated with declining poverty. Consumption-based poverty among cash croppers fell from 60 per cent to 30 per cent between 1992/93 and 1999/2000, more than twice the average of the coun-try as a whole (Appleton 2001). Yet the declines of malnutrition in Uganda were relatively modest dur-ing this period. This was likely related to disease and ill-health. The reported incidence of disease has risen since liberalization, and around 1 million adults suffer from HIV/AIDS (UNAIDS 2006). It is also likely re-lated to other aspects of export-oriented cash cropping and trade liberalization, including:
• The poorest farmers accrue relatively small income benefits: Many small-scale farmers grow so little coffee that the price increase has had relatively little impact. The faster cash payment system stimulated by liberalization
has also encouraged poorer coffee farmers in need of cash to sell their coffee beans when still “green” for a price lower than if they were ripe, again meaning that they benefit less from rising prices (Bazaara 2001; Geske Dijkstra & Kees van Donge 2001; Oxfam 2002a).
• Volatility of world agricultural prices: Since higher world prices account so much for the declines in poverty in Uganda, it is logical that a decline of prices would have the opposite effect. In 2001 an oversupply of coffee caused a slump in world prices. Revenues fell by $190 million in Uganda, and incomes for coffee growers declined (Charveriat 2001). In the eight months until June 2002, the value of Ugandan exports declined by 30 per cent (Oxfam 2002a). Reports from Uganda suggest that farmers’ incomes have been dramatically affected, and it has been shown in coffee producing nations that falling prices are accompanied by an increase in malnutrition (Oxfam 2002a).
Women’s labour in cash cropping detracts from their income and home food production: Women have less chance to generate their own income. This is because of unpaid household agricultural labour – in 1999/00 there were 2.4 million female unpaid family workers compared with 0.6 million males – and their lower wages (40% per cent less than men) (Fontana, Jo-ekes, & Masika 1998). Surveys have revealed cases in which cash cropping exacerbates this pattern. Men market and generate income from cash crops sales. Women face the double burden of extra unwaged labour – which conflicts with child caring practices and schooling for girls – and the loss of income from marketing food crops locally (Elson & Evers 1997; Fontana, Joekes & Masika 1998). In a participatory exercise, people reported that transfer of land use and women’s labour from food crops to cash crops for sale reduced the variety of food grown and consumed in the household, resulting in malnutrition in children (RoU 2001).
• Reduced availability of locally produced nutri-tional foods: Higher employment and prices in the fisheries sector have been accompanied by a reduction in the availability of fish to local populations. Fish are the most important

Globalization, Food and Nutrition Transitions 71
source of animal protein in Uganda (FAO 1999b). Growth of the fish export market (by more than five-fold between 1990 and 1997) has diverted fish away from the domestic market. Moreover, the high export prices have stimulated competitive forces, raising the cost of fish. This means much of the local popula-tion can only afford to consume rejected fish and fish frames, a growing trend that increasingly compromises their nutritional status (EPRC 1999; FAO 1999b). Overall the amount of energy, protein and fat available to the population from the domestic fish supply has declined significantly (FAOSTAT). Given that fish catches have fallen since the mid-1990s, another concern is that the fisheries are unsustainable, with implications for long-term availability. Locals blame factors arising from the liberalization of the fish market, including the over-exploitation of fishing grounds, use of smaller net sizes, pollution of lake waters and the increase in demand for cheaper yet lower quality juvenile fish (EPRC 1999; RoU 2001; Bazaara 2001).

72 Globalization and Health Knowledge Network
5.1 Conclusions
This paper has collated evidence on the linkages be-tween globalization and social determinants of nutri-tion, with a focus on food. There is little evidence from epidemiological studies isolating whether specific glo-balization processes and policies are linked with spe-cific nutritional outcomes However, the evidence nev-ertheless provides some insights into one of the basic questions of this paper: Can the decreasing prevalence – but continuing persistence – of under-nutrition, the rising prevalence of over-nutrition, and the inequities of these conditions between and within societies be somehow attributed to the globalization of the world economy, and the policies and processes that drive it? This question has three components:
Can the rising prevalence of over-nutrition be somehow attributed to the globalization of the world economy, and the policies and processes that drive it?
• The evidence presented here suggests that yes, the nutrition transition and the growth of DRCDs can be partly attributed to processes
of globalization. Its processes affect the supply and demand for foods associated with the nutrition transition and DRCDs.
• Key supply side drivers are the growth TFCs; the liberalization of international food trade; global food advertising and promotion; the development of supermarkets; cultural influ-ences; the liberalization of foreign direct investment; technological developments; and domestic agricultural liberalization. Key demand side drivers are income and employ-ment, set in the context of urbanization. The supply side drivers have made high-calorie, nutrient poor foods, especially processed foods, more readily available, accessible and acceptable to a greater proportion of the world’s population. The demand side drivers have increased the opportunity for popula-tions, especially in urban areas, to desire and consume such foods.
• Yet, as shown by the case studies, the specific impacts of globalization processes and policies
Globalization, Foodand Nutrition Transitions
5. Conclusions and recommendations

Globalization, Food and Nutrition Transitions 73
depend on many factors such as the specifics of the trade agreement, the foodstuff, and the domestic policy and societal context. Thus the implications of globalization for the nutri-tion transition and DRCDs should always be examined in these contexts.
Can the decreasing prevalence – but continuing persis-tence – of under-nutrition be somehow attributed to the globalization of the world economy, and the policies and processes that drive it?
• The evidence available to answer this question is less clear, since the globalization processes identified as important to under-nutrition pose risks and opportunities to under-nutri-tion. Still it can be concluded that globaliza-tion processes influence under-nutrition depending on the interplay between different effects, and the domestic context in which the processes operate.
• Many of these dynamics relate to the balance between income generation and other contributors to preventing under-nutrition. For example, trade liberalization can affect both boosting and undermining the incomes of groups at risk of under-nutrition (see also companion GKN paper by Blouin et al. 2007).15 But the evidence suggests that, while income is associated with lower under-nutrition at a national level, income does not necessarily lead to improved nutrition. It depends on who controls that income and benefits that may be compromised by wors-ening maternal and child caring practices (e.g. breastfeeding), or declining availability of locally produced nutrition foods. In urban areas, low-waged workers may benefit from better incomes and dietary intakes, but compromised by poor conditions in the workplace.
Can the inequities of these conditions between and within societies be somehow attributed to the globaliza-tion of the world economy, and the policies and processes that drive it?
• The evidence presented in this paper suggests that processes driving globalization exacerbates existing inequities. It is this conclusion that has most implications for nutritional inequi-ties and for development of national and multilateral policies to compensate the losers.
• Firstly, in the context of under-nutrition, communities already experiencing more favourable conditions – such as owning large plots of land or with sufficient capital to invest in agricultural technology – are more likely to accrue the benefits in nutrition. Those already disadvantaged – the landless, rural women – are less likely to benefit. Thus there are winners and losers within societies and between them, a conclusion drawn by other research into the effects of globalization on social welfare (Cornia, Jolly, & Stewart 1987; Oxfam 2002b).
• Secondly, there are inequities between those at risk of over- and under-nutrition associated with globalization, although these emerge along a spectrum. At earlier stages of the nutrition transition, wealthier groups have more opportunity to consume foods associated with DRCDs, and consume diets adequate or excessive in energy, while poorer groups remain at risk from under-nutrition. Later on in the transition, wealthier groups begin to desire and have more access to healthier foods, as the less nutritious, energy-dense foods become more desirable and accessible to groups of lower socio-economic status.
• Thirdly, in the context of the nutrition transi-tion and DRCDs, it is now more evident that there is no contradiction between globaliza-tion as a homogenizing and a diversifying dietary force, since the nature of globalization facilitates both processes. The diversifying nature of globalization processes has positive implications, but also raises the policy concern that these processes may encourage the uneven development of new dietary habits between rich and poor. As high-income groups in developing countries accrue the benefits of a more dynamic marketplace, lower-income groups may either continue to face inadequate
15 The extent to which this occurs under contemporary globalization policies of liberalization and global market integration continues to be a subject of intense empirical, methodological and theoretical debate, and is the topic of other papers produced by the Knowledge Network.

74 Globalization and Health Knowledge Network
access to food, or to experience convergence towards poor quality obesogenic diets, as has been observed in western countries. People of low socio-economic status (albeit not the poorest of the poor) are more likely to be influenced – over the long term – by the con-verging trends of the global marketplace, while the more affluent and educated move onto the more expensive, “healthy market” niches. Thus much of the influence of globalization on diet will depend on the context in which its poli-cies and processes are operating.
5.2 Recommendations
Globalization is a term used to describe an immense and complex set of policies, processes and actors in-volved in the changing global macroeconomy. While it is inevitable that these will affect food supply and de-mand, this inevitably is too often misinterpreted. Glo-balization is reified as an inevitable force, rather than being understood for what it is: policies, processes and actors deliberately created and chosen in a way that is far from inevitable. Therefore, formulating public health policies “to address globalization” can lead to stalemate since it is difficult to formulate clear policies to influence an abstract concept. But it is possible to formulate clear and concrete public policies targeted at specific processes and actors in order to facilitate positive nutritional outcomes.
Both changing food supply and changing consumer demand are major drivers behind the nutrition tran-sition. Therefore, particular policies are needed that target “demand creation”, that is, the manner in which changing food availability and prices are translated into demand. For under-nutrition, national safety nets are needed to help deal with the “adjustment costs” brought by economic policies. The following are some recommendations to policy makers and other stake-holders on potential levers for policy interventions to improve nutrition in a globalizing world:
Processes
• Growth of transnational food companies (TFCs): TFCs in industrialised countries currently are
under considerable pressure to take action to combat obesity. They have formulated volun-
tary commitments to pursue this objective, such as not advertising to children under the age of 12, and reformulating their product portfolios. As conditionality of investment, TFCs also should be required to implement these commitments in developing countries. Government regulations are also needed in certain areas (see below). As well, TFCs should be required to implement healthy working conditions, including child care policies, in factories they own or contract with in develop-ing countries.
• Development of transnational supermarkets: Supermarket sales make up an increasing proportion of consumer food expenditure and engage in aggressive promotional activity. The amount and/or proportion of promotions, including price cuts, for foods associated with the nutrition transition, should be regulated.
• Liberalization of foreign direct investment (FDI):
In all countries FDI is subject to regulation – often in very complex ways. When negotiating these regulatory packages, nutritional concerns should be given consideration. Through its upstream position, FDI would be a single entry-point to implement a range of policies affecting TFC behaviour.
• Global food advertising and promotion: Statutory regulation is needed in order to reduce the exposure of children to advertising and promotion of high-calorie, nutrient-poor foods. A tax on food advertising is also an option to raise funds for nutrition promo-tion. The WHO Code on the Marketing of Breastmilk Substitutes should be strictly enforced and monitored.
• Liberalization of international food trade: From an economic perspective, taxing consum-ers is a more efficient way of discouraging consumption of specific foods than imposing trade tariffs. Excise taxes – a normal part of any tax code – should be used to reduce demand for foods unnecessary in the basic diet of all income groups. With regard to under-nutrition, it should not be assumed that trade liberalization will necessarily produce positive shifts in employment, food avail-ability, food security and price. Even if these

Globalization, Food and Nutrition Transitions 75
shifts are positive, they may not translate into improved nutritional outcomes given the role of household and individuals play in making nutritional choices. Thus policy makers should pay close attention to the conditions of the implementation of trade liberalization. In negotiating policy, particular attention should be paid to the role of women in society, land distribution policy and the significance of household and national food production in affecting national nutritional well-being. The same applies to the liberalization and commer-cialization of domestic agricultural markets.
Actors
• International organizations, agencies and developed country governments:
All need to develop a coherent strategy for building capacity to address obesity and diet-
related chronic diseases (DRCDs) in develop-ing countries. Tremendous capacity exists in developed countries, but they are failing to dedicate resources to building this capacity in the developing world, even though this is where the greatest threat of DRCDs now lies. WHO should take a bold leadership role in lending technical assistance to developing country governments in building policies and programs to improve nutrition.
• Multilateral, regional and bilateral trade organizations:
These organizations need to recognize the legitimacy of taking nutrition into account in trade negotiations. They should not simply assume that nutrition will improve with increasing economic growth. At the moment, food is considered only in terms of food safety. The Framework Convention on Tobacco Control (FCTC) provides some lessons for developing a non-trade treaty that sets a pro-health standard in trade disputes. (The FCTC does not specifically refer to trade, but uses language indicating that health should be the prime consideration.)
• Transnational food companies: TFCs need to implement their voluntary
commitments aiming to improve diet in all countries. Regulation is needed in certain
areas to limit their activities designed to create demand for foods high in calories and low in nutrients. This is also of interest to investment banks, with their concerns about the long run sustainability of the food sector.
• Developing country governments: Governments need to implement policies
recommended here in a coherent strategy, taking an equity focus. They should also implement national social protection pack-ages that require conditionalities for nutrition (e.g. requiring vaccinations, visits to nutrition advice centres).
• Civil society: Civil society has traditionally been active in
the area of addressing under-nutrition, and it should continue to do so, but with greater attention paid to supply-side drivers. Civil society also needs to turn its attention to auditing the effects of macroeconomic pro-cesses on the nutrition transition. Ways to do this would include monitoring TFC voluntary commitments and the responses of the food industry and agribusiness to trade agreements affecting mergers across borders, growth and marketing trends and efforts to move to a healthier product mix.
• Research community: Researchers are beginning to try to understand
the nutritional outcomes of globalization pro-cesses, but their efforts are limited by the lack of data availability or poorly designed studies. Work is urgently needed to link information about changes in food consumption patterns and nutritional status to globalization policies and processes. The rhetoric and fierce debates around the merits and problems of these processes render it critically important that research is well-designed and focused on the key questions from a policy making perspec-tive. Such information is needed if policy makers are to lever globalization for positive nutritional outcomes.

76 Globalization and Health Knowledge Network
Appendix A: Search terms and inclusion / exclusion criteria used in the literature review
6. Appendices
Globalization terms Terms DatePubMed - Searches done in “all fields” - Terms with no * are MESH terms- Limited to “human” only papers - Publication date January 1980- search date
(Globalisation OR Globalization OR Coca-Colonization OR Mcdonaldization) AND (Nutrition OR Diet OR Food intake OR food habits OR food preferences OR food supply OR nutritional disorders OR body weight OR diet* OR food consumption* OR food choice* OR food expenditure* OR food access* OR food price* OR obesity OR nutrition transition* OR diet transition* OR dietary transition*)
July 14, 2006
ISI Web of Science- Searches done as “general searches” - Publication dates January 1980- search date
(Globalisation OR Globalization OR Coca-Colonization OR Mcdonaldization) AND (Nutrition OR Diet* OR food consumption OR Food intake OR food habit* OR food preference* OR food choice* OR food expenditure* OR food supply* OR food price* OR food access OR obesity OR nutrition transition* OR diet transition* OR dietary transition*)
July 14, 2006
CAB Direct- Searches done as advanced searches - Terms in bold searched as “descriptors”, terms not in bold in “all fields”- Limited to database subsets “Agricultural economics and rural studies” & “Human Health” - Publication date January 1980- search date
(Globalisation OR Mcdonaldization) AND (Nutrition OR Diet OR Food consumption OR Food prices OR Food preferences OR Obesity OR Food expenditure* OR Food choice* OR nutrition transition OR diet transition)
July 14, 2006
Google ScholarSearched entire database
- Globalisation or globalization and nutrition July 17, 2006
Trade termsPubMed - Searches done in “all fields” - Terms with no * are MESH terms- Limited to “human” only papers - Publication date January 1980- search date
(Trade policy* OR international trade* OR trade agreement* OR trade liberalization* OR trade liberalization* OR tariff OR Codex Alimentarius*) AND (Nutrition OR Diet OR Food intake OR food habits OR food preferences OR food supply OR nutritional disorders OR body weight OR diet* OR food consumption* OR food choice* OR food expenditure* OR food access* OR food price* OR nutrition transition* OR diet transition* OR dietary transition*)
October 13, 2005
ISI Web of Science- Searches done as “general searches” - Publication dates January 1980- search date
(Trade policy* OR international trade* OR trade agreement* OR trade liberalization* OR trade liberalization* OR tariff OR Codex Alimentarius*) AND (Nutrition OR Diet* OR food consumption OR Food intake OR food habit* OR food preference* OR food choice* OR food expenditure* OR food supply* OR food price* OR food access OR obesity OR nutrition transition* OR diet transition* OR dietary transition*)
October 27, 2005
CAB Direct- Searches done as advanced searches - Terms in bold searched as “descriptors”, terms not in bold in “all fields”- Limited to database subsets “Agricultural economics and rural studies” & “Human Health” - Publication date January 1980- search date
(Trade) AND (Diet* OR Food consumption OR Obesity OR nutrition transition)
July 14, 2006
Google ScholarSearched entire database
- Trade (liberalization or liberalization) and nutrition July 17, 2006
Table A1.1: Search terms used for the literature reviews

Globalization, Food and Nutrition Transitions 77
Inclusion criteria Exclusion criteria- Study presented a conceptual model of the relationship between globalization and diet - Study identified globalization policies and processes which affect diet - Study linked these policies or processes to specific dietary changes over time or space- Study analysed food availability or diet data in the context of particular globalization policies or processes
- Study not primarily focused on the relationship between globalization and nutrition- Study made just a cursory reference to a particular globalization process - Study briefly cited evidence and opinions on the subject without adding anything new to the literature- Study dealt solely with food insecurity
Table A1.2: Inclusion and exclusion criteria for review of globalization and nutrition transition
78 Globalization and Health Knowledge Network
Adair, L. S. & Popkin, B. M. (2005). Are child eating patterns being transformed globally? Obesity Research, 13, 1281-1299.
Aguilar, V., Gonzalez, A., & Heinen, S. (1997). Agricultural situation: Guatemala. AGR No. GT7018 United States Department of Agriculture Foreign Agricultural Service.
Ahmed, A. U. (2000a). Trends in consumption, nutrition and poverty. In: R.Ahmed, S.Haggblade and T.Chowdhury. Out of the Shadow of Famine: Evolving Food Markets and Food Policy in Bangladesh, Baltimore: Johns Hopkins University Press.
Ahmed, R. (2000b). Liberalization of agricultural input markets in Bangladesh. In: R.Ahmed, S.Haggblade and T.Chowdhury. Out of the Shadow of Famine: Evolving Food Markets and Food Policy in Bangladesh, Baltimore: Johns Hopkins University Press.
Albala, C., Vio, F., Kain, J., & Uauy, R. (2002). Nutrition transition in Chile: determinants and consequences. Public Health Nutrition, 5, 123-128.
Ali Rashid, M. (2000) Impact of Trade Policy Reforms on Industrial Capacity and Employment in Bangladesh. Dhaka, Bangladesh: Structural Adjustment Participatory Review Initiative.
Appleton, S. (2001). Changes in poverty and inequality. In: R.Reinikka and P.Collier (Eds.), Uganda’s Recovery: The Role of Farms, Forms, and Government., Washington DC: World Bank.
Babinard, J. & Pinstrup-Andersen, P. (2001). Globalization and nutrition. In P. Pinstrup-Andersen & R. Pandya-Lorch (Eds.), The Unfinished Agenda: Perspectives on Overcoming Hunger, Poverty, and Environmental Degradation (pp. 233-236). Washington DC: International Food Policy Research Institute.
Bazaara, N. (2001). Impact of Liberalisation on Agriculture and Food Security in Uganda 1987-2000: Final Research Paper for the Structural Adjustment Participatory Review Initiative (SAPRI). Available at: http://www.saprin.org/research_rpt.htm.
Benjelloun, S. (2002). Nutrition transition in Morocco. Public Health Nutrition, 5, 135-140.
Blouin, C., Bhushan, A., Murphy, S., & Warren, B. (2007). Trade Liberalization: Globalization Knowlege Network Synthesis Paper 4. Draft paper prepared for the WHO Commission on the Social Determinants of Health.
Bruinsma, J. (2003). World agriculture: towards 2015/2030. An FAO perspective. London: Earthscan Publications Ltd.
Caplan, P. (2002). Food in middle-class Madras households from the 1970s to the 1990s. In: Cwiertka, K., Walraven, B. (Eds.). Asian Food: The Global and the Local., Honolulu: University of Hawaii Press.
Cassels, S. (2006). Overweight in the Pacific: links between foreign dependence, global food trade, and obesity in the Federated States of Micronesia. Globalization and Health, 2.
Cassen R, Visaria P. (1999) India: looking ahead to one and a half billion people. British Medical Journal. 319(7215):995-7.
Castellon, S., Ramirez, I., & Bertsch, C. (1996). Agricultural situation: Nicaragua No. AGR No. NU6010 United States Department of Agriculture Foreign Agricultural Service. Retrieved from: http://www.fas.usda.gov/scriptsw/attacherep/display_gedes_report.asp?Rep_ID=10007750.
References

Globalization, Food and Nutrition Transitions 79
Chalapati-Rao KS, Murthy MR. (2006) Towards understanding the state-wise distribution of foreign direct investments in the post-liberalisation period. New Delhi: Institute for Studies in Industrial Development.
Chalapati-Rao KS, Murthy MR, Ranganathan KVK. (1999) Foreign direct investments in the post-liberalisation period: an overview. Journal of Indian School of Political Economy 11(4):423-54.
Chand R. (2002) Impact of Trade Liberalization and related Reforms on India’s Agricultural Sector, Rural Food Security, Income and Poverty. Global Development Network 5th Annual Conference.
Charveriat, C. (2001). Bitter Coffee: How the Poor are Paying for the Slump in Coffee Prices. Oxford, Oxfam.: Available at: http://www.oxfam.org.uk/what_we_do/issues/trade/bitter_coffee.htm.
Chopra, M. (2002). Globalization and food: implications for the promotion of “healthy” diets. In: World Health Organization, Globalization, Diets and Noncommunicable Diseases. Geneva: World Health Organization.
Chopra, M. & Darnton-Hill, I. (2004). Tobacco and obesity epidemics: not so different after all? British Medical Journal (Clinical Research edition), 328, 1558-1560.
Chopra, M., Galbraith, S., & Darnton-Hill, I. (2002). A global response to a global problem: the epidemic of overnutrition. Bulletin of the World Health Organization, 80, 952-958.
Connor, J. M. (1994). North-America As A Precursor of Changes in Western-European Food-Purchasing Patterns. European Review of Agricultural Economics, 21, 155-173.
Cornia, G. A. (2001). Globalization and health: results and options. Bulletin of the World Health Organization, 79, 834-841.
Cornia, G. A., Jolly, R., & Stewart, F. (1987). Adjustment with a Human Face Volume 1. New York: Oxford University Press.
Cwiertka, K. & Walraven, B. (2002). Asian food: the global and the local. Richmond: Curzon Press Ltd.
de Onis, M., Frongillo, E. A., & Blossner, M. (2000). Is malnutrition declining? An analysis of changes in levels of malnutrition since 1980. Bulletin of the World Health Organization, 78, 1222-1233.
del Ninno, C. & Dorosh, P. A. (2001). Averting a food crisis: private imports and public targeted distribution in Bangladesh after the 1998 flood. Agricultural Economics, 25, 337-346.
Doak, C. M., Adair, L. S., Monteiro, C., & Popkin, B. M. (2000). Overweight and underweight coexist within households in Brazil, China and Russia. Journal of Nutrition, 130, 2965-2971.
Dohlman, E., Persaud, S., & Landes, R. (2003). India’s Edible Oil Sector: Imports Fill Rising Demand. Washington DC: USDA. Retrieved from: http://www.ers.usda.gov/publications/OCS/nov03/ocs090301/.
Dollar, D. (2001). Is globalization good for your health? Bulletin of the World Health Organization, 79, 827-833.
Dorosh, P. (2000). Foodgrain production and imports: toward self-sufficiency in rice? In: R.Ahmed, S.Haggblade and T.Chowdhury. Out of the Shadow of Famine: Evolving Food Markets and Food Policy in Bangladesh, Baltimore: Johns Hopkins University Press.
Drewnowski, A. & Popkin, B. M. (1997). The nutrition transition: new trends in the global diet. Nutrition Reviews, 55, 31-43.
Du, S., Lu, B., Zhai, F., & Popkin, B. M. (2002). A new stage of the nutrition transition in China. Public Health Nutrition, 5, 169-174.

80 Globalization and Health Knowledge Network
Dyck, J. H. & Nelson, K. E. (2003). Structure of the global markets for meat. Economic Research Service Agriculture Information Bulletin No. 785. United States Department of Agriculture. Washington DC: USDA. Available at: http://www.ers.usda.gov/publications/aib785/aib785-1.pdf.
ECLAC (2006). Foreign investment in Latin America and the Caribbean Economic Commission for Latin America and the Caribbean, United Nations.
Elson, D. & Evers, B. (1997). Gender Aware Country Economic Reports: Uganda. Working Paper 2. Manchester: University of Manchester.
EPRC (Economic Policy Research Centre) (1999) Environmental Impacts of Trade Liberalization and Policies for the Sustainable Management of Natural Resources: A Case Study on Uganda’s Fisheries Sector. Geneva: UNEP.
Escalante de Cruz, A., Phillips.S., Visch, M., & Bulan Saunders, D. (2004). The Junk Food Generation: A multi-country survey of the influence of television advertisements on children. Kuala Lumpur, Malaysia: Consumers International, Asia Pacific Office.
Euromonitor (2006). Packaged Food - World. London: Euromonitor.
Evans, M., Sinclair, R. C., Fusimalohi, C., & Liava’a, V. (2001). Globalization, diet, and health: an example from Tonga. Bulletin of the World Health Organization, 79, 856-862.
Ezzati, M., Vander Hoorn, S., Lawes, C. M. M., Leach, R., James, W. P. T., Lopez, A. D. et al. (2005). Rethinking the “diseases of affluence” paradigm: Global patterns of nutritional risks in relation to economic development. PLoS Medicine, 2, 404-412.
Fajardo, L. F. (2004). Impact of globalization on food consumption, health and nutrition in urban areas of Colombia. Globalization of food systems in developing countries: impact on food security and nutrition, FAO Food and Nutrition Paper 83, 285-300.
FAO (1997) The State of Food and Agriculture 1997. FAO: Rome.
FAO (1999). Bangladesh: FAO Nutrition Country Profiles. Rome: FAO.
FAO (1999b) FAO Fisheries Department Fishery Country Profile – Uganda. Rome: FAO. www.fao.org/fi/FCP/FICP_UGA_E.ASP
FAO (2001). The State of Food Insecurity in the World 2001. Rome: FAO.
FAO (2003). Trade Reforms and Food Security: Conceptualizing the Linkages. Rome: FAO.
FAO. (2003b) The State of Food Insecurity in the World 2003: monitoring progress towards the World Food Summit and Millennium Development Goals. Rome: Economic and Social Department, FAO.
FAO (2006a). Special report: FAI/GIEWS review of crop and food situation in Uganda, September 2006. Rome: Available at: http://www.fao.org/docrep/009/j8416e/j8416e00.htm.
FAO (2006b). The State of Food Insecurity in the World 2006. Rome: FAO.
Federation of Indian Chambers of Commerce and Industry (2006) India’s Business Climate - Economy 2006 [cited 2006 October]; Available from: http://www.indiainbusiness.nic.in/business-climate/economy.htm
Fontana, M., Joekes, S., & Masika, R. (1998). Global Trade Expansion and Liberalisation: Gender Issues and Impacts. BRIDGE Report No. 42. Brighton, UK: Institute of Development Studies.
Friedland, W. (2004). Agrifood globalization and commodity systems. International Journal of Sociology of Agriculture and Food, 12.

Globalization, Food and Nutrition Transitions 81
Garrett, J. L. & Ruel, M. T. (2005). Stunted child–overweight mother pairs: Prevalence and association with economic development and urbanization. Food and Nutrition Bulletin, 26, 209-221.
Geske Dijkstra, A. & Kees van Donge, J. (2001). What does the ‘show case’ show? Evidence of and lessons from adjustments in Uganda. World Development, 29, 841-863.
Ghosh J. (2002) Social policy in Indian Development. Geneva: United Nations Research Institute for Social Development; 2002.
Ghosh S, Shah D. (2004) Nutritional problems of the urban slum children. Indian Pediatrics 41:682-96.
Gonzalez, O. & Heinen, S. E. (1997). Agricultural situation report: AGR No. HO7014. Washington DC: USDA FAS.
Gonzalez, O. & Heinen, S. E. (1999). Honduras: retail food sector: GAIN Report No. HO9013. Washington DC: USDA FAS.
Gonzalez, V., Quiros, T., & Bleggi, S. (1995). Livestock: pork meat tariff lowered in Costa Rica. AGR No. 5026 United States Department of Agriculture Foreign Agricultural Service. Retrieved from: http://www.fas.usda.gov/scriptsw/attacherep/display_gedes_report.asp?Rep_ID=10003972.
Grigg, D. (1995). The nutritional transition in Western Europe. Journal of Historical Geography, 22, 247-261.
Gupte MD, Ramachandran V, RK. M. (2001) Epidemiological profile of India: historical and contemporary perspectives. Journal of Bioscience. 26(4):437-64.
Hastings, G., McDermott, L., Angus, K., Stead, M., & Thomson, S. (2007). The Extent, Nature and Effects of Food Promotion to Children: A Review of the Evidence. Geneva: World Health Organization.
Hastings, G., Stead, M., McDermott, L., Forsyth, A., MacKintosh, A. M., Rayner, M. et al. (2003). Does food promotion influence children? A systematic review of the evidence. London: Food Standards Agency.
Hawkes, C. (2002). Marketing activities of global soft drink and fast food companies in emerging markets: a review. In: World Health Organization, Globalization, Diets and Noncommunicable Diseases. Geneva: World Health Organization.
Hawkes, C. (2005). The role of foreign direct investment in the nutrition transition. Public Health Nutrition, 8, 357-365.
Hawkes, C. (2006). Uneven dietary development: linking the policies and processes of globalization with the nutrition transition, obesity and diet-related chronic diseases. Global Health, 2, 4.
Hawkes C. (2007). Agricultural and food policy for cardiovascular health in Latin America. Prevention and Control: The Journal of the World Heart Federation 2:137-147.
Hawkes, C., Eckhardt, C., Ruel, M., & Minot, N. (2005). Diet quality, poverty and food policy: A new research agenda for obesity prevention in developing countries. SCN News, 29, 20-22.
Hendrickson, M. & Heffernan, W. (2005). Concentration of Agricultural Markets: February 2005. http://www.nfu.org/issues/economic-policy/resources/heffernan-report/: National Farmers Union (United States).
Herrera, M., Iglesias, A., & Huete, S. (2003). El Salvador retail food sector: GAIN Report No. ES3013. Washington DC: USDA FAS.
Herrera, M., Orellana, D., & Suazo, H. (2001). Three Central American markets add up to opportunities for US food exporters. AgExporter.
Hrapsky, A. (2004). Costa Rica fresh deciduous fruit report No. GAIN Report No. CS4007 United States Department of Agriculture Foreign Agricultural Service. Retrieved from: http://www.fas.usda.gov/gainfiles/200502/146118851.pdf.

82 Globalization and Health Knowledge Network
Hughes, R. G. & Lawrence, M. A. (2005). Globalization, food and health in Pacific Island countries. Asia Pacific Journal of Clinical Nutrition, 14, 298-306.
Hussain A, Cassen R, Dyson T. (2006) Demographic transition in Asia and its consequences. London: Institute of Development Studies and Overseas Development Institute.
Hutchinson, P. (2001). Combating Illness. In: R.Reinikka and P.Collier (editors), Uganda’s Recovery: The Role of Farms, Forms, and Government., Washington DC: World Bank.
IIPS. (2000) National Family Health Survey (NFHS-2), 1998–99. Mumbai: International Institute for Population Sciences (IIPS) and ORC Macro.
International Trade Services Corporation (2004). GMA’s processed food demand model: assessing the potential value of the Central American FTA on US exports of branded food and beverage products.
Jack M. (2006) Urbanisation, Sustainable Growth and Poverty Reduction in Asia. London: Institute of Development Studies and Overseas Development Institute.
James, WP. T., Jackson-Leach, R., Ni C.M., Kalamara, E., & Shayeghi, M. (2004). Overweight and obesity (high body mass index). In: Ezzati M, Lopez A, Rodgers A, Murray CJL (Eds.) Comparative quantification of health risks: Global and regional burden of disease attributable to selected major risk factors, Geneva: World Health Organization.
Joshi, P. K., Gulati, A., Birthal.P.S., & Tewari, L. (2003). Agriculture Diversification In South Asia: Patterns, Determinants, and Policy Implications. MSSD Discussion Paper Number 57. Washington DC: IFPRI. Available at: http://www.ifpri.org/divs/mtid/dp/papers/mssdp57.pdf.
Kennedy G., Nantel, G., & Shetty, P. (2004). Globalization of food systems in developing countries: a synthesis of country case studies. In Globalization of food systems in developing countries: impact on food security and nutrition, FAO Food and Nutrition Paper.
Kinabo, J. (2004). Impact of globalization on food consumption, health and nutrition in urban areas: a case study of Brazil. Globalization of food systems in developing countries: impact on food security and nutrition, FAO Food and Nutrition Paper.
Landes MR. (2004) The elephant is jogging. Amber Waves 28-35.
Lang, T. (1997). The public health impact of globalisation of food trade. In P. S. Shetty, & K. McPherson (Eds.), Diet, nutrition and chronic Disease: lessons from contrasting worlds. London: J Wiley & Sons.
Lang, T. (1999). Diet, health and globalization: five key questions. Proceedings of the Nutrition Society, 58, 335-343.
Lang, T. & Rayner, G. (2007). Overcoming policy cacophony on obesity: an ecological public health framework for policy makers. Obesity Reviews, Volume 8 Issue s1, 165 - 18.
Latham, M. C. & Beaudry, M. (1999). The impact of transnational corporations on food consumption and nutrition in Africa. In: Ogunrinade, A., Oniango, R.and May, J. (Eds.) Not by Bread Alone: Food Security and Governance in Africa, South Africa: Toda Institute.
Latham, M. C. & Beaudry, M. (2001). Globalization and inequity as determinants of malnutrition: A clear need for activism. Ecology of Food and Nutrition, 40, 597-617.
Leatherman, T. L. & Goodman, A. (2005). Coca-colonization of diets in the Yucatan. Social Science & Medicine, 61, 833-846.
Lee, K. (2001). A dialogue of the deaf? The health impacts of globalisation. Journal of Epidemiology and Community Health, 555, 619.

Globalization, Food and Nutrition Transitions 83
Leiva, E. & Hrapsky, A. (2004). Nicaragua: retail food sector No. GAIN Report No. NU4001 United States Department of Agriculture Foreign Agricultural Service. Retrieved from: http://www.fas.usda.gov/gainfiles/200402/146105462.pdf.
Lipoeto, N. I., Wattanapenpaiboon, N., Malik, A., & Wahlqvist, M. L. (2004). Nutrition transition in west Sumatra, Indonesia. Asia Pacific Journal of Clinical Nutrition., 13, 312-316.
Madeley, J. (2000). Hungry for Trade: How the Poor Pay for Free Trade. London: Zed Books.
Madeley, J. (2001). The Impact of Trade Liberalisation on Food Security in the South: A CIDSE Background Paper. Brussels: CIDSE. Available at: http://www.cidse.org/en/tg1/[email protected]&password=9999.
Marini, A. & Gragnolati, M. (2003). Malnutrition and Poverty in Guatemala: World Bank Policy Research Working Paper 2967. Washington DC: World Bank.
McGinnis, J. M., Gootman, J. A., & Kraak, V. I. (2006). Food Marketing to Children and Youth: Threat or Opportunity? Washington DC: National Academies Press.
McKay, J. (2004). Economic development and its influences and risks for nutrition, cuisine and health. Asia Pacific Journal of Clinical Nutrition, 13, 171-177.
Mendez, M. A. & Popkin, B. M. (2004). Globalization, urbanization and nutritional change in the developing world. FAO Food and Nutrition Paper, 55-80.
Mendez M, Monteiro C, Popkin B. (2005) Overweight exceeds underweight among women in most developing countries. American Journal of Clinical Nutrition. 81:714 –21.
Mennell, S. (2000). The globalization of eating - Opening Lecture at the 9th annual multidisciplinary Conference on Food Choice, Trinity College, University of Dublin. Appetite, 35, 191-192.
Monteiro, C., Moura, E. C., Conde, W. L., & Popkin, B. M. (2004). Socioeconomic status and obesity in adult populations of developing countries: a review. Bulletin of the World Health Organization, 82, 940-946.
Mookherjee D. (2003) Differential urbanisation model: the case of a developing country, India 1961-91. Tijdschrift voor Economische en Sociale Geografie 94(1):38-48.
Muller-Wille, L. (2001). From reindeer stew to pizza: the displacement of local food resources in Sβpmi, northernmost Europe. Fennia, 179, 89-96.
Murphy, S. (2006). Concentrated Market Power and Agricultural Trade. Online at: http://www.tradeobservatory.org/library.cfm?refid=89014: ECOFAIR Trade Dialogue.
Murshid, K. A. S. (2001). Implications of Agricultural Policy Reforms on Rural Food Security and Poverty. Background paper for the Structural Adjustment Participatory Review Initiative (SAPRI) Second National Forum, 13-15 March 2001, Dhaka. Available at: http://www.saprin.org/research_rpt.htm.
Orellana, D., Vasquez, E., & Huete, S. (2004). Guatemala: retail food sector. GAIN Report Number GT4018 United States Department of Agriculture Foreign Agricultural Service.
Oxfam (2002a). Mugged: Poverty in your Coffee Cup. Oxford and Boston: Oxfam.
Oxfam (2002b). Rigged Rules and Double Standards: Trade, Globalization and the Fight Against Poverty. Oxford and Boston: Oxfam International.
PAHO (2003). Preliminary Results: Prevalence of Diabetes, Hypertension and Their Risk Factors in the Municipality of Villa Nueva, Guatemala. Washington DC: Available at: www.paho.org/english/AD/DPC/NC/dia-camdi-gut-2003-result.pdf.
84 Globalization and Health Knowledge Network
Panagariya A. (1999) The WTO Trade Policy Review of India, 1998. The World Economy 22(6):799-824.
Papola TS. (2005) Workers in a globalising world: some perspectives from India. Globalisation and Labour Mobility in India and China; 2005. Melbourne, Australia.
Parthasarathy-Rao P, Birthal PS, Joshi PK, Kar D. (2004) Agricultural diversification in India and role of urbanisation. Washington DC: International Food Policy Research Institute.
Paul-Majumber, P. & Begum, A. (2001). The Gender Imbalances in the Export Oriented Garment Industry in Bangladesh. Policy Research Report on Gender and Development. Working paper series no 12. Washington DC: World Bank.
Pedro, M. R. A., Barba, C. V. C., & Candelaria, L. V. (2004). Globalization, food consumption, health and nutrition in urban areas: a case study from the Philippines. FAO Food and Nutrition Paper, 231-252.
Persaud S, Rosen S. (2003) India’s consumer and producer price policies: implications for food security. Food Security Assessment 2003:32-9.
Pettrie, G. (1995). CA tariff reductions should boost US agricultural exports No. AGR No. GT5010 United States Department of Agriculture Foreign Agricultural Service.
Phillips, L. (2006). Food and globalization. Annual Review of Anthropology, 35, 37-57.
Pingali, P. & Khwaja, Y. (2004). Globalization of Indian Diets and the Transformation of Food Supply Systems. ESA Working Paper No. 04-05. Rome: Agricultural and Development Economics Division, Food and Agriculture Organization of the United Nations.
Pinstrup-Andersen, P. (1987). Macroeconomic adjustment policies and human nutrition: available evidence and research needs. Food and Nutrition Bulletin 9 (online at: http://www.unu.edu/unupress/food/8F091e/8F091E00.htm).
Pinstrup-Andersen, P. & Babinard, J. (2001). Globalization and human nutrition: opportunities and risks for the poor in developing countries. African Journal of Food and Nutritional Sciences, 1, 9-18.
Popkin, B. M. (1999). Urbanization, lifestyle changes and the nutrition transition. World Development, 27, 1905-1916.
Popkin, B. M. (2002a). An overview on the nutrition transition and its health implications: the Bellagio meeting. Public Health Nutrition, 5, 93-103.
Popkin, B. M. (2002b). The shift in stages of the nutrition transition in the developing world differs from past experiences! Public Health Nutrition, 5, 205-214.
Popkin, B. M. (2006). Technology, transport, globalization and the nutrition transition food policy. Food Policy, 31, 569.
Popkin, B. M. & Gordon-Larsen, P. (2004). The nutrition transition: worldwide obesity dynamics and their determinants. International Journal of Obesity-Related Metabolic Disorders, 28 Suppl 3, S2-S9.
Populstat (2007). TONGA: historical demographical data of the whole country. http://www.populstat.info/Oceania/tongac.htm.
Prentice, A. M. (2006). The emerging epidemic of obesity in developing countries. International Journal of Epidemiology., 35, 93-99.
Price, G. K., Landes, R., & Govidan, A. (2003). India’s Pulse Sector: Results of Field Research. Washington DC: United States Department of Agriculture.
Globalization, Food and Nutrition Transitions 85
Quiros, T. & Bleggi, S. (1996). Fresh deciduous fruit: fresh fruit import profile No. AGR No. CS6015 United States Department of Agriculture Foreign Agricultural Service. Retrieved from: http://www.fas.usda.gov/scriptsw/attacherep/display_gedes_report.asp?Rep_ID=10005619.
Rajamma G. (1993) Changing from subsistence to cash cropping. Sakaramma’s story. Focus Gender 1(3):19-21.
Ravallion, M. (1994) Agricultural Wages in Bangladesh: What do the Figures Really Show? Journal of Development Studies 31(2):334-345.
Regmi, A., Ballenger, N., & Putnam, J. (2004). Globalisation and income growth promote the Mediterranean diet. Public Health Nutrition, 7, 977-983.
Reil-Muller A, Patel R. (2004) Shining India? Economic liberalisation and rural poverty in the 1990s. California: Institute for Food and Development Policy.
Reinikka, R. and Collier, P. (Eds.) (2001) Uganda’s Recovery: The Role of Farms, Forms, and Government. Washington D.C.: World Bank.
Republic of Uganda (RoU) (2001) Learning from the Poor: The Uganda Participatory Poverty Assessment Report. Kampala: Ministry of Finance.
Rosegrant MW, Paisner MS, Meijer S, Witcover J. (2001) 2020 Global Food Outlook. Trends, Alternatives and Choices. Washington: International Food Policy Research Institute.
Sawaya, A. L., Martins, P. A., & Martins, V. J. B. (2004). Impact of globalization on food consumption, health and nutrition in urban areas: a case study of Brazil. Globalization of food systems in developing countries: impact on food security and nutrition, FAO Food and Nutrition Paper 83, 253-274.
Schmidhuber, J. & Prakash, S. (2004). Nutrition transition, obesity & noncommunicable diseases: drivers, outlook and concerns. SCN News, 13-19.
Schultz, J. T. (2004). Globalization, urbanization and nutrition transition in a developing island country: a case study in Fiji. FAO Food and Nutrition Paper, 195-214.
Sengupta, S. (2006). India prosperity creates paradox; many children are fat, even more are famished. New York Times, December 31 2006.
Sharma D. (2005) The Indian experience of liberalisation of agriculture. Canberra: Agricultural Trade and Development.
Shetty PS. (2002) Nutrition transition in India. Public Health Nutrition. 5(1A):175-82.
Simi TB. (2006) Trade and environmental dimensions in the food and food processing industries in South Asia, with particular focus on India. Colombo, Sri Lanka.
Sinha R, Anderson DR, McDonald SS, Greenwald P. (2003) Cancer risk and diet in India. Journal of Postgraduate Medicine. 49(3):222-8.
Smith, L. & Haddad, L. (2001). How important is improving food availability for reducing child malnutrition in developing countries? Agricultural Economics, 26, 191-204.
Statistics South Africa (2003). The People of South Africa Population Census, 2000. Census in Brief. Report Statistics South Africa. Pretoria: Statistics South Africa.
Steyn NP, Labadarios D, Mauder E, Nel J, Lombard C. (2005) Secondary anthropometric data analysis of the national food consumption survey in South Africa: the double burden. Nutrition 21:4 –13.
86 Globalization and Health Knowledge Network
Tay, K. & Huete, S. (2006). Guatemala: poultry and products, production and consumption. GAIN Report No. GT6010. Washington DC: USDA FAS. Available at: http://www.fas.usda.gov/gainfiles/200609/146218887.pdf.
Tullao, T. S. (2002). The impact of economic globalization on noncommunicable diseases: opportunities and threats. In: World Health Organization Globalization, Diets and Noncommunicable Diseases, Geneva: World Health Organization.
Uganda Bureau of Statistics (2001). Income and Expenditure Indicator. In: 2001 Statistical Abstract. Entebbe, Entebbe.
UN SCN (2000). 4th Report on the World Nutrition Situation. Geneva: UN SCN / IFPRI.
UN SCN (2004). Fifth Report on the World Nutrition Situation: Nutrition for Improved Development Outcomes. Geneva: UN SCN.
UNAIDS (2006). Report on the global AIDS epidemic. Geneva: UNAIDS.
USDA FAS (2004). Guatemala: retail food sector: GAIN Report Number GT4018. Washington DC: USDA.
USTR (2004). Statement of why the Dominican Republic-Central America-United States Free Trade Agreement is in the interests of U.S. commerce. Available at: www.ustr.gov/assets/Trade_Agreements/Bilateral/CAFTA/Transmittal/asset_upload_file959_7817.pdf.
Uusitalo, U., Pietinen, P., & Puska, P. (2002). Dietary Transition in Developing Countries: Challenges for Chronic Disease Prevention. Globalization, Diets, and Noncommunicable Diseases, Geneva: World Health Organization.
Vepa, S. S. (2004). Impact of globalization on the food consumption of urban India. Globalization of food systems in developing countries: impact on food security and nutrition, FAO Food and Nutrition Paper 83, 215-230.
von Braun, J. (1995). Agricultural commercialization: impacts on income and nutrition and implications for policy. Food Policy, 20, 187-202.
von Braun, J. & Kennedy, E. (1986). Commercialization of Subsistence Agriculture: Income and Nutritional Effects in Developing Countries. Working Papers on Commercialization of Agriculture and Nutrition Number 1. Washington D.C.: IFPRI.
von Braun, J. & Kennedy, E. (1994). Agricultural Commercialization, Economic Development, and Nutrition. Baltimore: Johns Hopkins University Press.
Vorley, B. (2003). Food, Inc. Corporate Concentration from Farm to Consumer. London: IIED.
Wallach, L. & Sforza, M. (1999). Whose Trade Organization? Washington DC: Public Citizen.
Waniala, N. and Muramira, T. (1999) Environmental Implication of Liberalizing Trade in Agricultural and Fish Products - The Case for Uganda. Geneva: UNCTAD.
Watson, J. L. (1997). Golden Arches East: McDonald’s in East Asia. Stanford, California: Stanford University Press.
WHO (1999). Obesity : preventing and managing the global epidemic : report of a WHO consultation on Obesity. Geneva: World Health Organization.
WHO (2002) World Health Report. Reducing Risks, Promoting Healthy Life. Geneva: World Health Organization.
WHO (2005). Preventing Chronic Disease: A Vital Investment. Geneva: World Health Organization.
WHO (2006). Obesity and overweight : WHO Fact Sheet. Available at: http://www.who.int/mediacentre/factsheets/fs311/en/index.html. Accessed November 28 2006.
Globalization, Food and Nutrition Transitions 87
Wild, S., Roglic, G., Green A., Sicree, R., & King, H. (2004). Global prevalence of diabetes: estimates for 2000 and projections for 2030. Diabetes Care, 27, 1047-1053.
World Bank (1999) Bangladesh: From Counting the Poor to Making the Poor Count. Washington D.C.: World Bank.
WTO (2000). Trade Policy Review - Bangladesh 2000. Geneva: World Trade Organization.
WTO (2001). Trade Policy Review - Uganda 2001. Geneva: World Trade Organization.
WTO Trade Policy Review Body (2001). Trade policy review: Guatemala. Report by the Secretariat No. WT/TPR/S/96 World Trade Organization.
Yach, D., Hawkes, C., Gould, C. L., & Hofman, K. J. (2004). The global burden of chronic diseases: overcoming impediments to prevention and control. JAMA, 291, 2616-2622.
88 Globalization and Health Knowledge Network
Publications of the Globalization Knowledge Network
Towards Health-Equitable Globalisation: Rights, Regulation and Redistribution;Report to the Commission on Social Determinants of HealthRonald Labonté, Chantal Blouin, Mickey Chopra, Kelley Lee, Corinne Packer, Michael Rowson, Ted Schrecker, David Woodwardand other contributors to the Globalization Knowledge Network.
Globalization and health: pathways of transmission, and evidence of its impactGiovanni Andrea Cornia, Stefano Rosignoli, Luca Tiberti
Trends in global political economy and geopolitics post-1980 Patrick Bond
Globalization and policy spaceMeri Koivusalo, Ted Schrecker
Globalization, labour markets and social determinants of healthTed Schrecker, with assistance from Daniel Poon
Trade liberalizationChantal Blouin, Sophia Murphy, Aniket Bhushan, Ben Warren
Aid and healthSebastian Taylor
Globalization, debt and poverty reduction strategiesMichael Rowson
Globalization, food and nutrition transitionsCorinna Hawkes, Mickey Chopra, Sharon Friel, Tim Lang, Anne Marie Thow
Globalization and health systems changeJohn Lister
Globalization and health worker migration Corinne Packer, Ronald Labonté, Denise Spitzer
Globalization, water and healthJ. Zoë Wilson, Patrick Bond
Intellectual property rights and inequalities in health outcomesCarlos Correa
Globalization, global governance and the social determinants of health: A review of the linkages and agenda for actionKelley Lee, Meri Koivusalo, Eeva Ollila, Ronald Labonté, Ted Schrecker, Claudio Schuftan, David Woodward