![E-Learning - International Energy Forum...E-Learning: [Addressing national shortages in skilled human resources for the energy and industry sector] International Energy Forum Tackling](https://static.fdocuments.net/doc/165x107/5f480701b2337e2f2903184e/e-learning-international-energy-forum-e-learning-addressing-national-shortages.jpg)
Globalisation and Shortages of Skilled Labour in Pacific...
38
1 Globalisation and Shortages of Skilled Labour in Pacific Island Countries: A Case Study of Australia * M A B Siddique UWA Business School * Research for this paper has been generously funded by the Business School, The University of Western Australia. I wish to thank Mr Nathan Blight and Mr Callum Jones for their excellent research assistance.
Transcript of Globalisation and Shortages of Skilled Labour in Pacific...

1
Globalisation and Shortages of Skilled Labour in
Pacific Island Countries:
A Case Study of Australia*
M A B Siddique
UWA Business School
* Research for this paper has been generously funded by the Business School, The University of Western Australia. I wish to thank Mr Nathan Blight and Mr Callum Jones for their excellent research assistance.

1
Abstract During the past two decades, the Australian economy has experienced fundamental
changes influenced by the increasing propagation of globalisation. Globalising forces
have reduced barriers to labour mobility across countries and economies.
Concurrently there has been an increase in the importance of the ‘knowledge
economy’ and thus the demand for highly skilled workers. The combination of these
factors has increased the competition for highly skilled workers across national
economies and in particular among Pacific Island countries (such as New Zealand and
Fiji) in which the domestic demand for highly skilled labour outstrips the available
domestic supply. The primary objective of this article is to analyse the impact of
globalisation on the Australian labour market with a focus on shortages of skilled
labour in Australia. The paper also examines the implications of shortages of skilled
labour for other Pacific Island countries and suggests policy initiatives in this area.

2
1. Introduction
During the past two decades, the Australian economy has experienced fundamental changes influenced by the increasing propagation of globalisation. It has gradually been emerging as a completely globalised economy through technological improvements, liberalisation of trade, investment and financial sectors, labour market reforms and changes in market and social conditions. During 2005 Australia was ranked as the 13th most globalised country in the world. The impact of globalisation has been more pronounced on the labour market than on any other sector in the economy. Especially, the demand for skilled labour in a number of knowledge intensive industries has grown at a pace which could not be met without local market adjustments. These changes make Australia an insightful case study on migration in the face of labour shortages. A number of other Pacific Islands countries including Fiji and New Zealand have also been experiencing similar shortages of skilled labour. Therefore intense competition has emerged amongst the labour shortage countries to attract skilled labour and various policy measures have been introduced in this regard. The primary objective of this study is to examine the impact of globalisation on the Australian labour market with special focus on shortages of skilled workers. This study is divided into nine sections. The next section introduces and defines globalisation, which is followed by an examination of the progress of globalisation in Australia. Section four analyses the changes in demand for highly skilled workers in Australia resulting from globalisation before the fifth section assesses the changes in the supply of skilled workers. Section six outlines the Australian Government’s policy responses to the shortages and section seven evaluates the effectiveness of the measures. Section eight examines shortages of skilled labour in Australia and the implications for the Pacific Island countries, before the paper is concluded in section nine. 2. Globalisation: the Concept, Measurement and Theories 2.1 The Concept and Measurement of Globalisation The exact definition of globalisation is the subject of much debate as it is perceived in different ways by different people. Some see globalisation as a trade liberalisation concept while others see it as an internationalisation or westernisation phenomenon (Scholte, 2000). These are constantly reconsidered; indeed all definitions of globalisation are subject to criticism and, over time, revision. Scholte (2000) preferred to eschew traditional definitions of globalisation and characterise it as the rise of supraterritoriality, or alternatively, the deterritorialisation of social life meaning that as a result of the globalisation, aspects of social life are no longer reducible to territorial geography. This definition is perhaps reflective of the definition by Anthony Giddens when he describes globalisation as ‘the intensification of worldwide social relations’ (Rosenberg, 2000). Rosenberg, while critical of the conceptualisation of globalisation as deterritorialisation by Scholte preferred to think of globalisation as the ‘conceptual inflation of space’. Reyes (2001) takes a mainstream approach meaning to globalisation suggesting it means, ‘as a phenomenon … a greater interdependence … among different regions and countries in the world in terms of finances, trade and communications’. Building on this, for the purposes of this paper it is sufficient that globalisation be defined simply as a process by which countries and peoples are integrated more closely with one another through ‘free’ and increased

3
movement of goods and services including labour, capital, finance, technology and knowledge.
Identifying when globalisation ‘began’ is a most difficult task. It depends on the timing of steps taken by a country to remove various barriers that are considered as major obstacles to free movement of goods, services and factors of production. Unfortunately, “there is little consensus about identifying dates when countries may be said to have ‘globalised’ or ‘liberalised’” (Round and Whalley 2003: 4). Dollar and Kraay (2001) identify the timing of globalisation of a number of countries which embarked on globalisation after the 1980s with the following trade related measures:
(a) growth in trade relative to GDP; and (b) decline in average tariff rates.
A.T. Kearney, in its annual Globalisation Index, ranks 62 countries of the world according to their level of globalisation. They use four main dimensions to measure globalisation:
1) Economic integration – a measure of the volume of trade and foreign direct investment
2) Technological connectivity – a measure of the number of internet users, internet hosts and secure servers
3) Personal contact – a measure of the extent of connectivity of individuals in a country to the rest of the world. It includes international telephone traffic, and remittance and personal transfers (including worker remittances, compensation to employees and other person-to-person and non-governmental transfers)
4) Political engagement – this looks at countries membership in international organisations, personnel and financial contribution to UN peacekeeping missions, international treaties ratified and governmental transfers.
Depending on the scope of the analysis, there are many indicators that can be used to measure globalisation, but the most difficult task is finding relevant data to measure progress in each of the indicators. The following qualitative and quantitative indicators are used here to measure the progress of globalisation in Australia: (a) policy reforms in the areas of trade, banking and finance, labour markets and foreign direct investment (FDI); (b) growth in trade relative to GDP; (c) regionalism; (d) growth in FDI relative to GDP; and (e) progress in the information and communication technology (ICT) sector. Improvements in any, and preferably, in all of these indicators in a country are expected to lead to global integration.
Globalisation impacts an economy in a number of ways, such as increasing economic growth through trade reforms, increasing demand for skilled workers, attracting foreign direct investment and improving the capacity of a country to adopt modern technology in the knowledge based sectors such as ICT, banking and finance. In this study the analysis of the impacts of globalisation will be limited to the labour market in Australia.
2.2 Theories of Globalisation

4
Theories of globalisation can be characterised by the increasing integration of peoples and cultures, and political and economic structures. Reyes (2001) underpins his reasoning of the theory of globalisation with two main increasing trends, a) the increasing importance of worldwide active communication systems and b) the improving fluency of economic conditions, particularly the high mobility of financial resources and trade. From this Reyes suggests that increasing global communications has allowed all countries, rich and poor, to integrate themselves into a ‘global village’. This has created a new environment to carry out economic transactions and trade. Scholte (2000) argued in his theory that globalisation transpired as a result of four factors: (a) the spread of rationalism as a dominant knowledge framework; (b) the development of capitalism; (c) technological innovation in communication and data processing; and (d) the formation of an enabling regulatory framework. Expanding on this, in relation to the spread of rationalism as a dominant knowledge framework, Scholte likens the process of globalisation as the pursuit of the ‘secularist holy grail’ in that the thought process of rationalism ‘encourages a belief that people can gain comprehensive knowledge when they access the terrestrial world as a whole’. The focus then has been on the physical world as a whole providing the mentality for spurring on the globalisation process. The second element, capitalism focuses on the pursuit of global markets by firms to expand production to maximise the surplus production of firms; a key element of capitalist thought. This quest to expand production has resulted in the rise of global mobility of productive forces and processes. Together these act as another force behind globalisation. This complements basic economic theory with increasing production resulting in the attainment of economies of scale and lower costs with the global expansion of production (Krugman and Obstfeld, 2006). The third factor is relatively straightforward. As in Reyes’ analysis, technological innovation in communication and data processing have increased the ease of conducting financial transactions and international trade and has improved global marketing and accounting activities. In addition, Scholte suggests technology has been important in creating ‘transworld social places’ which has contributed to this process of deterritorialisation. Fourthly, the formation of a consistent regulatory framework such as standardising various legal and institutional arrangements has, according to Scholte, streamlined and facilitated the process of globalisation. Globalisation, in its widest meaning, is not really a new phenomenon. Baldwin and Martin (1999) point out that the two most recent spurts or waves of globalisation occurred between 1870 and 1914, and 1960 to the present. The former wave of globalisation began when the world was fairly homogeneous, that is, homogeneously poor and agrarian while the latter began when the world was sharply divided between rich industrial nations and poor primary producers. Nevertheless, these two periods are characterised by rapid technological change focused mainly in transport and communication. Between 1870 and 1914, the new technologies included the steamship, refrigeration, the telegraph and the telephone, whereas the 1960 to the present globalisation wave has been characterised by mobile phones, the internet and increased air travel. O’Rourke and Williamson (1999) argue that the expansion of trade during the present wave was driven by falling transport costs rather than trade liberalisation. In contrast, James (2002) concludes that the driving force for increased trade between 1960 to the present has been the reduction in communication costs.

5
Nayyar (1998) more specifically contrasts the two waves by stating that the 1870-1914 wave was dominated by imperial nations while the 1960 – present wave is dominated by Multinational Corporations and International Financial Institutions namely: the World Bank, the International Monetary Fund (IMF) and the World Trade Organisation (WTO). The present wave of globalisation has received the most divergent views. No other issue has been as hotly debated as globalisation and its effects on different economies. One reason for this could be the fact that it lacks one clear definition. In addition, technology changes have led to a widespread increase of information which can be manipulated to support one’s argument for or against globalisation. 3. Globalising Australia 3.1 Trade Reforms Agricultural
Agriculture is not only an important part of Australia’s trade, but also of its identity. The maintenance and growth of the farming sector is crucial to Australia’s economy. Given Australia exports about two-thirds of its agricultural production overseas, this sector is heavily dependent on foreign market conditions. Indeed, agricultural trade is the most contentious issue on the global trading agenda and trade barriers are notoriously higher for agricultural products; on average they are about three times higher (DFAT 2006). Thus both Australia’s trade policies and World Trade Organisation (WTO) initiatives in this area are critical.
If we focus briefly on WTO agricultural liberalisation schemes, the Doha round of negotiations in 2001 provides a convenient starting point. All WTO members agreed to negotiate on the phasing out of export subsidies and the substantial reduction of domestic trade distortions. Australia chairs the Cairns Group which consists of 18 members focused on agricultural trade liberalisation. The Group was heavily involved in the Doha round negotiations and has continued lobbying the WTO to meet the mandates formed at Doha. Progress has been slow in the last five years and significant reductions in agricultural support have not been seen. Australia remains committed to agriculture’s liberalisation especially given that it stands to gain up to US$1.3b from a 50 per cent reduction in support (DFAT 2006).
Perhaps Australia’s most important policy reform in the agricultural trade area has been the formation of free trade agreements (FTAs). Australia currently has four bilateral FTAs in action with the United States, Singapore, Thailand and New Zealand. The Australia-United States FTA (AUSFTA) has brought significant reductions in agricultural tariffs, with almost two-thirds of the tariffs applied on Australian agricultural produce being reduced to zero upon implementation of AUSFTA. A further nine per cent of tariffs will be reduced to zero within four years, whilst others will follow an 18 year downfall. The Australia-Thailand FTA incorporates major provisions for agricultural tariff reductions, albeit in longer timeframes. The Australian Government’s desire to participate in bilateral trade liberalisation is highlighted by the five negotiations currently underway with China, ASEAN and New Zealand, Malaysia, Japan and the Gulf Cooperation Council. It is

6
expected that these potential FTAs will include provisions aimed at increasing the competitiveness of Australian agricultural exports in much the same way the four current FTAs do.
Non-Agricultural
The WTO Doha round saw negotiations aimed at the removal or reduction of tariffs and also at reducing non-tariff barriers. All non-agricultural goods were included. The tariff cuts follow a non-linear structure with higher tariffs being specially targeted in line with the desired outcomes of the Doha round. Australia’s impetus for supporting these negotiations is greater predictability and market access for its exporters. Considering non-agricultural exports represent 82 per cent of Australia’s export income, these are important goals.
Australia has been proactive in reducing its tariffs on non-agricultural goods with the average tariff rates falling from 22 per cent in 1984/85 to only five per cent in 2006 (excluding textiles, clothing, footwear and passenger motor vehicles). These reductions and Australia’s exposure to the competitive global scene have seen its manufacturing sector grow by 40 per cent over the same period. Further reductions are planned for non-agricultural products. Textiles and clothing are subject to current rates of 5-17.5 per cent, but these are set to fall to a maximum ten per cent in 2010 and five per cent in 2015. Footwear follows a similar path to five per cent in 2010.
Effect of Reforms on Trade Levels
Figure 1 shows that Australia’s total trade as a percentage of GDP witnessed an increasing trend with some minor fluctuations since the government took the major initiative to globalise the economy in 1983. The increase is more pronounced between 1983 and 2000 with total trade as a percentage of GDP rising from about 30 per cent to 45 per cent. This increase corresponds with the trade liberalisation measures implemented over the period.
Figure 1 Australia’s trade (exports plus imports) as a percentage of GDP.

7
Source: WDI Online (2006).
3.2 Foreign Direct Investment Reforms
The first and most influential reform the Australian economy underwent was the float of its currency in 1983. This effectively opened up Australia to the global environment and forced its businesses to compete on an international scale. The float brought with it financial market deregulation, the entry of foreign financial institutions and as outlined above, tariff reductions and a commitment to liberalising trade. The period 1983 to 2000 saw sustained growth in Australia’s trade as a proportion of GDP as shown in Figure 1. Also the effects of these reforms on FDI inflows and outflows are shown in Figure 2. Since 1983 both inflows and outflows have generally trended upwards, and with the exception of 2004 the two series move together. The real increases in FDI have come since 1999 when the ratios were below one per cent, to 2004 when inflows represented about six and a half per cent of GDP and outflows about three per cent.
Figure 2 Australian FDI to GDP ratio (inflows and outflows)
20
25
30
35
40
45
50
1981 1983 1985 1987 1989 1991 1993 1995 1997 1999 2001 2003
Per c
ent

8
0.00
1.00
2.00
3.00
4.00
5.00
6.00
7.00
1982 1984 1986 1988 1990 1992 1994 1996 1998 2000 2002 2004
Per c
ent
InflowsOutflows
Source: WDI Online (2006).
Accompanying trade liberalisation, FTAs bring with them investment incentives. With the US being Australia’s largest source and destination for FDI, the AUSFTA and its provision for non-discrimination against Australian investors should see a significant increase in investment flows between the two nations. The Australia-Thailand FTA has seen Thailand increase Australian majority ownership potentials in a number of areas. Whilst the Australia-New Zealand Closer Economic Relations does not contain a specific section on investment, it has facilitated cooperation between the two countries and ongoing investment remains at high levels; the Australian Government estimates that two-way investment increased at an annual rate of 18.6 per cent between 1983 and 2003. The effect of Australia’s bilateral trade agreements on FDI levels remains to be seen but provisions promoting investment collaboration are undoubtedly in place.
3.3 ICT Reforms and Progress
Australia has undergone a significant transformation into an information economy in recent years. The Department of Communications, Information Technology and the Arts (DCITA) has shown that the number of households connected to the internet grew 225 per cent and the number of businesses online grew 138 per cent from 1998-2001 (DCITA 2002). The Economist Intelligence Unit (EIU) ranked Australia sixth and ninth globally in 2002 and 2003 respectively in its ‘e-readiness ranking’, a composite measure of a markets conduciveness to internet based opportunities. Australia’s high ranking is primarily due to the extensive telecoms deregulation in 1997 (EIU 2003). Australian’s propensity to utilise the internet has increased by almost 1900 per cent since 1996 as highlighted in Figure 3. Mobile phone usage has followed a similar trend.

9
Figure 3 Progress in Information and Communications Technology (ICT) sector in Australia
0
100
200
300
400
500
600
700
800
900
1990 1992 1994 1996 1998 2000 2002 2004
Use
rs
Internet users per1000 people
Mobile phone usersper 1000 people
Telephonesubscribers per 1000people
Source: WDI Online (2006).
The ICT sector has grown rapidly, not only in Australia but across the Western World. The EIU noted in 2003 that governments worldwide held much of the responsibility. Governments’ featured heavily in promoting its citizens connection with the internet, putting government services online and endorsing online business (EIU 2003). Australia began a bold plan aimed at increasing its ICT sector in 2001 by allocating $2.9 billion to enhancing Australia’s innovative capacity. This spending is distributed through a variety of sources, for example: the doubling of the funds dealt out by the Australian Research Council to $550 million by 2006, additional higher education positions for Australian Universities and enhancement of research and development tax incentives (DCITA 2002). 3.4 Labour Market Reforms
Since 1983 wages policy has been integrated with economic policy resulting in predictable increases in wages, a welcome change from the prior period of wage uncertainty. A major focus of this policy was the protection of the wages of those at the lowest end of the spectrum. This was achieved through flat dollar increases and minimum rate adjustments which were applied to all awards. In 1987 the Industrial Relations Commission ruled that wage increases would not be automatically applied to all awards and that increases would need to be justified based on a ‘structural efficiency principle’ (Lewis et al. 1998). This set the ball rolling for bargaining between employers and employees and in 1991 enterprise bargaining was introduced. Enterprise bargaining is the process whereby wages and working conditions are set through negotiation by employers and employees who may or may not be represented by a union. The major advantage of this system cited by its supporters was greater labour market flexibility. Industries where excess demand for labour existed would
10
see a relative wage increase as employers and employees picked up on the signals of a thriving industry. A disadvantage of enterprise bargaining is the weak negotiation position of lower paid workers. Whilst Australian low paid workers are amongst the best paid in the world, the Government has established a ‘safety net’ for those not able to accomplish enterprise bargaining. In 2005 around four out of five workers participated in enterprise bargaining with the remainder being the low paid that were still covered by awards (Norris et al. 2005). Today Australia operates with a labour market very similar to that of the US and UK, with the majority of workers negotiating with their employers and the low-paid covered by a minimum wage.
4. Globalisation and Shortages of Highly Skilled Workers
One important facet of globalisation Australia has experienced is the lack of restrictions on the movement of labour within Australia and between Australia and the world. With the increasing demand for skilled labour globally, a significant and growing number of people are internationally mobile. This phenomenon extends to Australia with residents leaving the country to work overseas. Many of these emigrants are highly skilled. The converse is also true with Australia receiving a considerable amount of other countries’ skilled expatriates. The entry and exit of international labour from and into Australia is a direct result of the globalisation of the world labour market. The ease of international migration and the lack of barriers to entry in labour markets have been a driving force behind this process. Countries’ labour flows are very important to its industrial development and prosperity, and policy makers must ensure domestic markets remain attractive for foreign workers. In this section we shall examine the problem of shortages of highly skilled workers in Australia resulting from globalisation and the policy measures taken by the government to overcome this problem. 4.1 Definition of ‘Highly Skilled Workers’ It has been acknowledged that the main problem associated with studies relating to highly skilled workers is that there is no agreed definition in the literature as to what constitutes a ‘highly skilled worker’ (Mahroum 1999:169). For example, should an executive with extensive skills and many years industry experience but no formal qualifications be considered highly skilled? Or should a plumber with extensive skills in his trade, yet no university education be considered highly skilled?
Auriol and Sexton (2001:13) also considered this issue of the lack of an internationally agreed definition of a ‘highly skilled worker’, stating that the lack of a consistent definition in international empirical work, limits its analysis at an international level. The main issue is the ambiguity of the term ‘skill’ as it refers to the qualifications needed to perform certain tasks in the labour market, and these skills can be multidimensional throughout various jobs, as most jobs require a multitude of skills to perform tasks adequately (Auriol and Sexton 2001:14).
Empirical studies undertaken in this area tend to use proxies based on education (Lam 2000). However, as suggested by Auriol and Sexton, measures based on education level do not necessarily take into account on-the-job training and learning, and the skills associated with the use of new technology.

11
The International Standard of Classification of Education (ISCED) provides a classification for ‘qualified’ and ‘highly qualified’, whereby ‘qualified’ means formal qualification and ‘highly qualified’ refers to a certain level of education or formal qualification. In the International Standard Classification of Occupations (ISCO), the definition of skill relates the particular skill level and specialisation. The ‘skill level’ is related to the complexity and range of the tasks and duties involved with reference to ISCED levels, whereas ‘skill specialisation’ is defined by the field of knowledge required, the tools and machinery used, the materials worked with, as well as the kind of goods and services produced (Auriol and Sexton 2002:14).
The definition of a ‘highly skilled’ worker used in this paper will be taken to be that of a person with a university education, namely a postgraduate degree, bachelor degree or graduate diploma. This definition is consistent with those used in the Machin and Van Reenen (1998) and Lam (2000) studies where education rather than occupation was used as a definition of skill.
4.2 Changes in the Composition of Demand for Highly Skilled Workers in Australia
Over the 20 year period 1981-2001, Australia saw a large change in the composition the various industry sectors comprising the workforce. Some sectors have declined whilst others have expanded.
Employment Shares in Each Industry
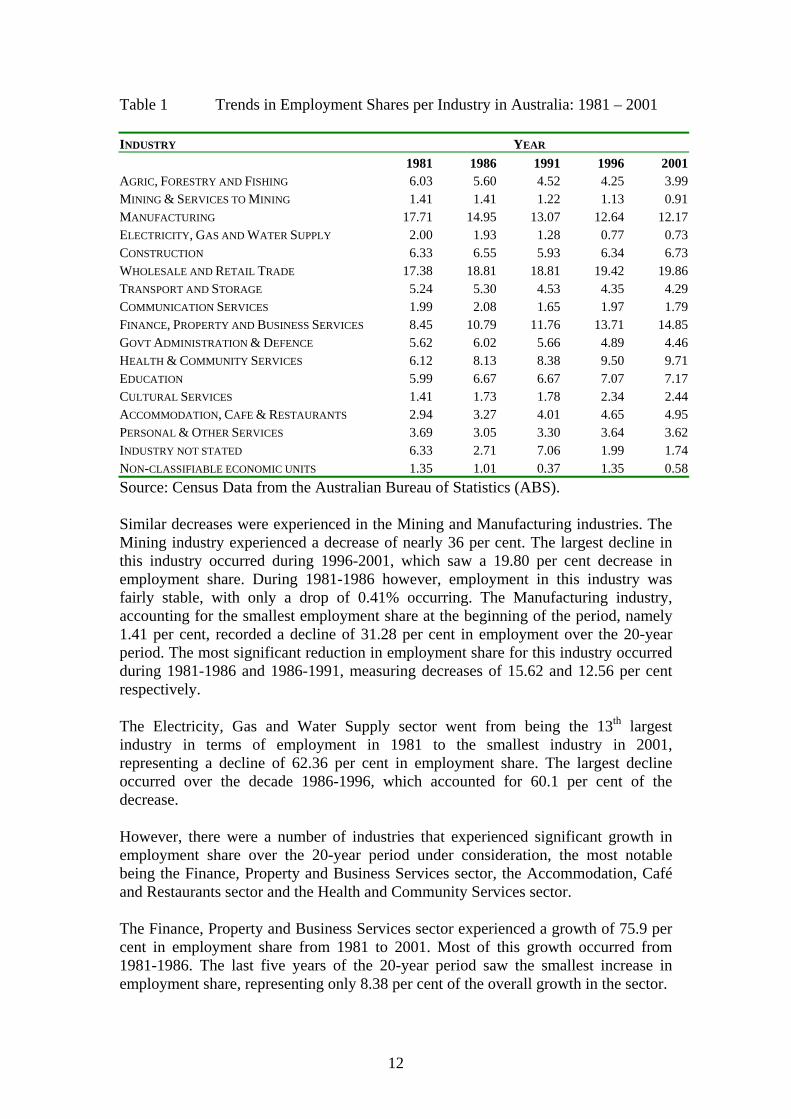
As seen in Table 1, during the 20-year period under consideration, the employment share of the Agricultural, Forestry and Fishing industries has declined from 6.03 per cent to 3.99 per cent, a decrease of about 34 per cent. 19.36 per cent of this decline occurred during 1986-1991.
12
Table 1 Trends in Employment Shares per Industry in Australia: 1981 – 2001 INDUSTRY YEAR 1981 1986 1991 1996 2001AGRIC, FORESTRY AND FISHING 6.03 5.60 4.52 4.25 3.99MINING & SERVICES TO MINING 1.41 1.41 1.22 1.13 0.91MANUFACTURING 17.71 14.95 13.07 12.64 12.17ELECTRICITY, GAS AND WATER SUPPLY 2.00 1.93 1.28 0.77 0.73CONSTRUCTION 6.33 6.55 5.93 6.34 6.73WHOLESALE AND RETAIL TRADE 17.38 18.81 18.81 19.42 19.86TRANSPORT AND STORAGE 5.24 5.30 4.53 4.35 4.29COMMUNICATION SERVICES 1.99 2.08 1.65 1.97 1.79FINANCE, PROPERTY AND BUSINESS SERVICES 8.45 10.79 11.76 13.71 14.85GOVT ADMINISTRATION & DEFENCE 5.62 6.02 5.66 4.89 4.46HEALTH & COMMUNITY SERVICES 6.12 8.13 8.38 9.50 9.71EDUCATION 5.99 6.67 6.67 7.07 7.17CULTURAL SERVICES 1.41 1.73 1.78 2.34 2.44ACCOMMODATION, CAFE & RESTAURANTS 2.94 3.27 4.01 4.65 4.95PERSONAL & OTHER SERVICES 3.69 3.05 3.30 3.64 3.62INDUSTRY NOT STATED 6.33 2.71 7.06 1.99 1.74NON-CLASSIFIABLE ECONOMIC UNITS 1.35 1.01 0.37 1.35 0.58Source: Census Data from the Australian Bureau of Statistics (ABS). Similar decreases were experienced in the Mining and Manufacturing industries. The Mining industry experienced a decrease of nearly 36 per cent. The largest decline in this industry occurred during 1996-2001, which saw a 19.80 per cent decrease in employment share. During 1981-1986 however, employment in this industry was fairly stable, with only a drop of 0.41% occurring. The Manufacturing industry, accounting for the smallest employment share at the beginning of the period, namely 1.41 per cent, recorded a decline of 31.28 per cent in employment over the 20-year period. The most significant reduction in employment share for this industry occurred during 1981-1986 and 1986-1991, measuring decreases of 15.62 and 12.56 per cent respectively.
The Electricity, Gas and Water Supply sector went from being the 13th largest industry in terms of employment in 1981 to the smallest industry in 2001, representing a decline of 62.36 per cent in employment share. The largest decline occurred over the decade 1986-1996, which accounted for 60.1 per cent of the decrease.
However, there were a number of industries that experienced significant growth in employment share over the 20-year period under consideration, the most notable being the Finance, Property and Business Services sector, the Accommodation, Café and Restaurants sector and the Health and Community Services sector.
The Finance, Property and Business Services sector experienced a growth of 75.9 per cent in employment share from 1981 to 2001. Most of this growth occurred from 1981-1986. The last five years of the 20-year period saw the smallest increase in employment share, representing only 8.38 per cent of the overall growth in the sector.
13
The Accommodation, Café and Restaurants sector recorded a growth of 68.14 per cent from 1981 to 2001. 1986-1991 experienced the most growth in this area, recording an expansion of 22.93 per cent in employment share. Again the 1996-2001 quarter showed the smallest amount of growth, as with the Finance, Property and Business Services sector, growing by only 6.34 per cent.
The Health and Community Services sector grew by 58.61 per cent in employment share. As with other periods, the main period for growth was between 1981-1986 (representing an increase of 32.76 per cent in employment share), whilst the period of smallest growth was in 1996-2001, which measured an increase of only 2.30 per cent.
The proportion of highly skilled workers in each sector varies considerably. Table 2 illustrates the percentage of highly skilled workers in each industry for the periods 1981, 1986, 1991, 1996 and 2001.
Table 2 Trends in % University Educated Labour in Australia by Industries: 1981 – 2001 INDUSTRY YEAR 1981 1986 1991 1996 2001AGRIC, FORESTRY AND FISHING 1.58 1.97 6.39 4.46 6.19MINING & SERVICES TO MINING 6.34 7.61 11.34 13.30 17.28MANUFACTURING 2.52 3.27 7.02 7.76 9.88ELECTRICITY, GAS AND WATER SUPPLY 4.83 6.19 10.75 13.85 20.20CONSTRUCTION 1.78 2.27 4.18 3.59 4.46WHOLESALE AND RETAIL TRADE 2.10 2.80 5.97 5.99 7.07TRANSPORT AND STORAGE 1.46 2.17 6.46 6.38 8.31COMMUNICATION SERVICES 3.25 4.36 8.75 11.24 15.85FINANCE, PROPERTY AND BUSINESS SERVICES 9.38 12.58 21.92 25.16 30.27GOVT ADMINISTRATION & DEFENCE 10.51 12.70 19.79 24.10 29.26HEALTH & COMMUNITY SERVICES 12.95 16.31 40.08 27.15 34.29EDUCATION 30.68 28.30 49.29 51.76 55.76CULTURAL SERVICES 7.31 9.38 15.22 17.01 20.38ACCOMMODATION, CAFE & RESTAURANTS 1.89 2.45 6.70 6.09 6.85PERSONAL & OTHER SERVICES 7.79 5.37 10.34 10.77 12.68INDUSTRY NOT STATED 1.72 3.25 8.50 5.43 6.75NON-CLASSIFIABLE ECONOMIC UNITS 2.56 4.22 10.06 8.05 11.86TOTAL 5.95 7.76 15.15 15.47 18.71Source: Census Data from the Australian Bureau of Statistics (ABS). In 2001, the lowest proportion can be found in the Construction industry, with only 4.46 per cent of workers having a university education. Also in the Agricultural, Forestry and Fishing industry, only 6.19 per cent of employees had a university education. The sector with the highest proportion of highly skilled workers was the Education industry, with 55.76 per cent of its employees receiving a university education. Other sectors with large proportions of highly skilled workers included the Finance, Property and Business Services industry with 30.27 per cent and the Government Administration and Defence industry, comprising of 29.26 per cent of highly skilled workers.

14
Percentage of University Educated Labour Over the 20-year period under consideration, all sectors experienced an increase in university-educated labour in their workforce. The most significant increase occurred in the Education industry, which gained 25.08 percentage points over the two decades. Large increases were also experienced in the Health and Community Services industry, increasing by 21.34 percentage points, and the Finance, Property and Business Services industry, which increased by 20.90 percentage points. The 20-year period saw an increase of 12.76 percentage points in the total amount of highly skilled workers in the Australian workforce. Table 3 shows the breakdown of this growth, in five year blocks.
Table 3 Breakdown of Growth in % University Educated Labour in Australia: 1981-2001
INDUSTRY FIVE YEAR QUARTERS 1981-1986 1986-1991 1991-1996 1996-2001 AGRIC, FORESTRY AND FISHING 0.39 4.41 -1.92 1.73 MINING & SERVICES TO MINING 1.26 3.72 1.97 3.98 MANUFACTURING 0.75 3.75 0.74 2.12 ELECTRICITY, GAS AND WATER SUPPLY 1.36 4.56 3.10 6.35 CONSTRUCTION 0.49 1.91 -0.59 0.87 WHOLESALE AND RETAIL TRADE 0.70 3.16 0.02 1.08 TRANSPORT AND STORAGE 0.71 4.29 -0.08 1.93 COMMUNICATION SERVICES 1.12 4.39 2.49 4.60 FINANCE, PROPERTY AND BUSINESS SERVICES 3.20 9.35 3.24 5.11 GOVT ADMINISTRATION & DEFENCE 2.20 7.09 4.31 5.17 HEALTH & COMMUNITY SERVICES 3.36 23.77 -12.93 7.14 EDUCATION -2.38 20.99 2.47 3.99 CULTURAL SERVICES 2.07 5.84 1.78 3.38 ACCOMMODATION, CAFE & RESTAURANTS 0.56 4.25 -0.61 0.76 PERSONAL & OTHER SERVICES -2.41 4.97 0.43 1.91 INDUSTRY NOT STATED 1.53 5.24 -3.10 1.31 NON-CLASSIFIABLE ECONOMIC UNITS 1.66 5.83 -2.00 3.81 TOTAL 1.81 7.40 0.32 3.24
Note: The change in percentage of highly skilled workers over a quarter is calculated as follows: isit RR − where itR represents the fraction of skilled labour in industry i for year t and s, where s is the year at the beginning of the quarter, and t is the year at the end of the quarter.
Source: Census Data from the Australian Bureau of Statistics (ABS). 4.6 Changes in the Supply of Highly Skilled Workers in Australia 1981-2001 The supply of highly skilled workers in Australia has increased dramatically during this period. As Table 4 shows, the total percentage of highly skilled persons in Australia has increased steadily over the 20-year period of this study, increasing from 3.98 per cent in 1981 to 12.92 per cent in 2001, representing an increase of 8.94 percentage points.

15
The number of people qualified with a bachelor degree has experienced the largest growth during the period, with a modest 2.78 per cent of people having obtained the degree in 1981, compared with 9.73 per cent in 2001. This is the most common form of high skill training undertaken by Australians, comprising 75.35 per cent of the total number of highly skilled persons in 2001.
Table 4 Share of Different High Skill Category of Labour Input EDUCATION LEVEL
1981 1986 1991 1996 2001
POST GRADUATE DEGREE LEVEL
0.50 0.57 0.96 1.36 1.81
GRADUATE DIPLOMA & GRADUATE CERTIFICATE LEVEL
0.70 0.68 0.96 1.30 1.37
BACHELOR DEGREE LEVEL
2.78 3.79 5.66 7.67 9.73
TOTAL % HIGHLY SKILLED LABOUR
3.98 5.04 7.57 10.33 12.92
Source: Census Data from the Australian Bureau of Statistics (ABS). However, this increase in the level of supply of highly skilled persons in Australia is likely to be insufficient to meet the large increase in demand for highly skilled persons as reported in Table 2. As such, Australia must consider other various sources to meet the demand for highly skilled workers, namely natural population growth and net overseas migration. These are discussed in the next section.
5. Supply of Highly Skilled Workers in Australia
The growth of the Australian population, and thus the supply of highly skilled workers, is dependent upon the number of births and deaths (natural population growth) and the number of immigrants and emigrants (net overseas migration). The estimated Australian population was 20.61 million at September 2006, and is increasing at approximately the same rate as the world’s population growth rate (DIMIA 2004a:3). Figure 4 below illustrates the components of Australia’s population growth over the period 1980-81 to 2004-05. 5.1 Natural Population Growth Australia’s population increased by 240,500 during 2002-03. 115,200 or 47.9 per cent of this increase was due to natural increase. In previous years, natural increase has usually been the main contributor to population growth and has experienced relatively steady rates over the past 30 years, as opposed to net migration rates, which have fluctuated markedly, as seen in Figure 4. The Australian Bureau of Statistics projects that the Australian population will grow to between 23.0 million and 31.4 million in 2051. This is based on estimates of fertility, life expectancy and net overseas migration.

16
Figure 4 Components of population growth
0
50000
100000
150000
200000
250000
300000
350000
80-81
83-84
86-87
89-90
92-93
95-96
98-99
2001
-02
2004
-05
Year
Pers
ons
Net Overseas MigrationNatural Increase
Sources: DIMIA (2004a), Australian Bureau of Statistics (ABS).
5.1.1 Fertility The total fertility rate in Australia has fallen steadily since 1961 when it was 3.6 children per woman. However, during the past five years, the fertility rate has been relatively stable, varying between 1.73 and 1.76 since 1998 (DIMIA 2004a:12). The downward trend is synonymous with almost every other developed country throughout the world. It is predicted that Australia’s fertility rate will fall further during the next ten years, however there is no consensus or certainty as to how far and how fast it will fall and whether it will stabilise at some point (DIMIA 2004a:13).
5.1.2 Life Expectancy Another factor contributing to population growth is life expectancy. Life expectancy has increased significantly since the 1960’s in Australia. Over the past 20 years, life expectancy has increased by six years for males, reaching 77.0 years, and by four years for females, reaching 82.4 years (DIMIA 2004a:13).
5.2 Net Overseas Migration A factor which must be considered when assessing population growth is net overseas migration. This is calculated as the difference between those leaving permanently or long-term and those arriving permanently or long term. Figure 5 shows net overseas migration as a percentage of total population growth from 1980-81 to 2004-05 for Australia. Since 1981, net overseas migration has ranged from a low of 30,000 or 17.79 per cent of population growth in 1992-93, to a high of 157,400 or 54.50 per cent of population growth in 1988-89. In 2002-03 Australia’s net overseas migration was 125,300; comprising 52.1 per cent of the total increase in population for that year, which is an increase in the number and proportion from recent years (see Figures 4 and 5). In the past, natural population growth always contributed more to the total population growth compared to net overseas migration. This increase is a direct reflection of the larger migration programs of the last two years.

17
Figure 5 Net overseas migration as a percentage of total population
0
10
20
30
40
50
60
70
80-81
82-83
84-85
86-87
88-89
90-91
92-93
94-95
96-97
98-99
2000
-01
2002
-03
2004
-05
Year
Perc
enta
ge
Source: DIMIA (2004a), Australian Bureau of Statistics (ABS).
5.2.1 Immigration With Australia’s population growth so heavily dependent on immigration due to declining rates of natural increase, it is important to determine possible impacts of immigration on Australia’s workforce. Besides the obvious direct population effect of net migration, there is also an indirect contribution to the natural increase proportion of population growth. During the post-war period there have been more than two and half million births with one or both parents born overseas (SCAAIP 1987:23). Immigration will affect the age structure and skill levels of the population when the associated characteristics of net overseas migrants are different from the Australian resident population. In recent years, statistics show that migrants have been younger and more skilled than the Australian resident population. Immigration, therefore, has tended to slightly decrease the average age of the population and to increase its overall skill levels (DIMIA 2002b:11). However, reliance should not be placed on immigration alone to better improve Australia’s working population. Extensive research has verified that immigration is an inefficient means of reducing the ageing effect on the workforce (DIMIA 2002b:11). This is because large levels of immigration would be necessary to have any noticeable impact on the proportion of the population that is aged. The number of permanent additions to Australia’s population was 125,860 in 2002-03, with the onshore Migration programs comprising 31,330 persons. Of those permanent additions, 45.1 per cent were from the Skill Stream of the Migration Program (DIMIA 2004a:1).
5.2.2 Emigration Australia’s population growth is derived from two main components; net overseas migration and natural increase. The natural increase component has been declining and is expected to continue to decline in the future. The implication then is that there will be a greater reliance on the net overseas migration component for population growth and replacement in the future.

18
Net overseas migration is further divided into two main categories of movement, namely permanent and long-term movement. Each category of permanent and long-term movement is in turn sub-divided into departures and arrivals. The Australian Bureau of Statistics (ABS, 2003) defines each of these sub-categories as follows:
• Permanent departures are Australian residents and former settlers who upon departure declare that they do not intend to return to Australia.
• Permanent arrivals include travellers who hold migrant visas, New Zealand citizens who indicate an intention to stay and those who are eligible to settle (for example, overseas-born children of Australian citizens).
• Long-term departures comprising Australian residents who intend to stay abroad for twelve months or more but not permanently and overseas visitors departing who stayed twelve months or more in Australia.
• Long-term arrivals comprising of overseas visitors who intend to stay in Australia for twelve months or more but not permanently and Australian residents returning after an absence of twelve months or more overseas.
Whilst most of the discussion in this area centres on immigration, it is also important to consider the effect of emigration on the supply of highly skilled workers. Emigration can be thought of as a depletion of the amount of highly skilled workers in Australia. A further issue associated with emigration is the fact that the government has little or no control over the level of emigration occurring in Australia.
Since the 1980’s, the scale of population movement throughout the world has increased significantly. The major reasons behind this are: ease, frequency and reduced cost of travel; development of communication systems; internationalisation of capital; variations between nations in economic growth; and changes in countries’ immigration and emigration policies (Hugo 1994:xiv). Emigration has increased steadily in recent years, with 50,463 people leaving Australia permanently in 2002-2003, the highest ever recorded number (DIMIA 2003a).
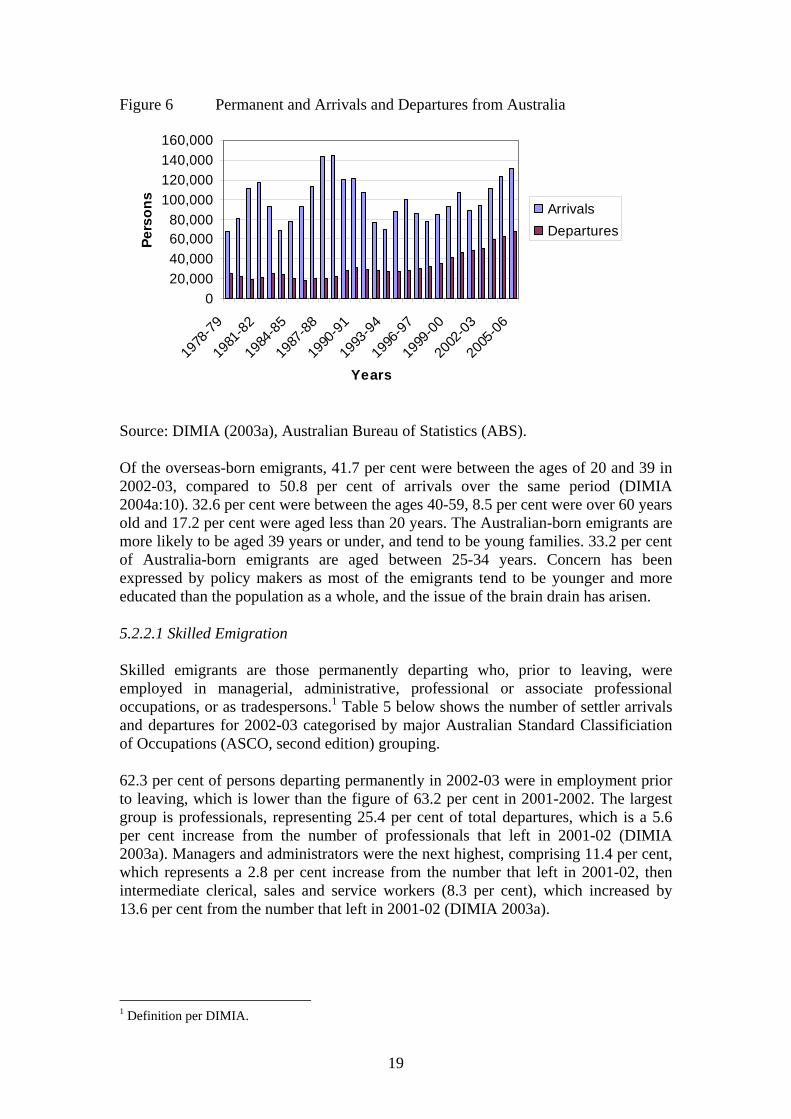
Hugo (1994:xvii) reports that there was a significant increase in Australian-born emigration in the early 1990s. The effect of this on the net migration figures can be seen in Figure 6 below. In 2005-06, 67,840 Australian-born people departed permanently, the highest number ever (ABS 2006). Furthermore, the gap between long-term arrivals and departures of the Australian-born has declined and as a result there are overall net losses of Australian-born. Thus there has been a significant increasing trend for Australian-born persons to leave the country. It is the outflow of Australian born emigrants which is causing the bias toward highly skilled individuals in the total emigration scheme (Hugo 1994: xvi). This trend is likely to continue as a result of the increasing internationalisation of labour markets and ongoing global demand for skilled workers.
The decision for Australian-born emigrants to leave Australia is usually based on economic reasons, particularly employment. Extended working holidays, marriage and educational reasons are other factors that motivate Australian-born persons to emigrate overseas (Hugo 1994: xvii). Some children born in Australia to former settlers may also eventually return with their parents to the country of origin thus also contributing to the emigration levels of Australian-born persons (DIMIA 2003a).
19
Figure 6 Permanent and Arrivals and Departures from Australia
020,00040,00060,00080,000
100,000120,000140,000160,000
1978
-79
1981
-82
1984
-85
1987
-88
1990
-91
1993
-94
1996
-97
1999
-00
2002
-03
2005
-06
Years
Pers
ons
ArrivalsDepartures
Source: DIMIA (2003a), Australian Bureau of Statistics (ABS).
Of the overseas-born emigrants, 41.7 per cent were between the ages of 20 and 39 in 2002-03, compared to 50.8 per cent of arrivals over the same period (DIMIA 2004a:10). 32.6 per cent were between the ages 40-59, 8.5 per cent were over 60 years old and 17.2 per cent were aged less than 20 years. The Australian-born emigrants are more likely to be aged 39 years or under, and tend to be young families. 33.2 per cent of Australia-born emigrants are aged between 25-34 years. Concern has been expressed by policy makers as most of the emigrants tend to be younger and more educated than the population as a whole, and the issue of the brain drain has arisen.
5.2.2.1 Skilled Emigration Skilled emigrants are those permanently departing who, prior to leaving, were employed in managerial, administrative, professional or associate professional occupations, or as tradespersons.1 Table 5 below shows the number of settler arrivals and departures for 2002-03 categorised by major Australian Standard Classificiation of Occupations (ASCO, second edition) grouping.
62.3 per cent of persons departing permanently in 2002-03 were in employment prior to leaving, which is lower than the figure of 63.2 per cent in 2001-2002. The largest group is professionals, representing 25.4 per cent of total departures, which is a 5.6 per cent increase from the number of professionals that left in 2001-02 (DIMIA 2003a). Managers and administrators were the next highest, comprising 11.4 per cent, which represents a 2.8 per cent increase from the number that left in 2001-02, then intermediate clerical, sales and service workers (8.3 per cent), which increased by 13.6 per cent from the number that left in 2001-02 (DIMIA 2003a).
1 Definition per DIMIA.

20
Table 5 Number of Arrivals and Departures Categorised by Major ASCO Grouping: 2002-03
Occupation Departures % Arrivals % Difference
MANAGERS/ADMIN 5,763 18 5,100 11 -663PROFESSIONALS 12,856 41 20,432 46 7,576ASSOCIATE PROFESSIONALS 3,412 11 4,807 11 1,395TRADE PERSONS & RE L WORKERS 2,135 7 5,783 13 3,648ADVANCED CLERICAL & SERVICE WORKERS 1,114 4 1,116 2 2INTERMEDIATE CLERICAL, SALES AND SERVICE WORKERS 4,203 13 4,321 10 118INTERMEDIATE PRODUCTION & TRANSPORT WORKERS 614 2 906 2 292ELEMENTARY CLERICAL, SALES & SERVICE WORKERS 1,102 3 1,534 3 432LABOURERS & RELATED WORKERS 540 2 713 2 173TOTAL WORKFORCE 31,739 100 44,712 100TOTAL IN EMPLOYMENT 63 48NOT IN WORKFORCE 16,495 33 40,463 43 23,968NOT IN EMPLOYMENT 373 1 3,477 4 3,104NOT STATED 1,856 4 5,262 6 3,406TOTAL 50,463 100 93,914 100 43,451
Source: DIMIA Unpublished Tabulation. Table 5 illustrates that Australia receives a net gain in most of the occupational categories. However, on closer inspection, it is apparent that the skill level of emigrants is higher than that of immigrants. Most noticeably in the occupation of managers and administrators, which accounted for 18 per cent of working emigrants, but only 11 per cent of working immigrants. Another alarming figure is the proportion of settlers working prior to arrival/departure. 63 per cent of emigrants were in employment prior to leaving, whereas only 48 per cent of immigrants were employed prior to arriving in Australia.
But while it is true that the overall skill level of emigrants is somewhat higher than that of immigrants, the number of immigrants by far outnumbers the emigrants (43,451) and there is still a substantial net gain in the number of professionals and associate professionals and other skilled occupational groups. Furthermore, with the implementation of the skilled migration policies, discussed in Section 6, Australian immigration has been more selective of skill, entrepreneurial ability and education.
The Department of Immigration and Multicultural and Indigenous Affairs states that overall, Australia continues to gain more skilled migrants than it loses. A total of 24,166 permanent emigrants that left Australia in 2002-03 were skilled, but Australia gained 36,122 skilled permanent settlers the same year. For the years 1995-96 to 1999-2000 inclusive, there was a net gain from overseas movements of around 40,000 managers and administrators, 57,000 professionals and 21,000 tradespeople. The annual gain was increasing in each year over that period (AMG 2001:3). Furthermore, in 2001, a seminar presented at Parliament House, Economic Impact of Immigration2, stated that Australia is attracting more skilled migrant workers than it is losing.
2 Research was conducted by Dr Bob Birrell of Monash University, Professor Sue Richardson of Flinders University, Chris Murphy of Econtech and Chris Richardson of Access Economics.

21
5.2.2.2 ‘Brain Drain’ The mobility of highly skilled workers throughout the world is often described as ‘brain drain’ or ‘brain gain’. Johnson and Regets (1998) describe it as ‘brain circulation’. It is proffered (Mahroum 1999:171) that the long term movement of the highly skilled between countries is due to diminishing economic disparities between countries.
Papers presented in the OECD seminar on “International Mobility of Highly Skilled Workers”, particularly Guellec and Cervantes (2002), showed the main effects anticipated from the mobility of workers for receiving and sending countries, that is the so called brain gain and brain drain. The positive effects for the main host countries are the stimulation of innovation capacity, an increase in the stock of available human capital and the international dissemination of knowledge. For the sending country, the loss of human capital can be at least partially offset by the return of migrants and the development of networks facilitating the circulation of skilled workers between host countries and their country of origin. The mobility of skilled workers can also promote investment in training in sending countries and increase inflows of currency through remittances.
The studies undertaken by Gaillard and Martinelli presented at the OECD seminar showed that the brain drain has in fact been overestimated in developed countries, mainly because the return rate is high. Therefore the effect of emigration on the supply of highly skilled workers is not something which policy makers should be primarily concerned with. Furthermore, a 2001 study discovered that Australia is experiencing a brain gain rather than losing skilled workers to better paid jobs overseas (Birrell et al, 2001). The study found that where demand in Australia was strong for particular skills, the attractions of working in Australia, such as lifestyle and low cost of living were enough to stop any major drain of resident professionals. As such, concern in Australia about the loss of skilled residents is unnecessarily alarmist.
Finally, whilst emigration is associated as having a negative effect on the supply of highly skilled workers in Australia, emigration can be beneficial to supply, as emigrants returning to Australia may bring back new skills and knowledge. Emigrants can assist in the development of links between Australia and its trading partners by facilitating access to overseas markets for Australian goods and services (DIMIA 2003a:3). Furthermore, emigration can boost the levels of foreign investment in Australia through the sending back of remittances by emigrants.
6. Responses by the Australian Government to Overcome the Problem of Shortages of Highly Skilled Workers
Australia is a country dominated by migrant population and its immigration policy has undergone changes due to changes in its socio-economic conditions and national objectives over time. The early migration schemes included only permanent and short-term movers and refugees were later added as a separate category. In due course, immigration typologies included illegal workers and asylum seekers.
22
6.1 Initial Government Policies Economic aspects of migration became a major focus of immigration policy with the publication of The Economic Effects of Immigration by the Committee of Economic Development of Australia (CEDA) in 1985 (DIMIA 2001b:12). The CEDA specifically outlined out a number of positive impacts of immigration on the Australian economy in terms of job creation through the increased demand for goods and services, introduction of new labour skills and technology to encourage innovation (DIMIA 1987).
The findings of CEDA prompted the government to design its 1986 Migration Programme in order to maintain economic development and to promote those who were bringing skills, business expertise and capital to Australia. Declining fertility and an ageing population also influenced the planning of the Migration Programme (DIMIA 2001b:12). New 'Independent' and 'Concessional' categories in the migration policy were introduced to allow extended family members to migrate provided that they qualified in relation to employability, age, education and skills. In the following year, the government introduced the 'Skills Transfer Scheme' for facilitating short-term entry of executives and specialists (DIMIA 2001b:12).
The need for skilled migrants was clearly recognised by the government in 1988 when the Migration Programme was divided into three streams - 'Family', 'Skilled' and 'Humanitarian'.3 In the same year, the National Office of Overseas Skills Programme was established as part of major reforms to the system of overseas skills recognition. The Migration Programme was significantly overhauled under the coalition government led by the current Prime Minister John Howard. More emphasis was given to people coming to Australia under the Skill category and the Family category was relegated to least preferential position. This is because research suggested that skilled migrants have substantially lower unemployment rates, an ability to find work more quickly, and higher levels of income and expenditure (DIMIA 2002b).
During 1992 two new visa classes were introduced to provide the State and Territory Governments with a way to sponsor a limited number of 'Business Skill' migrants. During 1997, the government created a new Skilled-Australian linked category which was derived from the former ‘Concessional Category' but with more emphasis on the skill of the applicants under this newly created category (DIMIA 2001b:15).
6.2 Skilled Category of Australia’s Migration Program The Skilled Category of Australia’s Migration Program is specifically designed to target migrants who have skills or outstanding abilities that will contribute to the Australian economy. Migrants must satisfy a points test, have particular work skills, be nominated by particular employers or have other links to Australia, or have successful business skills and/or significant capital to bring to Australia to establish a
3This major shift in Australia's migration policy took place at the recommendation of the Committee to Advise on Australia's Immigration Policies (CAAIP) which was formed by the government to advise it on immigration matters in light of the social and economic objectives of the nation. It should be noted here that the skill category has increasingly been refined to cope with the wide rage of circumstances and situations under which they now move in increasing numbers across the globe (Keely 2001:261-63).

23
business of benefit to Australia (DIMIA 2001a:1). The program is aimed at attracting overseas personnel who can help to address the skill shortages in particular occupations that exist in Australia and therefore enhance the size, skill level and productivity of the Australian workforce (Hugo 2002:297). There are five different classes of visa that make up the skilled category, namely Skilled Australian Sponsored; Skilled Independent; Distinguished Talent; Business Skills and Employer Nominations.
The Australian government has and continues to emphasise skilled migration. In recent years the overall skill level of migrants entering Australia has been increasing. In 2002-2003, nearly 90 per cent of Skilled Independent applicants scored the maximum points for skill. More than 50 per cent of these applicants had Australian qualifications and more than 20 per cent were in occupations in national shortage. In 2002-2003, the Skill Stream represented 61.1 per cent of the Migration Program, an increase from 57.5 per cent in 2001-2002.
A new points test for skilled migrants was developed in 1999 favouring migrants possessing the skills that were in demand. Greater emphasis was placed on targeting migrants who possess skills that are in shortage in the Australian labour market. This was done by awarding additional points under the existing points test to applicants whose occupation is on the Migration Occupations in Demand List (MODL). The changes to the points test also took into account other attributes such as Australian qualifications and work experience, fluency in a language other than English and spouse’s skills.
The Business Skills class of the Skilled category was amended in 2000 to increase Australia's competitiveness for these migrants in a globalising workforce environment. And in 2003, DIMIA introduced specific initiatives providing streamlined entry to Australia of business people applying for either short or long-term temporary stays (AMG 2004a:2).
6.2.1 Skilled Temporary Entry Whilst the permanent settlement migration policy dominated Australia’s migration program in previous years, temporary migration has emerged as an important change to Australia’s migration policy. This is the response to important changes in the Australian economy, internationalisation of labour markets and globalisation forces in general (Hugo et al. 2001:300). Whilst it has been argued (Hugo 1999 in Hugo 2002) that this represents a fundamental change to Australia’s immigration policy, it should be noted that this type of visa entry is only open to persons with skills in demand and entrepreneurs as opposed to those who are unskilled or lowly skilled. Temporary entry into Australia allows overseas personnel to enter Australia on a temporary basis for specific purposes, resulting in some benefit to Australia (DIMIA 2004a:51). The five broad categories of temporary entry are Visitors; Overseas Students; Working Holiday Makers; Business (Long-Stay) and Other Temporary Visas.
For many individuals and nations, temporary entry into a country is seen as an easier and more publicly acceptable way of moving into the global market for skilled workers (DIMIA 2002a:1). Employers have more flexibility in targeting skilled workers, as they can also access overseas persons who are not interested in permanent
24
residence in a particular country. The temporary entry visa programs also provide an alternative means for skilled workers to obtain permanent residence in Australia. It has been reported that there has been an increasing trend for many people to come to Australia on temporary entry visas and then apply for permanent entry (DIMIA 2002a:1).
6.2.1.1 Business (Long Stay) The Temporary Business (Long Stay) visa was introduced in 1996 with the aim of allowing employers to fill skill shortages from overseas and assess new ideas, skills and technology. The visa holders tend to be highly skilled and have relatively high-income levels and therefore are able to contribute to economic growth through improved productivity and increased demand for goods and services. They also enhance Australia’s ability to compete in international markets due to entrants usually being managers and skilled specialists (DIMIA 2004a:63). The aim of this program is to enable businesses to enhance international competitiveness through the quick and smooth transfer of key skills, while safeguarding employment and training opportunities for Australian workers (DIMIA 2004a:63).
In 2002-03, 37,859 Business (Long Stay) visas were granted, which represents an increase of 12.2 per cent from 2001-02. 64 per cent of these visas were comprised of professionals, 14 per cent were managers/administrators, 12 per cent were associate professionals, 8 per cent were trade and related workers and 2 per cent were unclassified (DIMIA 2004a:64). The other stream of the Business (Long Stay) visa is the Independent Executive Stream, which is non-sponsored. It enables persons to enter Australia for the purpose of establishing or buying into a business and managing that business.
6.2.1.2 Medical Practitioners Temporary resident medical practitioners are able to obtain a visa if they possess skills in an identified ‘area of need’ that cannot be filled by suitably qualified Australian residents (DIMIA 2004a:65). Regional and remote areas of Australia often find it difficult to recruit medical practitioners from more populated areas, therefore Australia benefits from this category, as medical practitioners from overseas can be recruited to these ‘areas of need’. In 2002-03, 5031 Medical Practitioner visas were granted. 6.2.1.3 Educational This category is available for overseas personnel who possess the necessary skills to fill academic, teaching and research positions that cannot be filled from within Australia. Australia has benefited through the contribution of new ideas and knowledge possessed by overseas academics and relations between Australia and overseas nations has improved considerably. However, legislation is expected to be introduced to abolish this category as needs met by this visa class could adequately be met by the Business (Long-Stay) category (DIMIA 2004a:65).

25
6.2.1.4 Other Temporary Entrants DIMIA has designed various categories of temporary visas for overseas visitors to further Australia’s economic, social and international relations in the context of a more mobile global workforce (DIMIA 2002a). The categories include Skilled workers and Business Creation visas; Social and Cultural visas; and International Relations visas. Skilled workers can be obtained through the International Relations category as well. The Exchange visa category allows for skilled overseas people to obtain employment in Australia while an Australian resident obtains a similar opportunity overseas. 1,369 visas were granted in 2002-03 (DIMIA 2004a:68).
6.2.2 Student Visas DIMIA offers temporary residents in Australia the benefit of being able to switch status between temporary and permanent programs, a benefit that many other nations do not allow. In other countries the route from temporary schemes to permanent residence is indirect, unplanned and uncertain (DIMIA 2002a). An example of this is the legislation introduced on 1 July 2001 allowing overseas students graduating from Australian universities to apply directly for permanent migration, without leaving the country. This reflects the Government’s recognition that overseas students who have successfully completed study in Australia have potential to contribute to the level of highly skilled workers in Australia. The categories of Student visas include: Skilled Independent Overseas Student, Skilled Australian Sponsored Overseas Student and Skilled Designated Area Sponsored Overseas Student.
New incentives to study in regional Australia were introduced in July 2003 for students who are interested in applying for skilled migration. Under the points system test for General Skilled Migration, applicants may now be awarded additional points for having lived and studied in regional Australia or a low population growth metropolitan area for at least two years. This category of skilled migration has opened up an immediate source of young, English-speaking migrants with Australian qualifications and experience of the Australian culture and labour markets (DIMIA 2002a). This policy implementation recognises the fact that students are a central component to the international migration of the highly skilled.
At 30 June 2003 there were 172,973 overseas students in Australia, which is a 13 per cent increase from 30 June 2002. The median duration of stay at 20 June 2002 was just under 5 months. The median age was 22 years (DIMIA 2004a:59).
6.3 State Specific Migration Mechanisms The Australian Government has also recognised that there is a shortage of highly skilled workers in regional areas. Regional migration initiatives support the States and Territories as well as employer needs.
6.3.1 State/Territory Nominated Independent Scheme (STNI) The STNI involves the sponsorship of Skilled Independent applicants who are willing to settle in a particular State or Territory where their skills are in demand. They are normally identified through a skills matching database (DIMIA 2003b:7). The States

26
and Territories that participate in this scheme are individually responsible for the management and operation of the scheme. Currently, the South Australian, Victorian and Tasmanian Governments are using the STNI scheme.
6.3.2 Skilled Designated Area Sponsored Introduced in 1996, this scheme enabled skilled relatives to be sponsored for migration to designated areas of Australia. All parts of Australia except Sydney, Newcastle, Wollongong, Perth, Brisbane, the Sunshine Coast and the Gold Coast are designated areas. This scheme is aimed at ensuring high levels of skills of migrants are maintained (DIMIA 2003b:5).
6.3.3 Regional Sponsored Migration Scheme (RSMS) This scheme specifically caters for any ‘rural’ employers who cannot find a suitable local Australian worker, whereby they can nominate a foreign worker for migration to Australia. Applicants must meet English language, age and skill criteria but there is no points test. Any employer operating a business in an area covered by the RSMS can participate in the scheme. The RSMS Medical Practitioner Scheme has been developed in recognition of the fact that there is a shortage of doctors in rural areas. This scheme enables hospitals to nominate suitably qualified medical practitioners from overseas.
6.3.4 State/Territory Sponsorship for Business Skills Applicants The Business Skills Category underwent changes in March 2003, whereby a majority of the Business Skills entrants will enter Australia on a temporary visa for an initial period of 4 years. Following this initial period of 4 years, visa holders may apply for permanent residence, providing satisfactory evidence regarding the specified level of business or investment activity is supplied. The Australian Government has been encouraging entrants under this category to set up business in rural, regional or low growth areas of Australia. State and Territory sponsorship is available to implement this.
6.3.5 Regional Established Business in Australia The Regional Established Business in Australia (REBA) category, which was introduced in 1 July 1997, allows temporary residents to gain permanent residence if they have established a successful business in Australia, are sponsored by their State or Territory Government and are in a designated area.
6.3.6 Skill Matching Visa The Skill Matching Visa Class is similar to the STNI and RSMS initiatives outlined above, but also contains additional features designed to complement the major reforms to Skill Stream selection arrangements that came into effect on 1 July 1999. This visa provides an opportunity for skilled migrants who do not meet the current criteria under the Skilled Independent category to be included in the skill matching database for possible nomination by a State or Territory Government. Applicants must meet certain criteria relating to age, education background, English-speaking ability
27
and employment in an occupation listed on the Skilled Occupations List (DIMIA 2003b:4).
6.4 Migrant Training Programs A new visa category was introduced on 1 July 2003 enabling organisations to bring professionals into Australia for tailored training programs. The new visa allows education and training to provide academic and practical training for professionals, managers and government officials from overseas.
6.5 The IT and T Industries With the emergence of the New Economies (based on knowledge-intensive industries) the demand for skilled labour in traditionally labour-short countries (which are highly dependent on migrant labours) has accelerated in recent years. The increased demand has been more pronounced in the IT and T industries. Evidence of this shortage is contained in the ‘Olivier Internet Job Index’ for the IT sector. This index, which started at 100 in January 2000, showed that the number of jobs advertised nationally in April 2004 was at 39.51, which is still low compared to other industries, although it has been experiencing a steady resurgence during recent years (see Figure 7).
Figure 7 Olivier Internet Job Index Report – IT and T.
Source: Olivier Internet Job Index Report, available from
www.olivier.com.au/IJI_Current.html
The Australian Government has recognised this shortage in the IT and T industries. Initiatives developed are aimed at attracting more highly-skilled IT workers to Australia. They are also aimed at the retention of Australian-educated overseas IT students. These measures will ensure that Australia can build on its competitive skilled migration system and retain its leading position in the global IT marketplace (AMG 2001:1).
Policy changes in response to the shortage have included (AMG 2001:1):
• Using at least 2,500 places in the Skill Stream contingency reserve to accommodate the rising demand for permanent migration from overseas students with Australian qualifications in IT; and

28
• The July 1 2001 changes allowing these overseas students to apply for and be granted their permanent residence visas without leaving Australia.
Further initiatives that were designed to enhance Australia’s permanent and temporary entry arrangements included:
• Recognising all IT occupations as ‘key’ positions for long-term temporary entry;
• Requiring immigration decision makers to give immediate processing priority to IT professionals; and
• Exploring the possibility of electronic lodgement of visa applications over the Internet.
Whilst these measures go a long way to meeting the immediate needs of the IT industry, the Government’s focus in the long term is to expand training and education opportunities for young Australians.
7. Effectiveness of Australia’s Migration Policies
Over the past six years the Government has rebalanced the migration program towards young, educated English-speaking workers and their families (AMG 2003b:1). The migration program in 2003 was the largest and most highly skilled in over a decade, with the skilled stream of the program increasing by 23.4 per cent from around 53,520 to 66,053 (DIMIA 2004a:22).
Figure 8 Migration to Australia
0.0
20.0
40.0
60.0
80.0
100.0
120.0
140.0
1995
1996
1997
1998
1999
2000
2001
2002
2003
2004
2005
Year
Pers
ons
'000
TotalFamilySkilled
Source: DIMIA (2002b), Australian Bureau of Statistics (ABS).
Skilled migrants represent 61.1 per cent of the non-humanitarian migration program, an increase from 57.5 per cent in 2001-02 and a major increase from 29 per cent in 1995-96. Figure 8 shows the percentage has been increasing over the past decade. In addition to the positive effects this has on the supply of highly skilled labour in the Australian workforce, this will lead to benefits to the Australian economy.

29
It has been reported (Skotnicki 2003:19) that the Skilled migrants program will have a large positive effect on the federal budget over the next 20 years. Furthermore, it is suggested that, over the past 10 years, there has been an additional $19.4 million in tax revenue for every 1000 independent skilled migrants.
7.1 Effectiveness of Changes to Points Test The 1999 changes to the points test categories of the Skill Stream have been overwhelmingly successful in attracting highly skilled migrants. As Figure 9 shows the number of migrants entering under the skilled migration category has dramatically increased in proportion and volume since the changes were implemented in 1999.
7.2 Categories of Skilled Migration Program Visas The five main categories comprising the Skill Category of visas are represented in Figure 10. Over 50 per cent of all applicants in the points tested categories have skills in a MODL occupation. In 2002-03, nearly 90 per cent of Independent Skilled principal applicants scored the maximum points for skill. Furthermore, in the same period, more than 50 per cent had Australian qualifications and more than 20 per cent were in occupations in national shortage (AMG 2003a; pg 1).
Figure 9 Migration by category
0
10
20
30
40
50
60
1995
1996
1997
1998
1999
2000
2001
2002
2003
2004
2005
Years
Pers
ons
'000
SkilledFamilyHumanitarian
Note: Program numbers do not include New Zealand citizens in 2000/01 and 2001/02
periods Source: DIMIA (2002b), Australian Bureau of Statistics (ABS).
30
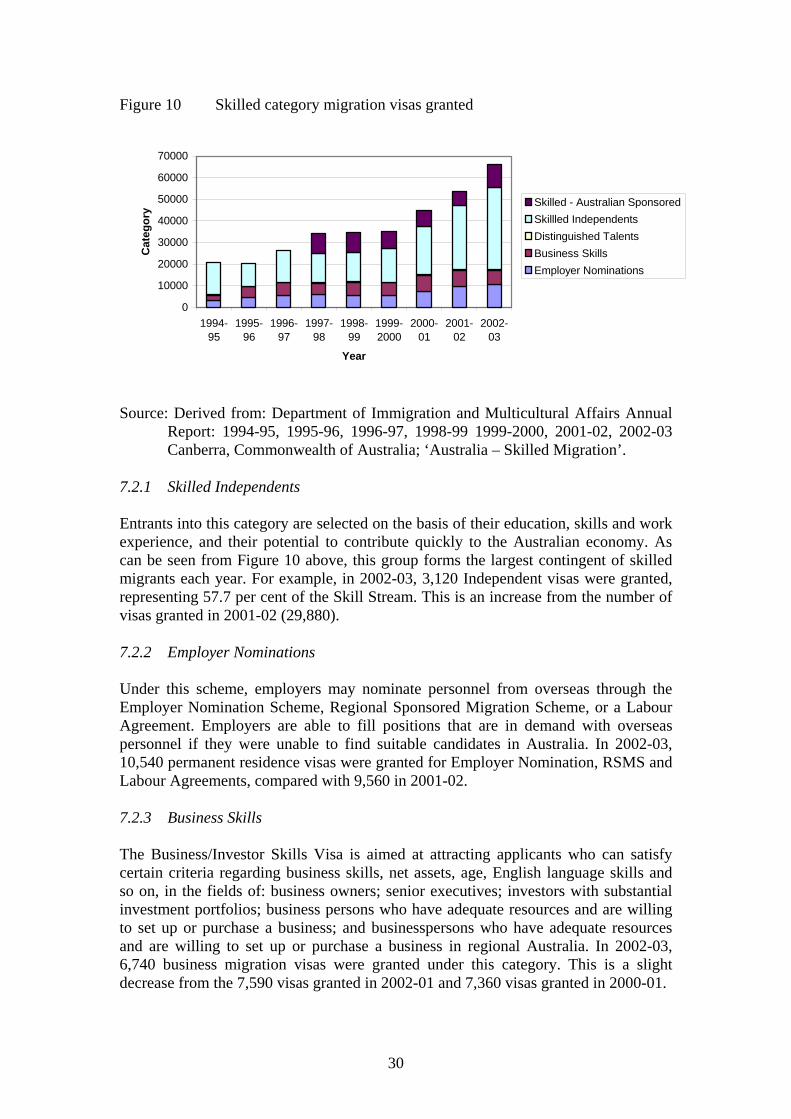
Figure 10 Skilled category migration visas granted
0
10000
20000
30000
40000
50000
60000
70000
1994-95
1995-96
1996-97
1997-98
1998-99
1999-2000
2000-01
2001-02
2002-03
Year
Cat
egor
y
Skilled - Australian SponsoredSkillled IndependentsDistinguished TalentsBusiness SkillsEmployer Nominations
Source: Derived from: Department of Immigration and Multicultural Affairs Annual Report: 1994-95, 1995-96, 1996-97, 1998-99 1999-2000, 2001-02, 2002-03 Canberra, Commonwealth of Australia; ‘Australia – Skilled Migration’.
7.2.1 Skilled Independents Entrants into this category are selected on the basis of their education, skills and work experience, and their potential to contribute quickly to the Australian economy. As can be seen from Figure 10 above, this group forms the largest contingent of skilled migrants each year. For example, in 2002-03, 3,120 Independent visas were granted, representing 57.7 per cent of the Skill Stream. This is an increase from the number of visas granted in 2001-02 (29,880).
7.2.2 Employer Nominations Under this scheme, employers may nominate personnel from overseas through the Employer Nomination Scheme, Regional Sponsored Migration Scheme, or a Labour Agreement. Employers are able to fill positions that are in demand with overseas personnel if they were unable to find suitable candidates in Australia. In 2002-03, 10,540 permanent residence visas were granted for Employer Nomination, RSMS and Labour Agreements, compared with 9,560 in 2001-02.
7.2.3 Business Skills The Business/Investor Skills Visa is aimed at attracting applicants who can satisfy certain criteria regarding business skills, net assets, age, English language skills and so on, in the fields of: business owners; senior executives; investors with substantial investment portfolios; business persons who have adequate resources and are willing to set up or purchase a business; and businesspersons who have adequate resources and are willing to set up or purchase a business in regional Australia. In 2002-03, 6,740 business migration visas were granted under this category. This is a slight decrease from the 7,590 visas granted in 2002-01 and 7,360 visas granted in 2000-01.
31
7.2.4 Distinguished Talent This is the smallest of the skilled category visas, reserved for those with special or unique talents beneficial to Australia. Such people that have been successful under this category include sports people, musicians, artists and designers, whom are all recognised internationally as outstanding in their field. In 2002-03, 180 visas were granted under this category.
7.2.5 Skilled – Australian Sponsored This category was introduced on 1 July 1997 and comprises of migrants who pass a points test on the basis of skill, age, English language ability and family relationship. They must be sponsored by a relative already living in Australia. In 2002-03, 10,470 visas were granted under this category.
7.3 SSMM Visa Grants The State-Specific and Regional Migration has experienced great success since it was introduced, with over 25,000 visas being granted since the introduction of the State-specific and Regional Migration SSRM initiatives. In 2002-03, 7,941 visas were granted under SSRM initiatives, representing an increase of over 90 per cent since 2002-01 (DIMIA 2004a:37). This represents over 12 per cent of the total Skill Stream in 2002-03. The 2002-03 outcome is the highest since the introduction of the initiatives in 1996-97.
8. Shortages of Skilled Labour in Australia: Implications for the Pacific Island Countries
The Australian labour market has been significantly globalised and diversified since the 1980’s. Not surprisingly, the Pacific Island Countries (PICs) have become increasingly important as sources for the Australian labour market. Migrants from these countries to Australia can be used as a proxy to demonstrate the importance of this region as a source for Australian population and thereby labour. Table 6 shows the composition of migrants to Australia by region. Since 1992-93, over the entire period, the importance of the Pacific Island Countries has increased, rising from 12.5 per cent of the total migrant intake in 1992-93 to 17.1 per cent in 2004-05. By contrast, the importance of Southeast Asian and Northeast Asian nations has declined overall, as has the intake from European countries.

32
Table 6 Composition of Migrants to Australia by Region: 1992-93 – 2004-05
REGION YEAR 1992-93 1994-95 2004-2005
PACIFIC ISLAND COUNTRIESA 12.5 15.5 17.1 EUROPE/FRM USSR 29.1 29.2 20.3B MIDDLE EAST & NORTH AFRICA 7.1 8.2 10.5 SOUTH EAST ASIA 18.1 17.0 13.7 NORTH EAST ASIA 16.4 11.3 12.7 SOUTH/CENTRAL ASIA 8.7 8.7 12.8 NORTH AMERICA 2.6 2.9 SOUTH AMERICA 2.0 1.5 3.2C
AFRICA 3.4 5.6 9.0 TOTAL (INCLUDING NOT STATED) 100.0 100.0 100.0 a Pacific Islands Countries figures reflect figures from Oceania countries4 b Data for 2004-05 Europe does not include the former USSR countries. Instead they are included in the total c Figure incorporates both North and South America Source: BIMPR (1995), Australian Immigration Fact Sheet available at
http://www.immi.gov.au/media/fact-sheets/02key.htm#b (accessed 30/1/07). Australia is also assisting these countries to overcome the problem of skill shortages through provision of training and education. Particularly, AusAID is active in these countries in an attempt to enhance the knowledge base of these countries through various programs. It is obvious that many highly educated and skilled Pacific Islanders do not wish to remain in their home countries. Instead they are eager to migrate to Australia and it is impossible to stop them in this era of globalisation from this point of view. From this point of view, both Australia and the PICs compete with each other for skilled labour from the same source. A significant number of Australians also work in the Pacific Island countries most of whom are highly skilled and professional, thus indicating skill shortages in those countries. In particular there has been a net movement out of Australia of managers and administrators, professionals, associate professionals and tradespersons for Papua New Guinea, Solomon Islands and Vanuatu (Table 7). Movements with New Zealand have seen a manager/administrator outflow while inflows are recorded for the other professions. Overall, there has been a net inflow of skilled workers from New Zealand to Australia while outflows are recorded for all other PICs. In aggregate, for 2004-05, Australia experienced a net inflow of 997 skilled workers. This illustrates the proposition that PICs represent an important source of Australian skilled labour while on a micro-level, complementarily Australia provides many skilled workers to the PICs. In this way, Australia helps to relieve some of the skill shortages experienced in various PICs.
4 Australian External Territories, New Zealand, Melanesia (New Caledonia, Papua New Guinea, Solomon Islands, Vanuatu), Micronesia (Guam, Kiribati, Marshall Islands, Micronesia Federated States, Nauru, Northern Mariana Islands, Paulau, Micronesia nfd), Polynesia (Cook Islands, Fiji, French Polynesia, Niue, Samoa, Tokelau, Tonga, Tuvalu, Polynesia (excluding Hawaii) ne)
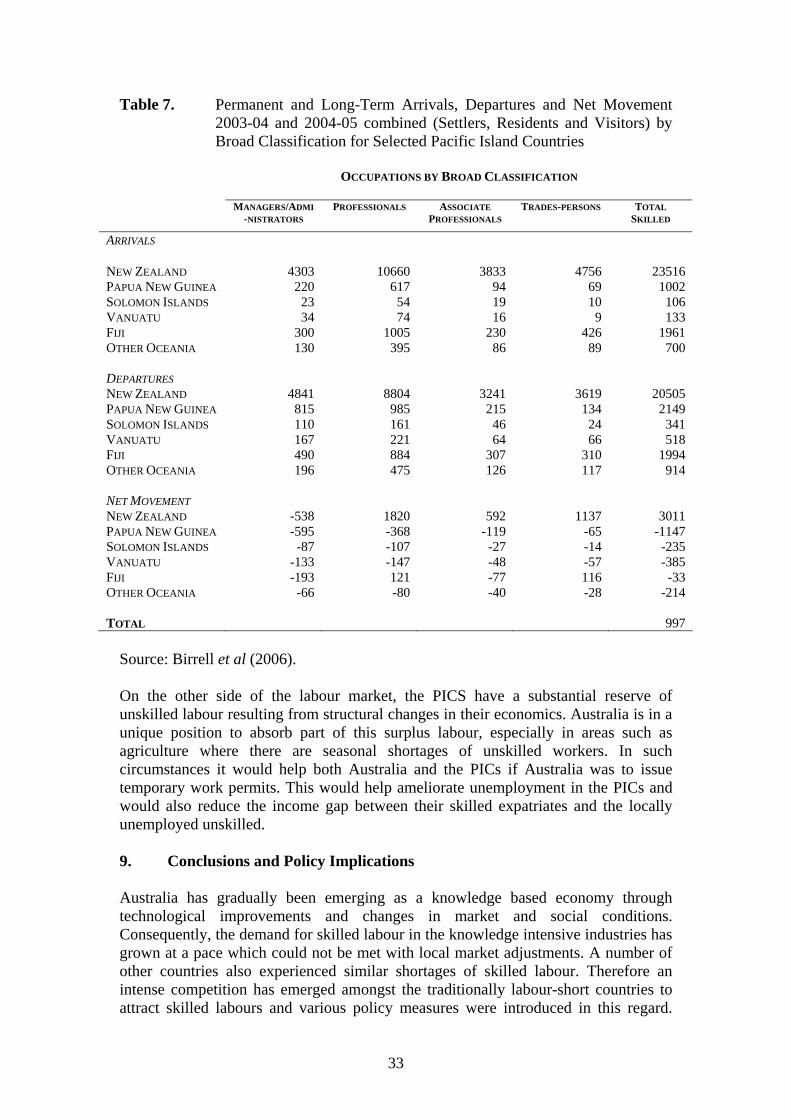
33
Table 7. Permanent and Long-Term Arrivals, Departures and Net Movement 2003-04 and 2004-05 combined (Settlers, Residents and Visitors) by Broad Classification for Selected Pacific Island Countries
OCCUPATIONS BY BROAD CLASSIFICATION
MANAGERS/ADMI
-NISTRATORS PROFESSIONALS ASSOCIATE
PROFESSIONALS TRADES-PERSONS TOTAL
SKILLED
ARRIVALS
NEW ZEALAND PAPUA NEW GUINEA SOLOMON ISLANDS VANUATU FIJI OTHER OCEANIA
4303 220 23 34
300 130
10660 617 54 74
1005 395
3833 94 19 16
230 86
4756 69 10
9 426 89
23516 1002 106 133
1961 700
DEPARTURES NEW ZEALAND PAPUA NEW GUINEA SOLOMON ISLANDS VANUATU FIJI OTHER OCEANIA
4841 815 110 167 490 196
8804 985 161 221 884 475
3241 215 46 64
307 126
3619 134 24 66
310 117
20505 2149 341 518
1994 914
NET MOVEMENT NEW ZEALAND PAPUA NEW GUINEA SOLOMON ISLANDS VANUATU FIJI OTHER OCEANIA TOTAL
-538 -595 -87
-133 -193 -66
1820 -368 -107 -147 121 -80
592 -119 -27 -48 -77 -40
1137 -65 -14 -57 116 -28
3011 -1147
-235 -385 -33
-214
997 Source: Birrell et al (2006). On the other side of the labour market, the PICS have a substantial reserve of unskilled labour resulting from structural changes in their economics. Australia is in a unique position to absorb part of this surplus labour, especially in areas such as agriculture where there are seasonal shortages of unskilled workers. In such circumstances it would help both Australia and the PICs if Australia was to issue temporary work permits. This would help ameliorate unemployment in the PICs and would also reduce the income gap between their skilled expatriates and the locally unemployed unskilled.
9. Conclusions and Policy Implications Australia has gradually been emerging as a knowledge based economy through technological improvements and changes in market and social conditions. Consequently, the demand for skilled labour in the knowledge intensive industries has grown at a pace which could not be met with local market adjustments. A number of other countries also experienced similar shortages of skilled labour. Therefore an intense competition has emerged amongst the traditionally labour-short countries to attract skilled labours and various policy measures were introduced in this regard.

34
With the rise of globalisation and thus multinational companies, transfers of staff within these companies have also contributed to the increase in mobility of highly skilled workers. Many of the countries that have often been thought of as less than developed have experienced growth in technology and knowledge. Such countries include those found in South East Asia and Eastern Europe. They are now fast becoming increasingly knowledge based economies, and thus highly skilled workers might stop flowing out. This puts further pressure on the international demand for highly skilled workers.
Policies implemented across other countries in recent years will provide Australia with competition for highly skilled immigrants. These policies include that of the US Government which has raised the ceiling of skilled immigrants intake, as well as Singapore which has set up an active policy to attract foreign talents from abroad (Mahroum 1999:180)
Policy objectives that were discussed in the OECD seminar in Paris in 2001 regarding the immigration of highly skilled workers in most OECD countries were namely: (i) to respond to cyclical labour market shortages; (ii) to increase the stock of human capital; and (iii) to encourage the circulation of the knowledge embodied in highly skilled workers and promote innovation5.
Results from the papers presented at the OECD seminar6 suggest that in order for a country to be able to compete with overseas nations for the attainment of highly skilled workers it should be able to provide a higher education and research system that is internationalised and which has an environment conducive to entrepreneurship and innovation. Therefore the Australian Government should implement policies aimed at providing internationally competitive universities and research centres in order to attract highly skilled workers in light of keen international competition.
Policy makers in the PICs involved in the international competition for the highly skilled should work together to facilitate the circulation of highly skilled workers whilst generating benefits for the sending and receiving countries, thus ensuring a ‘brain circulation’ rather than a ‘brain drain’ or ‘brain gain’. There appears to be both complimentary and competitive relationships between the Australian and the Pacific Island labour markets. Consideration should be made for a working party consisting of representatives from Australia and the PICS to examine both the complementary and competitive elements in the respective labour markets.
References Auriol, L & J. Sexton (2001), ‘Human Resources in Science Technology: Measurement Issues and
International Mobility’, in OECD, International Mobility of the Highly Skilled, Paris: OECD Publications.
Australian Bureau of Statistics (ABS), Census Data , 1981, 1986, 1991, 1996 and 2001 available from http://www.abs.gov.au
Australian Bureau of Statistics (2003), Migration, Australia, 2000-2002 (Cat. No. 3412.0)
5 See Tremblay (Chap 2), Hugo (Chap 17), Martinelli (Chap 6). 6 See Guellec and Cervantes (Chap 3) in particular.
35
Australia wide Migration Group (AMG) (2001), ‘Immigration Initiatives to Attract IT Experts’, Joint Media Release with Senator Alston and Philip Ruddock MP, 7th November.
Australia wide Migration Group (AMG) (2003a), ‘Overview of Skilled Migration to Australia’ 24/09/2003.
Australianise Migration Group (AMG) (2003b), ‘Minister Promotes Benefits of Skilled Migrants to Top End’, 19/09/2003.
Australia wide Migration Group (AMG) (2004a), ‘Migration to Australia – Assisting Skilled and Business People’, 05/03/2004.
Australia wide Migration Group (AMG) (2004b), ‘Skilled Migration to Australia- Revised MODL’ 15/01/2004.
Baldwin, R. and P. Martin (1999), ‘Two waves of globalisation: superficial similarities, fundamental differences’, NBER Working Paper No. W6904.
Berman E, J. Bound and S. Machin (1998), ‘Implications of Skill-Based Technological Change: International Evidence’, Quarterly Journal of Economics, 113(4), 1245-79.
Birrell, B., V. Rapson, F. Smith (2001), referred to in ‘Australia’s Brain Drain a ‘Myth’’ Asia Times July 18, 2001. Full citation: Birrell, B., V. Rapson, and T.F. Smith, (2006), ‘Skilled Movements in 2004-05 and earlier years’, Department of Immigration, Multicultural Affairs and Citizenship: Canberra Bureau of Immigration, Multicultural and Population Research (BIMPR), (1995), Immigration Update,
June Quarter 1995: Canberra: AGPS
Department of Communications, Information Technology and the Arts (DCITA) (2002), ‘Advancing Australia’, available from: http://www.dcita.gov.au/ie/publications/2002/november/advancing_australia_-_highlights_of_the_information_economy_progress_report_2002, Accessed on 05/09/06.
Department of Foreign Affairs and Trade (DFAT) (2006), ‘Trade in agriculture’, Available from http://www.dfat.gov.au/trade/negotiations/trade_in_agriculture.html, Accessed 05/09/06.
Department of Immigration and Multicultural and Indigenous Affairs (DIMIA) (1987), Understanding Immigration, Canberra: Australian Government Publishing House.
Department of Immigration and Multicultural and Indigenous Affairs (DIMIA) (2001a), ‘Fact Sheet 1 – ‘Immigration - The Background’’, Available from: http://www.immi.gov.au/media/fact-sheets/01backgd.htm, Accessed on 04/11/01.
Department of Immigration and Multicultural and Indigenous Affairs (DIMIA) (2001b), Immigration: Federation to Century's End, Canberra: Commonwealth of Australia.
Department of Immigration and Multicultural and Indigenous Affairs (DIMIA) (2002a), Annual Report 2001-02, Canberra: Commonwealth of Australia.
Department of Immigration and Multicultural and Indigenous Affairs (DIMIA) (2002b), Population
Flows: Immigration Aspects 2001 edition, AGPS Canberra.
Department of Immigration & Multicultural and Indigenous Affairs (DIMIA) (2003a), ‘Fact Sheet 5 – ‘Emigration from Australia’’, Available from: http://www.immi.gov.au/media/fact-sheets/05emigration.htm, Accessed on: 18/11/03.

36
Department of Immigration and Multicultural and Indigenous Affairs (DIMIA) (2003b), ‘Fact Sheet 26: ‘State/Territory Specific Migration’’, Available from: http://www.immi.gov.au/media/fact-sheets/26state.htm, Accessed on 27/11/03.
Department of Immigration and Multicultural and Indigenous Affairs (DIMIA) (2003c), ‘Fact Sheet 2 – ‘Key Facts in Immigration’’, Available from: http://www.immi.gov.au/media/fact-sheets/02key.htm, Accessed on: 01/12/03.
Department of Immigration and Multicultural and Indigenous Affairs (DIMIA) (2004a), Population Flows: Immigration Aspects 2002-03 edition, AGPS Canberra
Department of Immigration and Multicultural and Indigenous Affairs (DIMIA) (2004b), ‘Fact Sheet 15 –‘Population Projections’’, Available from: http://www.immi.gov.au/media/fact-sheets/15population.htm, Accessed on: 22/01/04.
Dollar, D. and A. Kraay (2001), Trade, Growth and Poverty, Paper Presented to the WIDER Conference on ‘Growth and Poverty’ Available from: http://www.wider.unu.edu/ conference-2001-1/dollar%20kraay.pdf, Accessed on: 22/04/2004.
Economist Intelligence Unit (EIU) (2003), ‘The 2003 e-Readiness Rankings’, Available from: www-1.ibm.com/services/au/index.wss/ibvstudy/igs/a1006351?cntxt=a1005069, Accessed on 05/09/06.
Guellec, D. and M. Cervantes (2002), ‘International Mobility of Highly Skilled Workers: From Statistical Analysis to Policy Formulation’, in OECD, International Mobility of the Highly Skilled, Paris: OECD Publications.
Gaillard, A.M. (2002), ‘The mobility of human resources in science and technology in Sweden’, in OECD, International Mobility of the Highly Skilled, Paris: OECD Publications.
Hugo, G. (1985), Some Demographic Aspects of the Australian workforce in the early 1980’s, Bedford Park SA, National Institute of Labour Studies Flinders University of South Australia
Hugo, G. (1994), The Economic and Social Impacts of Emigration on Australia Canberra: AGPS.
Hugo, G. (1999), ‘A New Paradigm of International Migration in Australia’, New Zealand Population Review, 25(1-2), 1-39.
Hugo, G. (2002), ‘Migration Policies Designed to Facilitate the Recruitment of Skilled Workers in Australia’, in OECD, International Mobility of the Highly Skilled, Paris: OECD Publications.
Hugo, G., D. Rudd and K. Harris (2001), Emigration from Australia: Economic Implications, Centre for the Economic Development of Australia (CEDA) Information Paper No. 77.
James, J. (2002), Technology, Globalization and Poverty, UK:Edward Elgar Publishing Ltd
Johnson, JM and M. Regets (1998), ‘International Mobility of Scientists and Engineers to the US- Brain Drain or Brain Circulation?’, NSF Issue Brief, 98.
Keely, C. (2001), ‘International Personnel Movement and the Emergence of an International Migration Regime’, in M A B Siddique (ed.), International Migration into the 21st Century: Essays in Honour of Reginald Appleyard, London: Edward Elgar Publishing Limited, pp. 262-74.
Krugman, P.R. and M. Obstfeld (2006), International Economics: Theory & Policy, 7th ed, Boston: Pearson Addison Wesley.
Lam, J (2000), ‘Shortage of Highly Skilled Workers in Hong Kong and Policy Responses’, Journal of International Migration and Integration, 1(4).

37
Lewis, P., A. Garnett, P. Drake, J. Juttner, K. Norris and M. Treadgold (1998), Issues, Indicators and Ideas, Melbourne: Longman.
Machin, S. and J Van Reenen (1998), ‘Technology and Changes in Skill Structure: Evidence from Seven OECD Countries’, Quarterly Journal of Economics, 113 (4), pp. 1215-1244
Mahroum, S. (1999), ‘Highly Skilled Globetrotters: The International Migration of Human Capital’ Seville, Institute for Prospective Technological Studies Joint Research Centre of the European Commission, pp 168-85.
Marinelli, D. (2002), ‘A brain drain among young PhDs: mirage or reality?’, in OECD, International Mobility of the Highly Skilled, Paris: OECD Publications.
Murphy, K M and Welch, F. (1993), ‘Industrial Change and the Rising Importance of Skill’, in S. Danziger and P. Gottschalk (eds), Uneven Tides: Rising Inequality in the 1980s, Russell Sage Foundation Press, pp. 101-32.
Nayyar, D. (1998), Globalisation: The Past in our Present, Malaysia: Third World Network
Norris, K., R. Kelly and M. Giles (2005), Economics of Australian Labour Markets, Frenchs Forest: Pearson.
OECD (2001), International Mobility of the Highly Skilled, proceedings of the seminar on International Mobility of Highly Skilled Workers: From Statistical Analysis to the Formulation of Policies, held in Paris 11-12 June, 2001.
O’Rourke, K. and J. Williamson (1999), ‘The Heckscher-Ohlin model between 1400 and 2000: when it explained factor price convergence and when it did not, and why’, NBER Working Paper 7411. Reyes, G.E. (2001), ‘Theory of Globalization: Fundamental Basis’ available from http://sincronia.cucsh.udg.mx/globaliz.htm, accessed on 4/02/2007 Round, J. and J. Whalley (2003), Globalisation and Poverty: Implications of South Asian Experience
for the Wider Debate. Available from: http://www.gapresearch.org/production/JJoverview.pdf, accessed on: 18/04/2004.
Rosenberg, J. (2000), The Follies of Globalisation Theory, London
Scholte, J.A. (2000), Globalization: A Critical Introduction, New York: St Martin’s Press.
Secretariat to the Committee to Advise on Australia’s Immigration Policies (SCAAIP) (1987), Understanding Immigration, AGPS, Canberra.
Skotnicki, T (2003), ‘Give Me Your Highly Skilled’ Business Review Weekly April 24-30 2003, pg 18.
Tremblay, K. (2002), ‘Student mobility between and towards OECD countries: a comparative analysis’, in OECD, International Mobility of the Highly Skilled, Paris: OECD Publications.
International Bank for Reconstruction and Development (World Bank), World Development Indicator (WDI), available from http://devdata.worldbank.org/dataonline/