
Global Wind Energy Outlook | 2014
60
GLOBAL WIND ENERGY OUTLOOK | 2014 OCTOBER 2014
Transcript of Global Wind Energy Outlook | 2014
1C H A P T E R T I T L E
GLOBAL WIND ENERGY OUTLOOK | 2014
OCTOBER 2014
2 GLOBAL WIND ENERGY OUTLOOK | 2014
1 Momentum
for Change? � � � � � � � � � � � � � � � � � � � � � � � � � � �4
2 The Global Wind Energy
Outlook Scenarios � � � � � � � � � � � � � � � � � � � � � 8
Three visions of the future � � � � � � � � � � � � � � � � � � � � � �9
IEA New Policies scenario � � � � � � � � � � � � � � � � � � � � � �9
GWEO Moderate scenario � � � � � � � � � � � � � � � � � � � � � �9
GWEO Advanced scenario � � � � � � � � � � � � � � � � � � � � � 10
Global scenario results � � � � � � � � � � � � � � � � � � � � � � � 10
Global cumulative wind power capacity� � � � � � � � � � � � � � 10
Capacity growth� � � � � � � � � � � � � � � � � � � � � � � � � � � 11
Regional breakdown: New Policies scenario� � � � � � � � � � � � 12
Regional breakdown: Moderate scenario � � � � � � � � � � � � � 13
Regional breakdown: Advanced scenario � � � � � � � � � � � � � 13
Production and share of electricity supply � � � � � � � � � � � � 13
Wind power share of global electricity demand � � � � � � � � � 14
Specific costs per kilowatt installed � � � � � � � � � � � � � � � � 14
Projections for electricity demand development � � � � � � � � � 15
Investment and employment � � � � � � � � � � � � � � � � � � � 18
Annual CO2 emissions reductions � � � � � � � � � � � � � � � � � 21
Cumulative CO2 emissions reductions � � � � � � � � � � � � � � 21
Annual and cumulative CO2 emissions reductions � � � � � � � � 21
Research background � � � � � � � � � � � � � � � � � � � � � � � � 22
Regional breakdown of cumulative capacity up to 2030� � � � � 24
3 The Regional Scenario
Results � � � � � � � � � � � � � � � � � � � � � � � � � � � � 26
Africa� � � � � � � � � � � � � � � � � � � � � � � � � � � � � � � � � 27
China� � � � � � � � � � � � � � � � � � � � � � � � � � � � � � � � � 30
Eastern Europe/Eurasia � � � � � � � � � � � � � � � � � � � � � � � 33
India � � � � � � � � � � � � � � � � � � � � � � � � � � � � � � � � � 36
Latin America � � � � � � � � � � � � � � � � � � � � � � � � � � � � 38
Middle East � � � � � � � � � � � � � � � � � � � � � � � � � � � � � 41
Non-OECD Asia � � � � � � � � � � � � � � � � � � � � � � � � � � � 44
OECD Europe � � � � � � � � � � � � � � � � � � � � � � � � � � � � 47
OECD Pacific � � � � � � � � � � � � � � � � � � � � � � � � � � � � 51
OECD North America � � � � � � � � � � � � � � � � � � � � � � � � 53
Annex table � � � � � � � � � � � � � � � � � � � � � � � � � � � � � 57
TA B L E OF C ON T E N T S
3GLOBAL WIND ENERGY OUTLOOK | 2014
F OR E W OR D
The Global Wind Energy Council and Greenpeace International are pleased to present this fifth
edition of the Global Wind Energy Outlook for 2014, the latest product of a collaboration that goes back to 1999. A lot has changed since then.
Wind power has now firmly established itself as a mainstream option for new electrical generation� The most remarkable recent development is that in an increasing number of markets, wind power is the least cost option when adding new generation capacity to the grid, and prices continue to fall� There are now commercial wind power installations in more than 90 countries with total installed capacity of 318 GW at the end of 2013, providing about 3% of global electricity supply last year�
While this is an amazing success story, it is also the case that due to a combination of the various manifestations of the economic crisis, low or negative demand growth in the OECD economies, and policy instability in key markets, growth has been essentially flat for the last four years� The last significant jump in annual market size was in 2009, when the market grew by over 40% in comparison with 2008, to just over 38 GW� Since then, it has hovered around the 40 GW mark, with major ups and downs in the US, an end to the exponential growth in the Chinese market and little or no growth in Europe�
However, the Chinese market has recovered and posted strong (25%) growth in 2013; the US market seems to be back on track for 2014 and 2015 at least, and it seems as though the Indian market is ready to start growing again and beginning to realize its potential in that market which so desperately needs new electricity supply�
The most exciting areas of new growth are in Brazil, Mexico and South Africa� The Brazilian industry is set to install nearly 4 GW in 2014 alone; energy reform in Mexico has set that country on course for a ~2GW/annum market for the next 10 years; and South Africa will rack up impressive numbers in 2014, which we believe is just the beginning of major developments across Africa� 2014 should be a pretty good year�
But the Global Wind Energy Outlook isn’t about 2014 or 2015� It’s about what the industry will look like in 2020, 2030 and beyond� There is much that we don’t know about the future, and there will no doubt be unforeseen shifts and shocks in the global economy as well as political ups and downs; and no one knows whether or not the global community is
going to respond proactively to the threat of climate change, or try to do damage control after the fact� But it seems clear that for all of the reasons that wind power has gotten to where it is today, it will play a significant and growing role in our electricity supply�
As in previous editions, we use the International Energy Agency’s World Energy Outlook as a baseline for comparability purposes, in terms of regions, projected GDP and population growth, the development of electricity demand, etc� We use their ‘New Policies scenario’ which has now become the central scenario for the World Energy Outlook�
We examine three development paths for the industry: the IEA New Policies scenario, the GWEO Moderate scenario and the GWEO Advanced scenario� These are measured against two different demand scenarios: that contained within the IEA study, and an Energy Efficiency demand scenario� We hope that you find it useful�
Steve SawyerSecretary GeneralGlobal Wind Energy Council
Klaus RaveChairmanGlobal Wind Energy Council
Sven TeskeDirector, Renewable EnergyGreenpeace International
› In an increasing number of markets, wind power is now the least cost option when adding new capacity to the grid, and prices continue to fall. ‹
4 GLOBAL WIND ENERGY OUTLOOK | 2014
1 SPEC I A L F O C U S
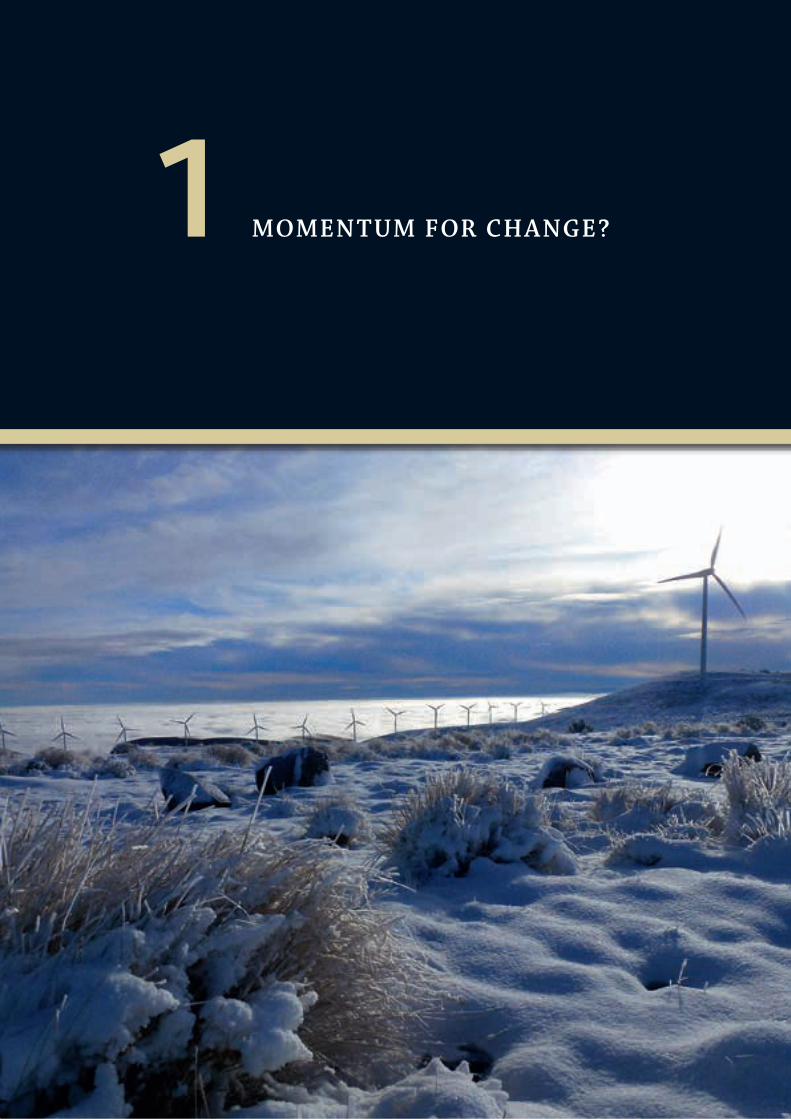
1 MOM E N T U M F OR C H A N G E ?
5GLOBAL WIND ENERGY OUTLOOK | 2014
1MOM E N T U M F OR C H A N G E ?
A fter the collapse of the last Big Climate Summit in Copenhagen in 2009, for
many if not most people the climate issue was ‘over’, or at least the hope of serious action by governments was over. Fatigue, shattered expectations, disappointment and despair drove away all but the scientists, hard-core activists and civil servants whose job it is to keep the talks going.
But climate change is back – bigger and badder than ever, and we have an opportunity to make a big step forward in the run up to the next Big Summit in Paris in December 2015� It’s urgent that we get it right this time�
For those who don’t have the patience to plow through the Intergovernmental Panel on Climate Change’s latest assessment report
– it’s 5th since 1990 – you don’t have to go any further than your local newspaper, or your favorite web page:
‘Super typhoon’ Haiyan which wrought devastation in the Philippines;
Hurricane Sandy which put lower Manhattan out of business;
Frightening new evidence about the instability and vulnerability of the Greenland ice sheet, whose collapse would cause seven meters of global sea level rise, at the end of the day. Goodbye London, New York, Shanghai, Tokyo…
Projections of extreme weather damage of one trillion USD/year by mid-century;
…the list goes on� Oh, and California’s Central Valley is out of water� That’s right - out of water� There are communities that haven’t had water running in their taps for five months now - can’t flush their toilets; no showers� For the moment, they’re getting their drinking water from the fire department, although it’s not clear how much longer that will last�
The 400,000 people who marched in the run up to UN Secretary General Ban Ki-moon’s Climate Summit in New York in September have gotten the message� So have the many
major corporations who were reported to have pounded the table behind closed doors in New York demanding action; and so have the struggling farmers in India, sub-Saharan Africa, California and Australia�
RETOOLING JUST ABOUT THE ENTIRETY OF HUMAN CIVILIZATION
The good news is that unlike 25 years ago when the climate issue first emerged, and indeed even unlike five years ago in Copenhagen, we have the technology to solve the problem, and to do so cost effectively� “It doesn’t cost the earth to save the planet”, said IPCC Working Group III Chairman Ottmar Edenhofer when unveiling the IPCC’s latest work on climate mitigation� Wind and solar are taking over the power sector� Electric mobility and improved battery technology is on the rise� Improved materials science, energy efficiency equipment and practices, and an almost inexhaustible list of other technologies and innovation have given us the tools we need, or at least most of them; and the rest can be picked up along the way�
Not to say that it’s going to be easy – we’re talking about retooling just about the entirety of human civilization in the next 40 years – which, by the way, we’re probably going to do anyway; the question is whether we do it right this time, at least in terms of the climate�
The much greater obstacle lies in the political, economic and institutional inertia which have bogged down the discussion for too long now� The fossil fuel industry, the most powerful vested interest in the world today, continues to do everything it can to obfuscate the science and slow down political progress� Not their least pernicious influence is on the politicians they own, particularly those in the US Congress
– and in the places where the fossil fuel industry is a family business masquerading as a national government in the Persian Gulf – and in the places where fossil fuel exports have become a blunt political and military instrument to bludgeon recalcitrant neighbours into submission�
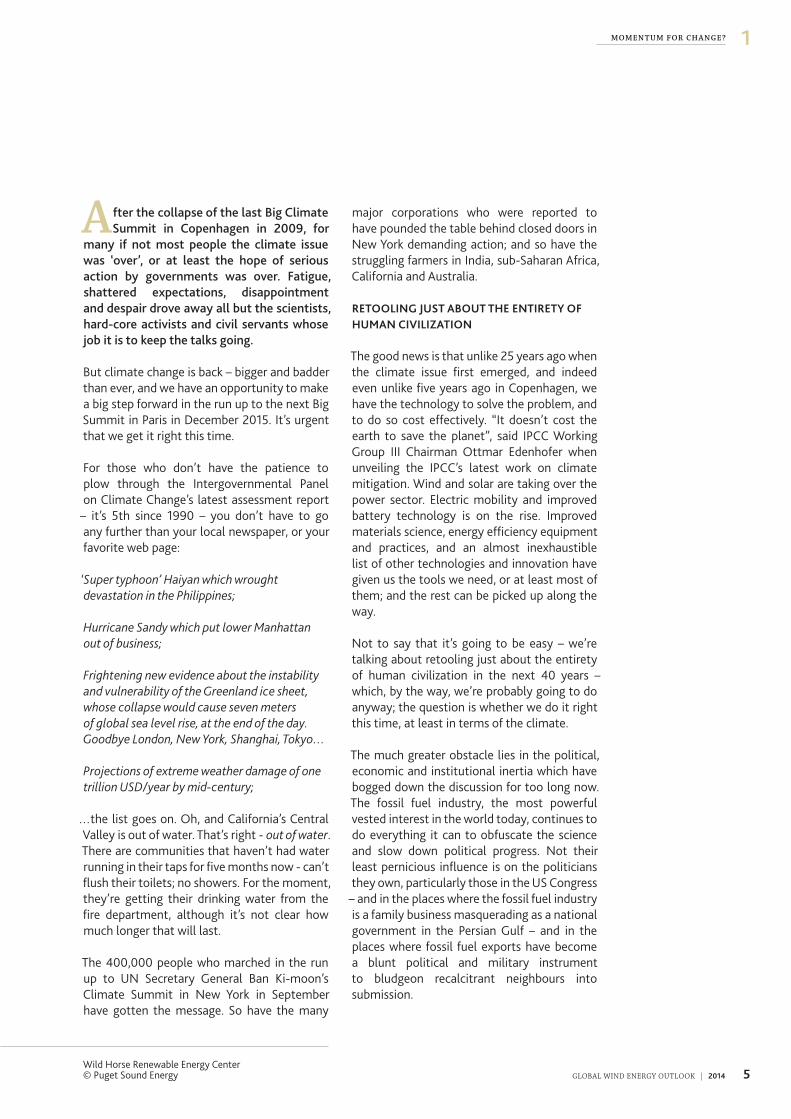
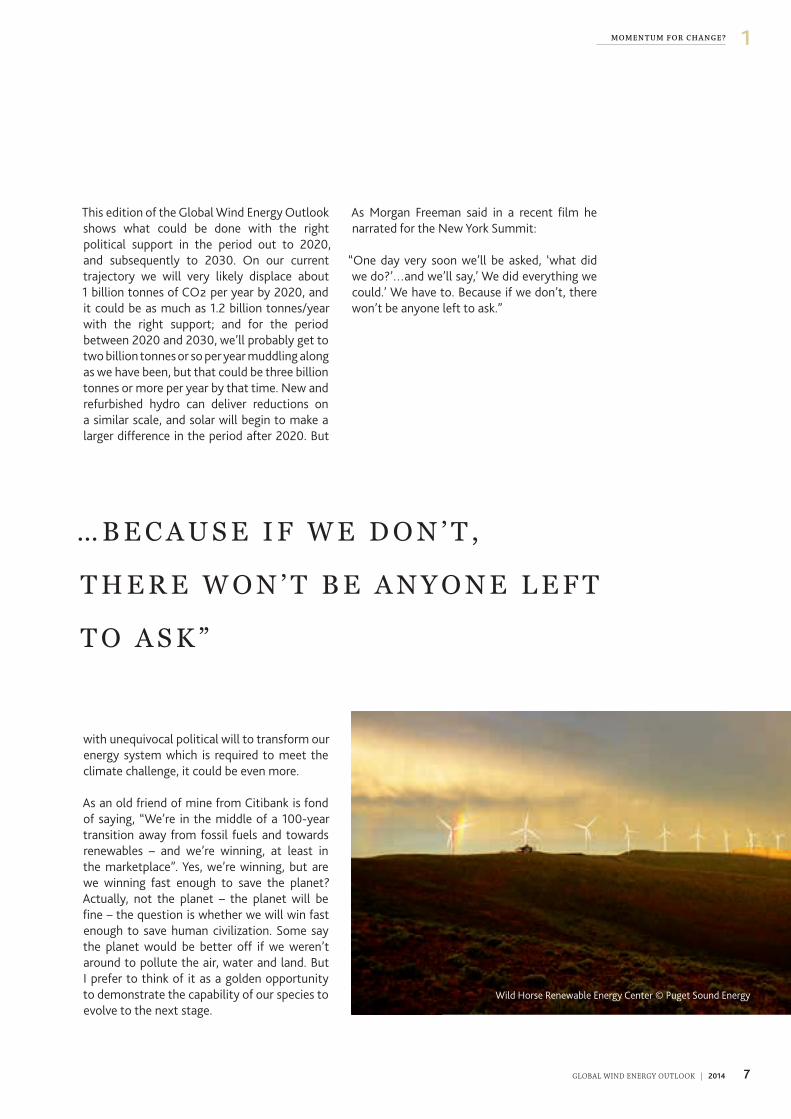
Wild Horse Renewable Energy Center © Puget Sound Energy
6 GLOBAL WIND ENERGY OUTLOOK | 2014
1 MOM E N T U M F OR C H A N G E ?
› The dramatic progress of wind and solar technologies over the past decades has brought us to the point where the vision of a clean sustainable energy future is well within reach. ‹
But we have a chance to change all that� The dramatic progress of wind and solar technologies over the past decades have brought us to the point where the vision of a clean sustainable energy future for our whole economy is well within reach, and has become the explicit policy direction of an increasing number of countries�
Further, for those who attended the march in New York and the subsequent summit, there is once again a positive feeling, a palpable momentum for change� The trick will be to turn that into instructions from politicians to their civil servants, including but not limited
to those who are negotiating towards Paris in 2015� At the end of the day, it is governments which will set the frameworks at national and international level; who determine the extent to which we can succeed in the time required�
For time is the one thing we don’t have – not much, anyway� All of the science indicates global emissions need to peak in the next five years if we are to have any reasonable chance of avoiding the worst ravages of man-made climate change, i�e�, keeping global mean temperature rise below 2°C above pre-industrial levels� Or, if you happen to depend upon a vulnerable coral reef ecosystem, if you have extensive low-lying coastal territory, or if you live on a low lying island in the Pacific, Caribbean or Indian Ocean, then you’d prefer
that global mean temperature rise be kept below 1�5°C�
To preserve a chance to reach either of those targets, then there is one clear and immediate imperative: global emissions must peak and begin to decline before the end of this decade
– which is not impossible, but it’s getting increasingly difficult; and the longer we wait the more expensive it will be�
The power sector isn’t the whole problem, but it is the largest single contributor to global greenhouse gas emissions – about 40% of energy related CO2 emissions, and about 25%
of overall greenhouse gas emissions� If we want to make a difference in that sector in the next 5-10 years, then we don’t have a lot of options� First and foremost, we need massive and rapid implementation of existing energy efficiency and energy saving technologies and practices, which will yield the greatest benefit in the shortest period of time� Secondly, no new coal plants should be built, and fuel-switching from coal to gas should be implemented wherever possible� And finally, continue and accelerate the dramatic growth of renewable generation technologies
– and although solar makes a significant contribution in the period after 2020, and may be the largest energy source of all by 2050, in the next 5 to 10 years the big contribution to emission reductions will come from hydro and wind� That’s what we should focus on�
“ T H E L O N G E R W E W A I T
T H E M O R E E X P E N S I V E
I T W I L L B E …
7GLOBAL WIND ENERGY OUTLOOK | 2014
1MOM E N T U M F OR C H A N G E ?
This edition of the Global Wind Energy Outlook shows what could be done with the right political support in the period out to 2020, and subsequently to 2030� On our current trajectory we will very likely displace about 1 billion tonnes of CO2 per year by 2020, and it could be as much as 1�2 billion tonnes/year with the right support; and for the period between 2020 and 2030, we’ll probably get to two billion tonnes or so per year muddling along as we have been, but that could be three billion tonnes or more per year by that time� New and refurbished hydro can deliver reductions on a similar scale, and solar will begin to make a larger difference in the period after 2020� But
with unequivocal political will to transform our energy system which is required to meet the climate challenge, it could be even more�
As an old friend of mine from Citibank is fond of saying, “We’re in the middle of a 100-year transition away from fossil fuels and towards renewables – and we’re winning, at least in the marketplace”� Yes, we’re winning, but are we winning fast enough to save the planet? Actually, not the planet – the planet will be fine – the question is whether we will win fast enough to save human civilization� Some say the planet would be better off if we weren’t around to pollute the air, water and land� But I prefer to think of it as a golden opportunity to demonstrate the capability of our species to evolve to the next stage�
As Morgan Freeman said in a recent film he narrated for the New York Summit:
“One day very soon we’ll be asked, ‘what did we do?’…and we’ll say,’ We did everything we could�’ We have to� Because if we don’t, there won’t be anyone left to ask�”
… B E C A U S E I F W E D O N ’ T ,
T H E R E W O N ’ T B E A N Y O N E L E F T
T O A S K ”
Wild Horse Renewable Energy Center © Puget Sound Energy
8 GLOBAL WIND ENERGY OUTLOOK | 2014
C H A P T E R T I T L E12 T H E G L OB A L W I N D E N E RG Y O U T L O OK SC E N A R IO S
2 T H E G L OB A L W I N D E N E RG Y O U T L O OK S C E N A R IO S
9GLOBAL WIND ENERGY OUTLOOK | 2014
2T H E G L OB A L W I N D E N E RG Y O U T L O OK SC E N A R IO S
› Broader range of governments will have to begin to respond to the increasing imperative for the energy security and price stability offered by wind energy. ‹
THREE VISIONS OF THE FUTURE
The Global Wind Energy Outlook explores the future of the wind energy industry
out to 2020, 2030 and up to 2050. With the International Energy Agency’s New Policies scenario from the World Energy Outlook as a baseline, we have developed two scenarios especially for this publication: the GWEO Moderate scenario and the GWEO Advanced scenario.
The GWEO Moderate and Advanced scenarios have evolved over the years as a collaboration between the Global Wind Energy Council, Greenpeace International and the German Aerospace Centre (Deutsches Zentrum fur Luft-und-Raumfahrt – DLR)� These scenarios for the future of the wind industry have contributed to an ongoing series of broader studies on global sustainable energy pathways up to 2050 conducted by DLR and Greenpeace in collaboration with a number of industry associations including GWEC� The ‘Energy [R]evolution’ scenario’, or ‘2° Scenario’, has become one of the benchmarks in international energy scenario discussions, utilized by the IPCC, IEA and others�1
The upheaval in electricity markets around the globe, the wild swings in policy both in favor of and against renewable energy deployment and the uncertain future of the global climate regime make predictions about the future of this or any other industry even more difficult than usual� However, it is also the case that as wind power plays a more and more central role in our electricity system, that the various scenarios from industry, the IEA, NGOs and others all begin to converge� Here we present each of the three scenarios for each of the 10 IEA-defined regions as well as global totals, looking towards 2020 and 2030 – with longer term projections out to 2050 in the Annex table� A brief description of the underlying assumptions and orientation of each scenario is listed below�
IEA NEW POLICIES SCENARIO
Originally, we used the IEA World Energy Outlook’s ‘Reference’ scenario as the baseline for this exercise� However, that scenario has been renamed the ‘Current Policies’ scenario and is no longer the central scenario against which variations are tested within the WEO framework, as it is clear that continuing the status quo is unlikely in the extreme�
The ‘New Policies’ scenario is based on an assessment of current directions and intentions of both national and international energy and climate policy, even though they may not yet have been incorporated into formal decisions or enacted into law� Examples of this would include the emissions reduction targets adopted in Cancun in 2010, the various commitments to renewable energy and efficiency at national and regional levels, and commitments by governments in such fora as the G-8/G-20 and the Clean Energy Ministerial� The New Policies scenario is now at the center of the WEO analysis; the version which appears in the 2013 WEO runs out to 2035 and we have extrapolated it out to 2050 for comparison purposes�
GWEO MODERATE SCENARIO
The GWEO ‘Moderate’ scenario has many of the same characteristics as the IEA New Policies scenario, taking into account all policy measures to support renewable energy either already enacted or in the planning stages around the world, and at the same time assuming that the commitments for emissions reductions agreed by governments at Cancun will be implemented, although on the modest side� At the same time it takes into account existing and planned national and regional targets for the uptake of renewable energy in general and wind energy in particular, and assumes that they are in fact met�
Through the five year period out to 2018, the Moderate scenario is very close to our annual five year market forecast, based on industry orders and planning as well as intelligence from our global network about new and emerging markets�
Rio do Fogo, Brazil © Wind Power Works
1 See http://www�energyblueprint�info
10 GLOBAL WIND ENERGY OUTLOOK | 2014
T H E G L OB A L W I N D E N E RG Y O U T L O OK SC E N A R IO S2
› As wind power plays a more and more central role in our electricity system, the various scenarios from industry, the IEA, NGOs and others all begin to converge. ‹
After 2018 it is difficult to make a precise forecast given the current set of global uncertainties, but at that stage we assume that a broader range of governments will have begun to respond to the increasing imperative for the energy security and price stability offered by wind energy, as the LCOE of wind continues to come down and the price of conventional generation continues to go up� Further, it is expected that there will be the beginnings of some sort of response to whatever is agreed in UNFCCC climate change process which peaks in Paris in December 2015�
GWEO ADVANCED SCENARIO
The ‘Advanced’ scenario is the most ambitious, and outlines the extent to which the wind industry could grow in a best case ‘wind energy vision’, but still well within the capacity of the industry as it exists today and is likely to grow in the future� It assumes an unambiguous commitment to renewable energy in line with industry recommendations, the political will
to commit to appropriate policies and the political stamina to stick with them�
It also assumes that governments enact clear and effective policies on carbon emission reductions in line with the now universally agreed objective of keeping global mean temperature rise below 1�5-2°C above pre-industrial temperatures� Wind power is an absolutely critical technology to meeting the first objective in that battle - which is getting global emissions to peak and begin to decline before the end of this decade�
GLOBAL SCENARIO RESULTS
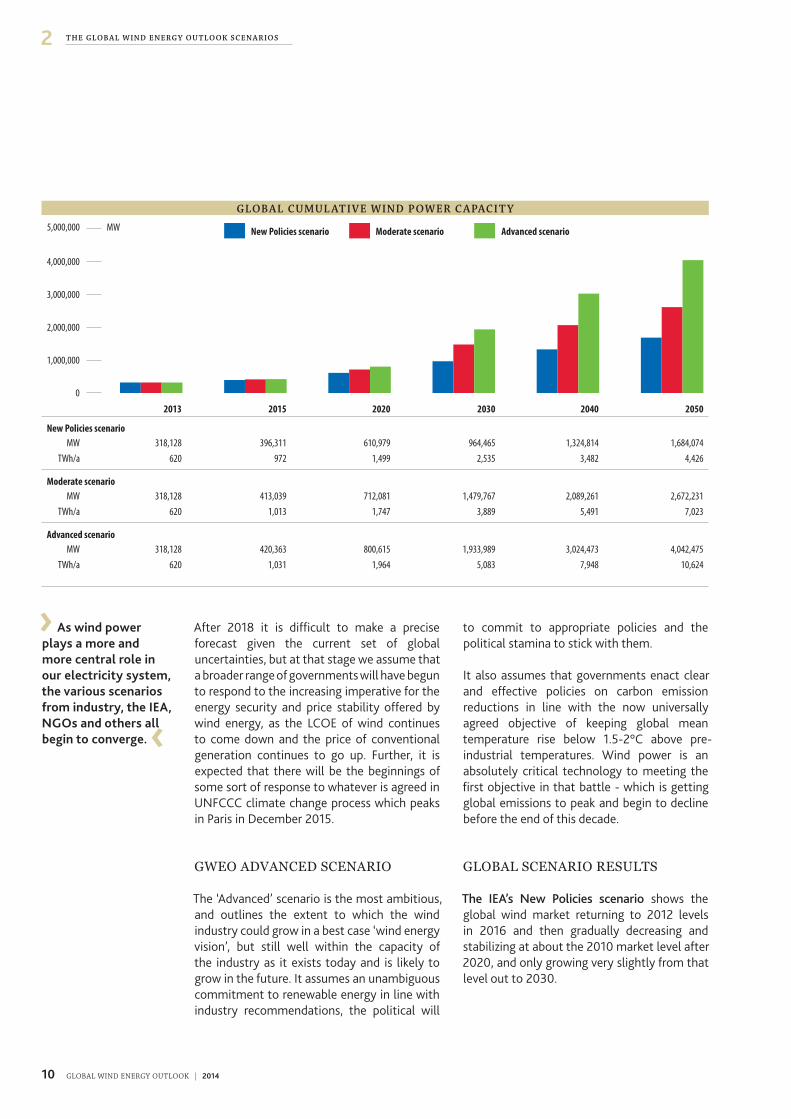
The IEA’s New Policies scenario shows the global wind market returning to 2012 levels in 2016 and then gradually decreasing and stabilizing at about the 2010 market level after 2020, and only growing very slightly from that level out to 2030�
G L OB A L C U M U L AT I V E W I N D P O W E R C A PAC I T Y
0
1,000,000
2,000,000
3,000,000
4,000,000
5,000,000 Advanced scenarioModerate scenarioNew Policies scenario
205020402030202020152013
MW
2013 2015 2020 2030 2040 2050
New Policies scenarioMW 318,128 396,311 610,979 964,465 1,324,814 1,684,074
TWh/a 620 972 1,499 2,535 3,482 4,426
Moderate scenarioMW 318,128 413,039 712,081 1,479,767 2,089,261 2,672,231
TWh/a 620 1,013 1,747 3,889 5,491 7,023
Advanced scenarioMW 318,128 420,363 800,615 1,933,989 3,024,473 4,042,475
TWh/a 620 1,031 1,964 5,083 7,948 10,624
11GLOBAL WIND ENERGY OUTLOOK | 2014
2T H E G L OB A L W I N D E N E RG Y O U T L O OK SC E N A R IO S
› Under the Advanced scenario, wind power could reach nearly 2,000 GW by 2030, supply between 16.7-18.8% of global electricity and help save over 3 billion tons of CO2 emissions annually. ‹
The GWEO scenarios paint a picture of two different futures:
The Moderate scenario reflects a world which carries on more or less the way it has for the past decade, with wind power continuing to gain ground but still struggling against heavily subsidized incumbents; without a comprehensive or cohesive carbon market, and with those that exist at very low prices� Policy instability decreases, but is still a factor, although the competition in OECD markets for a larger share of a stable or dwindling pie is intense�
The Advanced scenario shows the potential of wind power to produce 25-30% of global electricity demand by the end of the scenario period, where there is a strong international political commitment towards meeting climate goals and national energy policy is driven by the need for enhanced energy security, price stability, job creation and the need to conserve our precious fresh water resources� Which future shall it be?
CAPACITY GROWTH
ASSUMPTIONS ON GROWTH RATES
Growth rates in the GWEO scenarios are based on a combination of historical trends, current and planned policies, new and emerging markets for wind power, and assumptions on the direction of overall climate and energy policy� While the double-digit growth rates assumed in both the Moderate and Advanced scenarios out to 2020 may seem high for a manufacturing industry, actual wind industry cumulative growth rates have averaged about 26% for the past eighteen years� Interestingly, annual market growth rates over that same period are only a bit less, about 23%, although the inter-annual variability is much higher due to the vicissitudes of the marketplace and the state of the global economy� The cumulative market growth figures are a more useful way to look at the industry over the longer term�
The Moderate scenario starts with about 14% growth in 2014, tapering off gradually to 10% by 2020 and then also to 6% by 2030, while the IEA New Policies scenario starts at 12% in 2014, sinking to 7% by 2020 and then to 4% by 2030�
In the Advanced scenario, cumulative growth rates start off well below the historical average at 15%, remain steady in the middle of this decade and then taper off to 13% by the end of the decade, dropping to 6% by 2030�
It should be borne in mind that cumulative market growth figures will inevitably drop over time in almost any scenario as the size of the cumulative market grows; although even small percentage increases a decade out from now will mean a large actual increase in the quantity of wind power deployed�
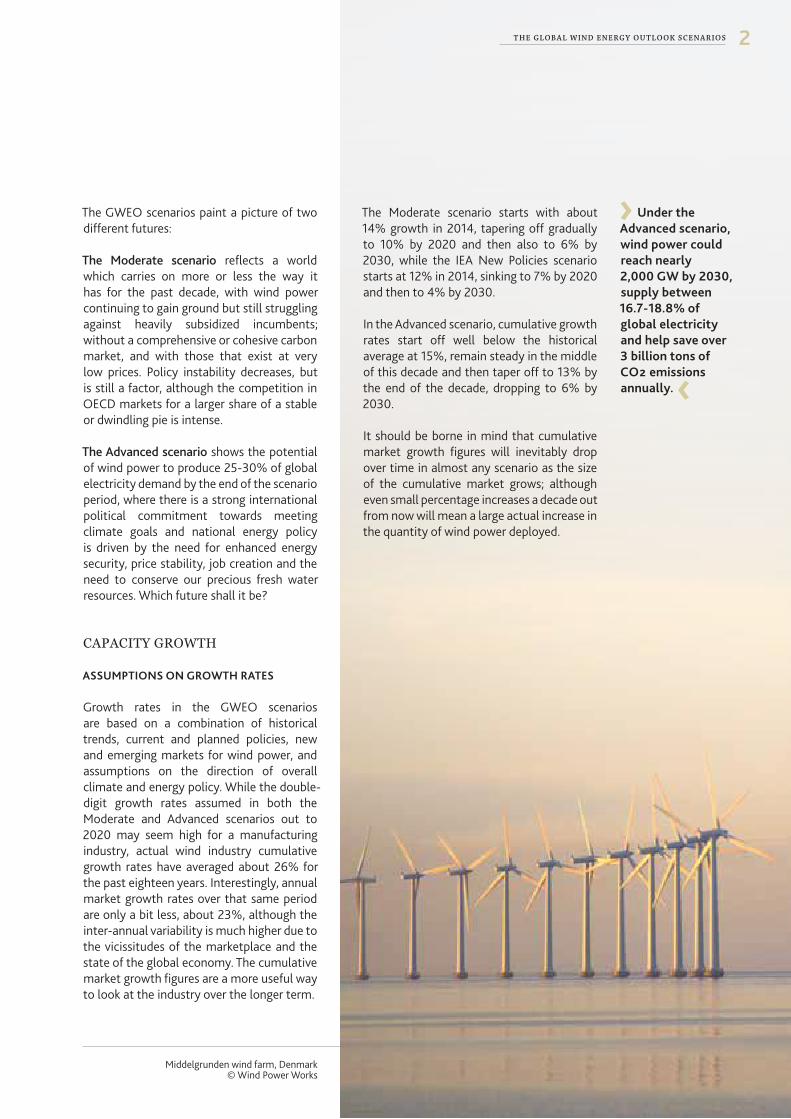
Middelgrunden wind farm, Denmark © Wind Power Works
12 GLOBAL WIND ENERGY OUTLOOK | 2014
T H E G L OB A L W I N D E N E RG Y O U T L O OK SC E N A R IO S2
SCENARIO RESULTS
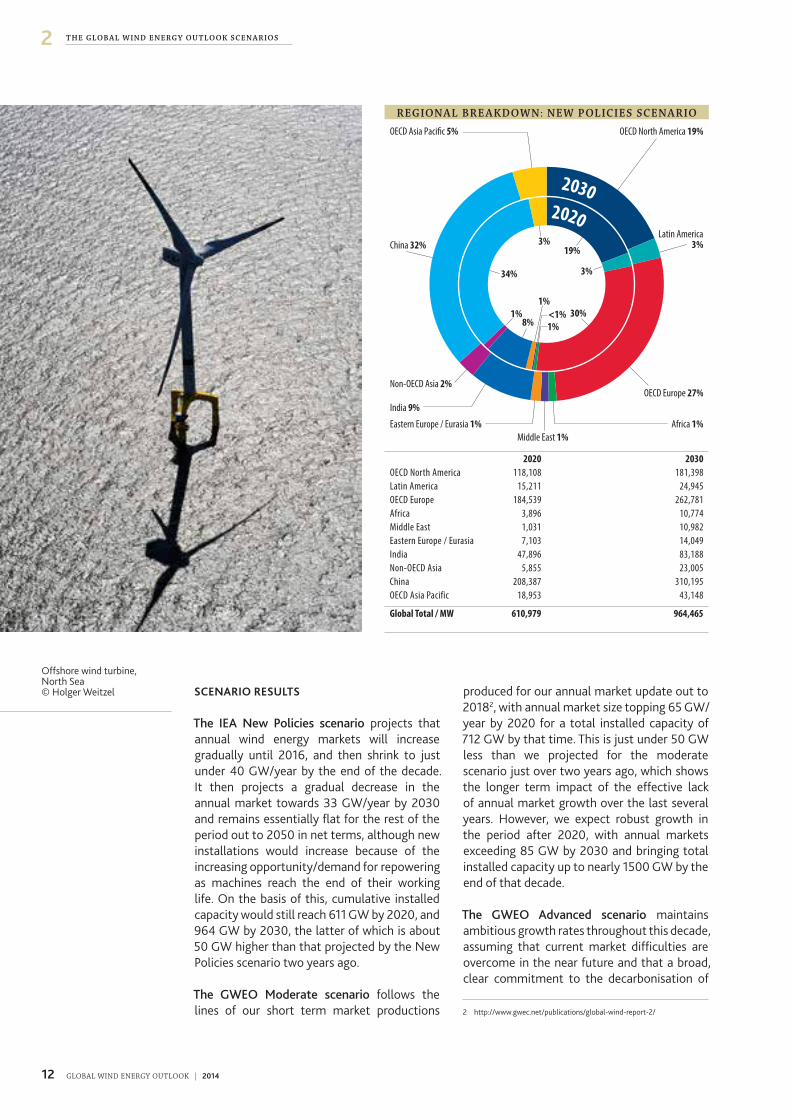
The IEA New Policies scenario projects that annual wind energy markets will increase gradually until 2016, and then shrink to just under 40 GW/year by the end of the decade� It then projects a gradual decrease in the annual market towards 33 GW/year by 2030 and remains essentially flat for the rest of the period out to 2050 in net terms, although new installations would increase because of the increasing opportunity/demand for repowering as machines reach the end of their working life� On the basis of this, cumulative installed capacity would still reach 611 GW by 2020, and 964 GW by 2030, the latter of which is about 50 GW higher than that projected by the New Policies scenario two years ago�
The GWEO Moderate scenario follows the lines of our short term market productions
produced for our annual market update out to 20182, with annual market size topping 65 GW/year by 2020 for a total installed capacity of 712 GW by that time� This is just under 50 GW less than we projected for the moderate scenario just over two years ago, which shows the longer term impact of the effective lack of annual market growth over the last several years� However, we expect robust growth in the period after 2020, with annual markets exceeding 85 GW by 2030 and bringing total installed capacity up to nearly 1500 GW by the end of that decade�
The GWEO Advanced scenario maintains ambitious growth rates throughout this decade, assuming that current market difficulties are overcome in the near future and that a broad, clear commitment to the decarbonisation of
Offshore wind turbine, North Sea © Holger Weitzel
2 http://www�gwec�net/publications/global-wind-report-2/
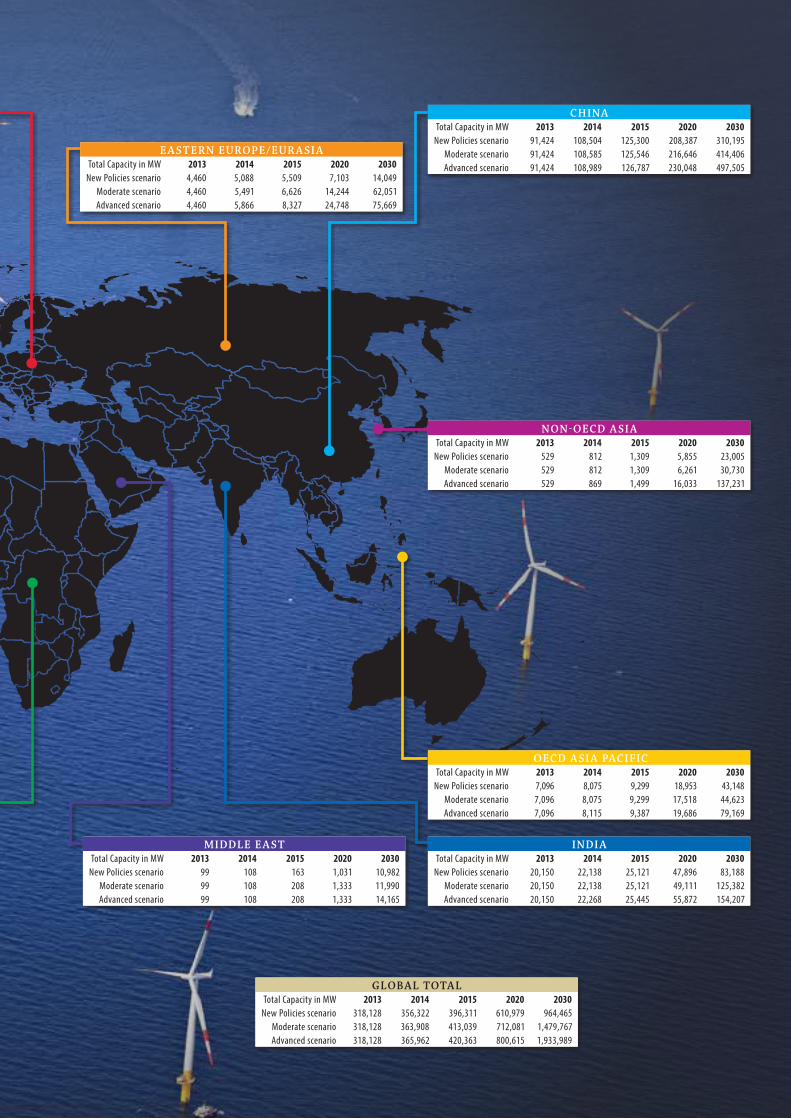
R E G ION A L B R E A K D O W N : N E W P OL IC I E S S C E N A R IO
OECD Asia Paci�c 5%
China 32%
Non-OECD Asia 2%
India 9%
Eastern Europe / Eurasia 1%Middle East 1%
Africa 1%
OECD Europe 27%
Latin America3%
OECD North America 19%
20302020
3%
34%
1%8%
19%
3%
30%1%<1%
1%
2020 2030OECD North America 118,108 181,398Latin America 15,211 24,945OECD Europe 184,539 262,781Africa 3,896 10,774Middle East 1,031 10,982Eastern Europe / Eurasia 7,103 14,049India 47,896 83,188Non-OECD Asia 5,855 23,005China 208,387 310,195OECD Asia Pacific 18,953 43,148
Global Total / MW 610,979 964,465
13GLOBAL WIND ENERGY OUTLOOK | 2014
2T H E G L OB A L W I N D E N E RG Y O U T L O OK SC E N A R IO S
› Global total installed capacity could reach nearly 2000 GW by 2030, if a robust climate regime was in place along with political will to tackle the climate challenge across most of the globe which has been missing to date.‹
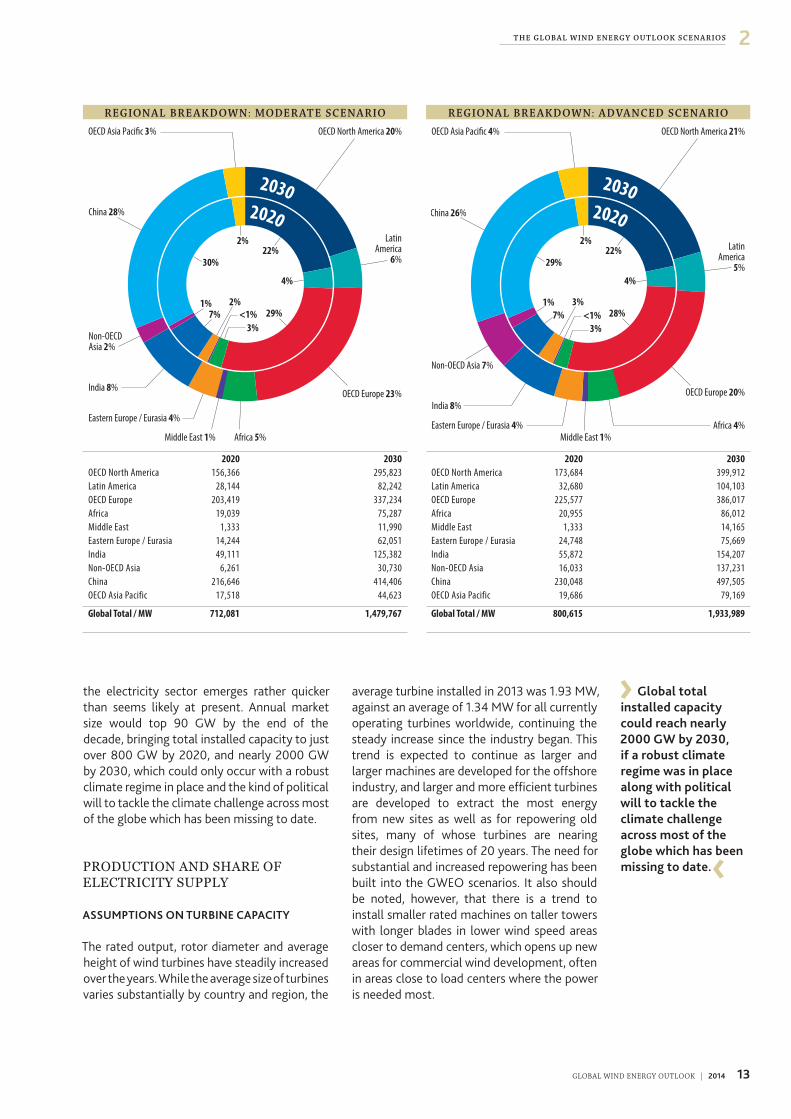
the electricity sector emerges rather quicker than seems likely at present� Annual market size would top 90 GW by the end of the decade, bringing total installed capacity to just over 800 GW by 2020, and nearly 2000 GW by 2030, which could only occur with a robust climate regime in place and the kind of political will to tackle the climate challenge across most of the globe which has been missing to date�
PRODUCTION AND SHARE OF ELECTRICITY SUPPLY
ASSUMPTIONS ON TURBINE CAPACITY
The rated output, rotor diameter and average height of wind turbines have steadily increased over the years� While the average size of turbines varies substantially by country and region, the
average turbine installed in 2013 was 1�93 MW, against an average of 1�34 MW for all currently operating turbines worldwide, continuing the steady increase since the industry began� This trend is expected to continue as larger and larger machines are developed for the offshore industry, and larger and more efficient turbines are developed to extract the most energy from new sites as well as for repowering old sites, many of whose turbines are nearing their design lifetimes of 20 years� The need for substantial and increased repowering has been built into the GWEO scenarios� It also should be noted, however, that there is a trend to install smaller rated machines on taller towers with longer blades in lower wind speed areas closer to demand centers, which opens up new areas for commercial wind development, often in areas close to load centers where the power is needed most�
R E G ION A L B R E A K D O W N : MO DE R AT E S C E N A R IO
OECD Asia Paci�c 3%
China 28%
Non-OECD Asia 2%
India 8%
Eastern Europe / Eurasia 4%
Middle East 1% Africa 5%
OECD Europe 23%
LatinAmerica
6%
OECD North America 20%
20302020
2%
30%
1%7%
22%
4%
29%3%
<1%2%
2020 2030OECD North America 156,366 295,823Latin America 28,144 82,242OECD Europe 203,419 337,234Africa 19,039 75,287Middle East 1,333 11,990Eastern Europe / Eurasia 14,244 62,051India 49,111 125,382Non-OECD Asia 6,261 30,730China 216,646 414,406OECD Asia Pacific 17,518 44,623
Global Total / MW 712,081 1,479,767
R E G ION A L B R E A K D O W N : A D VA N C E D S C E N A R IO
OECD Asia Paci�c 4%
China 26%
Non-OECD Asia 7%
India 8%
Eastern Europe / Eurasia 4%Middle East 1%
Africa 4%
OECD Europe 20%
LatinAmerica
5%
OECD North America 21%
20302020
2%
29%
1%7%
22%
4%
28%3%
<1%3%
2020 2030OECD North America 173,684 399,912Latin America 32,680 104,103OECD Europe 225,577 386,017Africa 20,955 86,012Middle East 1,333 14,165Eastern Europe / Eurasia 24,748 75,669India 55,872 154,207Non-OECD Asia 16,033 137,231China 230,048 497,505OECD Asia Pacific 19,686 79,169
Global Total / MW 800,615 1,933,989
14 GLOBAL WIND ENERGY OUTLOOK | 2014
T H E G L OB A L W I N D E N E RG Y O U T L O OK SC E N A R IO S2
ASSUMPTIONS ON CAPACITY FACTORS
The ‘capacity factor’ of a wind turbine or a wind farm refers to the percentage of the nameplate capacity that a turbine will deliver in terms of electricity generation over the course of a year� This is primarily governed by the wind resources in the particular location, but is also affected by the efficiency of the turbine, its suitability for the particular location, the reliability of the turbine, how well the wind project is managed, and whether or not it is subjected to curtailment by the grid operator� For example, a 1 MW turbine operating at a 25% capacity
factor will deliver 2190 MWh during a year; a 2 MW turbine operating at a 35% capacity factor will deliver 6132 MWh during a year, etc�
Average capacity factors globally today are about 28%, but vary widely from region to region, and are generally increasing with rapid new developments in very windy locations in Brazil, Mexico, offshore and elsewhere� As mentioned above, there is also an increased emphasis on developing new turbines for new locations with lesser wind resources but which may be closer to load centers� These ‘low wind speed’ turbines generally are on taller towers
W I N D P O W E R S H A R E OF G L OB A L E L E C T R IC I T Y DE M A N D
%
0
5
10
15
20
25
30
35 Advanced scenario – Energy e�ciency demand projectionAdvanced scenario – IEA demand projection
Moderate scenario – Energy e�ciency demand projectionModerate scenario – IEA demand projection
New Policies scenario – Energy e�ciency demand projectionNew Policies scenario – IEA demand projection
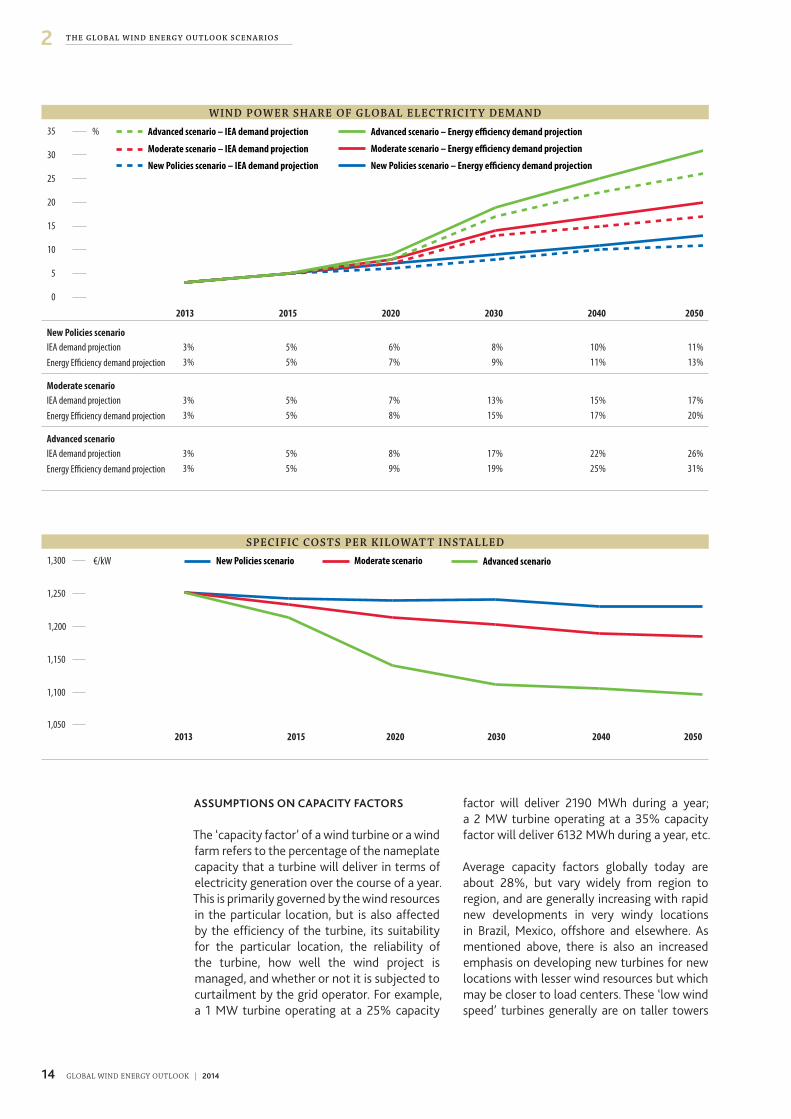
“2050”“2040”“2030”“2020”“2015”“2013”2013 2015 2020 2030 2040 2050
New Policies scenarioIEA demand projection 3% 5% 6% 8% 10% 11%Energy Efficiency demand projection 3% 5% 7% 9% 11% 13%
Moderate scenarioIEA demand projection 3% 5% 7% 13% 15% 17%Energy Efficiency demand projection 3% 5% 8% 15% 17% 20%
Advanced scenarioIEA demand projection 3% 5% 8% 17% 22% 26%Energy Efficiency demand projection 3% 5% 9% 19% 25% 31%
S PE C I F IC C O S T S PE R K I L O WAT T I N S TA L L E D
1,050
1,100
1,150
1,200
1,250
1,300 Advanced scenarioModerate scenarioNew Policies scenario
205020402030202020152013
€/kW
15GLOBAL WIND ENERGY OUTLOOK | 2014
2T H E G L OB A L W I N D E N E RG Y O U T L O OK SC E N A R IO S
› The trend to install smaller rated machines on taller towers with longer blades in lower wind speed areas closer to demand centers opens up new areas for commercial wind development. ‹
with smaller generators and longer blades, and operate with a higher capacity factor�
However, for the GWEO scenarios we have left the average global capacity factor at 28% for the period out to 2030, increasing to 30% after that date for the rest of the scenario period� The reality is that it will probably be greater than that� For the regional scenarios, however, we have used capacity factors slightly higher than the global average in OECD North America, Latin America, Africa and OECD Asia Pacific; and slightly lower in India and China, reflecting the realities of those markets today�
PROJECTIONS FOR ELECTRICITY DEMAND DEVELOPMENT
While it is useful to calculate the actual electricity production from the global installations of wind power, it is also helpful to put it in the context of global electricity demand, and to thereby determine what percentage of that growing demand for power wind energy can supply� Each of the three scenarios in this study is set against two different projections for the future growth of electricity demand: the IEA demand projection from the New Policies scenario, and an ‘Energy Efficiency’ demand projection�
IEA DEMAND PROJECTION
As a baseline we have used the IEA’s electricity demand projection from the New Policies scenario from the 2013 World Energy Outlook, including its assumptions on population and GDP growth, extrapolated out to 2050� Again, this assumes some measures to curb emissions growth and create a more sustainable energy future, but does not foresee dramatic changes�
With these assumptions, the scenario looks for electricity demand to grow from around 20,000 TWh last year to more than 24,000 TWh by 2020, and to just over 30,000 TWh by 2030; a 50% increase in a decade�
ENERGY EFFICIENCY DEMAND PROJECTION
We also measure our progress against an Energy Efficiency demand projection, originally developed for the Energy [R]evolution scenario by the ECOFYS consultancy, which has been updated by researchers at the University of Utrecht3� The study includes the implementation of best practice existing technologies and a certain share of new efficiency technologies, while
Kutch wind farm, Gujarat, India © Wind Power Works
3 http://www�energyblueprint�info/fileadmin/media/documents/2012/UU_Demand_projections_for_energy_revolution_2012_30-3-12�pdf
16 GLOBAL WIND ENERGY OUTLOOK | 2014
T H E G L OB A L W I N D E N E RG Y O U T L O OK SC E N A R IO S2
using the same assumptions for population and GDP growth over the period as the IEA, and assuming no structural economic changes beyond those in the IEA scenario� The uptake of e-mobility after 2020 is also included in the study� It does not foresee lifestyle changes or loss in comfort levels, nor does it foresee ‘stranded’ assets, i�e�, the early retirement of inefficient installations in favour of more efficient ones – which is a very conservative assumption given that such ‘early retirement’ is already beginning to occur and seems likely to increase substantially�
This ‘Energy Efficiency’ demand projection, then, only taps a portion of the potential for energy savings and increased efficiency which are available to us now, and which will likely be
available in the near future� However, it is an indicator of what can be done at very low or no cost if we are to be serious about achieving our climate and energy security objectives�
SCENARIO RESULTS
In the IEA New Policies scenario, wind power contributes just under 1,500 TWh of electricity to the global energy mix in 2020, more than twice the ~620 TWh produced by wind power in 2013�
Measured against the two different demand scenarios, this would count for 6�2 to 6�7% of total global electricity demand� By 2030, this number rises to 2,535 TWh, accounting for between 8�4 and 9�4% of global demand
Horns Rev, Denmark © GWEC
17GLOBAL WIND ENERGY OUTLOOK | 2014
2T H E G L OB A L W I N D E N E RG Y O U T L O OK SC E N A R IO S
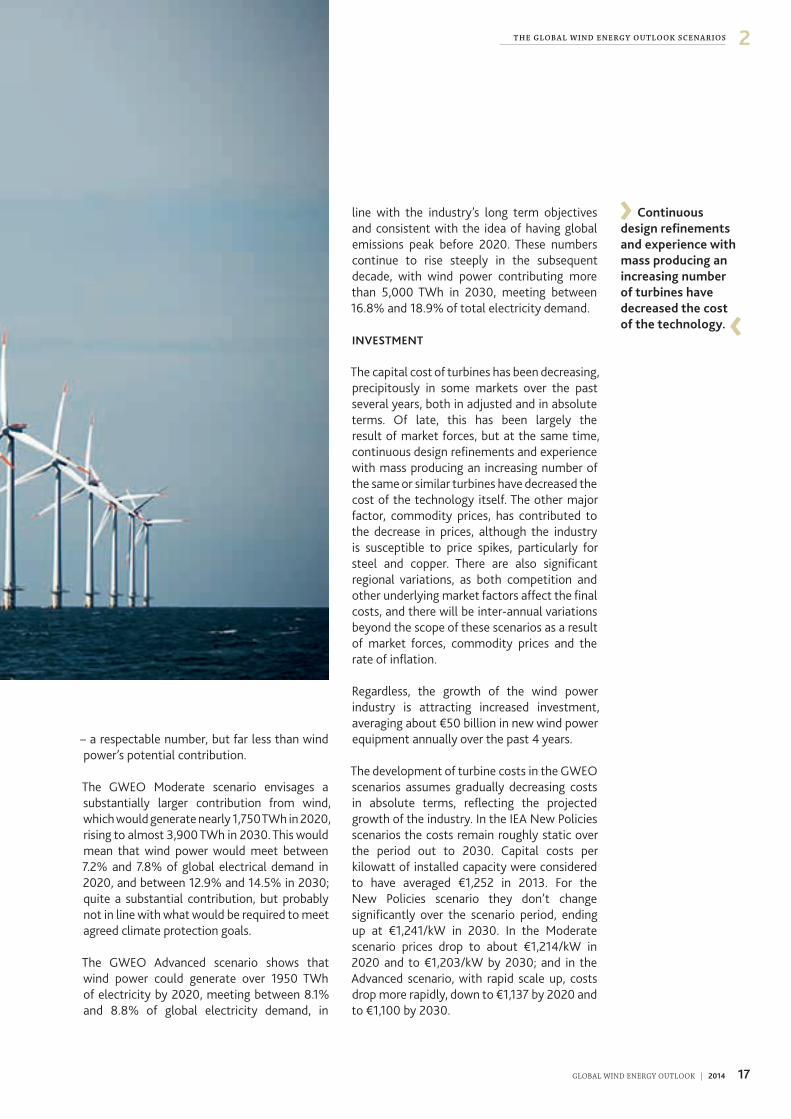
› Continuous design refinements and experience with mass producing an increasing number of turbines have decreased the cost of the technology. ‹
– a respectable number, but far less than wind power’s potential contribution�
The GWEO Moderate scenario envisages a substantially larger contribution from wind, which would generate nearly 1,750 TWh in 2020, rising to almost 3,900 TWh in 2030� This would mean that wind power would meet between 7�2% and 7�8% of global electrical demand in 2020, and between 12�9% and 14�5% in 2030; quite a substantial contribution, but probably not in line with what would be required to meet agreed climate protection goals�
The GWEO Advanced scenario shows that wind power could generate over 1950 TWh of electricity by 2020, meeting between 8�1% and 8�8% of global electricity demand, in
line with the industry’s long term objectives and consistent with the idea of having global emissions peak before 2020� These numbers continue to rise steeply in the subsequent decade, with wind power contributing more than 5,000 TWh in 2030, meeting between 16�8% and 18�9% of total electricity demand�
INVESTMENT
The capital cost of turbines has been decreasing, precipitously in some markets over the past several years, both in adjusted and in absolute terms� Of late, this has been largely the result of market forces, but at the same time, continuous design refinements and experience with mass producing an increasing number of the same or similar turbines have decreased the cost of the technology itself� The other major factor, commodity prices, has contributed to the decrease in prices, although the industry is susceptible to price spikes, particularly for steel and copper� There are also significant regional variations, as both competition and other underlying market factors affect the final costs, and there will be inter-annual variations beyond the scope of these scenarios as a result of market forces, commodity prices and the rate of inflation�
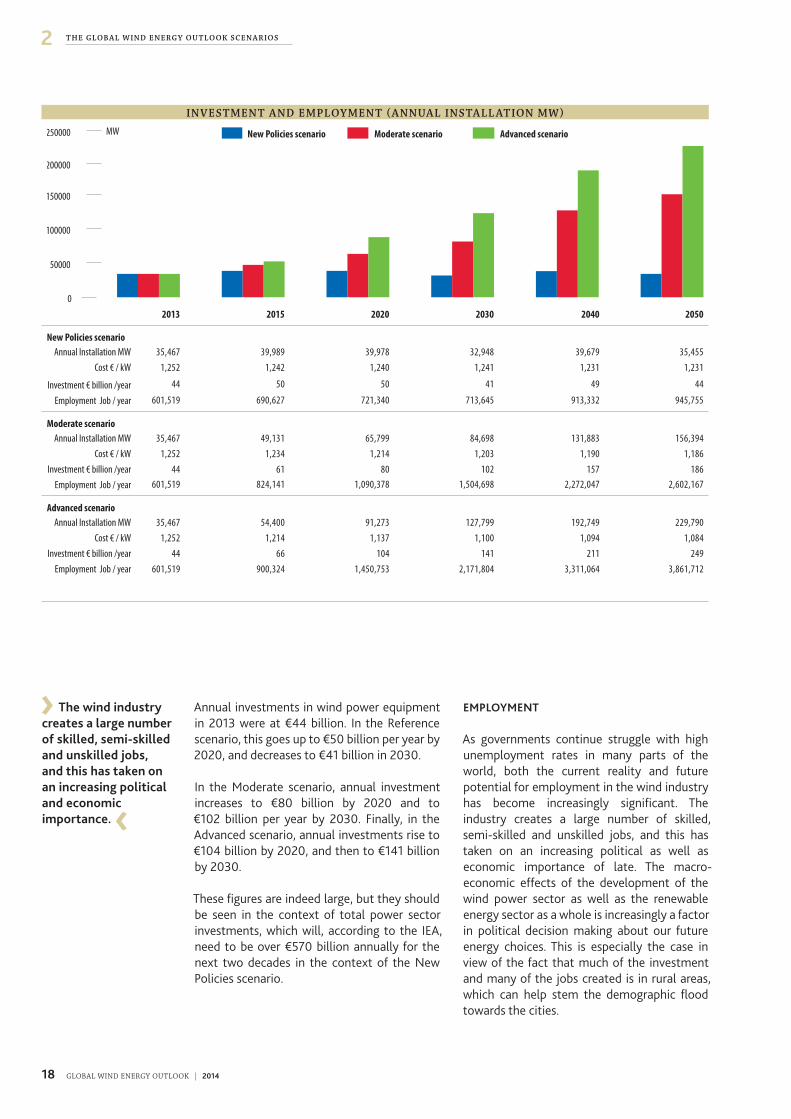
Regardless, the growth of the wind power industry is attracting increased investment, averaging about €50 billion in new wind power equipment annually over the past 4 years�
The development of turbine costs in the GWEO scenarios assumes gradually decreasing costs in absolute terms, reflecting the projected growth of the industry� In the IEA New Policies scenarios the costs remain roughly static over the period out to 2030� Capital costs per kilowatt of installed capacity were considered to have averaged €1,252 in 2013� For the New Policies scenario they don’t change significantly over the scenario period, ending up at €1,241/kW in 2030� In the Moderate scenario prices drop to about €1,214/kW in 2020 and to €1,203/kW by 2030; and in the Advanced scenario, with rapid scale up, costs drop more rapidly, down to €1,137 by 2020 and to €1,100 by 2030�
18 GLOBAL WIND ENERGY OUTLOOK | 2014
T H E G L OB A L W I N D E N E RG Y O U T L O OK SC E N A R IO S2
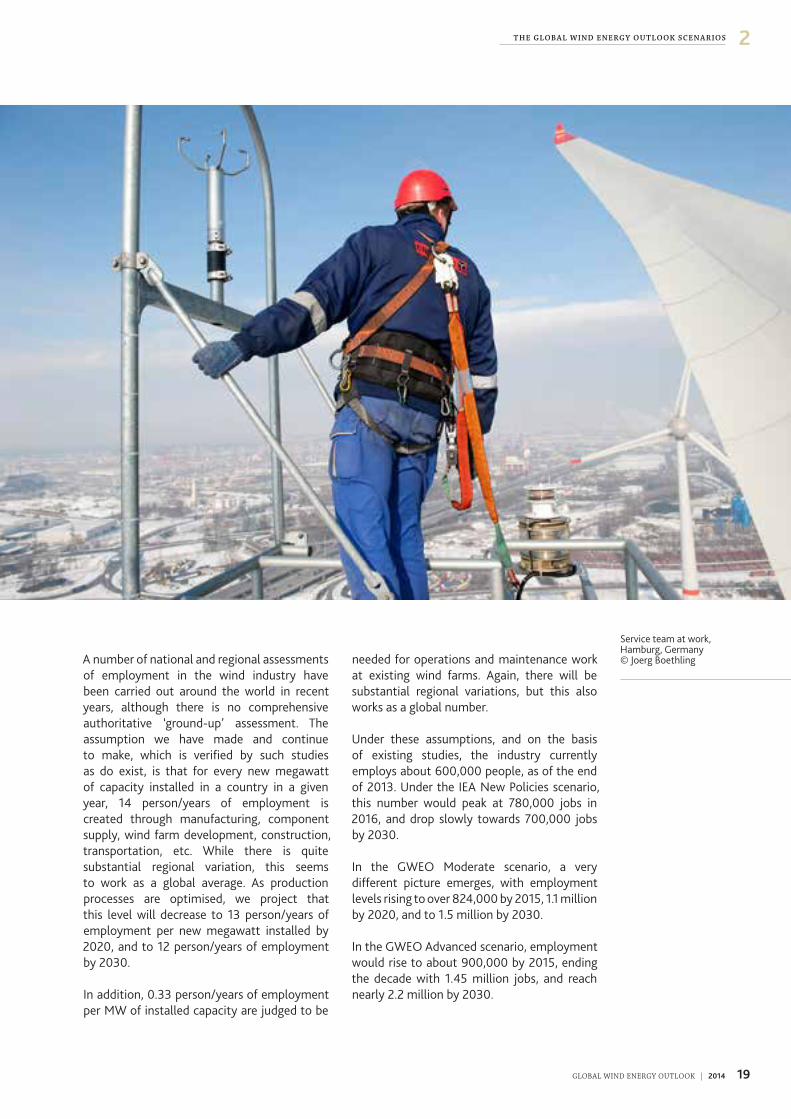
› The wind industry creates a large number of skilled, semi-skilled and unskilled jobs, and this has taken on an increasing political and economic importance. ‹
Annual investments in wind power equipment in 2013 were at €44 billion� In the Reference scenario, this goes up to €50 billion per year by 2020, and decreases to €41 billion in 2030�
In the Moderate scenario, annual investment increases to €80 billion by 2020 and to €102 billion per year by 2030� Finally, in the Advanced scenario, annual investments rise to €104 billion by 2020, and then to €141 billion by 2030�
These figures are indeed large, but they should be seen in the context of total power sector investments, which will, according to the IEA, need to be over €570 billion annually for the next two decades in the context of the New Policies scenario�
EMPLOYMENT
As governments continue struggle with high unemployment rates in many parts of the world, both the current reality and future potential for employment in the wind industry has become increasingly significant� The industry creates a large number of skilled, semi-skilled and unskilled jobs, and this has taken on an increasing political as well as economic importance of late� The macro-economic effects of the development of the wind power sector as well as the renewable energy sector as a whole is increasingly a factor in political decision making about our future energy choices� This is especially the case in view of the fact that much of the investment and many of the jobs created is in rural areas, which can help stem the demographic flood towards the cities�
I N V E S T M E N T A N D E M PL OY M E N T ( A N N UA L I N S TA L L AT ION M W )
0
50000
100000
150000
200000
250000 Advanced scenarioModerate scenarioNew Policies scenario
“2050”“2040”“2030”“2020”“2015”“2013”
MW
2013 2015 2020 2030 2040 2050
New Policies scenarioAnnual Installation MW 35,467 39,989 39,978 32,948 39,679 35,455
Cost € / kW 1,252 1,242 1,240 1,241 1,231 1,231
Investment € billion /year 44 50 50 41 49 44
Employment Job / year 601,519 690,627 721,340 713,645 913,332 945,755
Moderate scenarioAnnual Installation MW 35,467 49,131 65,799 84,698 131,883 156,394
Cost € / kW 1,252 1,234 1,214 1,203 1,190 1,186Investment € billion /year 44 61 80 102 157 186
Employment Job / year 601,519 824,141 1,090,378 1,504,698 2,272,047 2,602,167
Advanced scenarioAnnual Installation MW 35,467 54,400 91,273 127,799 192,749 229,790
Cost € / kW 1,252 1,214 1,137 1,100 1,094 1,084Investment € billion /year 44 66 104 141 211 249
Employment Job / year 601,519 900,324 1,450,753 2,171,804 3,311,064 3,861,712
19GLOBAL WIND ENERGY OUTLOOK | 2014
2T H E G L OB A L W I N D E N E RG Y O U T L O OK SC E N A R IO S
A number of national and regional assessments of employment in the wind industry have been carried out around the world in recent years, although there is no comprehensive authoritative ‘ground-up’ assessment� The assumption we have made and continue to make, which is verified by such studies as do exist, is that for every new megawatt of capacity installed in a country in a given year, 14 person/years of employment is created through manufacturing, component supply, wind farm development, construction, transportation, etc� While there is quite substantial regional variation, this seems to work as a global average� As production processes are optimised, we project that this level will decrease to 13 person/years of employment per new megawatt installed by 2020, and to 12 person/years of employment by 2030�
In addition, 0�33 person/years of employment per MW of installed capacity are judged to be
needed for operations and maintenance work at existing wind farms� Again, there will be substantial regional variations, but this also works as a global number�
Under these assumptions, and on the basis of existing studies, the industry currently employs about 600,000 people, as of the end of 2013� Under the IEA New Policies scenario, this number would peak at 780,000 jobs in 2016, and drop slowly towards 700,000 jobs by 2030�
In the GWEO Moderate scenario, a very different picture emerges, with employment levels rising to over 824,000 by 2015, 1�1 million by 2020, and to 1�5 million by 2030�
In the GWEO Advanced scenario, employment would rise to about 900,000 by 2015, ending the decade with 1�45 million jobs, and reach nearly 2�2 million by 2030�
Service team at work, Hamburg, Germany © Joerg Boethling
20 GLOBAL WIND ENERGY OUTLOOK | 2014
2 T H E G L OB A L W I N D E N E RG Y O U T L O OK SC E N A R IO S
› Wind power’s scalability and its speed of deployment makes it an ideal technology to bring about the early emissions reductions which are required if we are to keep the window open for keeping global mean temperature rise to 2°C or less above pre-industrial levels. ‹
CARBON DIOXIDE SAVINGS
Wind power has many environmental benefits, including the elimination of local air pollution and nearly zero water consumption� However, the greatest benefit is wind power’s contribution to reduction of carbon dioxide emissions from the power sector, which is the single largest anthropogenic contributor to the global climate change problem�
Modern wind energy technology has an extremely good energy balance� All of the CO2 emissions related to the manufacturing, installation, servicing and decommissioning of a turbine are generally ‘paid back’ after the first 3 to 9 months of operation� For the rest of its 20 year design lifetime, the turbine operates without producing any of the harmful greenhouse gases which are already disrupting life on earth�
The benefit obtained from wind power in relation to CO2 emissions depends entirely
on what sort of power plant it displaces� If it displaces hydro or nuclear power, the benefit is small; but if it replaces coal or gas, then the benefit is enormous� Emissions from fossil fuel plants range from around 500g CO2/kWh up to 1200g CO2/kWh or more for the dirtiest fuels� On the basis of the current electricity distribution, we have calculated that 600g CO2/kWh is a good average number to characterize the savings generated by wind power, although the regional variations will be significant� While the majority of the existing plant is in regions which may be slightly lower than that number, the majority of new installations are in regions where what is displaced has significantly higher than average emissons�
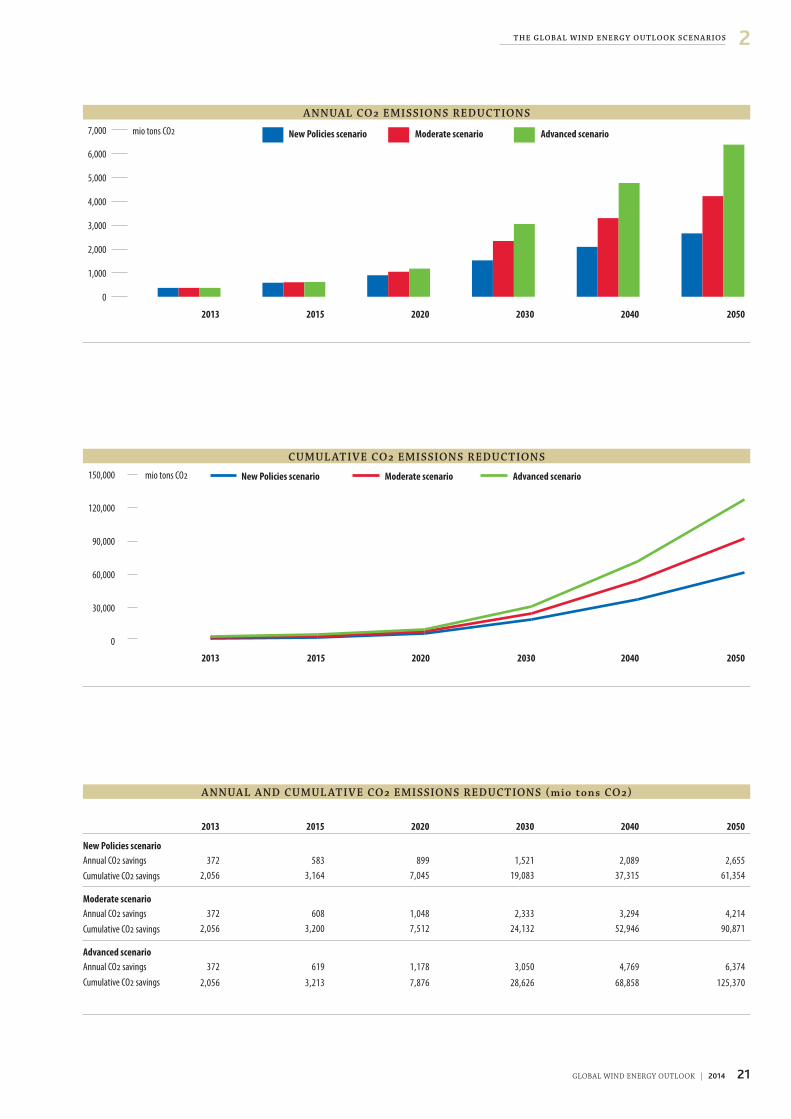
Annual reductions in CO2 from existing wind power plants were about 372 million tonnes in 2013� Under the IEA New Policies scenario, this is expected to rise to 899 million tonnes annually by 2020 and up to 1,521 tonnes per year by 2030�
The GWEO Moderate scenario implies savings of over 1 billion tonnes of CO2/annum by 2020 and more than 2�3 billion tonnes by 2030; while the GWEO Advanced scenario would result in savings of nearly 1�2 billion tonnes of CO2 per year by 2020, and 3�1 billion tonnes/annum by 2030�
In cumulative terms, the IEA New Policies scenario has wind power saving 7 billion tonnes by 2020, and over 19 tonnes by 2030� The GWEO Moderate scenario results in over 7�5 billion tonnes in cumulative savings by 2020, and 24�1 billion tonnes of CO2 savings by 2030� The GWEO Advanced scenario yields cumulative CO2 savings of nearly 7�9 billion tonnes by 2020, and 28�6 billion tonnes by 2030�
These are significant reductions in all cases, but the critical issue here is not just the total volume of reductions, but the speed at which these savings are achieved, as these are long-lived cases, and the imperative is for early CO2 emissions reductions to achieve the greatest benefit for the atmosphere� Wind power’s scalability and its speed of deployment makes it an ideal technology to bring about the early emissions reductions which are required if we are to keep the window open for keeping global mean temperature rise to 2°C or less above pre-industrial levels�
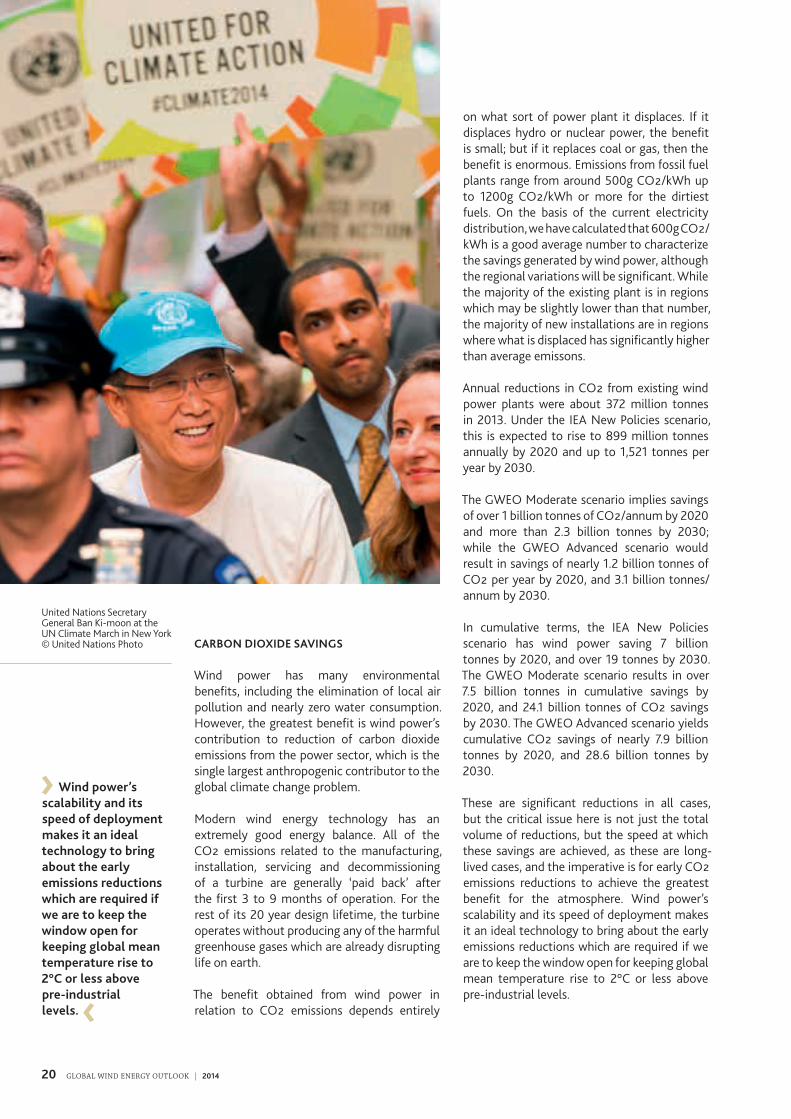
United Nations Secretary General Ban Ki-moon at the UN Climate March in New York © United Nations Photo
21GLOBAL WIND ENERGY OUTLOOK | 2014
2T H E G L OB A L W I N D E N E RG Y O U T L O OK SC E N A R IO S
C U M U L AT I V E C O 2 E M I S S ION S R E D U C T ION S
mio tons CO2
0
30,000
60,000
90,000
120,000
150,000 Advanced scenarioModerate scenarioNew Policies scenario
“2050”“2040”“2030”“2020”“2015”“2013”2013 2015 2020 2030 2040 2050
A N N UA L C O 2 E M I S S ION S R E D U C T ION S
mio tons CO2
0
1,000
2,000
3,000
4,000
5,000
6,000
7,000 Advanced scenarioModerate scenarioNew Policies scenario
“2050”“2040”“2030”“2020”“2015”“2013”2013 2015 2020 2030 2040 2050
A N N UA L A N D C U M U L AT I V E C O 2 E M I S S ION S R E D U C T ION S ( m i o to n s C O 2 )
2013 2015 2020 2030 2040 2050
New Policies scenarioAnnual CO2 savings 372 583 899 1,521 2,089 2,655Cumulative CO2 savings 2,056 3,164 7,045 19,083 37,315 61,354
Moderate scenarioAnnual CO2 savings 372 608 1,048 2,333 3,294 4,214Cumulative CO2 savings 2,056 3,200 7,512 24,132 52,946 90,871
Advanced scenarioAnnual CO2 savings 372 619 1,178 3,050 4,769 6,374Cumulative CO2 savings 2,056 3,213 7,876 28,626 68,858 125,370
22 GLOBAL WIND ENERGY OUTLOOK | 2014
2 T H E G L OB A L W I N D E N E RG Y O U T L O OK SC E N A R IO S
RESEARCH BACKGROUND
THE GERMAN AEROSPACE CENTER
The German Aerospace Center (Deutsches Zentrum für Luft- und Raumfahrt – DLR) is the largest engineering research organisation in Germany� It specialises, among other things, in the development of solar thermal power station technologies, the utilisation of low and high temperature fuel cells, particularly for electricity generation, and research into the development of high efficiency gas and steam turbine power plants�
The Institute of Technical Thermodynamics at DLR (DLR-ITT) is active in the field of renewable energy research and technology development for efficient and low emission energy conversion and utilisation� Working in co-opoeration with other DLR institutes, industry and universities, its research focuses on solving key problems in electrochemical energy technology and solar energy conversion� This encompasses application-oriented research, development of laboratory and prototype models as was design and operation of demonstration plants� System analysis and technology assessment supports the preparation of strategic decisions in the field of research and energy policy�
Within DLR-ITT, the System Analysis and Technology Assessment Division has long term experience in the assessment of renewable energy technologies� Its main research activities are in the field of techno-economic utilisation and system analysis, leading to the development of strategies for the market introduction and dissemination of new technologies, mainly in the energy and transport sectors�
SCENARIO BACKGROUND
DLR was commissioned by the European Renewable Energy Council and Greenpeace international to conduct the study ‘Energy [R]evolution: A sustainable global energy outlook’, developing global sustainable energy pathways up to 2050�1 This study was first published in January 2007 and has been updated several
times since then2, most recently in 2012� It lays out energy scenarios that are significantly lower than current levels, and within the range of scenarios consistent with a 2°C target�
Integral to the analsyis was an examination of the future potential for renewable energy sources, including wind energy� In collaboration with the wind industry, the study looks at regional projections for wind power around the world, and it is this work which forms the basis for the Global Wind Energy Outlook scenarios�
The energy supply scenarios used in this report, which both extend beyond and enhance projections by the International Energy Agency, have been calculated using the MESAP/PlaNet simulation model by DLR covering all 10 world regions as delineated by the IEA� This model has then been developed in cooperation with
1 Krewitt W, Simon S, Graus W, Teske S, Zervos A, Schaefer , ‘The 2 degrees C scenario – A sustainable world energy perspective’; Energy Policy, Vol 35, No� 10, 4969-4980, 2007; and Teske S, Pregger R, Simon S, Naegler T, Graus W, Lins C, “Energy [R]evolution 2010—a sustainable world energy outlook”, Energy Efficiency, DOI 10�1007/s12053-010-9098-y
2 See http://www�energyblueprint�info
23GLOBAL WIND ENERGY OUTLOOK | 2014
2T H E G L OB A L W I N D E N E RG Y O U T L O OK SC E N A R IO S
an energy efficiency study originally developed by the Ecofys consultancy to take into account the future potential for energy efficiency measures, beyond those envisaged in the World Energy Outlook�
ENERGY EFFICIENCY STUDY
The aim of the original Ecofys energy efficiency study3 developed for the Energy [R]evolution scenario was to develop low energy demand scenarios for the period from 2007 to 2050 on a sectoral basis for the IEA regions as defined in the World Energy Outlook series� Energy demand was divided into electricity and fuels� The sectors which were examined were industry, transport and other consumers, including households and services�
This study has now been updated by researchers at the University of Utrecht4, maintaining the
same parameters as the first study� The study includes the implementation of best practice existing technologies and a certain share of new efficiency technologies, while using the same assumptions for population and GDP growth over the period as the IEA, and assuming no structural economic changes beyond those in the IEA scenario� The uptake of e-mobility after 2020 is also included in the study�
While maintaining the same level of comfort and standard of living, and without ‘stranding’ assets, i�e�, not including retiring inefficient assets before the end of their economic life, the study concludes that savings of up to 36% can be made in electricity use, and up to 28% in fuel consumption� While nowhere near the technical potential for energy efficiency and energy savings, the study shows the enormous potential for emissions reductions offered by such measures, which would be an essential part of any serious efforts to tackle climate change�
3 www�energyblueprint�info/1211�0�html4 http://www�energyblueprint�info/fileadmin/media/documents/2012/
UU_Demand_projections_for_energy_revolution_2012_30-3-12�pdf
Daman, India © Suzlon
24 GLOBAL WIND ENERGY OUTLOOK | 2014
C H A P T E R T I T L E1REGIONAL BREAKDOWN OF CUMULATIVE CAPACITY UP TO 2030
OECD Europe Germany, Greece, Hungary, Iceland, Ireland, Italy, Luxembourg, the Netherlands, Norway, Poland, Portugal, Slovak Republic, Spain, Sweden, Switzerland, Turkey, United Kingdom
EU 28 Austria, Belgium, Bulgaria, Croatia, Cyprus, Czech Republic, Denmark, Estonia, Finland, France, Germany, Greece, Hungary, Ireland, Italy, Latvia, Lithuania, Luxembourg, Malta, Netherlands, Poland, Portugal, Romania, Slovakia, Slovenia, Spain, Sweden, United Kingdom
Eastern Europe/Eurasia Albania, Armenia, Azerbaijan, Belarus, Bosnia-Herzegovina, Bulgaria, Croatia, Estonia, Serbia and Montenegro, the former Republic of Macedonia, Georgia, Kazakhstan, Kyrgyzstan, Latvia, Lithuania, Moldova, Romania, Russia, Slovenia, Tajikistan, Turkmenistan, Ukraine, Uzbekistan, Cyprus, Malta
OECD North America Canada, Mexico, United States
OECD Asia Pacific Australia, Japan, Korea (South), New Zealand
India India
Latin America Antigua and Barbuda, Aruba, Argentina, Bahamas, Barbados, Belize, Bermuda, Bolivia, Brazil, the British Virgin Islands, the Cayman Islands, Chile, Colombia, Costa Rica, Cuba, Dominica, the Dominican Republic, Ecuador, El, Salvador, the Falkland Islands, French Guyana, Grenada, Guadeloupe, Guatemala, Guyana, Haiti, Honduras, Jamaica, Martinique, Montserrat, Netherlands Antilles, Nicaragua, Panama, Paraguay, Peru, St. Kitts and Nevis, Saint Lucia, Saint Pierre et Miquelon, St. Vincent and the Grenadines, Suriname, Trinidad and Tobago, the Turks and Caicos Islands, Uruguay and Venezuela
Middle East Bahrain, Iran, Iraq, Israel, Jordan, Kuwait, Lebanon, Oman, Qatar, Saudi Arabia, Syria, United Arab Emirates, Yemen
Non-OECD Asia Afghanistan, Bangladesh, Bhutan, Brunei, Cambodia, Chinese, Taipei, Cook Islands, East Timor, Fiji, French Polynesia, Indonesia, Kiribati, Democratic People’s Republic of Korea, Laos, Macao, Malaysia, Maldives, Mongolia, Myanmar, Nepal, New Caledonia, Pakistan, Papua New Guinea, Philippines, Samoa, Singapore, Solomon Islands, Sri Lanka, Thailand, Tonga, Vietnam, Vanuatu
Africa Algeria, Angola, Benin, Botswana, Burkina Faso, Burundi, Cameroon, Cape Verde, Central African Republic, Chad, Comoros, Congo, Democratic Republic of Congo, Cote d’Ivoire, Djibouti, Egypt, Equatorial Guinea, Eritrea, Ethiopia, Gabon, Gambia, Ghana, Guinea, Guinea-Bissau, Kenya, Lesotho, Liberia, Libya, Madagascar, Malawi, Mali, Mauritania, Mauritius, Morocco, Mozambique, Namibia, Niger, Nigeria, Reunion, Rwanda, Sao Tome and Principe, Senegal, Seychelles, Sierra Leone, Somalia, South Africa, Sudan, Swaziland, United Republic of Tanzania, Togo, Tunisia, Uganda, Zambia, Zimbabwe
China People’s Republic of China including Hong Kong
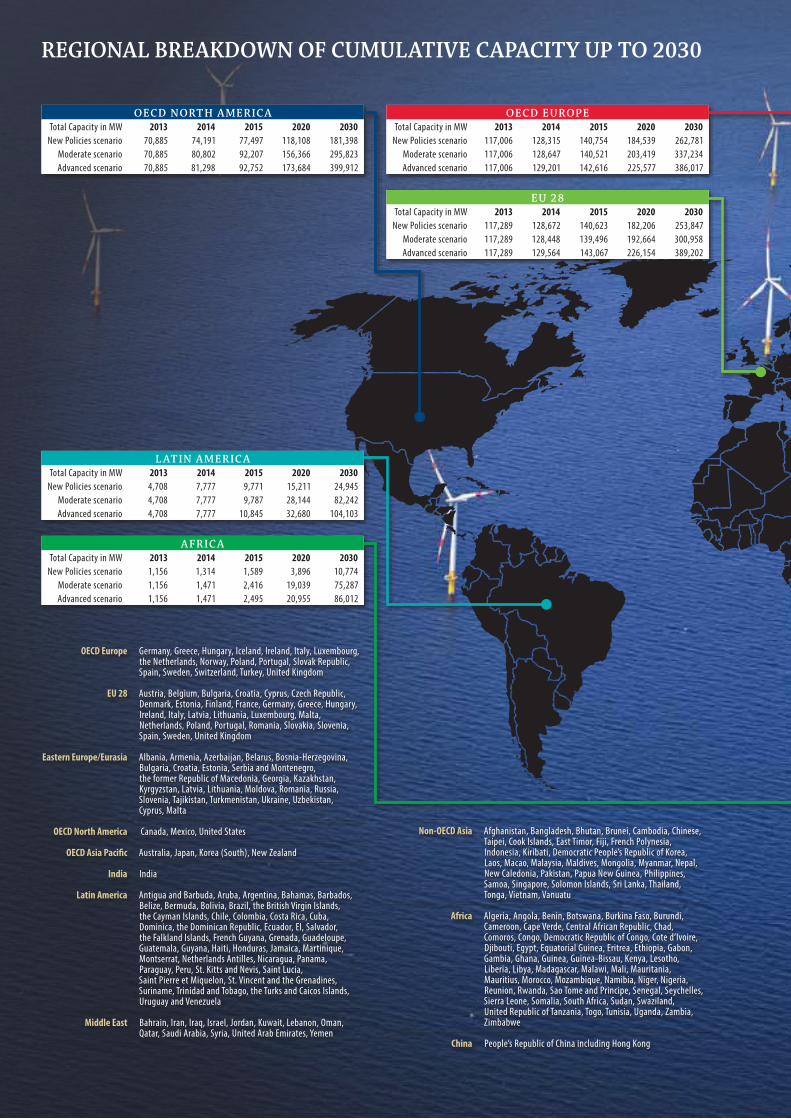
O E C D N ORT H A M E R IC ATotal Capacity in MW 2013 2014 2015 2020 2030
New Policies scenario 70,885 74,191 77,497 118,108 181,398Moderate scenario 70,885 80,802 92,207 156,366 295,823Advanced scenario 70,885 81,298 92,752 173,684 399,912
L AT I N A M E R IC ATotal Capacity in MW 2013 2014 2015 2020 2030
New Policies scenario 4,708 7,777 9,771 15,211 24,945Moderate scenario 4,708 7,777 9,787 28,144 82,242Advanced scenario 4,708 7,777 10,845 32,680 104,103
A F R IC ATotal Capacity in MW 2013 2014 2015 2020 2030
New Policies scenario 1,156 1,314 1,589 3,896 10,774Moderate scenario 1,156 1,471 2,416 19,039 75,287Advanced scenario 1,156 1,471 2,495 20,955 86,012
O E C D E U ROPETotal Capacity in MW 2013 2014 2015 2020 2030
New Policies scenario 117,006 128,315 140,754 184,539 262,781Moderate scenario 117,006 128,647 140,521 203,419 337,234Advanced scenario 117,006 129,201 142,616 225,577 386,017
E U 2 8Total Capacity in MW 2013 2014 2015 2020 2030
New Policies scenario 117,289 128,672 140,623 182,206 253,847Moderate scenario 117,289 128,448 139,496 192,664 300,958Advanced scenario 117,289 129,564 143,067 226,154 389,202
25GLOBAL WIND ENERGY OUTLOOK | 2014
1C H A P T E R T I T L E
M I DD L E E A S TTotal Capacity in MW 2013 2014 2015 2020 2030
New Policies scenario 99 108 163 1,031 10,982Moderate scenario 99 108 208 1,333 11,990Advanced scenario 99 108 208 1,333 14,165
G L OB A L TOTA LTotal Capacity in MW 2013 2014 2015 2020 2030
New Policies scenario 318,128 356,322 396,311 610,979 964,465Moderate scenario 318,128 363,908 413,039 712,081 1,479,767Advanced scenario 318,128 365,962 420,363 800,615 1,933,989
I N DI ATotal Capacity in MW 2013 2014 2015 2020 2030
New Policies scenario 20,150 22,138 25,121 47,896 83,188Moderate scenario 20,150 22,138 25,121 49,111 125,382Advanced scenario 20,150 22,268 25,445 55,872 154,207
O E C D A S I A PAC I F ICTotal Capacity in MW 2013 2014 2015 2020 2030
New Policies scenario 7,096 8,075 9,299 18,953 43,148Moderate scenario 7,096 8,075 9,299 17,518 44,623Advanced scenario 7,096 8,115 9,387 19,686 79,169
N ON - O E C D A S I ATotal Capacity in MW 2013 2014 2015 2020 2030
New Policies scenario 529 812 1,309 5,855 23,005Moderate scenario 529 812 1,309 6,261 30,730Advanced scenario 529 869 1,499 16,033 137,231
C H I N ATotal Capacity in MW 2013 2014 2015 2020 2030
New Policies scenario 91,424 108,504 125,300 208,387 310,195Moderate scenario 91,424 108,585 125,546 216,646 414,406Advanced scenario 91,424 108,989 126,787 230,048 497,505
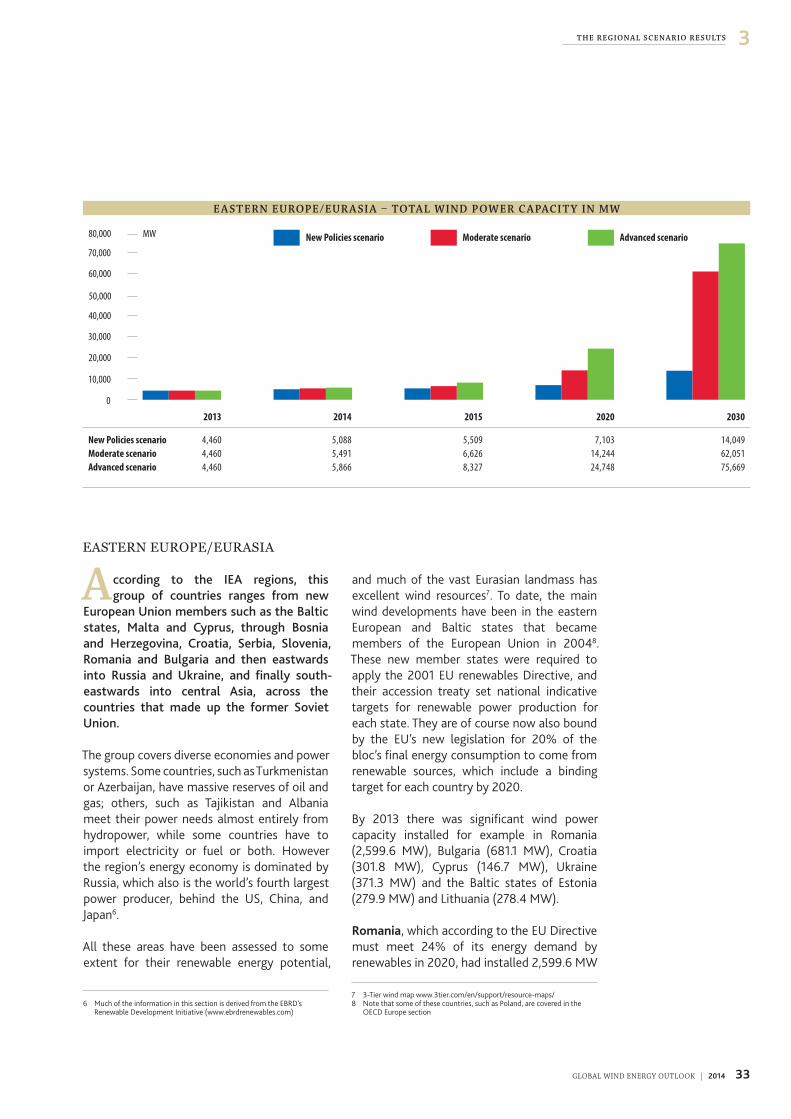
E A S T E R N E U ROPE / E U R A S I ATotal Capacity in MW 2013 2014 2015 2020 2030
New Policies scenario 4,460 5,088 5,509 7,103 14,049Moderate scenario 4,460 5,491 6,626 14,244 62,051Advanced scenario 4,460 5,866 8,327 24,748 75,669
26 GLOBAL WIND ENERGY OUTLOOK | 2014
T H E G L OB A L W I N D E N E RG Y O U T L O OK SC E N A R IO S2
3 T H E R E G ION A L S C E N A R IO R E S U LT S
27GLOBAL WIND ENERGY OUTLOOK | 2014
3T H E R EG ION A L SC E N A R IO R E S U LT S
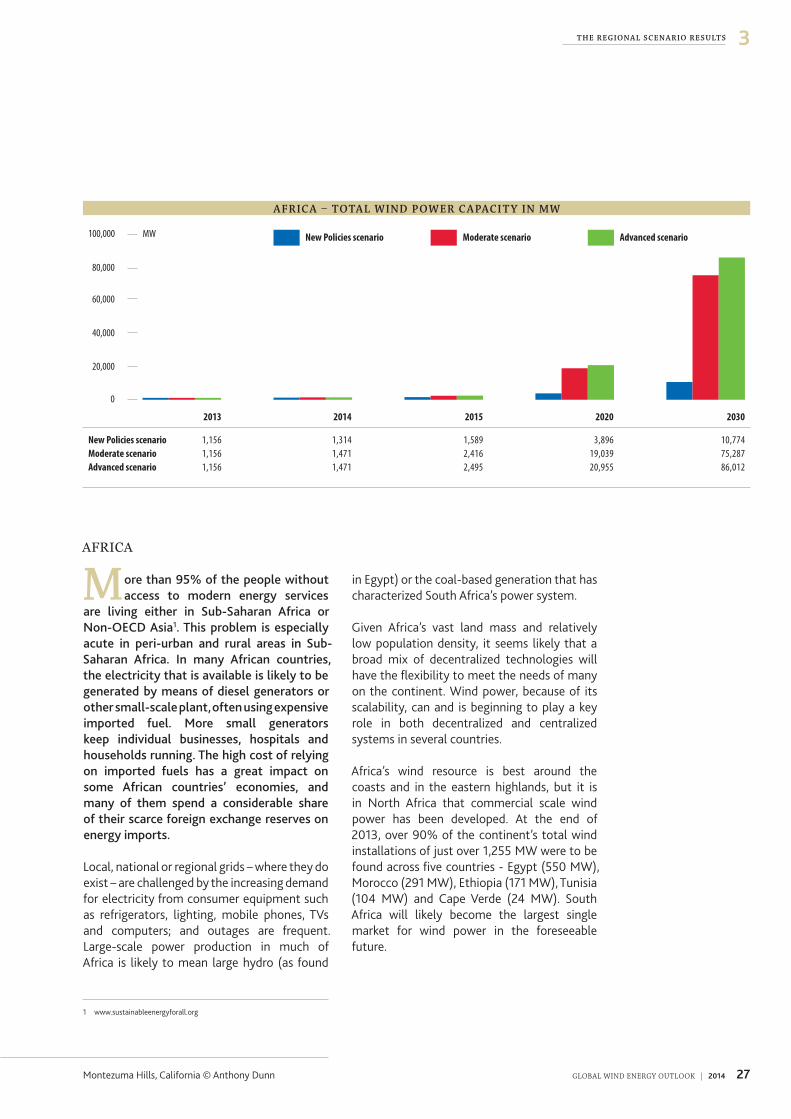
AFRICA
More than 95% of the people without access to modern energy services
are living either in Sub-Saharan Africa or Non-OECD Asia1. This problem is especially acute in peri-urban and rural areas in Sub-Saharan Africa. In many African countries, the electricity that is available is likely to be generated by means of diesel generators or other small-scale plant, often using expensive imported fuel. More small generators keep individual businesses, hospitals and households running. The high cost of relying on imported fuels has a great impact on some African countries’ economies, and many of them spend a considerable share of their scarce foreign exchange reserves on energy imports.
Local, national or regional grids – where they do exist – are challenged by the increasing demand for electricity from consumer equipment such as refrigerators, lighting, mobile phones, TVs and computers; and outages are frequent� Large-scale power production in much of Africa is likely to mean large hydro (as found
in Egypt) or the coal-based generation that has characterized South Africa’s power system�
Given Africa’s vast land mass and relatively low population density, it seems likely that a broad mix of decentralized technologies will have the flexibility to meet the needs of many on the continent� Wind power, because of its scalability, can and is beginning to play a key role in both decentralized and centralized systems in several countries�
Africa’s wind resource is best around the coasts and in the eastern highlands, but it is in North Africa that commercial scale wind power has been developed� At the end of 2013, over 90% of the continent’s total wind installations of just over 1,255 MW were to be found across five countries - Egypt (550 MW), Morocco (291 MW), Ethiopia (171 MW), Tunisia (104 MW) and Cape Verde (24 MW)� South Africa will likely become the largest single market for wind power in the foreseeable future�
A F R IC A – TOTA L W I N D P O W E R C A PAC I T Y I N M W
MW
0
20,000
40,000
60,000
80,000
100,000 Advanced scenarioModerate scenarioNew Policies scenario
20302020201520112010 2013 2014 2015 2020 2030
New Policies scenario 1,156 1,314 1,589 3,896 10,774Moderate scenario 1,156 1,471 2,416 19,039 75,287Advanced scenario 1,156 1,471 2,495 20,955 86,012
Montezuma Hills, California © Anthony Dunn
1 www�sustainableenergyforall�org
28 GLOBAL WIND ENERGY OUTLOOK | 2014
3 T H E R EG ION A L SC E N A R IO R E S U LT S
EGYPT
In February 2008, Egypt’s Supreme Council of Energy approved a plan to produce 20% of its electric power from Renewable sources by 2020� This target includes a 12% contribution from wind energy, which translates into more than 7 GW of grid-connected wind power�
Egypt’s best-developed wind region so far is the Zafarana district, with average wind speeds in the area of 9 m/s� The project consists of a series of linked wind farms, the first of which started construction in 2001� In 2010, Zafarana wind farm’s total capacity reached 550 MW� It is owned and operated by the Egyptian New & Renewable Energy Authority� Due to prevailing political conditions, 2011-2013 has seen no new project development across the country� However once there is increased political certainty perceived by the investor community, the government’s goal of 7 GW of wind power by 2020 is likely to be reached�
MOROCCO
The Moroccan government, under the integrated Moroccan Wind Power Plan, has set a target of installing 2000 MW of wind energy by 20202, a dramatic increase from the existing 291 MW at the end of 2013� Morocco has excellent wind resources along nearly its entire coastline, as well as inland near the Atlas Mountains�
Last year, French utility GDF Suez announced that it would be constructing the 300 MW Tarfaya wind farm in Morocco, which would be the largest single wind project in Africa to date� The wind farm is likely to be fully commissioned by end of 2014�
SOUTH AFRICA
South Africa is ideally suited for wind power development, given its abundant wind resources, ample suitable sites and modern high voltage electrical infrastructure� However
its electricity market continues to face numerous challenges�
In December of 2011, South Africa announced the preferred bidders for the first round under the ‘ReBid’ Programme� Wind energy garnered 634 MW in the first round out of a total of 1,450 MW of renewable energy�
By the end of 2013, only 10 MW of capacity was in operation� However 2014 will be a milestone for the South African wind power market; where up to 1 GW of new capacity is likely to come online, marking the beginning of South Africa’s long-term plan for installing 8�4 GW of wind power by 20303�
The South African Wind Energy Association (SAWEA) estimates that with the right policy framework, wind power could provide as much as 20% of the country’s energy demand by 2025, translating into 30,000 MW of installed wind capacity�
EAST AFRICA
After launching sub-Saharan Africa’s first large wind farm in 2012, Ethiopia added 90 MW wind power capacity in 2013 for a total installed capacity of 171 MW�
The €623 million, 300 MW project (Lake Turkana) is under construction in Kenya� The project is expected to generate approximately €118 (US$150) million per year in foreign currency savings to Kenya through fuel displacement costs� The project is equivalent to approximately 20% of Kenya’s currently (as of March 2014) installed capacity and will generate power at €7�52 cents/kWh (Ksh9/kWh4)� According to the government, the electricity produced from this project will be the cheapest source of electricity along with geo-thermal�
These new wind energy projects will make a substantial contribution to the total generating capacity in each of these countries�
2 http://www�one�org�ma/3 http://www�doe-irp�co�za/content/IRP2010_updatea�pdf 4 Lake Turkana Wind Power http://ltwp�co�ke/
29GLOBAL WIND ENERGY OUTLOOK | 2014
3T H E R EG ION A L SC E N A R IO R E S U LT S
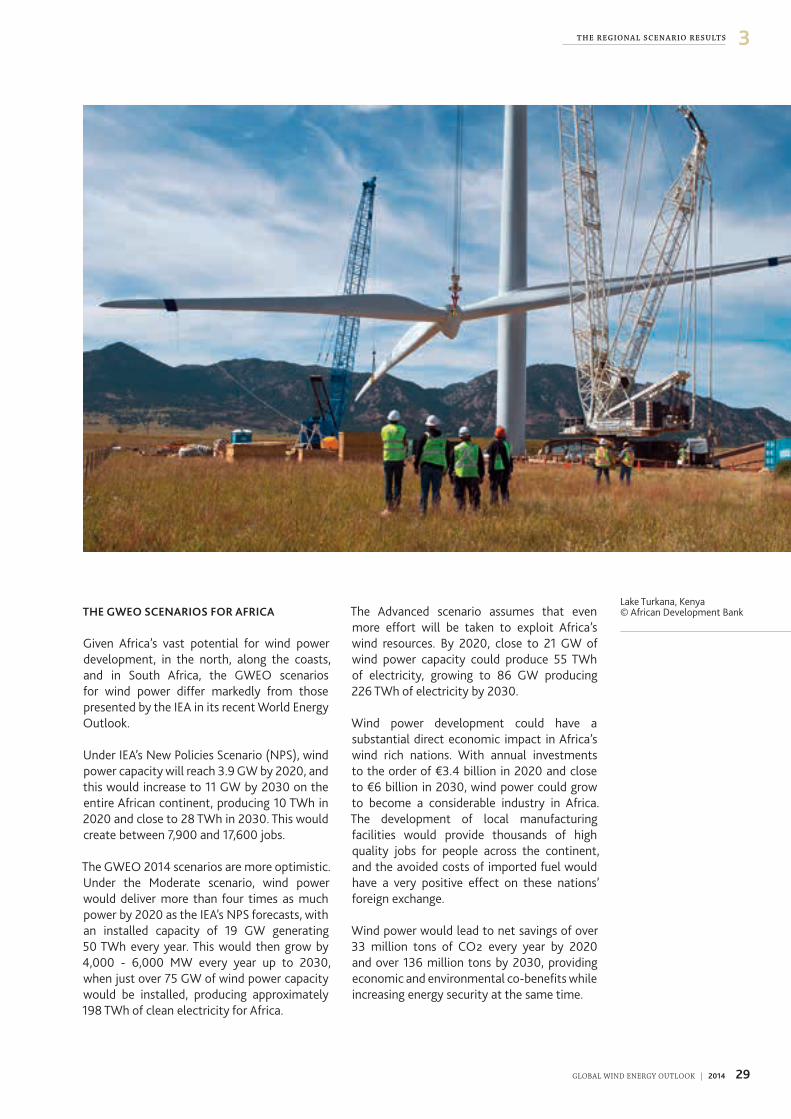
THE GWEO SCENARIOS FOR AFRICA
Given Africa’s vast potential for wind power development, in the north, along the coasts, and in South Africa, the GWEO scenarios for wind power differ markedly from those presented by the IEA in its recent World Energy Outlook�
Under IEA’s New Policies Scenario (NPS), wind power capacity will reach 3�9 GW by 2020, and this would increase to 11 GW by 2030 on the entire African continent, producing 10 TWh in 2020 and close to 28 TWh in 2030� This would create between 7,900 and 17,600 jobs�
The GWEO 2014 scenarios are more optimistic� Under the Moderate scenario, wind power would deliver more than four times as much power by 2020 as the IEA’s NPS forecasts, with an installed capacity of 19 GW generating 50 TWh every year� This would then grow by 4,000 - 6,000 MW every year up to 2030, when just over 75 GW of wind power capacity would be installed, producing approximately 198 TWh of clean electricity for Africa�
The Advanced scenario assumes that even more effort will be taken to exploit Africa’s wind resources� By 2020, close to 21 GW of wind power capacity could produce 55 TWh of electricity, growing to 86 GW producing 226 TWh of electricity by 2030�
Wind power development could have a substantial direct economic impact in Africa’s wind rich nations� With annual investments to the order of €3�4 billion in 2020 and close to €6 billion in 2030, wind power could grow to become a considerable industry in Africa� The development of local manufacturing facilities would provide thousands of high quality jobs for people across the continent, and the avoided costs of imported fuel would have a very positive effect on these nations’ foreign exchange�
Wind power would lead to net savings of over 33 million tons of CO2 every year by 2020 and over 136 million tons by 2030, providing economic and environmental co-benefits while increasing energy security at the same time�
Lake Turkana, Kenya © African Development Bank
30 GLOBAL WIND ENERGY OUTLOOK | 2014
3 T H E R EG ION A L SC E N A R IO R E S U LT S
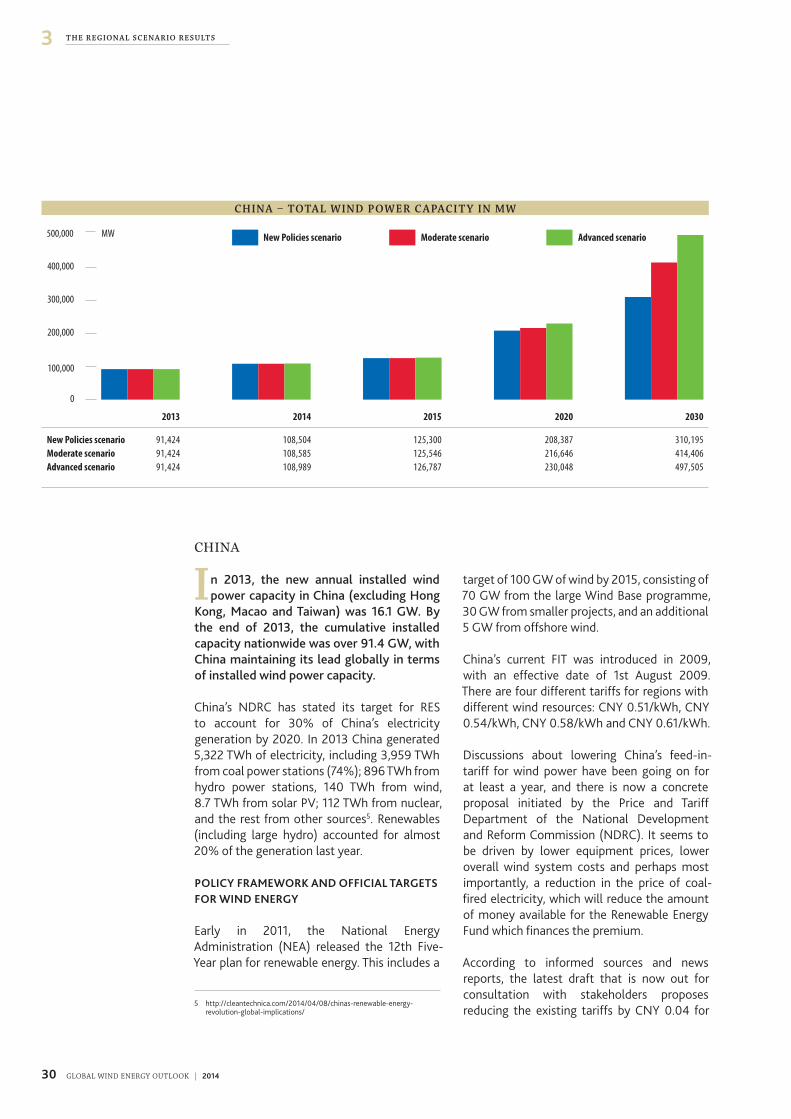
CHINA
In 2013, the new annual installed wind power capacity in China (excluding Hong
Kong, Macao and Taiwan) was 16.1 GW. By the end of 2013, the cumulative installed capacity nationwide was over 91.4 GW, with China maintaining its lead globally in terms of installed wind power capacity.
China’s NDRC has stated its target for RES to account for 30% of China’s electricity generation by 2020� In 2013 China generated 5,322 TWh of electricity, including 3,959 TWh from coal power stations (74%); 896 TWh from hydro power stations, 140 TWh from wind, 8�7 TWh from solar PV; 112 TWh from nuclear, and the rest from other sources5� Renewables (including large hydro) accounted for almost 20% of the generation last year�
POLICY FRAMEWORK AND OFFICIAL TARGETS FOR WIND ENERGY
Early in 2011, the National Energy Administration (NEA) released the 12th Five-Year plan for renewable energy� This includes a
target of 100 GW of wind by 2015, consisting of 70 GW from the large Wind Base programme, 30 GW from smaller projects, and an additional 5 GW from offshore wind�
China’s current FIT was introduced in 2009, with an effective date of 1st August 2009� There are four different tariffs for regions with different wind resources: CNY 0�51/kWh, CNY 0�54/kWh, CNY 0�58/kWh and CNY 0�61/kWh�
Discussions about lowering China’s feed-in-tariff for wind power have been going on for at least a year, and there is now a concrete proposal initiated by the Price and Tariff Department of the National Development and Reform Commission (NDRC)� It seems to be driven by lower equipment prices, lower overall wind system costs and perhaps most importantly, a reduction in the price of coal-fired electricity, which will reduce the amount of money available for the Renewable Energy Fund which finances the premium�
According to informed sources and news reports, the latest draft that is now out for consultation with stakeholders proposes reducing the existing tariffs by CNY 0�04 for
C H I N A – TOTA L W I N D P O W E R C A PAC I T Y I N M W
MW
0
100,000
200,000
300,000
400,000
500,000 Advanced scenarioModerate scenarioNew Policies scenario
20302020201520112010 2013 2014 2015 2020 2030
New Policies scenario 91,424 108,504 125,300 208,387 310,195Moderate scenario 91,424 108,585 125,546 216,646 414,406Advanced scenario 91,424 108,989 126,787 230,048 497,505
5 http://cleantechnica�com/2014/04/08/chinas-renewable-energy-revolution-global-implications/
31GLOBAL WIND ENERGY OUTLOOK | 2014
3T H E R EG ION A L SC E N A R IO R E S U LT S
the three lower tariffs and CNY 0�02 for the highest� This amounts to a 7-8% reduction for the windier sites, and a 3% reduction in the lowest wind zone�
The resistance from the developers is very strong, as this reduction can make a big difference to China’s wind industry that is already seeing 10-20% of its profits lost to curtailment, and massive cash flow problems caused by the long delays in FIT premium payments since 2011� While both of these problems were addressed somewhat last year, they still put much pressure on the industry, and to face another big reduction of this sort could be devastating�
So, while the original plan was for the tariffs to be set at the end of this year, to take effect as of 30 June next year, it seems that the controversy means that it could take some months longer� The tariff reduction needs to be seen in the context of the government’s 13th five year plan, which has large plans for wind power and a goal for 200 GW by 2020� The proposed new tariffs will put those targets in jeopardy�
OFFSHORE WIND DEVELOPMENT
China has an offshore wind development target of 5 GW by 2015 and 30 GW by 2030� By 2013, the cumulative offshore installed capacity in China was 428�6 MW, which placed it in the fifth spot behind the U�K�, Denmark, Belgium and Germany�
China’s NEA has been working with the NDRC tariff department for months to determine the FIT for offshore wind, and the discussions between the two agencies have now been finalised: the inter-tidal projects will receive a tariff of CNY 0�75 per kWh while the near-shore tariff was set at CNY 0�85 per kWh�
In the beginning of May 2014, the Shanghai Municipal Government announced additional RE subsidies on top of the FIT given by the central government: onshore wind is given an additional subsidy of CNY 0�1/kWh, while offshore wind a boost of CNY 0�2/kWh�
Following this new measure, the Shanghai Oceanic Administration also permitted a new offshore project, the “Shanghai Lingam Offshore Project, Phase I-100 MW”� The total project capacity will be 200 MW� This is a near shore project and will be another big project for Shanghai after the first two phases of the Shanghai Donghai Bridge project�
Currently China has seven offshore projects under construction totaling 1,566 MW and another 3�5 GW that will start construction in 2015�
THE GWEO SCENARIOS FOR CHINA
In our previous Outlook, published in 2012, the 2020 projections for cumulative capacity were 70 GW (Reference), 200 GW (Moderate) and 250 GW (Advanced)� However – by the end of 2013 China’s total installed capacity had already reached 91 GW� 2014 will see China cross another milestone; it will have over 100 GW of wind power installed by the end of this year� No single market has seen wind power installations of that scale�
With these developments in mind, the scenarios presented in this report have been updated, while the IEA’s New Policy scenario remains rather pessimistic�
In the New Policies Scenario, the Chinese wind energy market will experience a considerable decrease in the rate of annual installations from almost 92 GW of new capacity added by 2013 to a total installed capacity of 208 GW by 2020, which is just a little over the unofficial conservative Chinese target of 200 GW by 2020�
Given the Chinese government’s commitment to developing its wind resources, the GWEO Moderate scenario foresees a realistic continuation of wind power growth in China, with annual installations increasing from last year’s 16 GW to 19 GW by 2020� By 2016, the total installed capacity would rise to reach 143 GW, and this would grow to 217 GW by 2020 and 414 GW by 2030�
32 GLOBAL WIND ENERGY OUTLOOK | 2014
C H A P T E R T I T L E1
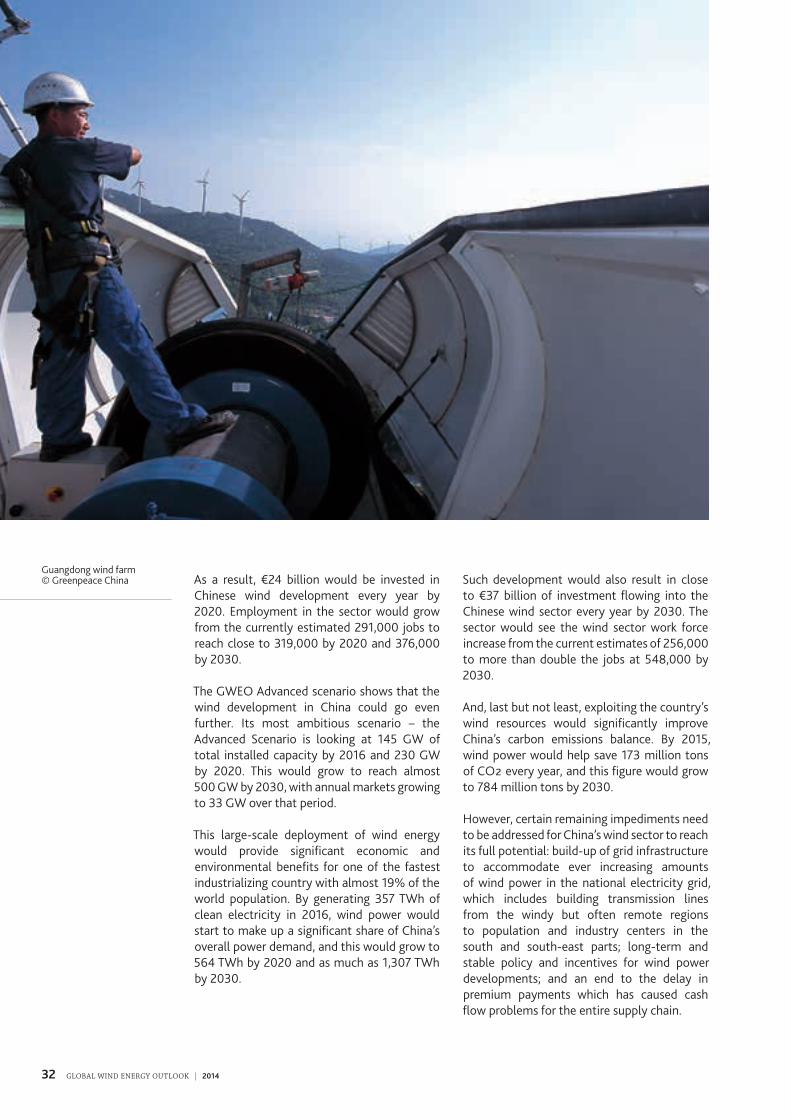
As a result, €24 billion would be invested in Chinese wind development every year by 2020� Employment in the sector would grow from the currently estimated 291,000 jobs to reach close to 319,000 by 2020 and 376,000 by 2030�
The GWEO Advanced scenario shows that the wind development in China could go even further� Its most ambitious scenario – the Advanced Scenario is looking at 145 GW of total installed capacity by 2016 and 230 GW by 2020� This would grow to reach almost 500 GW by 2030, with annual markets growing to 33 GW over that period�
This large-scale deployment of wind energy would provide significant economic and environmental benefits for one of the fastest industrializing country with almost 19% of the world population� By generating 357 TWh of clean electricity in 2016, wind power would start to make up a significant share of China’s overall power demand, and this would grow to 564 TWh by 2020 and as much as 1,307 TWh by 2030�
Such development would also result in close to €37 billion of investment flowing into the Chinese wind sector every year by 2030� The sector would see the wind sector work force increase from the current estimates of 256,000 to more than double the jobs at 548,000 by 2030�
And, last but not least, exploiting the country’s wind resources would significantly improve China’s carbon emissions balance� By 2015, wind power would help save 173 million tons of CO2 every year, and this figure would grow to 784 million tons by 2030�
However, certain remaining impediments need to be addressed for China’s wind sector to reach its full potential: build-up of grid infrastructure to accommodate ever increasing amounts of wind power in the national electricity grid, which includes building transmission lines from the windy but often remote regions to population and industry centers in the south and south-east parts; long-term and stable policy and incentives for wind power developments; and an end to the delay in premium payments which has caused cash flow problems for the entire supply chain�
Guangdong wind farm © Greenpeace China
33GLOBAL WIND ENERGY OUTLOOK | 2014
3T H E R EG ION A L SC E N A R IO R E S U LT S
EASTERN EUROPE/EURASIA
According to the IEA regions, this group of countries ranges from new
European Union members such as the Baltic states, Malta and Cyprus, through Bosnia and Herzegovina, Croatia, Serbia, Slovenia, Romania and Bulgaria and then eastwards into Russia and Ukraine, and finally south-eastwards into central Asia, across the countries that made up the former Soviet Union.
The group covers diverse economies and power systems� Some countries, such as Turkmenistan or Azerbaijan, have massive reserves of oil and gas; others, such as Tajikistan and Albania meet their power needs almost entirely from hydropower, while some countries have to import electricity or fuel or both� However the region’s energy economy is dominated by Russia, which also is the world’s fourth largest power producer, behind the US, China, and Japan6�
All these areas have been assessed to some extent for their renewable energy potential,
and much of the vast Eurasian landmass has excellent wind resources7� To date, the main wind developments have been in the eastern European and Baltic states that became members of the European Union in 20048� These new member states were required to apply the 2001 EU renewables Directive, and their accession treaty set national indicative targets for renewable power production for each state� They are of course now also bound by the EU’s new legislation for 20% of the bloc’s final energy consumption to come from renewable sources, which include a binding target for each country by 2020�
By 2013 there was significant wind power capacity installed for example in Romania (2,599�6 MW), Bulgaria (681�1 MW), Croatia (301�8 MW), Cyprus (146�7 MW), Ukraine (371�3 MW) and the Baltic states of Estonia (279�9 MW) and Lithuania (278�4 MW)�
Romania, which according to the EU Directive must meet 24% of its energy demand by renewables in 2020, had installed 2,599�6 MW
E A S T E R N E U ROPE / E U R A S I A – TOTA L W I N D P O W E R C A PAC I T Y I N M W
MW
0
10,000
20,000
30,000
40,000
50,000
60,000
70,000
80,000 Advanced scenarioModerate scenarioNew Policies scenario
20302020201520112010 2013 2014 2015 2020 2030
New Policies scenario 4,460 5,088 5,509 7,103 14,049Moderate scenario 4,460 5,491 6,626 14,244 62,051Advanced scenario 4,460 5,866 8,327 24,748 75,669
6 Much of the information in this section is derived from the EBRD’s Renewable Development Initiative (www�ebrdrenewables�com)
7 3-Tier wind map www�3tier�com/en/support/resource-maps/ 8 Note that some of these countries, such as Poland, are covered in the
OECD Europe section
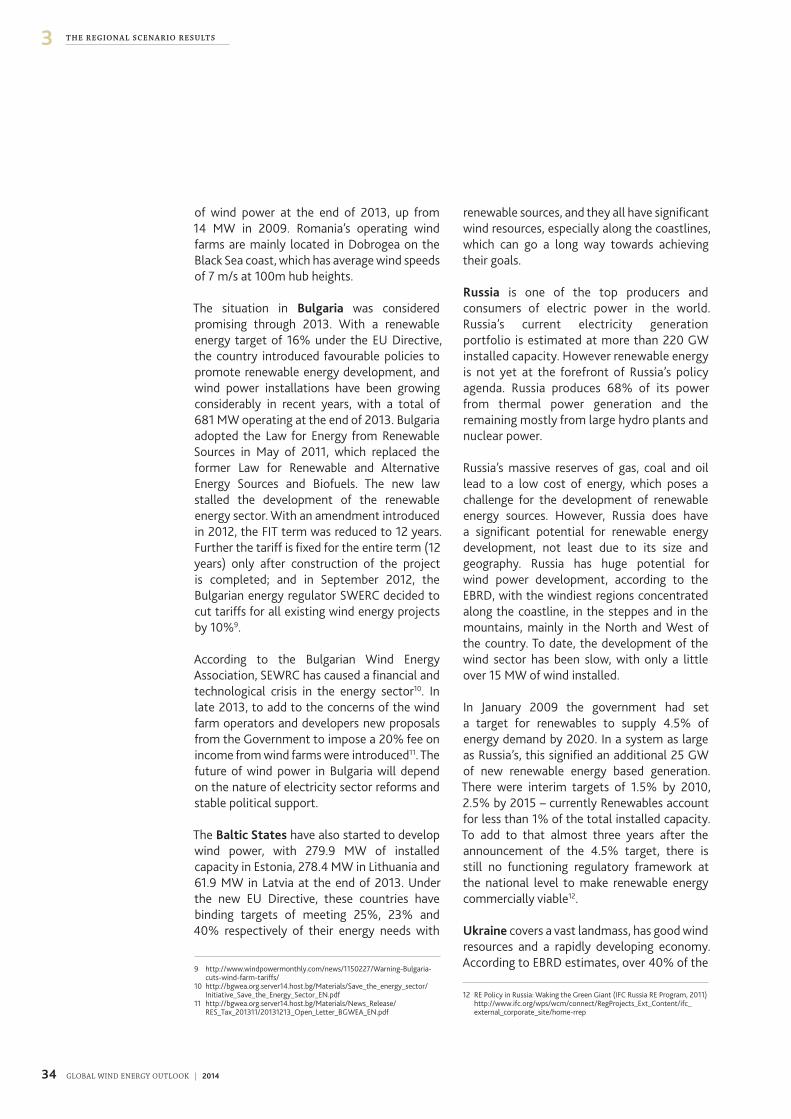
34 GLOBAL WIND ENERGY OUTLOOK | 2014
3 T H E R EG ION A L SC E N A R IO R E S U LT S
of wind power at the end of 2013, up from 14 MW in 2009� Romania’s operating wind farms are mainly located in Dobrogea on the Black Sea coast, which has average wind speeds of 7 m/s at 100m hub heights�
The situation in Bulgaria was considered promising through 2013� With a renewable energy target of 16% under the EU Directive, the country introduced favourable policies to promote renewable energy development, and wind power installations have been growing considerably in recent years, with a total of 681 MW operating at the end of 2013� Bulgaria adopted the Law for Energy from Renewable Sources in May of 2011, which replaced the former Law for Renewable and Alternative Energy Sources and Biofuels� The new law stalled the development of the renewable energy sector� With an amendment introduced in 2012, the FIT term was reduced to 12 years� Further the tariff is fixed for the entire term (12 years) only after construction of the project is completed; and in September 2012, the Bulgarian energy regulator SWERC decided to cut tariffs for all existing wind energy projects by 10%9�
According to the Bulgarian Wind Energy Association, SEWRC has caused a financial and technological crisis in the energy sector10� In late 2013, to add to the concerns of the wind farm operators and developers new proposals from the Government to impose a 20% fee on income from wind farms were introduced11� The future of wind power in Bulgaria will depend on the nature of electricity sector reforms and stable political support�
The Baltic States have also started to develop wind power, with 279�9 MW of installed capacity in Estonia, 278�4 MW in Lithuania and 61�9 MW in Latvia at the end of 2013� Under the new EU Directive, these countries have binding targets of meeting 25%, 23% and 40% respectively of their energy needs with
renewable sources, and they all have significant wind resources, especially along the coastlines, which can go a long way towards achieving their goals�
Russia is one of the top producers and consumers of electric power in the world� Russia’s current electricity generation portfolio is estimated at more than 220 GW installed capacity� However renewable energy is not yet at the forefront of Russia’s policy agenda� Russia produces 68% of its power from thermal power generation and the remaining mostly from large hydro plants and nuclear power�
Russia’s massive reserves of gas, coal and oil lead to a low cost of energy, which poses a challenge for the development of renewable energy sources� However, Russia does have a significant potential for renewable energy development, not least due to its size and geography� Russia has huge potential for wind power development, according to the EBRD, with the windiest regions concentrated along the coastline, in the steppes and in the mountains, mainly in the North and West of the country� To date, the development of the wind sector has been slow, with only a little over 15 MW of wind installed�
In January 2009 the government had set a target for renewables to supply 4�5% of energy demand by 2020� In a system as large as Russia’s, this signified an additional 25 GW of new renewable energy based generation� There were interim targets of 1�5% by 2010, 2�5% by 2015 – currently Renewables account for less than 1% of the total installed capacity� To add to that almost three years after the announcement of the 4�5% target, there is still no functioning regulatory framework at the national level to make renewable energy commercially viable12�
Ukraine covers a vast landmass, has good wind resources and a rapidly developing economy� According to EBRD estimates, over 40% of the
12 RE Policy in Russia: Waking the Green Giant (IFC Russia RE Program, 2011) http://www�ifc�org/wps/wcm/connect/RegProjects_Ext_Content/ifc_external_corporate_site/home-rrep
9 http://www�windpowermonthly�com/news/1150227/Warning-Bulgaria-cuts-wind-farm-tariffs/
10 http://bgwea�org�server14�host�bg/Materials/Save_the_energy_sector/Initiative_Save_the_Energy_Sector_EN�pdf
11 http://bgwea�org�server14�host�bg/Materials/News_Release/RES_Tax_201311/20131213_Open_Letter_BGWEA_EN�pdf
35GLOBAL WIND ENERGY OUTLOOK | 2014
1C H A P T E R T I T L E
country’s territory would be suitable for wind generation� Wind installations in the country are growing, but the growth could be faster�
Further east, several countries including Kazakhstan, Turkmenistan, Azerbaijan and Uzbekistan have areas with excellent wind resources, but large oil and gas reserves have to date been a disincentive to any renewable energy development� Kazakhstan has huge wind potential, but has not yet perfected regulations to cover renewable energy development� Countries with fewer fossil fuel resources, such as Kyrgyzstan and Tajikistan might be more promising for wind power development in the short and medium term, but no development has taken place to date�
THE GWEO SCENARIOS FOR EASTERN EUROPE/ EURASIA
Apart from the new EU member states in this region, which are undertaking considerable efforts to catch up in terms of renewable energy deployment, no substantial development has taken place in Eastern Europe� Projection of the installed wind power capacity in the near and mid-term future is particularly difficult in this region, as this will largely depend on political decisions in some key countries, especially Russia and Ukraine� If they decide to exploit the tremendous resource at their doorstep and provide the necessary incentives for attracting investors, wind power generation could play a key role in fuelling the growing economies� Without political will, however, the Eurasian wind markets will not gain momentum�
According to the IEA’s New Policy Scenario cumulatively these markets across the whole region (including the new EU member states) grow to 7 GW by 2020 and 14 GW by 2030, up from under 2 GW in 2011�
This development would not have a major impact on power generation, economic growth or emissions savings in these countries� In 2020, wind power would produce 17 TWh across the entire region and rise to 37 TWh by 2030� By 2030 investment in wind power would amount
to about €1�3 billion by 2030, and employment in the wind sector would stand at around 17,000 jobs�
If one compares it to the actual generation and consumption in Russia alone, this is insignificant� In 2011, electric power generation totaled approximately 996 billion kWh, and Russia consumed about 861 billion kWh13�
The Moderate scenario is slightly more optimistic, assuming that both the EU member states and some other countries with existing renewable energy targets will meet these as planned� The installed capacity would stand at 14 GW in 2020 and 62 GW by 2030�The resulting benefits for power generation and climate protection would be higher under this scenario�
In terms of investment and jobs, the GWEO Moderate scenario figures would translate into investments worth €2�1 billion in 2020, creating approximately 28,000 jobs, and €8�3 billion in 2030 with a workforce of 110,000 people in the wind sector�
The figures in the GWEO Advanced scenario are slightly higher� Here, 25 GW of wind power would be installed by 2020, producing 61 TWh and saving 36 million tons of CO2 emissions per year� The cumulative capacity would increase to 76 GW by 2030, producing 199 TWh, which would translate into €6�1 billion worth of investment in the sector annually�
13 http://www�eia�gov/countries/country-data�cfm?fips=rs
Jelinak wind farm, Croatia © Acciona
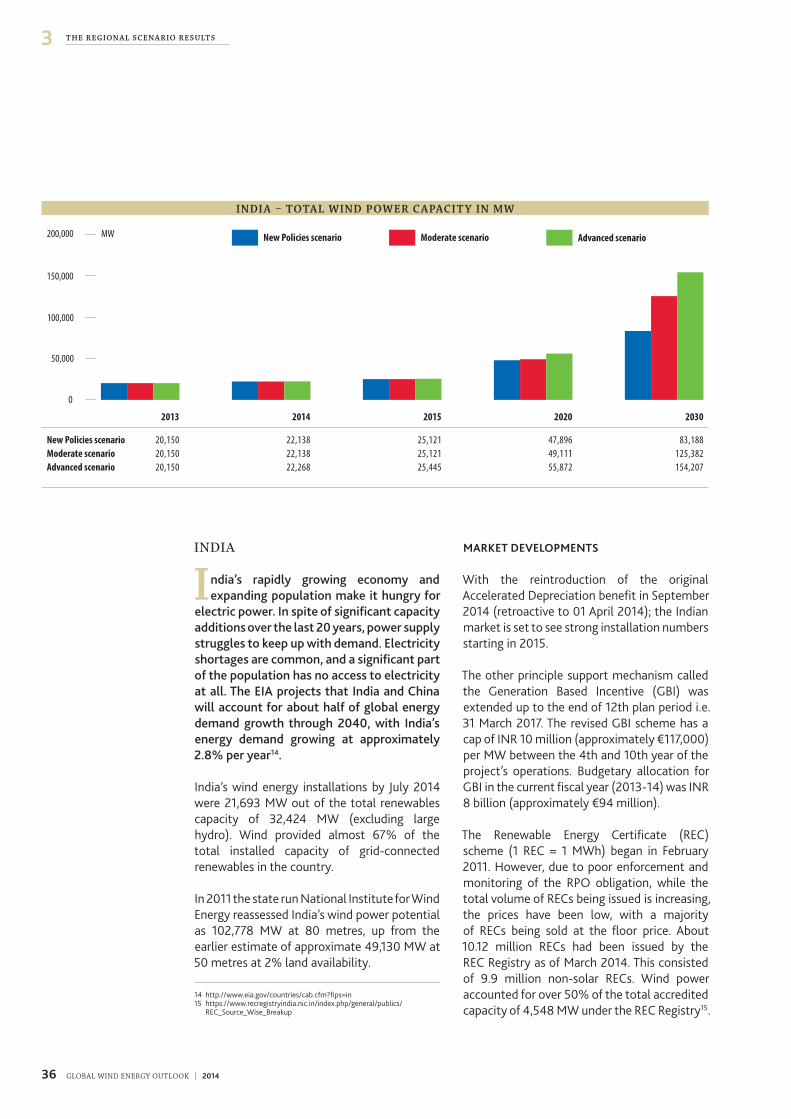
36 GLOBAL WIND ENERGY OUTLOOK | 2014
3 T H E R EG ION A L SC E N A R IO R E S U LT S
INDIA
India’s rapidly growing economy and expanding population make it hungry for
electric power. In spite of significant capacity additions over the last 20 years, power supply struggles to keep up with demand. Electricity shortages are common, and a significant part of the population has no access to electricity at all. The EIA projects that India and China will account for about half of global energy demand growth through 2040, with India’s energy demand growing at approximately 2.8% per year14.
India’s wind energy installations by July 2014 were 21,693 MW out of the total renewables capacity of 32,424 MW (excluding large hydro)� Wind provided almost 67% of the total installed capacity of grid-connected renewables in the country�
In 2011 the state run National Institute for Wind Energy reassessed India’s wind power potential as 102,778 MW at 80 metres, up from the earlier estimate of approximate 49,130 MW at 50 metres at 2% land availability�
MARKET DEVELOPMENTS
With the reintroduction of the original Accelerated Depreciation benefit in September 2014 (retroactive to 01 April 2014); the Indian market is set to see strong installation numbers starting in 2015�
The other principle support mechanism called the Generation Based Incentive (GBI) was extended up to the end of 12th plan period i�e� 31 March 2017� The revised GBI scheme has a cap of INR 10 million (approximately €117,000) per MW between the 4th and 10th year of the project’s operations� Budgetary allocation for GBI in the current fiscal year (2013-14) was INR 8 billion (approximately €94 million)�
The Renewable Energy Certificate (REC) scheme (1 REC = 1 MWh) began in February 2011� However, due to poor enforcement and monitoring of the RPO obligation, while the total volume of RECs being issued is increasing, the prices have been low, with a majority of RECs being sold at the floor price� About 10�12 million RECs had been issued by the REC Registry as of March 2014� This consisted of 9�9 million non-solar RECs� Wind power accounted for over 50% of the total accredited capacity of 4,548 MW under the REC Registry15�
I N DI A – TOTA L W I N D P O W E R C A PAC I T Y I N M W
MW
0
50,000
100,000
150,000
200,000 Advanced scenarioModerate scenarioNew Policies scenario
20302020201520112010 2013 2014 2015 2020 2030
New Policies scenario 20,150 22,138 25,121 47,896 83,188Moderate scenario 20,150 22,138 25,121 49,111 125,382Advanced scenario 20,150 22,268 25,445 55,872 154,207
14 http://www�eia�gov/countries/cab�cfm?fips=in15 https://www�recregistryindia�nic�in/index�php/general/publics/
REC_Source_Wise_Breakup
37GLOBAL WIND ENERGY OUTLOOK | 2014
3T H E R EG ION A L SC E N A R IO R E S U LT S
Annual wind installations fell from over 3 GW in 2011 to 2�3 GW in 2012 to 1�7 GW in 2013� 2013 was one of the toughest years for the Indian wind industry since the economic recession of 2008�
The industry has faced various challenges including the withdrawal of accelerated depreciation benefits, challenges in transmission, scheduling and forecasting, lack of an integrated energy plan among others which precipitated a significant drop in capacity additions� Though wind power accounted for over half of the registered generation capacity under the REC registry, making RECs a widely accepted instrument and a revenue stream for the project financing community remains a challenge in India, especially with the limited validity of five years of the REC certificates�
TARGETS
The report of the sub-group for wind power development appointed by the Ministry of New and Renewable Energy to develop the approach paper for the 12th Plan Period (April 2012 to March 2017) has fixed a reference target of 15 GW in new capacity additions, and an aspirational target of 25 GW for the next five-year period�
However, a National Wind Energy Mission (NWEM) is likely to be announced in 2014� This would introduce long-term plan targets for the wind sector and provide a more stable policy platform� The approved outlay for 12th plan for New and Renewable Energy programmes was INR 33 billion (approximately €387 million), which is almost 3 times that for the 11th five-year plan period (2007-12)�
In addition to streamlining various existing policy initiatives, new actions such as the NWEM are considered essential to accelerating the pace of deployment of clean energy technologies� After the recent announcement of the NWEM, the industry is hopeful of a recovery over 2014-2015� The strength of the recovery will be closely linked to how effectively the NWEM and its contents
can be made operational and how well it is designed� If everything goes according to expectation then during the Indian financial year 2014-15 wind capacity addition is likely to cross 2,500 MW�
Finally, over the last two years there has been a plan to look at harvesting India’s large offshore potential� While not much development is expected in the near term, after 2020 this could add significantly to the Indian wind market�16
THE GWEO SCENARIOS FOR INDIA
Under the IEA New Policies scenario, India’s wind power market would shrink considerably out to 2020� The result would be a total installed capacity of 47 GW by 2020 and 83 GW by 2030� Wind power would then produce close to 117 TWh every year by 2020 and 219 TWh by 2030, and help save 70 million tons of CO2 in 2020 and 131 million tons in 2030�
Under the Moderate scenario, the total installed capacity would reach 29 GW by 2015, and this would grow to 49 GW by 2020 and 125 GW by 2030�The wind industry will see investments of €6�6 billion per year by 2020 and €10�3 billion per year by 2030� Employment in the sector would grow to over 86,000 by 2020 and over 145,000 jobs ten years later�
Nevertheless the GWEO Advanced scenario shows that the wind development in India could go much further: by 2020 India could have almost 56 GW of wind power in operation, supplying 137 TWh of electricity each year, while employing over 123,000 people in the sector and saving 82 million tonnes of CO2 emissions each year� Investment would reach a level of €8�6 billion per year� By 2030 wind power would generate over 400 TWh per year and avoid the emission of 243 million tons of CO2 each year� Investment would by then have reached a level of €10�5 billion per year�
16 See http://fowind�in
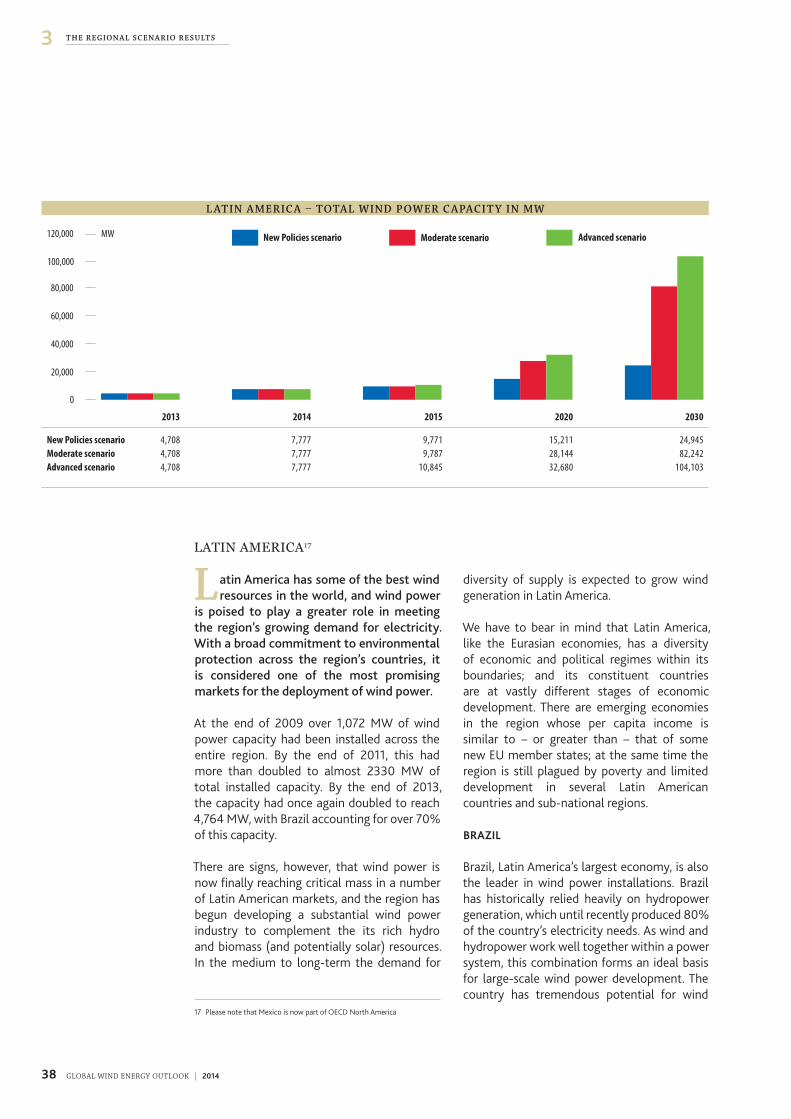
38 GLOBAL WIND ENERGY OUTLOOK | 2014
3 T H E R EG ION A L SC E N A R IO R E S U LT S
LATIN AMERICA17
Latin America has some of the best wind resources in the world, and wind power
is poised to play a greater role in meeting the region’s growing demand for electricity. With a broad commitment to environmental protection across the region’s countries, it is considered one of the most promising markets for the deployment of wind power.
At the end of 2009 over 1,072 MW of wind power capacity had been installed across the entire region� By the end of 2011, this had more than doubled to almost 2330 MW of total installed capacity� By the end of 2013, the capacity had once again doubled to reach 4,764 MW, with Brazil accounting for over 70% of this capacity�
There are signs, however, that wind power is now finally reaching critical mass in a number of Latin American markets, and the region has begun developing a substantial wind power industry to complement the its rich hydro and biomass (and potentially solar) resources� In the medium to long-term the demand for
diversity of supply is expected to grow wind generation in Latin America�
We have to bear in mind that Latin America, like the Eurasian economies, has a diversity of economic and political regimes within its boundaries; and its constituent countries are at vastly different stages of economic development� There are emerging economies in the region whose per capita income is similar to – or greater than – that of some new EU member states; at the same time the region is still plagued by poverty and limited development in several Latin American countries and sub-national regions�
BRAZIL
Brazil, Latin America’s largest economy, is also the leader in wind power installations� Brazil has historically relied heavily on hydropower generation, which until recently produced 80% of the country’s electricity needs� As wind and hydropower work well together within a power system, this combination forms an ideal basis for large-scale wind power development� The country has tremendous potential for wind
L AT I N A M E R IC A – TOTA L W I N D P O W E R C A PAC I T Y I N M W
MW
0
20,000
40,000
60,000
80,000
100,000
120,000 Advanced scenarioModerate scenarioNew Policies scenario
20302020201520112010 2013 2014 2015 2020 2030
New Policies scenario 4,708 7,777 9,771 15,211 24,945Moderate scenario 4,708 7,777 9,787 28,144 82,242Advanced scenario 4,708 7,777 10,845 32,680 104,103
17 Please note that Mexico is now part of OECD North America
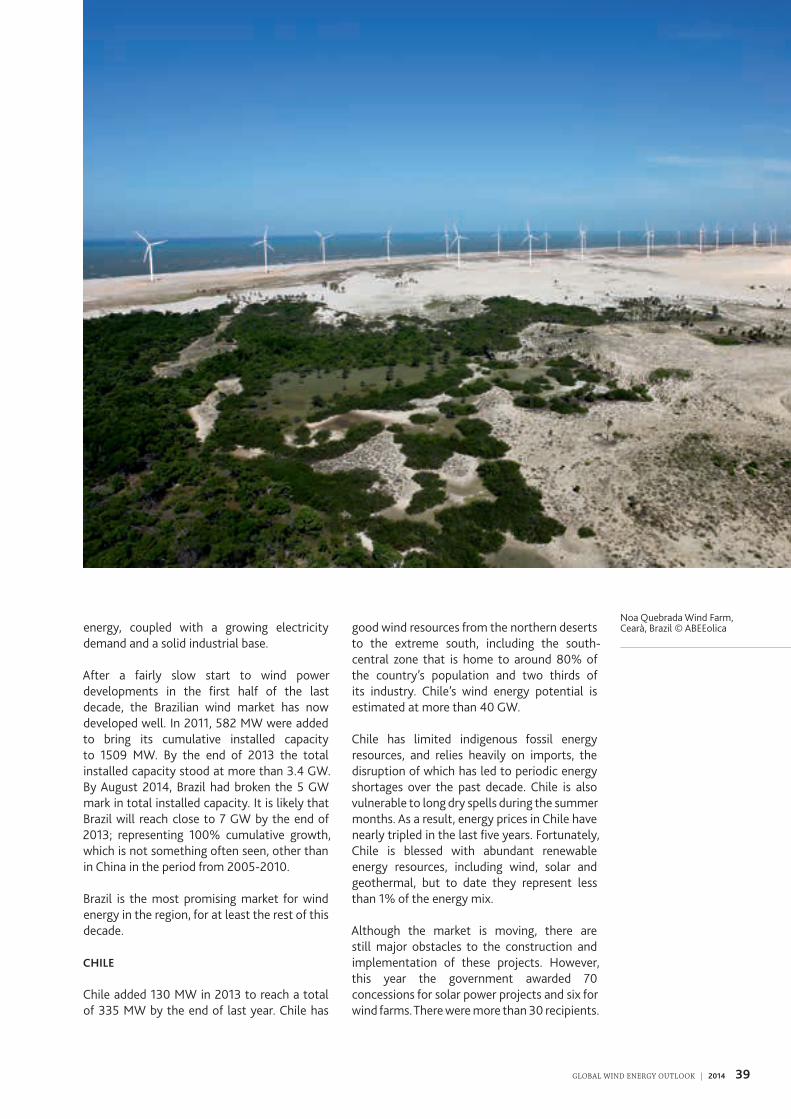
39GLOBAL WIND ENERGY OUTLOOK | 2014
1C H A P T E R T I T L E
energy, coupled with a growing electricity demand and a solid industrial base�
After a fairly slow start to wind power developments in the first half of the last decade, the Brazilian wind market has now developed well� In 2011, 582 MW were added to bring its cumulative installed capacity to 1509 MW� By the end of 2013 the total installed capacity stood at more than 3�4 GW� By August 2014, Brazil had broken the 5 GW mark in total installed capacity� It is likely that Brazil will reach close to 7 GW by the end of 2013; representing 100% cumulative growth, which is not something often seen, other than in China in the period from 2005-2010�
Brazil is the most promising market for wind energy in the region, for at least the rest of this decade�
CHILE
Chile added 130 MW in 2013 to reach a total of 335 MW by the end of last year� Chile has
good wind resources from the northern deserts to the extreme south, including the south-central zone that is home to around 80% of the country’s population and two thirds of its industry� Chile’s wind energy potential is estimated at more than 40 GW�
Chile has limited indigenous fossil energy resources, and relies heavily on imports, the disruption of which has led to periodic energy shortages over the past decade� Chile is also vulnerable to long dry spells during the summer months� As a result, energy prices in Chile have nearly tripled in the last five years� Fortunately, Chile is blessed with abundant renewable energy resources, including wind, solar and geothermal, but to date they represent less than 1% of the energy mix�
Although the market is moving, there are still major obstacles to the construction and implementation of these projects� However, this year the government awarded 70 concessions for solar power projects and six for wind farms� There were more than 30 recipients�
Noa Quebrada Wind Farm, Cearà, Brazil © ABEEolica
40 GLOBAL WIND ENERGY OUTLOOK | 2014
3 T H E R EG ION A L SC E N A R IO R E S U LT S
Renewable-energy developers plan to invest over €5�5 billion (US$ 7 billion) for wind and solar projects in Chile over the coming years18�
OTHER MARKETS
Uruguay added to its total tally with the commissioning of 4 MW of new capacity, bringing its total installed capacity up to 59 MW by the end of 2013� The expectation is that Uruguay could have 2 GW of wind power installed by 2020� A prospect for increasing wind power in the region could be a planned interconnection between Uruguay and Brazil�
Another promising market is Argentina with massive wind resources� Argentina added 76 MW of new capacity to bring its total installed capacity up to 218 MW in 2013� A number of large wind power projects are under development, and they are desperately needed to help alleviate chronic electricity shortages, although short-sighted government policies have recently discouraged investors� Some analysts claim that the winds in Argentina are sufficient to supply Latin America’s entire electrical demand seven times over�
Other wind power markets in the region include: Costa Rica, which had about 148 MW of wind power at the end of 2013; Honduras, which has over 102 MW of wind power at the end of 2013; Nicaragua, which boasts 145�7 MW of total capacity; Ecuador has 30 MW of wind capacity; Colombia had installed 11�7 MW; and the Dominican Republic had 33 MW of wind capacity, thereby joining the list of countries with commercial-scale wind power development�
Finally, although there is some development of wind power in the island economies in the Caribbean, which currently mostly rely on imported fossil fuels, wind power could play a much more substantial role in helping grow their economies on a more sustainable basis� Jamaica has 41�7 MW of installed wind capacity; Dominican Republic had a total capacity of
33 MW and Aruba had over 30 MW of installed wind power capacity at the end of 2013�
Unfortunately, however, all of these early markets suffer from the lack of a clear, long-term policy framework for the development of a wind power industry, which continues to hamper market development�
THE GWEO SCENARIOS FOR LATIN AMERICA
GWEC expects wind energy installations in Latin America to be considerably stronger by 2020, with encouraging developments in markets such as Brazil and Chile�
Under the NPS there would be 15 GW by 2020 and 25 GW of wind installed across the entire region by 2030�
The Moderate scenario, which takes into account current policies and targets, foresees a much more rapid development� This would bring the total installed wind capacity to 28 GW by 2020 and 82 GW by 2030� The impact on electricity production would be considerable, with 86 TWh of wind power generated in 2020 and 252 TWh in 2030�
The Advanced scenario indicates that even more could be achieved, given the extraordinary wind conditions in many Latin American countries� The wind sector could reach nearly 11 GW by 2016, and this would increase to 33 GW by 2020 and as much as 104 GW by 2030�
With such a development, wind power would start to account for a significant part of electricity supply, producing more than 100 TWh by 2020 and 319 TWh by 2030� Wind power developed at such a scale would not only strengthen Latin America’s energy independence, but it would also have a direct impact on regional economic development and jobs�
Wind power would attract substantial investment; the Advanced scenario estimates that Latin America’s wind sector could channel over €8�6 billion annually by 2030, compared to just €1�4 billion in 2013�
18 http://www�bloomberg�com/news/2014-08-14/renewable-energy-companies-to-invest-7-billion-in-chile-power�html
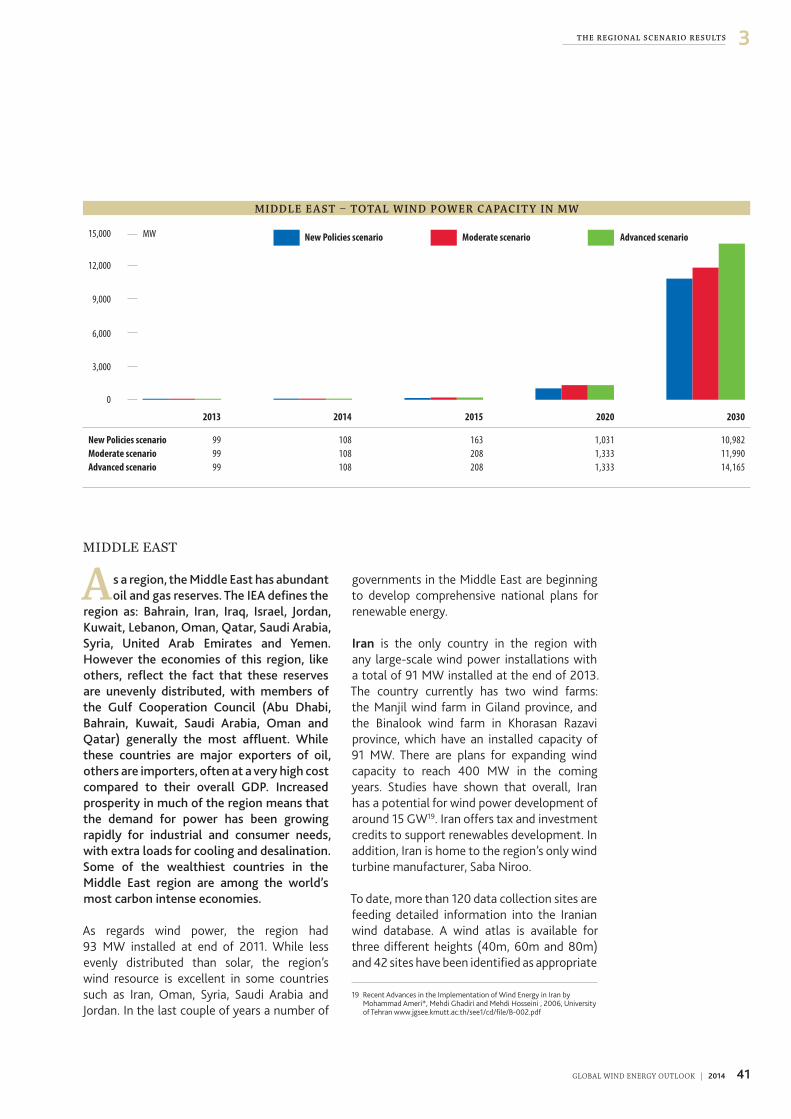
41GLOBAL WIND ENERGY OUTLOOK | 2014
3T H E R EG ION A L SC E N A R IO R E S U LT S
MIDDLE EAST
A s a region, the Middle East has abundant oil and gas reserves. The IEA defines the
region as: Bahrain, Iran, Iraq, Israel, Jordan, Kuwait, Lebanon, Oman, Qatar, Saudi Arabia, Syria, United Arab Emirates and Yemen. However the economies of this region, like others, reflect the fact that these reserves are unevenly distributed, with members of the Gulf Cooperation Council (Abu Dhabi, Bahrain, Kuwait, Saudi Arabia, Oman and Qatar) generally the most affluent. While these countries are major exporters of oil, others are importers, often at a very high cost compared to their overall GDP. Increased prosperity in much of the region means that the demand for power has been growing rapidly for industrial and consumer needs, with extra loads for cooling and desalination. Some of the wealthiest countries in the Middle East region are among the world’s most carbon intense economies.
As regards wind power, the region had 93 MW installed at end of 2011� While less evenly distributed than solar, the region’s wind resource is excellent in some countries such as Iran, Oman, Syria, Saudi Arabia and Jordan� In the last couple of years a number of
governments in the Middle East are beginning to develop comprehensive national plans for renewable energy�
Iran is the only country in the region with any large-scale wind power installations with a total of 91 MW installed at the end of 2013� The country currently has two wind farms: the Manjil wind farm in Giland province, and the Binalook wind farm in Khorasan Razavi province, which have an installed capacity of 91 MW� There are plans for expanding wind capacity to reach 400 MW in the coming years� Studies have shown that overall, Iran has a potential for wind power development of around 15 GW19� Iran offers tax and investment credits to support renewables development� In addition, Iran is home to the region’s only wind turbine manufacturer, Saba Niroo�
To date, more than 120 data collection sites are feeding detailed information into the Iranian wind database� A wind atlas is available for three different heights (40m, 60m and 80m) and 42 sites have been identified as appropriate
M I DD L E E A S T – TOTA L W I N D P O W E R C A PAC I T Y I N M W
MW
0
3,000
6,000
9,000
12,000
15,000 Advanced scenarioModerate scenarioNew Policies scenario
20302020201520112010 2013 2014 2015 2020 2030
New Policies scenario 99 108 163 1,031 10,982Moderate scenario 99 108 208 1,333 11,990Advanced scenario 99 108 208 1,333 14,165
19 Recent Advances in the Implementation of Wind Energy in Iran by Mohammad Ameri*, Mehdi Ghadiri and Mehdi Hosseini , 2006, University of Tehran www�jgsee�kmutt�ac�th/see1/cd/file/B-002�pdf
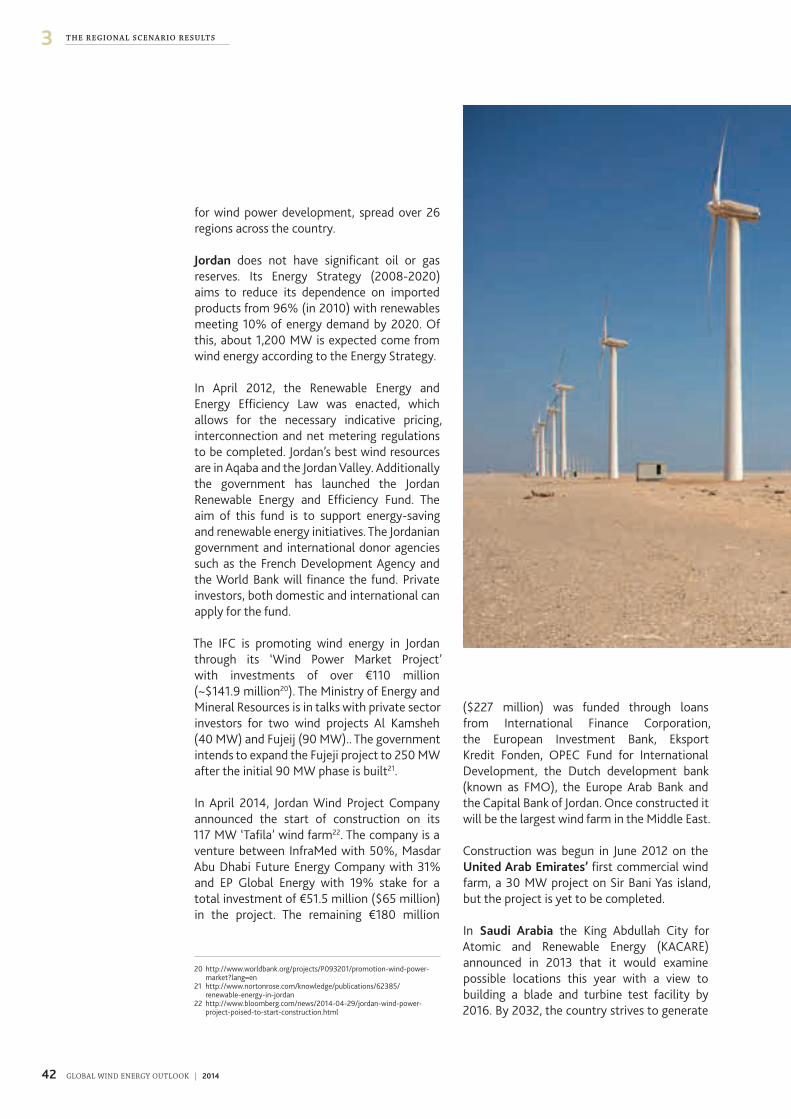
42 GLOBAL WIND ENERGY OUTLOOK | 2014
3 T H E R EG ION A L SC E N A R IO R E S U LT S
for wind power development, spread over 26 regions across the country�
Jordan does not have significant oil or gas reserves� Its Energy Strategy (2008-2020) aims to reduce its dependence on imported products from 96% (in 2010) with renewables meeting 10% of energy demand by 2020� Of this, about 1,200 MW is expected come from wind energy according to the Energy Strategy�
In April 2012, the Renewable Energy and Energy Efficiency Law was enacted, which allows for the necessary indicative pricing, interconnection and net metering regulations to be completed� Jordan’s best wind resources are in Aqaba and the Jordan Valley� Additionally the government has launched the Jordan Renewable Energy and Efficiency Fund� The aim of this fund is to support energy-saving and renewable energy initiatives� The Jordanian government and international donor agencies such as the French Development Agency and the World Bank will finance the fund� Private investors, both domestic and international can apply for the fund�
The IFC is promoting wind energy in Jordan through its ‘Wind Power Market Project’ with investments of over €110 million (~$141�9 million20)� The Ministry of Energy and Mineral Resources is in talks with private sector investors for two wind projects Al Kamsheh (40 MW) and Fujeij (90 MW)�� The government intends to expand the Fujeji project to 250 MW after the initial 90 MW phase is built21�
In April 2014, Jordan Wind Project Company announced the start of construction on its 117 MW ‘Tafila’ wind farm22� The company is a venture between InfraMed with 50%, Masdar Abu Dhabi Future Energy Company with 31% and EP Global Energy with 19% stake for a total investment of €51�5 million ($65 million) in the project� The remaining €180 million
($227 million) was funded through loans from International Finance Corporation, the European Investment Bank, Eksport Kredit Fonden, OPEC Fund for International Development, the Dutch development bank (known as FMO), the Europe Arab Bank and the Capital Bank of Jordan� Once constructed it will be the largest wind farm in the Middle East�
Construction was begun in June 2012 on the United Arab Emirates’ first commercial wind farm, a 30 MW project on Sir Bani Yas island, but the project is yet to be completed�
In Saudi Arabia the King Abdullah City for Atomic and Renewable Energy (KACARE) announced in 2013 that it would examine possible locations this year with a view to building a blade and turbine test facility by 2016� By 2032, the country strives to generate
20 http://www�worldbank�org/projects/P093201/promotion-wind-power-market?lang=en
21 http://www�nortonrose�com/knowledge/publications/62385/renewable-energy-in-jordan
22 http://www�bloomberg�com/news/2014-04-29/jordan-wind-power-project-poised-to-start-construction�html
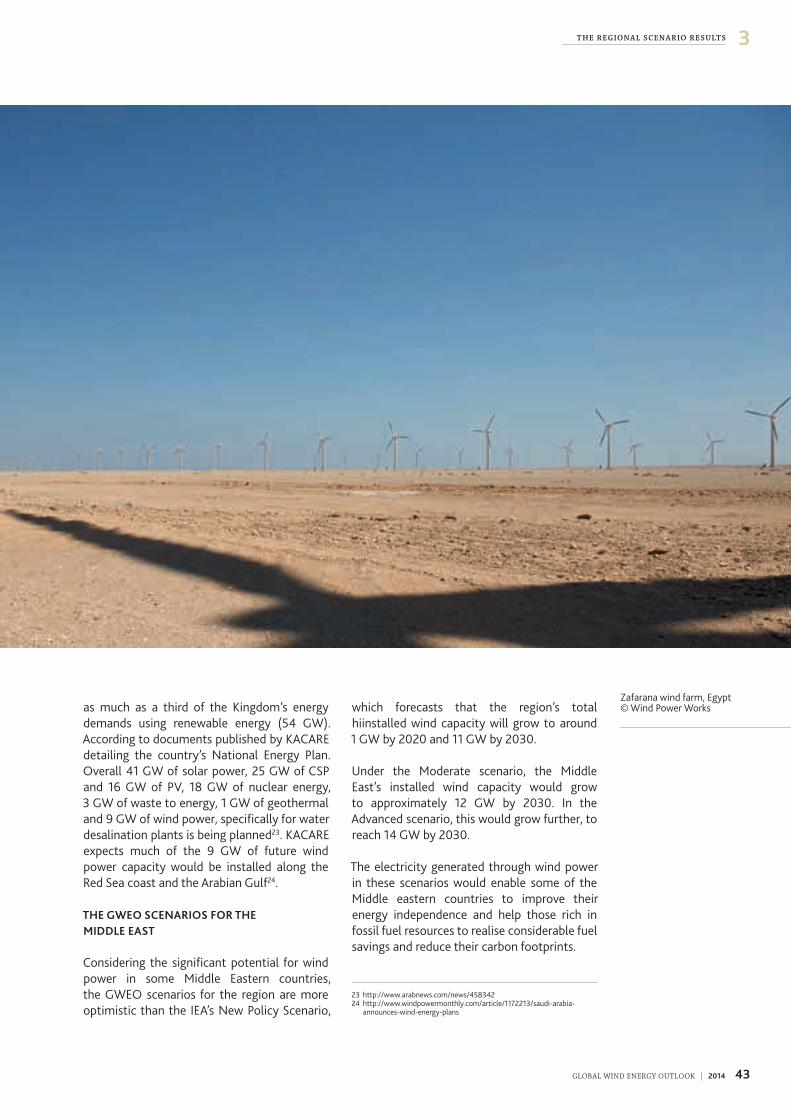
43GLOBAL WIND ENERGY OUTLOOK | 2014
3T H E R EG ION A L SC E N A R IO R E S U LT S
as much as a third of the Kingdom’s energy demands using renewable energy (54 GW)� According to documents published by KACARE detailing the country’s National Energy Plan� Overall 41 GW of solar power, 25 GW of CSP and 16 GW of PV, 18 GW of nuclear energy, 3 GW of waste to energy, 1 GW of geothermal and 9 GW of wind power, specifically for water desalination plants is being planned23� KACARE expects much of the 9 GW of future wind power capacity would be installed along the Red Sea coast and the Arabian Gulf24�
THE GWEO SCENARIOS FOR THE MIDDLE EAST
Considering the significant potential for wind power in some Middle Eastern countries, the GWEO scenarios for the region are more optimistic than the IEA’s New Policy Scenario,
which forecasts that the region’s total hiinstalled wind capacity will grow to around 1 GW by 2020 and 11 GW by 2030�
Under the Moderate scenario, the Middle East’s installed wind capacity would grow to approximately 12 GW by 2030� In the Advanced scenario, this would grow further, to reach 14 GW by 2030�
The electricity generated through wind power in these scenarios would enable some of the Middle eastern countries to improve their energy independence and help those rich in fossil fuel resources to realise considerable fuel savings and reduce their carbon footprints�
23 http://www�arabnews�com/news/458342 24 http://www�windpowermonthly�com/article/1172213/saudi-arabia-
announces-wind-energy-plans
Zafarana wind farm, Egypt © Wind Power Works
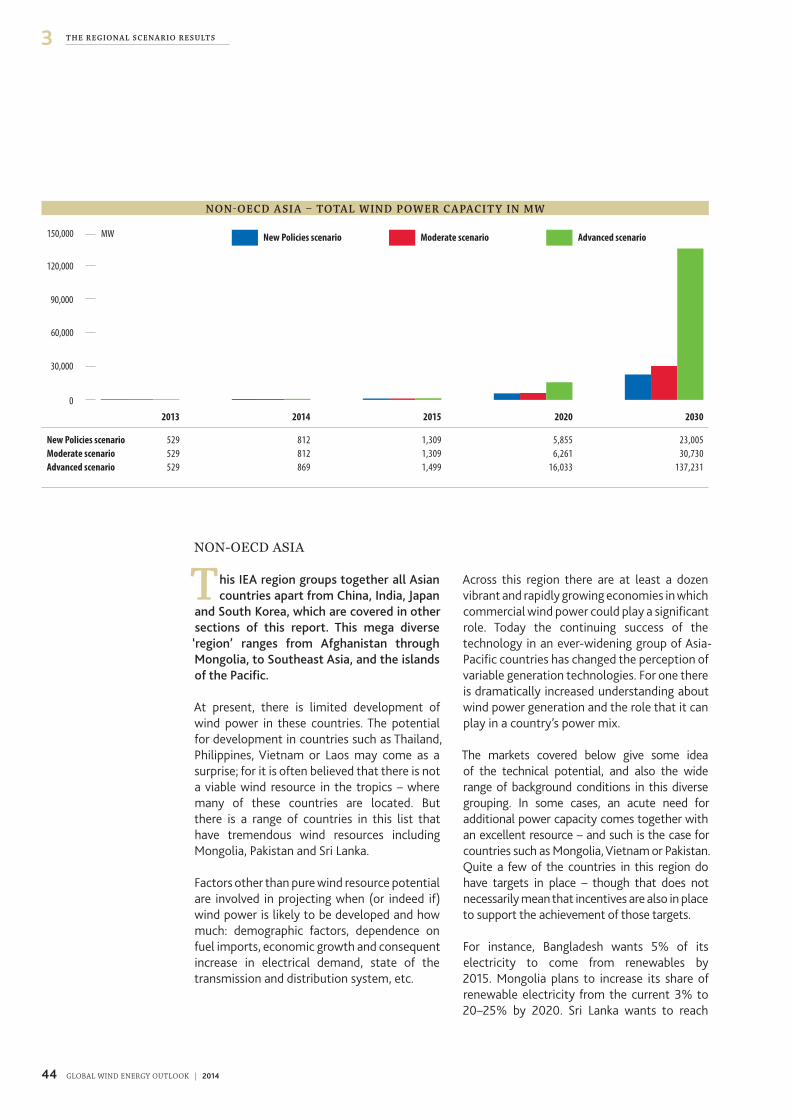
44 GLOBAL WIND ENERGY OUTLOOK | 2014
3 T H E R EG ION A L SC E N A R IO R E S U LT S
NON-OECD ASIA
This IEA region groups together all Asian countries apart from China, India, Japan
and South Korea, which are covered in other sections of this report. This mega diverse ‘region’ ranges from Afghanistan through Mongolia, to Southeast Asia, and the islands of the Pacific.
At present, there is limited development of wind power in these countries� The potential for development in countries such as Thailand, Philippines, Vietnam or Laos may come as a surprise; for it is often believed that there is not a viable wind resource in the tropics – where many of these countries are located� But there is a range of countries in this list that have tremendous wind resources including Mongolia, Pakistan and Sri Lanka�
Factors other than pure wind resource potential are involved in projecting when (or indeed if) wind power is likely to be developed and how much: demographic factors, dependence on fuel imports, economic growth and consequent increase in electrical demand, state of the transmission and distribution system, etc�
Across this region there are at least a dozen vibrant and rapidly growing economies in which commercial wind power could play a significant role� Today the continuing success of the technology in an ever-widening group of Asia-Pacific countries has changed the perception of variable generation technologies� For one there is dramatically increased understanding about wind power generation and the role that it can play in a country’s power mix�
The markets covered below give some idea of the technical potential, and also the wide range of background conditions in this diverse grouping� In some cases, an acute need for additional power capacity comes together with an excellent resource – and such is the case for countries such as Mongolia, Vietnam or Pakistan� Quite a few of the countries in this region do have targets in place – though that does not necessarily mean that incentives are also in place to support the achievement of those targets�
For instance, Bangladesh wants 5% of its electricity to come from renewables by 2015� Mongolia plans to increase its share of renewable electricity from the current 3% to 20–25% by 2020� Sri Lanka wants to reach
N ON - O E C D A S I A – TOTA L W I N D P O W E R C A PAC I T Y I N M W
MW
0
30,000
60,000
90,000
120,000
150,000 Advanced scenarioModerate scenarioNew Policies scenario
20302020201520112010 2013 2014 2015 2020 2030
New Policies scenario 529 812 1,309 5,855 23,005Moderate scenario 529 812 1,309 6,261 30,730Advanced scenario 529 869 1,499 16,033 137,231
45GLOBAL WIND ENERGY OUTLOOK | 2014
3T H E R EG ION A L SC E N A R IO R E S U LT S
14% by 2022, Tonga is targeting 50% by 2012, and Indonesia wants to build 255 MW of wind capacity by 2025 (alongside other renewable technologies such as 6 GW of geothermal)�
Some wind power development has already taken place in this region, including:
In Pakistan, there is an acute power shortage, and a strong increase in power demand� Most of the country’s power needs to date are met by fossil fuels� Today almost 65% of Pakistan’s electricity is generated with fossil fuels, of which 80% is imported� 2013 saw Pakistan’s cumulative wind power capacity reach 106 MW�
The Pakistani government wishes to exploit indigenous resources and reduce dependence on imported fuel� According to Pakistan’s Alternative Energy Development board, wind power offers a technical potential of 350GW with the Gharo-keti Bandar wind corridor in Sindh alone accounting for almost 50GW of this potential� In September 2014, two private companies – HydroChina and Dawood Power Limited signed agreements with the provincial government of Sindh for setting up a 50MW wind power project near Gharo, Sindh� Officials of the provincial energy department announced that almost 40 companies were involved in the province to produce 3GW of wind power from the wind corridor� Another 50MW project was being executed by China’s Three Gorges Dam Company, which would start supplying electricity to the national grid by the end of 201425�
In the Philippines, 33 MW of wind power were operating at the end of 2011, but the technical potential is estimated at around 55 GW according to UNEP’s Solar and Wind Resource Assessment (SWERA)26� The government set a target for 40% of its electricity to be generated by renewable sources by 2020� Both the Philippines government and the Asian Development bank (ADB) have set up funds to help with this process� However, stable and
planned developments in the wind sector are yet to be realised largely due to regulatory and political hurdles�
Thailand’s growing affluence has led to a startling rise in per capita electricity consumption, which has grown by almost 25% in the past five years� By the end of 2011, Thailand had installed only 7�2 MW of wind, but by 2013 its installed capacity had grown to 222�7 MW�
According to SWERA figures, Thailand’s technical wind resource could support the development of 190 GW of wind power� The government launched its 10 years Alternative Energy Development Plan (AEDP-Master Plan 2012-2021) that set a target for 25 % of renewable energy in Thailand’s total energy consumption by 2021�
The Taiwan government has proactively promoted wind power along with other renewable energy technologies over the last ten years� In 2010 Taiwan set a target to have 16% of installed power capacity from renewable energy sources by 2025� By 2013, the total installed capacity had risen to 614�2 MW�
Vietnam’s (purely technical) wind potential could support 642 GW of wind power according to SWERA figures� The Vietnamese government is aiming for renewable power to provide about 5% of the nation’s electricity by 2020�
By the end of 2013,Vietnam had 52 MW of operating wind power capacity� Vietnam’s Power Master Plan-7 set out wind power generation targets of 1GW by 2020 and 6�2 GW by 2030, with an obligation on Electricity of Vietnam Group (EVN) to purchase all electricity generated by on-grid wind plants at a price of VND 1,614/kWh (~$7�8/kWh) which includes a subsidy of 207 VNĐ/ kWh (~ 1�0 $cent/ kWh) through the Vietnam Environmental Protection Fund�
25 http://tribune�com�pk/story/768868/pakistan-china-investment-sindh-plays-host-to-130m-wind-power-project/
26 http://www�climateplanning�org/tools/swera-rrex
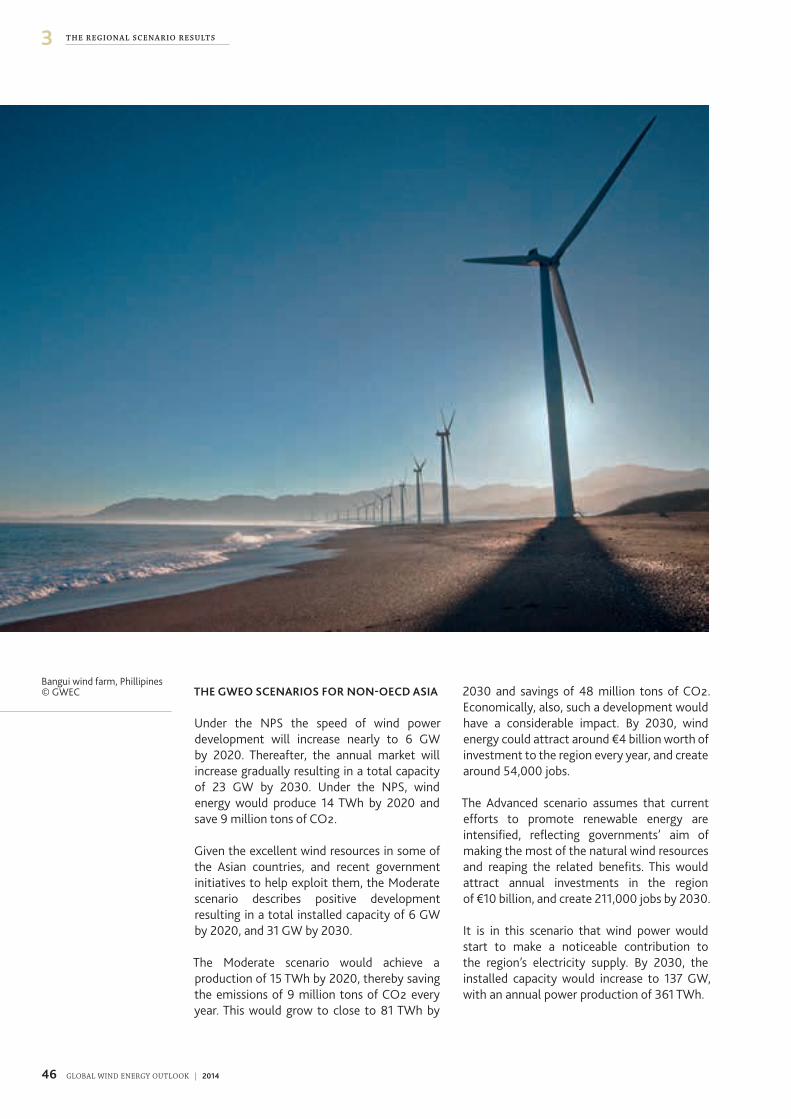
46 GLOBAL WIND ENERGY OUTLOOK | 2014
3 T H E R EG ION A L SC E N A R IO R E S U LT S
THE GWEO SCENARIOS FOR NON-OECD ASIA
Under the NPS the speed of wind power development will increase nearly to 6 GW by 2020� Thereafter, the annual market will increase gradually resulting in a total capacity of 23 GW by 2030� Under the NPS, wind energy would produce 14 TWh by 2020 and save 9 million tons of CO2�
Given the excellent wind resources in some of the Asian countries, and recent government initiatives to help exploit them, the Moderate scenario describes positive development resulting in a total installed capacity of 6 GW by 2020, and 31 GW by 2030�
The Moderate scenario would achieve a production of 15 TWh by 2020, thereby saving the emissions of 9 million tons of CO2 every year� This would grow to close to 81 TWh by
2030 and savings of 48 million tons of CO2� Economically, also, such a development would have a considerable impact� By 2030, wind energy could attract around €4 billion worth of investment to the region every year, and create around 54,000 jobs�
The Advanced scenario assumes that current efforts to promote renewable energy are intensified, reflecting governments’ aim of making the most of the natural wind resources and reaping the related benefits� This would attract annual investments in the region of €10 billion, and create 211,000 jobs by 2030�
It is in this scenario that wind power would start to make a noticeable contribution to the region’s electricity supply� By 2030, the installed capacity would increase to 137 GW, with an annual power production of 361 TWh�
Bangui wind farm, Phillipines © GWEC
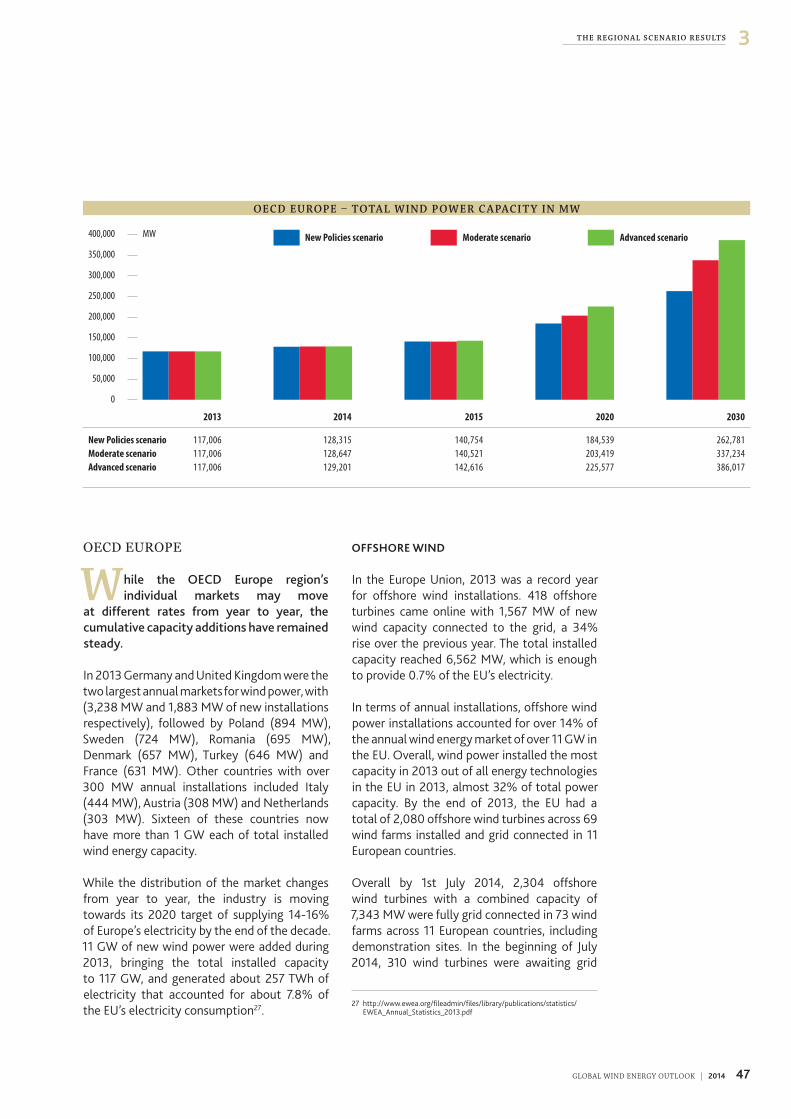
47GLOBAL WIND ENERGY OUTLOOK | 2014
3T H E R EG ION A L SC E N A R IO R E S U LT S
OECD EUROPE
While the OECD Europe region’s individual markets may move
at different rates from year to year, the cumulative capacity additions have remained steady.
In 2013 Germany and United Kingdom were the two largest annual markets for wind power, with (3,238 MW and 1,883 MW of new installations respectively), followed by Poland (894 MW), Sweden (724 MW), Romania (695 MW), Denmark (657 MW), Turkey (646 MW) and France (631 MW)� Other countries with over 300 MW annual installations included Italy (444 MW), Austria (308 MW) and Netherlands (303 MW)� Sixteen of these countries now have more than 1 GW each of total installed wind energy capacity�
While the distribution of the market changes from year to year, the industry is moving towards its 2020 target of supplying 14-16% of Europe’s electricity by the end of the decade� 11 GW of new wind power were added during 2013, bringing the total installed capacity to 117 GW, and generated about 257 TWh of electricity that accounted for about 7�8% of the EU’s electricity consumption27�
OFFSHORE WIND
In the Europe Union, 2013 was a record year for offshore wind installations� 418 offshore turbines came online with 1,567 MW of new wind capacity connected to the grid, a 34% rise over the previous year� The total installed capacity reached 6,562 MW, which is enough to provide 0�7% of the EU’s electricity�
In terms of annual installations, offshore wind power installations accounted for over 14% of the annual wind energy market of over 11 GW in the EU� Overall, wind power installed the most capacity in 2013 out of all energy technologies in the EU in 2013, almost 32% of total power capacity� By the end of 2013, the EU had a total of 2,080 offshore wind turbines across 69 wind farms installed and grid connected in 11 European countries�
Overall by 1st July 2014, 2,304 offshore wind turbines with a combined capacity of 7,343 MW were fully grid connected in 73 wind farms across 11 European countries, including demonstration sites� In the beginning of July 2014, 310 wind turbines were awaiting grid
O E C D E U ROPE – TOTA L W I N D P O W E R C A PAC I T Y I N M W
MW
0
50,000
100,000
150,000
200,000
250,000
300,000
350,000
400,000 Advanced scenarioModerate scenarioNew Policies scenario
20302020201520112010 2013 2014 2015 2020 2030
New Policies scenario 117,006 128,315 140,754 184,539 262,781Moderate scenario 117,006 128,647 140,521 203,419 337,234Advanced scenario 117,006 129,201 142,616 225,577 386,017
27 http://www�ewea�org/fileadmin/files/library/publications/statistics/EWEA_Annual_Statistics_2013�pdf
48 GLOBAL WIND ENERGY OUTLOOK | 2014
3 T H E R EG ION A L SC E N A R IO R E S U LT S
connection� Once connected, these turbines would add a total capacity of over 1,200 MW in European waters this year� As of July 2014, 4�9 GW offshore wind capacity was considered to be under construction� It is expected that during this decade, offshore wind power capacity in Europe will grow to about 25 GW�
More than 90% of the world’s offshore wind power is currently installed off northern Europe, in the North, Baltic and Irish Seas, and the English Channel� The rest of the installed capacity by the end of 2013 was off China’s east coast (429 MW) and some in Japan (49 MW)� Offshore wind is an essential component of Europe’s binding target to source 20% of final energy consumption from renewables�
GERMANY
The German wind market had a good year in 2013, installing over 3 GW of new capacity, maintaining its position as the European leader in wind energy with 34,250 MW of installed capacity� This represents 29% annual market growth, and included 766 MW in repowering and 520 MW of offshore wind� 258 MW of onshore turbines were decommissioned in 2013�
Renewable energy accounted for 23�5% of electricity generation in Germany, with wind being the single largest contributor� The average size of newly installed onshore turbines was about 2�6 MW, average rotor diameter about 95 meters and average hub height of about 117 meters�
Wind turbines generated about 47�2 TWh in 2013� Wind power contributed 8�4% to the total electricity consumption of 560 TWh in Germany during the year�
In the summer of 2011, the German parliament voted in favour of fully phasing out nuclear energy by 2022� This decision will have a significant impact on Germany’s energy planning up to and beyond 2020� Further the amended Renewable Energy Sources Act (EEG), which entered into force on 1 January 2012, continues to provide stable support for
onshore wind power and support conditions for offshore wind power� In 2014, the German wind industry expects new installations of about 3 GW�
POLAND
Wind power is the fastest growing renewable energy source in the country currently - the Ernst & Young Renewable Energy Country Attractiveness Indices from February 2013 ranks Poland 8th worldwide for wind energy�
The annual market in 2013 was 894 MW, for a total installed capacity of 3,390 MW by the end of the year; generating 5�8 TWh, approximately 3�6% of all electricity produced in Poland�
Despite existing barriers, companies investing in wind power in Poland have successfully found ways of overcoming market obstacles, and the country is attracting significant foreign investment, particularly in component manufacturing� In order to meet the EU Renewables Directive target, Poland must source 15% of its final energy demand from renewable sources by 2020, up from 7�2% in 2005�
SWEDEN
In 2013, 724 MW of new onshore wind power was installed in Sweden, bringing the total capacity to 4,470 MW, of which 211�7 MW is offshore, accounting for about 7% of the country’s total electricity consumption, an increase of 2% from 2012�
Sweden expects a record year of installations in 2014 with 1 GW of new capacity� After 2014, much depends on the new quotas; if the technical adjustments of the quotas for the green certificate system are insufficient, Sweden will most likely face a sharp slowdown in wind development and renewable energy in general for the next 3 to 4 years� In order to maintain balance in the system and to ensure that the 2020 renewables target is met, the Swedish Energy Agency proposed technical quota adjustments in February 2014 with the first adjustment expected to take place in 2016� If
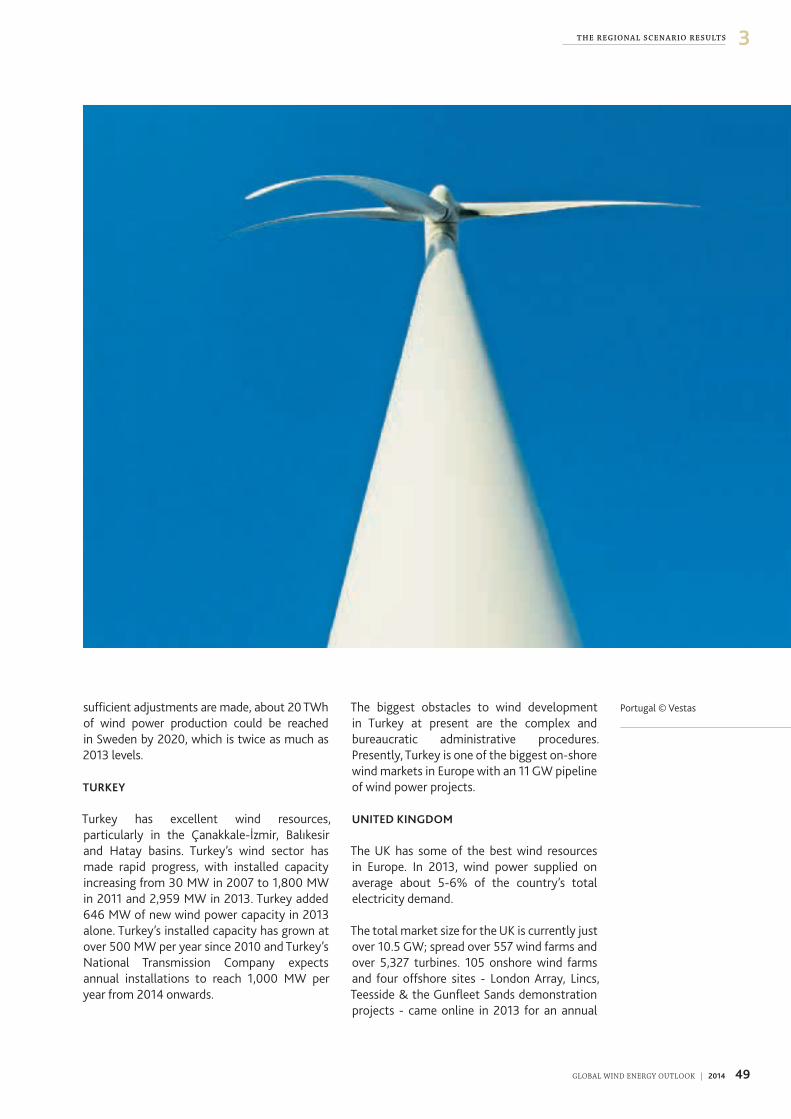
49GLOBAL WIND ENERGY OUTLOOK | 2014
3T H E R EG ION A L SC E N A R IO R E S U LT S
sufficient adjustments are made, about 20 TWh of wind power production could be reached in Sweden by 2020, which is twice as much as 2013 levels�
TURKEY
Turkey has excellent wind resources, particularly in the Çanakkale-İzmir, Balıkesir and Hatay basins� Turkey’s wind sector has made rapid progress, with installed capacity increasing from 30 MW in 2007 to 1,800 MW in 2011 and 2,959 MW in 2013� Turkey added 646 MW of new wind power capacity in 2013 alone� Turkey’s installed capacity has grown at over 500 MW per year since 2010 and Turkey’s National Transmission Company expects annual installations to reach 1,000 MW per year from 2014 onwards�
The biggest obstacles to wind development in Turkey at present are the complex and bureaucratic administrative procedures� Presently, Turkey is one of the biggest on-shore wind markets in Europe with an 11 GW pipeline of wind power projects�
UNITED KINGDOM
The UK has some of the best wind resources in Europe� In 2013, wind power supplied on average about 5-6% of the country’s total electricity demand�
The total market size for the UK is currently just over 10�5 GW; spread over 557 wind farms and over 5,327 turbines� 105 onshore wind farms and four offshore sites - London Array, Lincs, Teesside & the Gunfleet Sands demonstration projects - came online in 2013 for an annual
Portugal © Vestas
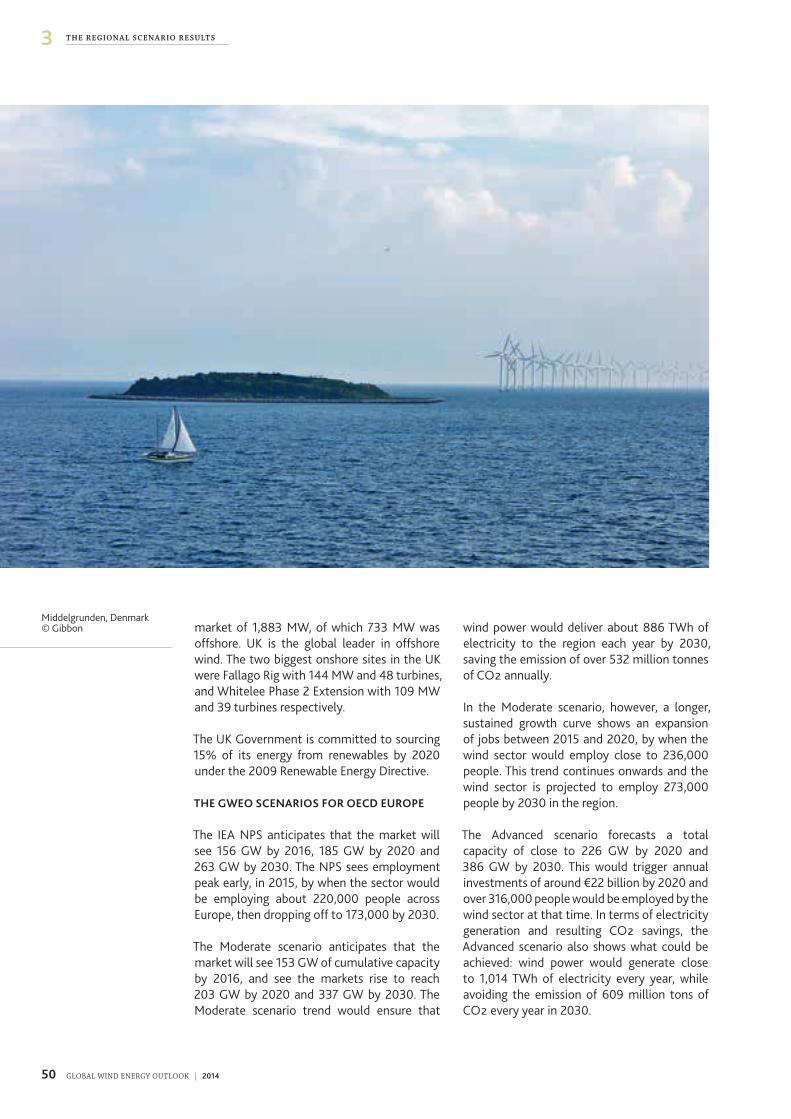
50 GLOBAL WIND ENERGY OUTLOOK | 2014
3 T H E R EG ION A L SC E N A R IO R E S U LT S
market of 1,883 MW, of which 733 MW was offshore� UK is the global leader in offshore wind� The two biggest onshore sites in the UK were Fallago Rig with 144 MW and 48 turbines, and Whitelee Phase 2 Extension with 109 MW and 39 turbines respectively�
The UK Government is committed to sourcing 15% of its energy from renewables by 2020 under the 2009 Renewable Energy Directive�
THE GWEO SCENARIOS FOR OECD EUROPE
The IEA NPS anticipates that the market will see 156 GW by 2016, 185 GW by 2020 and 263 GW by 2030� The NPS sees employment peak early, in 2015, by when the sector would be employing about 220,000 people across Europe, then dropping off to 173,000 by 2030�
The Moderate scenario anticipates that the market will see 153 GW of cumulative capacity by 2016, and see the markets rise to reach 203 GW by 2020 and 337 GW by 2030� The Moderate scenario trend would ensure that
wind power would deliver about 886 TWh of electricity to the region each year by 2030, saving the emission of over 532 million tonnes of CO2 annually�
In the Moderate scenario, however, a longer, sustained growth curve shows an expansion of jobs between 2015 and 2020, by when the wind sector would employ close to 236,000 people� This trend continues onwards and the wind sector is projected to employ 273,000 people by 2030 in the region�
The Advanced scenario forecasts a total capacity of close to 226 GW by 2020 and 386 GW by 2030� This would trigger annual investments of around €22 billion by 2020 and over 316,000 people would be employed by the wind sector at that time� In terms of electricity generation and resulting CO2 savings, the Advanced scenario also shows what could be achieved: wind power would generate close to 1,014 TWh of electricity every year, while avoiding the emission of 609 million tons of CO2 every year in 2030�
Middelgrunden, Denmark © Gibbon
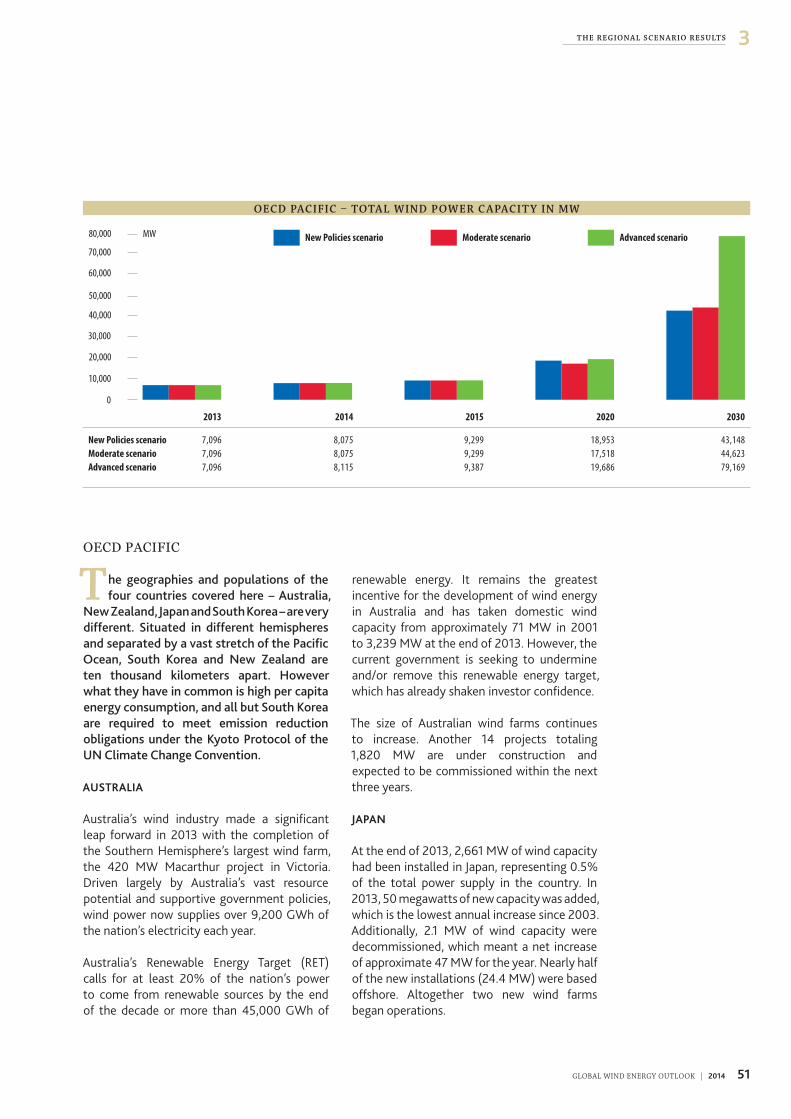
51GLOBAL WIND ENERGY OUTLOOK | 2014
3T H E R EG ION A L SC E N A R IO R E S U LT S
OECD PACIFIC
The geographies and populations of the four countries covered here – Australia,
New Zealand, Japan and South Korea – are very different. Situated in different hemispheres and separated by a vast stretch of the Pacific Ocean, South Korea and New Zealand are ten thousand kilometers apart. However what they have in common is high per capita energy consumption, and all but South Korea are required to meet emission reduction obligations under the Kyoto Protocol of the UN Climate Change Convention.
AUSTRALIA
Australia’s wind industry made a significant leap forward in 2013 with the completion of the Southern Hemisphere’s largest wind farm, the 420 MW Macarthur project in Victoria� Driven largely by Australia’s vast resource potential and supportive government policies, wind power now supplies over 9,200 GWh of the nation’s electricity each year�
Australia’s Renewable Energy Target (RET) calls for at least 20% of the nation’s power to come from renewable sources by the end of the decade or more than 45,000 GWh of
renewable energy� It remains the greatest incentive for the development of wind energy in Australia and has taken domestic wind capacity from approximately 71 MW in 2001 to 3,239 MW at the end of 2013� However, the current government is seeking to undermine and/or remove this renewable energy target, which has already shaken investor confidence�
The size of Australian wind farms continues to increase� Another 14 projects totaling 1,820 MW are under construction and expected to be commissioned within the next three years�
JAPAN
At the end of 2013, 2,661 MW of wind capacity had been installed in Japan, representing 0�5% of the total power supply in the country� In 2013, 50 megawatts of new capacity was added, which is the lowest annual increase since 2003� Additionally, 2�1 MW of wind capacity were decommissioned, which meant a net increase of approximate 47 MW for the year� Nearly half of the new installations (24�4 MW) were based offshore� Altogether two new wind farms began operations�
O E C D PAC I F IC – TOTA L W I N D P O W E R C A PAC I T Y I N M W
MW
0
10,000
20,000
30,000
40,000
50,000
60,000
70,000
80,000 Advanced scenarioModerate scenarioNew Policies scenario
20302020201520112010 2013 2014 2015 2020 2030
New Policies scenario 7,096 8,075 9,299 18,953 43,148Moderate scenario 7,096 8,075 9,299 17,518 44,623Advanced scenario 7,096 8,115 9,387 19,686 79,169
52 GLOBAL WIND ENERGY OUTLOOK | 2014
3 T H E R EG ION A L SC E N A R IO R E S U LT S
Japan is an island country with a strong maritime industry and the world’s 6th largest marine Exclusive Economic Zone� This makes offshore wind an attractive option, and Japan currently has 49�7 megawatts of offshore capacity, including 4 MW of floating turbines� At the moment there are four offshore projects totaling 254 MW which are under the EIA procedure, including two floating wind turbines (14 MW) developed by the ‘Fukushima FORWARD’ project, which entered its second phase in June 201428�
The Ministry of Environment has estimated Japan’s realistic potential at about 1,000 GW� Japan plans to boost spending on research
and development of offshore wind power� The Ministry of Economy, Trade and Industry among other renewables boosting activities also plans to spend €60 (US$76) million for research and development of offshore wind-power systems in the fiscal year starting April 201529�
The Japanese wind power market is at dawn now, and waiting for the sunrise� Many changes have been introduced for wind power expansion� Japan’s domestic market will grow quickly after 2016�
THE GWEO SCENARIOS FOR OECD ASIA PACIFIC
The New Policy scenario for OECD Asia Pacific expects total installed capacity of 19 GW in 2020, increasing to 43 GW in 2030� The effects on both economy and climate would be marginal, compared to these countries’ total economic and political strength� Annual investments hover around €2�5 billion in 2020 to rise just marginally to reach €2�7 billion by 2030�
In terms of climate change, wind power would, in this scenario, not play a major role in helping these countries achieve their targets – only 30 million tons of CO2 would be saved every year across the whole region by 2020 and 68 million tons by 2030, compared to over 1�32 billion tonnes of CO2 emitted in 2012 by Japan alone30�
The Moderate scenario shows that, with a more positive operating framework, there could be 45 GW of wind power in operation by 2030 while the advanced scenario anticipates 79 GW�
With 79 GW of wind power in place, these countries would produce close to 208 TWh and save the emissions of 125 million tonnes of CO2 per year� Almost €6�3 billion worth of investment would flow into these countries wind markets every year by 2030, and the sector would employ over 105,000 people�
Floating installation, Japan © MOE
28 http://www�fukushima-forward�jp/english/news_release/news140611�html
29 http://english�capital�gr/News�asp?id=2097051 30 http://edgar�jrc�ec�europa�eu/news_docs/pbl-2013-trends-in-global-CO2-
emissions-2013-report-1148�pdf
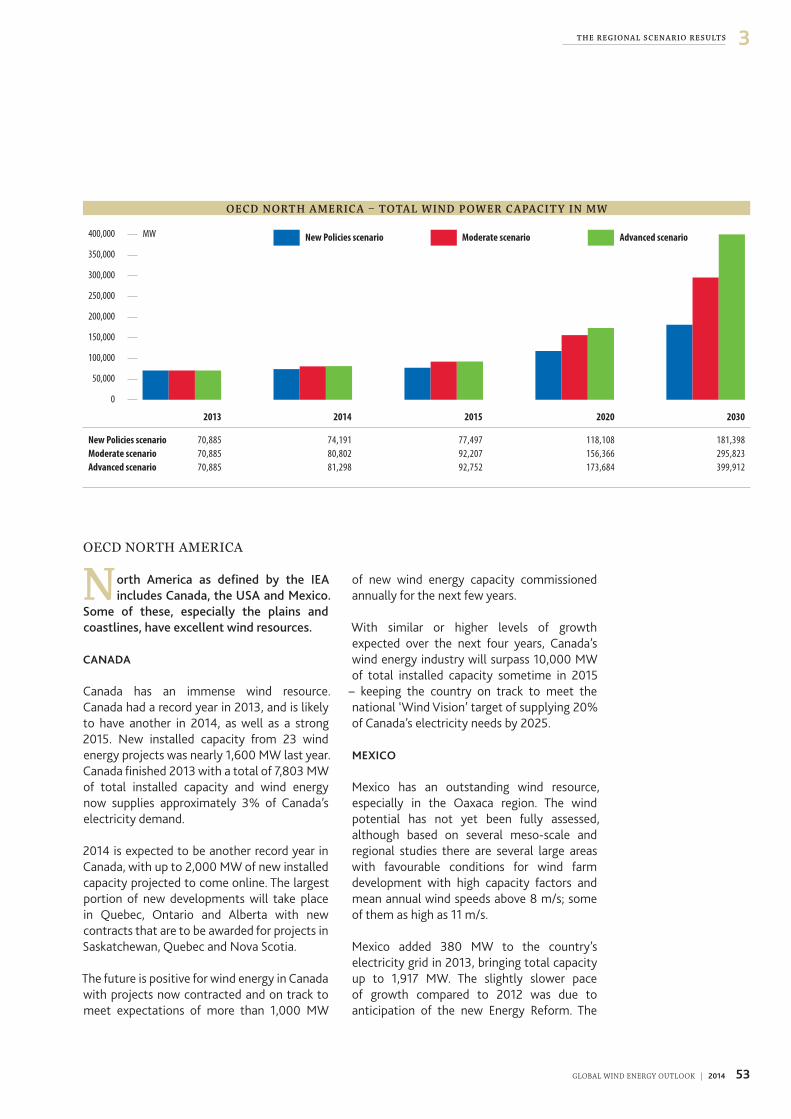
53GLOBAL WIND ENERGY OUTLOOK | 2014
3T H E R EG ION A L SC E N A R IO R E S U LT S
OECD NORTH AMERICA
North America as defined by the IEA includes Canada, the USA and Mexico.
Some of these, especially the plains and coastlines, have excellent wind resources.
CANADA
Canada has an immense wind resource� Canada had a record year in 2013, and is likely to have another in 2014, as well as a strong 2015� New installed capacity from 23 wind energy projects was nearly 1,600 MW last year� Canada finished 2013 with a total of 7,803 MW of total installed capacity and wind energy now supplies approximately 3% of Canada’s electricity demand�
2014 is expected to be another record year in Canada, with up to 2,000 MW of new installed capacity projected to come online� The largest portion of new developments will take place in Quebec, Ontario and Alberta with new contracts that are to be awarded for projects in Saskatchewan, Quebec and Nova Scotia�
The future is positive for wind energy in Canada with projects now contracted and on track to meet expectations of more than 1,000 MW
of new wind energy capacity commissioned annually for the next few years�
With similar or higher levels of growth expected over the next four years, Canada’s wind energy industry will surpass 10,000 MW of total installed capacity sometime in 2015
– keeping the country on track to meet the national ‘Wind Vision’ target of supplying 20% of Canada’s electricity needs by 2025�
MEXICO
Mexico has an outstanding wind resource, especially in the Oaxaca region� The wind potential has not yet been fully assessed, although based on several meso-scale and regional studies there are several large areas with favourable conditions for wind farm development with high capacity factors and mean annual wind speeds above 8 m/s; some of them as high as 11 m/s�
Mexico added 380 MW to the country’s electricity grid in 2013, bringing total capacity up to 1,917 MW� The slightly slower pace of growth compared to 2012 was due to anticipation of the new Energy Reform� The
O E C D N ORT H A M E R IC A – TOTA L W I N D P O W E R C A PAC I T Y I N M W
MW
0
50,000
100,000
150,000
200,000
250,000
300,000
350,000
400,000 Advanced scenarioModerate scenarioNew Policies scenario
20302020201520112010 2013 2014 2015 2020 2030
New Policies scenario 70,885 74,191 77,497 118,108 181,398Moderate scenario 70,885 80,802 92,207 156,366 295,823Advanced scenario 70,885 81,298 92,752 173,684 399,912
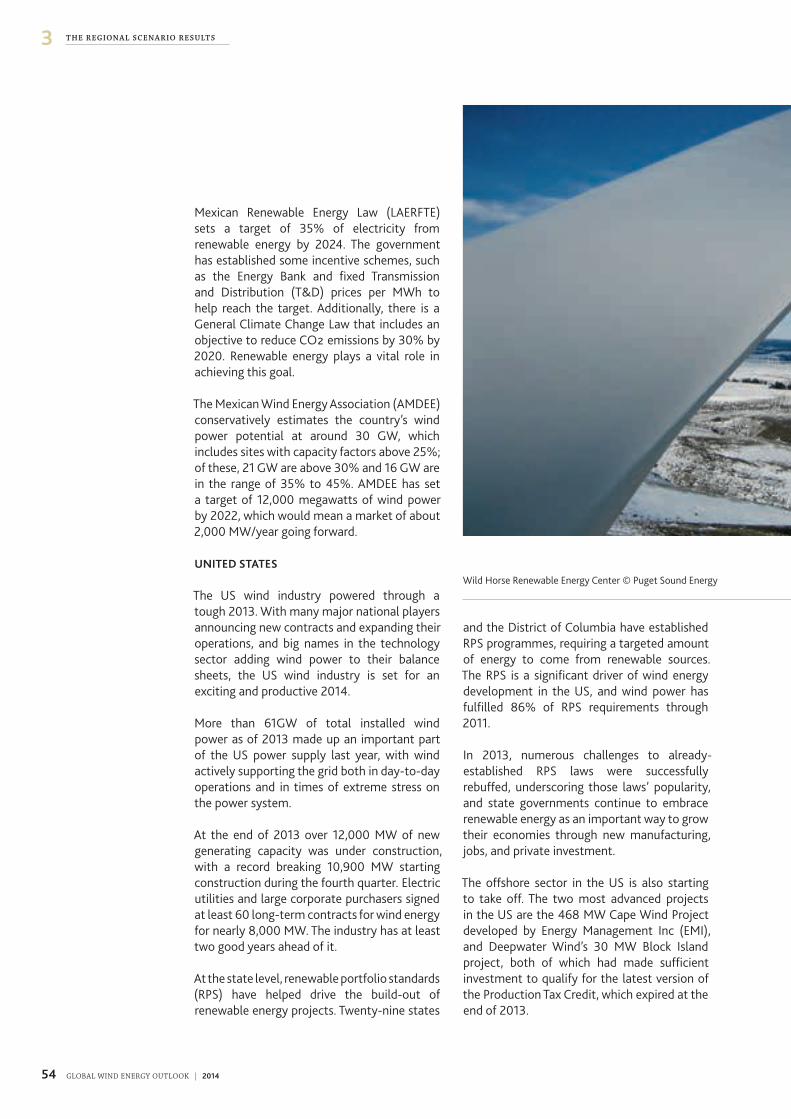
54 GLOBAL WIND ENERGY OUTLOOK | 2014
3 T H E R EG ION A L SC E N A R IO R E S U LT S
Mexican Renewable Energy Law (LAERFTE) sets a target of 35% of electricity from renewable energy by 2024� The government has established some incentive schemes, such as the Energy Bank and fixed Transmission and Distribution (T&D) prices per MWh to help reach the target� Additionally, there is a General Climate Change Law that includes an objective to reduce CO2 emissions by 30% by 2020� Renewable energy plays a vital role in achieving this goal�
The Mexican Wind Energy Association (AMDEE) conservatively estimates the country’s wind power potential at around 30 GW, which includes sites with capacity factors above 25%; of these, 21 GW are above 30% and 16 GW are in the range of 35% to 45%� AMDEE has set a target of 12,000 megawatts of wind power by 2022, which would mean a market of about 2,000 MW/year going forward�
UNITED STATES
The US wind industry powered through a tough 2013� With many major national players announcing new contracts and expanding their operations, and big names in the technology sector adding wind power to their balance sheets, the US wind industry is set for an exciting and productive 2014�
More than 61GW of total installed wind power as of 2013 made up an important part of the US power supply last year, with wind actively supporting the grid both in day-to-day operations and in times of extreme stress on the power system�
At the end of 2013 over 12,000 MW of new generating capacity was under construction, with a record breaking 10,900 MW starting construction during the fourth quarter� Electric utilities and large corporate purchasers signed at least 60 long-term contracts for wind energy for nearly 8,000 MW� The industry has at least two good years ahead of it�
At the state level, renewable portfolio standards (RPS) have helped drive the build-out of renewable energy projects� Twenty-nine states
and the District of Columbia have established RPS programmes, requiring a targeted amount of energy to come from renewable sources� The RPS is a significant driver of wind energy development in the US, and wind power has fulfilled 86% of RPS requirements through 2011�
In 2013, numerous challenges to already-established RPS laws were successfully rebuffed, underscoring those laws’ popularity, and state governments continue to embrace renewable energy as an important way to grow their economies through new manufacturing, jobs, and private investment�
The offshore sector in the US is also starting to take off� The two most advanced projects in the US are the 468 MW Cape Wind Project developed by Energy Management Inc (EMI), and Deepwater Wind’s 30 MW Block Island project, both of which had made sufficient investment to qualify for the latest version of the Production Tax Credit, which expired at the end of 2013�
Wild Horse Renewable Energy Center © Puget Sound Energy
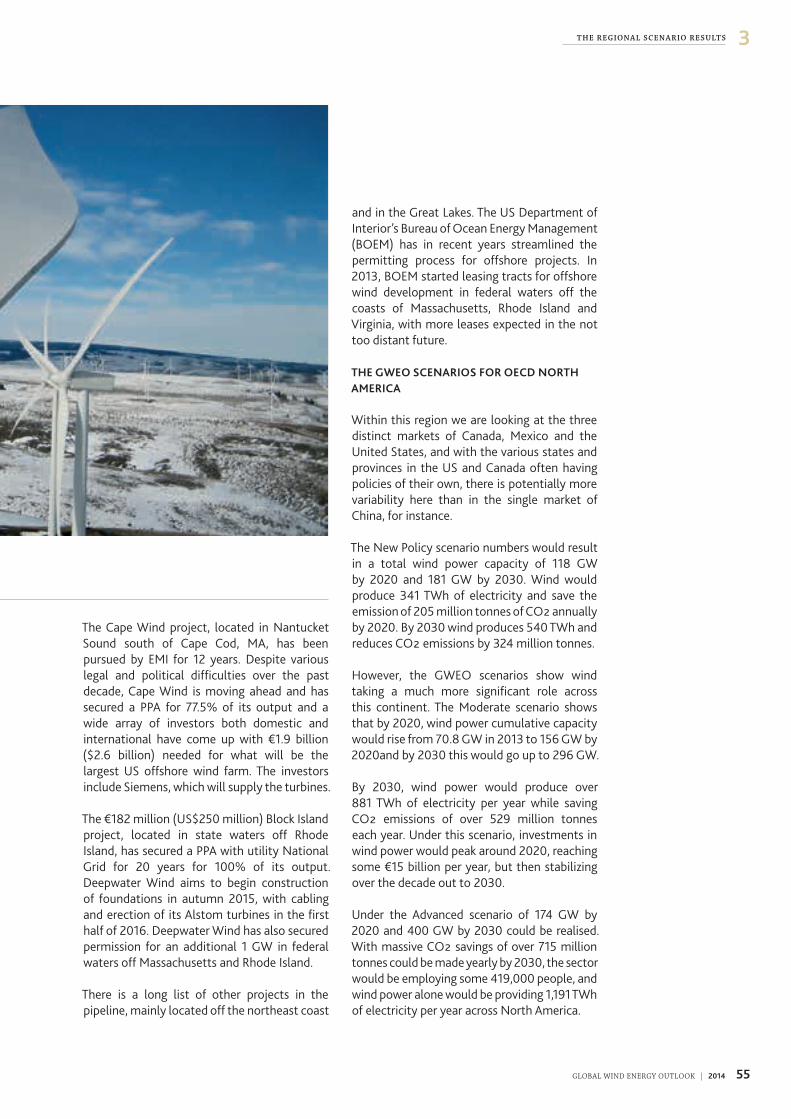
55GLOBAL WIND ENERGY OUTLOOK | 2014
3T H E R EG ION A L SC E N A R IO R E S U LT S
The Cape Wind project, located in Nantucket Sound south of Cape Cod, MA, has been pursued by EMI for 12 years� Despite various legal and political difficulties over the past decade, Cape Wind is moving ahead and has secured a PPA for 77�5% of its output and a wide array of investors both domestic and international have come up with €1�9 billion ($2�6 billion) needed for what will be the largest US offshore wind farm� The investors include Siemens, which will supply the turbines�
The €182 million (US$250 million) Block Island project, located in state waters off Rhode Island, has secured a PPA with utility National Grid for 20 years for 100% of its output� Deepwater Wind aims to begin construction of foundations in autumn 2015, with cabling and erection of its Alstom turbines in the first half of 2016� Deepwater Wind has also secured permission for an additional 1 GW in federal waters off Massachusetts and Rhode Island�
There is a long list of other projects in the pipeline, mainly located off the northeast coast
and in the Great Lakes� The US Department of Interior’s Bureau of Ocean Energy Management (BOEM) has in recent years streamlined the permitting process for offshore projects� In 2013, BOEM started leasing tracts for offshore wind development in federal waters off the coasts of Massachusetts, Rhode Island and Virginia, with more leases expected in the not too distant future�
THE GWEO SCENARIOS FOR OECD NORTH AMERICA
Within this region we are looking at the three distinct markets of Canada, Mexico and the United States, and with the various states and provinces in the US and Canada often having policies of their own, there is potentially more variability here than in the single market of China, for instance�
The New Policy scenario numbers would result in a total wind power capacity of 118 GW by 2020 and 181 GW by 2030� Wind would produce 341 TWh of electricity and save the emission of 205 million tonnes of CO2 annually by 2020� By 2030 wind produces 540 TWh and reduces CO2 emissions by 324 million tonnes�
However, the GWEO scenarios show wind taking a much more significant role across this continent� The Moderate scenario shows that by 2020, wind power cumulative capacity would rise from 70�8 GW in 2013 to 156 GW by 2020and by 2030 this would go up to 296 GW�
By 2030, wind power would produce over 881 TWh of electricity per year while saving CO2 emissions of over 529 million tonnes each year� Under this scenario, investments in wind power would peak around 2020, reaching some €15 billion per year, but then stabilizing over the decade out to 2030�
Under the Advanced scenario of 174 GW by 2020 and 400 GW by 2030 could be realised� With massive CO2 savings of over 715 million tonnes could be made yearly by 2030, the sector would be employing some 419,000 people, and wind power alone would be providing 1,191 TWh of electricity per year across North America�
Wild Horse Renewable Energy Center © Puget Sound Energy
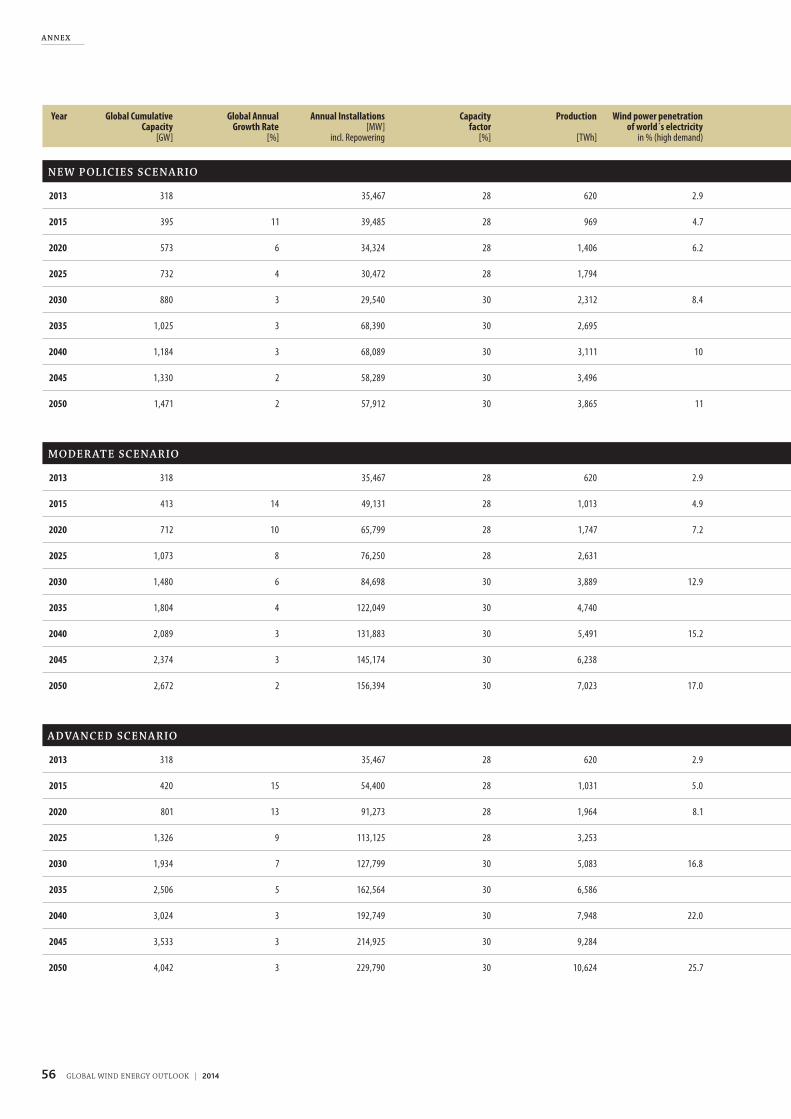
56 GLOBAL WIND ENERGY OUTLOOK | 2014
A N N E X
Year Global Cumulative Capacity
[GW]
Global Annual Growth Rate
[%]
Annual Installations [MW]
incl. Repowering
Capacity factor
[%]
Production
[TWh]
Wind power penetration of world´s electricity
in % (high demand)
Wind power penetration of world´s electricity
in % (low demand)
CO2 reduction (with 600g CO2/kWh)
[annual Mio t CO2]
Avoided CO2 since 2007
[cumulative Mio t CO2]
Capital Costs
[€/kW]
Investment
[€1,000]
Jobs total
N E W P OL IC I E S S C E N A R IO
2013 318 35,467 28 620 2.9 2.9 372 2,265 1,252 44,606,048 601,519
2015 395 11 39,485 28 969 4.7 4.8 582 2,332 1,390 54,871,573 683,208
2020 573 6 34,324 28 1,406 6.2 6.7 844 6,037 1,405 48,225,762 635,439
2025 732 4 30,472 28 1,794 1,077 10,965 1,415 43,115,289 637,534
2030 880 3 29,540 30 2,312 8.4 9.4 1,387 17,096 1,418 41,875,598 644,815
2035 1,025 3 68,390 30 2,695 1,617 24,723 1,419 41,011,530 685,279
2040 1,184 3 68,089 30 3,111 10 11 1,867 33,542 1,411 47,637,764 795,849
2045 1,330 2 58,289 30 3,496 2,098 43,583 1,416 39,395,574 745,038
2050 1,471 2 57,912 30 3,865 11 13 2,319 54,734 1,416 40,165,399 797,453
MO DE R AT E S C E N A R IO
2013 318 35,467 28 620 2.9 2.9 372 2,265 1,258 44,606,048 601,519
2015 413 14 49,131 28 1,013 4.9 5.0 608 3,424 1,234 60,624,512 824,141
2020 712 10 65,799 28 1,747 7.2 7.8 1,048 7,930 1,214 79,856,761 1,090,378
2025 1,073 8 76,250 28 2,631 1,578 15,100 1,207 92,013,006 1,345,186
2030 1,480 6 84,698 30 3,889 12.9 14.5 2,333 25,420 1,203 101,864,571 1,504,698
2035 1,804 4 122,049 30 4,740 2,844 39,116 1,192 145,492,683 2,059,746
2040 2,089 3 131,883 30 5,491 15.2 17.3 3,294 55,249 1,190 156,969,860 2,272,047
2045 2,374 3 145,174 30 6,238 3,743 73,669 1,188 172,454,667 2,380,192
2050 2,672 2 156,394 30 7,023 17.0 20.2 4,214 94,463 1,186 185,504,369 2,602,167
A D VA N C E D S C E N A R IO
2013 318 35,467 28 620 2.9 2.9 372 2,265 1,258 44,154,052 104,982
2015 420 15 54,400 28 1,031 5.0 5.1 619 3,438 1,214 63,923,002 900,324
2020 801 13 91,273 28 1,964 8.1 8.8 1,178 8,312 1,137 97,920,604 1,450,753
2025 1,326 9 113,125 28 3,253 1,952 16,904 1,113 115,467,649 1,908,237
2030 1,934 7 127,799 30 5,083 16.8 18.9 3,050 30,151 1,100 129,261,055 2,171,804
2035 2,506 5 162,564 30 6,586 3,952 48,802 1,100 109,582,987 2,777,780
2040 3,024 3 192,749 30 7,948 22.0 25.0 4,769 71,793 1,094 104,123,871 3,311,064
2045 3,533 3 214,925 30 9,284 5,571 98,908 1,090 104,403,279 3,530,014
2050 4,042 3 229,790 30 10,624 25.7 30.6 6,374 130,138 1,084 104,353,359 3,861,712
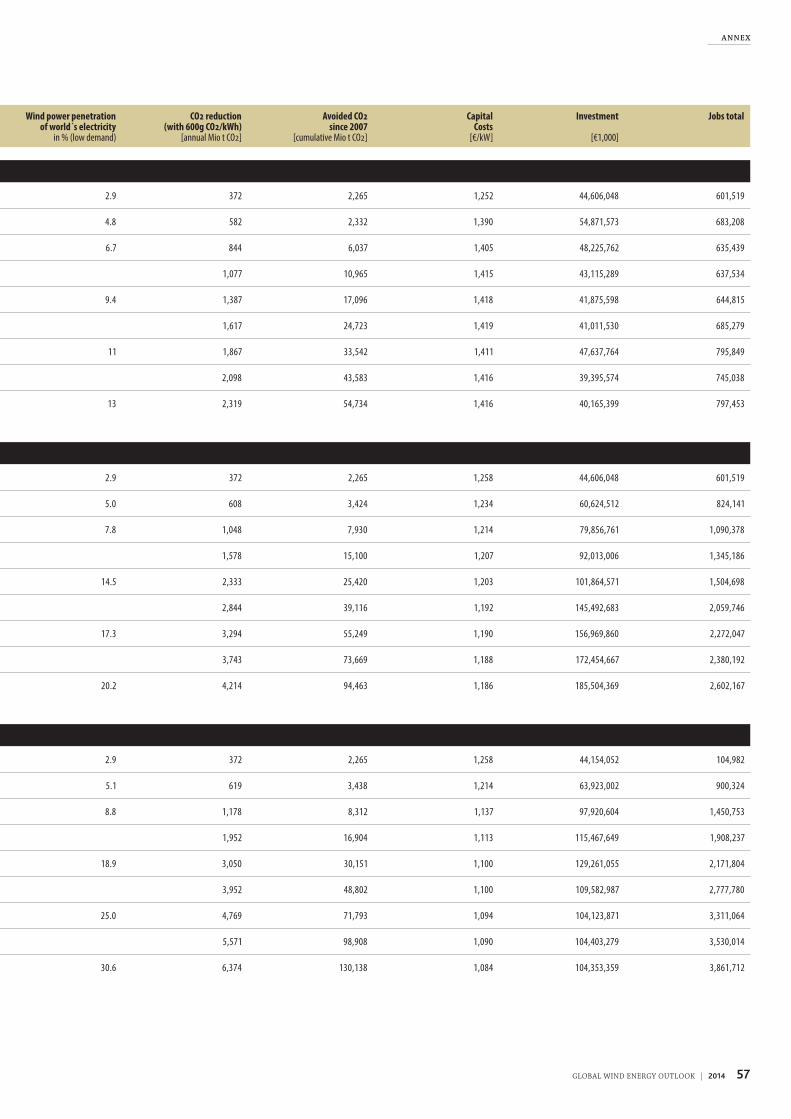
57GLOBAL WIND ENERGY OUTLOOK | 2014
A N N E X
Year Global Cumulative Capacity
[GW]
Global Annual Growth Rate
[%]
Annual Installations [MW]
incl. Repowering
Capacity factor
[%]
Production
[TWh]
Wind power penetration of world´s electricity
in % (high demand)
Wind power penetration of world´s electricity
in % (low demand)
CO2 reduction (with 600g CO2/kWh)
[annual Mio t CO2]
Avoided CO2 since 2007
[cumulative Mio t CO2]
Capital Costs
[€/kW]
Investment
[€1,000]
Jobs total
N E W P OL IC I E S S C E N A R IO
2013 318 35,467 28 620 2.9 2.9 372 2,265 1,252 44,606,048 601,519
2015 395 11 39,485 28 969 4.7 4.8 582 2,332 1,390 54,871,573 683,208
2020 573 6 34,324 28 1,406 6.2 6.7 844 6,037 1,405 48,225,762 635,439
2025 732 4 30,472 28 1,794 1,077 10,965 1,415 43,115,289 637,534
2030 880 3 29,540 30 2,312 8.4 9.4 1,387 17,096 1,418 41,875,598 644,815
2035 1,025 3 68,390 30 2,695 1,617 24,723 1,419 41,011,530 685,279
2040 1,184 3 68,089 30 3,111 10 11 1,867 33,542 1,411 47,637,764 795,849
2045 1,330 2 58,289 30 3,496 2,098 43,583 1,416 39,395,574 745,038
2050 1,471 2 57,912 30 3,865 11 13 2,319 54,734 1,416 40,165,399 797,453
M O DE R AT E S C E N A R IO
2013 318 35,467 28 620 2.9 2.9 372 2,265 1,258 44,606,048 601,519
2015 413 14 49,131 28 1,013 4.9 5.0 608 3,424 1,234 60,624,512 824,141
2020 712 10 65,799 28 1,747 7.2 7.8 1,048 7,930 1,214 79,856,761 1,090,378
2025 1,073 8 76,250 28 2,631 1,578 15,100 1,207 92,013,006 1,345,186
2030 1,480 6 84,698 30 3,889 12.9 14.5 2,333 25,420 1,203 101,864,571 1,504,698
2035 1,804 4 122,049 30 4,740 2,844 39,116 1,192 145,492,683 2,059,746
2040 2,089 3 131,883 30 5,491 15.2 17.3 3,294 55,249 1,190 156,969,860 2,272,047
2045 2,374 3 145,174 30 6,238 3,743 73,669 1,188 172,454,667 2,380,192
2050 2,672 2 156,394 30 7,023 17.0 20.2 4,214 94,463 1,186 185,504,369 2,602,167
A D VA N C E D S C E N A R IO
2013 318 35,467 28 620 2.9 2.9 372 2,265 1,258 44,154,052 104,982
2015 420 15 54,400 28 1,031 5.0 5.1 619 3,438 1,214 63,923,002 900,324
2020 801 13 91,273 28 1,964 8.1 8.8 1,178 8,312 1,137 97,920,604 1,450,753
2025 1,326 9 113,125 28 3,253 1,952 16,904 1,113 115,467,649 1,908,237
2030 1,934 7 127,799 30 5,083 16.8 18.9 3,050 30,151 1,100 129,261,055 2,171,804
2035 2,506 5 162,564 30 6,586 3,952 48,802 1,100 109,582,987 2,777,780
2040 3,024 3 192,749 30 7,948 22.0 25.0 4,769 71,793 1,094 104,123,871 3,311,064
2045 3,533 3 214,925 30 9,284 5,571 98,908 1,090 104,403,279 3,530,014
2050 4,042 3 229,790 30 10,624 25.7 30.6 6,374 130,138 1,084 104,353,359 3,861,712
58 GLOBAL WIND ENERGY OUTLOOK | 2014
3 T H E R EG ION A L SC E N A R IO R E S U LT S
Scenario GWEC, Greenpeace International, DLR, Ecofys and The University of Utrecht
Text editors Lauha Fried, Shruti Shukla, Steve Sawyer, Sven Teske
Design bitter grafik, Hamburg
Cover photo Wind farm at the southern end of Maui, Hawaii © National Geographic Image Collection
GWEC is an international trade association representing the global wind industry� The members of GWEC represent over 1,500 companies, organisations and institutions in more than 80 countries, including manufacturers, developers, component suppliers, research institutes, national wind and renewables associations, electricity providers, finance and insurance companies�
GWEC works at the highest international political level to create a better policy environment for wind power� GWEC and its members are active all over the world, educating local and national governments and international agencies about the benefits of wind power�
Working with the UNFCCC, the IEA, international financial institutions, the IPCC and the International Renewable Energy Agency (IRENA), GWEC represents the global wind industry to show how far we’ve come, but also to advocate new policies to help wind power reach its full potential in as wide a variety of markets as possible�
Find out more about GWEC’s policy work, publications, events and other membership benefits on our website at www.gwec.net
GLOBAL WIND ENERGY COUNCILRue d’Arlon 80 1040 Brussels Belgium Tel +32 2 213 18 97 Fax +32 2 213 18 90 info@gwec�net www�gwec�net
Greenpeace is a global organisation that uses non-violent direct action to tackle the most crucial threats to our planet‘s biodiversity and environment� Greenpeace is a non-profit organisation, present in 40 countries across Europe, the Americas, Asia and the Pacific� It speaks for 2�8 million supporters worldwide, and inspires many millions more to take action every day� To maintain its independence, Greenpeace does not accept donations from governments or corporations but relies on contributions from individual supporters and foundation grants�
Greenpeace has been campaigning against environmental degradation since 1971 when a small boat of volunteers and journalists sailed into Amchitka, an area north of Alaska, where the US Government was conducting underground nuclear tests� This tradition of ‘bearing witness’ in a non-violent manner continues today, and ships are an important part of all its campaign work�
GREENPEACE INTERNATIONALOttho Heldringstraat 5 1066 AZ Amsterdam The Netherlands Tel 31 20 7182000 Tel 31 20 5148151 www�greenpeace�org sven�teske@greenpeace�org

59GLOBAL WIND ENERGY OUTLOOK | 2014
3T H E R EG ION A L SC E N A R IO R E S U LT S

60 GLOBAL WIND ENERGY OUTLOOK | 2014
C H A P T E R T I T L E1


