Global Warming: Will Human-Induced Climate Change Destroy ... · Global Warming: Will Human-Induced...
15
Global Warming: Will Human- Induced Climate Change Destroy the World? by Rich Deem Introduction Is the world getting warmer and, if so, are the actions of mankind to blame for these temperature increases? The burning of fossil fuels converts carbon in the biomass into carbon dioxide (CO 2 ), which is a “greenhouse” gas. This and other greenhouse gases (such as methane) tend to trap energy from the Sun on the earth. Many scientists have sounded the alarm that we must reduce our use of fossil fuels. Others, including a number of prominent conservatives, have said that we have little to worry about. This page examines the basic questions and the answers we are getting from scientific studies, including historical values for greenhouse gases, temperature, and other variables that impact earth’s climate. In addition, we will examine some of the theory behind the science that causes most scientists to be concerned. Included below are links to the original data/studies that will allow you to verify that the information on this page is accurate. What’s the problem? Since this page is written at a lay level, we are not going to examine the details involved in climate modeling that concerns most scientists. However, some background is necessary in order to understand what the fuss is about. Looking at the big picture, radioactive dating of meteorites shows that the earth and solar system formed ~4.6 billion years ago. By examining the earth’s rocks and minerals, scientists have determined that liquid water was probably on the earth as early as 4.3 billion years ago. 1 However, much of the evidence for this period of time was destroyed by the heavy late bombardment that pummeled the inner solar system ~3.9 billion years ago. 2 Some of the collision events were so energetic that the entirety of the earth’s oceans and the outer layer of its rock was vaporized. 3 Therefore, the first evidence for the existence of life is at ~3.8 billion years ago. 4 Since that time, the earth’s climate has been relatively stable (except for some suggestion that the earth may have been frozen over at certain points in its history 5 ). The temperature of the earth is largely dependent upon the energy output from the Sun, which has increased ~30% over the history of the solar system. 6 This increase in solar luminosity has been balanced by a decrease in the amount of greenhouse gases in the atmosphere (largely as a result of the actions of photosynthetic organisms). However, the amount of energy received from the Sun is dependent upon the earth’s orbit (specifically, its eccentricity, precession, and tilt), which changes slightly at regular intervals. 7 In addition to solar luminosity, the earth produces a small amount of energy from radioactive decay, which keeps the earth’s core molten. Solar energy is partly absorbed and partly reflected by the earth. In addition, some of the energy absorbed by the earth is radiated back into space. The net difference in energy absorbed vs. energy radiated determines whether the earth becomes warmer or cooler over time. The composition of the atmosphere greatly affects how much energy from the Sun is radiated back into space. The large share of the atmosphere’s gases (nitrogen and oxygen, which make up 99% of the atmosphere) are transparent to the earth’s energy. Minor components, water vapor and carbon dioxide, are greenhouse gases that reduce the amount of the earth’s energy that radiates back into space. A much more potent greenhouse gas, methane, is produced by certain bacteria (mostly in the guts of cows, and under certain conditions of decomposition), although it tends to be naturally removed from the atmosphere through chemical reactions (with a half-life of ~7 years). Since the amount of water vapor in the atmosphere is relatively constant, scientists’ main concern is the amount of carbon dioxide, which is produced by burning of fossil fuels and wood, and by decomposition of biologically-produced materials After one year of study, I have decided to present a (hopefully) unbiased examination of the issue of global warming. This is a “big picture” analysis of the scientific studies related to global warming. Recently, 86 evangelical leaders signed an initiative urging the adoption of legislation to reduce carbon dioxide emissions (see Evangelical Leaders Join Global Warming Initiative). Are these suggestions the best way to address the global warming issue?
Transcript of Global Warming: Will Human-Induced Climate Change Destroy ... · Global Warming: Will Human-Induced...
Global Warming: Will Human-Induced Climate Change Destroy the World? by Rich Deem
Introduction Is the world getting warmer and, if so, are the actions of mankind to blame for these temperature increases? The burning of fossil fuels converts carbon in the biomass into carbon dioxide (CO2), which is a “greenhouse” gas. This and other greenhouse gases (such as methane) tend to trap energy from the Sun on the earth. Many scientists have sounded the alarm that we must reduce our use of fossil fuels. Others, including a number of prominent conservatives, have said that we have little to worry about. This page examines the basic questions and the answers we are getting from scientific studies, including historical values for greenhouse gases, temperature, and other variables that impact earth’s climate. In addition, we will examine some of the theory behind the science that causes most scientists to be concerned. Included below are links to the original data/studies that will allow you to verify that the information on this page is accurate.
What’s the problem? Since this page is written at a lay level, we are not going to examine the details involved in climate modeling that concerns most scientists. However, some background is necessary in order to understand what the fuss is about. Looking at the big picture, radioactive dating of meteorites shows that the earth and solar system formed ~4.6 billion years ago. By examining the earth’s rocks and minerals, scientists have determined that liquid water was probably on the earth as early as 4.3 billion years ago.1 However, much of the evidence for this period of time was destroyed by the heavy late bombardment that pummeled the inner solar system ~3.9 billion years ago.2 Some of the collision events were so energetic that the entirety of the earth’s oceans and the outer layer of its rock was vaporized.3 Therefore, the first evidence for the existence of life is at ~3.8 billion years ago.4 Since that time, the earth’s climate has been relatively stable (except for some suggestion
that the earth may have been frozen over at certain points in its history5). The temperature of the earth is largely dependent upon the energy output from the Sun, which has increased ~30% over the history of the solar system.6 This increase in solar luminosity has been balanced by a decrease in the amount of greenhouse gases in the atmosphere (largely as a result of the actions of photosynthetic organisms). However, the amount of energy received from the Sun is dependent upon the earth’s orbit (specifically, its eccentricity, precession, and tilt), which changes slightly at regular intervals.7 In addition to solar luminosity, the earth produces a small amount of energy from radioactive decay, which keeps the earth’s core molten. Solar energy is partly absorbed and partly reflected by the earth. In addition, some of the energy absorbed by the earth is radiated back into space. The net difference in energy absorbed vs. energy radiated determines whether the earth becomes warmer or cooler over time. The composition of the atmosphere greatly affects how much energy from the Sun is radiated back into space. The large share of the atmosphere’s gases (nitrogen and oxygen, which make up 99% of the atmosphere) are transparent to the earth’s energy. Minor components, water vapor and carbon dioxide, are greenhouse gases that reduce the amount of the earth’s energy that radiates back into space. A much more potent greenhouse gas, methane, is produced by certain bacteria (mostly in the guts of cows, and under certain conditions of decomposition), although it tends to be naturally removed from the atmosphere through chemical reactions (with a half-life of ~7 years). Since the amount of water vapor in the atmosphere is relatively constant, scientists’ main concern is the amount of carbon dioxide, which is produced by burning of fossil fuels and wood, and by decomposition of biologically-produced materials
After one year of study, I have decided to present a (hopefully) unbiased examination of the issue of global warming. This is a “big picture” analysis of the scientific studies related to global warming. Recently, 86 evangelical leaders signed an initiative urging the adoption of legislation to reduce carbon dioxide emissions (see Evangelical Leaders Join Global Warming Initiative). Are these suggestions the best way to address the global warming issue?

Global Warming: Will Human-Induced Climate Change Destroy the World? Evidence for God from Science by Rich Deem www.GodAndScience.org
2 of 15
(a significant amount of which is due to deforestation). Industrialization of most of the world has resulted in a rapid increase in the burning of fossil fuels, which is greatly increasing the amount of carbon dioxide released into the atmosphere. Scientists are concerned that increases in the amount of the greenhouse gas carbon dioxide will result in worldwide temperature increases that will affect the ecosystems of the planet. In the short-term, several species would be expected to become extinct. Ultimately, it is possible that a runaway greenhouse effect could make the earth uninhabitable by all species (including us). First, let’s look at what is happening with atmospheric carbon dioxide levels.
Atmospheric carbon dioxide
CO2 levels - past and present The atmospheric concentration of CO2 has varied greatly over time, from a recent high of more than 380 parts-per-million (ppm) 25 million years ago, to a low of about 180 ppm during several periods of glaciation over the past 650,000 years (Figure 1). As can be seen, CO2 levels go through cycles of increase and decrease over 100,000 year intervals, which correspond to eccentricity changes in the earth’s orbit. The atmospheric concentration of CO2 was relatively constant at about 280 ppm for ~1,000 years before 1750. Since 1750, the CO2 concentration has risen, reaching ~377 ppm in 2005. The inset (small graph in upper right) of figure 1 shows the atmospheric levels of CO2 for the last 44 years. During that short period of time, CO2 levels
have risen nearly 60 ppm, producing the sharp spike at the far right of the main graph. Although the cycles of CO2 levels (approximately 100,000 years apart) are naturally on a rise from the last ice age, the spike is dramatically higher than any levels seen over the last 650,000 years.
Where does the CO2 come from? Humans have been changing the face of the earth for thousands of years. Some of these changes include clearing the land for agriculture and burning carbon sources for heat. As the human population began to increase rapidly, these “insignificant” changes began to have global impact. Figure 2 shows annual carbon emissions since 1751. The use of coal during Industrial Revolution of the 19th century began humanity’s rapid addition of carbon into the atmosphere. The extensive use of petroleum and natural gas after World War II has rapidly increased the amount of these carbon emissions within the last 50 years. These data strongly suggest that the rapid increase of CO2 in the last century is not the result of a natural process. At the current rate of increase, atmospheric CO2 levels will double in ~150 years.
Missing CO2 Actually, we are producing much more CO2 than is showing up in the atmosphere (Figure 3). The blue
Figure 1. Historic CO2 Levels for the Last 650,000 Years
170
220
270
320
370
420
0200000400000600000Time (YBP)
CO
2(p
pm)
Vostok Ice CoreDome Concordia
Muana Loa ReadingsCO2 Levels Since 1958
310
330350
370
010203040
CO
2(p
pm)
References: Barnola, J.-M., et al., 2003,8 Keeling, C.D. and T.P. Whorf, 2005,9 and Siegenthaler, U., et al. 2005.10
Figure 2. Annual Carbon Emissions Since 1751.
0
1
2
3
4
5
6
7
8
1750 1800 1850 1900 1950 2000Year
Total
Gas fuel
Liquid fuel
Solid fuel
Car
bon
(pet
agra
ms/
year
)
0
1
2
3
4
5
6
7
8
1750 1800 1850 1900 1950 2000Year
Total
Gas fuel
Liquid fuel
Solid fuel
Car
bon
(pet
agra
ms/
year
)
Source: Trends: Carbon Dioxide Emissions11
Global Warming: Will Human-Induced Climate Change Destroy the World? Evidence for God from Science by Rich Deem www.GodAndScience.org
3 of 15
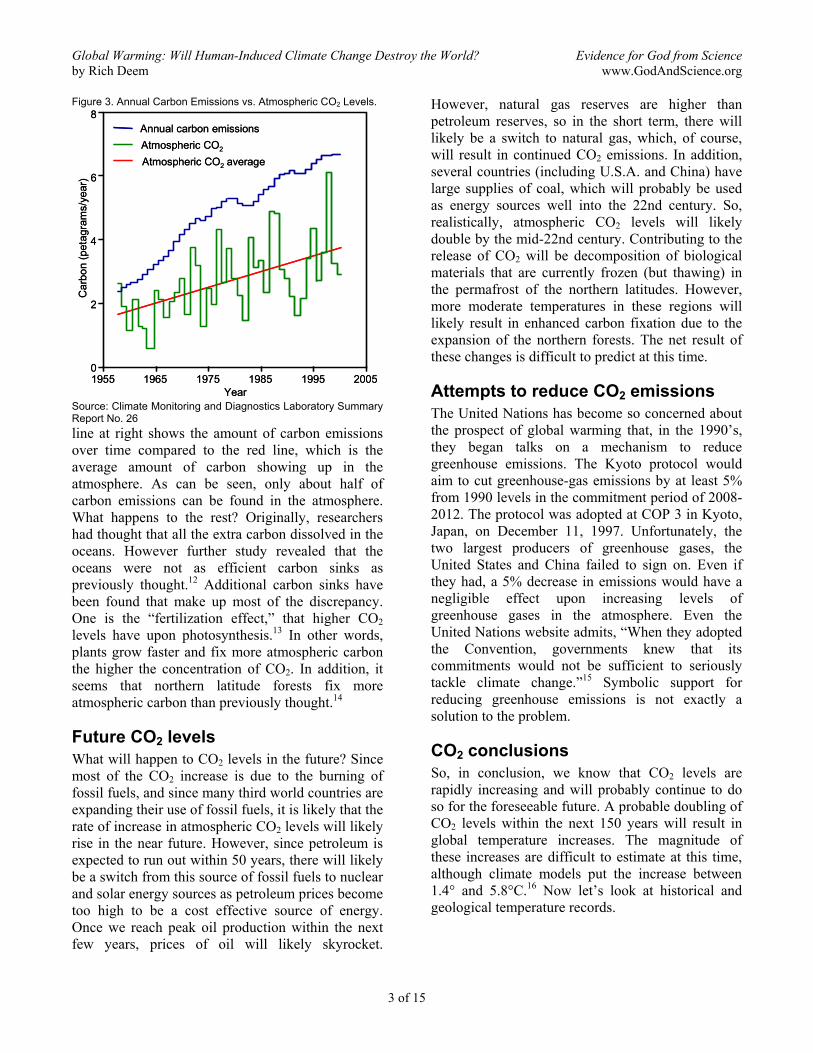
line at right shows the amount of carbon emissions over time compared to the red line, which is the average amount of carbon showing up in the atmosphere. As can be seen, only about half of carbon emissions can be found in the atmosphere. What happens to the rest? Originally, researchers had thought that all the extra carbon dissolved in the oceans. However further study revealed that the oceans were not as efficient carbon sinks as previously thought.12 Additional carbon sinks have been found that make up most of the discrepancy. One is the “fertilization effect,” that higher CO2 levels have upon photosynthesis.13 In other words, plants grow faster and fix more atmospheric carbon the higher the concentration of CO2. In addition, it seems that northern latitude forests fix more atmospheric carbon than previously thought.14
Future CO2 levels What will happen to CO2 levels in the future? Since most of the CO2 increase is due to the burning of fossil fuels, and since many third world countries are expanding their use of fossil fuels, it is likely that the rate of increase in atmospheric CO2 levels will likely rise in the near future. However, since petroleum is expected to run out within 50 years, there will likely be a switch from this source of fossil fuels to nuclear and solar energy sources as petroleum prices become too high to be a cost effective source of energy. Once we reach peak oil production within the next few years, prices of oil will likely skyrocket.
However, natural gas reserves are higher than petroleum reserves, so in the short term, there will likely be a switch to natural gas, which, of course, will result in continued CO2 emissions. In addition, several countries (including U.S.A. and China) have large supplies of coal, which will probably be used as energy sources well into the 22nd century. So, realistically, atmospheric CO2 levels will likely double by the mid-22nd century. Contributing to the release of CO2 will be decomposition of biological materials that are currently frozen (but thawing) in the permafrost of the northern latitudes. However, more moderate temperatures in these regions will likely result in enhanced carbon fixation due to the expansion of the northern forests. The net result of these changes is difficult to predict at this time.
Attempts to reduce CO2 emissions The United Nations has become so concerned about the prospect of global warming that, in the 1990’s, they began talks on a mechanism to reduce greenhouse emissions. The Kyoto protocol would aim to cut greenhouse-gas emissions by at least 5% from 1990 levels in the commitment period of 2008-2012. The protocol was adopted at COP 3 in Kyoto, Japan, on December 11, 1997. Unfortunately, the two largest producers of greenhouse gases, the United States and China failed to sign on. Even if they had, a 5% decrease in emissions would have a negligible effect upon increasing levels of greenhouse gases in the atmosphere. Even the United Nations website admits, “When they adopted the Convention, governments knew that its commitments would not be sufficient to seriously tackle climate change.”15 Symbolic support for reducing greenhouse emissions is not exactly a solution to the problem.
CO2 conclusions So, in conclusion, we know that CO2 levels are rapidly increasing and will probably continue to do so for the foreseeable future. A probable doubling of CO2 levels within the next 150 years will result in global temperature increases. The magnitude of these increases are difficult to estimate at this time, although climate models put the increase between 1.4° and 5.8°C.16 Now let’s look at historical and geological temperature records.
Figure 3. Annual Carbon Emissions vs. Atmospheric CO2 Levels.
Annual carbon emissionsAtmospheric CO2
Atmospheric CO2 average
1955 1965 1975 1985 1995 20050
4
6
8
2
Year
Car
bon
(pet
agra
ms/
year
)
Annual carbon emissionsAtmospheric CO2
Atmospheric CO2 average
1955 1965 1975 1985 1995 20050
4
6
8
2
Year
Car
bon
(pet
agra
ms/
year
)
Source: Climate Monitoring and Diagnostics Laboratory Summary Report No. 26
Global Warming: Will Human-Induced Climate Change Destroy the World? Evidence for God from Science by Rich Deem www.GodAndScience.org
4 of 15
Past temperatures
How do we determine past temperatures? Unfortunately, we don’t have any temperature measurements recorded from cave men or, even more recently, from much of recorded history. So, how can scientists determine what temperatures were like thousands or millions of years ago? It turns out that much information about temperatures and greenhouse gas levels can be determined from ice cores throughout the world. The main cores examined include those in Greenland and Antarctica. In addition, there are several glaciers at the tops of mountains throughout the world that have been around for thousands of years (although these are melting rapidly, and may not be available for future study). How do we date the ice cores? Every year, new snowfall adds another layer, which can be seen and counted. By counting all the layers, scientists can determine when the snow at a particular level was laid down. In addition, several other methods, including pollen records, plant macrofossils, vertebrate paleontology, noble gas temperatures from ground water, Sr/Ca isotope data, and carbon and oxygen isotopes from speleothem calcite (stalactites and stalagmites), have been calibrated to produce accurate models for past temperatures on earth. The fact that multiple methods give similar results confirms the validity of the techniques. In addition, many studies have shown that global temperature changes have occurred in the past, from testing samples at different sites on the planet. For these reasons, we can be confident that the scientific data gives us an accurate picture of earth’s past climatic changes.
Temperatures on the rise? Are the earth’s temperatures on the rise? There is actually a lot of data on global temperatures for the last 100 years or so. Equally important is whether there is a difference between energy influx from the Sun vs. radiation of thermal energy from the earth into space. Obviously, temperatures will increase only if the net influx of energy exceeds the radiation of the energy back to space. A study from 2005 revealed that the Earth is absorbing 0.85 watts per square meter more energy from the Sun than it is emitting to space,
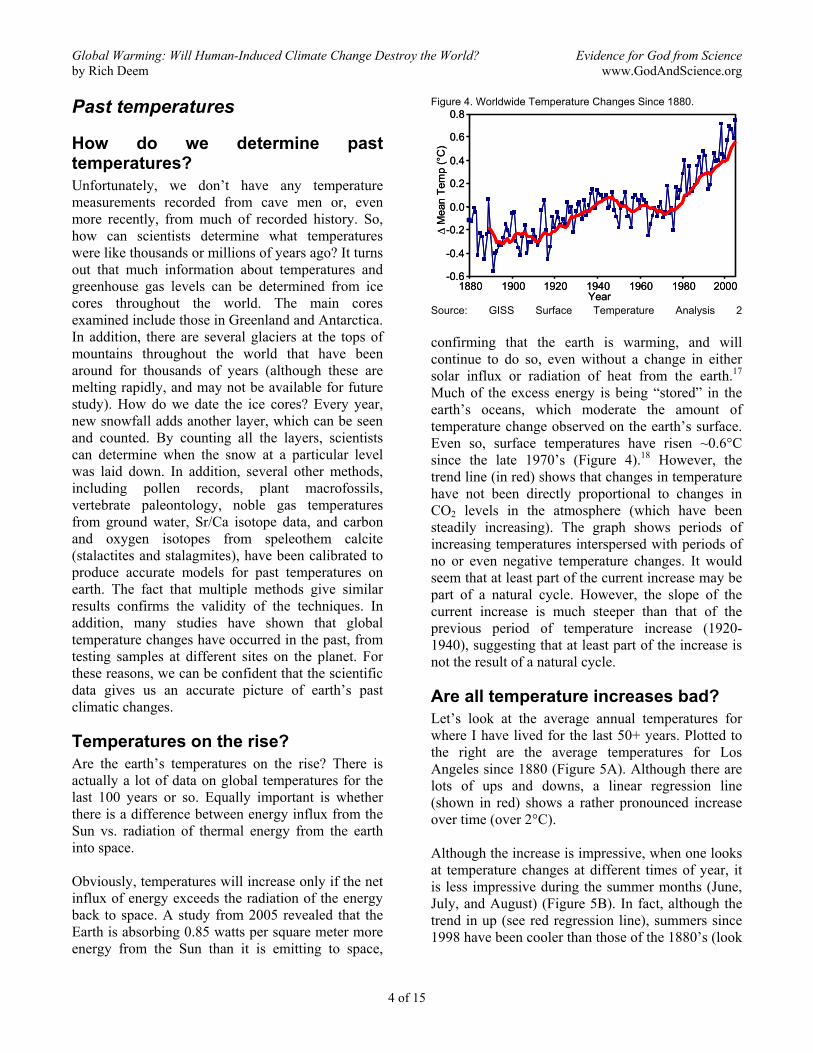
confirming that the earth is warming, and will continue to do so, even without a change in either solar influx or radiation of heat from the earth.17 Much of the excess energy is being “stored” in the earth’s oceans, which moderate the amount of temperature change observed on the earth’s surface. Even so, surface temperatures have risen ~0.6°C since the late 1970’s (Figure 4).18 However, the trend line (in red) shows that changes in temperature have not been directly proportional to changes in CO2 levels in the atmosphere (which have been steadily increasing). The graph shows periods of increasing temperatures interspersed with periods of no or even negative temperature changes. It would seem that at least part of the current increase may be part of a natural cycle. However, the slope of the current increase is much steeper than that of the previous period of temperature increase (1920-1940), suggesting that at least part of the increase is not the result of a natural cycle.
Are all temperature increases bad? Let’s look at the average annual temperatures for where I have lived for the last 50+ years. Plotted to the right are the average temperatures for Los Angeles since 1880 (Figure 5A). Although there are lots of ups and downs, a linear regression line (shown in red) shows a rather pronounced increase over time (over 2°C). Although the increase is impressive, when one looks at temperature changes at different times of year, it is less impressive during the summer months (June, July, and August) (Figure 5B). In fact, although the trend in up (see red regression line), summers since 1998 have been cooler than those of the 1880’s (look
Figure 4. Worldwide Temperature Changes Since 1880.
-0.6
-0.4
-0.2
0.0
0.2
0.4
0.6
0.8
1880 1900 1920 1940 1960 1980 2000Year
∆M
ean
Tem
p (°
C)
-0.6
-0.4
-0.2
0.0
0.2
0.4
0.6
0.8
1880 1900 1920 1940 1960 1980 2000Year
∆M
ean
Tem
p (°
C)
Source: GISS Surface Temperature Analysis 2

Global Warming: Will Human-Induced Climate Change Destroy the World? Evidence for God from Science by Rich Deem www.GodAndScience.org
5 of 15
at each end of the graph). Such trends suggest that temperature changes during the summer months might be cyclical, rather than an actual warming trend. More data is required to determine if the temperature changes are the result of a long-term trend. However, when one examines temperature data for the winter months (December, January, and February) (Figure 5C), it is clear that there has been a pretty consistent temperature increase through the years. The data shows that warming for the summer months is 8%, whereas warming for the winter months is 17%. However, global warming during the winter months is not a bad thing. In fact, warmer
winters will conserve fossil fuels (reducing CO2 emissions) as heating needs are reduced. What is happening globally with temperature increases? Figure 6 shows 2005 changes in global temperatures relative to the baseline of 1951-1980. Colors in the reds represent temperature increases, whereas colors in the blues represent decreases. As can be seen from the graph, the largest temperature increases are occurring in the most northern parts of the northern hemisphere. When one examines global temperature changes, the data shows a 0.6°C increase in worldwide temperatures over the last 150 years.18 This increase is a fairly large for such a short period of time, but is it outside the range of change that has been observed in the past?
Temperatures over the history of the earth Numerous studies have shown that temperatures in the past have been warmer than what we now experience. Studies suggest that the medieval warm period (from the ninth to thirteenth centuries) was up to 1°C warmer than today.19 This warm period was followed by the “Little Ice Age”, which extended from 1400 to 1840, during which time temperatures were significantly cooler than present.20 This period of cooling was only the last in a series of climate cycles that happen every 1,500 years.20 Scientists believe that these variations in temperature are due to changes in solar output, the orbit of the earth, and/or changes in ocean currents. For Eastern North America and Western Europe, temperatures are moderated by warm currents moving northward
Figure 5. Los Angeles Temperature Changes Since 1880. A. Average Annual Temperatures
y = 0.0174x - 15.77715
16
17
18
19
20
21
22
1880 1900 1920 1940 1960 1980 2000Year
Tem
pera
ture
(°C
)
y = 0.0174x - 15.777y = 0.0174x - 15.77715
16
17
18
19
20
21
22
1880 1900 1920 1940 1960 1980 2000Year
Tem
pera
ture
(°C
)
B. Average Summer Los Angeles Temperatures
y = 0.0138x - 5.307818
19
20
21
22
23
24
25
1880 1900 1920 1940 1960 1980 2000Year
Tem
pera
ture
(°C
)
y = 0.0138x - 5.3078y = 0.0138x - 5.307818
19
20
21
22
23
24
25
1880 1900 1920 1940 1960 1980 2000Year
Tem
pera
ture
(°C
)
C. Average Winter Los Angeles Temperatures
y = 0.0184x - 21.45810
11
12
13
14
15
16
17
1880 1900 1920 1940 1960 1980 2000Year
Tem
pera
ture
(°C
)
y = 0.0184x - 21.458y = 0.0184x - 21.45810
11
12
13
14
15
16
17
1880 1900 1920 1940 1960 1980 2000Year
Tem
pera
ture
(°C
)
Data courtesy of the Goddard Institute for Space Studies
Figure 6. Changes in Temperatures Relative to 1951-1980
-3 -2.5 -1.5 -1 -.5 -.1 .1 .5 1 1.5 2.5 3.4-3 -2.5 -1.5 -1 -.5 -.1 .1 .5 1 1.5 2.5 3.4Data courtesy of the Goddard Institute for Space Studies18
Global Warming: Will Human-Induced Climate Change Destroy the World? Evidence for God from Science by Rich Deem www.GodAndScience.org
6 of 15
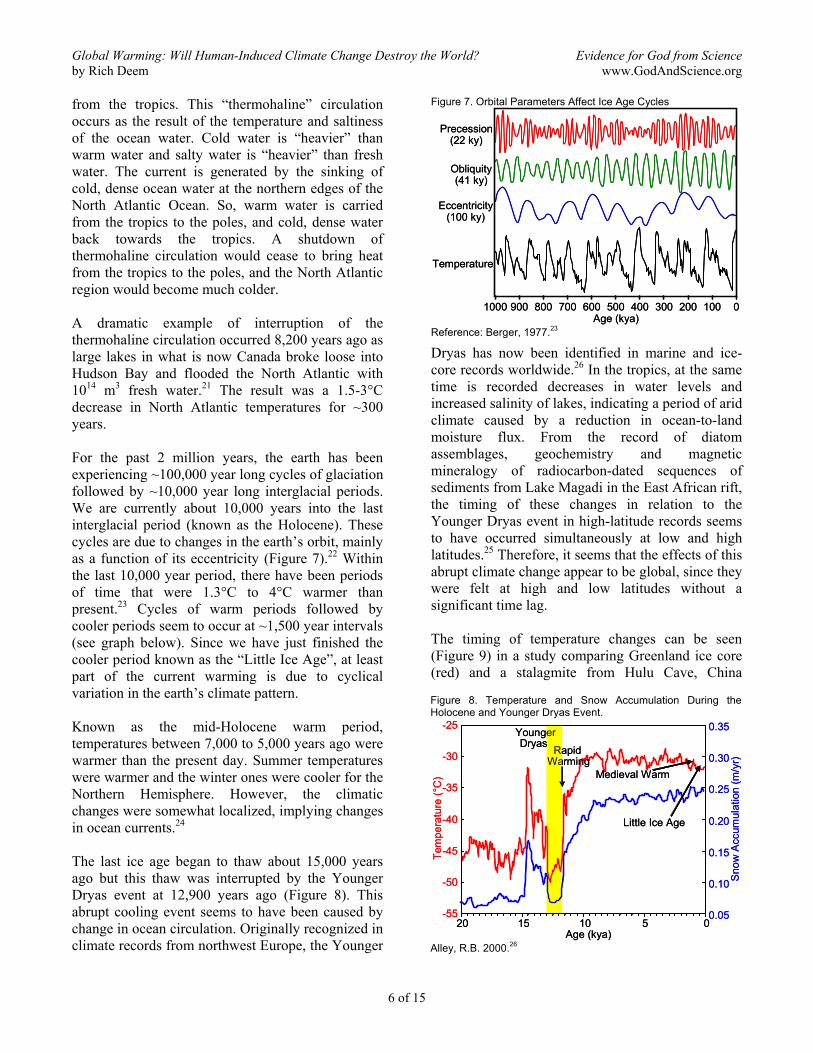
from the tropics. This “thermohaline” circulation occurs as the result of the temperature and saltiness of the ocean water. Cold water is “heavier” than warm water and salty water is “heavier” than fresh water. The current is generated by the sinking of cold, dense ocean water at the northern edges of the North Atlantic Ocean. So, warm water is carried from the tropics to the poles, and cold, dense water back towards the tropics. A shutdown of thermohaline circulation would cease to bring heat from the tropics to the poles, and the North Atlantic region would become much colder. A dramatic example of interruption of the thermohaline circulation occurred 8,200 years ago as large lakes in what is now Canada broke loose into Hudson Bay and flooded the North Atlantic with 1014 m3 fresh water.21 The result was a 1.5-3°C decrease in North Atlantic temperatures for ~300 years. For the past 2 million years, the earth has been experiencing ~100,000 year long cycles of glaciation followed by ~10,000 year long interglacial periods. We are currently about 10,000 years into the last interglacial period (known as the Holocene). These cycles are due to changes in the earth’s orbit, mainly as a function of its eccentricity (Figure 7).22 Within the last 10,000 year period, there have been periods of time that were 1.3°C to 4°C warmer than present.23 Cycles of warm periods followed by cooler periods seem to occur at ~1,500 year intervals (see graph below). Since we have just finished the cooler period known as the “Little Ice Age”, at least part of the current warming is due to cyclical variation in the earth’s climate pattern. Known as the mid-Holocene warm period, temperatures between 7,000 to 5,000 years ago were warmer than the present day. Summer temperatures were warmer and the winter ones were cooler for the Northern Hemisphere. However, the climatic changes were somewhat localized, implying changes in ocean currents.24 The last ice age began to thaw about 15,000 years ago but this thaw was interrupted by the Younger Dryas event at 12,900 years ago (Figure 8). This abrupt cooling event seems to have been caused by change in ocean circulation. Originally recognized in climate records from northwest Europe, the Younger
Dryas has now been identified in marine and ice-core records worldwide.26 In the tropics, at the same time is recorded decreases in water levels and increased salinity of lakes, indicating a period of arid climate caused by a reduction in ocean-to-land moisture flux. From the record of diatom assemblages, geochemistry and magnetic mineralogy of radiocarbon-dated sequences of sediments from Lake Magadi in the East African rift, the timing of these changes in relation to the Younger Dryas event in high-latitude records seems to have occurred simultaneously at low and high latitudes.25 Therefore, it seems that the effects of this abrupt climate change appear to be global, since they were felt at high and low latitudes without a significant time lag. The timing of temperature changes can be seen (Figure 9) in a study comparing Greenland ice core (red) and a stalagmite from Hulu Cave, China
Figure 7. Orbital Parameters Affect Ice Age Cycles
Age (kya)1000 900 800 700 600 500 400 300 200 100 0
Precession(22 ky)
Obliquity(41 ky)
Eccentricity(100 ky)
Temperature
Age (kya)1000 900 800 700 600 500 400 300 200 100 0
Precession(22 ky)
Obliquity(41 ky)
Eccentricity(100 ky)
Temperature
Reference: Berger, 1977.23
Figure 8. Temperature and Snow Accumulation During the Holocene and Younger Dryas Event.
-55
-50
-45
-40
-35
-30
-25
05101520Age (kya)
Tem
pera
ture
(°C
)
0.05
0.10
0.15
0.20
0.25
0.30
0.35S
now
Acc
umul
atio
n (m
/yr)
Little Ice Age
Medieval Warm
RapidWarming
YoungerDryas
-55
-50
-45
-40
-35
-30
-25
05101520Age (kya)
Tem
pera
ture
(°C
)
0.05
0.10
0.15
0.20
0.25
0.30
0.35S
now
Acc
umul
atio
n (m
/yr)
Little Ice Age
Medieval Warm
RapidWarming
YoungerDryas
Alley, R.B. 2000.26

Global Warming: Will Human-Induced Climate Change Destroy the World? Evidence for God from Science by Rich Deem www.GodAndScience.org
7 of 15
(blue).27 These data show that not only rapid cooling, but rapid warming periods have occurred within the recent history of the earth. Another period of warmer temperatures occurred during the previous interglacial period, called the Eemian, which took place 125,000 years ago. During the Eemian, temperatures were slightly warmer than today (by about 1 to 2°C), which seemed to have been caused by changes in the Earth’s orbit and changes in the thermohaline circulation.28 Going back even further in geologic time, the climate of the middle Pliocene (3.15 to 2.85 million years ago), based on microfossils from deep ocean cores and pollen records from land-based cores, was, on the average, 2°C higher than today. Sea levels were 100 ft higher than today, since the Antarctica ice sheet was smaller. Temperatures at high latitudes were 20°C higher, with only a 1°C warming at the Equator. These higher temperatures were probably caused by CO2 levels that were 100 ppm higher than today, along with increased thermohaline circulation.29 Movement of continents 41 million years ago led to the opening of the Drake Passage (between South America and Antarctica).30 Increased ocean current exchange between Atlantic and Pacific Oceans resulted in strong global cooling that led to the permanent glaciation of Antarctica for the first time ~34 million years ago.
The next warm period is known as the Late Paleocene Thermal Maximum, which occurred about 55 million years ago. Sea surface temperatures rose between 5 and 8°C over a period of a few thousand years or less. This rapid change in climate is thought to be due to increased volcanism and/or the rapid release of methane from the oceans.31 The Mid-Cretaceous period (120-90 million years ago: end of Mesozoic) is one period in the geologic past that stands out as much warmer than today, particularly at high latitudes. During this time, breadfruit trees grew as far north as Greenland and warm waters corals grew farther away from the Equator in both hemispheres. These high temperatures were due to much higher CO2 levels (at least 2 to 4 times higher than today, up to 1200 ppm), along with different ocean currents due to different positioning of the continents.32
The “hockey stick” controversy In 1998, Michael Mann published a study that reconstructed global temperatures over the last 1,000 years.33 The study attempted to address the question of the nature of recent global temperature increases. The study showed that rapid temperature increases of the latter half of the 20th century had no comparable analogs during the previous millennium. A subsequent study by Mann corrected and added to the first study, with nearly identical results.34 Mann’s studies were widely promoted by the United Nations’ Intergovernmental Panel on Climate Change (IPCC). A summary graph of their results became known is the “hockey stick” graph because the results showed relatively small temperature changes except for a rapid increase in the 20th century (Figure 10). Some climatologists were concerned about the validity of the Mann et al.
Figure 9. Oxygen Isotope (Temperature-related) Data from China and Greenland for the Younger Dryas Event
-44
-43
-42
-41
-40
-39
-38
-37
-36
-35
-34
δ18 O
(Gre
enla
nd)
-8.0
-7.5
-7.0
-6.5
-6.0
-5.5
-5.0
-4.5
-4.010000110001200013000140001500016000
δ18 O
(Chi
na)
YoungerDryas
Age (kya)
-44
-43
-42
-41
-40
-39
-38
-37
-36
-35
-34
δ18 O
(Gre
enla
nd)
-8.0
-7.5
-7.0
-6.5
-6.0
-5.5
-5.0
-4.5
-4.010000110001200013000140001500016000
δ18 O
(Chi
na)
YoungerDryas
Age (kya) Wang, Y.J., et al., 2004, and Nature 431: 147, 2004.27
Figure 10. Famous “Hockey Stick” Graph by Mann, et al. 1999.
1000 1200 1400 1600 1800 2000-0.8
Year
-0.6
-0.4
-0.2
0
0.2
0.4
0.6
Tem
pera
ture
Cha
nge
(°C
)
Direct temperature measurementsMann et al. 1999
1000 1200 1400 1600 1800 2000-0.8
Year
-0.6
-0.4
-0.2
0
0.2
0.4
0.6
Tem
pera
ture
Cha
nge
(°C
)
Direct temperature measurementsMann et al. 1999
Source: Mann et al. 1999.34
Global Warming: Will Human-Induced Climate Change Destroy the World? Evidence for God from Science by Rich Deem www.GodAndScience.org
8 of 15
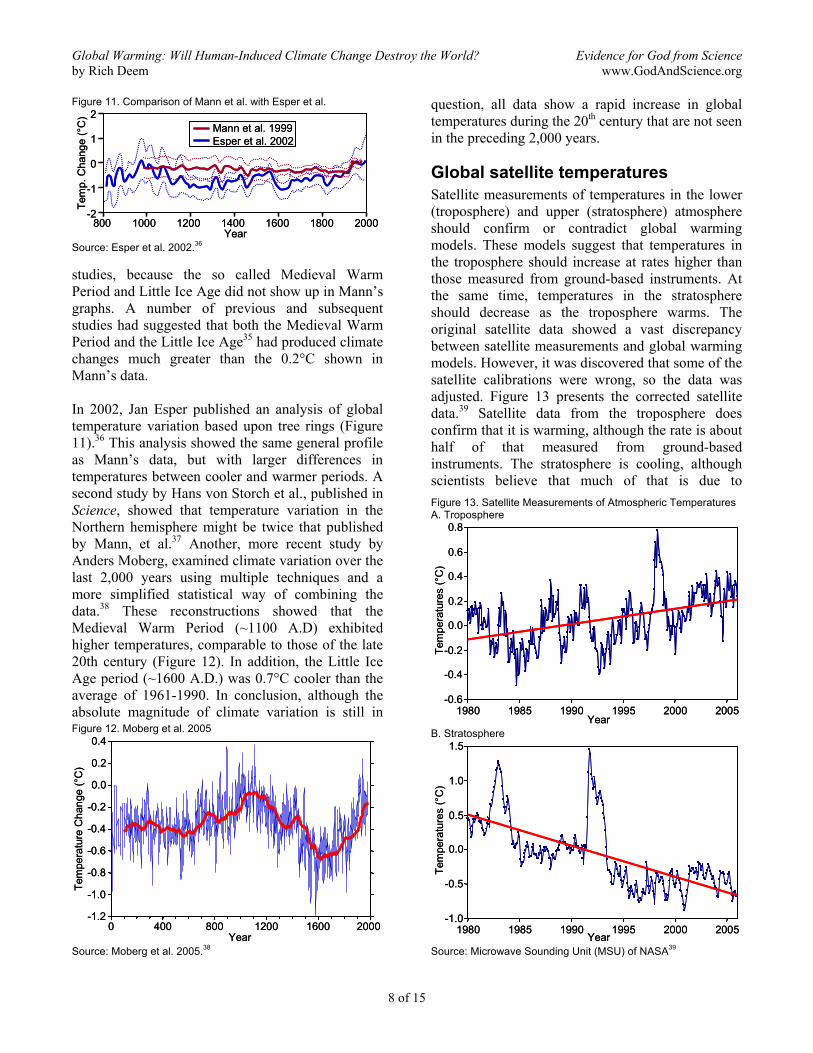
studies, because the so called Medieval Warm Period and Little Ice Age did not show up in Mann’s graphs. A number of previous and subsequent studies had suggested that both the Medieval Warm Period and the Little Ice Age35 had produced climate changes much greater than the 0.2°C shown in Mann’s data. In 2002, Jan Esper published an analysis of global temperature variation based upon tree rings (Figure 11).36 This analysis showed the same general profile as Mann’s data, but with larger differences in temperatures between cooler and warmer periods. A second study by Hans von Storch et al., published in Science, showed that temperature variation in the Northern hemisphere might be twice that published by Mann, et al.37 Another, more recent study by Anders Moberg, examined climate variation over the last 2,000 years using multiple techniques and a more simplified statistical way of combining the data.38 These reconstructions showed that the Medieval Warm Period (~1100 A.D) exhibited higher temperatures, comparable to those of the late 20th century (Figure 12). In addition, the Little Ice Age period (~1600 A.D.) was 0.7°C cooler than the average of 1961-1990. In conclusion, although the absolute magnitude of climate variation is still in
question, all data show a rapid increase in global temperatures during the 20th century that are not seen in the preceding 2,000 years.
Global satellite temperatures Satellite measurements of temperatures in the lower (troposphere) and upper (stratosphere) atmosphere should confirm or contradict global warming models. These models suggest that temperatures in the troposphere should increase at rates higher than those measured from ground-based instruments. At the same time, temperatures in the stratosphere should decrease as the troposphere warms. The original satellite data showed a vast discrepancy between satellite measurements and global warming models. However, it was discovered that some of the satellite calibrations were wrong, so the data was adjusted. Figure 13 presents the corrected satellite data.39 Satellite data from the troposphere does confirm that it is warming, although the rate is about half of that measured from ground-based instruments. The stratosphere is cooling, although scientists believe that much of that is due to
Figure 11. Comparison of Mann et al. with Esper et al.
Mann et al. 1999Esper et al. 2002
800 1000 1200 1400 1600 1800-2
-1
0
1
2
Tem
p. C
hang
e (°
C)
2000Year
Mann et al. 1999Esper et al. 2002
800 1000 1200 1400 1600 1800-2
-1
0
1
2
Tem
p. C
hang
e (°
C)
2000Year
Source: Esper et al. 2002.36
Figure 12. Moberg et al. 2005
-1.2
-1.0
-0.8
-0.6
-0.4
-0.2
0.0
0.2
0.4
0 400 800 1200 1600 2000Year
Tem
pera
ture
Cha
nge
(°C
)
-1.2
-1.0
-0.8
-0.6
-0.4
-0.2
0.0
0.2
0.4
0 400 800 1200 1600 2000Year
Tem
pera
ture
Cha
nge
(°C
)
Source: Moberg et al. 2005.38
Figure 13. Satellite Measurements of Atmospheric Temperatures A. Troposphere
-0.6
-0.4
-0.2
0.0
0.2
0.4
0.6
0.8
1980 1985 1990 1995 2000 2005Year
Tem
pera
ture
s (°
C)
-0.6
-0.4
-0.2
0.0
0.2
0.4
0.6
0.8
1980 1985 1990 1995 2000 2005Year
Tem
pera
ture
s (°
C)
B. Stratosphere
-1.0
-0.5
0.0
0.5
1.0
1.5
1980 1985 1990 1995 2000 2005Year
Tem
pera
ture
s (°
C)
-1.0
-0.5
0.0
0.5
1.0
1.5
1980 1985 1990 1995 2000 2005Year
Tem
pera
ture
s (°
C)
Source: Microwave Sounding Unit (MSU) of NASA39

Global Warming: Will Human-Induced Climate Change Destroy the World? Evidence for God from Science by Rich Deem www.GodAndScience.org
9 of 15
depletion of ozone in the atmosphere.40
CO2 vs. temperature link So, now we have data to show that global CO2 levels are at record highs for the last several million years and that global temperatures are on the increase and are high compared to the recent past. However, it would be good to know if past records show a correlation between CO2 levels and temperatures. Taking the CO2 data from Antarctica ice cores (Figure 1) and adding temperature data from the tropical Pacific,41 shows that CO2 levels almost exactly mirror temperature data (Figure 14), even in disparate parts of the world. It turns out that temperature changes precede changes in CO2 levels slightly, since it is likely that major climate changes in the past were initiated by changes in the earth’s orbit (Figure 7).
Global temperatures conclusions The scientific data is clear that global temperatures are rising. Although the amount of increase is probably within the range of natural variability for the last thousand years, the rate of increase is faster than at any other time during that period. Some of the increase may be due to a natural warming trend, although most of the increase is probably due to human influence.43
Consequences of global warming Temperature variations of the earth are highly dependent upon land and ocean configuration. Two thirds of the earth’s land resides in the northern hemisphere. Because oceans tend to moderate temperatures (Figure 15A), temperature changes in
the southern hemisphere tend to be more moderate than those in the northern hemisphere (Figure 15B). So, global warming will primarily impact the northern hemisphere, as seen in Figure 6. Without drastic changes, CO2 levels will double within 150 years, and possibly quadruple eventually. These high CO2 levels were seen during the Mid-Cretaceous period of the earth, and many species thrived during that time. However, since then, solar luminosity has increased by 0.7%. Although this doesn’t seem like a lot, but it would mean that temperatures would be much warmer than those of that era.
Rising of sea levels These kinds of temperature increases in the northern latitudes will profoundly affect the global ecosystems as ice melts and returns to the ocean. Sea
Figure 15. Comparison of Temperature Changes A. Land vs. Ocean
-0.61900
Tem
pera
ture
Cha
nge
(°C
)
-0.4
-0.2
0.0
0.2
0.4
0.6
0.8
1.0
1920 1940 1960 1980 2000Year
LandOcean
-0.61900
Tem
pera
ture
Cha
nge
(°C
)
-0.4
-0.2
0.0
0.2
0.4
0.6
0.8
1.0
1920 1940 1960 1980 2000Year
-0.61900
Tem
pera
ture
Cha
nge
(°C
)
-0.4
-0.2
0.0
0.2
0.4
0.6
0.8
1.0
1920 1940 1960 1980 2000Year
LandOceanLandOcean
B. Northern vs. Southern Hemisphere
Tem
pera
ture
Cha
nge
(°C
)
-0.6
-0.4
-0.2
0.0
0.2
0.4
0.6
0.8
1.0
1900 1920 1940 1960 1980 2000Year
Northern HemisphereSouthern Hemisphere
Tem
pera
ture
Cha
nge
(°C
)
-0.6
-0.4
-0.2
0.0
0.2
0.4
0.6
0.8
1.0
1900 1920 1940 1960 1980 2000Year
Tem
pera
ture
Cha
nge
(°C
)
-0.6
-0.4
-0.2
0.0
0.2
0.4
0.6
0.8
1.0
1900 1920 1940 1960 1980 2000Year
Northern HemisphereSouthern HemisphereNorthern HemisphereSouthern Hemisphere
Source: GISS Surface Temperature Analysis42
Figure 14. CO2 vs. Temperatures for the Last 650,000 Years
170
220
270
320
370
0200000400000600000Time (YBP)
CO
2(p
pm)
25
26
27
28
29
30
31
0200000400000600000
SS
T (°
C)
170
220
270
320
370
0200000400000600000Time (YBP)
CO
2(p
pm)
25
26
27
28
29
30
31
0200000400000600000
SS
T (°
C)
Sources: Barnola, J.-M., et al., 2003,8 Keeling, C.D. and T.P. Whorf, 2005,9 Siegenthaler, U., et al. 2005,10 and Medina-Elizalde and Lea, 200541

Global Warming: Will Human-Induced Climate Change Destroy the World? Evidence for God from Science by Rich Deem www.GodAndScience.org
10 of 15
level changes are plotted for the last 450,000 years compared to temperatures over that same period of time (Figure 16). The melting of pack ice (ice floating in the ocean) does not contribute any rise in sea level, because the density of ice is less than that of water and exactly matches the amount of ice above the water line. However, ice that melts on the land will increase the levels of the oceans. Several studies over the last few years have confirmed that sea levels are rising at a more or less constant rate (although the rate is influenced by La Niña and El Niño conditions). At present, this rate is 1.8 ± 0.3 mm/yr (7.4 in/century).44 However, one new study suggests that the rate of sea level increase seems to be accelerating at a rate of 0.013 ± 0.006 mm/yr2.45 If the rate of acceleration continues to increase at this rate, sea levels might rise up to 12 inches in this century. Some islands in the Pacific are threatened by these modest increases in sea level. For example, the island nation of Tuvalu consists of nine low lying islands (highest elevation is less than 16 feet) that will probably have to be abandoned within this century, displacing ~12,000 residents. Other coastal areas throughout the world will also be threatened with flooding and eventually will have to be abandoned. Flooding of coastal areas will also threaten with extinction sea turtles, which breed on the same beaches on which they were born. If these beaches are flooded or eroded by changing ocean currents, the turtles probably will not breed.
Melting of glaciers Melting of worldwide glaciers and the ice on Greenland and Antarctica will increase the sea level
7-12 inches in this century. A recent study specifically examined the melting of Antarctica ice through changes in gravity as measured by Gravity Recovery and Climate Experiment (GRACE) satellites.47 The measurements showed an average overall loss of 152 km3/year of ice, which would translate into an increase in sea level of 0.4 mm/year or about 2 in/century (Figure 17). However, the results were not evenly distributed over the Antarctic continent, since virtually all the ice loss came from the West Antarctic Ice Sheet. Using other, less accurate techniques, the IPCC had previously estimated the contribution of Antarctica ice melting to global sea level rise was 0.2 mm/year. Another study examined the amount of ice on Greenland and Antarctica over the last ten years, using satellite radar altimetry.48 The data confirmed the GRACE results for Antarctica (melting on the West Antarctic Ice Sheet, but little change on the East Antarctic Ice Sheet. The Greenland data showed extensive melting of the edges of Greenland's ice sheet (confirming visual observations), but increased ice inland (due to increased precipitation). Climate models had predicted increased precipitation in higher latitudes. The net change was +11 Gt a–1 for Greenland and -31 Gt a–1 for Antarctica.48 A number of species are specifically adapted to pack ice conditions. For example, polar bears live and feed from the sea's pack ice. A loss of all the sea ice will likely lead to their extinction in the wild. It might be possible to relocate polar bears to
Figure 16. Changes in Sea Level of the Red Sea for the last 450,000 years
Time (KYBP)
Sea
Lev
el (m
)
450 400 350 300 250 200 150 100 50 0
20
0
-20
-40
-60
-80
-100
-120 25
26
27
28
29
30
31
SS
T (°
C)
Sources: Medina-Elizalde, M. and D.W. Lea. Science, 2005,41 and Siddall et al., Nature, 2003.46
Figure 17. Changes in Antarctica Ice Mass from 2002 to 2005 1000
800
600
400
200
0
-200
-400
-6002003 2004 2005
Ice
Mas
s (k
m3 )
Year Source: Velicogna and Wahr, 2006.47
Global Warming: Will Human-Induced Climate Change Destroy the World? Evidence for God from Science by Rich Deem www.GodAndScience.org
11 of 15
Antarctica, but such a drastic move might have unintended negative consequences on other Antarctic species.
Hurricanes and cyclones Some scientists have suggested that global warming might be responsible for increasing the intensity of tropical storms, hurricanes, and cyclones. Scientists have determined that the energy of hurricanes is intensified in warmer water. The high temperatures of the Gulf of Mexico were probably responsible for the increased number of high category storms during the 2005 season. Two recent studies, published in Science and Nature, showed that the total number of hurricanes doesn’t seem to have changed with increasing temperatures, although the number of storms of category 4 and higher has significantly increased.49
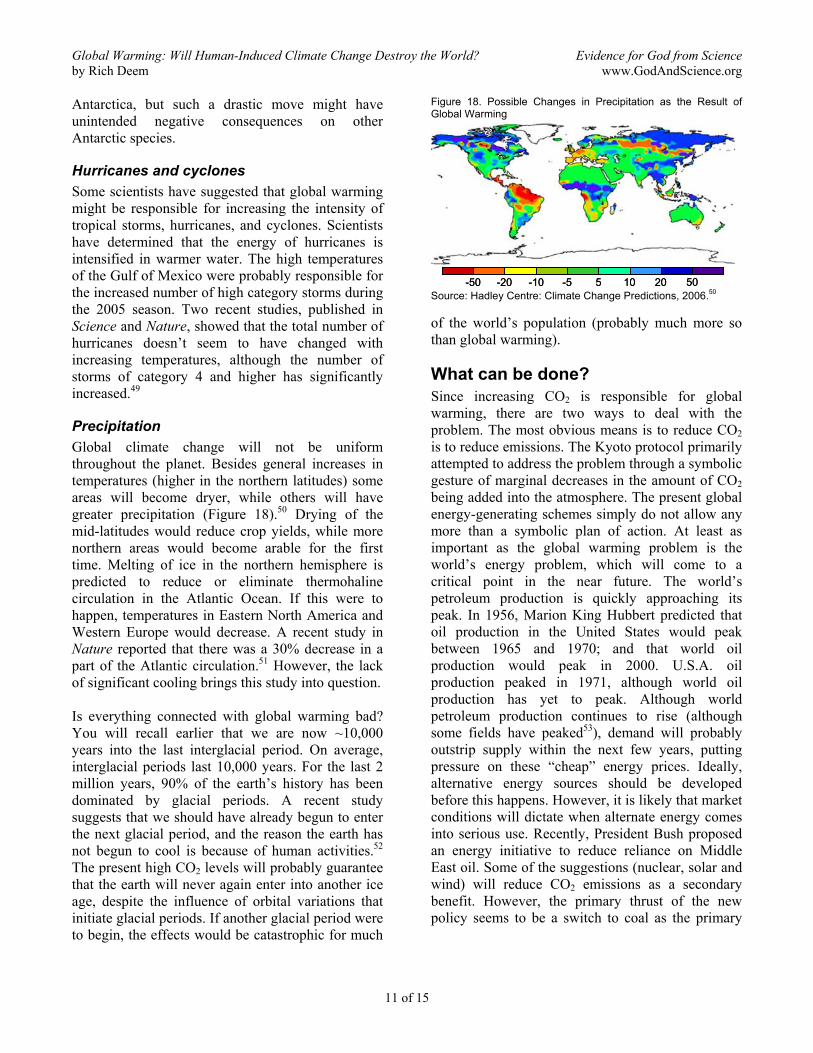
Precipitation Global climate change will not be uniform throughout the planet. Besides general increases in temperatures (higher in the northern latitudes) some areas will become dryer, while others will have greater precipitation (Figure 18).50 Drying of the mid-latitudes would reduce crop yields, while more northern areas would become arable for the first time. Melting of ice in the northern hemisphere is predicted to reduce or eliminate thermohaline circulation in the Atlantic Ocean. If this were to happen, temperatures in Eastern North America and Western Europe would decrease. A recent study in Nature reported that there was a 30% decrease in a part of the Atlantic circulation.51 However, the lack of significant cooling brings this study into question. Is everything connected with global warming bad? You will recall earlier that we are now ~10,000 years into the last interglacial period. On average, interglacial periods last 10,000 years. For the last 2 million years, 90% of the earth’s history has been dominated by glacial periods. A recent study suggests that we should have already begun to enter the next glacial period, and the reason the earth has not begun to cool is because of human activities.52 The present high CO2 levels will probably guarantee that the earth will never again enter into another ice age, despite the influence of orbital variations that initiate glacial periods. If another glacial period were to begin, the effects would be catastrophic for much
of the world’s population (probably much more so than global warming).
What can be done? Since increasing CO2 is responsible for global warming, there are two ways to deal with the problem. The most obvious means is to reduce CO2 is to reduce emissions. The Kyoto protocol primarily attempted to address the problem through a symbolic gesture of marginal decreases in the amount of CO2 being added into the atmosphere. The present global energy-generating schemes simply do not allow any more than a symbolic plan of action. At least as important as the global warming problem is the world’s energy problem, which will come to a critical point in the near future. The world’s petroleum production is quickly approaching its peak. In 1956, Marion King Hubbert predicted that oil production in the United States would peak between 1965 and 1970; and that world oil production would peak in 2000. U.S.A. oil production peaked in 1971, although world oil production has yet to peak. Although world petroleum production continues to rise (although some fields have peaked53), demand will probably outstrip supply within the next few years, putting pressure on these “cheap” energy prices. Ideally, alternative energy sources should be developed before this happens. However, it is likely that market conditions will dictate when alternate energy comes into serious use. Recently, President Bush proposed an energy initiative to reduce reliance on Middle East oil. Some of the suggestions (nuclear, solar and wind) will reduce CO2 emissions as a secondary benefit. However, the primary thrust of the new policy seems to be a switch to coal as the primary
Figure 18. Possible Changes in Precipitation as the Result of Global Warming
-50 -20 -10 -5 5 10 20 50-50 -20 -10 -5 5 10 20 50 Source: Hadley Centre: Climate Change Predictions, 2006.50

Global Warming: Will Human-Induced Climate Change Destroy the World? Evidence for God from Science by Rich Deem www.GodAndScience.org
12 of 15
energy source, which will continue to elevate atmospheric CO2 levels. A new technology to sequester CO2 underground has been used in certain locations in the United States.54 In order to economically pump oil from certain low yield fields, compressed CO2 produced by a nearby a coal-burning power plant has been diverted from release into the atmosphere to push oil out of oil fields. So far, the CO2 has not returned to the surface. Scientists speculate that salt brine formations might also work, but what other geological conditions are conducive to this technique are unknown, but presumably, coal-burning power plants could be built near such locations. The second way to reduce CO2 is through sequestration of carbon in botanical sources, specifically wood. Expansion of forests in North America and northern Asia will provide a carbon sink for some of the excess CO2. Besides sequestering carbon in their wood, the trees add beauty to our world. Personally, we can practice energy conservation of all kinds to reduce CO2 emissions. Get out of your SUV and join a car-pool or take public transportation. Recycling greatly reduces the amount of energy necessary to produce many products. If you can afford it, install a solar panel electrical generating system for your home, business, etc.
Conclusion Yes, global warming is real and most of the recent increases in temperature are directly the result of human actions. However, a number of predictions publicized in the media present unrealistic scenarios of doom and gloom. Yes, sea levels are likely to rise,
but certainly not 3 feet within this century as some publicize. Temperature increases have been extremely rapid within the last two decades. However, the pattern of global temperature increases has never been directly proportional to increasing CO2 levels in the atmosphere (See Figure 4). It is likely that a downturn in temperatures will occur within the next two decades. At that point, the global warming naysayers will proclaim global warming to be a myth. However, I expect temperatures to head up sharply again soon thereafter. If temperatures do not decrease in the near future, at the current rate, temperatures would be 2°C higher by the end of the century. Some climate models have predicted temperature increases of up to 9°C with a doubling of atmospheric CO2. However, two recent studies, using different techniques, have constrained the maximum temperature increase to between 1.5° and 6.2°C55 or 4.5°C.56 In order for temperatures to increase at the maximum predicted amount, the rate of increase would have to remain upward the entire time and increase dramatically. Changing temperatures and ocean currents will cause droughts in some parts of the world, while other areas become moister. However, droughts have been with humanity since the beginning of recorded history, and would have continued to occur in the absence of global warming. The existence of some species will be threatened by the consequences of global warming. However, according to Darwinian theory, these poorly adapted species will be replaced by newly evolved ones. Of course, not even scientists believe that this will really happen. Governments and individuals should work to seriously address the issues of CO2 emissions and carbon sequestration. The primary emphasis should be switching from fossil fuels to alternative energy sources, conservation, and expansion of northern forests.
References
1. Watson, E. B., and T. M. Harrison. 2005. Reports
Zircon Thermometer Reveals Minimum Melting Conditions on Earliest Earth. Science 308: 841-844.
2. Gomes, R., H. F. Levison, K. Tsiganis and A. Morbidelli. 2005. Origin of the cataclysmic Late Heavy Bombardment period of the terrestrial planets. Nature 435: 466-469.
3. Sleep, N.H., K.J. Zahnle, J.F. Kasting, and H.J.
Morowitz. 1989. Annihilation of Ecosystems by Large Asteroid Impacts on the Early Earth. Nature 342:139-142.
4. Rosing, M.T. 1999. 13C-depleted Carbon Microparticles in >3700-Ma Sea-floor Sedimentary Rocks from West Greenland. Science 283:674-676.

Global Warming: Will Human-Induced Climate Change Destroy the World? Evidence for God from Science by Rich Deem www.GodAndScience.org
13 of 15
Schoenberg, R., B.S. Kamber, K.D. Collerson, and S.
Moorbath. 2002. Tungsten Isotope Evidence from ~3.8-Gyr Metamorphosed Sediments for Early Meteorite Bombardment of the Earth. Nature 418:403-405.
5. Bodiselitsch, B., C. Koeberl, S. Master, and W. U. Reimold. 2005. Reports Estimating Duration and Intensity of Neoproterozoic Snowball Glaciations from Ir Anomalies. Science 308: 239-242.
6. Gough, D.O. 1981. Solar interior structure and luminosity variations. Solar Physics 74: 21-34.
7. Zachos, J., M. Pagani, L. Sloan, E. Thomas, K. Billups. 2001. Trends, Rhythms, and Aberrations in Global Climate 65 Ma to Present. Science 292: 686-693.
Bortman, H. 2001. Life Under Bombardment from the NASA Astrobiology Insititute.
8. Barnola, J.-M., D. Raynaud, C. Lorius, and N.I. Barkov. 2003. Historical CO2 record from the Vostok ice core. In Trends: A Compendium of Data on Global Change. Carbon Dioxide Information Analysis Center, Oak Ridge National Laboratory, U.S. Department of Energy, Oak Ridge, Tenn., U.S.A.
9. Keeling, C.D. and T.P. Whorf. 2005. Atmospheric CO2 records from sites in the SIO air sampling network. In Trends: A Compendium of Data on Global Change. Carbon Dioxide Information Analysis Center, Oak Ridge National Laboratory, U.S. Department of Energy, Oak Ridge, Tenn., U.S.A.
10. Siegenthaler, U., et al. 2005. Stable Carbon Cycle–Climate Relationship During the Late Pleistocene. Science 310: 1313-1317.
11. Trends: Carbon Dioxide Emissions (http://cdiac.ornl.gov/trends/emis/em_cont.htm)
12. Hesshaimer V., M. Heimann and I. Levin. 1994. Radiocarbon evidence for a smaller oceanic carbon dioxide sink than previously believed. Nature 370:201-203.
13. Kheshgi, H. S., A. K. Jain and D. J. Wuebbles. 1996. Accounting for the missing carbon sink with the CO2 fertilization effect. Climatic Change 33:31-62.
14. Fan, S., M. Gloor, J. Mahlman, S. Pacala, J. Sarmiento, T. Takahashi, and P. Tans. 1998. A Large Terrestrial Carbon Sink in North America Implied by Atmospheric and Oceanic Carbon Dioxide Data and Models. Science 282: 442-446.
Schimel, D. S., et al. 2001. Recent patterns and mechanisms of carbon exchange by terrestrial ecosystems. Nature 414: 169-172.
15. Kyoto Protocol, January, 2006, from the United Nations Framework Convention on Climate Change.
16. Intergovernmental Panel on Climate Change (IPCC) Third Assessment Report – Climate Change 2001.
17. Hansen, J., L. Nazarenko, R. Ruedy, Mki. Sato, J.
Willis, A. Del Genio, D. Koch, A. Lacis, K. Lo, S. Menon, T. Tovakov, Ju. Perlwitz, G. Russell, G.A. Schmidt, and N. Tausnev 2005. Earth’s energy imbalance: Confirmation and implications. Science 308: 1431-1435.
18. Data courtesy of Goddard Institute for Space Studies (Surface Temperature Analysis), January, 2006.
19. Keigwin, L. D. 1996. The Little Ice Age and Medieval Warm Period in the Sargasso Sea. Science 274: 1503-1508.
Broecker, W. S. 2001. Was the Medieval Warm Period Global? Science 291: 1497-1499.
20. Kerr, R. A 1999. The Little Ice Age--Only the Latest Big Chill. Science 284: 2069.
Hendy, E. J., M. K. Gagan, C. A. Alibert, M. T. McCulloch, J. M. Lough, and P. J. Isdale. 2002. Abrupt Decrease in Tropical Pacific Sea Surface Salinity at End of Little Ice Age. Science 295: 1511-1514.
21. Barber, D.C., Dyke, A., Hillaire-Marcel, C., Jennings, A.E., Andrews, J.T., Kerwin, M.W., Bilodeau, G., Mcneely, R., Southon, J., Morehead, M.D., Gagnon, J.M. 1999. Forcing of the cold event of 8,200 years ago by catastrophic drainage of laurentide lakes. Nature 400: 344-348.
22. Berger, A.L. 1977. Long-term variation of the earth’s orbital elements. Celestial Mechanics 15: 53-74.
23. Cheddadi, R., H. F. Lamb, J. Guiot, S. van der Kaars. 1998. Holocene climatic change in Morocco: a quantitative reconstruction from pollen data. Climate Dynamics 14: 883 - 890.
Andreev, A.A. and V.A. Klimanov. 2000. Quantitative Holocene climatic reconstruction from Arctic Russia. Journal of Paleolimnology 24: 81-91.
Kershaw A.P.1; Lloyd P.J. 1997. Late Quaternary Vegetation and Early Holocene Quantitative Climate Estimates from Morwell Swamp, Latrobe Valley, South-eastern Australia Australian Journal of Botany 45: 549-563.
Bennike, O. and A. Weidick. 1999. Observations on the Quaternary geology around Nioghalvfjerdsfjorden, eastern North Greenland. Geology of Greenland Survey Bulletin 183: 57–60.
24. McDermott, F., D. P. Mattey, and C. Hawkesworth. 2001. Centennial-Scale Holocene Climate Variability Revealed by a High-Resolution Speleothem δ18O Record from SW Ireland. Science 294: 1328-1331. DeVries et al. 1997. Determining the Early History of El Niño. Science 276: 965-967.
Bond, G., W. Showers, M. Cheseby, R. Lotti, P. Almasi, P. deMenocal, P. Priore, H. Cullen, I. Hajdas, and G. Bonani. 1997. A Pervasive Millennial-Scale

Global Warming: Will Human-Induced Climate Change Destroy the World? Evidence for God from Science by Rich Deem www.GodAndScience.org
14 of 15
Cycle in North Atlantic Holocene and Glacial Climates. Science 278: 1257-1266.
25. Roberts, N., M. Taieb, P. Barker, B. Damnati, M. Icole and D. Williamson. 1993. Timing of the Younger Dryas event in East Africa from lake-level changes. Nature 366: 146-148.
26. Alley, R.B. 2000. The Younger Dryas cold interval as viewed from central Greenland. Quaternary Science Reviews 19:213-226.
27. Wang, Y. J., H. Cheng, R. L. Edwards, Z.S. An, J. Y. Wu, C.-C. Shen, and J. A. Dorale. 2001. A High-Resolution Absolute-Dated Late Pleistocene Monsoon Record from Hulu Cave, China Science 294, 2345-2348.
North Greenland Ice Core Project members. 2004. High-resolution record of Northern Hemisphere climate extending into the last interglacial period. Nature 431: 147-151.
28. Adkins, J.F., E.A. Boyle, L. Keigwin, and E. Cortijo. 1997. Variability of the North Atlantic thermohaline circulation during the last interglacial period. Nature 390: 154-158.
Keigwin, L.D., W.B. Curry, S.J. Lehman, and S. Johnson. 1994. The role of the deep ocean in North Atlantic climate change between 70 and 130 kyr ago. Nature 371: 323-326.
Kukla, G. 2000. The last interglacial. Science 287: 987-989.
McManus, J.F., G.C. Bond, W.S. Broecker, S. Johnsen, L. Labeyrie, and S. Higgins. 1994. High-resolution climate records from the North Atlantic during the last interglacial. Nature 371: 326-329.
29. The Climate of the Pliocene: Simulating Earth’s Last Great Warm Period from the Goddard Institute for Space Studies.
30. Scher, H. D. and E. E. Martin. 2006. Timing and Climatic Consequences of the Opening of Drake Passage. Science 312: 428-430.
31. Bains, S., et al. 1999. Mechanisms of Climate Warming at the End of the Paleocene. Science 285: 724-727.
Bralower, T. J., D. J. Thomas, M. M. Hirschmann, and D. L. Whitney. 1997. High-resolution records of the late Paleocene thermal maximum and circum-Caribbean volcanism: Is there a causal link? Geology 25: 963-966.
Schmidt, G.A., and D.T. Shindell. 2003. Atmospheric composition, radiative forcing, and climate change as a consequence of a massive methane release from gas hydrates. Paleoceanography 18: 1004-1013.
Moran, K. et al. 2006. The Cenozoic palaeoenvironment of the Arctic Ocean. Nature 441: 601-605.
Brinkhuis, H., et al. 2006. Episodic fresh surface
waters in the Eocene Arctic Ocean. Nature 441: 606-609.
Sluijs, A., et al. 2006. Subtropical Arctic Ocean temperatures during the Palaeocene/Eocene thermal maximum. Nature 441: 610-613.
32. Haworth, M., S. P. Hesselbo, J. C. McElwain, S. A. Robinson, and J. W. Brunt. 2005. Mid-Cretaceous pCO2 based on stomata of the extinct conifer Pseudofrenelopsis (Cheirolepidiaceae). Geology 33: 749-752.
Tarduno, J. A., D. B. Brinkman, P. R. Renne, R. D. Cottrell, H. Scher, and P. Castillo. 1998. Evidence for Extreme Climatic Warmth from Late Cretaceous Arctic Vertebrates. Science 282: 2241-2243.
33. Mann, M. E., Bradley, R. S., and Hughes, M. K. 1998. Global-scale temperature patterns and climate forcing over the past six centuries. Nature 392: 779-787.
34. Mann, M.E., R.S. Bradley, and M.K. Hughes. 1999. Northern Hemisphere Temperatures During the Past Millennium: Inferences, Uncertainties, and Limitations. Geophysical Research Letters 26: 759-762.
35. Kreutz, K. J., P. A. Mayewski, L. D. Meeker, M. S. Twickler, S. I. Whitlow, I. I. Pittalwala. 1997. Bipolar Changes in Atmospheric Circulation During the Little Ice Age. Science 277: 1294-1296.
Stenni, B., Proposito, M., Gragnani, R., Flora, O., Jouzel, J., Falourd, S. and Frezzotti, M. 2002. Eight centuries of volcanic signal and climate change at Talos Dome (East Antarctica). Journal of Geophysical Research 107: 4076.
Khim, B-K., Yoon, H.I., Kang, C.Y. and Bahk, J.J. 2002. Unstable climate oscillations during the Late Holocene in the Eastern Bransfield Basin, Antarctic Peninsula. Quaternary Research 58: 234-245.
Oerlemans, J. 2005. Extracting a Climate Signal from 169 Glacier Records. Science 308: 675-677.
Dahl-Jensen, D., K. Mosegaard, N. Gundestrup, G. D. Clow, S. J. Johnsen, A. W. Hansen, N. Balling. 1998. Past Temperatures Directly from the Greenland Ice Sheet. Science 282: 268-271.
36. Esper, J., E.R. Cook, and F.H. Schweingruber. 2002. Low-Frequency Signals in Long Tree-Ring Chronologies for Reconstructing Past Temperature Variability. Science 295: 2250-2253.
37. von Storch, H. E. Zorita, J. M. Jones, Y. Dimitriev, F. González-Rouco, S. F. B. Tett. 2004. Reconstructing Past Climate from Noisy Data. Science 306: 679-682.
38. Moberg, A., D.M. Sonechkin, K. Holmgren, N.M. Datsenko and W. Karlén. 2005. Highly variable Northern Hemisphere temperatures reconstructed from low- and high-resolution proxy data. Nature 443: 613-617.
Global Warming: Will Human-Induced Climate Change Destroy the World? Evidence for God from Science by Rich Deem www.GodAndScience.org
15 of 15
39. Microwave Sounding Unit (MSU) of NASA. 40. Kiehl, J. T., B. A. Boville, B. P. Briegleb. 1988.
Response of a general circulation model to a prescribed Antarctic ozone hole. Nature 332: 501-504.
Ramaswamy, V., M. D. Schwarzkopf, and W. J. Randel. 1996. Fingerprint of ozone depletion in the spatial and temporal pattern of recent lower-stratospheric cooling. Nature 382: 616-618.
41. Medina-Elizalde, M. and D.W. Lea. 2005. The Mid-Pleistocene Transition in the Tropical Pacific. Science 310: 1009-1012.
42. GISS Surface Temperature Analysis. 2005. Analysis Graphs and Plots.
43. Schiermeier, Q. 2005. Past climate comes into focus but warm forecast stays put. Nature 433: 562-563.
44. White, N. J., J. A. Church, and J. M. Gregory. 2005. Coastal and global averaged sea level rise for 1950 to 2000. Geophys. Res. Lett. 32: L01601.
45. Church, J. A., and N. J. White. 2006. A 20th century acceleration in global sea-level rise. Geophys. Res. Lett. 33, L01602.
46. Siddall et al. 2003. Sea-level fluctuations during the last glacial cycle. Nature 423, 853-858.
47. Velicogna, I., and J. Wahr. 2006. Measurements of Time-Variable Gravity Show Mass Loss in Antarctica. Science DOI: 10.1126/science.1123785.
48. Zwally, H. J., et al. 2005. Mass changes the Greenland and Antarctic ice sheets and shelves and contributions to sea-level rise: 1992–2002. J. Glaciol. 51: 509–527.
49. Webster, P. J., G. J. Holland, J. A. Curry, and H.-R. Chang. 2005. Reports Changes in Tropical Cyclone Number, Duration, and Intensity in a Warming Environment. Science 309: 1844-1846.
Emanuel, K. 2005. Increasing destructiveness of
tropical cyclones over the past 30 years. Nature 436: 686-688.
50. Hadley Centre: Climate Change Predictions, Precipitation Annual Map, August, 2006.
51. Bryden, H. L., H. R. Longworth and S. A. Cunningham. 2005. Slowing of the Atlantic meridional overturning circulation at 25° N. Nature 438: 655-657.
52. Ruddiman, W. F., . J. Vavrus, and J. E. Kutzbach. 2005. A Test of the Overdue-Glaciation Hypothesis,” Quaternary Science Reviews 24: 1-10.
53. Peter J. Cooper. Kuwait’s biggest field starts to run out of oil, Kuwait Times Newspaper.
54. DOE Launches Carbon Dioxide Sequestration Initiative February 13, 2006.
Storing Carbon Underground Possible Option For Mitigating Greenhouse Gases. Lawrence Berkeley National Laboratory.
R. McKie and J. Jowit. December 4, 2005. Britain ‘could bury greenhouse gases’. The Observer.
55. Hegerl, G. C., T. J. Crowley, W. T. Hyde, and D. J. Frame. 2006. Climate sensitivity constrained by temperature reconstructions over the past seven centuries. Nature 440: 1029-1032.
56. Annan J. D., J. C. Hargreaves. 2006. Using multiple observationally-based constraints to estimate climate sensitivity, Geophys. Res. Lett. 33: L06704, doi:10.1029/2005GL025259.