Global Warming Is Not...
11
by Christopher Monckton February 21, 2009 Global Warming is not happening Science & Public Policy Institute “Science-based policy for a better world.” www.scienceandpublicpolicy.org
Transcript of Global Warming Is Not...
by
Christopher Monckton
February 21, 2009
Global Warming is nothappening
Science & Public Policy Institute“Science-based policy for a better world.”
www.scienceandpublicpolicy.org

2
Global Warming is not happeningby Christopher Monckton ~ February 21, 2009
he “global warming apocalypse” scare has the potential greatly to enrichscientists, academics, industrialists, and politicians willing to takeunscrupulous advantage of it. However, we should do some due diligence
before we join in reaping the considerable but short-lived rewards available to thosewho parrot the scientifically-baseless orthodoxy.
We begin with two graphs from the Monthly CO2 Report1 (SPPI, 2009). First, on allmeasures, global temperatures for the past seven years have been falling (though thefall was largely unreported) at a rate equivalent to >2 Celsius degrees/century.
Seven years’ global cooling: The arithmetic mean of the Hadley and NCDC monthly terrestrialglobal-temperature datasets and the RSS and UAH satellite lower-troposphere datasets shows a(largely-unreported) cooling for seven years at a rate equivalent to 2.1 C°/century. The pink regionshows the IPCC’s projected range of warming rates: the pale pink region is 1 standard deviationeither side of the IPCC’s central estimate that global temperature will rise 3.9 C° to 2100.
This seven-year decline in global temperatures is of great significance, for the IPCC’scurrent methodology cannot explain it. Throughout the period, CO2 concentrationhas risen, and the IPCC quantifies the contribution of natural forcings such as thatfrom the sun as being minuscule. Warming should have resulted.
Our second graph shows that the observed increase in atmospheric CO2concentration is well below the IPCC’s predicted range of increases.
1http://scienceandpublicpolicy.org/monthly_report/jan_co2_report.html
T

3
It is important to draw the distinction between the increase in CO2 emission, whichhas been at the high end of the IPCC’s projections, and the corresponding increase inCO2 concentration, which has recently been very near linear, and is running wellbelow the least of the exponential rates of increase projected by the IPCC.
Observed and predicted CO2 concentration, 2000-2100: The pale-blue region, bounded byexponential curves, is the IPCC’s predicted path for CO2 concentration. The observed, deseasonalizeddata from January 2000 to November 2008 (dark blue) is near-coincident with the least-squareslinear-regression trend, (solid, light-blue line). The predictive region emulates the IPCC’s graph forscenario A2 [inset]. Sources: NOAA; [inset] IPCC (2007), p.803, after aspect-ratio adjustment.
On the current, linear observed trend, CO2 concentration in 2100 will be just 575ppmv (IPCC central estimate 836 ppmv), requiring the IPCC’s central projection oftemperature increase to 2100 to be halved from 3.9 to a harmless 1.9 C°.
The IPCC’s prediction of Co2 increase is greatly exaggerated, chiefly because theIPCC cannot add up the global “carbon budget” to within a factor of two. Accordingto its metric, CO2 emissions at their current record levels ought to be adding some4.1 ppmv/year to the atmosphere, yet the actual increase is only 2 ppmv/year. Eversince CO2 concentration has been measured by modern methods, the increase inconcentration has run below half the expected rate.
Nevertheless, the IPCC tries implausibly to claim 90% certainty that more than halfof the warming of the past half-century is anthropogenic. It was the politicalrepresentatives, not the scientists, who reached this conclusion by show of hands –an intriguing instance of the argumentum ad populum, an Aristotelian fallacy thathas no place in serious thought. Science is not a democracy.
There is compelling evidence that much of the warming of the past half-century wascaused by an exceptional increase in solar activity. During the 70 years 1645-1715, theMaunder Minimum, the Sun was less active than in 10,000 years. Then solar activityinexorably increased for almost 300 years until, during the 70 years 1925-1995,

4
peaking in 1960, the Solar Grand Maximum, the Sun was at least as active as at anytime in the previous 11,400 years (Solanki et al., 2005). Hathaway et al. (2004)illustrate this solar increase by reference to the 11-year cycles of sunspot numbers –
300 years’ growth in solar activity: Smoothed sunspot numbers, showing the Sun’s 11-yearcycles, reveal the increase in solar activity between the Maunder Minimum and the recent (thoughlargely unreported) solar Grand Maximum. Source: Hathaway et al. (2004) (indication of GrandMaximum added by the author).
This exceptional increase in solar activity from Maunder Minimum to GrandMaximum has led solar physicists to accord a far greater role to the Sun than theIPCC finds it expedient to allow.
The 2004 Symposium of the International Astronomical Union concluded that theSun had been responsible for the warming of the past 250 years; that solar activitywas now likely to decline; and that global cooling, not warming, was likely.
In the four years since then:
Solar activity has declined sharply;
Magnetic convection currents beneath the surface of both solar hemisphereshave slowed to a rate never before observed;
266 days without sunspots occurred in 2008, the second-least solar activity inmore than a century; and
Global temperatures have duly fallen at a rate equivalent to 6 C°/century.
If that cooling were to persist, there would be an Ice Age by 2100. Scafetta & West(2008) conclude that the Sun caused 69% of the global warming that ceased in 1998.
The central question – on which there is no consensus – is how much warming agiven proportionate increase in CO2 concentration will cause. Arrhenius (1896)estimated 5 C° at CO2 doubling; Hansen (1988) 4.2 C°; IPCC (1995) 3.8 C°; IPCC(2001) 3.5 C°; and IPCC (2007) 3.26 ± 0.69 C°.

5
At its very simplest, climate sensitivity to atmospheric enrichment with CO2 is alogarithmic function of the proportionate increase in CO2 concentration. The IPCC’scurrent evaluation of this crucial climatic parameter is childishly simpliste: though3.26 ± 0.69 C° sounds commendably precise, this value may be attained by thefollowing startlingly naive method:
ΔTS,2x = c ln(C/C0)= (4.7 ± 1) ln 2= 3.26 ± 0.69 C°. {1}
This result is said to be derived from a “multi-model mean”: however, it is – to saythe least – suspicious that one obtains exactly one standard deviation above or belowthe central estimate simply by taking the coefficient c = 4.7 and adding or subtractingexactly unity. Plainly, further scrutiny is needed.
In the methodology of the IPCC, climate sensitivity – temperature response ΔTS to anexternal perturbation such as anthropogenic greenhouse-gas enrichment – is theproduct of:
Direct radiative forcings ΔF;
The zero-feedback climate-sensitivity parameter κ; and
Temperature feedbacks encompassed in the feedback multiplier f, such that:
f = (1 – bκ)–1, {2}
where b is the sum of all positive and negative temperature feedbacks, which are thenmutually amplified via Eq. {2}, the Bode linear feedback-amplification equation.
Thus the climate-sensitivity equation is:
ΔTS = ΔFκf = ΔFκ(1 – bκ)–1. {3}
None of the three key parameters ΔF, κ, f can be definitively evaluated by theoreticaldemonstration, directly measured by instrumentation, or reliably inferred byexperimentation (Monckton, 2008).
Official predictions of climate sensitivity, therefore, being reliant near-exclusively onnumerical modeling, cannot be Popper-falsified. To this extent, the anthropogenic-warming contention is untestable, does not qualify as a hypothesis and, stricto sensu,is not of interest to science.
However, we may enquire into the reasonableness of the IPCC’s values for the threekey parameters ΔF, κ, f, whose product is final climate sensitivity ΔTS.
First, all of the models on which the IPCC relies predict that most of the atmosphericwarming that arises from anthropogenic greenhouse-gas enrichment will occur in thetropical upper troposphere, where the warming rate will be 2-3 times that observedat the surface:

6
Predicted “hot-spot”: Zonal mean equilibrium temperature change (°C) at CO2 doubling (2x CO2
– control), as a function of latitude and pressure (hPa) for 4 general-circulation models. All show theprojected fingerprint of anthropogenic greenhouse-gas warming: the tropical mid-troposphere“hot-spot” is projected to warm at 2-3 times the surface rate. Source: Lee et al. (2007).
However, the tropical mid-troposphere “hot-spot” that is so confidently predicted byall of the models is not observed in reality:

7
No “hot-spot”: Altitude-vs.-latitude plot of observed relative warming rates in the satellite era.The greater rate of warming in the tropical mid-troposphere that is projected by general-circulationmodels is clearly absent in this and all other observational datasets, whether satellite or radiosonde.Source: Hadley Centre for Forecasting (HadAT, 2006).
Dr. Richard Lindzen, Alfred P. Sloan Professor of Meteorology at the MassachusettsInstitute of Technology, the world’s ranking expert on the behaviour of theatmosphere, has concluded from the absence of the “hot-spot” that:
“... A doubling of CO2 leads to surface warming of from about 1.5-3.5 K.By contrast, the observed warming over the past century or so amountsto only about 0.6-0.8 K (not all of which need be due to increasedgreenhouse gases). ... Using basic theory, modeling results andobservations, we can reasonably bound the anthropogeniccontributions to surface warming since 1979 to a third of the observedwarming, leading to a climate sensitivity too small to offer anysignificant measure of alarm ...”.
This result is very much in line with that of Scafetta & West (2008. op. cit.). Itrequires that we divide the IPCC’s imagined climate sensitivity to CO2 by at least 3.
Furthermore, the IPCC also overstates the zero-feedback climate sensitivityparameter (the “Planck parameter”), whose value cannot exceed 0.27 K W–1 m2,taking 0.313 instead. This value is above any in the mainstream literature. It repealsthe fundamental equation of radiative transfer, by taking temperature and radiantenergy from different radiating surfaces.
Also, the IPCC underestimates the cooling effect of evaporation in calculating thewater-vapor feedback (Wentz et al., 2007), and regards the cloud feedback asstrongly positive when it should be net-negative (Spencer, 2007), consequently – andsubstantially – overvaluing the feedback multiplier.
8
Correcting for each of these exaggerations reduces climate sensitivity to <0.6 C° atCO2 doubling (Monckton, 2008; cf. Lindzen, 2008; Spencer et al., 2007; Schwartz,2007).
Low climate sensitivity is to be expected, for CO2 is no more than a trace gas,occupying only 1 part in 10,000 more of the atmosphere than 250 years ago. Its effecton temperature is logarithmic: each additional molecule causes less warming than itspredecessors. Indeed, the IPCC’s formula for evaluating the radiative forcing fromCO2 ceases to apply once concentration reaches 915 ppmv, above which adding CO2has very little effect on temperature. Half a billion years ago, there was 25 times asmuch CO2 in the atmosphere as today. The planet did not fry.
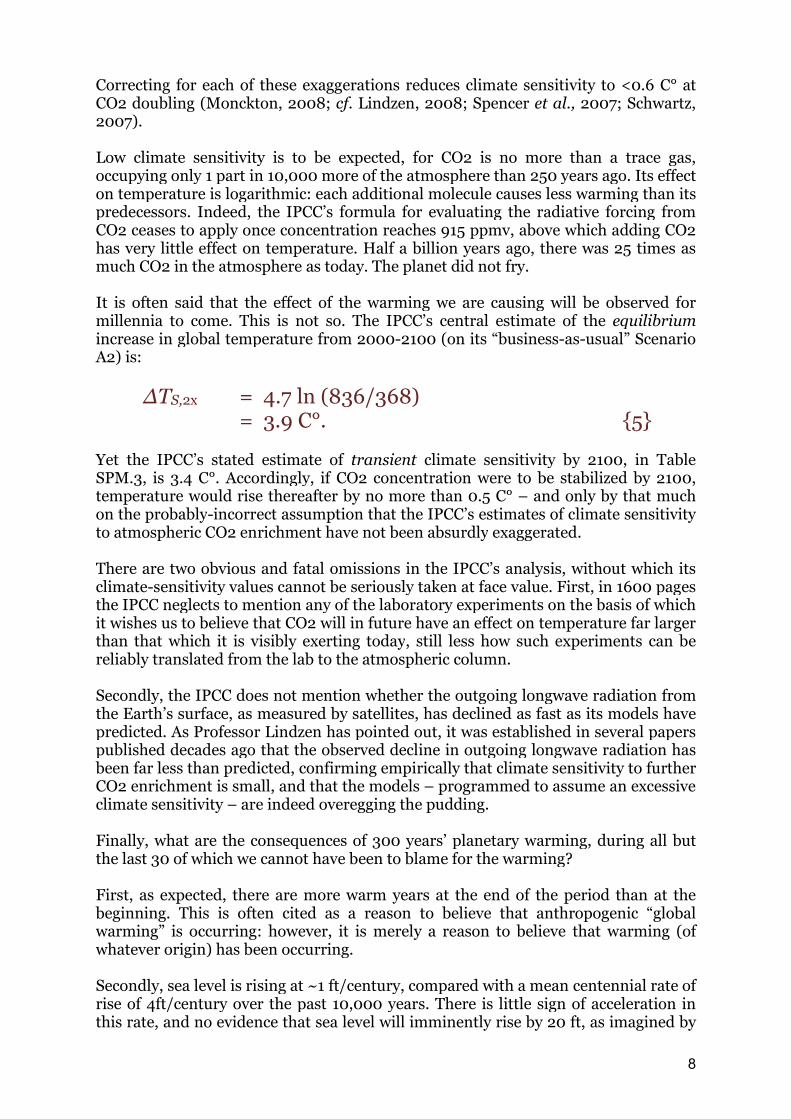
It is often said that the effect of the warming we are causing will be observed formillennia to come. This is not so. The IPCC’s central estimate of the equilibriumincrease in global temperature from 2000-2100 (on its “business-as-usual” ScenarioA2) is:
ΔTS,2x = 4.7 ln (836/368)= 3.9 C°. {5}
Yet the IPCC’s stated estimate of transient climate sensitivity by 2100, in TableSPM.3, is 3.4 C°. Accordingly, if CO2 concentration were to be stabilized by 2100,temperature would rise thereafter by no more than 0.5 C° – and only by that muchon the probably-incorrect assumption that the IPCC’s estimates of climate sensitivityto atmospheric CO2 enrichment have not been absurdly exaggerated.
There are two obvious and fatal omissions in the IPCC’s analysis, without which itsclimate-sensitivity values cannot be seriously taken at face value. First, in 1600 pagesthe IPCC neglects to mention any of the laboratory experiments on the basis of whichit wishes us to believe that CO2 will in future have an effect on temperature far largerthan that which it is visibly exerting today, still less how such experiments can bereliably translated from the lab to the atmospheric column.
Secondly, the IPCC does not mention whether the outgoing longwave radiation fromthe Earth’s surface, as measured by satellites, has declined as fast as its models havepredicted. As Professor Lindzen has pointed out, it was established in several paperspublished decades ago that the observed decline in outgoing longwave radiation hasbeen far less than predicted, confirming empirically that climate sensitivity to furtherCO2 enrichment is small, and that the models – programmed to assume an excessiveclimate sensitivity – are indeed overegging the pudding.
Finally, what are the consequences of 300 years’ planetary warming, during all butthe last 30 of which we cannot have been to blame for the warming?
First, as expected, there are more warm years at the end of the period than at thebeginning. This is often cited as a reason to believe that anthropogenic “globalwarming” is occurring: however, it is merely a reason to believe that warming (ofwhatever origin) has been occurring.
Secondly, sea level is rising at ~1 ft/century, compared with a mean centennial rate ofrise of 4ft/century over the past 10,000 years. There is little sign of acceleration inthis rate, and no evidence that sea level will imminently rise by 20 ft, as imagined by

9
Al Gore. The UK High Court has bluntly commented: “The Armageddon scenariothat he depicts is not based on any scientific view” (Dimmock v. S of S Educ., 2007).A fortiori, a recent statement by a NASA researcher that sea level will rise by almost250 feet is mere rodomontade. The oceans have been cooling since 2003, when 3175automated bathythermographs were deployed to provide the first reliablemeasurements of ocean temperature.
Thirdly, landfalling Atlantic hurricanes show no trend in 100 years, and severetyphoons and tropical storms have been in decline for 30 years. Losses fromhurricane damage, adjusted for inflation, population changes and changes in thebuilt environment in harm’s way, have declined. Extra-tropical storms, expected todecrease in both frequency and intensity as warmer weather reduces temperatureextremes, have indeed decreased.
Sea ice in the Arctic has been melting a little, particularly in the summer, but itswinter extent (purple in the chart below) is much as it was 30 years ago when thesatellites first looked. Note that more recent data are not available because thesensor has degraded:
The changes in Arctic sea ice are well within natural variability over the period. TheArctic was in fact warmer in the late 1930s and early 1940s than it is at present.
Sea ice in the Antarctic reached a record high (but largely-unreported) extent inOctober 2007. Globally, sea-ice extent shows little trend in 30 years:
10
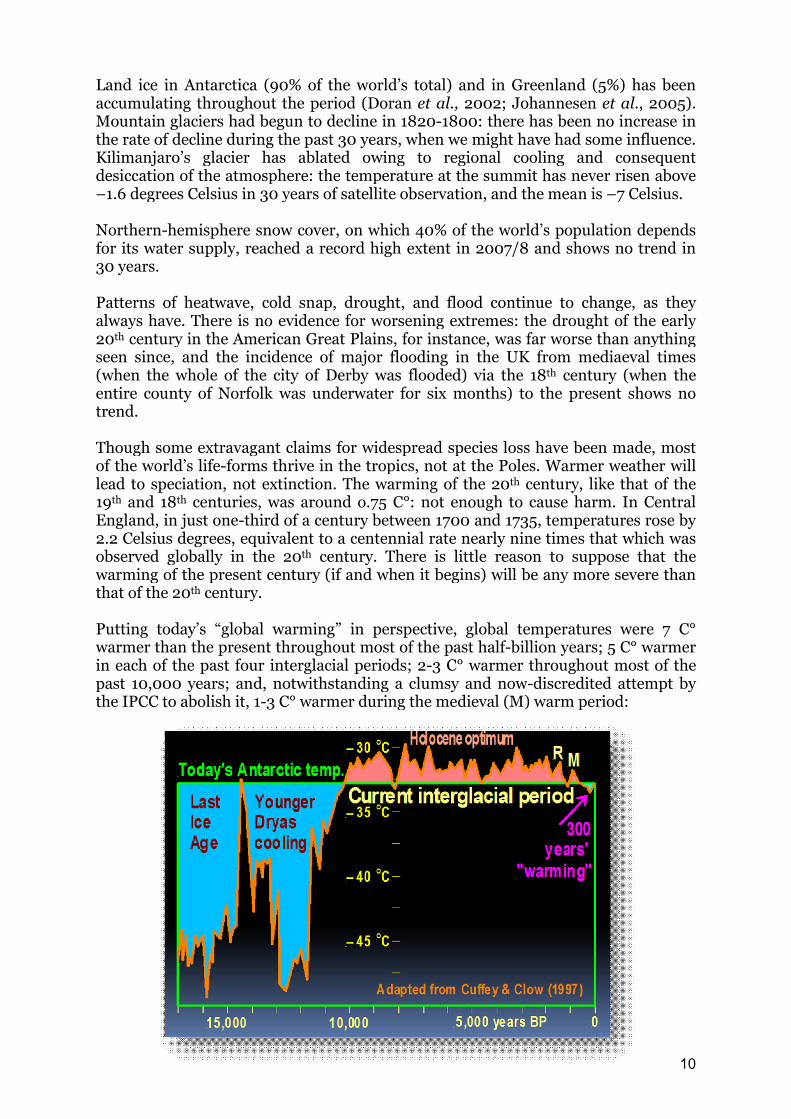
Land ice in Antarctica (90% of the world’s total) and in Greenland (5%) has beenaccumulating throughout the period (Doran et al., 2002; Johannesen et al., 2005).Mountain glaciers had begun to decline in 1820-1800: there has been no increase inthe rate of decline during the past 30 years, when we might have had some influence.Kilimanjaro’s glacier has ablated owing to regional cooling and consequentdesiccation of the atmosphere: the temperature at the summit has never risen above–1.6 degrees Celsius in 30 years of satellite observation, and the mean is –7 Celsius.
Northern-hemisphere snow cover, on which 40% of the world’s population dependsfor its water supply, reached a record high extent in 2007/8 and shows no trend in30 years.
Patterns of heatwave, cold snap, drought, and flood continue to change, as theyalways have. There is no evidence for worsening extremes: the drought of the early20th century in the American Great Plains, for instance, was far worse than anythingseen since, and the incidence of major flooding in the UK from mediaeval times(when the whole of the city of Derby was flooded) via the 18th century (when theentire county of Norfolk was underwater for six months) to the present shows notrend.
Though some extravagant claims for widespread species loss have been made, mostof the world’s life-forms thrive in the tropics, not at the Poles. Warmer weather willlead to speciation, not extinction. The warming of the 20th century, like that of the19th and 18th centuries, was around o.75 C°: not enough to cause harm. In CentralEngland, in just one-third of a century between 1700 and 1735, temperatures rose by2.2 Celsius degrees, equivalent to a centennial rate nearly nine times that which wasobserved globally in the 20th century. There is little reason to suppose that thewarming of the present century (if and when it begins) will be any more severe thanthat of the 20th century.
Putting today’s “global warming” in perspective, global temperatures were 7 C°warmer than the present throughout most of the past half-billion years; 5 C° warmerin each of the past four interglacial periods; 2-3 C° warmer throughout most of thepast 10,000 years; and, notwithstanding a clumsy and now-discredited attempt bythe IPCC to abolish it, 1-3 C° warmer during the medieval (M) warm period:

11
We conclude that catastrophic “global warming” is a fantasy; and that the warmingfrom CO2 enrichment will be small, harmless, and beneficial.
Even if temperature had risen above natural variability, the recent solar GrandMaximum may have been chiefly responsible. Even if the sun were not chiefly toblame for the past half-century’s warming, the IPCC has not demonstrated that CO2has contributed more than a small fraction of the warming.
Even if CO2 were chiefly responsible for the warming that ceased in 1998 and maynot resume until 2015 (Keenlyside et al., 2008), the distinctive, projected fingerprintof anthropogenic “greenhouse-gas” warming is entirely absent from the observedrecord.
Even if the fingerprint were present, computer models are long proven (Lorenz,1963) to be inherently incapable of providing projections of the future state of theclimate that are sound enough for policymaking. Even if per impossibile the modelscould ever become reliable, it is evident that the world will not – indeed, cannot –warm as much as the IPCC imagines as a result of atmospheric greenhouse-gasenrichment.
Even if the world were to warm that much, the overwhelming majority of thescientific, peer-reviewed literature does not predict that catastrophe would ensue(Schulte, 2008). Even if catastrophe might ensue, proposals to mitigate futureclimate change by reducing emissions of carbon dioxide would make very littledifference to the climate.
Even if mitigation were likely to be effective, it would do more harm than good:already millions face starvation as the environmentally-disastrous dash for biofuelstakes agricultural land out of essential food production, a warning that takingprecautions, “just in case”, can do untold harm unless there is a sound, scientificbasis for them.
Finally, even if mitigation might do more good than harm, adaptation when (and if)necessary would be far more cost-effective and far less likely to be harmful.
There is no case for spending a single penny more of taxpayers’ money on “globalwarming” unless and until mean global surface temperatures shall have risen by atleast 1 C° above the year 2000. On current evidence and trends, that will not happenfor at least a century, if then. This is a scare that has been oversold for politicalreasons. It is time for a calmer, more science-based approach.


![Pemanasan Global [Global Warming]](https://static.fdocuments.net/doc/165x107/549d1b95ac7959b52a8b48d4/pemanasan-global-global-warming.jpg)