
Global Views 01-13-12 - Global Banking and · PDF fileChart 1 compares Canadian and US house...
33
Global Views is available on: www.scotiabank.com, Bloomberg at SCOE and Reuters at SM1C Global Views Weekly commentary on economic and financial market developments January 13, 2012 Economics > Corporate Bond Research Emerging Markets Strategy > Foreign Exchange Strategy Economic Statistics > Financial Statistics > Forecasts > Portfolio Strategy > Fixed Income Strategy > Fixed Income Research Contact Us > Key Weeks For China, Canada, Brazil And Pre-EU Summit Meetings....................................................... Derek Holt Canada’s Mortgage Market Is Better Insulated Against Risks To House Prices ............................ Derek Holt & Dov Zigler Ottawa’s Second Spending Review — Competing Demands Surface ................................. Nathan Joshua & Mary Webb India’s Inflation Breaks Into A Downward Trend, Improving Growth Prospects .......................................Oscar Sánchez Global Car Sales Climb To Record Highs In December ...................................................................... Carlos Gomes An Expanding Services Surplus, A Bright Spot For The U.S. Economy .................................................. Gorica Djeric ECB Holds Rates For Now, Outlook Remains Tilted To The Downside ........................... Sarah Howcroft & Frédéric Prêtet Are EM Corporates Cheap Relative To Equity Vol? .......................................................... Joe Kogan & Leonor López UK Inflation Update........................................................................................................................ Alan Clarke Beat The Street — Q4/11 Earnings Season Preview ....................................................................... Hugo Ste-Marie 2-10 Economics Key Data Preview ................................................................................................................................... A1-A2 Key Indicators ......................................................................................................................................... A3-A6 Global Auctions Calendar ............................................................................................................................. A7 Events Calendar ........................................................................................................................................... A8 Global Central Bank Watch .......................................................................................................................... A9 Forecasts.................................................................................................................................................... A10 Latest Economic Statistics.......................................................................................................................... A11 Latest Financial Statistics ........................................................................................................................... A12 A1-A12 Forecasts & Data 2 3-4 5 6 7 8 9-10 11-13 Emerging Markets Strategy 14-15 Fixed Income Strategy 16-17 Portfolio Strategy
-
Upload
vuongxuyen -
Category
Documents
-
view
221 -
download
3
Transcript of Global Views 01-13-12 - Global Banking and · PDF fileChart 1 compares Canadian and US house...

Global Views is available on: www.scotiabank.com, Bloomberg at SCOE and Reuters at SM1C
Global Views
Weekly commentary on economic and financial market developments January 13, 2012
Economics > Corporate Bond Research
Emerging Markets Strategy >
Foreign Exchange Strategy
Economic Statistics > Financial Statistics >
Forecasts >
Portfolio Strategy > Fixed Income Strategy >
Fixed Income Research
Contact Us >
Key Weeks For China, Canada, Brazil And Pre-EU Summit Meetings....................................................... Derek Holt
Canada’s Mortgage Market Is Better Insulated Against Risks To House Prices............................ Derek Holt & Dov Zigler
Ottawa’s Second Spending Review — Competing Demands Surface ................................. Nathan Joshua & Mary Webb
India’s Inflation Breaks Into A Downward Trend, Improving Growth Prospects .......................................Oscar Sánchez
Global Car Sales Climb To Record Highs In December......................................................................Carlos Gomes
An Expanding Services Surplus, A Bright Spot For The U.S. Economy .................................................. Gorica Djeric
ECB Holds Rates For Now, Outlook Remains Tilted To The Downside ........................... Sarah Howcroft & Frédéric Prêtet
Are EM Corporates Cheap Relative To Equity Vol? ..........................................................Joe Kogan & Leonor López
UK Inflation Update........................................................................................................................Alan Clarke
Beat The Street — Q4/11 Earnings Season Preview ....................................................................... Hugo Ste-Marie
2-10 Economics
Key Data Preview................................................................................................................................... A1-A2
Key Indicators......................................................................................................................................... A3-A6
Global Auctions Calendar.............................................................................................................................A7
Events Calendar ...........................................................................................................................................A8
Global Central Bank Watch ..........................................................................................................................A9
Forecasts....................................................................................................................................................A10
Latest Economic Statistics..........................................................................................................................A11
Latest Financial Statistics ...........................................................................................................................A12
A1-A12 Forecasts & Data
2
3-4
5
6
7
8
9-10
11-13 Emerging Markets Strategy
14-15 Fixed Income Strategy
16-17 Portfolio Strategy

2
Global Views
Economics
January 13, 2012
THE WEEK AHEAD
Key Weeks For China, Canada, Brazil And Pre-EU Summit Meetings
Please see our full indicator, central bank, auction and event calendars on pp. A3-A9. Asian markets will have the ability to swing the global tone at least into the Tuesday session as key macro reports land in China. 2011Q4 GDP is expected to soften to the weakest growth pace since 2009Q2. The expected 8.7% y/y growth rate would be a sharp deceleration from the unsustainable nearly 12% peak in early 2010 which owed itself to a soft year-ago base effect and the lagged effects of policy easing that have since turned the other direction. Retail sales are expected to remain firm with growth in the 17% y/y range. Chinese industrial production has also been decelerating and at about 12% y/y, growth is firm but at the weakest pace since mid-2009. Key will also be Tuesday’s release for Chinese property prices in December. So far they have fallen by less than 1% from their peak on a nationwide basis, but far larger corrections in some cities have grabbed headlines. House prices face further downside and a cumulative nationwide drop of 5-10% seems like a reasonable forecast. Asia-Pacific markets will also digest an expected gain in Australian jobs following a prior decline. A 25bps rate cut in the Philippines is expected. Market risks coming out of European markets next week are likely to be focused on the after-math of probable rating downgrades after we went to print, bond auctions and headline risk out of high level meetings between European heads of state in advance of the January 30th EU Summit. Italian Prime Minister Mario Monti meets with UK Prime Minister David Cameron on Tuesday and then delivers a speech on the EU’s growth challenges. This is a warm-up act for a meeting between Monti, German Chancellor Angela Merkel, and French President Nicolas Sarkozy in Rome. Against this backdrop, bill auctions will occur in France, Spain, Greece, Belgium, the UK and Portugal. Bond auctions occur in Germany, Spain, and the UK. Data risk will be focused upon the UK via an expected gain in retail sales, cooler inflation, and flat job markets. Eurozone CPI is expected to moderate to below 3% y/y in support of further ECB easing. Germany’s ZEW survey of investor confidence and Italian CPI round out the hits. This could be a key week for Canada watchers and curve pricing. First, the Bank of Canada issues a rate statement on Tuesday to be followed by the quarterly Monetary Policy Report on Wednesday. We expect a policy hold, but the risk of upward revisions to its growth and inflation forecasts that could further erode market expectations for a rate cut. The BoC has been surprised to the upside on Q3 growth that it had pegged at 2% versus the 3.5% actual print, and we think it will again be surprised but only moderately higher in Q4 with our 1.7% call (BoC’s 0.8%). At the same time, inflation has been tracking the BoC’s y/y forecasts reasonably well, and Friday’s CPI figures will likely bring forth discounting influences, but at risk is whether the BoC still believes headline inflation will drop from just beneath 3% now to 1% by this Spring in light of the fact that WTI oil is tracking well above the BoC’s futures-based earlier oil forecast. The BoC’s forecast that core inflation will ride beneath 2% from now through to the end of 2013 may also be at risk of a modest upward revision. We thought at the time — and still do — that the BoC was being too aggressive in its inflation views — but the tone of global risks will likely have the BoC erring on the side of maintaining a hold into 2013 while it offers a moderately more positive tone that reflects somewhat better-than-expected US data. Manufacturing shipments and wholesale trade will help us firm up our November GDP call. US data flow will be moderate. Key will be the Philly Fed business outlook survey diffusion index on Thursday following downward revisions released just this past week, and Tuesday’s Empire State survey of manufacturing conditions. Existing home sales likely gained toward the highest print in over two years following the rise in pending home sales, but a waning trend in mortgage purchase applications may cap the rise in resales. It is partly concern over a lack of sustainability in the housing uptrend that we think will motivate the Fed toward a further half trillion in MBS and Treasury purchases toward mid- to late-2012. CPI inflation on Thursday should remain well behaved in advance of a 10 year TIPS auction, and housing starts could continue to track building permits higher to perhaps above the 700k range for the first time since October 2008. Industrial production rounds out the data flow. Key may be the Fed’s Daniel Tarullo as he testifies to the Financial Services Committee on the proposed Volcker Rule and its impact on the economy on Wednesday. Latam markets will be focused on a universally expected 50bps cut in the Bank of Brazil’s Selic target to 10.5%. It would bring the cumulative rate cut to about 200bps since September as growth wanes.
Derek Holt (416) 863-7707 [email protected]

3
Global Views
Economics
January 13, 2012
CANADA MACRO COMMENT
Stronger micro-foundations of Canada’s mortgage market versus the US mean that historically big price swings have led to only modest changes in arrears ratios.
What role do swings in house prices play in driving defaults on Canadian mortgages?1 This simple question is at the crux of the debate over what risks Canada's frothy housing market could pose to the financial system and the broader economy. We will present evidence that large house price swings have tended to have only modest influences on mortgage arrears in Canada including through violent swings in regional house prices, and for reasons owing to the different micro-foundations of Canada’s mortgage market that limit system-wide leverage and that keep people paying their mortgages with an eye on the smoothed longer run value of their home. In that sense, the tendency of US commentators to export their after-the-fact understanding of the US mortgage system to Canada’s is more than a tad simplistic. In fact, the evidence drawn from burst property market bubbles in the past points to a subdued response in the 90+ days in arrears measure of mortgage credit quality. Chart 1 compares Canadian and US house prices using repeat-sales measures, and includes Toronto and Vancouver as examples of markets that have gone through large price corrections in the past. Chart 2 compares the Canadian 90+day mortgage arrears ratios that are available at the provincial level. By contrast, recall that the US 90+day arrears ratio peaked at about 9%. The immediate point is that whereas the connection between massive US house price swings and mortgage arrears is apparent, it is far more muted in Canada. Recall that this sample period includes Toronto’s long lived 27% slide in house prices between1989 and 1996, Toronto’s 10% drop between 2008-09, Vancouver’s 14% drop between 1990-91, and Vancouver’s drawn out 20% hit between 1995 to 1999. Yet Ontario’s mortgage arrears ratio peaked at just over half a percentage point in the mid-1990s and B.C.’s has never been over about 0.6%.
Granted that household leverage has since risen sharply which some will suggest makes a comparison to these past experiences misleading. Fair enough, any shock today may well push delinquency rates higher than previously and make for serious consequences. We counter that there were very harsh interest rate and unemployment shocks in the past whereas mortgage rates and unemployment rates are currently low. We credit the following vastly different micro foundations to Canada's mortgage market in contrast to the US for why house price collapses have not driven higher delinquencies and devastating knock-on effects. Leverage may be comparable on household balance sheets today in Canada compared to the US, but
leverage elsewhere in the system is a night and day comparison. Dealers are generally held within bank
Canada’s Mortgage Market Is Better Insulated Against Risks To House Prices
Dov Zigler (416) 862-3080 [email protected]
Derek Holt (416) 863-7707 [email protected]
1. Our comparison of Canadian and US household finances may be a useful backgrounder. See “Why the Fixation on Canadian Household Debt-to-Income?”, pp.7-9, Global Views, December 16th 2011.
100
200
300
400
88 90 92 94 96 98 00 02 04 06 08 10
100
200
300
400
500
600
Toronto*, LHS
Canada*, LHS
U.S., LHS
Vancouver*, RHS
* Smoothed. Source: MLS, Case Shiller, Scotia Economics.
Canada & U.S. Home PricesHome Sweet Home?
index,March 1988 = 100
0.0
0.2
0.4
0.6
0.8
1.0
1.2
99 01 03 05 07 09
0
2
4
6
8
10
Source: CBA, New York Federal Reserve, Scotia Economics.
Canada & U.S. Mortgages 90+ Days Overdue
% %
U.S., RHS
Canada, LHS
Chart 1 Chart 2

4
Global Views
Economics
January 13, 2012
CANADA MACRO COMMENT
… continued from previous page
hold-co structures and did not pursue aggressive gearing ratios, while mortgage securities were not generally placed in off-balance sheet conduits like CDO structures as in the U.S. Thus, when housing markets turn, a reversal of leverage does not magnify the consequences like it does in the US.
The majority of mortgages are held on balance sheet in Canada, with only 28% having been securitized. Much more of Canada’s mortgage book is funded by on-book retail deposits than is the case in the U.S. That may also make the b2anks more conservative since more of their mortgages remain on balance sheet.
The majority of the securitized totals have been done through the CMHC — a Crown corporation with explicit backing by among the better fiscal positions of developed economies — thus avoiding the problems in the U.S. caused by the ambiguity of GSE liabilities. Other insured securitizations have been done through private insurers that also receive explicit government backing for the underlying assets through the Canada Mortgage Bond program.
Canadian financial institutions are not as reliant upon short-term lines extended by other financial institutions. The degree of reliance upon such funding in the U.S. is what contributed toward excessive exposure to short-term swings in market sentiments and funding gaps, not to mention adverse incentive effects as the same firms that pulled lines on some monolines also shorted their stocks.
Non-recourse loans are nowhere near as prevalent in Canada as they are in parts of the United States with the exception of modest portions of the mortgage markets in Alberta and Saskatchewan.
Canada’s subprime market is relatively modest — and is really more of a near-prime market — whereas the U.S. subprime share peaked at nearly one in five mortgages.
Abrupt adjustable rate mortgage (ARMs) resets occur much more suddenly in the U.S. and posed a bigger shock effect. By contrast, the closest Canadian product parallel is the variable rate mortgage, but it is constantly repriced. Also, in Canada, some variable rate products adjust principal not payments.
Canada’s mortgage equity withdrawal market isn't like the U.S. We've seen secured home equity lines of credit (Helocs) grow in Canada as a way of withdrawing equity, but not like the U.S. withdrawals picture. U.S. homeowners’ equity has been in free-fall with mortgage and Helocs debt growth outpacing housing assets since the early 1990s. Canada, by contrast, retains much higher homeowner equity.
Mortgage interest is deductible against taxes in the U.S. It generally is not in Canada. That creates different incentives to leverage oneself in the two markets.
The nature of the innovative mortgage products has been more conservative in Canada versus the U.S., and the Federal Government has pre-emptively tightened mortgage rules in two waves after previously liberalizing the rules.
At the peak, investor mortgages were among the first products to default in the U.S. where they accounted for about one in ten dollars of outstanding mortgages, similar to the UK and Australia. Canada’s market, however, is much smaller and likely well under half the U.S. share.
Unlike many U.S. banks, Canadian banks continue to apply generally prudent underwriting standards. In other words, they actually check incomes, verify job status, ask for sales contracts, etc., such that all those questions your banker asks in Canada have a purpose — a process that somehow got lost on many American bankers.
Appraisals are outsourced and the standards are generally higher in Canada. Appraisers are more likely to low-ball estimates of property value before banks make the final decision on how much to lend.
More of the mortgage broker sales force is internalized in Canada, in contrast to US sales out-sourcing.
Dov Zigler (416) 862-3080 [email protected]
Derek Holt (416) 863-7707 [email protected]

5
Global Views
Economics
January 13, 2012
FISCAL
Ahead of the federal Budget, mid-term restraint options receive debate. At the pre-budget hearings of the House of Commons Standing Committee on Finance, forecasts of real GDP growth for 2012 ranging from just 1.5% to 2.5% spurred some witnesses to urge Ottawa to scale back its second spending review (top chart) and adopt some new stimulus. Yet also persuasive are the advantages of Ottawa regaining some fiscal flexibility, in part to protect the considerable tax reform and reduction accomplished in recent years for individuals and business (bottom table). Acknowledging the challenges of rebalancing its books while maintaining scheduled major transfers to individuals and other Canadian governments and avoiding tax increases, the federal government has broached the possibility of a somewhat larger expenditure reduction than the current 5% target set for fiscal 2014-15 (FY15). Yet, the government also has offered the reassurance of a flexible and measured response if Canada’s economy should suddenly weaken. Data for the first half of FY12 indicate Ottawa’s emerging restraint. For this period, the Office of the Parliamentary Budget Officer (PBO) reports a 3% drop in total federal expenditures from a year earlier, reflecting in part the government’s Operating Budget Freeze adopted almost two years ago and the first spending review from 2007 to 2010. Although major transfers to Seniors, children and other levels of government rose as scheduled during the first half of FY12, operating expenses fell over 4% from a year ago, capital spending slid 15% given lower National Defence outlays and other federal transfers (excluding the major statutory transfers referenced above) declined 13% as Ottawa’s two-year stimulus package is wound down. For increased government spending efficiency, there is general consensus, but the differences between the recommendations of the Standing Committee and the Opposition parties’ appended comments mirror the range of public opinion on specifics such as adjusting the Scientific Research & Experimental Development Investment Tax Credit to obtain greater value per taxpayer dollar. Several pre-budget proposals highlight the need for policy adjustments at the margin, changes that should now be matched with new saving. Revisiting and simplifying Canada’s income tax are once again urged — Ottawa’s recent update of a wide array of large and small tax expenditures offers additional opportunities for restraint. During recent discussions, Ottawa has floated several possibilities, such as reviewing the cost of politicians’ pensions, thereby setting a path for other Canadian governments to explore the tough trade-offs required as the baby boom generation retires.
Ottawa’s Second Spending Review — Competing Demands Surface
Mary Webb (416) 866-4202 [email protected]
Nathan Joshua (416) 866-5338 [email protected]
0
1
2
3
4
5
6
7
8
9
FY09 10 11 12r 13b 14b 15b
2nd Strategic Review during FY12
Closing Tax Loopholes
Defence
1st Strategic Review: 2007-10
Ottawa’s Deficit Reduction Plan
projected saving, $ billions
Source: Finance Canada.
Calendar 2012$ billions
Personal Income TaxAdjust marginal tax rates by one percentage point
Lowest rate (15%) 6.0Second rate (22%) 1.9Third rate (26%) 0.5High rate (29%) 1.0
Change tax brackets thresholds by $5,000Second bracket threshold 2.9Third bracket threshold 0.4Top bracket threshold 0.1
Change basic personal & spousal amounts by $100Basic Personal Amount 0.3Spousal/Equivalent Amount 0**
Alter capital gains inclusion 5 percentage pts 0.3Child Tax Benefit (CCTB)
Change each benefit by $100 0.5Change phase-out threshold by $1,000 0.1
GST Credit for family of fourChange adult benefit by $50 0.5Change dependant benefit by $50 0.1Change phase-out threshold by $1,000 0.1
National Child Benefit (NCB) SupplementChange each benefit by $100 0.2Change phase-out threshold by $1,000 0.1
Corporate Income Tax Change general rate by 1 percentage point 1.5 Change small business rate by 1 percentage point 0.6
Goods and Services Tax (GST)Change rate by 1 percentage point 6.7________
Estimated Revenue Impact of Selected Federal Tax Changes*
* The estimates are static and do not include behavioural responses to the tax changes. ** Estimated at $30 million. Source: Office of the Parliamentary Budget Officer, December 2011.

6
Global Views
Economics
January 13, 2012
ASIA
Significant falls in food cost gains and peaking fuel price advances likely drove wholesale price increases below 8% y/y in December.
Annual inflation in India is bound to finally break the two-year spell that has kept it within an 8-10% y/y range. Our expectation that growth in the wholesale price index (WPI) will reach 7.7% y/y in December (Consensus 7.4%) implies that the Reserve Bank of India (RBI) is about to switch to a less hawkish monetary policy stance. Inflation has remained the RBI’s main concern for two years, as the benchmark WPI index has stuck stubbornly above 8% y/y since December 2009. Food cost increases were the main inflationary driver during 2010, only to be taken over by fuel price gains as the leading impulse of economy-wide costs. Average weekly observations of yearly price gains — which stick closely to the monthly advance in wholesale prices — already point to falling food costs and peaking fuel prices. These records lead us to believe that December inflation (to be announced the coming week) will come at about 7.7% y/y (chart). Importantly, the fall in India’s inflation will be mainly driven by a significant contraction in food costs on the back of gains in agricultural production. Conditions for the latter were mainly determined by last year’s closer to average monsoon season. This contrasts with the situation two years ago when rain scarcity drove up food costs resulting in an upsurge in WPI inflation. Average yearly food inflation for the final four weeks of 2011 was less than 2% y/y, significantly lower than the 8.5% November reading. An additional element favouring the disinflationary process that emerged during December was no acceleration in fuel cost gains, notwithstanding the depreciation of the Indian rupee (INR). India imports most of the oil it consumes, making exchange rate fluctuations a key variable in the local fuel cost equation. The INR averaged 52.5 per US dollar during December, which compared with a 50.7 level for November implies a 3.5% depreciation. Average yearly fuel cost gains, however, point to a 14.8% y/y advance in December, lower than the 15.5% November increase. Part of what explains the rise in fuel inflation is the withdrawal of gasoline subsidies during 2011 for fiscal reasons. A relaxation of this during the final months of 2011 is not out of the question. Looking at the broader picture, the implications for economic performance are favourable on several fronts. First and foremost, the downtrend in inflation will likely lead to a shift in monetary policy at the RBI as it is accompanied by weak readings on main economic activity variables. Although industrial production for November advanced at healthier 5.9% y/y rate, this came on the back of an upwardly revised -4.7% October reading. Thus, industrial activity in India seems likely to have advanced at a below trend rate during the final quarter of last year. This in part has been caused by the contraction in profit margins that rising raw material have implied for firms. As the rise in costs starts to be backstopped, the outlook for output and investment will turn the corner. The economic outlook for India still hinges heavily on the performance of the primary sector. Better agricultural yields not only lead to improved incomes for a significant share of the population, but lowering food costs also raise their spending power driving a rise in discretionary consumption outlays. In summary, the turn of the inflationary page in India speaks much more favourably about the country’s overall economic outlook.
Oscar Sánchez (416) 862-3174 [email protected]
India’s Inflation Breaks Into A Downward Trend, Improving Growth Prospects
-15
-10
-5
0
5
10
15
20
25
08 09 10 11
India's Inflation
Source: Reserve Bank of India & Scotia Economics.
y/y % changeFood
Fuel
Manufacturing
WPI
Forecast
Forecast

7
Global Views
Economics
January 13, 2012
AUTOS
Record volumes in the BRIC nations and a broad-based rebound in Asia lead the way. Global car sales ended 2011 on a strong note, as a rebound in Asia and ongoing gains in North America and Eastern Europe more than offset ongoing declines in Western Europe and Latin America. We estimate that sales advanced 3% above a year earlier — the 30th consecutive month of year-over-year gains — and 1% above the previous peak in March, when the tsunami in Japan began to dampen purchases. The latest improvement provides a clear indication that global vehicle demand remains quite firm — especially outside of Western Europe — despite ongoing concerns that retrenchment in the euro zone will spread to other regions, and slow sales activity across the globe. Russia continued to post the strongest gains, with purchases surging 23% above a year earlier in December. However, the most positive data came out of Asia, with car sales rebounding alongside increased product availability following two months of sluggish sales due to shortages caused by flooding in Thailand. The gains in Asia were broad based, led by a surge in Thailand and record volumes in India. In fact, sales in Asia climbed last month to the highest level since January — prior to the tsunami in Japan. In addition, higher sales in both India and China combined with ongoing strong gains in Russia lifted volumes in the BRIC nations to a record annual rate of 19 million units in December, surpassing the previous peak set in late 2010. The rebound in India is especially encouraging as it comes on the heels of sluggish sales in recent months, partly due to rising interest rates, but also reflecting product shortages arising from labour problems at Maruti Suzuki — the domestic market leader with a 45% share. While sales at Maruti remained below a year earlier in December, purchases from other automakers soared 22% above a year ago. In particular, sales of GM models were buoyed by a 90% y/y increase in purchases of the 3-cylinder Beat. The Chevrolet Beat has carved out a niche in India, and is the least expensive diesel hatchback in the country. Other global automakers also made large inroads in India last month. Volumes at Volkswagen jumped 31% y/y, largely on the strength of its Skoda brand, while Toyota benefitted from the introduction of several new models. Sales in China climbed 5% y/y in December — a significant improvement from a marginal year-over-year decline in November. We estimate that China ended 2011 with an annualized sales rate above 11 million units, up from a low of 8.5 million in the spring and early summer, when purchases were held back by shortages of Japanese models. As in India, foreign automakers led the way in China last month, lifting the share of German and U.S. brands by nearly 3 percentage points in 2011. In December, both General Motors and Ford reported double-digit sales increases in China, while the gains for European luxury automakers exceeded 30% y/y. Foreign models continue to benefit from a reputation of better quality and brand value than local competitors. As a result, local automakers were most impacted by the moderation in sales gains over the past year in China. For example, despite the improvement in overall volumes last month, purchases from Geely Automobile slumped by 15.8% y/y. Car and light truck purchases in North America jumped 9% y/y last month, lifting December sales to a four-year high. We expect a further 6% increase in 2012, as households and businesses in the United States replace their aging vehicles. Vehicle scrappage rates in the United States have dropped to only 4% of the U.S. fleet in recent years, nearly 2 percentage points below the average of the past two decades. As a result, the average age of vehicles in the United States is approaching a record 11 years, with many vehicles needing to be scrapped. Replacement demand is more limited in Canada, dampening the 2012 sales gain to roughly 1%.
Carlos Gomes (416) 866-4735 [email protected]
Global Car Sales Climb To Record Highs In December
5
7
9
11
13
15
17
19
21
07 08 09 10 11 12
Brazil, Russia, India & China
Auto Sales
United States
millions of units, 3MMA
Source: Scotia Economics.
Western Europe

8
Global Views
Economics
January 13, 2012
UNITED STATES
Services trade is becoming increasingly more relevant, and is better at buffeting economic shocks.
The service sector accounts for more than two-thirds of the global economy, with the United States at the helm, both in size of its domestic market and as a global exporter. Private-sector services represent 69% of the U.S. economy, 84% of private-sector employment, and, according to OECD statistics, has been a key driver of aggregate labour productivity growth since mid-1990s. Zooming in on exports — which, alongside business investment, are the key recovery engines — services appear to have been better at weathering the storm than their merchandise counterparts. While services exports account for only roughly a third (US$562 billion) of overall U.S. exports, they have been expanding at an accelerating clip (chart 1), with the trade balance — widening consistently since 1967, reaching a record US$153 billion in 2010 — offsetting a quarter of the trade deficit in goods. Top export markets include Canada, the United Kingdom and Japan, with sales to China quickly climbing ranks, surpassing Switzerland for the seventh spot in 2010, and rapidly closing in on Mexico. Demand for services is relatively less elastic than for goods, partly due to the inability to store these products. For suppliers, especially those who operate electronically, the overhead cost — and, hence, the need for external, including trade, financing — is smaller, reducing their exposure to the credit and capital markets. Drilling deeper, traditional services, such as tourism and goods-related transportation, and sectors currently undergoing deleveraging, like financial services and construction, are more susceptible to economic downturns (chart 2). The widening gap in the second chart is a byproduct of increasing variety and relevance of ‘new economy’ services (e.g., computer & information, legal, media), whose uptake has been boosted by globalization and advances in network technology. The aggregate share of services exports excluding the more-sensitive categories now accounts for over a half of all U.S. foreign services sales, up from 35% just two decades ago. Studies also show that some of these exports are less sensitive to income and currency fluctuations, which explains their ability to continue to expand throughout the economic cycle. However, there are a couple of things worth noting. The most important in the near term relates to the European debt crisis, as Europe at 41.2% is the largest export market for U.S. services. China & Pacific and Latin America combined represent a slightly larger 43.3% share (chart 3), providing a reasonable offset. In a longer-term sense, more effort needs to be placed on developing policies to promote services trade, and capturing reliable, detailed and internationally-comparable statistics, since these are intangible and heterogeneous products that can be traded across borders or indirectly, through affiliates and consumption abroad.
Gorica Djeric (416) 866-4214 [email protected]
An Expanding Services Surplus, A Bright Spot For The U.S. Economy
50
200
350
500
650
800
950
1,100
80 83 86 89 92 95 98 01 04 07 10
Goods Exports
Services Exports
U.S. Services Exports Expanding At An Accelerating Pace
Source: BEA, Scotia Economics.
Index (1980=100), nominal, sa
100
250
400
550
700
850
1,000
86 89 92 95 98 01 04 07 10
Traditional and CyclicalServices Exports*
Other Services Exports
Some Services Exports Are More Resilient To Downturns
* Travel, transport, finance, construction. Source: BEA, Scotia Economics.
Index (1986=100), nominal, sa
North America Europe
Asia & Pacific Latin America*
Africa M iddle EastOther
Weakness In Europe Balanced By Emerging Markets
* The E.U. region accounts for 34.1%.Source: BEA, Scotia Economics.
% share of all U.S. services exports, nominal, sa

9
Global Views
Economics
January 13, 2012
EUROPE
Reflecting a mood of cautious optimism, President Mario Draghi points to recent positive developments in survey data and on the fiscal consolidation front.
On further non-conventional measures to be taken, the European Central Bank appears
to be in ‘wait-and-see’ mode. Further monetary policy easing in store The Governing Council’s decision to keep rates unchanged was unanimous, which is no big surprise as the December rate cut was only a majority decision. So, some rebalancing inside the board was to be expected. Such an indication again raises the question of whether the 1.00% level could be the bottom in the interest rate cycle. It is true that looking into the details of the ECB statement, there were some elements of optimism. Indeed, Mr. Draghi pointed to signs of stabilisation in recent business survey indicators, likely referring to the PMIs from the final two months of 2011, which showed improvement in both the manufacturing and services sectors virtually across the euro zone. There was also the sentiment that the general global outlook was more relaxed, thanks probably to better US data, as the comment that the global economy “may be weaker than expected” was dropped from this month’s statement. However, Mr. Draghi was also quick to mention that the stabilisation in business surveys took place at a low level and had yet to translate into “hard” data. In addition to the less gloomy survey data, Mr. Draghi noted the important steps recently taken by some national governments on fiscal consolidation and structural reform, saying that progress in the last few months had been "extraordinary". Financial markets also appear to have noticed these efforts, with some risk metrics easing in recent weeks. Following on announcements late last year by prime ministers Mario Monti and Mariano Rajoy of bold new austerity measures, yields on Italian and Spanish 10-year government bonds moderated tentatively, from 7.5% and 6.6% in late November to 6.7% and 5.1% as of writing, respectively, and both governments have lately witnessed relatively successful bond auctions. Nevertheless, Mr. Draghi emphasised that the ECB still sees substantial downside risks to the real economy related to financial market tensions and possible “slippages” in governments’ reform plans. In the meantime, the fact that medium term inflation risks are seen as balanced allowed Mr. Draghi to indicate that monetary policy is and will remain accommodative, and that the central bank stands ready to act should the outlook worsen in the current environment of high uncertainty. With our view that hard data will increasingly reflect the sharp fall in confidence seen in the second half of 2011, resulting in a mild recession through the turn of the year, we continue to believe that further rate cuts are forthcoming. We anticipate that the refinancing rate will be reduced to 0.50%, where it will remain until at least the second half of 2013. Outlook for credit markets starting to improve The ECB president also attempted to ease rising worries of a credit crunch in the euro area following the latest ECB deposit facility and credit growth data. Indeed, the deposit facility held bank funds amounting to €470 billion as of January 10, which is €200 billion more than the level seen just before the first 3-year European longer-term refinancing operation (LTRO). This suggests that European banks parked all the cash offered by the ECB back at the central bank (while gross LTRO proceeds were €489 billion, net proceeds were only €210 billion). Such a situation could exacerbate the risk of a credit crunch at a time when the last available credit growth data showed further weakness. As of November, credit to households eased further to 1.8% y/y from 2.1% the previous month and a peak of 4.8% in Q1, while corporate loans, which up to October showed stronger resilience, also eased in November from an already very low 1.5% y/y pace.
Frédéric Prêtet (00 33) 17037-7705 [email protected]
Sarah Howcroft (416) 863-2859 [email protected]
ECB Holds Rates For Now, Outlook Remains Tilted To The Downside

10
Global Views
Economics
January 13, 2012
EUROPE
… continued from previous page
The ECB president nonetheless pointed to the fact that the liquidity provision operation proved its efficiency and dismissed concerns that the money is not circulating in the economy by mentioning that the banks borrowing money at the LTRO were not the same as those making deposits. Moreover, Mr. Draghi asserted that he anticipates substantial demand for the second 3-year LTRO approaching in February. The ECB statement also reiterated that the figures on lending do not suggest that financial market tensions have significantly affected the supply of credit. All in all, the decision today suggests that the central bank is maintaining a wait and see attitude with respect to its non-conventional monetary policy, with the ECB president underscoring the fact that all measures will work with a lag. It is true that the Ted spread (Euribor 3 month — German 3 month bills), which is usually seen as a leading indicator to measure the risk of credit tightening in the euro area, appears to have peaked at the beginning of the year. However, the next ECB quarterly survey at the end of this month could prove key to reassessing this credit risk issue.
Frédéric Prêtet (00 33) 17037-7705 [email protected]
Sarah Howcroft (416) 863-2859 [email protected]

Emerging Markets Strategy Global Views
11 January 13, 2012
Connecting equity volatility and default Uncertainty about the long-term global outlook was the overarching theme in the second half of 2011, leading to dramatic increases in spreads in many of the higher-yielding emerging market corporates. In previous articles, we have argued that the fundamentals of many EM corporates are resilient to global shocks; for example, half of Mexican global bond issuers actually increased their profitability in 2009.1 Nevertheless, the next downturn could be different, more protracted perhaps. Thus, we need other indicators to try to measure how the increase in uncertainty should affect corporate default risk, recognizing of course that every firm is affected differently. One such indicator comes from the dynamics of emerging market equities and an academic idea from Robert Merton about the pricing of corporate debt2 that was later adopted by the KMV corporation in its credit modelling.3 The basic premise here is that the value of the firm, defined as the sum of the market value of debt and market value of equity, evolves stochastically. If this firm value falls below the face value of the company’s debt, then the company will default. Therefore, the larger is the volatility of the value of the firm relative to its market value, the closer is a default. One has only to notice the close correlation between realized equity volatility and 10Y debt spreads (Figure 1) to see that this academic idea actually explains quite a lot in the market pricing of corporate debt. Similarly, when we look over time at the averages of equity volatility and spreads, we find that these move together as well (Figure 2). In fact, judging by the historical relationship, spreads today should be lower considering where volatility is, as indicated by the fact that the datapoint for 2H11 is below the trendline.4 Technical caveats Implementing a model that would price debt based on equity volatility is quite difficult. Here we mention a number of the assumptions that are necessary; since we have not fully explored other assumptions and specifications, the results we offer in this article are merely preliminary. First, while the model calls for a forward looking measure of the volatility of the firm, the only indicator we can use is the realized volatility of stock prices. Most Mexican stocks do not have liquid options markets with the exceptions of America Movil, Cemex, and Televisa. Second, and related to the topic of volatility, we need to specify a process by which the value of the firm evolves. The options market exhibits significant skew which differs between firms, and we have no way to estimate the skew for firms without a liquid options market. We assume that market value follows a Brownian motion, whereas an alternative assumption would have been that firm value follows a geometric Brownian motion. Finally, the model requires data on the market value of firm debt. While we can compute the market value of some securitized debt based on secondary market prices, we can only estimate the value of other types of debt such as bank debt. We also assume a $40 recovery rate for Mexican bonds, which is the historical average according to Moody’s. A more interesting assumption with special relevance to Mexico concerns the model’s core premise that a default occurs when no value in the firm remains for equity holders. That assumption may be appropriate for the US, but not so in Mexico, where debt holders receive less protection against equity holders as the recent ruling in Vitro demonstrates.
Are EM Corporates Cheap Relative To Equity Vol?
Leonor López (5255) 5229-2202 [email protected]
Joe Kogan (212) 225-6541 [email protected]
Emerging market corporate spreads are highly correlated with equity volatility, both across firms and over time. Based on historical data, the increase in spreads over the last six months has been higher than what would be suggested by the rise in equity volatility. We explain the assumptions necessary to build a statistical model to estimate the appropriate level of spreads based on a firm’s equity volatility. The much-simplified version of this model that we are able to implement suggests that corporate bond spreads are pricing more risk than warranted by recent levels of equity volatility.

Emerging Markets Strategy Global Views
12 January 13, 2012
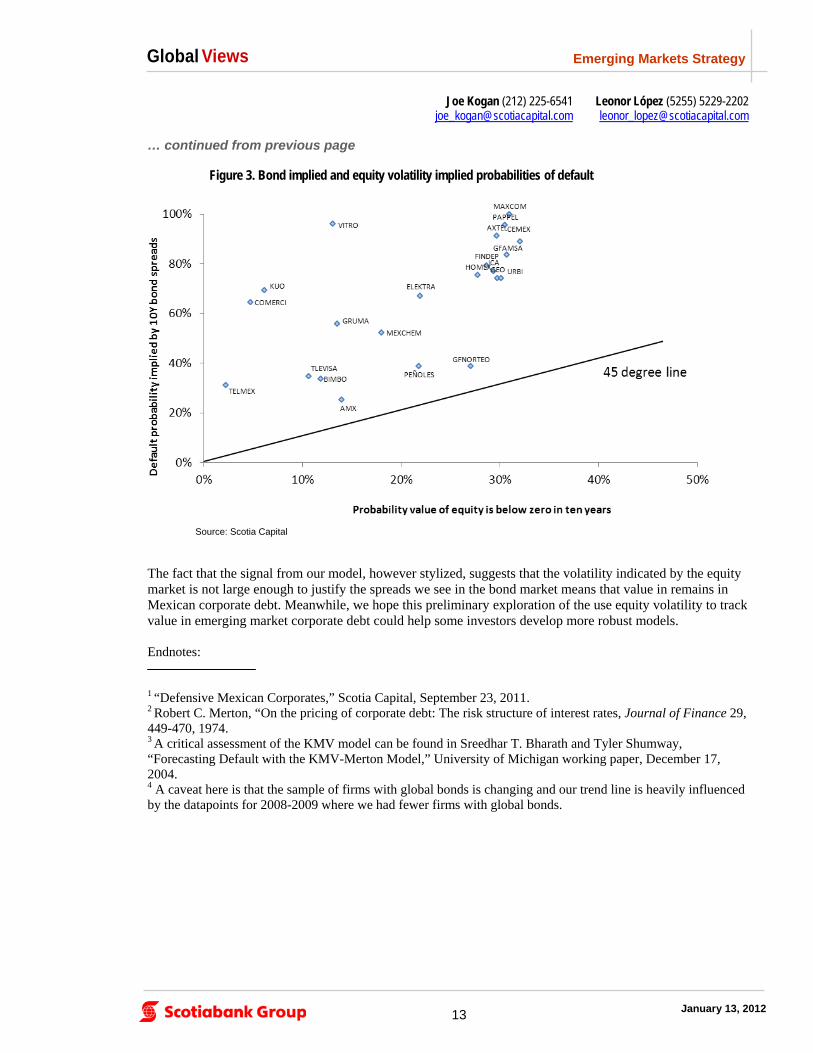
Preliminary model results In Figure 3, we present the results of our model, which compares the cumulative default probability priced in bonds against the probability of default implied by equity volatility for the set of Mexican firms that have both equity and globally traded bonds. The graph demonstrates that EM bonds are pricing much more default risk than would be warranted if firm value continued to evolve according to the volatility we have seen in the last six months in the equity market. The gap is particularly large in the higher yielding credits, many of whose bonds are pricing default probabilities in the 90% range, but the model also finds value in some of the higher grade names. Let us consider first the more risky credits. For ease of computation, we have assumed, in calculating the value of the firm, that the market value of debt equals the face value. That is a good approximation for most firms with the exception of a few distressed credits that deserve special attention. For those credits, we painstakingly computed the market value of firm debt using Bloomberg prices for global bonds and local stock exchange prices for peso bonds; for other non-securitized debt, we estimated a market value based on bond prices. The results of the exercise are interesting both in themselves, as well as critical for correctly interpreting the model. With the exception of Vitro, we found no companies where the market value of debt and equity is less than the face value of the debt. There were a few companies where those two figures were close, however. For Maxcom, the value of the firm only exceeds the face value of debt by about 2%; for Bio Pappel, it is 13%, and for Cemex, it is 15%. While these numbers indicate that the firms are close to default, a strict interpretation of our model would conclude that upside remains and the default probability should be around 50% rather than the 90% implied by bond spreads. On the higher grade names, we believe the results are less sensitive to the particular assumptions we make, especially those about the stochastic process that drives the value of the firm and the parameters of those processes. Since estimating the probability of default for higher-rated names is extremely difficult, we find the signals here valuable.
… continued from previous page
Figure 1. Correlation between spreads and equity vol
Figure 2. Realized vol vs. spread for different periods
Source: Scotia Capital, Bloomberg.
Source: Scotia Capital. Averages by semester across firms shown.
Leonor López (5255) 5229-2202 [email protected]
Joe Kogan (212) 225-6541 [email protected]
Emerging Markets Strategy Global Views
13 January 13, 2012
The fact that the signal from our model, however stylized, suggests that the volatility indicated by the equity market is not large enough to justify the spreads we see in the bond market means that value in remains in Mexican corporate debt. Meanwhile, we hope this preliminary exploration of the use equity volatility to track value in emerging market corporate debt could help some investors develop more robust models. Endnotes: 1 “Defensive Mexican Corporates,” Scotia Capital, September 23, 2011. 2 Robert C. Merton, “On the pricing of corporate debt: The risk structure of interest rates, Journal of Finance 29, 449-470, 1974. 3 A critical assessment of the KMV model can be found in Sreedhar T. Bharath and Tyler Shumway, “Forecasting Default with the KMV-Merton Model,” University of Michigan working paper, December 17, 2004. 4 A caveat here is that the sample of firms with global bonds is changing and our trend line is heavily influenced by the datapoints for 2008-2009 where we had fewer firms with global bonds.
… continued from previous page
Figure 3. Bond implied and equity volatility implied probabilities of default
Source: Scotia Capital
Leonor López (5255) 5229-2202 [email protected]
Joe Kogan (212) 225-6541 [email protected]

Fixed Income Strategy
14
Global Views
January 13, 2012
Next week’s UK economic data calendar is particularly busy with the release of CPI, the labour report and retail sales. We expect a sharp slowdown in both CPI and RPI inflation in December, reflecting a combination of base effects and aggressive discounting. This week’s utility bill cuts are likely to have a moderate downward impact on the outlook for UK CPI and RPI inflation over the next 3-4 months.
We expect CPI inflation to slow by 0.6 percentage points to 4.2% y/y in December, with RPI inflation down by a slightly smaller margin to 4.7% y/y.
The biggest influences this month are likely to be:
base effects related to Household energy bills;
petrol price base effects;
frozen air passenger duty; and
aggressive Christmas discounting.
Housing energy The biggest drag on overall inflation is likely to come from the housing energy component. In turn this reflects the near 10% hike in utility bills this time a year ago. This is likely to subtract 0.2 percentage points from headline CPI and RPI inflation. Airfares Transport price inflation is likely to subtract a similar margin from overall inflation on the back of two key influences. Although airfares typically rise sharply in December, the last two years have been even more elevated than usual (up by over 40% m/m) owing to significant increases in air passenger duty (APD). APD was frozen this year, which points to a sharp drop in this component of inflation. Petrol prices Petrol price base effects are likely to compound the drag from the transport component. Although petrol prices are likely to have fallen only slightly in December (down by around ½% m/m) this is set against a near 3% m/m gain this time a year ago. In isolation, this will subtract around 0.15 percentage points from headline inflation. Aggressive Christmas Discounting As ever, clothing is likely to be the joker in the pack. There have been widespread reports of significant discounting intended to support demand over the crucial Christmas trading period. If that has been the case, it is most likely to be evident in the furniture and clothing components. The BRC shop price index scheduled for release tonight should provide some vital clues. Overall December should mark the third consecutive month in which UK inflation has slowed. We expect the downward trend to continue until September, with the trough in CPI broadly in line with the 2% y/y BoE target. Thereafter, we expect inflation to stabilise a small margin above 2% reflecting pre-programmed price hikes — not least the upcoming university tuition fee hikes (Chart 1).
Alan Clarke (44 207) 826-5986 [email protected]
UK Inflation Update
Chart 1: UK CPI vs RPI Inflation

Fixed Income Strategy
15
Global Views
January 13, 2012
… continued from previous page
With regards to RPI inflation we expect the trough to be 3.2% y/y — also in September. Energy Price Cuts This week saw three of the six major utility providers announce reductions in utility bills which generated a disproportionate amount of publicity. Having raise electricity and gas bills both by around 10% in late-2011, EDF announced a surprise 5% reduction in gas prices effective from next month. Although wholesale gas prices have fallen a little, this announcement was something of a surprise. The extent of the fall in wholesale gas is much smaller than what we have observed ahead of past end-customer price cutting cycles. The reduction has also come much sooner than we are used to. Price hikes and cuts can normally be seen coming a mile off. This seems to be largely a publicity stunt / defensive tactics ahead of bumper profits announcements later this quarter. In particular a pattern seems to be emerging: Each firm is cutting the price of one or the other — not both gas and electricity. So whereas prices went
up by 10-15% for both, they are now going down by an average of 2.5% for both.
Each firm is opting to cut the price of the service which that company has a lower market share. I.e. for a company with a relatively higher share of the gas market, they have tended to opt to reduce electricity prices in order to minimise the squeeze on profit margins.
Firms are cutting prices by close to 5%. This is probably the least that they think that they can get away with.
The point is, that this is likely to be a very different to a normal price cutting trend. Firms are cutting prices as a PR exercise, rather than because there has been a slump in input costs. In the context of the CPI and RPI, we estimate that if all firms cut their prices for either electricity or gas by 5%, it will reduce % y/y inflation by 0.1% points — small beer. Furthermore, the price cuts are likely to trickle in over the next 3-4 months so it is hardly going to be a sharp step lower in any particular month. Clearly if this is the first of several cuts, then the impact could be bigger. However, we would stop short of calling this a price war — more like a handbag fight.
Alan Clarke (44 207) 826-5986 [email protected]

Portfolio Strategy Global Views
16 January 13, 2012
Highlights of our "Beat the Street" report We expect a relatively in-line U.S. earnings season. Headwinds from Europe, China, and a rising U.S.
dollar should limit the pace of earnings expansion in Q4. However, U.S. earnings have positively surprise in the past few quarters and they could prove once again very resilient. Q4 expectations have been set lower, the percentage of companies guiding down for Q4 stands below Q3, and companies having reported so far beat consensus earnings by 3% on average. With the U.S. economy showing better momentum relative to Europe/Asia, companies with a domestic focus offer less earnings risk, in our view.
Macro headwinds. The sovereign debt crisis and the deleveraging process in the euro-zone have continued to negatively impact the pace of economic activity in Q4. European macro data has continued to deteriorate with both manufacturing and services PMI falling further below the 50 threshold in Q4, industrial production and capacity utilization contracting, the leading economic indicator declining, and unemployment rising. On the positive side, we believe large U.S. multinationals exposure to Europe is mostly in core Europe (U.K., France, and Germany) where the economic performance is far from being as bad as in peripheral euro-zone countries. Moreover, European sales are not accounting for a huge chunk of S&P 500 revenues, about 10% in 2010 according to S&P. The economic momentum is also slowing down in Asia, where the region is feeling the ripple effects from the economic landing in China.
FX headwinds. Looking at the Dollar index (DXY), the greenback appreciated 4% against a basket of major currencies in Q4. A rebound in the dollar is having two negative impacts: (1) it makes U.S. dollar denominated goods more expansive, and less attractive, for foreigners and (2) it hits revenues earned abroad when converted back in to dollars. A firmer dollar could represent an additional challenge for companies with a high mix of foreign sales. With the dollar seen as the go-to currency in period of economic turmoil, the greenback could stay relatively firm in the coming months.
Domestic focus could save the day. In the United States, economic activity has gained traction since last summer. The manufacturing ISM is still above 50 and rising, industrial production and capacity utilization improved relative to Q3, and the pace of employment has accelerated, pushing the unemployment rate a few tenths lower. Auto and retail sales have also gained momentum in the last few months with the LEI still pointing toward a relatively sustained pace of activity. Overall, companies with a domestic focus offer less earnings risk in Q4, in our view.
Q4 Expectations set lower. The bar has been set lower for Q4, which could help sustain a relatively healthy earnings beat ratio. In fact, S&P 500 Q4 EPS forecasts have been revised 6% lower since September. Negative revisions have hit all S&P 500 sectors with Materials (-28%) and Telecom (-21%) feeling the most pain. More defensive sectors, such as Health Care and Staples, have suffered less from negative revisions. Small caps Q4 EPS has been revised 9% lower since September, but recent revisions have been more modest than large caps. This could be reflective of a higher percentage of domestic content in small cap's business mix.
Corporate guidance: % of negative guidance below Q3. According to Bloomberg data, 125 S&P 500 companies have provided guidance for Q4. Of which, 39% provided lower/negative earnings guidance. This percentage is a tad lower than in Q3, and it is only slightly higher than Q2 and Q1. Given the economic turmoil of the past few months, this is relatively good news and it bodes well for the rest of the earnings season.
Preliminary Q4 EPS exceeding forecasts by 3% on average. From the 25 S&P 500 companies having already reported: 14 beat on the bottom-line, implying a beat ratio of 56%. The beat ratio is relatively modest compared to prior quarters, but the average surprise is coming at +3% on average, which is suggesting that Q4 EPS could beat despite a more modest beat ratio.
Beat The Street — Q4/11 Earnings Season Preview
Hugo Ste-Marie (514) 287-4992 [email protected]

Portfolio Strategy Global Views
17 January 13, 2012
S&P 500 Fourth-quarter EPS is expected to come in at
US$24.31, 4% below Q3’s record EPS of US$25.29. Earnings growth is decelerating to 11% YOY in Q4 from 17% in Q3, the slowest pace of expansion in over two years. S&P 500 top line growth is also moderating to 7% YOY in Q4 from just over 10% in Q3. Three S&P 500 sectors are expected to enjoy sequential earnings improvement with Technology (+21% QOQ), Health Care (+4%), and Discretionary (+2%) leading the way.
S&P/TSX Fourth-quarter EPS is expected to hit $221 in
Q4, implying an EPS run rate of $885. Q4 EPS is expected to rebound following a weak Q3 performance, with earnings improving 8% sequentially and 4% YOY. Earnings for the big three (Financials, Energy, and Materials) are expected to expand sequentially, while only three TSX sectors should deliver sequential EPS contraction in Q4 — Telecom (-24%), Industrials (-12%), and Staples (-9%).
TSX Q4 revenues are expected to increase 4% on a year-over-year basis, lifted mainly by resource sectors.
Beat or miss. Last quarter, we were expecting all four major TSX sectors (Energy, Golds, Mining and Financials) to miss consensus forecasts. We were right on three of those (Mining, Golds, and Financials), while Energy beat expectations by about 7%.
We repeat our call for Q4, expecting Energy, Golds, Mining and Financials EPS to come in lower than consensus forecasts. Expectations have come down in the last few weeks, but they are still elevated based on our models, which is leaving some room for disappointment.
… continued from previous page
Hugo Ste-Marie (514) 287-4992 [email protected]
Exhibit 2: S&P/TSX EPS — Q4/11 Bottom-Up Consensus
$ QOQ YOYS&P/TSX 221 8% 4%
Energy 44 4% 33%
Materials 60 4% 20%
Industrials 22 -12% 5%
Discretionary 19 0% 11%
Staples 29 -9% -3%
Health Care 12 29% 59%
Financials 32 21% -15%
Technology 5 45% -19%
Telecom 16 -24% 9%
Utilities 26 136% -19%
TSX 60 14 12% 0%
TSX Completion 12 -7% 22%
Source: Scotia Capital, S&P
Q4/11 E
$ QOQ YOYS&P 500 24 -4% 11%
Energy 12 -14% 34%
Materials 3 -24% -13%
Industrials 5 -1% 3%
Discretionary 5 2% 4%
Staples 5 -1% 4%
Health Care 8 4% 12%
Financials 4 -14% 13%
Technology 9 21% 12%
Telecom 1 -27% -12%
Utilities 2 -43% 8%
S&P 600 6 6% 27%
Source: Scotia Capital, S&P
Q4/11 E
Exhibit 1: S&P 500 EPS — Q4/11 Bottom-Up Consensus

18
Global Views
Economics
January 13, 2012
KEY DATA PREVIEW
Key Data Preview
CANADA The Bank of Canada will be announcing its policy rate on Tuesday. Our call is for the BoC to remain in neutral, maintaining a policy rate of 1.00% with the first rate hike not due until Q2 2013. We expect the BoC to raise growth and particularly inflation forecasts moving forward. Aside from the BoC announcement, major data on the Canada docket include manufacturing sales and CPI. CPI, due out on Friday, is a fairly contentious topic at the moment. The BoC included an aggressive call by global central bank standards in its October Monetary Policy Report, forecasting core CPI to moderate to 1.9% y/y growth in Q1 2012 with headline CPI falling below core and expanding at a rate of 1.8% y/y. One assumption implicit in this prediction is that WTI will fall (the BoC has WTI at CAD 87 per barrel throughout 2012); another is that Canadian GDP growth will moderate, diminishing the risk of capacity pressure (the BoC base case for Q1 2012 y/y real GDP growth is 1.1%). With WTI having exceeded the BoC’s predictions during Q4 — the BoC called for an average price of CAD 87 while actual WTI was CAD 97 — a significant variable in the BoC’s model has changed. Our call is for core CPI to come in at 2.7% y/y, surprising to the upside viz. the BoC’s Q4 CPI call. We’re with consensus at –0.1 m/m headline CPI and a bit above consensus on core CPI (0.0% vs. –0.3% consensus), with our expectation for monthly CPI gains tempered by the extent of seasonal discounting. Either way, the y/y number should show that the BoC’s “October surprise” inflation call was overly bearish; as this reality dawns on the market there’s a possibility that the pricing of an eventual rate cut that still lingers in the Canadian forward rates market could further erode. November manufacturing sales data is due out on Thursday. International trade data released this past week was much stronger than expected and gives reason to anticipate manufacturing sales improvements both in terms of prices and volumes. Scotia’s Carlos Gomes notes that truck shipments were unusually high in November, so we anticipate that autos will contribute to manufacturing sales growth. Increases in WTI ought to boost the petroleum and coal products category. With the two largest components of manufacturing sales likely to post substantial gains, we think that the manufacturing sales number is likely to surprise to the upside. Wholesale trade (due on Friday) and retail sales (due out the next week) will round out the Canadian GDP picture. International securities transactions on Tuesday will be of interest to CAD watchers. UNITED STATES It will be a fairly interesting week for U.S. data. December industrial production data on Wednesday will further clarify the US GDP picture. The Fed’s industrial production diffusion index fell in November, leaving it moderately positive for the quarter (it had expanded by 0.66% in October). A reasonably improved reading on the ISM PMI in December and a strong November read on the ISM new orders measure both imply that this report will be directionally positive. The consensus amongst forecasters is for a gain of 0.5% on the index, and Scotia is a bit ahead of the consensus, forecasting a gain of 0.6%. The December Philly Fed Index read, due out on the 19th, is another measure of U.S. manufacturing momentum, and as it’s largely a sentiment-based indicator, we’re expecting that it will follow on the PMI data and trend upwards as well. While we’re optimistic about these two high-frequency reads, our house forecast is calling for moderate-at-best U.S. GDP growth in 2012 (Scotia’s forecast is 1.8% y/y growth in 2012) for a good reason: the risks to global growth are many. As the major dislocations are not in the U.S. this time around, however, it stands to reason that the negative ramifications of the European slow-down will take time to cross the Atlantic and arrive in America. These two upbeat-looking high-frequency data releases may well prove to be a good example of that phenomenon. December CPI is due out on the 19th and Scotia is with the consensus, calling for m/m growth of 0.1% in both headline and core CPI and 2.7% y/y growth. 1-year US inflation breakevens are pricing inflation at 1.59%, having moved up from pricing inflation of 1.2% at the start of the year (and a near deflationary situation in November — Nov. 30 1-year breakevens forecast inflation of less than 0.5%). In the medium term, we’re with the futures market, and this week’s weak US retail sales data demonstrated that the U.S. economy is, to say the least, not suffering from capacity pressure and overheating. Still, we expect November’s high energy prices to have caught up with CPI in December and the base effects of 2010’s lower energy prices to play into the y/y data. Aggressive retail discounting will mitigate some but not all of this effect.
A1
Dov Zigler (416) 862-3080 [email protected]
Derek Holt (416) 863-7707 [email protected]

19
Global Views
Economics
January 13, 2012
KEY DATA PREVIEW
… continued from previous page
EUROPE Next week’s UK economic data calendar is particularly busy with the release of CPI, the labour report and retail sales. We expect a sharp slowdown in both CPI and RPI inflation in December, reflecting a combination of base effects and aggressive discounting. This week’s utility bill cuts are likely to have a moderate downward impact on the outlook for inflation over the next 3-4 months. We expect CPI inflation to slow by 0.6 percentage points to 4.2% y/y in December, with RPI inflation down by a slightly smaller margin to 4.7% y/y. For a more in-depth analysis see article UK Inflation Preview. Inflation aside, the retail sales data should attract considerable attention — undeservedly. This is a random number generator at the best of times — in particular around the crucial Christmas trading period. While recent reports from retailers have been downbeat, the BRC retail sales monitor survey, in contrast, showed an improvement. Furthermore, when we look at past Christmas periods, a strong December has often been followed by a weak January (and vice versa). Bottom line — be it headlines of ‘blood on the high street’ or ‘booming Christmas sales’ — it doesn’t make a huge difference to overall GDP. Available monthly data point to a small contraction in output in the fourth quarter, and retail sales are unlikely to change this. With regards to the labour report, we expect more of the same. Whether GDP is negative or not in the fourth quarter, growth is well below trend, which should be expected to provoke further increases in unemployment. Having said that, recent months have seen relatively muted increases in claimant count unemployment, so it will be worthwhile watching whether this persists for a third consecutive month. LATIN AMERICA After growing 7.7% y/y in the third quarter of 2011, data available for the last quarter indicate that the Colombian economy remains on a positive trend as a result of sustained strong local demand. In October, industrial production expanded by 5.0% y/y, slightly below the previous month’s figure, but in line with the year-to-date average growth rate. The auto sector has been the major contributor to this performance with vehicles and other transportation growing by 23.0% y/y and 29.1% in the last 12 months, respectively. Additionally, with employment still expanding and interest rates low, consumer spending remains high. So far, there have been no clear signs that indicate any negative impacts on the Colombian consumption pattern caused by the crisis in Europe; however, confidence has been decreasing in recent months suggesting that a drag on local demand could materialize in the months ahead. ASIA Upcoming readings for China’s industrial output, retail sales and fixed asset investment for December will draw the picture behind this week’s trade figures, where an unexpected fall in imports growth was highlighted. Our reading of the fall in yearly import value gains has been that commodity price fluctuations played a role, on the back of base effects. That is, during the final months of 2011, commodity prices (measured by the CRB index) fell by around 7% from the previous quarter. Interestingly, the opposite situation occurred in 2010, when the CRB index increased by 13% on a quarterly basis. Thus, import volumes must not be falling much, which should be supported by data on consumption and investment, hence, the relevance of next week’s figures. We expect retail sales and fixed investment to expand at a 17% y/y and 24% pace, respectively. Investment, which represents over 45% of GDP would thus follow the pattern depicted in the adjacent table.
A2
Oscar Sánchez (416) 862-3174 [email protected]
Alan Clarke (44 207) 826-5986 [email protected]
Daniela Blancas (416) 862-3908 [email protected]
-20
-15
-10
-5
0
5
10
15
20
07 08 09 10 11
Colombian Industrial Production
Source: Bloomberg.
y/y % change
Total Construction Equip. Other
2007 Mar-May 629 383 135 111Jun-Aug 820 512 176 132Sep-Dec 888 532 199 1572007-Average 779 476 170 133
2008 Mar-May 711 437 152 122Jun-Aug 923 566 212 145Sep-Dec 1044 626 245 1732008-Average 893 543 203 147
2009 Mar-May 1059 661 223 175Jun-Aug 1388 863 303 222Sep-Dec 1397 848 318 2312009-Average 1281 791 282 209
2010 Mar-May 1189 728 243 217Jun-Aug 1575 977 331 267Sep-Dec 1592 971 358 2622010-Average 1452 892 311 249
2011 Mar-May 1443 921 295 228Jun-Aug 1745 1133 358 254Sep-Nov 1767 1124 385 2592011-Average 1652 1059 346 247
*Average monthly flows. Cumulative flows available from February on.Deflated by PPI using 1999 as base year.Source: National Bureau of Statistics, China.
REAL FIXED ASSET INVESTMENT IN CHINA*

Economics
1
Global Views
January 13, 2012
KEY INDICATORS
North America
Key Indicators for the week of January 16 - 20
Forecasts at time of publication. Source: Bloomberg, Scotia Economics.
A3
Country Date Time Event Period BNS Consensus LatestUS 01/17 08:30 Revisions: Empire State Manufacturing Activity IndexCA 01/17 08:30 Int'l Securities Transactions (CAD billions) NOV -- -- 2.0US 01/17 08:30 Empire Manufacturing JAN 10.0 10.5 9.5CA 01/17 09:00 Bank of Canada Rate 17-Jan 1.00 1.00 1.00MX 01/17 10:00 International Reserves Weekly (USD millions) 13-Jan -- -- 144136
US 01/18 07:00 MBA Mortgage Applications (WoW) 13-Jan -- -- 4.5US 01/18 08:30 Producer Price Index (MoM) DEC 0.1 0.1 0.3US 01/18 08:30 PPI Ex Food & Energy (MoM) DEC -- 0.1 0.1US 01/18 08:30 PPI Ex Food & Energy (YoY) DEC -- 2.8 2.9US 01/18 08:30 Producer Price Index (YoY) DEC -- 5.1 5.7US 01/18 09:00 Total Net TIC Flows (USD billions) NOV -- -- -48.8US 01/18 09:00 Net Long-term TIC Flows (USD billions) NOV -- -- 4.8US 01/18 09:15 Industrial Production (MoM) DEC 0.6 0.5 -0.2US 01/18 09:15 Capacity Utilization (%) DEC 78.0 78.1 77.8US 01/18 10:00 NAHB Housing Market Index JAN -- 22.0 21.0
CA 01/19 08:30 Manufacturing Sales (MoM) NOV 1.5 1.2 -0.8US 01/19 08:30 Consumer Price Index (MoM) DEC 0.1 0.1 0.0US 01/19 08:30 CPI Ex Food & Energy (MoM) DEC 0.1 0.1 0.2US 01/19 08:30 Consumer Price Index (YoY) DEC 3.0 3.1 3.4US 01/19 08:30 CPI Ex Food & Energy (YoY) DEC 2.0 2.2 2.2US 01/19 08:30 Housing Starts (000s) DEC 710 685 685US 01/19 08:30 Building Permits (MoM) DEC -- -0.7 5.6US 01/19 08:30 Housing Starts (MoM) DEC -- 0.0 9.3US 01/19 08:30 Initial Jobless Claims (000s) 14-Jan 376.0 382.5 399.0US 01/19 08:30 Continuing Claims (000s) 7-Jan 3590.0 3590.0 3628.0MX 01/19 09:00 Unemployment Rate (%) DEC 4.4 4.8 5.0US 01/19 10:00 Philadelphia Fed Index JAN 11.5 11.0 6.8
CA 01/20 07:00 Consumer Price Index DEC -- -- 120.9CA 01/20 07:00 Consumer Price Index (YoY) DEC 2.7 2.7 2.9CA 01/20 07:00 Bank Canada CPI Core (MoM) DEC 0.0 -0.2 0.1CA 01/20 07:00 Bank Canada CPI Core (YoY) DEC 2.0 2.2 2.1CA 01/20 07:00 Consumer Price Index (MoM) DEC -0.1 -0.2 0.1CA 01/20 08:30 Wholesale Sales (MoM) NOV -- 0.3 0.9US 01/20 10:00 Existing Home Sales (MoM) DEC -- 5.2 4.0US 01/20 10:00 Existing Home Sales (millions) DEC 5.0 4.7 4.4MX 01/20 10:00 Overnight Rate 4.50 4.50 4.50

Economics
2
Global Views
January 13, 2012
KEY INDICATORS
Europe
Key Indicators for the week of January 16 - 20
Forecasts at time of publication. Source: Bloomberg, Scotia Economics.
A4
Country Date Time Event Period BNS Consensus LatestIR JAN 13-20 CPI (EU Harmonised) (YoY) DEC -- -- 1.7IR JAN 13-20 CPI (YoY) DEC -- -- 2.9UK 01/15 19:01 Rightmove House Prices (YoY) JAN -- -- 1.5
NO 01/16 04:00 Trade Balance (NOK billions) DEC -- -- 35.5IT 01/16 04:00 CPI (NIC incl. tobacco) (MoM) DEC F 0.4 0.4 0.4IT 01/16 04:00 CPI (NIC incl. tobacco) (YoY) DEC F 3.3 3.3 3.3IT 01/16 04:00 CPI - EU Harmonized (MoM) DEC F 0.3 0.3 0.3IT 01/16 04:00 CPI - EU Harmonized (YoY) DEC F 3.7 3.7 3.7IT 01/16 05:00 General Government Debt (EUR billions) NOV -- -- 1909192GE JAN 16-17 Wholesale price Index (YoY) DEC -- -- 4.9SP JAN 16-20 House Price Index (YoY) 4Q -- -- -5.5UK JAN 16-20 Nationwide Consumer Confidence DEC -- 38.0 40.0
SW 01/17 02:00 PES Unemployment Rate DEC -- 4.6 4.4EC 01/17 02:00 EU 25 New Car Registrations DEC -- -- -3.5UK 01/17 04:30 DCLG UK House Prices (YoY) NOV -- -- -0.4UK 01/17 04:30 CPI (MoM) DEC 0.4 0.4 0.2UK 01/17 04:30 CPI (YoY) DEC 4.2 4.2 4.8UK 01/17 04:30 Core CPI (YoY) DEC 2.8 3.0 3.2UK 01/17 04:30 Retail Price Index DEC 239.1 239.1 238.5UK 01/17 04:30 RPI (MoM) DEC 0.3 0.3 0.2UK 01/17 04:30 RPI (YoY) DEC 4.7 4.7 5.2UK 01/17 04:30 RPI Ex Mort Int.Payments (YoY) DEC 4.8 4.9 5.3EC 01/17 05:00 Euro-Zone CPI - Core (YoY) DEC 1.6 1.6 1.6EC 01/17 05:00 Euro-Zone CPI (MoM) DEC 0.4 0.4 0.1EC 01/17 05:00 Euro-Zone CPI (YoY) DEC 2.8 2.8 3.0GE 01/17 05:00 Zew Survey (Current Situation) JAN 25.8 24.0 26.8EC 01/17 05:00 ZEW Survey (Econ. Sentiment) JAN -- -- -54.1GE 01/17 05:00 ZEW Survey (Econ. Sentiment) JAN -50.0 -49.2 -53.8
IT 01/18 04:00 Trade Balance (Total) (EUR millions) NOV -- -- -1076.7UK 01/18 04:30 Claimant Count Rate (%) DEC 5.0 5.0 5.0UK 01/18 04:30 Jobless Claims Change (000s) DEC 10.0 7.0 3.0UK 01/18 04:30 Average Weekly Earnings (3M/YoY) NOV 1.9 2.0 2.0UK 01/18 04:30 Weekly Earnings exBonus (3M/YoY) NOV 2.0 1.9 1.8UK 01/18 04:30 ILO Unemployment Rate (3mths) NOV 8.3 8.3 8.3EC 01/18 05:00 Construction Output WDA (YoY) NOV -- -- -2.8IT 01/18 05:00 Current Account (EUR millions) NOV -- -- -2489.0
EC 01/19 04:00 Euro-Zone Current Account nsa (EUR billions) NOV -- -- 1.7EC 01/19 04:00 ECB Euro-Zone Current Account sa (EUR billions) NOV -- -- -7.5PO 01/19 06:00 Producer Prices (YoY) DEC -- -- 5.2IR JAN 19-25 PPI (YoY) DEC -- -- 1.9
GE 01/20 02:00 Producer Prices (YoY) DEC -- 4.6 5.2IT 01/20 04:00 Industrial Orders n.s.a. (YoY) NOV -- -- -4.8IT 01/20 04:00 Industrial Sales n.s.a. (YoY) NOV -- -- 1.1UK 01/20 04:30 Retail Sales Ex Auto Fuel (MoM) DEC 0.2 0.7 -0.7UK 01/20 04:30 Retail Sales Ex Auto Fuel (YoY) DEC 1.2 1.7 0.5UK 01/20 04:30 Retail Sales w/Auto Fuel (MoM) DEC 0.2 0.6 -0.4UK 01/20 04:30 Retail Sales w/Auto Fuel (YoY) DEC 2.0 2.4 0.7SP 01/20 Trade Balance (EUR millions) NOV -- -- -3631.6IR JAN 20-25 Trade Balance: First Estimate (EUR millions) NOV -- -- 3715.3

Economics
3
Global Views
January 13, 2012
KEY INDICATORS
Asia Pacific
Key Indicators for the week of January 16 - 20
Forecasts at time of publication. Source: Bloomberg, Scotia Economics.
A5
Country Date Time Event Period BNS Consensus LatestNZ 01/15 16:45 Food Prices (MoM) DEC -- -- 0.2AU 01/15 18:30 TD Securities Inflation (YoY) DEC -- -- 2.1JN 01/15 18:50 Machine Orders (MoM) NOV -- 5.1 -6.9JN 01/15 18:50 Machine Orders (YoY) NOV -- 3.8 1.5JN 01/15 18:50 Domestic CGPI (MoM) DEC -- -0.1 0.1JN 01/15 18:50 Domestic CGPI (YoY) DEC -- 1.2 1.7AU 01/15 19:30 Home Loans (MoM) NOV -- 1.0 0.7AU 01/15 19:30 Investment Lending (MoM) NOV -- -- -5.5AU 01/15 19:30 Owner-Occupied Home Loan Value (MoM) NOV -- -- -1.2AU 01/15 19:30 ANZ Job Advertisements (MoM) DEC -- -- 0.0PH JAN 15-16 Overseas Workers Remittances (USD millions) NOV -- -- 1777.2PH JAN 15-16 Overseas Remittances (YoY) NOV -- -- 6.2TH JAN 15-18 Customs Exports (YoY) DEC -- -12.5 -12.4TH JAN 15-18 Total Car Sales DEC -- -- 25664.0
JN 01/16 Consumer Confidence DEC -- 38.5 38.1IN 01/16 01:30 Monthly Wholesale Prices (YoY) DEC 7.7 7.4 9.1NZ 01/16 16:00 NZIER Business Opinion Survey 4Q -- -- 25.0NZ 01/16 16:45 NZ Card Spending - Retail (MoM) DEC -- 0.2 -0.5NZ 01/16 16:45 NZ Card Spending - Total (MoM) DEC -- -0.2 -0.2JN 01/16 18:50 Tertiary Industry Index (MoM) NOV -- -0.4 0.6CH 01/16 21:00 Industrial Production YTD (YoY) DEC -- 13.8 14.0CH 01/16 21:00 Industrial Production (YoY) DEC 12.5 12.3 12.4CH 01/16 21:00 Fixed Assets Inv Excl. Rural YTD (YoY) DEC 24.0 24.1 24.5CH 01/16 21:00 Real GDP YTD (YoY) 4Q -- 9.2 9.4CH 01/16 21:00 Real GDP (QoQ) 4Q 2.0 -- 2.3CH 01/16 21:00 Real GDP (YoY) 4Q 8.5 8.7 9.1CH 01/16 21:00 Retail Sales YTD (YoY) DEC -- 17.0 17.0CH 01/16 21:00 Retail Sales (YoY) DEC 17.0 17.2 17.3NZ 01/16 21:00 Non Resident Bond Holdings DEC -- -- 60.2JN JAN 16-17 Cabinet Office Monthly Economic ReportSK JAN 16-19 Department Store Sales (YoY) DEC -- -- -0.5SK JAN 16-19 Discount Store Sales (YoY) DEC -- -- -0.5
JN 01/17 01:00 Machine Tool Orders (YoY) DEC F -- -- 17.4AU 01/17 18:30 Westpac Consumer Confidence s.a. (MoM) JAN -- -- -8.3AU 01/17 18:30 Westpac Consumer Confidence Index JAN -- -- 94.8AU 01/17 19:30 New Motor Vehicle Sales (MoM) DEC -- -- -0.7CH 01/17 20:30 China December Property PricesJN 01/17 23:30 Industrial Production (MoM) NOV F -- -- -2.6JN 01/17 23:30 Industrial Production (YoY) NOV F -- -- -4.0JN 01/17 23:30 Capacity Utilization (MoM) NOV F -- -- 4.1
NZ 01/18 16:00 ANZ NZ Job Ads (MoM) DEC -- -- 0.9NZ 01/18 16:45 Consumer Prices (QoQ) 4Q -- 0.4 0.4NZ 01/18 16:45 Consumer Prices (YoY) 4Q -- 2.6 4.6JN 01/18 18:50 Japan Buying Foreign Bonds (JPY billions) 13-Jan -- -- 386.3JN 01/18 18:50 Japan Buying Foreign Stocks (JPY billions) 13-Jan -- -- -56.4JN 01/18 18:50 Foreign Buying Japan Bonds (JPY billions) 13-Jan -- -- -141.3JN 01/18 18:50 Foreign Buying Japan Stocks (JPY billions) 13-Jan -- -- 43.1NZ 01/18 19:00 ANZ Consumer Confidence Index JAN -- -- 108.4NZ 01/18 19:00 ANZ Consumer Confidence (MoM) JAN -- -- -0.6

Economics
4
Global Views
January 13, 2012
KEY INDICATORS
Asia Pacific (continued from previous page)
Key Indicators for the week of January 16 - 20
Forecasts at time of publication. Source: Bloomberg, Scotia Economics.
A6
AU 01/18 19:30 New Motor Vehicle Sales (YoY) DEC -- -- 2.9AU 01/18 19:30 RBA Foreign Exchange Transactn (AUD millions) DEC -- -- 330.0AU 01/18 19:30 Employment Change (000s) DEC -- 10.0 -6.3AU 01/18 19:30 Unemployment Rate DEC 5.3 5.3 5.3AU 01/18 19:30 Full Time Employment Change (000s) DEC -- 18.8 -39.9AU 01/18 19:30 Part Time Employment Change (000s) DEC -- -8.8 33.6AU 01/18 19:30 Participation Rate DEC -- 65.5 65.5CH 01/18 21:00 Conference Board China November Leading Economic IndexJN 01/18 23:00 Tokyo Condominium Sales (YoY) DEC -- -- 31.0HK JAN 18-19 Composite Interest Rate DEC -- -- 0.5PH JAN 18-19 Balance of Payments (USD millions) DEC -- -- 364.0
IN 01/19 01:30 Food Articles WPI (YoY) 7-Jan -- -- -2.9IN 01/19 01:30 Fuel Power Light WPI (YoY) 7-Jan -- -- 14.5IN 01/19 01:30 Primary Articles WPI (YoY) 7-Jan -- -- 0.5PH 01/19 03:00 Overnight Borrowing Rate 4.25 4.25 4.50HK 01/19 03:30 Unemployment Rate SA DEC -- 3.4 3.4AU 01/19 19:30 Import price index (QoQ) 4Q -- 0.6 0.0AU 01/19 19:30 Export price index (QoQ) 4Q -- -2.0 4.0CH 01/19 20:35 MNI January Flash Business Sentiment SurveyJN 01/19 23:30 All Industry Activity Index (MoM) NOV -- -0.9 0.8MA JAN 19-20 Foreign Reserves 13-Jan -- -- 133.6
JN 01/20 Coincident Index CI NOV F -- -- 90.3JN 01/20 Leading Index CI NOV F -- -- 92.9JN 01/20 02:00 Convenience Store Sales (YoY) DEC -- -- 7.5TA 01/20 03:00 Commercial Sales (YoY) DEC -- -1.0 -1.0TA 01/20 03:00 Export Orders (YoY) DEC -- -0.5 2.5TA 01/20 03:00 Industrial Production (YoY) DEC -- -7.3 -3.6HK 01/20 03:30 CPI - Composite Index (YoY) DEC -- 5.6 5.7
Country Date Time Event Period BNS Consensus Latest
Latin America
Country Date Time Event Period BNS Consensus LatestBZ 01/16 05:30 Central Bank Weekly Economists SurveyBZ 01/16 12:00 Trade Balance (FOB) - Weekly (USD millions) 15-Jan -- -- -105.0PE JAN 16-20 GDP (YoY) NSA NOV -- 4.7 5.1PE JAN 16-20 Unemployment DEC -- -- 7.0
BZ 01/18 SELIC Target - Central Bank 10.50 10.50 11.00BZ JAN 18-25 Economic Activity Indx (MoM) SA NOV -- 1.0 -0.3BZ JAN 18-25 Economic Activity Indx (YoY) NSA NOV -- 0.6 0.7
CO 01/19 16:00 Industrial Production (YoY) NOV -- 4.7 5.0CO 01/19 16:00 Retail Sales (YoY) NOV -- 6.5 6.1

Economics
5
Global Views
January 13, 2012
AUCTIONS
North America
Europe
Global Auctions for the week of January 16 - 20
Source: Bloomberg, Scotia Economics.
A7
Country Date Time EventCA 01/17 10:30 Canada to Sell CAD6.5 Bln 98-Day BillsCA 01/17 10:30 Canada to Sell CAD2.5 Bln 182-Day BillsCA 01/17 10:30 Canada to Sell CAD2.5 Bln 364-Day BillsUS 01/17 11:30 U.S. to Sell 3-Month BillsUS 01/17 11:30 U.S. to Sell 6-Month Bills
US 01/18 11:30 U.S. to Sell 4-Week Bills
US 01/19 13:00 U.S. to Sell 10-Year TIPS
Asia Pacific
Country Date Time EventFR 01/16 09:00 France to Sell Bills
EC 01/17 ECB's Reserve Maintenance Period EndsSP 01/17 04:30 Spain to Sell 12M and 18M BillsGR 01/17 05:00 Greece to Sell BillsSZ 01/17 05:30 Switzerland to Sell 3-Month BillsBE 01/17 05:30 Belgium to Sell Bills
EC 01/18 03:15 ECB Calls for Bids in 7-Day US Dollar TenderEC 01/18 05:00 ECB Announces Allotment in 7-Day US Dollar TenderGE 01/18 05:15 Germany to Sell Add'l EU4 Bln 2-Year NotesPO 01/18 05:30 Portugal to Sell 3-Month and 6-Month Bills
SP 01/19 04:30 Spain to Sell BondsUK 01/19 05:30 U.K. to Sell GBP4 Bln 4% 2016 Bonds
UK 01/20 06:10 U.K. to Sell Bills
Country Date Time EventJN 01/16 22:35 Japan to Sell 1-Year BillsJN 01/16 22:45 Japan to Sell 30-Year Bonds
JN 01/17 22:35 Japan to Sell 3-Month Bills
NZ 01/18 20:30 New Zealand Plans to Sell Government BondsJN 01/18 22:45 Japan to Sell 5-Year Bonds
JN 01/19 22:35 Japan to Sell 2-Month Bills

Economics
6
Global Views
January 13, 2012
EVENTS
Source: Bloomberg, Scotia Economics.
Events for the week of January 16 - 20
North America
Europe
A8
Country Date Time EventCA 01/17 09:00 Bank of Canada Rate
US 01/18 09:30 Fed's Tarullo to Testify on Volcker Rule
MX 01/20 10:00 Overnight Rate
Latin America
Country Date Time EventBZ 01/18 SELIC Target - Central Bank
Country Date Time EventIT 01/16 05:00 Bank of Italy Releases Nov. Public Finance SupplementEC 01/16 08:30 EU's Almunia Speaks at EPC Event in Brussels
EC 01/17 04:00 EU's Buti, OECD's Padoan Speak on Economic OutlookPO 01/17 04:30 Portuguese Prime Minister Speaks at Conference in LisbonIT 01/17 18:00 Monti Travels to London to Meet with CameronIT 01/17 18:00 Monti Speaks at London School of Economics
GE 01/18 06:15 Ireland's Noonan Gives Speech, Holds Panel Discussion
EC 01/19 04:00 ECB Publishes Jan. Monthly ReportIT 01/19 18:00 Merkel, Sarkozy and Monti Meet in Rome
Asia Pacific
Country Date EventPH 01/19 03:00 Overnight Borrowing Rate

Economics
7
Global Views
January 13, 2012
NORTH AMERICARate Current Rate Next Meeting Scotia's Forecasts Consensus ForecastsBank of Canada – Overnight Target Rate 1.00 January 17, 2012 1.00 1.00
Federal Reserve – Federal Funds Target Rate 0.25 January 25, 2012 0.25 --
Banco de México – Overnight Rate 4.50 January 20, 2012 4.50 4.50
EUROPERate Current Rate Next Meeting Scotia's Forecasts Consensus ForecastsEuropean Central Bank – Refinancing Rate 1.00 February 9, 2012 1.00 --
Bank of England – Bank Rate 0.50 February 9, 2012 0.50 0.50
Swiss National Bank – Libor Target Rate 0.00 March 15, 2012 0.00 --
Central Bank of Russia – Refinancing Rate 8.00 TBA 8.00 --
Hungarian National Bank – Base Rate 7.00 January 24, 2012 7.50 7.50
Central Bank of the Republic of Turkey –1 Week Repo Rate
5.75 January 24, 2012 5.75 --
ASIA PACIFICRate Current Rate Next Meeting Scotia's Forecasts Consensus ForecastsBank of Japan – Target Rate 0.10 January 24, 2012 0.10 --
Reserve Bank of Australia – Cash Target Rate 4.25 February 6, 2012 4.25 4.00
Reserve Bank of New Zealand – Cash Rate 2.50 January 25, 2012 2.50 --
People's Bank of China – Lending Rate 6.56 TBA -- --
Reserve Bank of India – Repo Rate 8.50 January 24, 2012 8.50 --
Hong Kong Monetary Authority – Base Rate 0.50 TBA 0.50 --
Central Bank of China Taiwan – Discount Rate 1.88 March 29, 2012 1.88 --
Bank Negara Malaysia – Overnight Policy Rate 3.00 January 31, 2012 3.00 --
Bank of Korea – Bank Rate 3.25 February 8, 2012 3.25 --
Bank of Thailand – Repo Rate 3.25 January 25, 2012 3.25 --
Bank Indonesia – Reference Interest Rate 6.00 February 9, 2012 6.00 --
Central Bank of the Philippines – Overnight Policy Rate 4.50 January 19, 2012 4.25 4.25
LATIN AMERICARate Current Rate Next Meeting Scotia's Forecasts Consensus ForecastsBanco Central do Brasil – Selic Rate 11.00 January 18, 2012 10.50 10.50
Banco Central de Chile – Overnight Rate 5.00 February 14, 2012 5.25 --
Banco de la República de Colombia – Lending Rate 4.75 January 30, 2012 4.75 4.75
Banco Central de Reserva del Perú – Reference Rate 4.25 February 9, 2012 4.25 --
AFRICARate Current Rate Next Meeting Scotia's Forecasts Consensus ForecastsSouth African Reserve Bank – Repo Rate 5.50 January 19, 2012 5.50 5.50
The Bank of Canada makes a rate statement next week. We expect it to keep rates on hold. That said, as we noted in our week ahead column, the risk is that the BoC revises its growth and inflation projections higher and this could well further dent any market expecatations for a rate cut by the BoC. With WTI oil prices tracking sharply higher than the BoC had assumed in its October forecasts, it is unlikely that CPI will bottom at the 1% trough by summer that the BoC had been expecting. A slew of recent Federal Reserve speeches on balance signalled an easing bias to us in support of our view that the Fed will introduce a further expansion of its balance sheet via $500 billion in Treasury and mortgage security purchases by 2012H2.We maintain our view that Banco de Mexico will keep rates unchanged at 4.50% at the next monetary policy meeting on January 20th, even though inflation in Mexico accelerated to 3.82% y/y in December from 3.48% in November.
We expect the Hungarian central bank to adjust the benchmark interest rate with a third consecutive 50 basis point (bps) hike when it meets on January 24th, bringing the policy rate to 7.50%. The forint reached a new high versus the euro of 320.5 on January 4th, while the 10-year government bond yield and credit default swap spread also peaked at the same time, at 10.7% and 735 bps, respectively. Though all three measures have since eased, they remain well above levels prevailing through most of 2011. The central bank’s last statement indicated that if risk perceptions and the inflation outlook did not improve (latest reading on inflation was 4.3% y/y in November), further rate hikes could be imminent.
The central bank of the Philippines will in all likelihood cut the benchmark overnight policy rate by 25 basis points after its monetary policy meeting on January 19th. The advance in consumer prices has become less pronounced as food costs have come down significantly. Given that these items weigh heavily in the consumption basket we expect further falls in inflation in the months ahead, which would give the central bank more leeway to reduce borrowing costs.
We expect the central bank of Brazil to maintain its monetary policy stance and cut the SELIC rate again by 50 basis points to 10.50%. Inflation, measured by the IPCA, declined from its 7.3% y/y peak in September to 6.5% y/y in December, returning again to the central bank’s tolerance range. Additionally, the country’s economic deceleration has been more evident in the last quarter of 2011, supporting the monetary easing cycle.
The South African Reserve Bank (SARB) is expected to leave the benchmark repo rate unchanged when it meets next week. The inflation rate ticked up again in November (to 6.1% y/y from 6.0% the previous month), while improvements in survey indicators (including the PMI, the leading indicator and business confidence) suggest that economic activity should maintain a healthy rate of advance, notwithstanding the turmoil in Europe. Nevertheless, with a high trade exposure to the euro zone and a currency subject to swings in global risk aversion, the International Monetary Fund has cautioned South African policymakers to maintain a growth-supportive monetary policy.
Global Central Bank Watch
North America
Europe
Asia Pacific
CENTRAL BANKS
A9
Forecasts at time of publication. Source: Bloomberg, Scotia Economics.
Latin America
Africa

Economics
8
Global Views
January 13, 2012
FORECASTS
A10
Forecasts as at January 3, 2012* 2000-10 2011e 2012f 2013f 2000-10 2011e 2012f 2013f
Output and Inflation (annual % change) Real GDP Consumer Prices2
World1 3.7 3.7 3.6 3.9
Canada 2.2 2.3 1.8 2.4 2.1 2.9 1.8 2.0 United States 1.8 1.7 1.8 2.2 2.5 3.1 1.7 2.1 Mexico 2.1 3.9 3.0 3.7 4.9 3.6 4.0 4.1
United Kingdom 2.0 0.9 0.7 1.8 2.1 4.4 2.1 2.5 Euro zone 1.4 1.6 0.0 1.3 2.1 2.6 1.5 1.8
Japan 1.0 -0.4 3.3 1.8 -0.3 0.2 0.4 0.5 Australia 3.1 2.1 4.2 3.3 3.1 3.0 2.8 2.5 China 9.5 9.1 8.9 8.5 2.3 4.7 4.5 4.3 India 7.5 7.2 7.5 8.0 6.4 8.1 6.5 6.0 Korea 4.6 3.8 4.3 4.5 3.1 3.7 3.3 3.0 Thailand 4.1 2.8 3.5 4.5 2.6 3.5 3.0 2.8
Brazil 3.7 2.8 3.8 4.5 6.6 6.5 5.5 5.0 Chile 3.8 6.2 3.9 5.5 3.3 3.8 2.8 3.5 Peru 5.5 6.9 5.5 5.6 2.4 4.8 3.0 2.5
Central Bank Rates (%, end of period) 11Q4 12Q1f 12Q2f 12Q3f 12Q4f 13Q1f 13Q2f 13Q3f
Bank of Canada 1.00 1.00 1.00 1.00 1.00 1.00 1.50 2.00Federal Reserve 0.25 0.25 0.25 0.25 0.25 0.25 0.25 0.75European Central Bank 1.00 0.50 0.50 0.50 0.50 0.50 0.50 0.75Bank of England 0.50 0.50 0.50 0.50 0.50 0.50 0.50 0.75Swiss National Bank 0.00 0.00 0.00 0.00 0.00 0.00 0.00 0.25Bank of Japan 0.10 0.10 0.10 0.10 0.10 0.10 0.10 0.25Reserve Bank of Australia 4.50 4.25 4.25 4.25 4.25 4.25 4.50 4.50
Exchange Rates (end of period)
Canadian Dollar (USDCAD) 1.02 1.02 1.01 0.99 0.98 0.98 0.97 0.97Canadian Dollar (CADUSD) 0.98 0.98 0.99 1.01 1.02 1.02 1.03 1.03Euro (EURUSD) 1.30 1.29 1.28 1.27 1.25 1.25 1.26 1.28Sterling (GBPUSD) 1.55 1.56 1.59 1.62 1.63 1.65 1.66 1.67Yen (USDJPY) 77 78 80 80 82 83 83 84Australian Dollar (AUDUSD) 1.02 1.02 1.04 1.06 1.08 1.09 1.09 1.10Chinese Yuan (USDCNY) 6.3 6.2 6.2 6.1 6.1 6.0 6.0 5.9Mexican Peso (USDMXN) 13.9 13.5 13.2 13.0 13.0 13.1 13.2 13.3Brazilian Real (USDBRL) 1.87 1.84 1.81 1.78 1.75 1.77 1.80 1.82
Commodities (annual average) 2000-10 2011e 2012f 2013f
WTI Oil (US$/bbl) 54 95 100 105Brent Oil (US$/bbl) 52 111 110 110Nymex Natural Gas (US$/mmbtu) 5.81 4.05 3.50 4.25
Copper (US$/lb) 1.93 4.00 3.90 3.90Zinc (US$/lb) 0.75 0.99 0.94 1.10Nickel (US$/lb) 7.36 10.39 9.00 8.00Gold, London PM Fix (US$/oz) 586 1,569 1,675 1,600
Pulp (US$/tonne) 694 977 912 950Newsprint (US$/tonne) 575 640 680 725Lumber (US$/mfbm) 273 255 260 300
1 World GDP for 2000-10 are IMF PPP estimates; 2011-13f are Scotia Economics' estimates based on a 2010 PPP-weighted sample of 38 countries. 2 CPI for Canada and the United States are annual averages. For other countries, CPI are year-end rates.
* See Scotia Economics 'Global Forecast Update' (www.scotiacapital.com/English/bns_econ/forecast.pdf) for additional forecasts & commentary.

Economics
9
Global Views
January 13, 2012
ECONOMIC STATISTICS
Source: Bloomberg, Scotia Economics.
Canada 2010 11Q2 11Q3 Latest United States 2010 11Q2 11Q3 Latest Real GDP (annual rates) 3.2 -0.5 3.5 Real GDP (annual rates) 3.0 1.3 1.8 Current Acc. Bal. (C$B, ar) -50.9 -64.5 -48.5 Current Acc. Bal. (US$B, ar) -471 -499 -441 Merch. Trade Bal. (C$B, ar) -9.0 -14.3 1.1 12.9 (Nov) Merch. Trade Bal. (US$B, ar) -646 -762 -727 -758 (Nov) Industrial Production 4.9 2.3 3.5 4.6 (Oct) Industrial Production 5.3 3.8 3.7 8.5 (Nov) Housing Starts (000s) 191 192 205 200 (Dec) Housing Starts (millions) 0.58 0.57 0.62 0.69 (Nov) Employment 1.4 1.6 1.5 1.1 (Dec) Employment -0.8 0.9 1.1 1.3 (Dec) Unemployment Rate (%) 8.0 7.5 7.2 7.5 (Dec) Unemployment Rate (%) 9.6 9.0 9.1 8.5 (Dec) Retail Sales 5.5 4.1 4.1 4.4 (Oct) Retail Sales 6.8 8.1 8.3 6.3 (Dec) Auto Sales (000s) 1561 1574 1604 1634 (Oct) Auto Sales (millions) 11.6 12.1 12.4 13.5 (Dec) CPI 1.8 3.4 3.0 5.3 (Nov) CPI 1.6 3.4 3.8 4.8 (Nov) IPPI 1.0 5.1 5.3 -6.6 (Nov) PPI 4.2 6.9 6.8 9.1 (Nov) Pre-tax Corp. Profits 21.2 15.1 17.0 Pre-tax Corp. Profits 25.0 1.3 3.7
Mexico Brazil Real GDP 5.4 3.2 4.5 Real GDP 6.9 2.9 2.0 Current Acc. Bal. (US$B, ar) -5.7 -11.9 -14.9 Current Acc. Bal. (US$B, ar) -47.4 -43.4 -42.0 Merch. Trade Bal. (US$B, ar) -3.0 5.7 -15.3 -2.8 (Nov) Merch. Trade Bal. (US$B, ar) 20.2 39.2 40.3 45.8 (Dec) Industrial Production 6.0 3.5 3.4 9.9 (Nov) Industrial Production 10.5 0.6 0.1 2.1 (Nov) CPI 4.2 3.3 3.4 3.8 (Dec) CPI 5.1 6.5 7.1 6.7 (Dec)
Chile Italy Real GDP 5.2 6.6 4.8 Real GDP 1.4 0.7 0.2 Current Acc. Bal. (US$B, ar) 2.9 1.0 -11.6 Current Acc. Bal. (US$B, ar) -0.07 -0.08 -0.04 -0.04 (Oct) Merch. Trade Bal. (US$B, ar) 11.6 14.8 3.6 4.7 (Dec) Merch. Trade Bal. (US$B, ar) -40.1 -38.9 -18.3 -17.7 (Oct) Industrial Production 0.5 7.8 2.4 3.6 (Nov) Industrial Production 6.4 1.5 -0.1 3.0 (Nov) CPI 1.4 3.3 3.1 4.4 (Dec) CPI 1.6 2.7 2.9 5.0 (Nov)
Germany France Real GDP 3.6 2.9 2.6 Real GDP 1.4 1.7 1.5 Current Acc. Bal. (US$B, ar) 188.2 156.6 169.8 233.0 (Nov) Current Acc. Bal. (US$B, ar) -44.5 -81.9 -48.6 -113.9 (Oct) Merch. Trade Bal. (US$B, ar) 201.8 213.0 226.2 245.0 (Nov) Merch. Trade Bal. (US$B, ar) -38.8 -52.0 -49.2 -39.1 (Nov) Industrial Production 10.1 8.2 8.2 16.4 (Nov) Industrial Production 4.6 1.9 2.8 5.9 (Nov) Unemployment Rate (%) 7.7 7.1 7.0 6.8 (Dec) Unemployment Rate (%) 9.8 9.6 9.6 9.8 (Nov) CPI 1.1 2.3 2.5 2.1 (Dec) CPI 1.5 2.1 2.1 2.5 (Dec)
Euro Zone United Kingdom Real GDP 1.8 1.6 1.3 Real GDP 2.1 0.6 0.5 Current Acc. Bal. (US$B, ar) -77 -120 -56 29 (Oct) Current Acc. Bal. (US$B, ar) -75.2 -40.3 -113.3 Merch. Trade Bal. (US$B, ar) 32.0 -15.3 9.5 22.2 (Oct) Merch. Trade Bal. (US$B, ar) -152.5 -162.7 -177.3 -164.0 (Nov) Industrial Production 7.4 4.2 3.9 8.6 (Nov) Industrial Production 1.9 -1.3 -1.3 -0.1 (Nov) Unemployment Rate (%) 10.1 9.9 10.1 10.3 (Nov) Unemployment Rate (%) 7.9 7.8 8.2 8.3 (Sep) CPI 1.6 2.8 2.7 4.7 (Nov) CPI 3.3 4.4 4.7 7.6 (Nov)
Japan Australia Real GDP 4.5 -1.7 -0.8 Real GDP 2.6 1.9 2.5 Current Acc. Bal. (US$B, ar) 195.9 75.4 159.5 21.4 (Nov) Current Acc. Bal. (US$B, ar) -35.2 -18.3 -33.8 Merch. Trade Bal. (US$B, ar) 74.6 -54.7 -31.5 -83.2 (Nov) Merch. Trade Bal. (US$B, ar) 19.3 50.2 43.2 11.5 (Nov) Industrial Production 16.6 -7.0 -2.0 -0.3 (Nov) Industrial Production 4.3 -1.6 0.8 Unemployment Rate (%) 5.1 4.6 4.4 4.5 (Nov) Unemployment Rate (%) 5.2 4.9 5.2 5.3 (Nov) CPI -0.7 -0.4 0.1 -0.6 (Nov) CPI 2.8 3.6 3.5
China South Korea Real GDP 10.4 9.5 9.1 Real GDP 6.2 3.4 3.5 Current Acc. Bal. (US$B, ar) 305.4 Current Acc. Bal. (US$B, ar) 29.4 22.0 27.6 60.6 (Nov) Merch. Trade Bal. (US$B, ar) 181.5 185.8 250.2 198.2 (Dec) Merch. Trade Bal. (US$B, ar) 41.2 33.4 25.2 47.9 (Dec) Industrial Production 13.5 15.1 13.8 12.4 (Nov) Industrial Production 16.6 6.7 5.4 13.2 (Nov) CPI 4.6 6.4 6.1 4.1 (Dec) CPI 2.9 4.0 4.3 4.2 (Dec)
All data expressed as year-over-year % change unless otherwise noted.
A11

Economics
10
Global Views
January 13, 2012
FINANCIAL STATISTICS
* Latest observation taken at time of writing. Source: Bloomberg, Scotia Economics.
A12
Interest Rates (%, end of period)
Canada 11Q3 11Q4 Jan/06 Jan/13* United States 11Q3 11Q4 Jan/06 Jan/13*BoC Overnight Rate 1.00 1.00 1.00 1.00 Fed Funds Target Rate 0.25 0.25 0.25 0.25 3-mo. T-bill 0.75 0.80 0.76 0.72 3-mo. T-bill 0.02 0.01 0.01 0.02 10-yr Gov’t Bond 2.16 1.94 1.94 1.90 10-yr Gov’t Bond 1.92 1.88 1.96 1.84 30-yr Gov’t Bond 2.77 2.49 2.52 2.49 30-yr Gov’t Bond 2.91 2.89 3.02 2.89 Prime 3.00 3.00 3.00 3.00 Prime 3.25 3.25 3.25 3.25 FX Reserves (US$B) 63.5 65.5 (Nov) FX Reserves (US$B) 137.4 137.0 (Nov)
Germany France 3-mo. Interbank 1.51 1.35 1.27 1.20 3-mo. T-bill 0.38 -0.06 0.17 0.17 10-yr Gov’t Bond 1.89 1.83 1.85 1.77 10-yr Gov’t Bond 2.60 3.15 3.37 3.08 FX Reserves (US$B) 66.9 66.2 (Nov) FX Reserves (US$B) 51.8 48.7 (Nov)
Euro-Zone United Kingdom Refinancing Rate 1.50 1.00 1.00 1.00 Repo Rate 0.50 0.50 0.50 0.50 Overnight Rate 1.46 0.63 0.36 0.39 3-mo. T-bill 4.85 4.85 4.85 4.85 FX Reserves (US$B) 311.0 311.3 (Nov) 10-yr Gov’t Bond 2.43 1.98 2.02 1.97
FX Reserves (US$B) 78.9 79.2 (Nov)
Japan Australia Discount Rate 0.30 0.30 0.30 0.30 Cash Rate 4.75 4.75 4.50 4.25 3-mo. Libor 0.13 0.13 0.13 0.13 10-yr Gov’t Bond 4.22 3.67 3.80 3.84 10-yr Gov’t Bond 1.03 0.99 0.98 0.95 FX Reserves (US$B) 39.7 40.4 (Nov) FX Reserves (US$B) 1160.7 1261.8 (Nov)
Exchange Rates (end of period)
USDCAD 1.05 1.02 1.03 1.02 ¥/US$ 77.06 76.91 76.97 76.93CADUSD 0.95 0.98 0.97 0.98 US¢/Australian$ 96.62 102.09 102.28 102.80GBPUSD 1.558 1.554 1.543 1.529 Chinese Yuan/US$ 6.38 6.29 6.31 6.31EURUSD 1.339 1.296 1.272 1.265 South Korean Won/US$ 1178 1152 1163 1148JPYEUR 0.97 1.00 1.02 1.03 Mexican Peso/US$ 13.897 13.936 13.739 13.611USDCHF 0.91 0.94 0.96 0.95 Brazilian Real/US$ 1.879 1.867 1.857 1.791
Equity Markets (index, end of period)
United States (DJIA) 10913 12218 12360 12360 U.K. (FT100) 5128 5572 5650 5637 United States (S&P500) 1131 1258 1278 1283 Germany (Dax) 5502 5898 6058 6143 Canada (S&P/TSX) 11624 11955 12189 12155 France (CAC40) 2982 3160 3137 3196 Mexico (Bolsa) 33503 37078 36804 36487 Japan (Nikkei) 8700 8455 8489 8500 Brazil (Bovespa) 52324 56754 58600 58960 Hong Kong (Hang Seng) 17592 18434 18593 19204 Italy (BCI) 796 806 803 815 South Korea (Composite) 1770 1826 1843 1876
Commodity Prices (end of period)
Pulp (US$/tonne) 970 920 920 920 Copper (US$/lb) 3.23 3.43 3.41 3.61 Newsprint (US$/tonne) 640 640 640 640 Zinc (US$/lb) 0.86 0.83 0.83 0.88 Lumber (US$/mfbm) 240 261 261 259 Gold (US$/oz) 1620.00 1531.00 1616.50 1635.50 WTI Oil (US$/bbl) 79.20 98.83 101.56 98.20 Silver (US$/oz) 30.45 28.18 29.40 29.64 Natural Gas (US$/mmbtu) 3.67 2.99 3.06 2.66 CRB (index) 298.15 305.30 309.48 307.31

DISCLAIMER Global Views
Emerging Markets Strategy
The fixed income strategy reports contained herein have been prepared for Institutional Investors by Fixed Income Strategists of Scotia Capital (USA) Inc. (“Scotia Capital”) and may include contributions by strategists who are employees of affiliates of Scotia Capital. Fixed Income Strategists are employees of Scotia Capital’s Fixed Income Credit Sales & Trading Desk and support the trading desk through the preparation of market commentary, including specific trading ideas, and other materials, both written and verbal, which may or may not be made publicly available, and which may or may not be made publicly available at the same time it is made available to the Fixed Income Credit Sales & Trading Desk. Fixed Income Strategists are not research analysts, and this report was not reviewed by the Research Departments of Scotia Capital. Fixed Income Strategist publications are not research reports and the views expressed by Fixed Income Strategists in this and other reports may differ from the views expressed by other departments, including the Research Department, of Scotia Capital. The securities laws and regulations, and the policies of Scotia Capital that are applicable to Research Analysts may not be applicable to Fixed Income Strategists.
These reports are provided to you for informational purposes only. Prices shown in this publication are indicative and Scotia Capital is not offering to buy or sell, or soliciting offers to buy or sell any financial instrument. Scotia Capital may engage in transactions in a manner inconsistent with the views discussed herein. Scotia Capital may have positions, or be in the process of acquiring or disposing of positions, referred to in this publication. Other than the disclosures related to Scotia Capital, the information contained in this publication has been obtained from sources that Scotia Capital knows to be reliable, however we do not represent or warrant that such information is accurate and complete. The views expressed herein are the views of the Fixed Income Strategists of Scotia Capital and are subject to change, and Scotia Capital has no obligation to update its opinions or information in this publication. Scotia Capital and any of its officers, directors and employees, including any persons involved in the preparation or issuance of this document, may from time to time act as managers, co-managers or underwriters of a public offering or act as principals or agents, deal in, own or act as market-makers or advisors, brokers or commercial and/or investment bankers in relation to the securities or related derivatives which are the subject of this publication.
Neither Scotia Capital nor any of its officers, directors, partners, employees or affiliates accepts any liability for any direct or consequential loss arising from this publication or its contents. The securities discussed in this publication may not be suitable for all investors. Scotia Capital recommends that investors independently evaluate each issuer and security discussed in this publication, and consult with any advisors they deem necessary prior to making any investment.
January 13, 2012

DISCLAIMER Global Views
Fixed Income Strategy — London Portions of this report have been prepared on behalf of Scotia Capital and is not for the use of private individuals. The Scotia Capital trademark is used in association with the global corporate and investment banking and capital markets businesses of The Bank of Nova Scotia and some of its subsidiaries, including Scotia Capital Inc., Scotia Capital (USA) Inc., Scotiabank Europe plc; Scotia Capital (Europe) Limited; Scotiabank (Ireland) Limited – all members of the Scotiabank Group and authorized users of the mark. The Bank of Nova Scotia, a Canadian chartered bank, is incorporated in Canada with limited liability. The Bank of Nova Scotia, Scotiabank Europe plc, Scotia Capital (Europe) Limited and Scotia Capital Inc. are each authorized and regulated by the Financial Services Authority (FSA) in the U.K. Opinions, estimates and projections contained herein are subject to change without notice. The information and opinions contained herein have been compiled or arrived at from sources believed reliable but no representation or warranty, express or implied, is made as to their accuracy or completeness. Neither the Bank of Nova Scotia, its affiliates, employees or agents accepts any liability whatsoever for any loss arising from the use of this report or its contents. The Bank of Nova Scotia, its affiliates, employees or agents may hold a position in the products contained herein. This report is not a direct offer financial promotion, and is not to be construed as, an offer to sell or solicitation of an offer to buy any products whatsoever. This market commentary is regarded as a marketing communication. It has not been prepared in accordance with legal requirements designed to promote the independence of investment research and is not subject to any prohibition on dealing ahead of the dissemination of investment research. Fixed Income Strategy — Paris Portions of this report have been prepared on behalf of Scotia Capital and is not for the use of private individuals. The Scotia Capital trademark is used in association with the global corporate and investment banking and capital markets businesses of The Bank of Nova Scotia and some of its subsidiaries, including Scotia Capital Inc., Scotia Capital (USA) Inc., Scotiabank Europe plc; Scotia Capital (Europe) Limited; Scotiabank (Ireland) Limited – all members of the Scotiabank Group and authorized users of the mark. The Bank of Nova Scotia, a Canadian chartered bank, is incorporated in Canada with limited liability. The Bank of Nova Scotia, Scotiabank Europe plc, Scotia Capital (Europe) Limited and Scotia Capital Inc. are each authorized and regulated by the Financial Services Authority (FSA) in the U.K. Opinions, estimates and projections contained herein are subject to change without notice. The information and opinions contained herein have been compiled or arrived at from sources believed reliable but no representation or warranty, express or implied, is made as to their accuracy or completeness. Neither the Bank of Nova Scotia, its affiliates, employees or agents accepts any liability whatsoever for any loss arising from the use of this report or its contents. The Bank of Nova Scotia, its affiliates, employees or agents may hold a position in the products contained herein. This report is not a direct offer financial promotion, and is not to be construed as, an offer to sell or solicitation of an offer to buy any products whatsoever. When a comparison with other products, performance (whether past or future) or simulated performance (whether past or future) of financial instruments is displayed in this report, data has been drawn from external sources believed to be reliable but which has not been independently verified by Scotia Capital. Scotia Capital expressly disclaims any liability with respect to the accuracy, completeness or relevance of such data. Figures related to comparison performance (whether past or future) or simulated performance (whether past or future) is not reliable indicator of future returns. Where amounts are denominated in a currency other than that of your country of residence, the return may increase or decrease as a result of currency fluctuations This market commentary is regarded as a marketing communication. It has not been prepared in accordance with legal requirements designed to promote the independence of investment research and is not subject to any prohibition on dealing ahead of the dissemination of investment research. This document is confidential and may be neither communicated to any third party nor copied in whole or in part without the prior consent of Scotia Capital.
January 13, 2012

DISCLAIMER Global Views
Portfolio Strategy The equity research and strategy reports contained herein have been prepared by analysts who are employed by the Research Department of Scotia Capital. Scotia Capital Research produces research reports under a single marketing identity referred to as “Globally-branded research” under U.S. rules. This research is produced on a single global research platform with one set of rules which meet the most stringent standards set by regulators in the various jurisdictions in which the research reports are produced. In addition, the analysts who produce the research reports, regardless of location, are subject to one set of policies designed to meet the most stringent rules established by regulators in the various jurisdictions where the research reports are produced. These reports are provided to you for informational purposes only. These reports are not, and are not to be construed as, an offer to sell or solicitation of an offer to buy any securities and/or commodity futures contracts. The securities mentioned in these reports may neither be suitable for all investors nor eligible for sale in some jurisdictions where the report is distributed. The information and opinions contained herein have been compiled or arrived at from sources believed reliable, however, Scotia Capital makes no representation or warranty, express or implied, as to their accuracy or completeness. Scotia Capital has policies designed to make best efforts to ensure that the information contained in this report is current as of the date of this report, unless otherwise specified. Any prices that are stated in this report are for informational purposes only. Scotia Capital makes no representation that any transaction may be or could have been effected at those prices. Any opinions expressed herein are those of the author(s) and are subject to change without notice and may differ or be contrary from the opinions expressed by other departments of Scotia Capital or any of its affiliates. Neither Scotia Capital nor its affiliates accepts any liability whatsoever for any direct or consequential loss arising from any use of this report or its contents. Canada: These reports are distributed by Scotia Capital Inc., a subsidiary of The Bank of Nova Scotia. Scotia Capital Inc. is a member of the Canadian Investor Protection Fund and the Investment Industry Regulatory Organization of Canada. Mexico: This report is distributed by Scotia Inverlat Casa de Bolsa S.A. de C.V., a subsidiary of the Bank of Nova Scotia. United Kingdom and the rest of Europe: Except as otherwise specified herein, this report is distributed by Scotia Capital (Europe) Limited, a subsidiary of the Bank of Nova Scotia. Scotia Capital (Europe) Limited is authorized and regulated by the Financial Services Authority (FSA). Scotia Capital (Europe) Limited research complies with all the FSA requirements and laws concerning disclosures and these are indicated on the research where applicable. Scotia Capital Inc. is regulated by the FSA for the conduct of investment business in the UK. United States: This report is distributed by Scotia Capital (USA) Inc., a subsidiary of Scotia Capital Inc., and a registered U.S. broker-dealer. All transactions by a U.S. investor of securities mentioned in this report must be effected through Scotia Capital (USA) Inc. Non-U.S. investors wishing to effect a transaction in the securities discussed in these reports should contact a Scotia Capital entity in their local jurisdiction unless governing law permits otherwise.
January 13, 2012

Global Views
Scotia Economics
Scotia Plaza 40 King Street West, 63rd Floor
Toronto, Ontario Canada M5H 1H1
Tel: (416) 866-6253 Fax: (416) 866-2829
Email: [email protected]
For general and publication-related inquiries, contact
us by telephone, email and/or fax.
Scotia Economics
This report has been prepared by Scotia Economics as a resource for the clients of Scotiabank and Scotia Capital. Opinions, estimates and projections contained herein are our own as of the date hereof and are subject to change without notice. The information and opinions contained herein have been compiled or arrived at from sources believed reliable but no representation or warranty, express or implied, is made as to their accuracy or completeness. Neither Scotiabank Group nor its affiliates accepts any liability whatsoever for any loss arising from any use of this report or its contents.
DISCLAIMER