Global Value Chains, Industrial Upgrading and Governance: A … · "Global Value Chains, Industrial...
33
"Global Value Chains, Industrial Upgrading "Global Value Chains, Industrial Upgrading "Global Value Chains, Industrial Upgrading "Global Value Chains, Industrial Upgrading and Governance: and Governance: and Governance: and Governance: A Comparison of Mexico, China and India" A Comparison of Mexico, China and India" A Comparison of Mexico, China and India" A Comparison of Mexico, China and India" Gary Gary Gary Gary Gereffi Gereffi Gereffi Gereffi Duke University Duke University Duke University Duke University Center on Globalization, Governance & Competitiveness http://www.cggc.duke.edu [email protected] Seminario Internacional Innovación Tecnológica y Rentas Económicas en las Redes Globales de Producción: Un Enfoque desde las Estrategias de Desarrollo El Colegio de México 6 Y 7 De Marzo de 2008, Ciudad de México
Transcript of Global Value Chains, Industrial Upgrading and Governance: A … · "Global Value Chains, Industrial...

"Global Value Chains, Industrial Upgrading "Global Value Chains, Industrial Upgrading "Global Value Chains, Industrial Upgrading "Global Value Chains, Industrial Upgrading and Governance: and Governance: and Governance: and Governance:
A Comparison of Mexico, China and India"A Comparison of Mexico, China and India"A Comparison of Mexico, China and India"A Comparison of Mexico, China and India"
Gary Gary Gary Gary GereffiGereffiGereffiGereffiDuke UniversityDuke UniversityDuke UniversityDuke University
Center on Globalization, Governance & Competitivenesshttp://www.cggc.duke.edu
Seminario Internacional Innovación Tecnológica y Rentas Económicas en las Redes Globales de
Producción: Un Enfoque desde las Estrategias de Desarrollo
El Colegio de México6 Y 7 De Marzo de 2008, Ciudad de México

AgendaAgendaAgendaAgenda
1.1.1.1. Global Value Chain Analysis and Industrial Global Value Chain Analysis and Industrial Global Value Chain Analysis and Industrial Global Value Chain Analysis and Industrial UpgradingUpgradingUpgradingUpgrading
2.2.2.2. Comparing International Upgrading TrajectoriesComparing International Upgrading TrajectoriesComparing International Upgrading TrajectoriesComparing International Upgrading Trajectories3.3.3.3. Case Studies: China Vs MexicoCase Studies: China Vs MexicoCase Studies: China Vs MexicoCase Studies: China Vs Mexico4.4.4.4. Textiles and IT in IndiaTextiles and IT in IndiaTextiles and IT in IndiaTextiles and IT in India5.5.5.5. Global Production Networks and Governance Global Production Networks and Governance Global Production Networks and Governance Global Production Networks and Governance
2

1. Global Value Chain Analysis 1. Global Value Chain Analysis 1. Global Value Chain Analysis 1. Global Value Chain Analysis and Industrial Upgradingand Industrial Upgradingand Industrial Upgradingand Industrial Upgrading
1. Global Value Chain Analysis 1. Global Value Chain Analysis 1. Global Value Chain Analysis 1. Global Value Chain Analysis and Industrial Upgradingand Industrial Upgradingand Industrial Upgradingand Industrial Upgrading
3
4
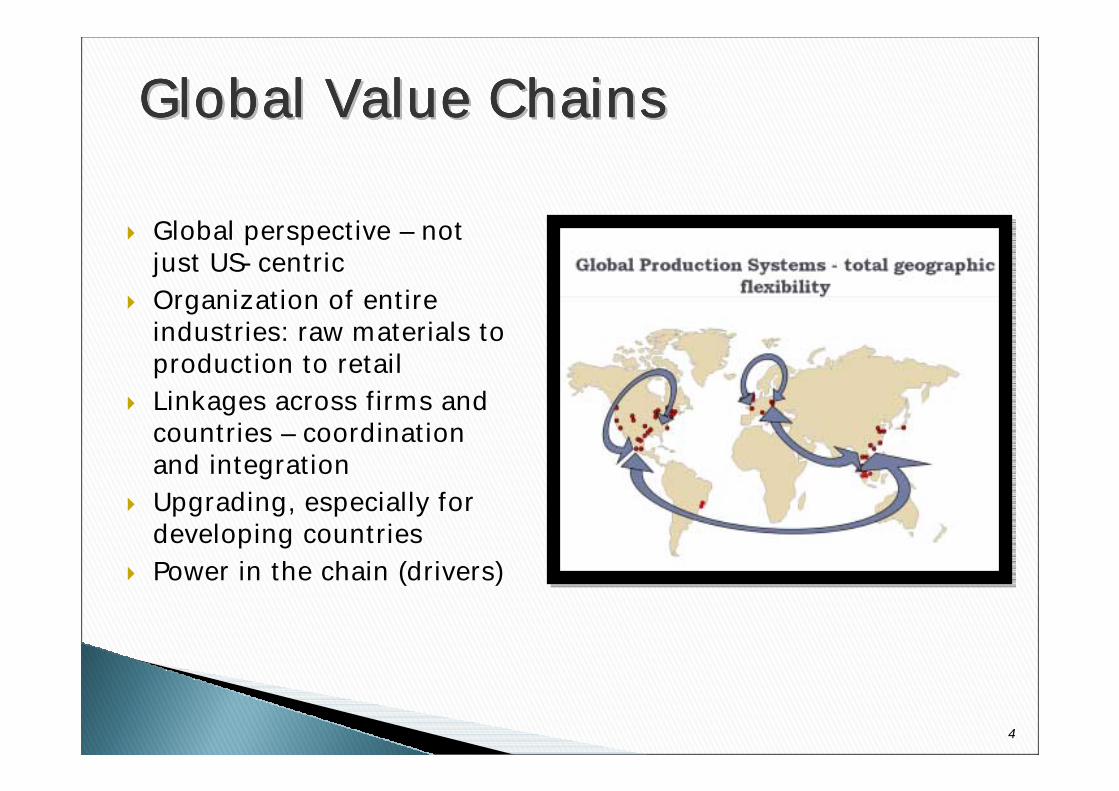
Global Value ChainsGlobal Value ChainsGlobal Value ChainsGlobal Value ChainsGlobal Value ChainsGlobal Value ChainsGlobal Value ChainsGlobal Value Chains
! Global perspective – not just US-centric
! Organization of entire industries: raw materials to production to retail
! Linkages across firms and countries – coordination and integration
! Upgrading, especially for developing countries
! Power in the chain (drivers)

Industrial UpgradingIndustrial UpgradingIndustrial UpgradingIndustrial Upgrading! PRODUCTS: PRODUCTS: PRODUCTS: PRODUCTS: Moving to higher value niches in
GVCs (goods and services)! INDUSTRIES:INDUSTRIES:INDUSTRIES:INDUSTRIES: Moving from labor-intensive to
capital-intensive to technology- and knowledge-intensive industries
! ROLES:ROLES:ROLES:ROLES: Assembly ! OEM ! OBM ! ODM! CAPABILITIES:CAPABILITIES:CAPABILITIES:CAPABILITIES: Production to Design to
Commercialization to Innovation

2. Comparing International Upgrading 2. Comparing International Upgrading 2. Comparing International Upgrading 2. Comparing International Upgrading TrajectoriesTrajectoriesTrajectoriesTrajectories
2. Comparing International Upgrading 2. Comparing International Upgrading 2. Comparing International Upgrading 2. Comparing International Upgrading TrajectoriesTrajectoriesTrajectoriesTrajectories
6

7
Composition of MexicoComposition of MexicoComposition of MexicoComposition of Mexico’’’’s Exports to the World Market, 1986s Exports to the World Market, 1986s Exports to the World Market, 1986s Exports to the World Market, 1986----2006200620062006
Source: UN Source: UN Source: UN Source: UN ComtradeComtradeComtradeComtrade....
2502141881651611581661361171109680615246272623202119
0
10
20
30
40
50
60
1986 1988 1990 1992 1994 1996 1998 2000 2002 2004 2006
% E
xpor
t Mar
ket
Primary ProductsResource Based ManufacturesLow Tech ManufacturesMedium Tech ManufacturesHigh Tech Manufactures
TotalExportsUS $B

8
Composition of Costa RicaComposition of Costa RicaComposition of Costa RicaComposition of Costa Rica’’’’s Exports to the World Market, 1986s Exports to the World Market, 1986s Exports to the World Market, 1986s Exports to the World Market, 1986----2006200620062006
Source: UN Source: UN Source: UN Source: UN ComtradeComtradeComtradeComtrade....
7.37.26.05.85.04.75.56.35.23.92.82.72.21.91.81.61.51.41.21.11.1
0
10
20
30
40
50
60
70
80
1986 1988 1990 1992 1994 1996 1998 2000 2002 2004 2006
% E
xpor
t Mar
ket
Primary ProductsResource Based ManufacturesLow Tech ManufacturesMedium Tech ManufacturesHigh Tech Manufactures
TotalExportsUS $B

9
Composition of ChinaComposition of ChinaComposition of ChinaComposition of China’’’’s Exports to the World Market, 1987s Exports to the World Market, 1987s Exports to the World Market, 1987s Exports to the World Market, 1987----2006200620062006
Source: UN Source: UN Source: UN Source: UN ComtradeComtradeComtradeComtrade....
96976259343832626624919518418315114912192857262534839
0
10
20
30
40
50
60
1987 1989 1991 1993 1995 1997 1999 2001 2003 2005
% E
xpor
t Mar
ket
Primary ProductsResource Based ManufacturesLow Tech ManufacturesMedium Tech ManufacturesHigh Tech Manufactures
TotalExportsUS $B

10
Composition of IndiaComposition of IndiaComposition of IndiaComposition of India’’’’s Exports to the World Market, 1985s Exports to the World Market, 1985s Exports to the World Market, 1985s Exports to the World Market, 1985----2006200620062006
Source: UN Source: UN Source: UN Source: UN ComtradeComtradeComtradeComtrade....
126103806352444537333533322622211818171412109
0
5
10
15
20
25
30
35
40
1985 1987 1989 1991 1993 1995 1997 1999 2001 2003 2005
% E
xpor
t Mar
ket Primary Products
Resource Based ManufacturesLow Tech ManufacturesMedium Tech ManufacturesHigh Tech Manufactures
TotalExportsUS $B

11
Composition of South KoreaComposition of South KoreaComposition of South KoreaComposition of South Korea’’’’s Exports to the World Market, 1985s Exports to the World Market, 1985s Exports to the World Market, 1985s Exports to the World Market, 1985----2006200620062006
Source: UN Source: UN Source: UN Source: UN ComtradeComtradeComtradeComtrade....
32528425419416215017214413213613012596827772656261473530
0
10
20
30
40
50
1985 1987 1989 1991 1993 1995 1997 1999 2001 2003 2005
% E
xpor
t Mar
ket
Primary ProductsResource Based ManufacturesLow Tech ManufacturesMedium Tech ManufacturesHigh Tech Manufactures
TotalExportsUS $B

3. Case Studies: China Vs Mexico3. Case Studies: China Vs Mexico3. Case Studies: China Vs Mexico3. Case Studies: China Vs Mexico3. Case Studies: China Vs Mexico3. Case Studies: China Vs Mexico3. Case Studies: China Vs Mexico3. Case Studies: China Vs Mexico
12

" Head-to-head competition in U.S. market" China is world’s leading exporter of many
manufactures, esp. consumer goods" China and Mexico are typically among the top
three exporters to the U.S. market in many product categories
" China is moving ahead of Mexico with dominant market shares in the United States, especially in 2000-2005 period
13

Product (SITC categories)% Market Share in
USA
Change in % Market Share
2000-2007Product (SITC categories)
% Market Share in
USA
Change in % Market Share
2000-2007
054 Vegetables, fresh, chilled, frozen; roots, tubers and other edible vegs
59.9 -1.0 894 Baby carr iages, toys, games and sporting goods 83.9 19.3
773 Equipment for d istributing electricity, n.e.s.
50.8 -9.9 763 Sound recorders; television image and sound recorders 76.1 53.9
761 TV receivers (including video monitors & projectors)
48.0 -15.5 831 Trunks, suitcases, vanity cases, binocular, camera cases, handbags, wal lets, etc.
74.2 24.3
782 Motor vehicles for the transport of goods 46.6 15.0 851 Footwear 72.8 10.9772 Electrical apparatus for switching or
protecting electrical circuits28.3 3.9 697 Household equipment o f base metal, n.e.s. 66.4 30.7
872 Instruments and appliances for medical, surg ical, denta l or veterinary purposes
26.9 6.7 813 Lighting fixtures and fittings, n.e.s. 65.5 7.1
741 Heating and cooling equipment and parts thereof, n.e.s
25.8 1.5 848 Articles of apparel and clothing accessories; non-textile fabrics
56.2 11.4
775 Household type electrical and nonelectr ical equip .
25.6 5.9 752 Automatic data processing machines; magnetic or optical readers;
49.3 38.0
658 Made-up articles of textile 48.8 24.7821 Furniture and parts; bedding, mattresses, suppor ts,
cushions47.7 24.1
762 Radio-broadcast receivers 45.4 10.0759 Parts and accessories for use office machines 44.5 33.0775 Household type electrical and nonelectrical equip . 44.2 7.0893 Articles, n.e.s. of plastics 42.8 11.9842 Women's or girls' coats, capes, jackets, suits, trousers,
dresses, skirts, underwear, etc. of woven textiles42.4 26.6
751 Office machines 41.9 12.7761 TV receivers (including video monitors & projectors) 38.7 36.2764 Telecommunications equipment, n .e.s. and
telecommunications accessories37.3 27.0
771 Electric power machinery 32.6 10.8899 Miscellaneous manufactured articles 31.8 -11.0699 Manufactures o f base metal, n.e.s. 31.2 17.6845 Articles of apparel, of textile fabrics, whether or not knitted
or crocheted31.2 20.4
778 Electrica l machinery and apparatus 26.6 14.7844 Women's or Girls' Coats, Capes, Jackets, Suits, Trousers,
Dresses, Underwear, etc. (except swimwear and coated etc. apparel), knitted or crocheted
29.3 25.3
625 Rubber Tires, Interchangeable Tire Treads, Tire Flaps and Inner Tubes
26.0 19.4
Source: United States International Trade Commission and US Department of Commerce. (http://dataweb.usitc.gov) downloaded Feb. '081Criteria: Over 2 Billion in US Imports from China or Mexico in 2007 at the 3 digit SITC level
Mexico China
Top US Imports in which Mexico and/or China hold 40% or more of the US market, 2007
14

Mexico's and China's Competing Exports to the United States, Mexico's and China's Competing Exports to the United States, Mexico's and China's Competing Exports to the United States, Mexico's and China's Competing Exports to the United States, 2000200020002000----2007200720072007
15

16Source: USITC http://dataweb.usitc.gov downloaded Feb 22, 2008
Main Competitors in the U.S. Market for Automatic Data Processing Machines and Units(SITC 752)
0%
10%
20%
30%
40%
50%
60%
2000 2001 2002 2003 2004 2005 2006 2007
Year
Perc
ent o
f U.S
. Mar
ket
ChinaMalaysiaMexicoThailandSingaporeJapan

17Source: USITC http://dataweb.usitc.gov downloaded Feb 22, 2008
Main Competitors in the U.S. Market for Telecommunication Equipment and Parts (SITC 764)
0%
10%
20%
30%
40%
2000 2001 2002 2003 2004 2005 2006 2007
Year
Per
cent
of U
.S. M
arke
t
ChinaMexicoKoreaJapanMalaysiaCanada

18Source: USITC http://dataweb.usitc.gov downloaded Feb 22, 2008
Main Competitors in the U.S. Market for Furniture and Parts (SITC 821)
0%
10%
20%
30%
40%
50%
2000 2001 2002 2003 2004 2005 2006 2007
Year
Perc
ent o
f U.S
. Mar
ket
ChinaCanadaMexicoVietnamItaly

19Source: USITC http://dataweb.usitc.gov downloaded Feb 22, 2008
Main Competitors in the U.S. Market for Articles of Apparel and Clothing (SITC 84)
0%
10%
20%
30%
40%
2000 2001 2002 2003 2004 2005 2006 2007
Year
Perc
ent o
f U.S
. Mar
ket
ChinaMexicoVietnamIndonesiaIndia

" China is a lower-cost producer overall (labor costs lower, but not transport & tariffs)
" China has huge scale economies" China has a coherent and multidimensional
upgrading strategy – diversify and add high value activities
" China is using direct foreign investment to promote “fast learning” in new industries
" China uses access to its domestic market to attract TNCs and promote knowledge spillovers
20

China’s Supply Chain Cities in Apparel
Source: David Barboza, “In roaring China, sweaters are west of socks city,” New York Times, Dec. 24, 2004. 21

22
# What kinds of work are Chinese, Indian, and American engineers actually doing?• Answer: Not just product adaptation,
but cutting-edge research & commercialization
# China: More than 1,000 MNC R&D Centers• GE’s China Technology Center:
Advanced research in energy storage, environmental management
• Microsoft Research Asia: Cutting-edge graphics & multimedia research

4. Textiles & Apparel and IT in India4. Textiles & Apparel and IT in India4. Textiles & Apparel and IT in India4. Textiles & Apparel and IT in India4. Textiles & Apparel and IT in India4. Textiles & Apparel and IT in India4. Textiles & Apparel and IT in India4. Textiles & Apparel and IT in India
23

TiruppurTiruppurTiruppurTiruppur Knitwear ClusterKnitwear ClusterKnitwear ClusterKnitwear Cluster$ Dramatic increase in sales & employment
$ 85% of India’s cotton knitwear exports, ~ 4% of total exports
$ Transformed from basic knit garments for lower end of domestic market to a diversified production range, especially fashion basics/casual wear for exports
$ 5,000 firms (few lead firms directly linked to global buyers)
$ 15 active industry associations, Knit Fair Complex, logistics, fashion institute in collaboration with NIFT
Labor Market Conditions*:Labor Market Conditions*:Labor Market Conditions*:Labor Market Conditions*:" 96% of workers are casual employees" Mostly migrant women from backward castes" Vast majority of women are ‘flexible’ seasonal workers" 92% of women surveyed were paid on piece-rate (though time-rate is increasing)
* Neetha, N (2002), ‘Flexible Production, Feminisation and Disorganisation: Evidence from the Tiruppur Knitwear Industry’, Economic and Political Weekly, May 25th.
24

+
-
Decent W
ork(Q
uality of Work)
Inte
rnat
iona
lizat
ion
Dom
estic
vs.
Exp
orts
+
- +-Informality
Employment Relationship
Textiles & Apparel Value ChainUpgrading Categories
Assembly OEM (Full-Package) ODM OBM
LargeIntegrated
Firms
Small Firms/Intermediaries
Subcontractors
25

India: The India: The India: The India: The OffshoringOffshoringOffshoringOffshoring of IT Servicesof IT Servicesof IT Servicesof IT Services# India employs about 650,000 professionals in IT services, and this figure is
expected to more than triple in the next five years
# General Electric’s “70-70-70” outsourcing rule of thumb: about one-third of GE’s IT work will be done in India
# A strong nucleus of domestic IT service providers has emerged:# Tata Consultancy Services – 23,400 employees and over $1 billion in revenues (as of
March 2003)# Wipro Technologies – 19,800 employees and $690 million in revenues# Infosys Technologies – 15,500 workers, over $750 million in revenues# Satyam Computer Services and HCL Technologies – close to 10,000 employees each
and $460 million and over $330 million in revenues
# Indian programmers make only 1/9 of their US counterparts, but in the domestic setting the Indian programmers are earning more than 16 times the min wage, while the average US programmer earns only twice the min wage
26

Bangalore Software Cluster:Bangalore Software Cluster:Bangalore Software Cluster:Bangalore Software Cluster:‘‘‘‘IndiaIndiaIndiaIndia’’’’s Silicon Citys Silicon Citys Silicon Citys Silicon City’’’’
# Tremendous growth in software exports since the late 1980s
# Largest centre for software exports in India - 40% of India’s total exports
# 140 TNC development centers, 750 large and small domestic IT firms
# Movement from on-site to offshore projects, increasing customized services
# A degree of upgrading from labor-intensive (coding, testing and maintenance) to skill-intensive & high value-adding (design and requirement analyses)
27

# India as a center of research, design and innovation
# Pharmaceutical# Drug discovery, specialty pharmaceuticals, biologics, high value,
bulk manufacturing, advanced intermediate manufacturing # Aerospace
# In-flight entertainment, airline seat design, collision control systems, navigation control systems, fuel inverting controls, first-class cabin design
# Consumer Appliances/Semiconductors, etc. # Design of next generation washing machines, dryers, refrigerators,
digital TV, cell phones – base stations, automobiles, tractors, locomotive motors
The Next Wave of Globalization in IndiaThe Next Wave of Globalization in IndiaThe Next Wave of Globalization in IndiaThe Next Wave of Globalization in India
28
5. 5. 5. 5. Global Production NetworksGlobal Production NetworksGlobal Production NetworksGlobal Production Networks,,,,
Governance, and Upgrading Revisited Governance, and Upgrading Revisited Governance, and Upgrading Revisited Governance, and Upgrading Revisited
5. 5. 5. 5. Global Production NetworksGlobal Production NetworksGlobal Production NetworksGlobal Production Networks,,,,
Governance, and Upgrading Revisited Governance, and Upgrading Revisited Governance, and Upgrading Revisited Governance, and Upgrading Revisited
29

Global Production, Private GovernanceGlobal Production, Private GovernanceGlobal Production, Private GovernanceGlobal Production, Private Governanceand Public Governanceand Public Governanceand Public Governanceand Public Governance
Temporary and Informal Work
International Organizations: ILO, WTO, etc.
Unions, NGOs,
etc.
State
Developing Countries
Developed Countries
Global Production Networks
Society
Economy
Government State
Unions, NGOs,
etc.
Consumers
Private Governance
Public Governance Facilitative Regulatory Distributive
GVC Governance
Source: Adapted from Gary Gereffi and Frederick Mayer, "Globalization and the demand for governance," Lecture 3 in G. Gereffi, The New Offshoring of Jobs and Global Development, ILO, 2006.

A Model of Industrial and Social Upgrading:A Model of Industrial and Social Upgrading:A Model of Industrial and Social Upgrading:A Model of Industrial and Social Upgrading:Integrating Global Production Networks,
Private Governance, and Public Governance
Scale and Quality of Work
Wages
Job stability
Rights at work
Respect for labor standards
Voice and representation
Workplace conditions
Social protection
Scale and Quality of Work
Wages
Job stability
Rights at work
Respect for labor standards
Voice and representation
Workplace conditions
Social protection
Industrial Organization,
GPN geography
GPN governance (hierarchy, captive, relational, modular, and market)
Workforce Composition: Gender, etc.
Typology of Work% Labor-intensive, informal, casual, migrant, or contract% Assembly for export% “Full package”% Original design % Knowledge-intensive jobs
Industrial Organization,
GPN geography
GPN governance (hierarchy, captive, relational, modular, and market)
Workforce Composition: Gender, etc.
Typology of Work% Labor-intensive, informal, casual, migrant, or contract% Assembly for export% “Full package”% Original design % Knowledge-intensive jobs
Private Governance,
Codes of Conduct% Extent of code adoption% Strength of codes
NGO strength
Trade union strength
Employers’organizations
Representation among non-organized sectors
Private Governance,
Codes of Conduct% Extent of code adoption% Strength of codes
NGO strength
Trade union strength
Employers’organizations
Representation among non-organized sectors
Public Governance
National
% Industrial and other “facilitative”policies
% Regulatory regime (labor standards, etc.)
% Distributive policies
International
ILO Conventions
Social Compact
Public Governance
National
% Industrial and other “facilitative”policies
% Regulatory regime (labor standards, etc.)
% Distributive policies
International
ILO Conventions
Social Compact
f

Options for Industrial and Social UpgradingOptions for Industrial and Social UpgradingOptions for Industrial and Social UpgradingOptions for Industrial and Social Upgrading# Industrial Upgrading
% Premise: Better location in value chain Better quality of work% Policy Instruments (Facilitative)
" Targeted Industrial Policy" Investment incentives" Infrastructure" Education" etc.
# Social Upgrading% Premise: Given type of job and location in value chain, stronger
governance Better quality of work
% Policy Instruments" Regulatory (ILO conventions, national laws, enforcement capacity)" Distributive (Social insurance, etc.)
% Private Governance

Thank you for your attention!
Gary Gereffi, Director, CGGCDuke University
Center on Globalization, Governance & Competitiveness
[email protected]@soc.duke.edu