Global Value Chains (GVCs) : Theoretical Integration...
236
저작자표시-비영리-변경금지 2.0 대한민국 이용자는 아래의 조건을 따르는 경우에 한하여 자유롭게 l 이 저작물을 복제, 배포, 전송, 전시, 공연 및 방송할 수 있습니다. 다음과 같은 조건을 따라야 합니다: l 귀하는, 이 저작물의 재이용이나 배포의 경우, 이 저작물에 적용된 이용허락조건 을 명확하게 나타내어야 합니다. l 저작권자로부터 별도의 허가를 받으면 이러한 조건들은 적용되지 않습니다. 저작권법에 따른 이용자의 권리는 위의 내용에 의하여 영향을 받지 않습니다. 이것은 이용허락규약 ( Legal Code) 을 이해하기 쉽게 요약한 것입니다. Disclaimer 저작자표시. 귀하는 원저작자를 표시하여야 합니다. 비영리. 귀하는 이 저작물을 영리 목적으로 이용할 수 없습니다. 변경금지. 귀하는 이 저작물을 개작, 변형 또는 가공할 수 없습니다.
Transcript of Global Value Chains (GVCs) : Theoretical Integration...

저 시-비 리- 경 지 2.0 한민
는 아래 조건 르는 경 에 한하여 게
l 저 물 복제, 포, 전송, 전시, 공연 송할 수 습니다.
다 과 같 조건 라야 합니다:
l 하는, 저 물 나 포 경 , 저 물에 적 된 허락조건 명확하게 나타내어야 합니다.
l 저 터 허가를 면 러한 조건들 적 되지 않습니다.
저 에 른 리는 내 에 하여 향 지 않습니다.
것 허락규약(Legal Code) 해하 쉽게 약한 것 니다.
Disclaimer
저 시. 하는 원저 를 시하여야 합니다.
비 리. 하는 저 물 리 목적 할 수 없습니다.
경 지. 하는 저 물 개 , 형 또는 가공할 수 없습니다.

Doctoral Thesis
Global Value Chains (GVCs):
Theoretical Integration, Extension, and Empirical Analysis
글로벌가치사슬: 이론적 통합, 확장 및 실증적 분석
August 2017
Graduate School of International Studies
Seoul National University
Wenyan Yin

i
ABSTRACT
Despite the rise of global value chain (GVC) as an important global phenomenon, the
theoretical understanding on GVC has been underdeveloped and narrow in scope. There
have been different approaches from various disciplines to GVC, yet these studies are
segmented and limited in capturing the entire mechanisms of GVC. In this respect, this
study aims to integrate three different approaches – trade, foreign direct investment
(FDI), and non-equity modes (NEMs) – to investigate the strategic options of creating
and transferring values in a more comprehensive and systematic way.
As the first step, this study proposes the three possible extensions for each of the
three approaches (trade, FDI, and NEMs). Specifically, for trade approach, this study
extends the unit of analysis from national to regional level by incorporating the cluster
theory and suggests that it is not the comparative advantage based on traditional trade
theories, but the cluster competitiveness which is a more fundamental factor that
determines the locations of fragmented value chain activities. Secondly, for FDI
approach, this study provides two possible directions for complementing the limitations
of the current transnationality index (TNI) developed by UNCTAD to better assess and
measure the degree of multinational corporations’ (MNCs) globalization. Lastly, for the
NEM approach, this study introduces a new framework to explain the conditions for
firms’ externalization decision to complement and extend the preceding studies which
mainly focus on general drivers of globalization or FDI-related factors.
Among the three extensions of each approach, this study particularly goes in more
detail on the third extension by proposing three conditions for firms’ externalization
governance mode (e.g., NEM). The three conditions comprise fast-growing business,
commercial best practices, and multiple competences. This study further argues that if
firms satisfy at least one of the three conditions, they are more likely to choose the
externalization mode or NEMs. In order to prove the explanatory power of the integrated
approach and the conceptual framework of the three conditions for externalization, this
study conducted rigorous case studies of Apple and Samsung Electronics, by focusing

ii
on their smartphone sector.
The case study finds that although Apple and Samsung Electronics are well known
for their high degrees of externalization and internalization across GVC, both firms
perform many of the value chain activities by combining both internalization and
externalization modes simultaneously. This proves the usefulness of the integrated
approach. On the other hand, the three conditions can also well explain their
externalization choices in many different value chain activities. In addition to the case
study, this research conducts a quantitative test for further generalization by expanding
the scope of the industries and the number of sample firms. To be specific, this study
tested the effects of the three conditions for the R&D partnership choices by Korea’s
high growth firms. The results support all of the three hypotheses developed on the
conceptual framework of three conditions.
Key words: global value chain (GVC), trade, foreign direct investment (FDI), non-equity
modes (NEM), externalization, internalization, Samsung Electronics, Apple, research
and development (R&D), partnership

iii
TABLE OF CONTENTS
ABSTRACT ......................................................................................................... i
LIST OF TABLES AND FIGURES ................................................................ iii
CHAPTER 1. INTRODUCTION ..................................................................... 1
CHAPTER 2. THEORETICAL INTEGRATION ......................................... 8 2.1. The Trade Approach ................................................................................................ 8
2.1.1. Literature on Trade Theories......................................................................... 9
2.1.2. Empirical Trade Literature .......................................................................... 14
2.1.3. Limitations of the Trade Approach for GVC Analysis ............................... 17
2.2. The FDI Approach ................................................................................................. 19
2.2.1. Literature on Conventional FDI Theories ................................................... 20
2.2.2. Literature on Unconventional FDI Theories ............................................. 26
2.2.3. Limitations of FDI Approach for GVC Analysis ........................................ 31
2.3. The NEM Approach ............................................................................................... 32
2.3.1. Business Network Theory ........................................................................... 33
2.3.2. Global Commodity Chain ........................................................................... 34
2.3.3. Global Supply Chain ................................................................................... 36
2.3.4. Value Network ............................................................................................ 36
2.3.5. Activities to Be Outsourced ........................................................................ 37
2.3.6. Limitations of NEM Approach for GVC Analysis ..................................... 38
2.4. Implications for Theoretical Integration ................................................................ 39
2.4.1. Combination of Various Options for Value Maximization ......................... 41
2.4.2. Shift in the Strategic Option from Trade to FDI Approach ........................ 42
2.4.3. Shift in the Strategic Option from FDI to NEM Approach ......................... 44

iv
CHAPTER 3. THEORETICAL EXTENSION ............................................. 46 3.1. Trade Approach: From National to Regional Level............................................... 47
3.1.1. Two Important Scholars in Cluster Theory ................................................. 47
3.1.2. Extension of Porter’s Cluster Theory .......................................................... 51
3.1.3. The Competitiveness Determinants of Clusters in GVC ............................ 54
3.2. FDI Approach: From TNI to GVC Index .............................................................. 60
3.2.1 Different Types of MNCs’ Global Strategy ................................................. 60
3.2.2 Measurement for MNCs’ Globalization ...................................................... 66
3.2.3 Limitations and Improvement of TNI .......................................................... 67
3.3. The NEM Approach: From Traditional to Three Conditions for MNCs’
Externalization Choice .......................................................................................... 73
3.3.1 Externalization: Definition ........................................................................... 75
3.3.2 Literature Review on Externalization .......................................................... 77
3.3.3 A New Framework for MNCs’ Externalization Choice .............................. 81
3.3.4 Discussions on the Three Conditions ........................................................... 87
CHAPTER 4. CASES AND EXAMPLES FOR EXTENSIONS OF TRADE
AND FDI APPROACHES .............................................................................. 90 4.1. Cluster Effects for Location Choice ....................................................................... 91
4.1.1 Samsung Electronics in Vietnam ............................................................. 91
4.1.2 The Growing Concentration of Korean FDI in Vietnam ......................... 93
4.1.3 Guangdong Province in China: The Cluster Effects and Sustainable Growth ............................................................................................................................ 101
4.1.4 The Performance of Korean Clusters in Attracting FDI ............................ 107
4.2. Korean MNCs’ Globalization and FDI in ASEAN .............................................. 109
4.2.1 The Degree of Globalization of Korea’s Top 20 MNCs .......................... 109
4.2.2 Korea’s FDI in ASEAN ............................................................................. 112

v
CHAPTER 5. CASE STUDY: APPLE AND SAMSUNG ELECTRONICS
.......................................................................................................................... 127
5.1. Methodology ........................................................................................................ 127
5.2. Apple and Samsung Electronics: Company Profile ............................................. 129
5.2.1 Apple ........................................................................................................ 129
5.2.2 Samsung Electronics ................................................................................ 131
5.3. The GVC Strategy of Apple and Samsung Electronics ....................................... 133
5.3.1 Apple’s Global Value Chain ...................................................................... 133
5.3.2 Samsung Electronics’ Global Value Chain ................................................ 145
5.3.3 Findings and Discussions ......................................................................... 158
5.4. Three Conditions for Externalization by Apple and Samsung Electronics .......... 161
5.4.1 Fast-Growing Business ............................................................................ 162
5.4.2 Commercial Best-Practices ........................................................................ 164
5.4.3 Multiple Competences ............................................................................... 165
5.5. Conclusions .......................................................................................................... 166
CHAPTER 6. EMPIRICAL TEST: THREE CONDITIONS ................... 168 6.1. Hypotheses ........................................................................................................... 169
6.2. Methodology ........................................................................................................ 169
6.2.1 Sample and Data ...................................................................................... 169
6.2.2 Dependent Variable ............................................................................... 171
6.2.3 Independent and Control Variables ............................................................ 172
6.2.4 Model ......................................................................................................... 173
6.3. Results ................................................................................................................ 174
6.4. Discussions and Conclusions ............................................................................. 178
CHAPTER 7. CONCLUSIONS .................................................................... 180
vi
REFERENCES ............................................................................................... 183
APPENDIX ..................................................................................................... 207
국문초록 .......................................................................................................... 223
ACKNOWLEDGEMENTS .......................................................................... 225

vii
LIST OF TABLES AND FIGURES
Tables Table 2.1. Key Studies on Trade in Intermediate Goods .............................................. 11
Table 2.2. Key Initiatives for Measuring Trade in Value-Added ................................. 16
Table 2.3. Key Indicators of Measuring Value-Added ................................................. 17
Table 2.4. The Evolution of Conventional FDI Theories ............................................. 21
Table 2.5. Comparison of Studies on Conventional and Unconventional FDI ............. 27
Table 2.6. Types of Chinese FDI Motivations .............................................................. 30
Table 2.7. The Key Investments in the US in Response to Trump’s Trade Protectionist
Policy .................................................................................................................... 43
Table 3.1. Characteristics of Four Stages of Clusters ................................................... 52
Table 3.2. Key Studies on the Measurement of Firms’ Globalization .......................... 66
Table 3.3. The Top 100 Largest Non-Financial TNCs Worldwide (2011-2013).......... 70
Table 3.4. Studies on Firms’ Outsourcing R&D Activities .......................................... 73
Table 3.5. Studies on Outsourcing: Theories and Advantages ..................................... 79
Table 3.6. Literature on Determinant Factor for Externalization .................................. 81
Table 3.7. Conditions for Firms’ Externalization ......................................................... 88
Table 4.1. Regional Distribution of Korean FDI in Vietnam........................................ 97
Table 4.2. Key Korean Investments in Vietnam (2016-2017) ...................................... 99
Table 4.3. Top 20 Korean Multinationals, 2011-2013 ($ million, number of employees)
............................................................................................................................. 110
Table 4.4. Stages and Characteristics of Korean MNCs’ FDI in ASEAN .................. 114
Table 4.5. Share Ownership of Foreign Subsidiaries by the 14 Major Korean MNCs in
ASEAN ............................................................................................................... 116
Table 4.6. Number of Subsidiaries in ASEAN of the 14 Major Korean MNCs ......... 117
Table 4.7. Industrial Distribution of Employment by Korean MNCs ......................... 118
Table 4.8. Geographical Distribution of Employment by Korean MNCs................... 119

viii
Table 4.9. Basic Information on the 12 Korean SMEs ............................................... 123
Table 5.1. Annual Sales of Apple and Samsung Electronics (2016) .......................... 129
Table 5.2. The Growth of Apple in the Past Decade (2006-2016) .............................. 130
Table 5.3. The Regular Sources and Approximate Time for iPhones ......................... 138
Table 5.4. Payments under Contractual Obligations ($ million, %) ........................... 140
Table 5.5. Apple’s GVC: Governance ........................................................................ 144
Table 5.6. Retail Stores and Sales Corporations (2014) ............................................. 149
Table 5.7. (Supplier) Procurement Costs (trillion KRW) ........................................... 151
Table 5.8. Major Learning and Development Indicators ............................................ 154
Table 5.9. Samsung Electronics’ GVC: Governance .................................................. 157
Table 5.10. Comparison of Apple and Samsung Electronics’ GVC Strategy ............. 161
Table 5.11. Apple and Samsung Electronics: Three Conditions for Externalization .. 162
Table 6.1. Samples: Industrial Distribution ................................................................ 171
Table 6.2. Samples: Distribution across Types of Partnership ................................... 172
Table 6.3. Descriptive Statistics and Correlation Matrix ............................................ 175
Table 6.4. Logistic Regression .................................................................................... 176
ix
Figures Figure 2.1. Conventional and Unconventional FDI Theories ....................................... 20
Figure 2.2. Three Different Approaches to GVC .......................................................... 40
Figure 3.1. Sustainable Sources of Competitiveness for Clusters ................................. 55
Figure 3.2. Types of Organizational Models and Evolutionary Path ............................ 65
Figure 3.3. TNI vs. GVC Index .................................................................................... 69
Figure 3.4. GVC Index: Two Possible Extensions of TNI............................................ 70
Figure 3.5. US HQ Firms’ R&D Allocation ($ billion) ................................................ 72
Figure 4.1. Korean FDI Flow in ASEAN (2011-2016) ($ million) .............................. 93
Figure 4.2. FDI by Korean Large Firms and SMEs ($ million) .................................... 95
Figure 4.3. Manufacturing Labor Costs of Key Countries (per hour, $) ................... 102
Figure 4.4. The Industry Transfer of Guangdong Province ........................................ 103
Figure 4.5. China’s International Patent Applications by City in 2016 (%) ............... 104
Figure 4.6. Global-Linking Clusters between PDR, Northeast, and Southeast Asian
Clusters................................................................................................................ 107
Figure 5.1. Profits of Samsung Electronics by Division (trillion KRW) .................... 133
Figure 5.2. Global Production Distribution of Samsung’s Mobile Sets (2016) (million)
............................................................................................................................. 148
Figure 6.1. Observed Groups and Predicted Probabilities .......................................... 177

x
ABBREVIATIONS
ASEAN Association of Southeast Asian Nations
FDI Foreign Direct Investment
GDP Gross Domestic Product
GVC Global Value Chain
IMD International Institute for Management Development
MNC Multinational Corporation
NEM Non-Equity Mode
OECD Organization for Economic Co-operation and Development
OEM Original Equipment Manufacturer
OS Operating System
PRD Pearl River Delta
R&D Research and Development
SME Small and Medium-Sized Enterprise
TiVA Trade in Value-Added
TNI Transnationality Index UNTAD United Nations Conference on Trade and Development
US United States
WEF World Economic Forum
WTO World Trade Organization

1
CHAPTER 1. INTRODUCTION
The global value chain (GVC) is not a new phenomenon; what have changed over the
past decades are the speed, scale, depth, and breadth of global interactions (Elms and
Low, 2013). The concept of GVC has been used by different schools of economic theory,
development studies, and international business disciplines, and each adopts different
definitions and boundaries of analysis. For more effective understanding, this study takes
on a business perspective at the firm level, particularly from an extended perspective of
Porter’s (1985) value chain, which is an important reference for analysis by international
business scholars (Cattaneo et al., 2013). Porter’s (1985) value chain1 focuses on value
adding activities within a firm in the domestic context.
Gereffi and Fernandez-Stark (2011) said value chains will be global when activities
are carried out in inter-firm networks on a global scale. Therefore, GVC extends the
original value chain concept in two dimensions. First, Porter’s value chain emphasizes
the value activities within a firm, while the GVC activities can be performed either by
the firm itself or external firms. Therefore, in addition to the intra-organizational
collaboration, the governance of value chain is extended by incorporating the inter-
organizational collaboration. Second, since the value chain activities are dispersed
around the world, the scope of Porter’s value chain is extended from domestic to
international scope.
There is no comprehensive framework that theoretically encompasses the
specificities of GVC (Amador and Cabral, 2016). Among various studies from different
1 The value chain activities are divided into two broad categories – primary and support activities. Primary activities are those involved in the physical creation of the product, as well as its sale and transfer to the buyer and post-sale assistance. Support activities, on the other hand, support primary activities and the entire value chain. Primary activities are divided into five categories (inbound logistics, operations, outbound logistics, marketing & sales, and services) and support activities into four generic categories (infrastructure, human resource management, technology development, and procurement).
2
disciplines, this study focuses on strategic options (or governance modes) for creating
and transferring values across the GVC. GVCs are often governed and managed by
multinational corporations (MNCs) through internalization (ownership) and
externalization (without ownership) (UNCTAD, 2011). In general, firms have three
options in organizational governance for each activity in the value chain, and they are
trade (i.e., arm’s-length transactions), foreign direct investment (FDI), and non-equity
modes (NEMs) (Gereffi et al., 2005; UNCTAD, 2013). Trade and NEMs are typical
externalization modes, while FDI is a typical internalization mode.
Trade refers to the transaction of final and intermediate goods, and FDI refers to the
transactions of production factors, such as capital, technology, and human resources. FDI
involves a certain level of equity holdings, creating an internalized system of affiliates
owned and managed by the parent firm. NEMs include contracts, outsourcing,
franchising and licensing, and strategic alliances. There have been a long history and
extensive studies for trade and FDI while NEM approach has an increasing number of
studies in more recent years.
In practice, the three approaches are interlinked with each other. More than 80% of
the global exports are linked to the international production networks of MNCs, driven
by either FDI or NEM (UNCTAD, 2013). The huge amount of exports of smartphone
from Vietnam since the 2008 Global Financial Crisis has been driven by FDI of Samsung
Electronics and their affiliates. About 96% of Samsung Electronics’ smartphones
produced in Vietnam were exported to the global market (Moon and Parc, 2014). On the
other hand, billions of dollars from iPhones exported from China are driven by the
strategic partnership between Apple and Foxconn, where Apple outsourced to Foxconn
as its contract manufacturers for assembling its products in China.
On the other hand, MNCs also shift between the alternative options due to the
environmental changes to increase profits. For example, in response to the new
government’s (e.g., Trump administration) protection policy on MNCs in the automotive
industry, MNCs in the automotive industry changed their previous trade option
(manufacturing in low-cost countries and re-export to the US) into FDI (producing and

3
selling in the US) to get access to the US market. Similarly, Korean film makers changed
their trade strategy into NEM (co-production with local firms) in order to catch business
opportunities from the fast-growing Chinese film market. Therefore, no single theory
out of the three approaches (trade, FDI, and NEM) can satisfactorily explain MNCs’
strategic options in the context of GVC. We need an eclectic approach which combines
the three theories from three different perspectives.
Moreover, there are rooms to further develop each of the approaches. As for the
trade approach, there are numerous studies that use different terminologies which aim to
explain the growing trade in intermediate goods. These studies mainly focus on the
international fragmentation of production processes. Also, they focus on the
determinants of national comparative advantages on trade patterns in the GVCs.
However, trade driven by MNCs’ investment and NEM modes is often not located in the
countries with cheapest labor when offshoring the production activities abroad. Within
both developed and developing countries, there is some degree of unbalanced regional
development which are fostered by the government’s regional policies. Trade is
concentrated in certain regions such as export-oriented clusters or specialized economic
zones. In particular, for developing countries, governments often establish these clusters
and pursue faster and earlier development in these regions. Therefore, in order to better
examine GVCs from trade perspective, we need to extend the unit of analysis from
national to regional level (extension 1). One typical approach at regional level is the
cluster analysis. Furthermore, trade scholars have developed a series of measures at the
national level in order to track the sources of value added for parts and components and
services involved in the final products. However, as mentioned earlier, majority of global
trade are linked to MNCs’ international production networks. Therefore, the second
direction in further improving the trade perspective is to expand the unit of analysis of
trade in value added from national to the regional level.
Unlike the trade approach, which mainly deals with the production or upstream
activities, the FDI approach incorporates all types of activities in the value chain at the
firm level. In specific, the FDI literature can be divided into two categories in general:

4
(1) studies on the conventional FDI (i.e., downward FDI) which is about the investments
by developed country firms in developing counties; (2) studies on unconventional FDI
(i.e., upward FDI) which is about the investments by developing country firms in
developed countries. Unlike GVC measurements at national level (mostly from trade
perspective), the empirical studies using firm-level are still relatively scarce although
they are increasing (Amador and Cabral, 2016). Among numerous measurements at the
firm level, the Transnationality Index (TNI) developed by UNCTAD is the most popular
index. TNI is composed of three elements, including the ratio of foreign assets, foreign
sales, and foreign employment. However, one of the critical limitations of this index is
that it covers only two out of three types of transactions in the GVCs. This is why Apple,
which is considered one of the most globalized companies, is excluded from the world’s
top 100 non-financial TNCs. Therefore, the second extension in this study aims to
conceptually extend the current TNI index by adding NEM-related elements to the
existing three elements (extension 2).
In contrast to the FDI approach which emphasizes MNCs’ control through the
ownership of their subsidiaries, the NEM approach focuses on explaining how the
leading firms in GVCs control and coordinate all of the involved organizations, including
those in which they do not have any ownership. However, the conditions of
externalization (i.e., NEM) stressed by the preceding studies are mostly FDI-related
determinants (e.g., transaction cost) or more superficial drivers of general globalization.
These determinants of externalization cannot satisfactorily explain some cases in
practice, such as Apple’s outsourcing of manufacturing related activities to China. This
limitation requires us to introduce new, NEM-specific elements to explain the growing
inter-organizational governance in the GVCs. To this end, this study introduces a new
framework comprising three elements to explain the conditions under which firms are
more likely to externalize certain parts of their value chain activities instead of
internalizing all of the activities within the firm (extension 3).
For other extensions (i.e., trade and FDI), this study presents many practical
examples and cases to illustrate and support the arguments raised in Chapter 3. For trade

5
approach, I took the example of Samsung Electronics’ investment in Vietnam and
growing agglomeration of FDIs in this country despite its increasing labor costs
compared to other ASEAN countries. Moreover, I took the example of cluster effects on
the upgrade of Guangdong Province in China for its sustainability in attracting global
MNCs’ investments in this regions, Pearl River District in particular, in spite of the
substantial increase in the income level and falling supply of labor force. On the other
hand, regarding the extension of FDI approach, I took the examples of FDI by Korean
MNCs and small and medium-sized enterprises (SMEs) in ASEAN and found that their
FDIs are usually associated with other governance modes in terms of trade and NEMs,
and such combination of various governance modes help Korean MNCs and SMEs
generate and enhance their production networks in ASEAN.
However, this study focuses more on the third extension by introducing three
conditions for MNCs’ choice of externalization. There have been extensive studies on
firms’ externalization choice, but the determinants proposed by those studies are mostly
based on the FDI-related theories. The theory of transaction cost economics (TCE)
dominates among many theories for explaining the choice between externalization and
internalization. According to TCE, firms are more likely to select the externalization
mode instead of internalization, if the market failure is lower. However, in reality, MNCs
sometimes externalize parts of their value chain activities in spite of high market failure.
This suggests that there are other critical conditions to explain firms’ externalization
choice. In this respect, this study proposes three conditions which are fast-growing
business, the existence of commercial best practices, and multiple competences.
In order to strengthen the two main theoretical frameworks – integrated GVC
approach and the three conditions – this study further conducted a case study of Apple
and Samsung Electronics by focusing on their smartphone business, and empirical test
to complement the case study and also strengthen the explanatory power of the
conceptual framework by including more samples. Specifically, for the case study, this
research showed that although Samsung and Apple are well-known for pursuing
opposite strategies in terms of producing competitive smartphone product, there are also

6
some similarities between the two firms when analyzed with the integrated GVC
approach. Although Samsung internalizes more activities in the value chain activities,
both firms pursue a combination of internalization (domestic in-house development, or
FDI) and externalization (trade, NEM) for more than half of the entire value chain
activities (Apple: 6 activities; Samsung Electronics: 5 activities).
Moreover, drivers of both firms’ externalization can be well explained by the three
conditions. Apple’s outsourcing to Foxconn for the manufacturing operations and
Samsung’s increasing trend in outsourcing to local firms in Vietnam for some parts and
components are not just driven for cheap labor, but for fast and flexible adaptation to the
market changes. In addition, Apple and Samsung’s outsourcing activities to key parts
and components suppliers from world’s well-known MNCs occur not because those
MNCs possess highest technology but because their products are the commercial best
practices which create highest values. Furthermore, Apple and Samsung Electronics
externalize some activities across their GVCs not just to exploit the benefits of
specialization, but to maximize values through co-specialization and co-development
with their partners.
In addition to case approach for explaining why and how Apple and Samsung
combine various governance modes to perform their GVCs in smartphone businesses,
the empirical test proved that Korea’s high-growth firms from other industries’ R&D
partnership decision can also be well explained by the three conditions. The higher the
degree of the three conditions, the more likely the observed firms make partnership for
more effectively implementing their R&D activities.
The remainder of this study is organized as follows. Chapters 2 and 3 deal with
GVC theories on the logic behind the integrated approach for GVC and three extensions,
respectively. The following three chapters from Chapter 4 to 6 deal with GVC practices
with case studies. In order to better explain the first two conceptual extensions (trade and
FDI), Chapter 4 shows many examples and cases for the first two extensions. Chapter 5
conducts the case study of Apple and Samsung Electronics and aims to prove the two
main theoretical frameworks proposed in this study (integrated approach of GVC and

7
three conditions). Chapter 6 then adopts a quantitative approach by using the logistic
regression to test the effects of the three conditions on Korea’s high-growth firms’
decision on R&D partnership. The final part (Chapter 7) concludes by emphasizing the
contributions of this study, implications for enhancing firms’ competitiveness, and
suggestions for further study.

8
CHAPTER 2. THEORETICAL INTEGRATION
As illustrated in Chapter I, the concept of GVC is the extension of Porter’s (1985) value
chain which aims to explain the sources of value creation both geographically and
organizationally. The literature on GVC can be categorized into the following five main
topics: governance, location, coordination among value chain activities, firm
performance, and upgrading along the value chains (Hernández and Pedersen, 2016).
Among various topics on GVC, this study focuses on the governance modes in the
context of GVC. Whereas preceding studies mainly aim to describe the different types
of governance modes as well the conditions affecting these governance structures, this
study aims to integrate different approaches (or theoretical ground) to GVC governance.
To address this issue, this study first reviews the main issues of each approach in
the context of GVC, and discusses the limitations of each approach. Based on the above
analysis, it then suggests an eclectic approach by combining the three approaches to
analyze the strategic options for organizing value creation and transfer in a
comprehensive and evolutionary way. Lastly, this section presents meaningful
implications of this integrated approach from two perspectives: (1) the necessity of
combining various strategic options for higher value creation, (2) shifting from one to
another option in order to adapt to the environment and maximize their value creation.
Specific examples are also shown to illustrate the arguments.
2.1. The Trade Approach
GVC studies from trade approach mainly aim to explain the increasing trade in
intermediate goods. While the trade in parts and components is not new, its share in the
total trade has grown dramatically in more recent years. About 60% of global trade,
which amounts to more than $20 trillion, consists of trade in intermediate goods and

9
services that are assembled at various stages in production for final consumption
(UNCTAD, 2013). Moreover, trade in intermediate goods is rising much faster than the
overall trade. This rise is most dramatic after the late 1980s when the developing world
was linked more systematically through GVCs (Sturgeon and Gereffi, 2009). The
classical trade theories discuss comparative advantage in terms of end products and
international specialization in terms of complete industries and integrated products
(Arndt and Kierzkowski, 2001). Although many of the insights of traditional trade theory
continue to hold, they cannot satisfactorily explain the patterns of trade in components
and parts which call for a vast body of research and multiple labels. The following
section shows several prominent studies and highlights some of the key arguments.
2.1.1. Literature on Trade Theories
Until the late 19th century, factories normally had an integrated production structure,
which is characterized as parts and components being manufactured in sequential units,
often clustered locally near consumers (Amador and Cabral, 2016). Hence, the classical
trade theories have long emphasized comparative advantages in terms of end-products
and international specialization in terms of complete industries and integrated products
(Arndt and Kierzkowski, 2001). For example, Adam Smith’s trade theory based on
absolute advantage suggests all nations through trade can gain some benefits by
exporting goods in which they have absolute advantages, and importing those goods with
absolute disadvantages compared to their trading partners. David Ricardo, on the other
hand, complemented the trade theory of Smith by introducing the concept of comparative
advantages. Even if a country has many areas of absolute advantages, it should better
focus on the areas of comparative advantages, and import goods with more
disadvantages vis-à-vis the trading partners. Heckscher and Ohlin’s trade theory from
the factor endowment perspective stresses the comparative advantages of nations from
the perspective of factor endowments. They argued that nations should specialize in the

10
sectors where they have abundant factors, which can contribute to maximizing the wealth
of nations through trading with other countries.
In addition to the above classical trade theories, some other theories and models
were developed by the later scholars in order to explain the increasingly complex world,
such as factor price equalization theorem, Stolper-Samuelson theorem, inter-industry
trade, intra-industry trade, country similarity theory, and product life cycle (Cho and
Moon, 2013). Despite the contribution of these trade theories in explaining the trade
patterns among countries, they have a common assumption that the entire production
process of transforming raw materials and other intermediate goods into the final
consumption goods is completed within the nation.
However, since the 1980s the production process have become more fragmented
and dispersed internationally. There are only a few goods or services which are purely
domestically made. The primary input factors often pass through several stages for
further processing with some value-added from other countries before reaching the
consumers. For example, 40% of Mexico’s exports to the US are value-added made by
US firms (Economist, 2016/12/10). Similarly, GM exported 700,000 automobiles from
Mexico to the US in 2016, but 70% of these parts and components were imported from
the US. Due to the dramatic growth of trade in parts and components, GVC studies from
trade approach mainly aim to explain the increasing trade in intermediate goods.
Although many of the insights of traditional trade theory continue to remain valid,
they do not comprehensively explain the patterns of trade in intermediate goods. In fact,
the intermediate goods trade is rising much faster than the overall trade. This rise has
been most dramatic since the late 1980s. The limitation of traditional theories based on
the final goods has stimulated a vast body of research, to explain the disaggregation and
dispersion of production activities, and their impacts on production and trade patterns,
factor prices, and national welfare as well (see Table 2.1).

11
Table 2.1 Key Studies on Trade in Intermediate Goods
Labels Studies
Two-stage model Balassa (1965), Bhagwati and Srinivasan (1973), Corden (1966)
Multi-stage production Dixit and Grossman (1982)
Slice-up of the value-added chain Krugman (1995)
Disintegration of production Feenstra (1998)
Vertical specialization of trade Hummels et al. (2001)
Fragmentation of production Antrás and Rossi-Hansberg (2009), Arndt and Kierzkowski (2001)
The two-stage production model discussed in earlier studies (e.g., Balassa, 1965;
Bhagwati and Srinivasan, 1973; Corden, 1966) suggested that the entire production
process is divided into upstream and downstream stages. At the upstream stage, the
intermediate goods were produced by utilizing the primary factors and then further
processed by combining with other primary factors at the downstream stage for
producing the final goods. Some other studies (e.g., Melvin, 1969; Vanek, 1963)
provided more practical implications for this by investigating the inter-industry flows;
they found that the final products in certain industries are used as the intermediate goods
or inputs from other industrial goods.
On the other hand, Dixit and Grossman (1982) analyzed the production processes
with multiple stages. The inputs are shipped from one country to another and sometimes
shipped back again for additional value adding process; such integrated and complicated
production processes are coordinated by multinational companies (MNCs). The pattern
of production specialization is determined by the nation’s comparative advantages.
Therefore, the common traits of both two-stage and multiple-stage production theory are
that the production process is integrated through a series of vertical stages, each of which
adds a certain degree of values for the following stages in the manufacturing processes.

12
Other studies such as Hummels et al. (2001) and Sanyal (1983) explained the same
phenomenon using different terminology of “vertical specialization,” which explains
how countries are sequentially linked with each other through the value-added in a
number of stages of production processes which contribute to yielding the final goods.
Hummels et al. (2001) constructed the measure of vertical specialization by using the
imported inputs in producing goods for exports. Using this criterion, they conducted
empirical tests for 10 OECD and four emerging countries and found that there was a
significant growth in vertical specialization for these countries during the period of
examination from 1970 to 1990.
On the other hand, Krugman’s (1995) concept of “slice-up of the value-added chain”
aims to explain the reasons behind the substantial growth in global trade. The production
process is broken into a number of steps located in various countries; the production
components comprise numerous subcomponents manufactured in many other countries.
The geographical spread among a number of countries requires many exchanges in
exports and imports, which increase the volume of global trade. Krugman’s concept is
also useful in explaining the emergence of super-trading economies such as Hong Kong
and Singapore, which have a quite high percentage of trade to GDP (often the trade value
exceeds GDP by several times). These economies play the role of platform by re-
exporting goods with little or no additional value to the imported goods. Such trade
pattern cannot be well explained by the classical trade theories based upon the
comparative advantages or factor endowments.
Feenstra (1998) stressed that the disintegration of production process has driven the
integration of global economy through trade coordinated by MNCs. MNCs outsource
low-valued added activities which demand a large of number of low-skilled workers to
the developing country firms, and then imported these manufactured intermediate inputs
back home country for further valued-added on these goods through activities such as
advertising, marketing, and research and development (R&D). MNCs’ outsourcing
strategy has not only encouraged the substantial increase in trade for the US economy
but also the structure of trade shifting from agriculture and raw materials to

13
manufactured goods or intermediate inputs. The author further argued that globalization
through trade in intermediate goods has much more impacts on employment and wages
than trade in final goods.
Compared to the traditional trade theories on final products, the theories on trade in
intermediate goods have the following characteristics. First, in contrast to the traditional
trade theory which considered import as a negative item to GDP, trade theories in
intermediate goods emphasize more on the positive effects of imports, because imported
inputs determine the quality and competitiveness of the exported final products (OECD
et al., 2013). Second, since the production process becomes more fragmented and
dispersed globally, it provides more opportunities for developing countries participating
in MNCs’ international production networks through trade (Sturgeon and Gereffi, 2009).
For example, the share of intermediate goods imported from developing countries grew
from 5.2% in 1988 to 29.6% in 2006; and the share of intermediate goods exported from
developing countries increased from 3.9% to 31.7% during the same period (Sturgeon
and Gereffi, 2009). Therefore, developing countries can achieve economic development
by increasing the degree of their participation in GVC and upgrading their roles in GVC
participation (OECD et al., 2013; UNCTAD, 2013).
Despite the meaningful and influential contributions of these new theories, there
are still some critical limitations for explaining GVC. According to these theories, the
production and trade patterns are still determined by the comparative advantages, or
factor endowments of the nations, which is consistent with the traditional trade theories.
Therefore, countries should specialize in the intermediate goods where they have
comparative advantages. However, this approach cannot explain the upgrade in the value
chain from lower value-added to higher value-added activities for developing countries.
Although some studies have suggested the trade impacts on factor prices, they did not
show a more comprehensive spillover effects which lead to the structural changes or
industrial transfer and upgrade. These effects often involve MNCs’ investment activities
and inter-linkages with local firms. In this respect, theories of foreign direct investment

14
(FDI) can complement the trade approaches by investigating the firm activities across
national boundaries.
2.1.2. Empirical Trade Literature
In addition to the conceptual development for trade in intermediate goods, the empirical
trade literature has introduced various methods for measuring the GVC, due to the
limitations of the traditional trade statistics. However, one of the most critical problems
is the double or multiple counting. Since traditional trade statistics are measured in gross
terms, the intermediate inputs are counted many times whenever they cross a border for
further processing (OECD et al., 2013; UNCTAD, 2013). According to UNCTAD (2013),
about 28% of global exports are foreign value-added, which also represent the amount
of double/multiple counted in global trade figures. For example, although China exports
billions of dollars’ worth iPhones to the US, which leads to a significant trade deficits of
the US against China, majority of the values are not added by China but are from the
third countries such as Japan, Korea, and Germany. The value-added by China only
accounts for 3.6% of the entire value per iPhone device (Wall Street Journal, 2010/12/15).
Therefore, traditional statistics of simple export values from China do not well reflect
the extent of a country’s real value-added.
Second, traditional trade statistics which are biased toward the trade in goods
neglect the role of services (e.g., finance-insurance, R&D, accounting) in creating goods.
For example, the factory-gate price based on the manufacturing costs is only around
$200, but the retail price is nearly $700 when incorporating the costs of services such as
design, R&D, and advertising and marketing. Third, using the traditional measurements,
we cannot figure out the detailed information about value-added for each process of
production. Take the iPhone for example again. The factory-gate price of an iPhone is
largely determined by the third country’s parts and components. Therefore, when China
exports more sets of iPhones, the real beneficiaries are the suppliers of these parts and
components more than China. In order to solve these issues, three main methodological

15
approaches have been introduced by existing studies – international trade data on parts
and components; customs statistics on processing trade; and input-output tables (Amador
and Cabral, 2016).
Among the three methods, input-output based measures are increasingly adopted
by the recent studies for tracking the source country of the value-added. Table 2.2
summarizes some features of the key initiatives by international organizations for
mapping the value-added. IDE-JETRO is one of the earliest agencies to develop
international input-output matrices. Also, these projects cover various countries and
industries. UNCTAD/Eora’s project covers the most number of countries and industries
as well. Moreover, OECD-WTO’s I-O tables were developed more recently and have
been used mostly in policy-oriented studies and some other recent exploratory research
(Amador and Cabral, 2016).

16
Table 2.2. Key Initiatives for Measuring Trade in Value-Added
Project Institution Data sources Countries of
coverage Industries of
coverage Time span
GTAP Purdue University Individual researchers and organizations
129 57 1997, 2001, 2004, 2007
WIOD Consortium of 11 institutions (EU funded)
National supply-use tables 40 35 1995-2011
TiVA database OECD/WTO National I-O tables, 57 18 1995, 2000, 2005, 2008, 2009
GVC Database UNCTAD/Eora National supply-use and I-O tables, Eurostat, IDE-JETRO, and OECD
187 25-500 depending on the country
1990-2010
Asian International I-O tables
Institute of Developing Economies-Japan External Trade Organization (IDE-JETRO)
National accounts and firm surveys
10 76 1975, 1980, 1985, 1990, 1995, 2000, 2005
Note: (1) GTAP: Global Trade Analysis Project, WIOD: World Input-Output Database, TiVA: Trade in Value-added. (2) The table is reorganized and modified by UNCTAD (2013) and Amador and Cabral (2016).
17
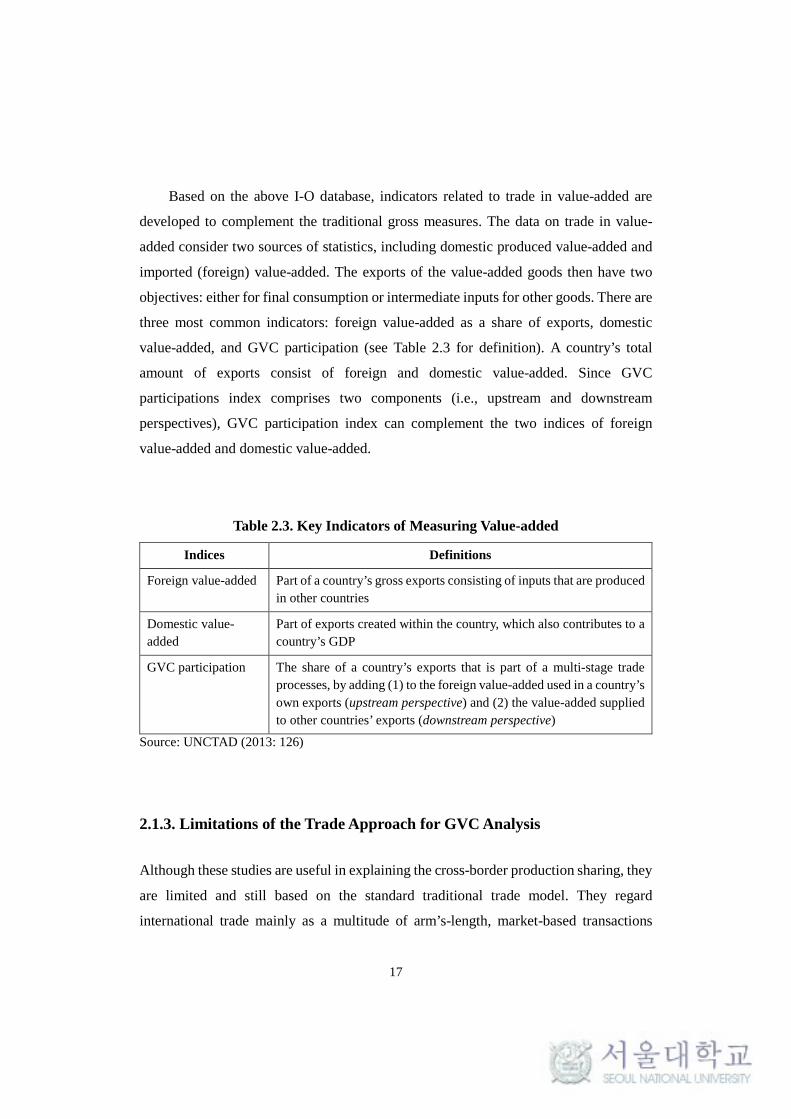
Based on the above I-O database, indicators related to trade in value-added are
developed to complement the traditional gross measures. The data on trade in value-
added consider two sources of statistics, including domestic produced value-added and
imported (foreign) value-added. The exports of the value-added goods then have two
objectives: either for final consumption or intermediate inputs for other goods. There are
three most common indicators: foreign value-added as a share of exports, domestic
value-added, and GVC participation (see Table 2.3 for definition). A country’s total
amount of exports consist of foreign and domestic value-added. Since GVC
participations index comprises two components (i.e., upstream and downstream
perspectives), GVC participation index can complement the two indices of foreign
value-added and domestic value-added.
Table 2.3. Key Indicators of Measuring Value-added
Indices Definitions
Foreign value-added Part of a country’s gross exports consisting of inputs that are produced in other countries
Domestic value-added
Part of exports created within the country, which also contributes to a country’s GDP
GVC participation The share of a country’s exports that is part of a multi-stage trade processes, by adding (1) to the foreign value-added used in a country’s own exports (upstream perspective) and (2) the value-added supplied to other countries’ exports (downstream perspective)
Source: UNCTAD (2013: 126)
2.1.3. Limitations of the Trade Approach for GVC Analysis
Although these studies are useful in explaining the cross-border production sharing, they
are limited and still based on the standard traditional trade model. They regard
international trade mainly as a multitude of arm’s-length, market-based transactions

18
(Gereffi et al., 2001). For instance, the role of MNCs in offshore production activities is
neglected by trade theories. In fact, 80% of global trade (in terms of gross exports) is
linked to the international production networks of MNCs, either as intra-firm trade,
NEM-generated trade, or arm’s-length transactions involving at least one MNC
(UNCTAD, 2013).
Second, standard trade theories regard the offshoring production to exploit the cost
advantage of foreign countries, which is mainly dependent on the national factor
endowments (Arndt and Kierzkowski, 2001). However, in reality, the factor endowments
or inherited advantages of a country (e.g., cheap labor) are often not the key
consideration of MNCs’ location decision for offshoring production. For example, the
manufacturing locations of two largest smartphone makers – Apple and Samsung – are
China and Vietnam2, respectively. The monthly minimum wages of China and Vietnam
are not the lowest in the world; their wage levels are similar or even higher than other
Asian countries such as Bangladesh, Indonesia, and Philippines. Moreover, both of the
two MNCs’ manufacturing plants are located in the clusters, in or near the large cities
within China and Vietnam. The income level in these clusters, in the case of both Apple
and Samsung, is the highest, rather than being the cheapest. This thus implies that there
are more important strategic factors which should be considered for the determinants of
production locations. This also suggests that the location selection analysis should be
better conducted at the regional level (i.e., cluster) rather than the national level.
Third, trade in intermediate goods and services primarily concern the international
fragmentation of production activities of a certain industry. However, due to the
emergence of multiple functional products, manufacturing of a product requires
knowledge from various industries, and the boundary of industry becomes blurry. For
example, the automotive value chain encompasses many industries including
automobiles, electronics, ICT, and shipping (Giround and Hirza, 2015). Therefore,
2 Samsung’s assembly plants are dispersed across six countries in the world, and more than 50% of the total production are located on Vietnam.

19
industry-based analysis of trade approach, the measurement of trade in value-added in
particular, cannot capture the entire transactions in the value-added activities.
2.2. The FDI Approach
This section explains the drivers of GVC activity at the firm-level, particularly by
focusing on the FDI perspective. In contrast to trade approach, FDI approach assumes
the possibility of factor transfer across national boundaries. FDI approach investigates
the value creation inside the MNCs comprising the parent companies with their
subsidiaries across countries.
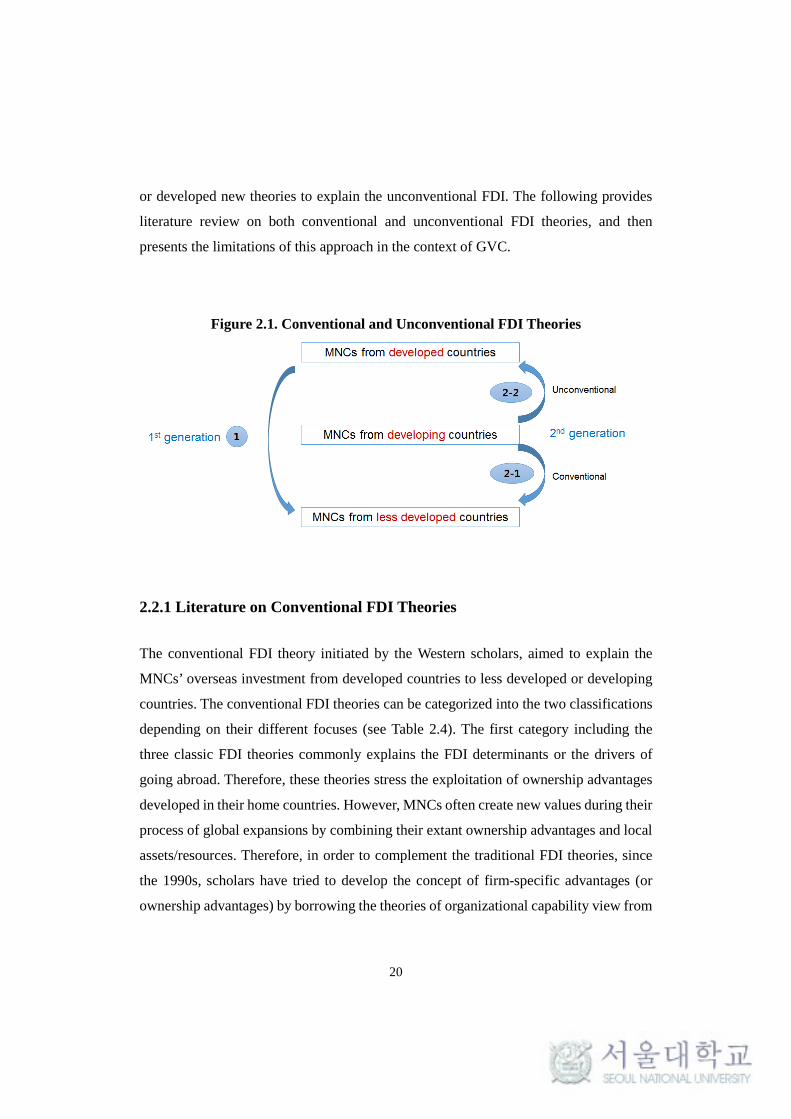
FDI theories were first introduced to explain the overseas investment from
developed country firms, which is often labeled as conventional FDI (or first generation
FDI). However, the investment by firms from emerging countries 3 have witnessed
explosive growth since the 1990s (or second generation FDI)4. Emerging country firms
invest both in developing and developed countries. Therefore, whereas the former type
of FDI can be well explained by the conventional FDI theories, the latter type
(unconventional FDI) possesses distinctive characteristics and needs extended or new
theories to explain this (see Figure 2.1). The unconventional FDI has attracted growing
attention by scholars particularly after mid-2000s, driven by the numerous Chinese firms’
outward FDI.5 Scholars have tried the modified or extended conventional FDI theories,
3 According to Hoskisson et al. (2000), emerging markets include 64 transition economies and developing countries. Luo and Tung (2007) defined emerging MNCs using the following three characteristics: 1) firms must engage in outward FDI, 2) firms must effectively control their international activities, 3) firms’ international expansions must focus on value-adding activities. 4 The percentage of FDI outflows by emerging country firms rose from 5.4% in 1990 to 33.8% in 2014, although decreased a little to 25.6% in 2015. Yet, the growth rate in the recent 10 years (2005-2015) by emerging country firms’ FDI is 245%, which is significantly higher than that of previous ten years (1995-2005), which has the growth rate of 110%. 5 There has been a steep rise in articles dealing with emerging-country firms published in the leading international business journals since 2007 (2 articles in 2006, 20 articles in 2007, and 29 articles in 2012) (Luo and Zhang, 2016).
20
or developed new theories to explain the unconventional FDI. The following provides
literature review on both conventional and unconventional FDI theories, and then
presents the limitations of this approach in the context of GVC.
Figure 2.1. Conventional and Unconventional FDI Theories
2.2.1 Literature on Conventional FDI Theories
The conventional FDI theory initiated by the Western scholars, aimed to explain the
MNCs’ overseas investment from developed countries to less developed or developing
countries. The conventional FDI theories can be categorized into the two classifications
depending on their different focuses (see Table 2.4). The first category including the
three classic FDI theories commonly explains the FDI determinants or the drivers of
going abroad. Therefore, these theories stress the exploitation of ownership advantages
developed in their home countries. However, MNCs often create new values during their
process of global expansions by combining their extant ownership advantages and local
assets/resources. Therefore, in order to complement the traditional FDI theories, since
the 1990s, scholars have tried to develop the concept of firm-specific advantages (or
ownership advantages) by borrowing the theories of organizational capability view from

21
the field of strategic management to examine how MNCs build up their firm-specific
advantages. The following explain each of the above theories in more detail.
Table 2.4. The Evolution of Conventional FDI Theories
O advantage L advantage I advantage
1. Classical FDI Theories (FDI determinants; exploitation of O advantage)
1.1. Hymer’s (1976[1960]) theory √
1.2. Internalization theory √
1.3. OLI paradigm √ √ √
2. Organizational Capability View (Sources of firm competitive advantages; creation of O advantage)
2.1. Resource-based view √
2.2. Dynamic capability view √
2.3. Cantwell’s Evolutionary theory √ √ √
Both of the previous two perspectives focus on the MNCs’ internal elements but
less concern the relationship outside the firm. The degree of value creation which
depends much on the strategy and organization structure is often affected by the
environmental factors. In this respect, some other scholars have incorporated the theories
(e.g., contingency theory, business network theory, and institutional theory) dealing with
the relationship between the environment and the firm to enrich the FDI theories. Since
these theories, particularly the business network theory, are much related to the NEM
approach of later section, more details will be explained in Section 2.3

22
2.2.1.1. Classical FDI Theories
Stephen Hymer, the grandfather of the conventional FDI theory, initially analyzed MNCs
from industrial organization perspective in his doctoral dissertation (Hymer,
1976[1960])6. Hymer found market failure (i.e., market structure imperfections) as the
main driver of MNCs going abroad to exploit their ownership advantages through
internalization.
Internalization theory explains the existence and growth of MNCs by using a
different type of market failure (i.e., transaction-cost imperfection) based on transaction
cost analysis. The conventional internalization theory was first developed by Buckley
and Casson (1976), and extended by Rugman (1981) and Hennart (1982). MNCs
perform activities internally, rather than through the external market, because of the
additional costs from market failure. Any type of market imperfection for intermediate
products will pressure MNCs to bypass the market transaction and create their internal
markets from the efficiency perspective.
Dunning (1977) introduced a more comprehensive framework (i.e., the eclectic
theory or the OLI paradigm) for explaining the choice of entry mode. OLI paradigm is
composed of three factors – ownership (O) advantage of the firm, location (L) advantage
of the host countries, and the internalization (I) advantage of integrating transactions
inside the firm. Dunning (1981) argued that internalization theory emphasizes more the
static efficiency of the MNC while the OLI paradigm can better explain the evolutionary
growth of MNCs (Rugman and Verbeke, 2008).
6 Hymer’s doctoral thesis was submitted to MIT in 1960, but was refused to be published as a book. However, later his thesis was recognized by the academia and finally was published in 1976.

23
2.2.1.2. Organizational Capability View (OCV)7
The main objective of organizational capability view is to conceptualize the firm-specific
advantages of Hymer’s approach and internalization in a different way. The classical FDI
theories are mostly based on the economic perspective on FDI. First, cost efficiency (or
transaction costs elimination) is the main reason for MNCs going abroad based on the
hierarchy instead of transactions of firm-specific assets through market. Second, the
firm-specific advantages are examined based on the industrial organization theory
(Porter, 1980), which argues the market power is determined by the bargaining power
(or market position) against a broader scope of competitors (i.e., five forces of an
industry). Such market power is manifested mainly in the firms’ final product (e.g.,
market share) (Forsgren, 2013). Third, although Dunning’s firm-specific advantages are
based on the business perspective, they still lack an explanation about how these firms’
assets are created. In this respect, the OCV can complement the earlier theories by
focusing on conceptualizing the firms’ ownership advantages from the business
perspective. The following adopts the three main theories in the field of strategic
management dealing with the sources of firms’ competitive advantages with different
focuses
Resource-based View (RBV)
The RBV is useful in explaining why some firms have superior performance at a specific
point in time, which is often argued by traditional FDI theories as the base for MNCs’
going abroad to overcome the costs of foreignness. The RBV argues that in order to
maintain a superior advantage against the rivals, firms should have some resources which
are difficult to be replicated and imitated. Barney (1986) theorized the RBV, while
7 The information of section is abstracted, reorganized, and extended from Forsgren (2013), Moon (2016a), and Moon (2016b).

24
Penrose (1959) provided the preliminary idea of RBV. Barney (1991) categorized the
resources into physical capital resources, human capital resources, and organizational
capital resources8, and introduced four criteria (i.e., valuable, rare, inimitable, and non-
substitutable) for resources that can make firms sustain their competitive advantages.
Some other scholars (e.g., Peteraf, 1993; Priem and Butler, 2001) criticized that
Barney’s interpretation on the RBV mainly focuses on the resource itself, which is not
sufficient to guarantee firms to sustain their competitive advantages, and argued that the
concept of capability of exploiting, leveraging, and managing resources should be
incorporated. Moreover, RBV is also criticized for being static and cannot satisfactorily
explain firms’ capability of achieving competitive advantages in the volatile and fast-
changing business environment.
Dynamic Capability View (DCV)
DCV is developed by Teece et al. (1997) to complement the RBV for explaining how
firms’ heterogeneity arises and how to sustain competitive advantages in a rapidly
changing environment. According to Teece et al. (1997), DCV is defined as “the firm’s
ability to integrate, build, and reconfigure internal and external competences to address
rapidly changing environments. Although there are various definitions on dynamic
capabilities, they commonly stress firms’ capability of reorganizing, modifying, and
creating resources to upgrade the current resources and achieve new and innovative form
of competitive advantages (Winter, 2003).
8 Physical capital resources include physical technology used in a firm, a firm’s plant and equipment, its geographic location, and its access to raw materials. Human capital resources include training, experience, judgement, intelligence, relationships, and insight of individual managers and workers in a firm. Organizational capital resources include a firm’s formal reporting structure, its formal and informal planning, controlling, and coordinating systems, as well as informal relations among groups within a firm and between a firm and those in its environment (Barney, 1991).

25
Unlike resources, dynamic capabilities cannot be bought through market
transactions, but are built within a firm, and thus they are path dependent. However, there
is still no consistent conclusion regarding whether dynamic capabilities can lead to the
sustainable competitive advantages. For example, Eisenhardt and Martin (2000) argued
that dynamic capabilities can make firms achieve new competitive advantages but cannot
make firms sustain such competitive advantages in the long run, particularly in high-
velocity and unstable markets.
Evolutionary Theory
A critical issue of OCV is MNC’s ability to replicate such capabilities across
geographical locations and various cultural contexts. However, it is always not possible
for MNCs to transfer their organizational routines and skills from home country to
foreign countries. In this respect, evolutionary theory can address the transfer issues in
a more detail manner. Kogut and Zander’s (1992) combinative capabilities and
Cantwell’s (1989, 1991, 1994) evolutionary theory are useful to address this issue.
Compared to other theories from OCV perspective, Kogut and Zander’s (1992)
combinative capabilities stress the need to combine firms’ extant knowledge and
resources with external knowledge outside the firm. By reconfiguring and recombining
the extant available stocks of resources and knowledge, firms can create new values and
competitive advantages. The external knowledge is derived from the consumer markets,
a certain location (i.e., clustered firms) or firm’s networks. MNCs thus can combine
knowledge from different locations through transfer within the firm. Unlike the
internalization theory, Kogut and Zander (1993) argued that the internalization of cross-
border activities by MNCs is not because of the market failure, but because of its superior
efficiency in knowledge transfer within the firm hierarchy. The authors suggested that
MNCs are the vehicle of knowledge generation and transfer, and firms will not choose
external but internal transfer of tacit knowledge and know-how which are difficult to
codify and teach.
26
Consistent with the logic of Kogut and Zander’s combinatory theory, the main idea of
Cantwell’s evolutionary theory is that the superiority of MNCs comes from their globally
dispersed networks of production, which allows MNCs to access to various and valuable
local resources and capabilities. The inter-linkage between location-specific advantages
combined with MNCs’ foreign subsidiaries and their own core competences can help
MNCs create new values and advantages. However, compared to Kogut and Zander’s
theory, Cantwell’s theory not only concerns the organizational advantages, but also how
these advantages develop over a certain period of time.
2.2.2. Literature on Unconventional FDI Theories9
2.2.2.1. Distinctive Characteristics of Unconventional FDI
The unprecedented rise of MNCs from emerging economies since the 1990s have
inspired a huge number of studies over the past three decades. The traditional FDI theory
led by Dunning’s OLI paradigm is often criticized for not fully explaining the
international behavior of multinationals from emerging economies (Moon and Roehl,
2001). The following will explain the distinctive characteristics stressed by preceding
studies on emerging country MNCs’ outward FDI in terms of three elements of
Dunning’s OLI paradigm (see Table 2.5).
9 This section is abstracted and extended from Yin (2015).

27
Table 2.5. Comparison of Studies on Conventional and Unconventional FDI
Conventional Unconventional Studies
Ownership advantage
Different types of O advantages To address competitive
disadvantages
Cui et al. (2014), Luo and Tung (2007), Makino et al. (2002), Mathews (2006), Moon and Roehl (2001), Rui and Yip (2008), Ramaurti (2012)
Location advantage
Distinct determinants of location choice (e.g., home country related factors, network)
Buckley et al. (2007), Chen and Chen (1998), Cuervo-Cazurra and Genc (2008)
Internalization advantage
Risky and aggressive internationalization process for catch-up
Liang et al. (2012), Liu et al. (2008)
The differences between developed and developing-country MNCs regarding
ownership advantages are mostly stressed by the previous studies. MNCs from emerging
countries do not possess any significant firm-specific advantages when they engage in
the overseas investment in more developed countries. Moon and Roehl (2001)
introduced a new theory – imbalance theory – to explain the different patterns of
motivations of emerging firms’ FDI. The essence of this theory is that the motivation of
FDI does not have to be the ownership advantages, but also the disadvantages, or the
balance between the two. The upward investments undertaken by emerging firms
towards advanced countries are mainly driven to compensate for their disadvantages. By
acquiring and learning foreign technologies and other strategic assets which are not
available at home countries, they can build up their resources and strengthen other
competitive advantages. The FDIs motivated by the ownership advantages are often
regarded as the conventional ones, while the FDIs motivated by the disadvantages are
the unconventional ones. Emerging MNCs’ OFDI should include both conventional and
unconventional FDIs, but traditional FDI theories are only concerned with the
conventional motivations.

28
Moon and Roehl’s (2001) work has provided a theoretical foundation for later
studies on emerging firms’ FDI. Although they utilized different terminologies or
developed alternative frameworks or models, the basic argument is consistent with Moon
and Roehl’s (2001) imbalance theory. For example, Li (2003, 2007) argued that the
emerging firms’ FDI is not to exploit their ownership advantages abroad, but to address
their ownership disadvantages and seek the advantages which are necessary for
competing in the global arena. Another important study (Luo and Tung, 2007) also
argued that emerging MNCs use international expansion as a springboard to acquire
strategic resources and reduce their institutional and market constraints.
Hedlund and Ridderstrale (1997) incorporated exploitation and exploration (March,
1991) in the international business research and argued that the existing dominant theory
mainly explained about exploitation but ignored the exploration perspective. Mathews
(2006) then introduced the LLL (Linkage, Leverage, and Learning) framework and
illustrated how the latecomer MNCs, even without prior possession of significant
resources, improve their competitiveness and catch up with the industrial leaders.
Makino et al. (2002), on the other hand, showed that FDI from the newly industrialized
economies had the characteristics of both asset-exploiting and asset-seeking FDI,
depending on the country-specific factors of the host country as well as the firms’ degree
of the capabilities. Makino et al.’s (2002) asset-exploiting FDI can be linked to
conventional FDI and the asset-seeking FDI linked to unconventional FDI.
Regarding location advantages, Buckley et al. (2007) found that in addition to the
traditional location factors that attract Chinese FDI (e.g., host market size, natural
resources, geographic proximity), Chinese firms tend to invest more in host countries
with high levels of political risks and cultural proximity to host countries. Chen and
Chen’s (1998) study extended Buckley et al. (2007) in terms of the influences of network
linkage on emerging firms’ FDI location choice. This study distinguished the network
into strategic linkages and relational linkages. They found that the former type motivated
Taiwanese FDI in the US, while the latter type facilitated Taiwanese FDI in Southeast
Asia. Cuervo-Cazurra and Genc (2008) argued that emerging country MNCs are more

29
prevalent among the largest foreign firms in the least developed countries, especially in
those countries with poorer regulatory quality and lower control of corruption. This is
because compared to the developed country MNCs, developing country MNCs are more
familiar with the underdeveloped institutional environment of developing countries, and
thus they can better deal with such difficult situations.
Lastly, unlike conventional FDI by developed country MNCs which pursue more
gradual global expansion, developing country MNCs adopt more aggressive
internationalization processes for catch-up. Liang et al. (2012) found that the relative
advantages and disadvantages of Chinese private enterprises against state-owned
enterprises and foreign-invested enterprises at home affect their risk-taking tendency
when going abroad. Liu et al. (2008) found that in spite of the lack of knowledge and
international experiences, the entrepreneurship promoted Chinese firms to expand
abroad without the need to wait until they accumulate enough knowledge on foreign
markets and international operations and management. One of the reasons behind this is
that the highly motivated entrepreneurs could help them identify the international
business opportunities and develop the needed international operations through all
available means and resources.
2.2.2.2. Motivations of Chinese Outward FDI
Although several studies have investigated Chinese motivations for investing abroad,
they have not fully covered a comprehensive picture of Chinese OFDI. Yin (2015)
provided a new comprehensive framework to examine the various FDI motivations of
Chinese firms (see Table 2.6). Among the 10 types of motivations, four types are
categorized as conventional FDI, while the other six types are considered unconventional
FDI. This framework not only incorporated the motivations mentioned by the existing
studies, but also added two new ones: market-learning 10 and labor-management
10 The motivation of market-learning by emerging firms has been mentioned by earlier studies

30
relations. Various types of investments can now be succinctly contrasted in this new
framework.
Table 2.6. Types of Chinese FDI Motivations
Factor conditions 1-1 Natural resource
1-2 Cheap labor
1-3 Strategic asset-seeking *
Demand conditions 2-1 Market-seeking
2-2 Market-learning *
Related & Supporting Industries 3-1 Network relations
3-2 Infrastructure *
3-3 Regulation-bypassing *
Firm Strategy, Structure & Rivalry 4-1 Labor-management relations *
4-2 Strategic location *
Source: Yin (2015) Note: (1) * represent the unconventional motivations. (2) The framework describing Chinese firms’ FDI is modified and extended by Moon’s (2007) framework for explaining Korean firms’ FDI.
This study has found that both the conventional and unconventional motivations
significantly affect Chinese Outward FDI. Existing empirical studies perceive each
motivation separately. This paper, however, by utilizing the factor analysis and
regression, conducted an empirical test to explain which motivations have more similar
locational distributions when Chinese firms engage in overseas investment. Therefore,
not only conventional but also unconventional investment activities appear at the early
stage of Chinese FDI.
of Moon and Roehl (2001) Moon (2007).

31
Yin (2015) also distinguishes the asset-seeking FDI of scientific and commercial
technologies. It finds that the former one (asset-seeking FDI of scientific technology)
tends to flow into advanced countries that have advanced institutions, developed
infrastructure, and sophisticated market, while the latter (asset-seeking FDI of
commercial technology) goes to both developing and developed countries that possess
large market and overseas Chinese populations. Therefore, unlike the general
assumption that the asset-seeking motivation only occurs among advanced countries, the
empirical test shows that it also happens in the developing countries.
2.2.3. Limitations of FDI Approach for GVC Analysis
Ever since the popularity of GVC, it has been widely incorporated in various disciplines
such as international political economy, economic geography, and managerial studies,
but less discussions are made in the literature of international business (IB) (De Marchi
et al., 2014). However, some studies (e.g., Vahlne and Johanson, 2013) suggested that
IB literature, centered on explaining the value creation and transfer within the MNC
boundary, needs to be enriched by incorporating the literature on non-equity modes of
MNCs’ internationalization strategy, in order to better understand how MNCs orchestrate
and manage the dispersed activities around the world. The challenges of FDI literature
can be summarized from the following several perspectives.
First, FDI literature mainly concerns the knowledge and value creation and transfer
with the MNC boundary. Therefore, MNC becomes the center of the intra-firm (or
internal) network of cooperation. However, in the GVC context (or global networks of
value-added activities), which includes both internal and external networks of
cooperation, MNCs are no longer located at the center of the intersecting networks, and
there could be multiple centers (Giroud and Mirza, 2015). The key component suppliers
could also be positioned as the leader of the value chain networks.
Second, many topics of FDI theories (e.g., motivations, location choice, entry
modes) are often discussed at the level of investing firms (or MNC) or their entire value

32
chain level. However, as the activities or functions comprising the value chains shift
toward more fragmented and modularized, these topics face rising challenges. Giroud
and Mirza (2015) suggested a general idea that determinants of motivations, location
choices, and modes should be different depending on the functions in the value chain.
For example, regarding the determinants of governance mode of R&D activity,
intellectual property regime could be more influential factor for FDI mode, whereas
R&D capabilities of partner affect more for non-equity modes. Some other studies (e.g.,
Azmeh and Nadvi, 2014) found that Asian pivotal garment firms have expanded their
operations through FDI mode, but the location choices for their foreign investment are
determined by their GVC engagements. Despite these challenges, the above two main
limitations can be complemented by the literature on NEM approach.
2.3. The NEM Approach and Its Limitations
At the firm level, there are two main types of value chain relationships, through which
firms create and transfer values and knowledge among actors involved in the value
chains. One is intra-firm network through FDI (or vertical relationship), and the other is
inter-firm network through non-equity modes (or horizontal relationship). In the past,
MNCs established their international production networks mainly through equity
holdings or FDI mode, by owning and controlling their overseas affiliates in host
countries. However, nowadays, MNCs increasingly externalize parts of their activities
in their global value chains, thereby incorporating both affiliates and partners firms from
both home and host countries (UNCTAD, 2011). In spite of the importance of non-equity
modes for value creation, this has been less incorporated in the FDI theories. Instead, the
inter-firm relationship through various contractual agreements is theorized by other
various studies, using different terminology such as business network, commodity chain,

33
supply chain, and value networks.11 The following will explain and discuss the key idea
of each concept and the differences as well.
2.3.1. Business Network Theory
The network theory was proposed by scholars from the field of strategic management to
explain the sources of competitiveness of the firm. The business network is defined as
“the structure of interdependent relationships between the activities of a given firm and
those of other firms in its competitive environment that influence each other’s strategies.”
(Kambil and Short, 1994). Traditionally, there are two main theoretical streams, namely
industry-based view and resource-based view, to explain the different performances
among firms within the same industry. The former focuses on the influences of external
factors, or industry structure on firms’ competitive advantages, whereas the latter
emphasizes the internal factors, or the sources possessed by the firm which lead to the
heterogeneity among firms. In contrast with both views on competitive advantages,
network theory looks at the inter-firm relationships for the sources of competitive
advantages. Firms can enhance their competitiveness by exploiting the synergy created
among firms, and such relationship is often difficult to be emulated by the rivals, and
can lead to superior performance in the market.
The inter-firm relationship can be distinguished into two types depending on
whether they are intentionally or unintentionally formed (Moon, 2016a). The former
type is formed through various format of contractual agreements, which defines and
requires a certain engagement of involved parties. The latter type of network is often
established when firms are geographically close to each other, or through clusters.
Krugman (1979, 1980, and 1991) introduced three main benefits of locating in a cluster
11 The current literature on GVC mainly focuses on the inter-firm relationship established through contractual agreement. The GVC concept in this study, on the other hand, refers to a more comprehensive concept, including all governance modes for explaining the value creation and transfer both within and outside the firm.

34
which are economies scale, greater consumption diversity, and lower transportation costs.
Porter (1990), on the other hand, introduced a more comprehensive framework – named
diamond model – in order to explain the cluster effects and competitiveness (see more
details in Chapter 3 and 4 for cluster theories and practices). Thus, the cluster perspective
can explain why firms prefer to situate themselves in the competitive clusters to exploit
the knowledge or resources which cannot be found otherwise.
The above business network theory is limited to the relationship with business
partners. Portes and Sensenbrenner (1993), on the other hand, extended the relationship
by incorporating the network with competing firms and customers. They also defined
the inter-firm network in a broader scope by incorporating the social capital (e.g., social
norm and values). Through these social network, firms can have better access to special
resources (e.g., capital, government support, special information), which facilitate them
to create higher values than those without these channels and networks. Such social
networks particularly play an important role in underdeveloped market system and
institutional system. For example, during Korea’s earlier development stage, the inter-
relationship between the government and large firms played a significant role in
nurturing Chaebol and efficient allocation of resources.
2.3.2. Global Commodity Chain
Global commodity chain (GCC) (Gereffi, 1994), based on world-system theory and
organizational sociology, aims to analyze the dynamics and structure of global industries,
and the issues of authority and power relationships among participating firms (Bair and
Gereffi, 2001; Mahutga, 2012). The leading firm refers to the firm that shapes, controls,
coordinates, and distributes values in the industry value chain (Hernández and Pedersen,
2017; Mahutga, 2012). The power relationships determine the allocation and flow of
financial, material, and human resources in the chain (Gereffi, 1994).
Depending on the drivers of the chain, Gereffi (1994) distinguished into two types
of governance structure for GCC: producer-driven and buyer-driven commodity chains.

35
There are two main differences between the two types of GCCs. First, industry
distribution is different. Producer-driven commodity chains arise from capital intensive
and durable goods industries (e.g., automobile industry), whereas, buyer-driven
commodity chains mainly arise from non-durable and labor intensive industries, such as
garment, footwear, and toy. Second, the role of leading firms is different. In the producer-
driven GCCs, producers conduct the activity of manufacturing, design, R&D, and
marketing, and control the backward linkages (with suppliers of raw materials and
components), and forward linkages (with distribution and sales agents). On the other
hand, in the buyer-driven GCCs, the leading firm is the main buyer of the final products,
while mainly taking charge in the activities of design, marketing, and retail, whereas the
production related activities are decentralized to numerous outside suppliers.
However, the typology of producer and buyer-driven GCCs is often criticized for
its static description of a given industry. Azmeh and Nadvi (2014) summarized the main
limitations as follows. First, oftentimes a certain industry shifts from producer to buyer-
driven or vice versa, or even mixed of both governances. Second, the relationship
between the leading firm and suppliers is not fixed, and sometimes the first-tier supplier
shows increasing power and ultimately emerges as the leading firm. Third, due to the
growing degree of outsourcing across various industries, the distinction between buyers
and producers erodes over time. By stressing the above issues, Gereffi et al. (2005)
introduced three alternative network-types of governance modes, including modular,
relational, and captive governance structures. Theses governances are determined by
three criteria: complexity of transactions, ability to codify transactions, and capabilities
of suppliers.
However, these alternative governance structures are still limited to the industry
analysis, and thus a good analytical framework for governance structure for activity
based at the firm-level is needed. Moreover, these criteria focus on the economizing
conditions (i.e., transaction costs) and less on the benefits of value creation through
transactions.

36
2.3.3. Global Supply Chain
Supply chain concept is derived from Porter’s (1985) value chain, which comprises five
primary activities and four support activities. The supply chain then incorporates the
three out of five primary activities, including inbound logistics, operation, and outbound
logistics (Priem and Swink, 2012). Supply chain management emphasizes the
relationship between a firm and suppliers outside and inside the firm which collectively
transform the raw materials into the final products and deliver them to the customers
(Hult et al., 2007).
As the growing influences on the management of supply chains, firms realize that
suppliers, partners, and customers who have great potential to value creation to their
operations do not necessarily locate within the national borders. This encourages a
growing research extending the dimension of supply chain management from domestic
to international scope (Connelly et al., 2013). Priem and Swink (2012) argued that the
efficient supply chain management can be sources of sustainable competitive advantages
for firms. However, in contrast to popular practice in global supply chain management
among MNCs, the concept and theoretical perspective are still underdeveloped and
fragmented (Hult, 2004).
2.3.4. Value Networks
A value network is defined as value generation through complex dynamic exchanges
among firms, customers, and suppliers, and the community (Allee, 2000). It is an
organizational network, composed of various actors collaborating for a service delivery
(de Reuver and Bouwman, 2012). It is different form business network, which is a
broader concept, encompassing both cooperative and competitive relationship.
The concept of value network (Peppard and Rylander, 2006) is developed to address
the limitations of Porter’s (1985) value chain in explaining firms’ practices in the real
world. Porter’s value chain emphasizes the flow of value creation in the traditional

37
manufacturing industry, by transforming the tangible/physical raw materials and
components into the finished products. However, nowadays the consumer products in
many manufacturing sectors require a certain degree of service content. For example,
Porter’s inbound logistics mainly refer to procurement of inputs for hardware (raw
materials and components), but manufacturing of some devices (e.g., smartphone) also
requires the procurement of software inputs and other intangible content as well. These
intangible inputs are not well addressed in Porter’s value chain (Campbell and Wilson,
1996).
Moreover, Porter’s value chain emphasizes the linear flow of value generation from
inputs to outputs, whereas the value network has non-linear, horizontal, and dynamic
relationships (de Reuver and Bouwman, 2012). Each unit or actor in the value chain has
its own position or role, but the value network’s distinction becomes less clear as value
is co-created by a combination of various players (Allee, 2000). For example, customers
can also participate in the production process for developing and improving the quality
of the products.
2.3.5. Activities to Be Outsourced
The literature on outsourcing has emerged under the NEM approach to explain which
areas should be maintained within the firm, and which areas should be externalized for
value maximization. With the rising GVC, MNCs’ activities become more finely sliced.
The value chain is not just divided into nine general activities (five primary and four
support ones), but each activity is also sliced up further into numerous smaller sub-
activities (Contractor et al., 2010; Moon, 2010). Not just the low-end activities but also
high-end functions are increasingly outsourced. For example, in the past MNCs often
internalize the entire R&D function (considered as the core activity by many firms)
within their parent firms in the home country, but currently it becomes more
disaggregated and firms often outsource some sub-activities of the R&D function to their
partners (Grimpe and Kaiser, 2010).

38
In the past, scholars explained that firms’ activities are divided into core and non-
core activities, and non-core activities are often selected by firms as the areas of
outsourcing in order to reduce the cost and enhance the efficiency of those activities.
However, nowadays the core activities are further sliced into true core activities and
essential activities (e.g., Contractor et al., 2010; Quinn, 1999). The true core activities
are often the core competences of the company which perform better than others and are
internalized within the firm, but essential activities are outsourced along with the non-
core activities. This thus requires MNCs to select appropriate governance and even
combine various governances to effectively perform each function of the value chain and
create higher values to the consumers. Therefore, the entry mode decision should be
made at more finely-sliced activities. In reality, a pure form of governance is seldom
found in the firms’ value chain; instead, firms always maximize the utility of each mode
through various combinations of different scales of governance depending on the firms’
status and their surrounding environment.
2.3.6. Limitations of NEM Approach for GVC Analysis
Various theories from the NEM approach commonly stress the role of relationship
among actors involved in the value chain in value creation. Despite the advantages of
NEM approach, there is a critical limitation. As the NME approach shifts the focus of
research from firm-specific analysis to inter-relationship among various actors, the
nature of the firm, MNC in particular, is neglected. For example, Gereffi et al.’s (2005)
framework for determining the three network-based governances in the value chain
mainly concern the nature of knowledge to transfer and the capabilities of suppliers or
partners. For the governance mode analysis, there could be four strategic parameters to
concern: what is to be produced, how it is to be produced, when it is to be produced, and
how much is to be produced (Saliola and Zanfei, 2009). Without regarding the firm’s
nature, the NEM approach cannot well explain when and how much to be produced,
which are highly influenced by the firm’s organizational characteristics.

39
2.4. Implications for Theoretical Integration
This study combines three different streams of literature (trade, FDI, and NEM) for
analyzing the strategic options of value creation and transfer in the context of GVC in a
more comprehensive way. The three approaches highlight different elements but they are
in fact complementary to each other (see Figure 2.2). First of all, the trade approach
emphasizes the value added in intermediate inputs at each stage of internationally
fragmented production networks (what to be produced), but does not concern how these
values are created and by whom. In this respect, FDI and NEM approaches can
complement with trade approach. FDI approach focuses on the value creation through
the internal organizational network across national boundaries, whereas NEM approach
investigates the influences on the inter-organizational network on value creation.
Secondly, trade approach mainly deals with the international production network,
or the upstream activities in the value chain. FDI approach encompasses a broader scope
of value chain activities, but focuses primarily on the value creation of manufacturing
industries and service sectors are far less concerned. In this respect, the NEM approach
complements the other two approaches by incorporating the value creation of all value
chain activities and giving equal weights for both manufacturing and service industries.
Thirdly, for trade approach, the trade and production patterns are mainly determined
by the comparative advantage of nations, which is less sensitive to the external changes
over time. On the other hand, the focus of FDI approach is the internal linkages and
organizational structure within the firm hierarchy, and the relationship with
environmental factors is not the key issues. However, the focus of NEM approach is the
nature of relationship with both business partners from different industries and actors
from non-business sector (e.g., community). Therefore, it can better capture the dynamic
flows or the changes of activities along the chain.

40
Figure 2.2. Three Different Approaches to GVC

41
Last but not least, the three strategic options for value creation are not fixed forever.
MNCs often flexibly combine two or all the three options for conducting one specific
value chain activities or shift from one to another option. The following section will
discuss the two issues in more detail.
2.4.1. Combination of Various Options for Value Maximization
Existing studies on MNCs’ entry mode when entering the host country mainly consider
the entire value chain or even without distinguishing whether it is for the entire value
chain or specific value activities. In other words, their studies on the determinants of
entry mode are about choosing one dominant mode of governance to another. However,
each governance has its own disadvantages in dealing with the public goods and
externalities (Erkus-Öztürk and Terhorst, 2010). For example, externalization modes
(e.g., trade, NEMs) lack internal control and enforcement authority; internalization (e.g.,
FDI) has higher control for the internal divisions, thereby lacking the flexibility in
responding to the markets and incurring higher costs than benefits. Therefore, combining
various modes of governance can better and more flexibly respond to the environmental
changes.
For example, after the 2008 financial crisis, Samsung Electronics accelerated its
investment in Vietnam and currently almost 50% of its smartphones are assembled in
Vietnam and many of its high value-added parts and components are imported from
China and Korea. However, due to the local government’s pressures to employ more
local suppliers to improve their production network and capabilities, Samsung also
began to outsource to more Vietnamese firms. By the early 2016, 63 Vietnamese firms
joined Samsung’s supply chain, out of which 11 are first-tier suppliers, and the other 52
are second-tier suppliers.
Samsung’s investment in Vietnam shows that for procuring the parts and
components Samsung has extended its major governance of trade and FDI to
externalization mode by incorporating more local suppliers for producing some

42
intermediate inputs. The addition of externalization mode helps Samsung not only
reduce the production costs but also flexibly respond to the market changes.
2.4.2. Shift in the Strategic Option from Trade to FDI Approach12
In order to induce MNCs’ (including the US local firms) investment to the US and retain
US-based firms from shifting their manufacturing plants outside the country, the Trump
administration proposed high tariff rates for imported goods produced overseas whereas
low corporate tax for companies doing business in the US. Specifically, during the
election period, Trump announced the reduction of corporate tax from 35% to 15%, the
second lowest to Irish among OECD countries. He also proposed imposing 45% of tariff
against the imported goods from China and 35% of tariff against the imports from
Mexico.
The automotive industry is the first target of Trump’s protectionist policy. He
pressed on by saying that if the US firms (e.g., Ford) or even foreign automotive firms
in the US (e.g., BMW, Toyota) offshored their production facilities to overseas countries,
those cars produced in foreign countries and exported to the US will face high tariffs. In
order to effectively respond to the US government and not to lose the business
opportunities in the US, MNCs flexibility changed their extant export (or manufacturing
in overseas countries and export to the US market) oriented strategy to FDI strategy.
Table 2.7 lists the main automotive companies which announced to expand their extant
scale of manufacturing plants or pursue new investments in the US.
12 This section is abstracted and modified from Moon and Yin (2017b).

43
Table 2.7. The Key Investments in the US in Response to Trump’s Trade
Protectionist Policy
Firm Investment ($ billion)
Motivation
Ford 0.7 • The US: To produce electric cars and SUVs • Mexico: To produce small passenger cars
GM 1 To increase vehicle production (decision made years before the Trump administration)
Fiat Chrysler 1 To upgrade plants
Toyota 10 To meet demand and upgrade plants to build more fuel-efficient models.
Hyundai 3.1 To develop self-driving and eco-friendly cars
Daimler 1.3 To expand production facilities in Alabama (The increasing demand for SUV in the US)
However, what should be noted is that the shift by MNCs form trade to FDI strategy
needs some additional conditions. Their strategic changes are not simply the results of
the government pressure and threats, but based on business reasons. Ford’s case can be
a good example. On January 3, 2017, Ford announced that it would cancel its $1.6 billion
investment project in Mexico and initiate a $700 million investment for establishing
factories producing electric and self-driving cars. However, the Economist (2017/1/5)
analyzed Ford’s investment strategy as not “a U-turn” but “a wheel-spin.” The products
planned to be produced in Mexico and the US factories are different. The Mexico
factories mainly produce the small-sized and fuel efficiency cars. Due to the recent
decreasing demand in small cars, Ford in fact has already considered reduction in the
scale of small-sized cars. Therefore, the cancellation of investment in Mexico is
consistent with the interests of Ford, instead of being a reluctant response to the Trump
pressure.
By looking at the investment cases of other industrial companies, we can find an
important logic behind MNCs’ decision making for changing the governance mode from

44
trade to FDI. The shift toward the strategic option of FDI is largely affected by the
investment attractiveness of host countries. Ashe US is one of the most attractive
countries in the world for investment, MNCs need to flexibly consider their strategic
options for entry, including FDI as well as exporting.13.
2.4.3. Shift in the Strategic Option from FDI to NEM Approach
Samsung Electronics is well known for its internalization strategy (i.e., FDI) when going
abroad. Recently, it is rumored that Samsung will expand the portion of production of
low- and medium-end smartphones, because of the saturation of high-end smartphone
market but fast-growing demand from emerging markets such as China, India, and
Vietnam. However, the result appears the opposite. Samsung seems to shift its strategy
by accelerating outsourcing production of low- and medium-end of smartphones to
Chinese firms, whereas it concentrates on producing high-end smartphones (Ubergizmo,
2013/11/13). It was estimated that the percentage of outsourcing would be over 10% out
of its total smartphone production (ET News, 2013/11/12).
One of the most successful examples is Galaxy Trend Duos, the smartphone that
Samsung outsourced to the subcontractor of Zhonghuan Telecommunication in Tianjin,
China. This model is exported to many developing countries including India, and the
price sold in India is only around $150. The accumulated production of this smartphone
model has exceeded 10 million units. Although the subcontractor of Zhonghuan
Telecommunication is a joint venture created by Samsung in Tianjin, it shows a
Samsung’s production strategy shifting away from the full internalization (e.g., FDI)
towards partial externalization. It needs further investigation whether it will remain the
current model of outsourcing to joint ventures or passing the production to the
completely independent third subcontractors in the following years.
13 This is consistent with location of Dunning’s OLI paradigm.

45
Through outsourcing, Samsung could relieve the pressure from the trade-off
between sales and profits. Many argue that the major reason behind Samsung’s
outsourcing decision is driven by the cost reduction. In spite of the importance of cost
factor, this perspective does not capture the entire picture. Another important driving
force for Samsung’s opt to outsourcing is to quickly adjust to the substantial growth of
demand for low- and medium-end smartphone from emerging markets. In addition to the
speed factor, there are some other driving forces for consideration. More details
regarding the conditions for firms’ externalization will be discussed in the following
Chapter 3.
46
CHAPTER 3. THEORETICAL EXTENSION
The previous chapter discussed the theoretical integration by combining three main
streams of literature on the organizational governance for value creation and transfer
along the GVC. Each of the three approaches provides significant contributions with
different focus, but also shows limitations which can be effectively complemented by
one another. On the other hand, there are also rooms for further development of each
approach, which is the focus of this chapter.
Specifically, the trade approach stresses the comparative advantage (e.g., cheap
labor) of nations for determining the locations of fragmented international production
networks. However, this cannot well explain why many MNCs do not move their extant
manufacturing bases in spite of the substantial increase of labor costs in some developing
countries (e.g., China) compared to other cheaper countries. In this respect, this chapter
suggests the cluster perspective for analyzing the location choice of MNCs. Second, for
foreign direct investment (FDI) approach, this chapter mainly deals with the limitations
of the most widely cited index for measuring the degree of MNCs’ globalization, which
is UNCTAD’s transnationality index (TNI), and suggests a direction for further
improvement. Lastly, as for the non-equity mode (NEM) approach, this chapter stresses
the issue of conditions of MNCs for choosing NEM mode, which cannot be sufficiently
explained by existing studies. After proposing the three possible theoretical extensions,
this chapter particularly focuses on the third extension by introducing three conditions
for firms to choose the NEM approach instead of internalizing the activities in the GVC.

47
3.1. The Trade Approach: From National to Regional Level
3.1.1. Two Important Scholars in Cluster Theory
The study on cluster has been initiated since Marshall (1920[1890]), yet Paul Krugman
and Michael Porter are the two well-known scholars for their significant contribution to
the development of cluster theories.
3.1.1.1. Krugman (1979, 1980, 1991)14
Paul Krugman, the Nobel Prize winner in Economics in 2008, made a substantial
contribution to linking the two fields, trade and economic geography. International trade
and the location of economic activity have been two important research topics in
economics. However, the two streams of literature on trade theory and economic
geography have been separated for centuries. Scholars have paid greater attention to
combining the two areas, by emphasizing the same drivers that simultaneously determine
the specialization of a country in the international production networks (trade theory)
and the location of economic activity (economic geography).
Among his numerous articles published in the fields of trade and economic
geography, the three articles published in 1979, 1980, and 1991 are the most influential
for linking the two literature.15 His 1991 article introduced a core-periphery model,
which analyzes the allocation of population and economic activity between the regions
of core and periphery. He explained that firms tend to locate themselves in larger markets
to exploit economies of scale and reduce transportation costs, and individuals tend to
14 The literature review on Krugman’s contribution in cluster theory is abstracted and modified from Moon and Jung (2010) and Prize Committee of the Royal Swedish Academy of Sciences (2008). 15 The 1991 article is regarded as the seminal work, but the origin of the idea can be found in his 1979 article.

48
move to more populated regions, which offer higher welfare benefits coming from
greater consumption diversity. This diversity can further strengthen the market size,
which provides incentives for firms to migrate. Krugman highlighted the relationship
between economies of scale and transportation costs that can result in either
concentration or decentralization of communities. This perspective became the
foundation of the cluster theory.
Krugman’s (1991) general idea in his new approach to economic geography comes
from his earlier articles of 1979 and 1980 which discuss the determinants of trade
patterns. The traditional trade theories stress the importance of comparative advantage
in determining the patterns of international trade. However, Krugman (1979) argued that
even lacking the significant comparative advantage, trade can still occur due to
economies of scale and imperfect competition. This article served as the seed to a new
geography by showing that economies of scale can also explain the location of economic
activity. He argued that firms can obtain cost reduction by exploiting economies of scale
(i.e., expanding the production), and then he explained that firms tend to locate
themselves in larger markets to exploit economies of scale.
Krugman (1980) extended his 1979 article by incorporating transportation cost
factors which are important to international trade, because lower costs in transportation
will encourage higher growth in trade. On the other hand, firms tend to locate the
production near the largest market, and transportation costs can thus be minimized.
3.1.1.2. Porter (1990, 1998, and 2008)16
Porter (1990) expanded the view on the cluster theory from Krugman’s economic
geography. In fact, the key elements that Krugman proposed for geographic
concentration are just three of the four determinants of Porter’s diamond model – factor
16 The literature review of Porter’s cluster’s theory is abstracted and modified from Ketels (2011), Moon (2016a, 2016b), Moon (2017a), Moon and Jung (2010), Moon et al. (2013).

49
conditions, demand conditions, and related & supporting industries, in particular.
Porter’s work on clusters is the most influential compared to other works by economic
geographers, and his notion of cluster has since become the standard in the field (Martin
and Sunley, 2003). Previous studies emphasize specific aspects of clusters, but Porter’s
framework is more comprehensive and focuses more on providing practical implications
for policy makers. He tried to link the cluster to the competitiveness of firms, regions,
and nations. His work is also easier to understand and more readily applicable in practice,
effectively filling the gap between theory and practice (Martin and Sunley, 2003).
Accordingly, his work has attracted a broader attention from business managers,
governments, and other cluster practitioners (Ketels, 2011).
Porter’s cluster study was informally introduced in his well-known book, The
Competitive Advantage of Nations (Porter, 1990). He found that the competitiveness of
a nation usually draws on some internationally competitive industries17, rather than all
the industries. These competitive industries are often concentrated in a particular region
within a nation. Porter then systematically organized the cluster theory in Chapter 7 in
his 1998 book On Competition, and later expanded it in 2008. His cluster studies have
shifted the economic focus from industries/firms to regions/nations, and from
competition to embracing both cooperation and competition for building competitive
advantages.
Porter (1998: 199) defined cluster as “a geographically proximate group of
interconnected companies and associated institutions in a particular field, linked by
commonalities and complementarities.” Therefore, the two core elements of cluster can
be identified—geographical proximity and inter-linkage among the involved companies
and organizations. The geographical scope of cluster can be a city (e.g., Bangalore’s IT
cluster), a state (e.g., California’s wine cluster), or a country (e.g., Italy’s nation-wide
fashion cluster). Porter categorized the players within the cluster into four types: (1) the
17 By cooperating with international scholars from 10 countries, Porter studied the most competitive industries of each of the 10 countries, including eight developed countries and two developing countries (Korea and Singapore).

50
end-product or service companies; (2) suppliers of specialized inputs, components,
machinery, and services; (3) financial institutions, firms in related industries and other
intuitions (e.g., universities, government); and (4) downstream industries (e.g.,
consumers). The linkage among these players is created through either competition or
cooperation. On the other hand, although proximity is important, what is more critical is
the inter-linkage among firms and organizations.
Due to the increasing globalization and deceasing cost of transportation and
communication, firms nowadays can easily outsource capital, information, materials
from abroad on the global scope. Hence, many argue that the locational advantage or the
role of location in competition will necessarily diminish. However, Porter (1990, 1998)
argued that, ironically, the location will still matter despite globalization of business.
This is because the internationally competitive firms tend to co-locate in a specific place
or region, such as the financial companies in Wall Street, IT firms in Silicon Valley,
automobile companies in southern Germany, and fashion shoe firms in northern Italy.
Porter (1998) explained the reasons for cluster’s crucial role in enhancing firms’
competitiveness from the following three perspectives. First, clusters increase the
productivity of firms within the area. By locating oneself in the cluster, firms can get
easier access to specialized and experienced employees and suppliers, specialized
information, and institutions and public goods. Hence, firms can save time and costs of
seeking them in other locations. The linkage with the complementarities can also create
potential synergy effects. The complementarities can rise from the related products or
services and marketing effects (such as attracting more customers from related products).
Firms within the cluster can also benefit from powerful psychological effects of
becoming better motivated because of the intensified competition compared to outside
firms. These favorable factors collectively contribute to enhancing the productivity of
the firm.
Second, clusters drive the direction and pace of innovation. The sophisticated
buyers within the cluster often play a vital role as the window or early signal of future
market trend. There are other pressures, such as competitive pressure and peer pressure,

51
which promote the introduction of more competitive products. Moreover, easier access
to various resources required for innovation could also make it possible for firms to
expedite the plans or strategic designs in practice. Porter (1990) argued that firms’ local
outsourcing has competitive advantage in terms of reduced risks, costs, flexibility, and
sustainability compared to distant outsourcing and development.
Third, clusters encourage the formation of new businesses. Barriers to entry are
lower in the cluster than other places. The concentrated consumers also proliferate the
creation of new businesses. Firms can easily get access to the needed staff, skills, capital,
and other inputs, which are available from the external market or acquired from the
established companies. Some empirical studies (e.g., Gilbert et al., 2008; McCann and
Folta, 2011) have shown that young firms or new ventures, in fact, benefited more than
the incumbents in clusters due to their easier accessibility to the needed resources.
Therefore, it is not advisable for firms to choose a location simply by considering
particular input costs alone; rather, firms should choose their location based on the costs
from the entire system, including both hard (e.g., labor cost, infrastructure) and soft
factors (e.g., finance, education, and health system).
3.1.2. Extension of Porter’s Cluster Theory
Despite Porter’s useful and comprehensive framework for analyzing the cluster, it is
limited to the scope within a country and neglects international factors (Moon and Jung,
2008; 2010). Identifying the limitations of Porter’s cluster concept, Moon and Jung
(2008) extended the boundary of cluster from domestic to international ones. They
distinguished the cluster into two stages based on the degree of internationalization of
clusters: regional cluster, regional-linking cluster, international-linking cluster, and
global-linking cluster (see Table 3.1). The first two types are domestic clusters, and the
other two clusters are international. Porter’s concept of cluster is relevant to the first
type, which has been discussed in the earlier section. This is because Porter emphasized
the aggregation of firms and other organizations within a certain area or region, but

52
concerned less on the linkages with other regional or national clusters. Such linkage
concept is particularly important in the context of GVC. This is because no country or
region can be competitive enough to host all the value chain activities in one single
region. The following will illustrate the characteristics of other three types of clusters in
more detail.
Table 3.1. Characteristics of Four Stages of Clusters
Domestic Clusters International Clusters
Regional clusters (stage 1)
Regional-linking clusters (stage 2)
International-linking clusters (stage 3)
Global-linking clusters (stage 4)
Independent and separate clusters (e.g., Silicon Valley)
Regionally linked by neighboring clusters (e.g., entertainment clusters in California, linking Hollywood, Disneyland, and Las Vegas)
Internationally linked by neighboring countries (e.g., SIJORI growth triangle)
Globally linked by neighboring/ non-neighboring countries (e.g., Linking Silicon Valley and Bangalore)
Source: Moon and Jung (2010), Moon (2016b)
Regional-linking cluster refers to the interconnection of clusters located in different
regions in a country. The entertainment cluster in the state of California can be a good
example. In the southern region, Hollywood and Disneyland in Los Angeles are
connected with the zoo of San Diego, a neighboring city. Such linkages among these
attraction resources from different cities have contributed to enhancing the
competitiveness of the entire tourism industry of the region of California. Moreover,
these areas are also connected with the tourism resources of neighboring state of Nevada
(e.g., Las Vegas, Death Valley), which facilitates the formation of even larger tourism
cluster (Moon, 2017b).

53
International-linking cluster represents the clusters located and interconnected in
the neighboring countries. The SIJORI growth triangle linking Singapore, Malaysia, and
Indonesia is a good example. The different areas of comparative/competitive advantages
strengthened the complementarity of these economies and have strengthened the
linkages among each other. The sustainable growth of Singapore requires sustainable
supply of food, water, and other natural resources which can be sourced from Indonesia
and Malaysia that both have rich natural resources. On the other hand, the continuous
upgrade of Indonesia and Malaysia needs the inputs of advanced technology and talented
human resources in addition to the capital inflows by MNCs. All of these resources can
be well solved by leveraging the strengths of Singapore. According to the National
Competitiveness Reports by two internationally well-known organizations, IMD and
WEF, Singapore ranked the top on the list. Moreover, it is one of the most attractive
locations for MNCs’ overseas investment.
The final stage of global-linking cluster is defined as the network dispersed in
different countries but not adjacent to each other: the global network of India’s
Bangalore and the Silicon Valley in the US in the IT industry. Despite the physical
distance, the comparative advantages of language (i.e., English), a large and cheap pool
of engineers in IT technology, time-zone of Bangalore serve as the base for the long-run
sustainable linkages between the two. Bangalore clusters can benefit from upgrading
their current skills, technology, and knowledge in IT and related industry, whereas
Silicon Valley can continuously upgrade to higher value-added activities by shifting the
low-value added activities to Indian firms.
The determinants of a country’s competitiveness are shifting from the perspective
of a single country to the concept of cluster, which is beyond the country boundary (Cho
et al., 2016). The high competitiveness of Bangalore compared to other regions in India
is remarkable because it has extensive global linkages with Silicon Valley in the US,
through which it can better access to talents, technology, and knowledge. Similarly,
although Singapore has limited natural resources, the linkages with neighboring
countries can complement such disadvantages and also contribute to creating new

54
advantages. For example, many MNCs select Singapore as the platform (e.g., regional
hub) for connecting the investment in other ASEAN countries.
The four-stage model is also very useful for explaining the creation and upgrading
the clusters in the developing country (Moon et al., 2013). Porter’s cluster is useful to
explain the sources of competitive clusters, but cannot explain how to create or develop
such competitive factors for establishing a globally successful cluster. In this sense,
developing countries can follow the order of four stages, through which they can achieve
economic development, by exploiting the advantages of partner country’s clusters and
complementing one’s disadvantages.
3.1.3. The competitiveness determinants of clusters in GVC
While Moon and Jung’s (2010) four-stage cluster model is useful by extending Porter’s
(1990) cluster theory from domestic to international scope, we need to specify the
changes in the sources of cluster competitiveness in the global context. Since Porter’s
four determinants – factor conditions, demand conditions, related & supporting sectors,
and firm strategy, structure & rivalry – are limited to domestic scope, this study suggests
an extended framework for explaining the determinants of cluster’s competitiveness in
GVCs.
The newly proposed factors are abstracted by examining the location choices of
Samsung Electronics’ manufacturing plants in Vietnam and Apple’s contract
manufacturing factories in China. Based on the information collected from related
academic articles, newspapers, and periodicals, this study developed four elements,
which are labor productivity, access to global market, access to supply chains, and
strategic location (see Figure 3.1).

55
Figure 3.1. Sustainable Sources of Competitiveness for Clusters
Note: The concept of the four factors for explaining the sustainable sources of cluster competitiveness is adopted from Moon’s (2016b) ABCD model and Moon’s (2017b) framework for explaining the sources of competitiveness of Silicon Valley.
The basic difference between Porter’s four factors of the diamond model and those
of this new model is the addition of internationalization, global linkage in particular,
which plays a critical role in the context of GVC. The modified four factors are obtained
by borrowing the concept of Moon et al.’s (1995, 1998) generalized double diamond
model, which is an extended model of Porter’s single diamond, by incorporating the
international context. Each factor will be discussed in more detail in the following
section by taking the examples of Samsung Electronics and Apple.

56
3.1.3.1. Four Strategic Factors of Competitive Clusters
Labor Productivity
Cheap labor, in particular, of the factor conditions of Porter’s diamond model is
commonly stressed by extant studies when MNCs choose their production locations.
However, in addition to cheap cost, labor productivity is also an important factor. The
price for unskilled labor for Samsung’s manufacturing plants in Vietnam is only one-
sixth of that of Gumi factory in Korea, but there is almost no difference in terms of labor
productivity (Moon and Parc, 2014). Another advantage of production offshoring in
Vietnam is the large pool of labor force, which Samsung can take advantage of. In 2012,
Samsung hired 21,000 new employees in Samsung Electronics Vietnam (SEV) assembly
plant, but such employment scale in Korea is impossible (Moon and Parc, 2014).
It is the same for Apple’s assembly factory in China. China’s factories are far bigger
and more nimble than those in the US (Business Insider, 2012/1/22). They can hire (and
fire) tens of thousands of workers practically overnight. Also, since many of the workers
live on-site, they can come to work at a moment’s notice. Most of all, they can change
production procedures and speed very quickly. The high labor productivity makes both
China and Vietnam distinct compared to other developing countries which are normally
characterized by low labor costs but low productivity as well.
Access to Global Market
Porter’s demand conditions emphasize local market size, but concern less the
connectivity with other countries. Since Vietnam is a member of ASEAN countries,
Samsung can easily access its member states by taking advantages of lower trade barriers.
Also, the launch of the ASEAN Economic Community (AEC) in December 2015 has
contributed to further development of market integration and the business environment
in the region. According to the 2012 statistics, the foreign sales of SEV were $12.9

57
billion; only $0.3 billion were sold in Vietnam, while the other $12.6 billion were
exported from Vietnam to the global market, including Korea.
Similarly, Apple’s first manufacturing plant was located in the export-oriented
cluster, in Guangdong Province (Economist, 2012/3/10). Majority of Apple’s products
are sold outside China. According to 2016/1Q statistics, Chinese local market sales only
contributed to one-fourth of the total revenue, while the other 75% foreign sales were
gained from non-Chinese market.
Access to Supply Chains
Among many locational advantages of Vietnam, one of the important advantages is its
easy accessibility to the Chinese supply chain. This is why the two mobile phone
assembly complexes are located in the northern cluster near Chinese boarders. As local
supplier infrastructure is underdeveloped, Samsung has to rely on the Korean and other
foreign suppliers, and many of the higher value-added parts and components are
manufactured in China.
On the other hand, Apple’s manufacturing plants in China can have easy access to
iPhones and iPads components within the country. According to 2015 statistics on the
suppliers of Apple, there were 198 companies and 759 subsidiaries. Although these
subsidiaries were widely dispersed in 30 countries, almost half (336 suppliers) were
located in China (Grimes and Sun, 2016). This demonstrates why China is the most
important location for achieving sustainable supply of parts and components.
Strategic Location
Vietnam accounted for 50% of Samsung’s global smartphone production, and China
almost accounted for 100% of Apple’s global production. Therefore, Vietnam and China
serve as the manufacturing hubs for both Samsung and Apple. In particular, Samsung’s

58
manufacturing factories used to be concentrated in China, but recently Samsung has
increased production activities in Vietnam within its entire global production system.
Therefore, Vietnam is not a separated manufacturing site, but it is highly coordinated
with Samsung’s other value chain functions in other locations.
3.1.3.2. Four Factors for Sustainable Development of Clusters
The above four strategic factors are concluded mainly through the considerations of
Samsung and Apple when they chose the production sites at the beginning. However,
over time, new problems emerge and thereby new strategies are needed. Hence, for
continuous upgrading of cluster competitiveness, I suggest four strategies, which are
dynamics, interaction, ecosystem, and motivation.18
Dynamics.
Vietnamese and Chinese labor forces have been competitive in speed, although for
manufacturing higher-value added products, they need to improve the degree of
precision. Samsung Electronics outsourced parts and components to very few local
suppliers in Vietnam, because of their lack of capability in terms of precision and
technology. The majority of Samsung’s suppliers are Korean subsidiaries located in
China, Korea, and Vietnam. Similarity, although Chinese suppliers take a large portion
in Apple’s total number of suppliers, many high-value added parts and components
suppliers are outside China.
18 The concept of the four factors for explaining the sustainable sources of cluster competitiveness is adopted and modified from Moon’s (2016b) ABCD model. Moon (2017b) then applied the model to explain the competitiveness sources of Silicon Valley.

59
Interaction
Both clusters located in these two countries are typical export-oriented clusters, but for
sustainable growth, they also need to attract more inward FDI, through which local
suppliers can enhance their interaction with globally competitive MNCs. Such
interaction can facilitate the learning of global standard and competition within the
cluster. For example, Samsung Electronics is currently actively engaging in transferring
its technology and knowledge to local suppliers and help them enhance their production
capability. Thanks to the knowledge transfer, local Vietnamese suppliers can provide
their products not only to Samsung but also to other MNCs doing business in Vietnam.
Ecosystem
The current clusters of both countries are mainly developed based on the improvement
of manufacturing-specific industry infrastructure. However, referring to the most
successful innovation cluster (e.g., Silicon Valley), the cluster development depends on
the existence of sophisticated service sectors, such as financial and legal services. In
addition to the industrial ecosystem, the living ecosystem is required to attract talented
people who are working and living there. The living ecosystem should include both basic
living conditions (e.g., food, residence) and cultural living conditions (e.g., education,
entertainment, sports). The current problem in high turnover rate of SEV is actually due
to its lack of cultural living conditions.
Motivation
This strategy refers to the upgrade of the strategic goal of the cluster to higher value-
added. Although both Vietnam and China were originally chosen as manufacturing sites,
both companies are now strengthening their existing clusters by establishing R&D

60
centers to support local or even global production development and services. Currently,
both countries have shown some signs of upgrading their locational advantage in
adaptation to attracting higher-value added activities. Samsung Electronics has recently
decided to establish the second R&D center in the Northern area of Vietnam to
strengthen its capability of serving global market. Similarly, Apple has established a
R&D center near its manufacturing plants in Guangdong Province in 2016, and also
announced recently its plans for establishing additional R&D centers in other regions in
China to help strengthen the capability of local suppliers, which in turn contribute to the
enhancement of the product quality.
3.2. FDI Approach: From TNI to GVC Index
The degree of MNCs’ globalization is highly influenced by MNCs’ global strategy. This
is because whether the value activities of MNCs are geographically concentrated or
dispersed on a global scale depends on MNCs’ strategic design of their international
production networks and the target markets (Moon, 2016a). Hence, the following section
will first review the types of MNCs’ global strategy. Then, the key studies on measuring
MNCs’ globalization are presented and their limitations for the analysis in the context of
GVCs are discussed. Based on the above critical review and analysis, this section
suggests the directions for further improvement of MNCs’ global expansion.
3.2.1. Different Types of MNCs’ Global Strategy
In 1980s, when MNCs’ business activities were becoming increasingly globalized,
managers began to realize the importance of globalization for enhancing firm
performance. However, they were often confused with where and how to effectively

61
globalize their value activities. The following provides a historical review for describing
the types of MNCs’ global strategy.
3.2.1.1. Configuration-Coordination (C-C) Model (Porter, 1986)
Porter (1986) first provided a useful and systematic framework for distinguishing MNCs’
different types of global strategy. Porter categorized MNCs’ global strategy into four
types based on two criteria: configuration and coordination. Hence, Porter’s model is
also known as Configuration-Coordination (C-C) model. Configuration refers to the
location of value activities in the value chain in the world, whereas coordination refers
to how closely these activities in different countries are coordinated with each other.
Based on the degree of configuration (i.e., geographically concentrated or dispersed)
and coordination (i.e., low or high), there are four strategies in general: country-centered
strategy, export-based strategy, high foreign investment with high extensive coordination
strategy, and global strategy. Both country-centered strategy and export-based strategy
are commonly characterized with low coordination. Firms with country-centered
strategy pursue a dispersed configuration, but firms employing export-based strategy
locate their production activities only in one country which serves the global market.
The other two strategies – global strategy, and high foreign investment with extensive
coordination – are characterized with high coordination strategy. Firms applying global
strategy concentrate as many activities as possible in one county and serve the global
market through high coordination. On the other hand, the other strategy has both high
coordination and geographical dispersion.
3.2.1.2. Three Dimensional Framework (Moon, 1994)
Despite the usefulness and great contribution in academia, Porter’s (1986) model has
two critical problems, which were well pointed out by Moon (1994). First, Porter argued

62
that firms with global strategy, which is geographically concentrated and highly
coordinated among value activities, are mostly globalized as seen in the examples of
Japanese MNCs – the most successful companies in the world at that time. However,
according to Porter’s logic, MNCs with more dispersed geographical locations are less
globalized, and this does not sufficiently reflect the real world. Second, Porter did not
distinguish the nature of coordination between production-related activities and
marketing-related activities. For example, GM and Toyota, the two examples taken by
Porter (1986), pursued production-seeking coordination and market-seeking
coordination, respectively. Without differentiating the types of coordination, the result
could be misleading as Porter suggested Toyota was more globalized than GM.
In order to solve the two main issues, Moon (1994) introduced a three dimensional
framework, comprising three criteria: number of countries, production coordination, and
marketing coordination. The author further suggested that MNCs could take different
paths for global expansion by considering either the production or marketing perspective.
For example, GM focused more on production-oriented expansionary path, whereas
Toyota pursued market-oriented expansion. In contrast with Porter (1986), this
framework suggests that MNCs are more globalized with higher (either production or
marketing) coordination and more dispersed locations (i.e., larger number of countries).
3.2.1.3. Integration-Responsiveness Framework (Prahalad and Doz, 1987)
Prahalad and Doz (1987) developed the Integration-Responsiveness (I-R) Framework,
based on two dimensions of global integration and local responsiveness, to describe the
pressures on the global business. Global integration refers to the management of
geographically dispersed activities on a global scale. The managerial integration is
necessary in order to respond to the pressures of reducing costs and optimization of
foreign investment. The other dimension of local responsiveness refers to the automatic
decision making by MNCs’ foreign subsidiary in order to adapt to local customer
demands.

63
Based on the varying degrees of the two dimensions, the authors distinguished
MNCs’ global strategy into three types: integrated product strategy (high integration and
low responsiveness), multifocal strategy (simultaneous focus on both aspects of
integration and local responsiveness), and locally responsive strategy (low integration
and high responsiveness). Comparing with Porter’ C-C model, the dimension of global
integration can be linked with Porter’s coordination parameter and responsiveness can
be linked with Porter’s configuration parameter, because the higher degree of local
responsiveness will be more likely to encourage MNCs to spread their value chain
activities in more number of countries. However, both Porter (1986) and Prahalad and
Doz (1987) did not fully distinguish the coordination between production and marketing
(Moon and Kim, 2008).
3.2.1.4. Different Organizational Models (Bartlett and Ghoshal, 1989)
Some other scholars approached the issue of global strategy from other perspectives. A
seminal work by Bartlett and Ghoshal (1989) presented different organizational models
in the context of global business. They outlined the characteristics of four types of
organizations, namely multinational, global, international, and transnational firms, based
on three criteria – (1) configuration of assets and capabilities, (2) role of overseas
operations, and (3) development and diffusion of knowledge. They further suggested the
evolutionary path transforming form domestic and transnational firms: domestic
multinational global international transnational. Thus, according to the
argument of the authors, transnational firms are the ideal choice for MNCs to maximize
the benefits of globalization.

64
3.2.1.5. Modified Framework of Bartlett and Ghoshal (1989) (Moon, 2009)
In spite of the significant contribution of Bartlett and Ghoshall (1989), Moon (2009)
pointed out several problems and introduced a modified model to better understand the
characteristics of different types of MNCs’ strategy as well as their evolution stages over
time. Moon first incorporated all of the five organizational models of Bartlett and
Ghoshal into the I-R framework (See left side of Figure 3.2). From the figure, problems
can be easily found. The evolution from multinational firms, to global, and then to
transnational firms means that the evolutionary path of the firm moves from low
integration (multinational) to high integration (global), and then back to lower
integration (international); this seems complicated and inefficient.
For this, Moon (2009) reduced five types of organizational models into four. Two
specific changes are made. The type of international firm is deleted; the form of
multinational is changed into “multi-domestic” which is characterized as high degree of
responsiveness to individual markets. Based on the newly modified typology, Moon
(2009) suggested an updated evolutionary path from domestic to transnational firms (see
right side of Figure 3.2).
Moon and Kim (2008) further argued that transnational firm model is not
necessarily the ideal one. Firms at different stages of development should have different
models which maximize the benefits from globalization. In fact, when firms have
superior ownership advantages (e.g., Apple’s iPhone), they do not need to respond too
much to local consumption needs, and thus standardization (i.e., global firm) is more
appropriate in terms of cost reduction and efficiency. On the other hand, if firms have
weaker ownership advantages, they might be more likely to be pressured to consider
local consumption needs, and thus multi-domestic model is appropriate for an effective
penetration into the local market.
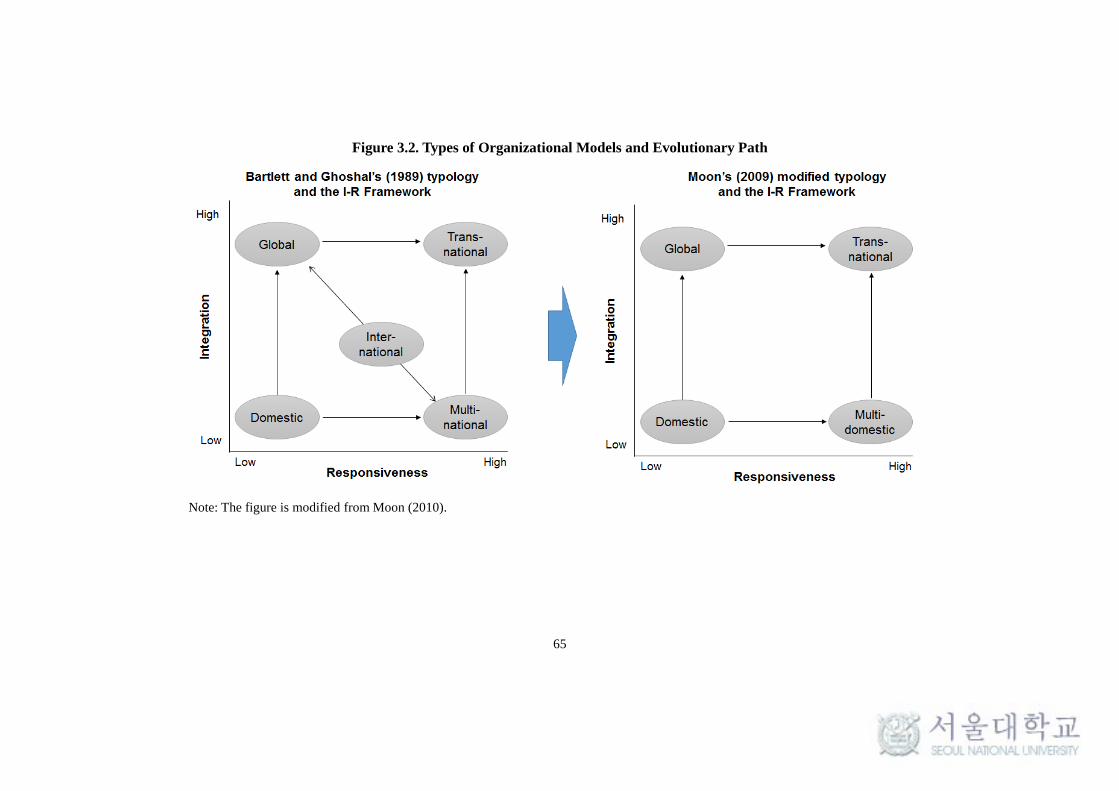
65
Figure 3.2. Types of Organizational Models and Evolutionary Path
Note: The figure is modified from Moon (2010).

66
3.2.2. Measurement for MNCs’ Globalization
Over the past decades, there have been many studies which tried to find a better
measurement for the degree of firms’ globalization. Table 3.2 selected some key studies.
Some studies (e.g., Collins, 1990; Geringer, et al., 1989; Grant et al., 1988, Rugman and
Verbeke, 2004) employed a single criterion which is foreign sales. Among these studies,
Rugman and Verbeke (2004) is the most recognized one. They examined the world’s
largest MNCs (Fortune 500) and distribution of their sales across the world. They found
that among the firms listed in Fortune 500, only a few firms are truly global and have
sales in all three regions (i.e., the EU, the US, and Japan); most of other firms operate
only in their home region.
Table 3.2. Key Studies on the Measurement of Firms’ Globalization
Studies Indicators
Collins (1990), Geringer et al. (1989); Grant et al. (1988), Rugman and Verbeke (2004)
Foreign sales
Ramaswamy (1993) Ratio of foreign assets
UNCTAD (1995) Ratio of foreign sales to total sales, foreign assets to total assets, foreign employment to total employment
Lu and Beamish (2004) The number of overseas subsidiaries, the number of countries
Porter (1986), Moon (1994), Moon and Kim (2008)
The number of countries, the degree of coordination
Sullivan (1994) Performance, structural, and attitudinal
Ramaswamy (1993), on the other hand, assessed the degree of firms’ globalization
using the ratio of foreign assets. UNCTAD (1995) also utilized the relative measurement
including three elements – the ratio of foreign sales to total sales, the ratio of foreign
67
assets to total assets, and the ratio of foreign employment to total employment. Therefore,
UNCTAD’s measurement is more comprehensive than those studies using a single item,
either foreign sales or foreign assets. Over the past years, the approaches of measurement
have been advanced using from single one to multiple criteria.
Another aspect of improvement is by using financial dimension and other non-
financial dimensions. For example, Lu and Beamish (2004) assessed firms’
internationalization using two variables – the number of overseas subsidiaries and the
number of countries where their foreign subsidiaries are located. Hence, Lu and Beamish
emphasized the dimension of firms’ geographical configuration (or the locus of
destination) aspect. On the other hand, some studies (e.g., Porter, 1986; Moon, 1994;
Moon and Kim, 2008) added one more dimension which is the degree of coordination
of MNCs’ activities distributed around the world. Sullivan’s (1994) measurement is also
a multi-dimensional including three attributes, which are performance, structural, and
attitudinal.
Among the above numerous measurements, UNCTAD’s (1995) transnationality
index (TNI), first introduced in the World Investment Report 1995, is the most popular
measurement among scholars and policy makers. This index has been adopted by
business scholars in several countries to study internalization of national companies.
Integrating the three dimensions into a single framework can balance different types of
internationalization among various industries. TNI index is also the most feasible among
various approaches due to its simplicity. However, despite many advantages or
superiority of TNI index, it is not without criticism; the major limitations or problems of
TNI index will be illustrated in the following section.
3.2.3. Limitations and Improvement of TNI Index
TNI index is one of the most popular and comprehensive indices for measuring firms’
globalization, but it neglects some key activities such as technology development, which
is particularly important for high technology industry. Furthermore, although firms adopt

68
various types of transactions – trade, FDI, and NEMs, this index incorporates only trade
(foreign sales of TNI) and FDI (foreign assets and employment of TNI), thus it cannot
well reflect the reality. One of the typical evidences is that Apple is excluded from the
top 100 non-financial TNCs. This is because Apple does not possess a significant scale
of foreign assets through FDI. The majority of its foreign employment in China is
through NEMs and thus cannot be captured in TNI. Therefore, we need to develop an
improved TNI index, which can better assess the globalization of MNEs with the rising
GVCs.
Porter’s (1985) value chain framework includes nine activities – five primary and
four support activities. Some studies (e.g., Mudambi, 2008; Mudambi and Puck, 2016;
Nicovich et al., 2007; Pananond, 2013; Singer and Donoso, 2008; Verbeke and
Asmussen, 2016) classified the activities in the value chain into three types based on the
function in the value chain: upstream, middle-end, and downstream activities
(Hernández and Pedersen, 2016). Upstream activities refer to those that mainly aim to
exploit natural resources and raw materials or those related to design, R&D, as well as
the commercialization of the creative efforts. Middle-end activities are those related to
manufacturing and logistics. On the other hand, downstream activities are those relevant
to ultimate consumer, which add values to the product and those activities related to
marketing, advertising, brand management, and after sales. However, the critical
limitations of this classification are that it incorporates the support activities into the
outbound logistics, which are categorized as a larger concept of upstream logistics.
However, the support activities (e.g., R&D) also contribute to the downstream activities,
hence the basic distinction between primary and support activities is necessary.
This study thus first adopts Porter’s classification of primary and support activities,
and each is further classified into two, thereby four types of activities in total (see Figure
3.3). Specifically, the five primary activities are re-categorized into two – upstream and
downstream activities; those related to production are often referred to as upstream
activities, and the other sales related activities are referred to as downstream activities.
On the other hand, the four supporting activities can also be further reduced into two

69
main types – human resource management (HRM) and technology development (see
Figure 3.3).
Figure 3.3. TNI vs. GVC Index
The reorganization of Porter’s nine value chain activities into four categories is
more realistic because it is difficult to measure the degree of firms’ globalization in terms
of all nine activities. Considering the above mentioned problems of TNI index, GVC
index by extending the current TNI can develop into two perspectives. The first method
is to add elements related to technology development. The second method of extension
is to add outsourcing related elements (see Figure 3.4). The following will explain more
about the logic behind adding the two elements.

70
Figure 3.4. GVC Index: Two Possible Extensions of TNI
Table 3.3 represents the data for the top 100 TNCs in terms of the three elements of
TNI, most of which are from developed countries. For foreign sales, the growth rate
shows upward trend from 2.0% in 2012 to 2.7% in 2013. However, this is contradictory
with the growth trend of foreign assets and foreign employment. Regarding foreign
assets, although the growth rate still maintained positive, it slowed down from 3.3% to
1.9%. On other hand, as for foreign employment, the growth rate witnessed minus
growth in both 2012 and 2013, despite the slight improvement shifting from minus to
positive growth in 2013. The opposite development trend (i.e., increase in foreign sales
but decrease in foreign assets and employment) partly explains the increasing trend
where MNCs control their foreign production through contracts instead of FDI.
Table 3.3. The Top 100 Largest Non-financial TNCs Worldwide (2011-2013)
2011 2012 2013
Foreign Sales (billions $) 5,783 5,900 (2.0%) 6,057 (2.7%)
Foreign Assets (billions $) 7,634 7,888 (3.3%) 8,035 (1.9%)
Foreign Employment (1000) 9,911 9,821 (-0.9%) 9,810 (-0.1%)
Source: UNCTAD (2014) Note: Figures in the parentheses represent the growth rate compared to the previous year.

71
On the other hand, regarding technology development, in the past MNCs primarily
developed their technology in their home countries and exploited them in foreign
countries through FDI. However, the recent report by PwC which examined the
geographical footprint of innovation by top 1000 firms in terms of R&D spending, found
that firms with higher global R&D footprint had a better performance in terms of various
financial indicators than their less globalized competitors. However, the report did not
find significant evidences for the relationship between the level of spending and firm
performance. Therefore, PwC concluded that it is not how much the firm spends on R&D,
but how it spends. For example, Apple was ranked as the most innovative company in
2015, but its percentage of R&D spending of the total revenue was only 3.3%, which
was only 50% of Samsung Electronics, and about 1/3 of Google and Tesla Motors (PwC,
2015).
Figure 3.5 shows the changing trend of locational distribution of US firms between
2007 and 2015. In 2007, about half of the R&D spending by US-based firms were
allocated in the US (45%), followed by Europe (27%). However, in 2015, Asia became
the most preferred region outside the US for R&D spending, which accounted for one-
fourth of the total of $214 billion by US-based firms. This percentage is 4%p higher than
R&D spending in Europe. In particular, US firms significantly increased R&D spending
in low-cost Asian countries such as China and India. The above statistics shows the
importance of adding particular elements regarding MNCs’ global expansion in R&D
related activities.

72
Figure 3.5. US HQ Firms’ R&D Allocation (US billions)
Source: PwC (2015) Note: ROW: rest of the world; HQ: headquarters
Moreover, it becomes more popular for MNCs not only to offshore R&D related
activities outside their home countries, but also to outsource the entire or sub-part of
R&D related value activities. Such changing trend of outsourcing has attracted growing
attention in academia in more recent years. Table 3.4 lists the main studies recently
published that examined firms’ outsourcing in higher value-added activities. The
technology development, in particular, is often argued for in-house development in order
to maintain one’s core competence. These studies have suggested some conditions or
drivers for firms’ choosing outsourcing mode for technology development. The next
section will discuss in more detail the conditions for firms choosing NEM (or
externalization), which can be applied not just for technology development but for all
activities in the value chain.
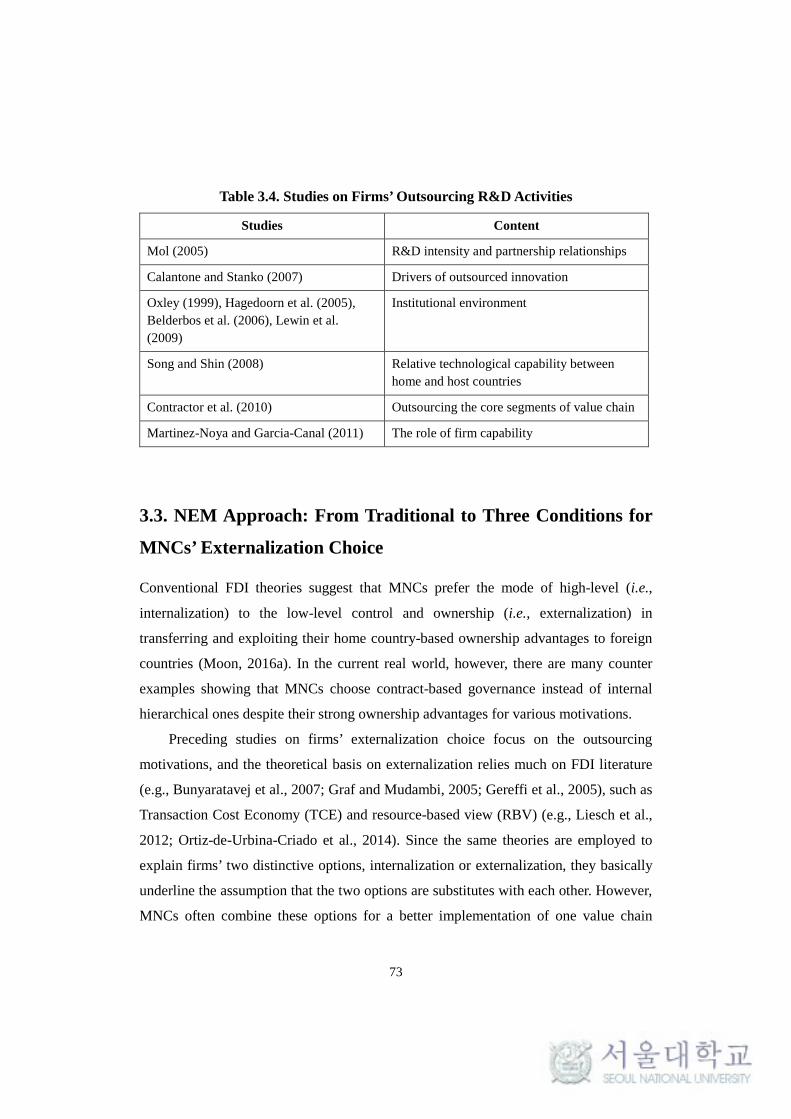
73
Table 3.4. Studies on Firms’ Outsourcing R&D Activities
Studies Content
Mol (2005) R&D intensity and partnership relationships
Calantone and Stanko (2007) Drivers of outsourced innovation
Oxley (1999), Hagedoorn et al. (2005), Belderbos et al. (2006), Lewin et al. (2009)
Institutional environment
Song and Shin (2008) Relative technological capability between home and host countries
Contractor et al. (2010) Outsourcing the core segments of value chain
Martinez-Noya and Garcia-Canal (2011) The role of firm capability
3.3. NEM Approach: From Traditional to Three Conditions for
MNCs’ Externalization Choice
Conventional FDI theories suggest that MNCs prefer the mode of high-level (i.e.,
internalization) to the low-level control and ownership (i.e., externalization) in
transferring and exploiting their home country-based ownership advantages to foreign
countries (Moon, 2016a). In the current real world, however, there are many counter
examples showing that MNCs choose contract-based governance instead of internal
hierarchical ones despite their strong ownership advantages for various motivations.
Preceding studies on firms’ externalization choice focus on the outsourcing
motivations, and the theoretical basis on externalization relies much on FDI literature
(e.g., Bunyaratavej et al., 2007; Graf and Mudambi, 2005; Gereffi et al., 2005), such as
Transaction Cost Economy (TCE) and resource-based view (RBV) (e.g., Liesch et al.,
2012; Ortiz-de-Urbina-Criado et al., 2014). Since the same theories are employed to
explain firms’ two distinctive options, internalization or externalization, they basically
underline the assumption that the two options are substitutes with each other. However,
MNCs often combine these options for a better implementation of one value chain
74
activity or higher value creation. Sometimes internalization can even be the driver of the
externalization activities of MNCs. (the evidence can be seen in the cases of Apple and
Samsung Electronics; see Chapter 5 for details). Therefore, the increase in the degree of
firms’ internalization does not necessarily lead to the decrease in the degree of
externalization; they can co-evolve simultaneously. Such reality is not satisfactorily
explained by the conventional FDI-related theories or determinants.
On the other hand, some other studies (e.g., Kedia and Mukherjee, 2009; OECD et
al., 2013; UNIDO, 2015) suggested that the macro-environmental changes (e.g.,
globalization, technological advancements, liberalization of emerging economies, and
hyper-competition) affect firms’ strategic changes toward externalization of value chain
activities. However, the macro-environmental factors also positively affect MNCs’
international business including the internalization (e.g., FDI) choice. Therefore,
externalization-specific elements are necessary to distinguish the effects on MNCs’
externalization versus internalization choice.
In this respect, this section provides a conceptual framework to explain MNCs’
externalization choice. This framework consists of three elements, namely fast-growing
business, the existence of commercial best practices, and multiple competences. These
are externalization-specific factors, which means that the higher degree of these factors
will increase the likelihood of firms’ externalization decision. Moreover, unlike the
majority of the previous literature on externalization addressing the externalization
advantages of cost reduction, process improvement, and capability building (Hätönen,
2009), this article stresses the role of externalization as a strategy for effectively
responding to the competitive environment. In other words, firms may face difficulty if
they do not externalize certain resources or activities given the three conditions. Such
motivation of externalization is inspired by a few preceding studies (e.g., Gleich et al.,
2017; Mol, 2005). The previous studies have emphasized one or two of these three
conditions, but no study has integrated all of the three factors into a single framework in
a systematic way. More details and specific evidences will be discussed below.
75
3.3.1. Externalization: Definition
The organizational governance of firms’ business activities can be dichotomized into
internalization and externalization (Kojima, 1992). This classification has its origin in
Coase (1937) that explained market and hierarchy as alternative governance structures.
The conventional FDI theories (e.g., internalization theory, OLI theory) commonly
assume that firms first develop their monopolistic or ownership advantages in their home
countries, and then extend their business abroad by exploiting their superior advantages
(Moon and Roehl, 2001). Therefore, the conventional FDI theories prefer internalization
to externalization mode by focusing on how firms sell their ownership advantages in the
market (e.g., franchising/licensing) (Moon, 2016a).
However, the complex and fast-changing business environment in today’s world
make it difficult for MNCs to internally develop all of the necessary resources for
maintaining or enhancing their competitive advantages (Ortiz-de-Urbina-Criado et al.,
2014). Even some MNCs possessing strong capability sometimes prefer externalization
mode of buying compared to in-house development (Mudambi and Tallman, 2010).
Therefore, few MNCs pursue pure internalization or externalization strategy for their
international operations. Rather, it has become more common for MNCs to pursue both
modes of internalization and externalization simultaneously to exploit both of their
ownership advantages and explore complementary ones.
MNCs’ externalization choice has been examined extensively under the literature
of outsourcing since both are commonly concerned with “make-or-buy” (make in-house
or buy from outside) decisions (Elfing and Baven, 1994; Loh and Venkatraman, 1992;
Mol, 2005). Unlike internalization theory (Buckley and Casson 1976), however, there is
no established theory regarding externalization. Consistent with Buckley (2004),
externalization and outsourcing are interchangeably used in this paper, and thus the
literature review below will focus on outsourcing, although a broader scope of
externalization includes other entry modes such as trade and licensing.
76
Outsourcing is commonly defined as “the transfer of activities and processes
previously conducted internally to an external party” (Ellram and Billington, 2001).
However, this definition does not capture the entire picture of firms’ outsourcing
activities. For example, manufacturing activities outsourced by Apple to the third party
have never been conducted in Apple before. In this sense, Giley and Rasheed’s (2000)
definition is more comprehensive; they distinguished outsourcing into two types which
are substitution and abstention. The former one occurs when firms substitute external
purchases for internal activities, whereas the latter one arises when the purchase
activities have not been completed within the firm before. Similar definition can also be
found in other important works on outsourcing such as Kotabe and Mudambi (2009) and
Liesch et al. (2012).
Outsourcing has been examined extensively in the disciplines of economics and
management, but it has become an important topic in the field of international business
only since the 1990s when global sourcing began to increase substantially (Hätönen and
Eriksson, 2009; Kotabe and Mudambi, 2009; Mol et al., 2005). The research on global
outsourcing strategy has mainly focused on manufacturing industry (e.g., Cavusgil et al.,
1993; Mol, 2005; Swamidass, 1993), but more recently there have also been increasing
studies on service industry (e.g., Gleich et al., 2017; Grote and Täube, 2007; Javalgi et
al., 2009).
The geographic scope of outsourcing can be either domestic or international.
International outsourcing has often been referred to offshoring or offshore outsourcing,
which involves the transfer of both ownership and location of operations (Hätönen, 2009;
Hätönen and Eriksson, 2009; Kedia and Mukherjee, 2009). On the other hand, the
organizational governance of outsourcing can be either contractual modes or alliance-
based modes (Contractor et al., 2010). Mudambi and Tallman (2010) argued that most
outsourcing transactions are conducted through alliances instead of “buying from the
market.” This is because collaboration through alliances can reduce costs compared to
full internalization and lower risks compared to pure market transactions. It also

77
facilitates knowledge transfer when the knowledge is complex and involves much tacit
element (Phene and Tallman, 2012).
3.3.2 Literature Review on Externalization: Externalization Advantages and
Theoretical Background
The strategic rationalization of outsourcing has evolved over the past decades: from cost
reduction in 1980s, to capability building and competitive advantage in 1990s, to
survival since 2000s (Hätönen and Eriksson, 2009). Given the complex and evolving
traits in outsourcing phenomenon, various theories have been created to explain the
motives of outsourcing.
The outsourcing decision was first driven by cost reduction, which has been
traditionally explained by the TCE (e.g., Coase, 1937; Williamson, 1975). If the
transactions costs in the external market are lower than those of internal production,
firms should buy them from the market (Williamson, 1975, 1979). Williamson (1975)
further specified the factors that influence TCE such as asset specificity, uncertainty
about contract parameters, and frequency of transactions. Hence, firms are suggested to
outsource their non-core activities to the third parties that have comparative advantages
so they can utilize the resources for other activities.
However, TCE has gradually lost its relevance for explaining firms’ practice of
outsourcing (e.g., Loh and Venkatraman, 1992). The criterion for outsourcing does not
only rely on the costs of transaction but also the value of creation through transaction.
For this, resource-based view (Barney, 1991; Wernerfelt, 1984), competence-based view
(Prahalad and Hamel, 1990), and knowledge-based view (e.g., Grant, 1996) emerged as
popular theoretical grounds behind outsourcing. In addition, firms not just focus on the
outsourcing of standardized and low-value added activities (e.g., production operations),
but recently there is an increasing trend of outsourcing high value-added activities (e.g.,
R&D) in foreign countries (Calantone and Stanko, 2007; Contractor et al., 2010;
Martínez-Noya and García-Canal, 2011; Mol, 2005; Mudambi and Tallman, 2010; Rao

78
et al., 2012). Therefore, outsourcing is a strategic means of gaining access to external
skills, competences and knowledge, to create new competitive advantages.
More recently, outsourcing has become a tool for transforming firms towards
becoming more flexible organizations. This means loosely coordinated networks with
various external partners are often employed, rather than traditionally tightly controlled
hierarchy, for agile and flexible response to the volatile external environment. Such
outsourcing activities are named as “transformational outsourcing” (Linder, 2004;
Linder et al., 2002; Mazzawi, 2002). On the other hand, organizational learning, co-
evolutionary approach, network theory, and modular systems theory also have
contributed to the evolution of literature (Hätönen and Eriksson, 2009). Inter-firm and
cooperative relationships such as strategic alliance are often stressed by scholars for this
motivation of outsourcing (e.g., Kedia and Mukherjee, 2009; Mudambi and Tallman,
2010).
In spite of various theories proposed to explain the drivers of outsourcing, many of
the literature for the externalization advantages have been much influenced by the
conventional FDI theories that stress the internalization advantages (see Table 3.5).
However, this FDI-based approach has a critical limitation in that externalization choice
is regarded as the opposite selection of internalization. Hence, the increase in the degree
of MNCs’ internalization excludes the possibility of externalization choice. However, in
reality, the two options can co-evolve, and internalization can also encourage
externalization for the same or different value activities, or vice versa.

79
Table 3.5. Studies on Outsourcing: Theories and Advantages
Items Description Study
Theories Transaction cost economics, Resource-based view/competence-based view, Transactional value approach, Organizational learning, Co-evolutionary approach, Modular systems theory, Resource dependency theory, Global factory, Global commodity chain/Global value chain
Gereffi (1994, 2001), Calantone and Stanko (2007), Grote and Täube (2007), Kedia and Mukherjee (2009), Hätönen and Eriksson (2009), Javalgi et al. (2009), Mudambi and Tallman (2010), Martínez-Noya and García-Canal (2011)
Advantages of Outsourcing
Cost reduction/profit maximization, Process improvement/Co-specialization, Strategic/competitive advantage, Organizational learning, Relational rents, Corporate transformation, Flexibility/speed, Survival
Kotabe (1992), Cavusgil et al. (1993), Quinn and Hilmer (1994), Tayles and Drury (2001), Kakabadse and Kakabadse (2002), Quélin and Duhamel (2003), Trent and Monczka (2003), Buckley (2004), Kedia and Mukherjee (2009), Javalgi et al. (2009), Hätönen and Eriksson (2009), Kotabe et al. (2009), Contractor et al. (2010)

80
For example, for both marketing & sales and technology development activities in
the value chain, Apple has increased both of its internalization and externalization modes.
Specifically, Apple increased the investment and expenditures on the two activities to
enhance its sales and technology capabilities, and at the same time, it also expanded its
partnership with external parties to enhance the effectiveness of both activities in the
global scope and scale. In other words, MNCs’ externalization choice is not a trade-off
with internalization choice. Since both options have their own advantages and
disadvantages, firms can exploit and maximize advantages and minimize disadvantages
by combining the two in the most effective manner.
Some studies (e.g., Contractor and Lorange, 2002) introduced a comprehensive
framework which highlighted how the contextual and environmental changes (i.e.,
changes in government policy, knowledge management in firms, and production and
distribution) favor firms’ externalization through alliance formation. However, many of
the factors emphasize the increased degree of globalization, such as deregulation and
liberalization of economy, the growing role of IT, and deconstruction of the value chain.
These factors can be useful in explaining the decreasing trend of market failure, but they
do not necessarily lead to firms’ decision towards externalization unless there are
significant advantages of externalization over internalization (see Table 3.6). Therefore,
we need to find externalization-specific determinants which are independent of the
effects of internalization choices. In this regard, this research has aimed to fill the
research gap by introducing a more comprehensive framework for firms’ choice of
externalization, which will be detailed in the following section.

81
Table 3.6. Literature on Determinant Factors for Externalization
Studies Determinants
Contractor and Lorgange (2002), Sturgeon and Gereffi (2009), Amador and Cabral (2016), OECD and World Bank (2014), UNIDO (2015), Hagedoorn et al. (2005), Belderbos et al. (2006)
Macro-environmental changes (e.g., technological advancements, liberalization of emerging economies, IPR, and hyper-competition)
Williamson (1975), Rindfleisch and Heide (1997), Geyskens, Steenkamp and Kumar (2006)
Asset specificity, uncertainty of contract parameters, frequency of transactions
Holcomb and Hitt (2007) Asset specificity, technological uncertainty, small number’s bargaining
Gereffi et al. (2005) Complexity of transactions, ability to codify transactions, capabilities of suppliers
Song and Shin (2008), Calantone and Stanko (2007), Martinez-Noya and Garcia-Canal (2011)
Level of current firm capability
Gleich et al. (2017) Level of competition (i.e., existence of foreign rivals in home)
3.3.3. A New Framework for MNCs’ Externalization Choice
This study introduces a new framework composed of three factors that affect firms’
externalization choice by incorporating and reorganizing some factors from preceding
relevant studies, and by adding new factors. I argue that under these conditions, firms
are more likely to externalize some of the value activities to the external parties even
when the firms possess the capability to internalize the activities. The three elements are

82
fast-growing business, commercial best practices, and multiple competences (see Table
3.6)19.
3.3.3.1. First, Fast-Growing Business
Fast-growing business can be characterized by two aspects – production and market side.
Many of the fast-growing businesses are viewed as technology leaders (Lundquist et al.
2008). In this regard, this paper examines the technological change as a proxy variable
for explaining the production side of fast-growing businesses and its influences on firms’
externalization choice.
In the fast-growing business, the introduction of new technology can make the
existing technology obsolete in a short time (Folta, 1998; Robertson and Gatignon, 1998).
However, the new technology is often developed through alliance between new and old
firms, rather than completely displacing the incumbents like Schumpeterian “creative
destruction” (Contractor and Lorange, 2002). Moreover, externalization can help firms
speed up the rate of R&D, which is hard to be achieved by firms alone. Teece et al. (1994)
thus emphasized that it is rarely an attractive proposition to try to develop a collection
of novel skills rapidly, because it is likely to be extremely difficult to interpret and guide
the learning process when many interrelated procedures are changed simultaneously.
In addition, the shorter product life cycles also impose greater risks on individual
firms to bear the burden of undertaking internal R&D. This encourages firms to
outsource to appropriate partners for selective R&D activities, not only for sharing the
risks and investment burdens, but also for flexible and quick response to the
environmental changes (Dess et al., 1995). The previous empirical studies (e.g.,
Geyskens et al., 2006; Walker and Weber, 1984) have also shown the evidences that high
technological uncertainty increases the likelihood of firm's choice in market governance
19 The concepts of these three elements are adopted and modified from Moon’s (2016b) ABCD model, and applied to the field of international business.

83
(i.e., externalization). This is because firms can flexibly switch suppliers when the new
and more effective technologies are available in the market. By contrast, internalization
would increase the costs associated with bureaucracy for a large firm in particular. For
example, the self-driving car industry is growing extremely fast, thereby driving
traditional automotive producers to cooperate with IT firms to achieve first-mover
advantages in the emerging market, as seen in the partnership between Apple and Didi
Chuxing, and BMW with Intel/Mobileye.
On the other hand, fast changing technology promotes the fast transition of the
product features and rapidly-changing environment in competition (Giachetti and March,
2010). When the technology is applied at a faster pace, a greater number of products will
be introduced to the market (Lundquist et al., 2008; Tassey, 2000). In such market, speed-
to-market becomes an increasingly important factor of determining firms’ success, which
is often measured by the market share (Contractor and Lorange, 2002; Kotabe et al.,
1996). However, it becomes more difficult for a single firm to dominate the market.
Hence, the explosive growth in demand is one of the powerful driving forces of
outsourcing (Quinn, 2000).
Moreover, the fast growing market demand also suggests that the catch-up speed
becomes faster by latecomers through benchmarking strategy (Giachetti and March,
2010). Therefore, in order to maintain the current competitive position, the market
leaders have to consider the externalization as a strategic tool for continuously moving
forward. The increasing market competition facilitates the emergence of various
externalization arrangements (Holcomb and Hitt, 2007). Based on the above discussion,
we can develop the following proposition.
Proposition 1. The faster the growth of business the firm is in, the higher the tendency
to choose the externalization mode in order to obtain the needed
resources timely and adapt more flexibly to the changing environment.

84
3.3.3.2. Second, Commercial Best Practices
“Fine-slicing” of activities makes it possible for firms to compare and evaluate every
element of the firm activities with the market suppliers, and decide whether to outsource
or not to achieve lower costs or higher quality (e.g., Buckley, 2009; Kedia and Mukherjee,
2009). Some studies (e.g., Kotabe and Mudambi, 2009; Martínez-Noya and García-
Canal, 2011) suggested outsourcing of inputs when they are available only for certain
firms or to best-in-the-world providers. Hence, these arguments often assume that firms
have no capability to produce these inputs or tasks, and thus outsourcing is not a choice
but an imperative.
However, if the industry has best practices or global standard, firms should better
adopt the industry standard instead of creating a new standard even if the company has
the capability to provide better standard. This is because if such best practices are widely
disseminated within the industry, the market will be sticky to shift to another supplier.
Technology leader does not always lead to the market leaders (Moon, 2016b), but those
which can provide higher value to the consumers achieve success in the market. In the
past, facing challenges and taking risks were regarded as necessary to become an
innovative leader, but in the current environment, this strategy is not always useful
(Moon, 2016b). Pursuing only new and state-of-the-art innovation while disregarding
the current best practices leads to a waste of time and money.
Best practices can create the highest commercial values, although they may not be
scientifically the best. A good example is the contrasting results between Apple’s failure
and IBM’s success in the personal computer (PC) industry during the 1980s and 1990s.
Apple first introduced the innovative computer, Macintosh in 1984. In the following
years, Apple continuously and consistently promoted “Think Different” advertisements
by emphasizing its unique and creative features compared to other rivals while ignoring
the huge popularity of IBM PCs in the industry. Apple was the pioneer in the PC industry,
and its products were scientifically and functionally more advanced but the price was
quite high, so not many consumers could afford the products. On the other hand, IBM

85
outsourced the production of the operating system to an outside company, Microsoft,
and provided quality products with low-price. Many consumers and enterprises
purchased IBM computers, and the market at that time gradually became more adoptive
and familiar to the IBM brand, eventually shunning away from Apple’s products. As a
result, IBM’s market share in PC products took off and became the industry standard in
the 1990s.
In order to incorporate the best practices, firms can either internalize through
learning or externalize through outsourcing. Although both methods are possible, the
latter may be more appropriate, particularly when the business in which the firm belongs
to possesses the industry standard and holds the patent of that standard (e.g., android and
iOS in the mobile phone market).
Some may criticize the effects of losing competitiveness in the long run due to the
me-too strategy which leads to destructive competition (Porter, 1996). However, when
everyone is innovating, the most efficient way of staying ahead is by creating new best
practices together by outsourcing other best practices (Quinn, 2000). Makadok (2001)
proposed two sources of rent generation through strategic outsourcing – resource-
picking and capability-building. In addition, Holcomb and Hitt (2007) argued that
outsourcing appropriate activities affect firm performance by enhancing the productivity
of firm’s other internal activities (Holcomb and Hitt, 2007). Hence, the second condition
for firms’ externalization choice is suggested as follows.
Proposition 2. The stronger the degree of industry-standard in a certain input within the
business, the higher the tendency to obtain those assets through
externalization.
3.3.3.3. Third, Multiple Competencies
In the period of product-centered strategies, the competitive products used to be
determined by one single core competence (mostly the technological competence).

86
Under this situation, the superior technological advantage can outweigh the weaknesses
in other value activities, such as manufacturing or marketing. Recently, however, the
competitive advantage of products and services increasingly relies on multiple
competences from various diverse knowledge sources (Contractor and Lorange, 2002).
As the needed number of competences increases, a firm can no longer master all fields
of competences (Granstrand et al., 1997). Hence, acquiring complementary competences
through market transactions or alliances become more important than ever for sustaining
competitiveness. This encourages firms to build a competitive ecosystem, by making
strategic alliances with other firms. Accordingly, the overall competitiveness of the
products or services is not determined by a single firm, or the focal firm, but a cluster of
firms including competitors and supporters. Therefore, knowledge is becoming more
extensive to perform activities internally (Brusoni et al., 2001). This is because in order
to coordinate outside suppliers and partners efficiently, firms need to know more than
they make (Mol, 2005).
The emergence of multiple competences is driven by the proliferation of
convergence of multi-field technology and multi-functional products. The most striking
characteristic of the technological competencies of large firms is the wide range of
technological fields in which they are active (Granstrand et al., 1997). The multi-
technology competences encourage a growing number of multi-functional products and
cross-development of previously distinctive technological areas (Narula, 2004; Porter
and Heppelmann, 2014). Taking iPhone for example, the traditional feature phones had
provided only the telephone (or voice) function but now it has been expanded into a
multi-functional device with a number of new features and applications.
Not only the sources of inputs of products or services multiplied, but the end
applications of technologies have also multiplied (Contractor and Lorange, 2002) as well.
The same technology can be applied to various industries, previously considered
unrelated, and relevantly. Kotabe et al. (1996) suggested that technology is blurring the
industry boundaries. This thus increases the uncertainty and reduces the appropriability
of technology. In order to fully capture the profits from R&D investment, firms

87
externalize some functions or make alliances in order to enter new market. So, the
following proposition can be formulated.
Proposition 3. The larger the areas of competence outside the firm’s expertise in
products or services and the greater multiplicity of end applications of
technologies, the higher the tendency to choose the externalization mode.
3.3.4. Discussions on the Three Conditions
The three conditions have been extensively but separately discussed in the field of
strategic management to explain the emerging sources of firms’ competitive advantages
(see Table 3.7). For example, Ito and Rose (2004) argued that the economies of speed
become a new source for firms to achieve competitive advantage. Regarding commercial
best practices, Liang (2015) suggested the importance of commercial convenience in
addition to price and quality which have been the traditional two sources of competitive
strategy for firms according to Porter’s (1980, 1985) generic strategies. Similarly, Gans
and Stern (2003) emphasized commercial strategy which focuses on commercialization
process by introducing the advanced technology developed in the laboratory to the
consumer markets. In this sense, Koufteros et al. (2005) integrated the role of consumer’s
role in technology development and production process. Lastly, in terms of multiple
competences, preceding studies highlighted the importance of multiple sources for
achieving and sustaining competitive advantages, but there are scarce studies which
explicitly mentioned the concept of “multiple (core) competences.”

88
Table 3.7. Conditions for Firms’ Externalization Choice
Factors Concepts/Theories in Strategic Management
Literature Existing Studies on Externalization
Fast-growing business
Hyper-competition (D’Aveni, 1998), Economies of speed (Ito and Rose 2004), Manufacturing agility (Gunasekaran, 1998, 1999; Koste and Malhotra, 2000), Time management (Stalk, 1988), Value chain flexibility (Zhang et al., 2002), Value chain agility (Swafford et al., 2006), Overall process agility (Moon, 2016b)
Difficulty in developing a collection of novel skills rapidly (Teece et al., 1994), Acceleration in the rate of technical change (Contractor and Lorange, 2002), Nimble and learner firms (Mol, 2005), High technology uncertainty (Geyskens et al., 2006), Fast growing demand (Quinn, 2000), Rapid-changing environment of competition (Giachetti and March, 2010)
Commercial best practices
Commercialization strategy (Gans and Stern, 2003), Customer integration (Koufteros et al., 2005), Customer convenience (Liang, 2015), Global standard (Moon, 2016b)
E.g., IBM PC vs. Macintosh (Business Insider, 2012/12/9) Sony’s ATRAC3 vs. others’ MP3 technology for media player (Moon, 2017a)
Multiple competences
Integrative competence (Wang et al., 2004), Combinative capability (Kogut and Zander, 1992), Smart, connected products (Porter and Heppelmann, 2014)
Know more than make (Brusoni et al., 2001), Growing diversity of knowledge sources (Contractor and Lorange, 2002), Multiplicity of end applications of technologies and customization (Contractor and Lorange, 2002)

89
The emerging sources of competitive advantages require firms to pursue new ways
for achieving these advantages in the global competition, in particular. This study
showed that externalization or NEM methods are more effective in achieving these
competitive advantages. Specifically, when firms satisfy one or all of the three conditions,
they are more likely to externalize some part of their activities to outside companies
instead of performing them internally. By contrast, previous studies have mentioned only
one or two factors of the three conditions, and none of them incorporated them in a single,
systematic framework.
Although there are some practical examples and cases which illustrate firms’
outsourcing activities driven by incorporating the commercial best practices instead of
sticking to the highest technology, there is no study which links the existence of
commercial best practices and firms’ decision for externalization. Regarding the
condition of fast-growing business, previous studies only concern the speed of changes,
however, by adopting the concept of the third conditions, this study stresses that if the
industry/business characterized by multiple competences experiences simultaneous
changes, the industry/business will grow even faster. Therefore, this study contributed
by combining the key determinants of externalization of preceding studies and improved
conceptualization of each conditions. For a better understanding, more specific examples
and cases are analyzed in Chapter 4, whereas the application of the three conditions to
prove the usefulness and legitimacy of this new framework is shown in Chapter 5 and
Chapter 6 through case study and empirical test.

90
CHAPTER 4. CASES AND EXAMPLES FOR EXTENSIONS
ON TRADE AND FDI APPROACHES
For a better understanding of the first two directions proposed in Chapter 2, this chapter
conducts a series of case studies and examples. Samsung Electronics’ investment in
Vietnam and the growing concentration of Korean foreign direct investments (FDI) in
Vietnam are taken as examples to illustrate that clusters, not the inherited advantages,
affect MNCs’ location choice for their production and other activities. Moreover, this
chapter illustrates the example of Guangdong Province in China by showing how the
clusters facilitate to upgrade the industry structure of this area and avoid hollowing-out
in spite of substantial increase in the labor costs, since the 2008 Global Financial Crisis,
in particular. Another example from the cluster perspective is to show the reasons behind
the low performance of inward FDI in Korea clusters (e.g., specialized economic zones).
The second main part of this chapter aims to explain the globalization (or expansion)
of Korea’s large firms and small and medium-sized enterprises (SMEs) in ASEAN
through a combination of tools including trade, FDI, and non-equity modes (NEMs).
Specifically, this chapter investigates the degree of Korea’s top MNCs’ degree of
globalization in terms of the three elements of transnationality index (TNI) to figure out
the general features of Korean MNCs compared to those of global MNCs from other
countries This chapter then specifies the analysis of Korean FDI in the ASEAN region,
which is considered as one of the most preferred regions for Korean firms’ outward FDI.
The case study and statistical figures show that no single transaction among the three
(i.e., trade, FDI, and NEM) dominates Korean outward FDI in this region. Korean firms
are intertwining the three types flexibly for creating more values. Finally, this chapter
concludes by providing useful implications.

91
4.1. Cluster Effects for Locational Choice
4.1.1. Samsung Electronics in Vietnam20
Samsung is the largest business group or chaebol in Korea.21 Since the establishment of
its mobile phone production factory in Bac Ninh, Vietnam (Samsung Electronics
Vietnam, SEV) in 2009, Samsung has continuously expanded its investment in Vietnam.
Another $2 billion mobile phone factory - the Samsung Electronics Vietnam Thai
Nguyen (SEVT) - was established in 2013. The two plants employed 112,000 local
workers out of the company’s 219,822 workers outside Korea in 2014 (Samsung
Electronics, 2015; Vietnamplus, 2016/5/9). Vietnam now accounts for about 50% of
Samsung’s mobile phone production in the world, compared to only 8% from its
facilities inside Korea (Vietnamplus, 2016/5/9).
The Vietnamese government encourages MNCs to utilize locally produced parts
and components. In 2013, Samsung submitted a list of 170 spare parts to the Vietnam’s
Ministry of Industry and Trade to be sourced locally. However, only 15 out of the 100
local companies which were recommended by the government met the quality
requirements of Samsung. The lack of technological capability and constraints in capital
for training has led Samsung to utilize Korean SMEs and foreign firms in Vietnam to
supply parts and components for its production. Favorable host country policies have
also supported about 100 Korean suppliers of Samsung (including Korean SMEs) to
invest in Vietnam.
By 2014, 53 Korean firms out of 67 parts suppliers for the SEV plant were Korean,
and only four Vietnamese firms joined Samsung’s supply chain as first-tier parts
suppliers: seven are from Japan, and one of each from UK, Malaysia, and Singapore.
Other parts and components were mostly imported from China, Korea, and Taiwan
20 This part is abstracted and extended from parts of Chapters 3 and 5 of ASEAN Secretariat and UNCTAD (2016), which are partly contributed by Hwy-Chang Moon and Wenyan Yin. 21 For company profile in detail, refer to Chapter 5.
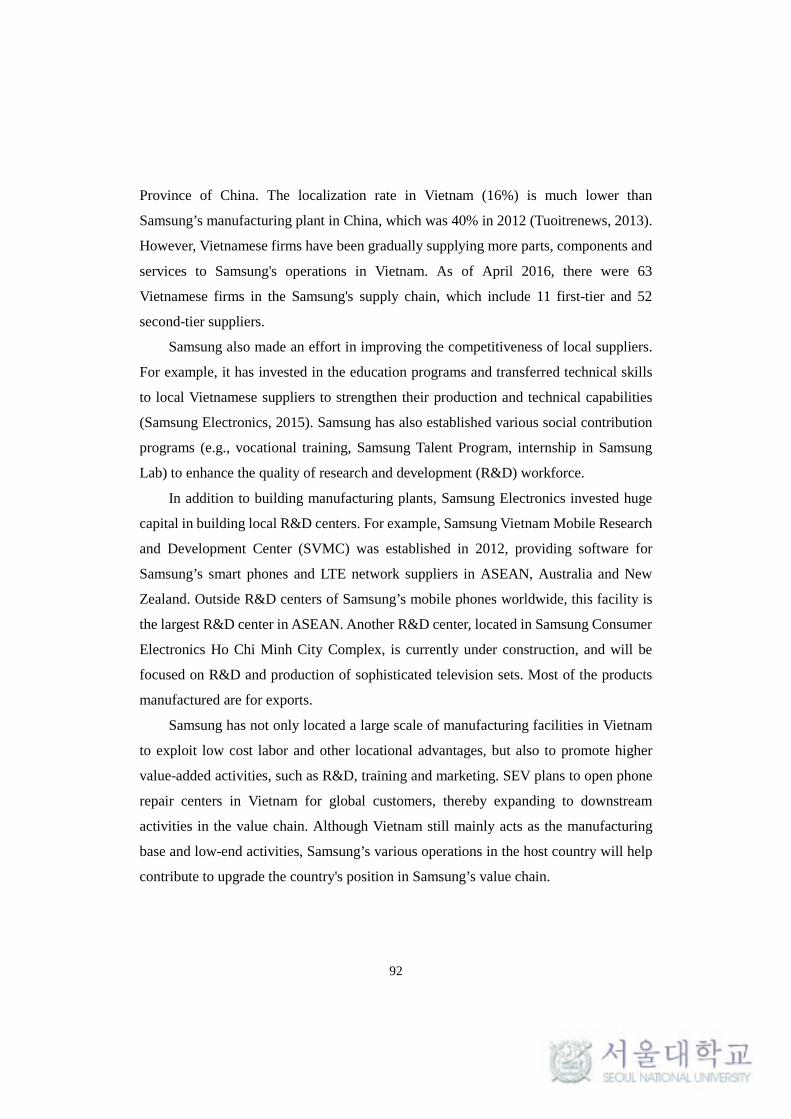
92
Province of China. The localization rate in Vietnam (16%) is much lower than
Samsung’s manufacturing plant in China, which was 40% in 2012 (Tuoitrenews, 2013).
However, Vietnamese firms have been gradually supplying more parts, components and
services to Samsung's operations in Vietnam. As of April 2016, there were 63
Vietnamese firms in the Samsung's supply chain, which include 11 first-tier and 52
second-tier suppliers.
Samsung also made an effort in improving the competitiveness of local suppliers.
For example, it has invested in the education programs and transferred technical skills
to local Vietnamese suppliers to strengthen their production and technical capabilities
(Samsung Electronics, 2015). Samsung has also established various social contribution
programs (e.g., vocational training, Samsung Talent Program, internship in Samsung
Lab) to enhance the quality of research and development (R&D) workforce.
In addition to building manufacturing plants, Samsung Electronics invested huge
capital in building local R&D centers. For example, Samsung Vietnam Mobile Research
and Development Center (SVMC) was established in 2012, providing software for
Samsung’s smart phones and LTE network suppliers in ASEAN, Australia and New
Zealand. Outside R&D centers of Samsung’s mobile phones worldwide, this facility is
the largest R&D center in ASEAN. Another R&D center, located in Samsung Consumer
Electronics Ho Chi Minh City Complex, is currently under construction, and will be
focused on R&D and production of sophisticated television sets. Most of the products
manufactured are for exports.
Samsung has not only located a large scale of manufacturing facilities in Vietnam
to exploit low cost labor and other locational advantages, but also to promote higher
value-added activities, such as R&D, training and marketing. SEV plans to open phone
repair centers in Vietnam for global customers, thereby expanding to downstream
activities in the value chain. Although Vietnam still mainly acts as the manufacturing
base and low-end activities, Samsung’s various operations in the host country will help
contribute to upgrade the country's position in Samsung’s value chain.

93
4.1.2. The Growing Concentration of Korean FDI in Vietnam22
Korean FDIs in ASEAN witnessed strong growth in 2016, with the highest growth rate
peaking at 15.7% since 2013, arriving at nearly $5,000 million (see Figure 4.1).
Moreover, ASEAN’s share of Korean outward FDI flows to Asia also increased
substantially by almost 10% from 38.9% in 2015 to 47.7% in 2016. This implies the
growing preference by Korean firms’ destination choice in this region for their outward
investment. However, Korean FDIs in this region tend to be concentrated in a few
countries, Vietnam, in particular. Nonetheless, the industrial distribution of Korean FDI
in Vietnam shows a trend of growing diversification, from manufacturing to other sectors
such as real estate, construction, and distribution. The following will first describe the
recent trend of Korean FDIs in ASEAN in 2016, and then analyze the reasons behind the
growing FDI flows in Vietnam from a cluster perspective.
Figure 4.1. Korean FDI Flow in ASEAN (2011-2016) ($ millions)
Source: Korea Eximbank FDI database
22 This section is abstracted, modified, and extended from a part of the ongoing project by UNCTAD in 2017, partly contributed by Hwy-Chang Moon and Wenyan Yin.

94
4.1.2.1. General Trends and Development of Korean FDI in ASEAN in 2016
Country Distribution
FDIs to Thailand, Indonesia, Myanmar, and Singapore decreased in 2016, while the
inflows to other six countries increased significantly. However, Korean FDI inflows in
ASEAN still concentrate in a few countries. Three destinations of Vietnam (46%),
Singapore (23%), and Indonesia (13%) received more than 80% of Korean FDI in 2016.
Industrial Distribution
The sectors of real estate, transportation, construction, and finance & insurance
experienced a particular high growth rate (near or more than 100%) in 2016. Despite its
moderate growth compared to other sectors, manufacturing still received the largest FDI
from Korea in 2016, accounting for 45.2% of the entire FDI flows to this region. In
contrast, Korean FDI to mining decreased significantly from 25% in 2015 to 5.4% only
in 2016. The top three sectors including manufacturing (45.2%), finance & insurance
(13.7%), and wholesale & retail (10.3%), accounted for about 70% of the total FDI
inflows in 2016.
Size of Investors
The investments by Korean large firms accounted for 69% of the total Korean FDI in
ASEAN, and Korean SMEs investments accounted for 26% in 2016 (see Figure 4.2).
Although the absolute amount of FDI by Korean large firms was 2.6 times that of Korean
SMEs, the growth rate of Korean SMEs’ FDI in ASEAN was much higher than that of
Korean large firms. Compared to 2015, Korean SMEs’ FDI grew by 32% in 2016,
whereas the FDI by Korean large firms grew by only 8%. Moreover, in terms of country

95
distribution, Korean SMEs’ FDIs were much more concentrated than those of Korean
large firms. The top three destinations (Vietnam, Singapore, and Indonesia) accounted
for 77% of Korean large firms’ FDI inflows, whereas the single destination of Vietnam
dominated majority of Korean SMEs’ FDI with the share of 73% in 2016.
Figure 4.2. FDI by Korean Large Firms and SMEs ($ millions)
Source: Korea Eximbank FDI database
4.1.2.2. The Cluster Effects on Increasing Concentration of Korean FDIs in
Vietnam
Despite the failure of Trans-Pacific Partnership (TPP) due to the withdrawal of the US
in January 2017, Korean firms’ investments in Vietnam have shown a continuous growth
(JoongAng Ilbo, 2017/2/27; Monthly Bobbin Journal, 2017/5/10). The share of Korean
FDIs in Vietnam increased from 37% in 2015 to 46% in 2016. The acceleration of
Korean investments in Vietnam is because Vietnam not only became an emerging
manufacturing base but also a growing market. The following will analyze the reasons
in more detail from a cluster perspective.

96
Cluster is normally defined as the agglomeration of firms and other related
institutions in a certain area to create higher synergy effects. Krugman (1979, 1980, and
1991) introduced three main benefits of locating in a cluster, which are economies scale,
greater consumption diversity, and lower transportation costs. Porter (1990), on the other
hand, introduced a more comprehensive framework, the diamond model, in order to
explain the cluster effects and competitiveness. However, these conceptual frameworks
have critical limitations that they mainly focus on domestic scope (Moon and Jung,
2010), whereas in the context of global value chains (GVC), international linking
clusters play an important role for attracting MNCs’ investments. These theoretical
grounds23 of international scope can be well incorporated to explain Korean FDI in
Vietnam.
By May 2016, Vietnam had more than 300 industrial and economic zones, which
contributed to attracting billions of FDI inflows. Korean FDIs were particularly
concentrated in the industrial and economic zones in the northern area near Hanoi, and
the southern area near Ho Chi Minh City (see Table 4.1). According to the statistics on
the accumulated FDI inflows by June 2016, the Bac Ninh province accounted for the
biggest portion of FDI from Korea. The large amount of FDI in Bac Ninh was attributed
to the investments by Samsung Electronics and its affiliates. The second largest area of
receiving Korean FDI was Hanoi, followed by Dong Nai, Thai Nguyen, Ho Chi Minh
City, Haiphong, and Vung Tau. Bac Hinh, Thai Nguyen, and Haiphong are provinces
adjacent to Hanoi, while Dong Nai and Vung Tau are provinces near Ho Chi Minh City.
23 Please see Chapter III for more detailed information on cluster theory.

97
Table 4.1. Regional Distribution of Korean FDI in Vietnam
Region Northern area Central area Southern area
Number of provinces 29 13 21
Number of projects 2,594 149 2,619
Investment ($100 million) (%) 267.89 (55.2) 25.39 (5.2) 190.68 (39.3)
Source: KOTRA (2016/7/25)
The preference of northern and southern areas by Korean firms is because the
clusters in the two areas have extensive international linkages with neighboring countries
which facilitate Korean firms’ coordination with their global value chain activities across
borders. Specifically, the North has locational advantage for firms importing input goods
(i.e., parts and components) from China, while the South has the advantage of proximity
to large commercial ports, main cities for consumption (the economic center of Ho Chi
Minh City), and the ASEAN market. Thus, in the context of GVCs, the attractive
location of global firms’ investment should be extended from domestic single cluster to
international linking clusters24.
Secondly, Korean firms in the same business group tend to locate their overseas
subsidiaries in the same clusters (e.g., industrial park, economic zone) or those near with
each other. For example, majority of the investments by Samsung Electronics and its
affiliates in Vietnam are located in Bac Ninh and Thai Nguyen. The two new investments
(R&D center of Samsung Electronics and battery production factory of Samsung SDI)
approved by Vietnam government in 2016 are located in Hanoi and Bac Ninh
respectively. On the other hand, LG Electronics and its affiliates’ investments are mostly
located in Haiphong area. The two major investments of LG Display and LG Innotek
approved in 2016 are all located in Haiphong (See Table 4.5).
24 Moon and Jung (2010) distinguished clusters into four stages: regional cluster, regional-linking cluster, international-linking cluster, and global-linking cluster (Refer to Chapter 3).

98
Moreover, despite the high price of rental and other facilities which could be a
burden for SMEs, suppliers can exploit even higher benefits such as easy access to the
customer firms, increasing economies of scale, and lower costs of transportation and
communication. Therefore, these large Korean conglomerates are creating their own
industry zones by expanding the existing industrial clusters.
Thirdly, Korean MNCs not only expand their investments in terms of the size of
FDI, but also the quality of FDI by locating more high-value added activities in Vietnam.
The new wave of Korean FDIs in Vietnam after 2008 Global Financial Crisis was
initiated by establishing large scale of assembly plants (labor intensive activity) of
electronic goods by Samsung Electronics in the electronics industry. However, more
recently, their investments are shifting to more technology and capital intensive activities,
such as R&D center (e.g., Samsung Electronics) and high value-added parts and
components.
For example, LG Display currently has module assembly lines (display) in Korea
(Paju, Gumi), China (Guangzhou, Nanjing, and Yantai), and Poland (Wroclaw). In 2016,
LG Display announced that Vietnam will become the fourth country for mass-producing
the firm’s modules. Other Korean suppliers (e.g., Seoul Semiconductor, Lumens) also
promoted a large scale of investment projects for producing high-end parts and
components (e.g., LED) last year (see Table 4.2).
Lastly, the upgrade not only occurs within the same industry (i.e., electronics), but
also across industries by expanding from manufacturing to other service industries such
as construction and distribution (i.e., wholesale, retail). The growing manufacturing
sector creates more business opportunities for other sectors, including real estates,
construction, and distribution. For example, because of the fast-growing logistics
markets in Vietnam, in 2016, Samsung SDS made an agreement with Vietnam’s largest
aviation logistics company, Aviation Logistics Service (ALS) to provide global and
inland transportation, warehousing, and customs brokerage services.
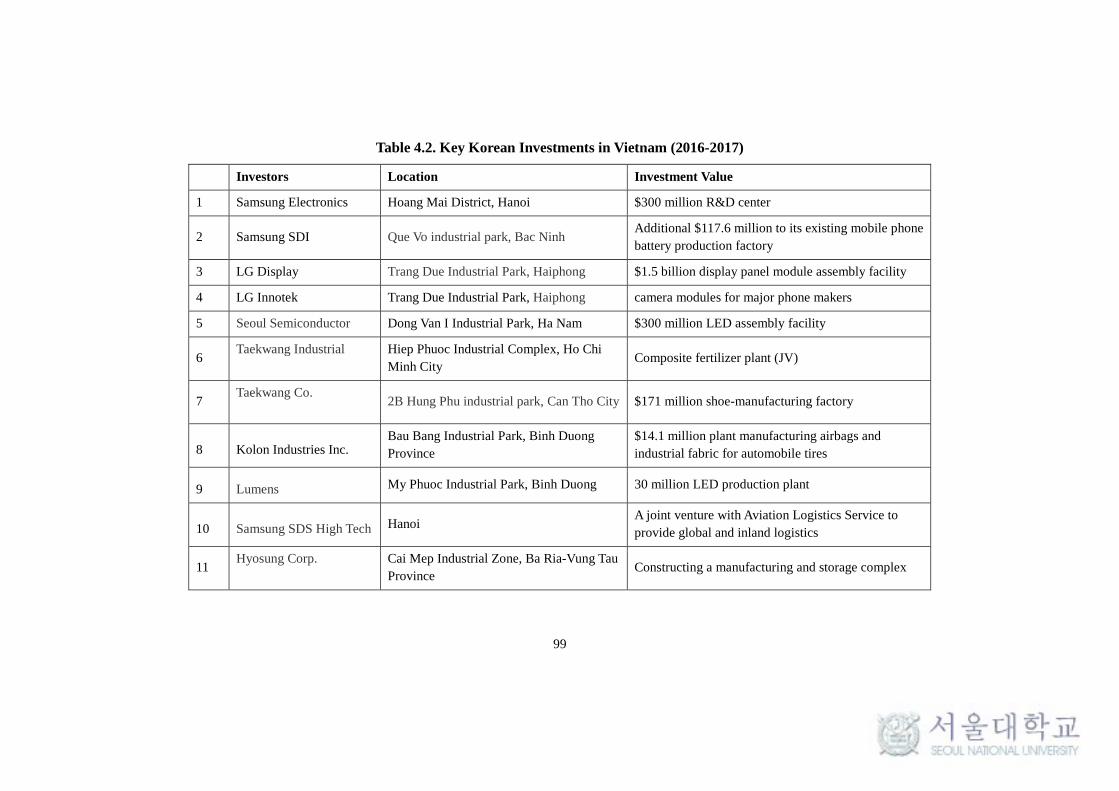
99
Table 4.2. Key Korean Investments in Vietnam (2016-2017)
Investors Location Investment Value
1 Samsung Electronics Hoang Mai District, Hanoi $300 million R&D center
2 Samsung SDI Que Vo industrial park, Bac Ninh Additional $117.6 million to its existing mobile phone battery production factory
3 LG Display Trang Due Industrial Park, Haiphong $1.5 billion display panel module assembly facility
4 LG Innotek Trang Due Industrial Park, Haiphong camera modules for major phone makers
5 Seoul Semiconductor Dong Van I Industrial Park, Ha Nam $300 million LED assembly facility
6 Taekwang Industrial
Hiep Phuoc Industrial Complex, Ho Chi Minh City
Composite fertilizer plant (JV)
7 Taekwang Co.
2B Hung Phu industrial park, Can Tho City $171 million shoe-manufacturing factory
8 Kolon Industries Inc. Bau Bang Industrial Park, Binh Duong Province
$14.1 million plant manufacturing airbags and industrial fabric for automobile tires
9 Lumens My Phuoc Industrial Park, Binh Duong 30 million LED production plant
10 Samsung SDS High Tech Hanoi A joint venture with Aviation Logistics Service to provide global and inland logistics
11 Hyosung Corp. Cai Mep Industrial Zone, Ba Ria-Vung Tau
Province Constructing a manufacturing and storage complex

100
Moreover, the economic boom driven by the FDIs in the traditional manufacturing
(e.g., processing and assembly activities) helped Vietnam become an emerging consumer
market. A good example is the distribution sector such as wholesale and retails. Due to
the rapid growth of sales in Vietnam’s e-commerce market, Lotte Group in 2016
launched its online shopping sites based on its retail networks of Lotte affiliates (e.g.,
Lotte Department, Lotte Mart, Lotte Home Shopping) to open earlier in Vietnam. The
online mall was built in anticipation to provide huge business opportunities of Korean
SMEs’ goods and services supply. Since the early 2000, it has become a general trend
that Korean SMEs invest together with Korea large firms in Vietnam. The growing
business opportunities can partly explain the growing trend that Korean SMEs increase
FDI in Vietnam.
In addition to the distribution sector, Korean firms have also been competitive in
the cinema and fast food industries. The two Korean firms, CGV and Lotte Cinema,
accounted for 60% of the market by the end of 2015. Various Korean food brands, such
as Lotteria, CJ Foodville, F&B, and Caffe Bene have also been very popular in Vietnam.
CJ or CheilJedang, a Seoul-based food firm, has heavily invested in Vietnam. In March
2016, it purchased 4% of Vietnam Meat Industries by spending over $13 million. It also
plans to acquire over 47% of Cau Tre Export Goods Processing, one of the leading food
companies in Ho Chi Minh City. The expansion of Korean FDI from manufacturing to
services also promoted Korean MNCs’ various entry modes, from greenfield to M&As.
The above analysis of Korean FDI in Vietnam shows that the cluster effects do not
only result in the growing the quantity of the FDI, but also in the structural changes in
terms of industrial distribution, size of investors, as well as the entry modes. Such
quantitative and qualitative growth of Korean FDI in Vietnam will make Korean MNCs’
position more sustainable in their host countries such as Vietnam, and also help the
countries’ economic and industrial developments.

101
4.1.3. Guangdong Province in China: The Cluster Effects and Sustainable
Growth25
The Pearl River Delta (PRD)26, a cluster in Guangdong province in China is a region
which accumulates a huge amount of wealth thanks to the benefits from globalization.
With more than 66 million people living in this region, it is nominated as the world’s
largest megacity by the World Bank recently (Economist, 2017/4/8). Although it is now
one of most successful economies in the world, it has been a very shabby and humble
place until the late 1970s. Since its economic liberalization in the 1980s, it has attracted
more than a trillion dollars of FDI, which accounted for about 20% of the entire FDI in
China. The continuous globalization policy and fast growth contributed to making this
region emerge as a global manufacturing factory and export hub.
However, the development path of this region did not always go smoothly.
Particularly after 2008 Global Financial Crisis, thousands of small and medium-sized
enterprises were bankrupted due to the internal and external challenges. Internally, the
fast-growing income level and decrease in the labor supply from neighboring regions
made numerous firms, which were engaged in labor-intensive sectors, face challenges in
sustaining their earlier price advantages in the global market. As Figure 4.3 shows, over
the last decade between 2005 and 2015, the manufacturing labor costs increased by more
than 370 times, which is currently higher than India or some South East Asian countries
(e.g., Indonesia). Moreover, the net inflow of migrants into Guangdong has decreased
by nearly 50% from 1.1 million to 600,000 in 2016 (Economist, 2017/4/8). This, on the
other hand, shows the limits of sustaining locational advantages based on only inherited,
traditional advantages. Externally, the 2008 Global Financial Crisis resulted in shrinking
global demands, and thus export-oriented economic development model has faced
serious challenges.
25 The information on PDR’s economic development is abstracted and extended from IPS (2011) and a series of special reports on PDR published in the issue of April 8, 2017, by the Economist. 26 The PRD hosts nine major cities in the Guangdong Province, notably Shenzhen and Guangzhou (the capital city of the province), Hong Kong, and Macau.

102
Figure 4.3. Manufacturing Labor Costs of Key Countries (per hour, $)
Source: Economist (2017/4/8), “The PRD is exporting jobs but producing more goods for the home market.” Note: Data for 2015 is estimated
In order to pursue sustainable regional development, the Guangdong Province
government has initiated a series of reforms to transform and upgrade the current
industry from lower-value added to higher value-added structure since the 2008 Global
Financial Crisis. Specifically, the provincial government introduced “double-transfer”
policy to promote industry upgrade and transfer across all of Guangdong province. The
“double transfer” policy refers to the transfer of labor intensive industries from the PDR
region to the less developed regions of the province and the subsequent transfer of rural
labor from the primary industries to the secondary and tertiary industries (see Figure 4.4).
The provincial government planned to invest nearly 50 billion yuan over a period of five
years (2008-2012) to develop high-end industries in the PDR and to build industrial
transfer parks in surrounding less developed regions (East, West, and North of the
province) (IPS, 2011).

103
Figure 4.4. The Industry Transfer of Guangdong Province
Source: IPS (2011)
The government’s efforts of “double-transfer” policy can be well explained by
Moon and Jung’s (2010) concept of regional-linking cluster. No cluster alone can be
sustainable in the fast-growing and volatile business environment. By transferring the
low-value added sectors to the less developed regions, the PRD can successfully move
up to the higher value added without the effects of hollowing-out, or substantial damages
due to “hard-landing.” On the other hand, the less developed areas (north, east, and
western area of Guangdong Province) can upgrade by attracting the investment from
both local enterprises and foreign MNCs. The inter-linkage among regions can further
create higher synergy effects, which generate higher values.
The industrial upgrade of PDR region in fact resulted in great success. The average
growth rate of this region was 12% over the last decade, and that was even higher in the
earlier decades. This region accounts for 1% of China’s territory and 5% of the total
population, but it contributes to more than 10% of China’s value added (GDP) and 25%
of exports (Economist, 2017/4/8). The GDP of this region arrived at more than $1.2
trillion, which even surpassed that of Indonesia with four times of the population
(Economist, 2017/4/8). This region not only has witnessed significant growth in size of
the regional economy, it has also emerged as the hothouse of innovation.

104
The city of Shenzhen, the first place adopting open-door policy in this region, has
developed into one of the most innovative cities. Local firms that used to import core
parts and components to produce competitive products nowadays work on their own
inventions. Although there are not many top-tier universities in this region, many
graduates from other regions of China flock to Guangdong – Shenzhen in particular,
providing an abundant pool of talented people to both local and foreign MNCs
(Economist, 2017/4/8). On the other hand, in terms of international patents applied by
cities in 2016, Shenzhen ranked as the top, surpassing other major cities in China such
as Beijing, Shanghai, and Guangzhou (see Figure 4.5). In fact, many local (e.g., Huawei,
BGI) and foreign MNCs (e.g., Apple, Foxconn) invest in high value added activities (e.g.,
R&D) by harnessing such high brains at lower costs.
Figure 4.5. China’s International Patent Applications by City in 2016 (%)
Source: Economist (2017/4/8), “Shenzhen is a hothouse of innovation”
However, facing harsher competition from rest of China and also neighboring
countries (e.g., ASEAN), the recent special report by Economist (2017/4/8) suggested
four directions – diversification, integration, automation, and innovation – in order to
adapt to new realities and achieve higher competitiveness. The following will first

105
explain the four directions in detail, and then complement by adding some further
suggestions based on the sustainable factors introduced in Chapter 3.
Diversification incorporates two meanings: (1) to shift the manufacturing plants
from the delta to places with lower labor costs, (2) to redirect the market from Western
countries (e.g., the US, Europe) to the Chinese domestic market. Integration refers to
enhancing the integration with domestic market by investing more in the infrastructure
to facilitate the linkages with other regions. Unlike Yangzi river delta cluster, the
infrastructure of delta regions was originally designed for exports. Hence in order to shift
the focuse to the domestic market, it is necessary to construct other infrastructure
relevant to this purpose. In order to overcome the fast growing labor costs, automation
and innovation are further required.
Although those suggestions by the Economist are plausible, the view is
domestically oriented. Moreover, the Economist suggests the shift from reliance on the
external export markets to the domestic market. Although the external market is
vulnerable and less controllable compared to the domestic market, it is not always
necessary for one country to choose between the domestic and international markets.
Both markets are important and necessary to sustain one’s economic development.
Therefore, it is more advisable to pursue both domestic and international markets. As
discussed in Chapter 2, since no country can be fully capable to carry out all the activities
of GVC, hosting some parts of value chain activities has become the global trends in the
current world. This on the other hand implies the country to pursue more economic
development policies which promote and facilitate the linkage among MNCs’ value
chain activities dispersed around the world.
There is already close economic partnership with Hong Kong, particularly in
financial sector. Hong Kong’s banking system and capital market are quite advanced and
liberalized, which makes it as one of the most vibrant global financial centers. On the
other hand, the financial sector in the mainland is heavily controlled by the government.
Hence, many mainland companies consider Hong Kong as their parking center which
facilitates their foreign investment. Another important effort by Guangdong province is

106
its heavy investment in infrastructure. The provincial government released the latest
five-year plan for Guangdong in 2016 and promoted “one-hour transport circle” to
connect the main cities in the delta region, including Hong Kong and Macau. For
example, Hong Kong-Zhuhai-Macau bridge which is still under construction and being
completed soon, will help the four-hour car journey reduce to 45-minute only. This is
particularly helpful for Macau to attract the global tourists.
However, the current extensive regional-linking clusters between Guangdong,
Hong Kong, and Macau can be extended to global-linking clusters through partnership
with Northeast (e.g., Korea) and Southeast Asian (e.g., Vietnam, Singapore) clusters (see
Figure 4.6) (IPS, 2011). Recently, after the 2008 Global Financial Crisis in particular,
Korean electronics firms have extensively invested in Vietnam and other Southeast
countries. However, many of the parts and components are procured from China. Thus,
Guangdong’s role of linking between Northeast and Southeast Asian regions will be
particularly important for the effective linkages among the value chain activities of
MNCs.
A manager of Hong Kong’s Kerry Logistics with a large presence in the delta region
said that in spite of the growth of labor income, the effective business system in this
region, in fact, help his company save money. For example, it only takes about one day
to ship goods from northern Vietnam to the delta region (Economist, 2017/4/8). Similarly,
the supply chain manager of Huawei stressed that the reducing costs should not be the
single driver which forces them to shift the manufacturing out of the region. The costs
might be increased by 20-30%, but the benefits from easy access to the supplier bases
are even larger (Economist, 2017/4/8). Moreover, an effective manufacturing process
should be accompanied with R&D activities. Only the innovative cluster such as PDR
can host such collaborative manufacturing. Considering these reasons, the company
decided to remain their manufacturing based in this region

107
Figure 4.6. Global-Linking Clusters between PDR, Northeast, and Southeast
Asian Clusters
Source: IPS (2011)
4.1.4. The Performance of Korean Clusters in Attracting FDI27
Developing specialized economic zones is often considered as policy tool by local or
federal governments to achieve their strategic goals of economic development and
enhancing national competitiveness. Korean government is not without exception. In
order to attract FDI, it has established various specialized zones such as foreign
investment zones (1998), free trade zones (2000), and economic free zones (2003), and
company city (2004). However, the performance was far low from expectation; the
27 This part is abstracted and extended from some part of Moon and Yin (2017b).

108
effectiveness in attracting FDI was significantly lower compared to the costs of building
these specialized zones.
The total amount of inward FDI to the three types of specialized economic zones
(i.e., economic free zones, free trade zones, and foreign investment zones) accounted for
only a little more than one-fifth of Korea’s total inward FDI during the period of 2003-
2014. In particular, during the same period the amount of inward FDI into the eight free
economic zones was only 14.4% of the costs of building these economic zones. Hence,
the revenues were not large enough to cover the operating costs. Moreover, it shows
significant differences among free economic zones. Majority of FDI flew into Incheon,
a city near the capital of Seoul, while some other economic zones which were far from
Seoul attracted nearly none.
The recent report by Korean Economic Institute (2016) conducted an intensive
investigation about the reasons behind the low performance of attracting FDI in these
free economic zones. The reports found that these free economic zones compete rather
than their original intension of cooperation and are overlapping with similar
characteristics. This thus results in huge amount of wastes in money and efforts. The
second main reason for the low performance is the lack of differentiation or incentives
compared to other national economic zones. This report particularly emphasized that
although Korea’s specialized economic zones have comparative advantages in
geographic locations, easy accessibility to the market, developed industrial infrastructure,
other obstacles such as the extensive regulations and rigid labor market have been the
critical problems for attracting FDI.
Moon and Yin (2017b) suggested that the formation of international-linking clusters
is the right direction for Korean government to effectively attract FDI. It is not advisable
to limit the scope of competitiveness of cluster by itself within a certain boundary, but it
should be extended from enhancing the competitive of a single cluster to the capability
of connecting neighboring or distant clusters either within the country or across the
national boarders as long as they can create synergies. For example, although the GDP
and land size of Hong Kong and Singapore are quite small, their openness so the global

109
scope of both trade and investment rank at the top in the world. This is because global
MNCs consider Hong Kong and Singapore as their platform for further investment in
the neighboring regions, not the end of the investment in Hong Kong or Singapore. This
provides meaningful implications for Korean government to establish effective policies
for enhancing their FDI attractiveness.
4.2. Korean MNCs’ Globalization and FDI in ASEAN
4.2.1. The Degree of Globalization of Korea’s Top 20 MNCs28
In 2013, top 20 Korean MNCs were ranked in terms of their foreign assets and most
firms were subsidiaries of Korea’s eight leading business groups (or chaebols), which
are Samsung, POSCO, LG, Hyundai Heavy Industries, Hyundai-Kia Motors, SK, Lotte,
and Hyosung Group (see Appendix Table A1). Five out of the twenty MNCs were also
included in UNCTAD’s “Top 100 non-financial TNCs from developing and transition
economies” in 2012.29
Samsung Electronics had the highest TNI at 56.1, followed closely by SK Hynix
(54.1) and Samsung SDI (48.8). All of the top three companies belong to the electronics
industry. The next three firms in terms of their TNIs have scored in the 40s, and belong
to either the chemical or electronics industries (LG Chem, 47.9; LG Display, 46.1; and
Lotte Chemical, 44.7). The 7th to 11th firms have TNIs in the 20s and 30s. These firms
mostly belong to the automobile and wholesale & retail trade industries. KOGAS,
KEPCO, and SK Telecommunications ranked close to the bottom; notably, two of the
three being state-owned companies. The TNIs of these firms are all lower than 8, which
is far lower than the other 11 firms.
28 This part is abstracted and extended from some parts of Moon and Yin (2015). 29 The five multinationals are Samsung Electronics, Hyundai Motor Company, POSCO, LG Electronics, and Hynix Semiconductor.

110
Table 4.3 shows a snapshot of changes in the collective assets, sales, and
employment of the top 20 Koreans MNCs from 2011 to 2013. Foreign assets grew by
20.7% in 2012. They continued to grow in 2013, in spite of their decreased rate of 17.4%.
Total assets, in turn, grew by 15.6% in 2012, although the growth slowed to 7.5% in
2013. The respective differences in growth rates between foreign assets and total assets
for each year imply that companies have accelerated their overseas investments over
domestic investments for the past three years.
Table 4.3. Top 20 Korean Multinationals, 2011-2013 ($ million, number of employees)
Variable 2011 2012 2013
% change (2011-2012)
% change (2012-2013)
% change (2011-2013)
Assets
Foreign 47,249 57,042 66,952 20.7% 17.4% 41.7%
Total 518,765 599,643 644,671 15.6% 7.5% 24.3%
Foreign share of the total (%)
9.1% 9.5% 10.4%
Sales
Foreign 240,707 283,929 317,036 18.0% 11.7% 31.7%
Total 426,352 493,885 525,811 15.8% 6.5% 23.3%
Foreign share of the total (%)
56.5% 57.5% 60.3%
Employment
Foreign 287,722 327,877 375,517 14.0% 14.5% 30.5%
Total 644,647 684,015 747,709 6.1% 9.3% 16.0%
Foreign share of the total (%)
44.6% 47.9% 50.2%
Sources: Moon and Yin (2015)

111
In the case of sales, the trend is similar to that of foreign and total assets. The growth
rates of foreign sales and total sales in 2013 decreased compared to 2012, but the gap
between the two increased over the same period. As was the case for assets, the growth
rates of foreign sales in both 2012 and 2013 are higher than those in terms of total sales.
In contrast to assets and sales, the growth rates of both foreign and total employment
are higher in 2013 than in 2012. This is because two key sources (Samsung Electronics
and Lotte Shopping) of foreign employment among the 14 firms expanded their overseas
employment dramatically in 2013. The number of foreign employees of Samsung
Electronics, for example, increased by 14,142 in 2012, and increased substantially by
more than 50,000 in 2013 because of its active commitment to overseas factories. The
expansion of Lotte Shopping’s foreign employment is more aggressive, particularly in
China, Indonesia, and Vietnam. The overall foreign employees increased by only 917 in
2012, but went up by 11,038 in 2013, which is more than 10 times that of the preceding
year.
Comparing the foreign shares of the three indices, it is evident that the ratio of
foreign to total assets is much lower than that of the other two (about 1/6 level of the
other two). The same data for the "100 largest non-financial TNCs from developing and
transition economies” show that the foreign shares for all three variables are around 60%
in 2013. Korea’s level of internationalization in terms of sales and employment is similar
to the global standard, but internationalization of assets lags far behind. Consequently,
there is much potential for Korean firms to expand foreign investment in the future.

112
4.2.2. Korea’s FDI in ASEAN30
4.2.2.1. Stages of development in Korea’s investments in ASEAN
Most of previous studies (e.g., Kim and Rhee, 2009; Kwak, 2007; Nicolas, Thomsen,
and Bang 2013; Yang et al., 2009) divided the stages of Korean MNCs’ FDIs based on
the economic development stage or government’s changing outward FDI (OFDI) policy.
However, there are two main limitations when applying these approaches to the case of
Korean MNCs’ FDIs in ASEAN. First, there is a time gap between the policy
introduction or implementation and its effects on the FDI outflows. In other words,
instead of the immediate influence on firms’ OFDI activities, the increase or decrease in
OFDI flows would occur a few years after the introduction of new policy. Second, these
approaches are for the overall foreign countries in general. Hence, we need a more
realistic stage model to analyze the changing trend of Korean MNCs’ FDI in the ASEAN
region. In this regard, Korean OFDI in ASEAN can be divided into four stages (see Table
4.4).
The first stage of OFDI in ASEAN was mainly driven by the resource nationalism
caused by the second oil shock. The Korean government relaxed OFDI restrictions and
removed prior approval system in 1981. Therefore, the main driver of OFDI in this
period by the Korean MNCs in ASEAN is resource-seeking.
Korean FDI in ASEAN took off in two periods (i.e. second and fourth stages). The
first period was the late 1980s when the Korean government liberalized its investment
policy, in order to overcome the appreciation of the Korean currency, high labor costs at
home, and trade conflicts. However, the OFDI in ASEAN driven by cost reduction was
not as significant as resource-seeking and export promotion FDI motivations. This might
be because more cheap-labor seeking OFDI went to China after the normalization of
30 This part is abstracted and extended some parts of chapters 3 and 5 of ASEAN Secretariat and UNCTAD (2016), which are partly contributed by Hwy-Chang Moon and Wenyan Yin.

113
relations with China since 1992. Hence in the second stage in ASEAN, the export-driven
FDI emerged along with resource-seeking FDI in the previous stage.
The OFDI liberalism slowed due to the 1997 Asian Financial Crisis, and the OFDI
flows also scaled down until the early 2000s when Korea’s domestic economy
completely recovered. During the recovery period, the Korean government further
relaxed the OFDI regulations and provided various support policies and measures. In
this stage, the FDI motivation of cheap labor-seeking became more significant than other
motivations – market- and resource-seeking FDIs.
The second take-off phase relates to the fourth stage, which took place after 2006.
During this phase, many Korean companies having already invested in China in the
previous stage moved their production facilities to ASEAN, along with a significant
increase in new investments. In contrast to previous stages, Korean FDI flows in stage 4
were led by large firms, particularly Korean chaebols after the 2008 Global Financial
Crisis. The number of large Korean companies that made overseas investments rose and
the amount that they invest also increased. More importantly, in this stage, Korean
MNCs invested in ASEAN by incorporating the region into their global value chains,
aiming to create synergies with other locations of value activities (e.g., China, Korea,
and advanced countries).

114
Table 4.4. Stages and Characteristics of Korean MNCs’ FDI in ASEAN
Stage Characteristics Drivers
Stage 1 (1982-1987)
Initial stage (Government-led industrialization)
Resource-seeking
Stage 2 (1988-1997)
Growing stage (Pre-crisis liberalization)
Resource-seeking, market-seeking (i.e., export promotion)
Stage 3 (1998-2005)
Restructuring stage (Post-crisis liberalization)
Resource-seeking, market-seeking (i.e., export promotion, local market penetration), cost reduction
Stage 4 (2006- )
Proactive stage (Acceleration of globalization)
Global value chain
Source: This table is abstracted and modified from ASEAN Secretariat and UNCTAD (2016)
4.2.2.2. Korea’s Top 20 MNCs in ASEAN
There are at least 3,77331 Korean companies, including large MNCs and SMEs, in
ASEAN. The top 20 most internationalized large MNCs of Korea have a presence in
ASEAN, with almost half of them establishing subsidiaries and facilities in multiple
locations across the region. Large Korean MNCs dominate the list with companies such
as Samsung and LG in electronics, POSCO in metals and infrastructure sectors and the
Lotte group in retail and chemicals. All of them have sales offices or representative
offices in addition to having main subsidiaries in the region. The industry in which some
of these Korean MNCs do business also influences the type of business (i.e., production,
sales or service corporation) in establishing their presence in ASEAN. For instance, in
the automobile industry, companies such as Hyundai Motor have regional headquarters
31 The figure is based on the record of Overseas Investment Information System of Korea (www.ois.go.kr), which provides the information of Korean firms investing abroad. According to this system, there is no record for Korean firms investing in Brunei Darussalam. Hence 3,773 incorporate Korean firms investing in nine ASEAN countries. This figure also includes only production, sales and service corporations, whereas local branches and liaison offices are excluded.

115
in Vietnam and Malaysia, including sales offices in other member states even though
Hyundai does not procure cars in ASEAN.
Aside from the top 20 Korean MNCs, other Korean companies have also invested
in ASEAN and they operate in a wide range of manufacturing and service industries.
Some Korean MNCs in ASEAN have extensive networks of subsidiaries in the region.
For instance, a total of 14 major Korean MNCs have a combined number of 116
subsidiaries in the region during 1977-2015. POSCO has the largest number of
subsidiaries (45) with one-third of them in resource-rich Indonesia and more than 70%
of them being established after the 2008 Global Financial Crisis. Samsung C&T and
Lotte Shopping have also established more than 50% of their subsidiaries in the region
after 2008. More than 70% of these 116 subsidiaries of the 14 Korean MNCs were
established in recent years, which suggest growing interests of large Korean companies’
investment in ASEAN.
Entry Strategy of Korean Top 20 MNCs in ASEAN
Korean companies have strong firm-specific advantages that they exploit when investing
abroad. Companies such as Samsung, LG, Hyundai Motor, and POSCO are among the
leading companies in their sectors with a substantial global market share. The
exploitation of such advantages can take many forms. While this section concentrates on
FDI with majority or wholly-owned subsidiaries, in many cases, such investments are
complemented by other modalities, including collaborative partnership agreements in
R&D, distribution, or contractual relationships within the value chain.
Majority-owned greenfield investment has been the predominant form of
internationalization for Korean companies, and this is also the case in the ASEAN region
(Moon and Yin, 2015). The 14 major Korean MNCs have a majority of their foreign
subsidiaries established with a majority ownership arrangement (see Table 4.5). The
modality depends not only on the preferences and ownership advantages of the investing
firm, but also on the availability of alternative modes of entry, as well as any restrictions
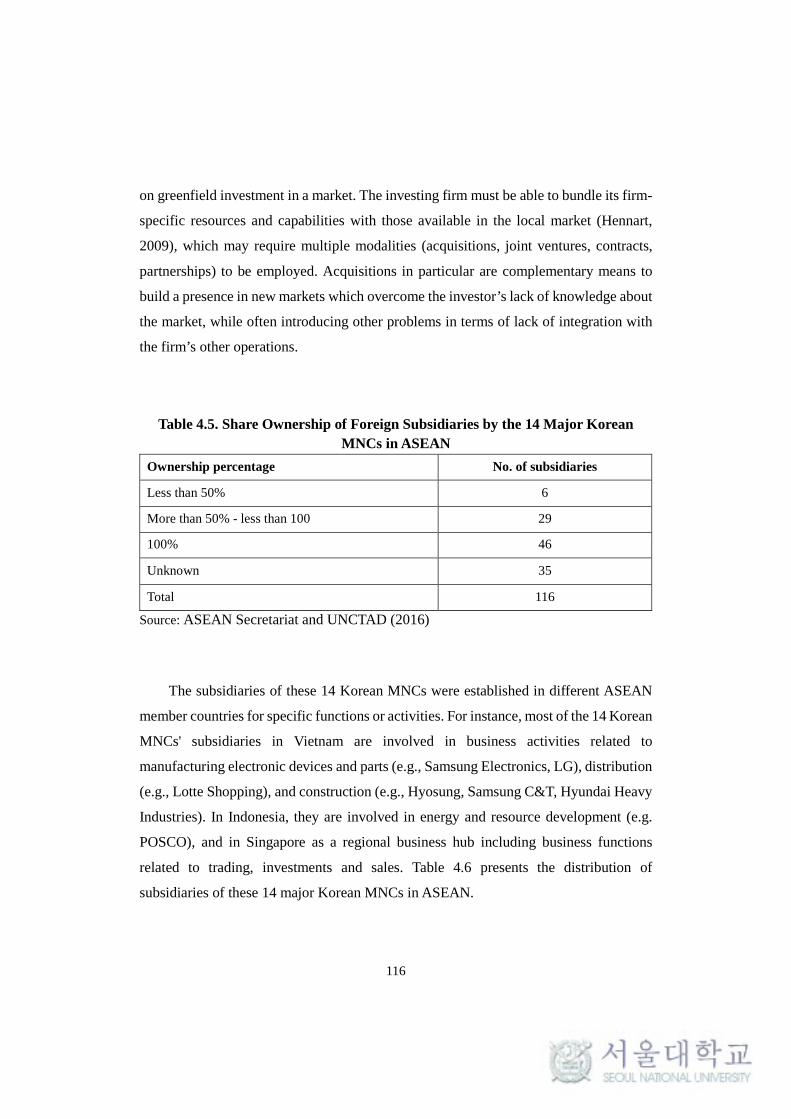
116
on greenfield investment in a market. The investing firm must be able to bundle its firm-
specific resources and capabilities with those available in the local market (Hennart,
2009), which may require multiple modalities (acquisitions, joint ventures, contracts,
partnerships) to be employed. Acquisitions in particular are complementary means to
build a presence in new markets which overcome the investor’s lack of knowledge about
the market, while often introducing other problems in terms of lack of integration with
the firm’s other operations.
Table 4.5. Share Ownership of Foreign Subsidiaries by the 14 Major Korean MNCs in ASEAN
Ownership percentage No. of subsidiaries
Less than 50% 6
More than 50% - less than 100 29
100% 46
Unknown 35
Total 116
Source: ASEAN Secretariat and UNCTAD (2016)
The subsidiaries of these 14 Korean MNCs were established in different ASEAN
member countries for specific functions or activities. For instance, most of the 14 Korean
MNCs' subsidiaries in Vietnam are involved in business activities related to
manufacturing electronic devices and parts (e.g., Samsung Electronics, LG), distribution
(e.g., Lotte Shopping), and construction (e.g., Hyosung, Samsung C&T, Hyundai Heavy
Industries). In Indonesia, they are involved in energy and resource development (e.g.
POSCO), and in Singapore as a regional business hub including business functions
related to trading, investments and sales. Table 4.6 presents the distribution of
subsidiaries of these 14 major Korean MNCs in ASEAN.

117
Table 4.6. Number of Subsidiaries in ASEAN of the 14 Major Korean MNCs
Country No. of subsidiaries Country No. of subsidiaries
Vietnam 29 Thailand 11
Indonesia 28 Myanmar 7
Singapore 18 Philippines 6
Malaysia 16 Cambodia 1
Source: ASEAN Secretariat and UNCTAD (2016)
4.2.2.3. Korean SMEs in ASEAN
Korean SME investment projects in ASEAN rose substantially in recent years along with
the surge of investments by large Korean MNCs in the region. ASEAN is a key
destination for FDIs by Korean SMEs. Various economic reasons and locational factors
contributed to this trend. Korean SME investments in ASEAN is concentrated in
Vietnam, followed by Indonesia and Singapore. In 2015, Vietnam accounted for more
than two-thirds of Korean SME’s FDIs in the region. The rise in Korean SMEs’ FDI in
Vietnam was mainly driven in manufacturing activities by large scale investments of
Korean technology giants such as Samsung and LG. These large Korean MNCs
encouraged their part and component suppliers from the home country to operate close
to them in the host country.32
Employment
In order to investigate Korean SMEs’ employment generation in ASEAN, this section
32 Examples of Samsung Electronics’ part and component suppliers investing in Vietnam are Woojeon (smartphone cases), MCNEX (Camera modules), Flexcom (Flexible Printed Circuit Board, FPCB), INTOPS (smartphone cases) (ETNews, 2014).

118
selected top 10 Korean SMEs, in terms of the size of local employment, for each ASEAN
member states. 33 These 81 overseas subsidiaries in ASEAN generated 124,565
employees in total, including 123,704 local people and 861 Korean staff, which are less
than 1% of local employment (see Table 4.7).
Table 4.7. Industrial Distribution of Employment by Korean MNCs
Industry No. of
subsidiaries
Employment
Koreans Local
employees Total
Manufacturing 59 (73%) 809 122,744 123,553
Wholesale and retail 9 (11%) 15 161 176
Construction 6 (7%) 27 728 755
Service 4 (5%) 5 48 53
Transportation 2 (2%) 4 18 22
Finance & insurance 1 (1%) 1 5 6
Total 81 (100%) 861 123,704 124,565
Source: ASEAN Secretariat and UNCTAD (2016)
Out of these 81 subsidiaries, 59 (73%) engage in the manufacturing industry,
particularly the textile and apparel sector. They employed 123,553 people in total (809
Korean staff members and 122,744 local people), accounting for 99% of total
employment by the 81 sample subsidiaries. Nine subsidiaries were engaged in wholesale
and retail service sector, which were mostly located in Singapore. The nine firms
33 The data are abstracted from Overseas Investment Information System of Korea Trade-Investment Promotion Agency, which provides various information, including local employment by the overseas subsidiaries of all the Korean firms investing abroad. We exclude subsidiaries for which parent companies are unknown. There is only one subsidiary in Lao PDR, and no record for Brunei Darussalam.

119
employed 176 people (15 Koreans and 161 local employees). Another six subsidiaries
engaged in construction sector, employing 755 people, including 27 Koreans and 728
local workers.
In terms of the geographical distribution, Korean SMEs in Indonesia created the
largest number of employees with 49,966 people, including 45 Koreans and 49,921 local
people. Vietnam witnessed the second largest employment of 41,773 persons and the
Philippines followed with the third largest number of employees with 15,364 people (see
Table 4.11). Therefore, Korean SMEs generated significant employment in ASEAN host
countries.
Table 4.8. Geographical Distribution of Employment by Korean MNCs
Country Employment
Koreans Local employees Total
Cambodia 31 7,754 7,785
Indonesia 45 49,921 49,966
Malaysia 33 580 613
Myanmar 20 5,186 5,206
Philippines 64 15,300 15,364
Singapore 17 61 78
Thailand 43 3,737 3,780
Vietnam 608 41,165 41,773
Total 861 123,704 124,565 Source: ASEAN Secretariat and UNCTAD (2016)
Unconventional Drivers and Motivations of FDI by Korean SMEs
Korean SMEs have been traditionally motivated to invest in this region, through

120
resource-, efficiency-, and market-seeking FDI. In addition to the conventional FDI
motivations, some other types of unconventional motivations can be found in Korean
SMEs investment in ASEAN. As the three motivations (i.e., technology learning, labor
management relations, and market learning) which are more popular for firms investing
in advanced countries, have not been pursued significantly by the Korean SMEs
currently in the ASEAN region. As such, this section mainly deals with the other five
types of unconventional FDI, classified under two factors of the Porter's diamond model
- related and supporting industries and firm strategy, structure, and rivalry.34
Follow-the-customer. Firms that invest abroad become driven by this motivation
when they follow their customers abroad to keep custom or business relationship. Many
cases of Korean SME investment in ASEAN are to follow the footstep of their customers'
investment in the region. Many Korean SMEs investing in the electronics sector in
ASEAN are part and component suppliers of large Korean firms. For example, the
establishment of mobile phone manufacturing plants of Samsung Electronics in Vietnam
attracted nearly 100 suppliers of Samsung (including its affiliates and domestic
cooperative firms, including Korean SMEs; see box table 1) to Vietnam since 2009. Tens
of Korean firms have also decided to invest in Vietnam for parts production to support
$1.5 million project of LG Electronics in Haiphong City. There was a sharp increase in
FDIs in ASEAN by both Korean large firms and SMEs particularly after 2011, in the
sector of electronics manufacturing.
Infrastructure. This motivation is to exploit the infrastructure of host countries to
reduce costs in communication and transportation. Many Korean SMEs choose to
operate in industrial parks or industrial complexes that provide better physical
infrastructure and connection. In the case of Vietnam, before the announcement of a
protocol (Decree24/2007/ND-CP) on the new corporate income tax in 2007, Korean
large firms chose industrial parks which were provided with well-developed logistics
and other industrial infrastructure, whereas majority of the Korean SMEs selected other
34 For more information about the general analysis of this, see Moon and Roehl (2001) and Moon (2007).

121
non-industrial zones because of lower rents. However, after the 2007 protocol, not only
Korean large firms but also SMEs tend to establish their manufacturing plants in the
industrial zones in spite of higher rental fees, because of the benefits of corporate income
tax in the industrial zones (Korean Ministry of Knowledge Economy, 2008).
For instance, Korean SMEs’ subsidiaries (e.g., Dongsin, Mobase, Daewon Vina)
chose to locate in Yen Phong Industrial Park of Bac Ninh Province in Vietnam, where
the annual rental is the most expensive in Vietnam industrial parks. In addition, many
Korean SME suppliers of Samsung Electronics (e.g., JK Vina, JuKwang Precision,
Seohwi Vina) are located in Diem Thuy Industrial Zone, near its second smartphone
factory in Yen Binh Industrial Park in Vietnam.
Regulation bypassing. This motivation aims to avoid domestic restrictions and
take advantage of trade quota privileges or low tariff rates of host countries. Under the
ASEAN Trade in Goods Agreement, duty rates for trading most goods have been zero
or reduced to 5%, among six ASEAN member states (Brunei Darussalam, Indonesia,
Malaysia, the Philippines, Singapore, and Thailand); the effective rate for other four
member states will come into force by 2018. Moreover, the recent growth of Korea’s
textile and apparel firms investing in Vietnam is not only because of exploiting local
cheap labor, but also of bypassing the regulations and access to other advanced countries
for exports. By 2015, there were around 600 Korean firms in this sector; Hyun Jin
Corporation, a Korean SME, along with other Korean large firms (e.g., Panco,
NOBLAND, Youngone), is included among the top export firms in the textile and
apparel sector in Vietnam (KOTRA, 2015).
Catch-up. This motivation is pursued by firms when they invest abroad to imitate
or offset the advantages of their competitors going aboard. The new paradigm of firm
competitiveness shifts from competition among single firms to the entire ecosystem led
by the leading firm (Moon, 2016b). For example, Samsung and LG are the major rivals
in both Korean and international electronics markets; their overall competitiveness
highly relies on their suppliers’ competitiveness. Therefore, Samsung’s (or LG’s)
suppliers cooperate with Samsung (or LG), but compete with their counterparts of LG

122
(or Samsung). Therefore, after the entry into Vietnam by many Samsung’s Korea-based
suppliers, LG suppliers also invested in Vietnam (e.g., Trang Due Industrial Park,
in Haiphong City), in order to keep up with the competitiveness of Samsung’s suppliers.
Strategic location. Strategic location refers to the key market, for taking the
locational advantage, where firms can achieve various strategic objectives. For example,
Korean SMEs’ cooperation with Singapore-based companies helps the former focus on
technology development while providing the latter with roles to penetrate markets in the
region given that Korean SMEs lack experiences with local management and marketing
matters. For example, a Korean startup Neo Pop which manufactures LED pet collars by
inscribing texts such as the name of the pet and mobile phone number for emergency,
invested in Singapore not only for its best business environment for startups, but also for
its strategic location as a business hub connecting the large Southeast Asian market.
Some Selective Cases of Korean SMEs in ASEAN
Table 4.9 provides key features of the 12 cases presented in this section35. Most of these
companies are in apparel business and have been established for 20 to more than 50 years.
Some of them are competitive companies in the global market specializing in the
business and industry. Although most of them supply products to global brands, through
Original Design Manufacturer (ODM) or Original Equipment Manufacturer (OEM)
methods, many of them have also established their own in-house R&D facilities for
design and product development. The more detailed information is provided in Appendix
regarding the 12 SMEs’ FDI in ASEAN.
35 According to the revised version of Small and Medium-Sized Enterprises Basic Act in Korea, the criteria of small and medium-sized firms are as follows: (1) The three-year average sales value should be less than a certain level, which varies across different industries (e.g., apparel and textiles, lower than 150 billion Won); (2) The company asset should not exceed 500 billion Won; and (3) The company should not belong to any other business groups.

123
Table 4.9. Basic Information on the 12 Korean SMEs
Business sector Year Countries
1. Hyun Jin Apparel 1987 Vietnam
2. Sees Global Sports gears 1970 Vietnam, Cambodia
3. MSA Apparel 1992 Vietnam
4. Suy Apparel 1991 Vietnam, Indonesia, Philippines
5. Gomundang Printing Printing and packaging 1962 Vietnam
6. Dada Headwear 1974 Vietnam, Indonesia,
7. Molax Trading Apparel 1996 Vietnam, Indonesia,
8. Kyung Seung Apparel 1994 Vietnam, Indonesia,
9. Doing-In Entech Aluminum frame backpacks, sports equipment, and carts
1992 Vietnam, Philippines
10. PSMC Electronics parts and die manufacturing
1978 Philippines
11. FTN Apparel 1974 Vietnam, Indonesia, Philippines
12. Kumnumg Molds electric appliances 1993 Thailand
Source: ASEAN Secretariat and UNCTAD (2016)
4.2.2.4. Korean MNC-SME Production Networks and Business Linkages
The old paradigm of MNCs’ overseas investments is often focused on single motivation,
such as seeking cheap labor or the market potential of the host country. Yet, the new
paradigm for FDI, seeking locational advantages to maximize synergies by linking other
activities located in other countries, gives rise to the importance of GVC participation.36
36 The GVC participation rate can be measured using two elements: backward participation and forward participation. See Chapter 2 for details.

124
This is because the fragmentation of value activities requires that firms deploy their value
chain activities in the locations where they can perform most efficiently, and foster
cooperation with other firms all over the world, thereby allowing them to complement
their relative lack in resources (Moon, 2016a). Such kind of efficient firm networks
across national borders can benefit firm operations and profits.
Until the mid-2000s, no more than 10 large Korean companies invested in Vietnam.
After the 2008 Global Financial Crisis, however, Korean large MNCs that produce
electric and electronics increased their investments in Vietnam. Many firms in textile,
apparel, and footwear industries also shifted their existing investments from China to
Vietnam. Large Korean retail and supermarket chains such as Lotte and E-mart are
actively expanding their presence in Vietnam, and they are also influencing many of their
Korean suppliers to invest in the host country (Business Korea, 2014). The presence and
recent surge in investments by large Korean firms have also encouraged FDIs by Korean
SMEs, and many of them are suppliers of parts and components. This symbiotic
relationship between Korean MNCs and SMEs strengthens the production networks and
linkages between them in the ASEAN region. Korean firms are also building linkages
involving indigenous ASEAN suppliers.
The number of new large firms investing in Vietnam rose from 16 in 2009 to 39 in
2015 and the number of new Korean SMEs rose from 91 to 331 during the same period.
A majority of Korean SMEs’ investments went to manufacturing sector. Korea is the
largest foreign investor in Vietnam because of the recent surge in investment by Korean
large companies and SMEs. The host country has emerged as a global manufacturing
hub for Korean electronics firms.
The establishment of large Korean electronics companies together with their
affiliates and suppliers in Vietnam has expedited the industrial transformation of the host
country. Until 2009, the manufactured exports of Vietnam were footwear, apparel, and
furniture, but in 2013 the top manufactured exports were electrical and electronic
equipment (OECD and World Bank, 2014). As a result, Vietnam has become a major
mobile phone production hub. Korean MNCs in particular contributed to Vietnam’s

125
structural shift towards more sophisticated and higher value-added exports (OECD and
World Bank, 2014). Vietnam provided more incentives for FDI in higher value-added
sectors. The Vietnamese government has given the preferential incentives to many large
electronic firms, such as Intel in 2006, Samsung in 2010, and Nokia, Bosch, and LG in
more recent years.
4.2.3. Conclusions
Korean firms are making strong inroads in ASEAN. Various factors drive them to invest
in ASEAN. More importantly, Korean companies are increasingly investing abroad for
a combination of reasons rather than just on a single motive basis. ASEAN’s integration
and complementary locational advantages provide an attractive platform for Korean and
other investors, large and small, to build their regional production networks or value
chains liking to a greater global value chain process in which they participate and lead.
Some Korean MNCs continue to look for even lower cost locations. For example,
Samsung Electronics is negotiating with Myanmar to establish new manufacturing
facilities to reduce costs and achieve production efficiency. Facing new challenges,
Korean SMEs should continue to follow their existing customers (i.e., Korean large firms
or multinationals) when they move to lower cost countries, but they also need to consider
expanding their customers, from Korean MNCs to other MNCs in the region. This
dynamism, bringing enhanced competition and cooperation, will shift the GVC of firms
to the global ecosystem of the region.
Likewise, the prospect for further growth in FDI by Korean SMEs is also promising.
As large Korean MNCs increase their scale of investment in ASEAN, they continue to
attract and encourage Korean SMEs to operate closely as their suppliers or contract
manufacturers in the host region. Increasing costs in Korea and the need to expand sales
will continue to drive Korean SMEs to establish a strong presence in the rapidly growing
ASEAN region. This will lead Korean SMEs to play a pivotal role in linking ASEAN to
the GVC in global electronics and garment, including establishing a high level

126
benchmark for ASEAN SMEs to emulate. Some Korean firms source materials and
subcontract part of their operations to ASEAN companies and local SMEs. In this
context, they help forge increasing business linkages with ASEAN SMEs.

127
CHAPTER 5. A CASE STUDY: APPLE AND SAMSUNG
ELECTRONICS
5.1. Methodology
This chapter develops a case study to illustrate and prove the two newly introduced
frameworks – namely the integrated framework of global value chain (GVC) strategy
and three conditions for externalization. A case approach has two main objectives. One
is to build on a theory based on the findings and insights from either single or multiple
cases. The other is to elaborate on an extant theory or a framework by making it clearer
(Eisenhardt, 1989; Kotabe et al., 2007; Lukka, 2005). The goal of case study in this
chapter follows the second one.
The case approach is particularly useful to address the questions of “how” and
“why,” and it also has the strength of tracking the changes over time (Yin, 2003). In this
sense, by conducting the case approach, this chapter can investigate how distinctive
multinational corporations (MNCs) pursue similar GVC strategies – combining both
internalization and externalization governance for generating higher values, and also
why (or the motivations) these firms externalize some value chain activities in spite of
their strong ownership advantages in those activities. I selected two companies, Apple
and Samsung Electronics, to highlight the differences as well as the commonalities in
the smartphone business regarding the GVC strategy and the determinants for
externalization decisions. There are three main reasons behind the case selection.
First, the industry has a global significance. Since its first launch in the market in
2007 by Apple, the volume and revenue of this business in a global scale have grown
significantly. After ten years, the industry developed from a growing stage into a mature
stage, because many emerging country MNCs, China in particular, entered this industry
and accelerated the competition among firms. Moreover, smartphone business is
128
different from conventional manufacturing sectors, where the product itself comprises
physical components. The smartphone, as Porter and Heppelmann (2014) described, has
three core elements: physical components, smart components, and connectivity
components. 37 Such transformation will reshape the value chain, which deserves
additional research for driving new findings and insights for GVC strategy.
Second, because of the increasing pressures from competition, firms disperse their
value chain activities globally either to reduce production costs or enhance their product
differentiation. There are also extensive outsourcing practices pursued by firms. Apple
and Samsung Electronics are the two leading firms in the smartphone industry, where
Apple accounted for the largest share of industrial profits, and Samsung Electronics was
the largest producer in terms of shipments of smartphones. Therefore, the two most
successful firms are particularly useful to address the research questions.
Lastly, despite the different business scopes, the smartphone business is the flagship
product or business for both companies, and the sales of smartphone (or related
businesses) accounted for a significant portion of the annual sales for both companies.
Apple used to be a computer company, but became a first mover in the smartphone
business. Currently, the iPhone sales revenues represented 63% of Apple’s entire revenue
in 2016 (see Table 5.1). On the other hand, Samsung Electronics, as a traditional
manufacturing firms, engages across various manufacturing industries, from home
appliances to mobile handsets, from finished goods to parts and components. However,
the revenue earned by IT & Mobile Communications (including smartphone and other
related business) accounted for 45% of its entire revenue in 2016 (see Table 5.1). With
regards to the share of profits to their entire businesses, the smartphone business makes
up even larger portion. This provides the legitimacy of comparing the two companies’
GVC strategies in the smartphone business.
37 Smart components are comprised of the sensors, microprocessors, data storage, controls, software, an embedded operating system, and enhanced use interface. Connectivity components are comprised of the ports, antennae, and protocols enabling wired or wireless connections with the product (Porter and Heppelmann, 2014).

129
Table 5.1. Annual Sales of Apple and Samsung Electronics (2016)
Apple’s Sales by product Divisional Sales & Ratio
Product Sales ($ millions) Division Sales (KRW trillion)
iPhone 136,700 (63.4%) IM 100.30 (44.9%)
iPad 20,628 (9.6%) CE 45.10 (20.2%)
Mac 22,831 (10.6%) DS Semiconductors 51.16 (22.9%)
Services 24,348 (11.3%) DP 26.93 (12.0%)
Other products 11,132 (5.2%) Total 78.15 (35.0%)
Source: Apple sales: Annual Report 2016, Samsung Electronics sales: Samsung (2017/4/27) Note: IM: IT & Mobile Communications, CE: Consumer Electronics, DS: Device Solutions, DP: Display Panel.
In this chapter, case studies are conducted by using diverse and broad empirical
base including both primary (company documents such as annual report) and secondary
sources (newspapers, periodicals, online articles, academic papers, and consulting
reports). The following of this chapter is comprised of three main parts: (1) a brief
introduction of the two companies; (2) the GVC strategy of the two companies by
applying the integrated GVC approach, focusing on examining the organizational
governance of value creation among the value chains; and (3) the externalization choices
of the two companies by applying the three conditions.
5.2. Apple and Samsung Electronics: Company Profile
5.2.1. Apple Inc.
Apple, a California-based company, was established in 1977. Until 2006, Apple had been
known as Apple Computer Inc., a company that made computers and portable music
players. The two products (iPod: 39.7%, Mac: 38.2%) accounted for nearly 80% of its

130
revenue in 2006. However, in 2007 it removed the word “computer” and added “Apple
Inc.,” which reflects the shifting focus towards consumer electronics and digital
distribution (Johnson et al., 2012). After ten years, iPhone has become its dominant
source of revenue creation, which accounted for about two-thirds (63.4%) of its revenue
in 2016, and overshadowed Apple’s other products. Mac products, the second largest
source of revenue, only accounted for 10.6% (Wall Street Journal, 2017/6/29, 2017/6/20).
The launch of the iPhone in 2007, one of the best-selling products in history, has
transformed Apple in various dimensions (see Table 5.2), and help it turn into the world’s
most valuable publicly traded company.38
Table 5.2. The Growth of Apple in the Past Decade (2006-2016)
2006 2016
Employees * 18,000 116,000
Building space (million sq. ft) 6.8 29.3
Sales (billion) 19.32 215.64
Profit (billion) 1.99 45.69
Cash (billion) 6.39 237.59
Asia Pacific / China sales (billion) 1.35 (Asia Pacific) 48.49 (China)
iPod / iPhone units (million) 39.4 (iPod) 211.9 (iPhone)
R&D (billion) 0.71 10.04
Source: Wall Street Journal (2017/6/20) Note: * Full-time equivalent employees
38 In 2016, its market value was even less than a quarter of Microsoft Corporation’s, but by June 28, 2017 its market value was more than 1.5 times that of Microsoft’s (Wall Street Journal, 2017/6/29).

131
Apple’s business can be categorized into three types, including product, software,
and services. To be specific, it designs, manufactures, and markets mobile
communications and media devices, personal computers and portable digital music
players. It also sells related software, services, accessories, and third-party digital
content and applications. Its customers include consumers, small and medium-sized
businesses and education, enterprise, and government. Consumers (i.e., B2C business)
are still its major source of income. Due to the high price of iPhone, its primary target
focus is middle and upper-class income people. However, because of the slowing growth
of iPhone39 it tries to diversify its business portfolio and also looks for new customer
group. The B2B or B2G businesses (company or government) are becoming its new
targets, since they have higher purchasing capability, and are less sensitive to product
prices. Moreover, Apple has been more reliant on the growth of the developing countries.
In 2006, the sales in the Asia-Pacific (excluding Japan) accounted for only 7% of its
revenue, but in 2016, greater China alone comprised 23% of its revenue.
5.2.2. Samsung Electronics
Samsung Electronics, a Suwon (in South Korea)-based company, was established in
1969. It is the flagship of Samsung Group, and makes up nearly 50% of the Group’s
sales. At the early stage, the main products of Samsung Electronics were electronics
appliances such as television, air conditioners, and washing machines. Since the mid-
1970s, it expanded into higher technology and value-added businesses, namely
semiconductor. After a decade it has developed as a major company in the world for
producing the memory, and currently it has grown as a leading manufacturer of
electronic components such as batteries, semiconductors, memory, and display panels
for global clients, such as Apple. For example, it currently dominates the global OLED
39 The Strategy Analyst expected a 3% growth only in the world total shipments of smartphones in 2017, and the growth rate will fall to the level of 2% in 2018 and 2019 (IT Chosun, 2017/7/2).

132
market, by accounting for 98% of its market share. More recently, the company
diversified into consumer electronics, and it is the world’s top maker of smartphones.
The company currently has three main businesses, including IT & Mobile
Communications, Consumer Electronics, and Device Solutions. The department of IT &
Mobile Communications mainly deals with mobile communication business and
network business; the department of Consumer Electronics covers visual display, digital
appliance, printing solutions, and health & medical equipment business; and the
department of Device Solutions focuses on memory and system LSI business.
Like Apple, the mobile division is also the top earner for the company as shown in
Table 5.1, and many question the sustainability of their (both Apple and Samsung)
business in the face of growing competition from premium model producers and cheaper
Chinese rivals, by relying on its large portion from a single business or product (e.g.,
Reuters, 2016/7/7; Wall Street Journal, 2017/6/20). However, there is a critical difference
between Apple and Samsung Electronics. For Apple, the iPhone accounts for the largest
share in both its sales and profits, whereas Samsung Electronics, its largest source of
sales comes from the IM division (or smartphone), but the profits from DS division (or
parts and components) comprises larger share than IM division. This is particularly
evident since 2015, and about four-fifths of profits (77%) rely on the DS division in the
first quarter of 2017 (see Figure 5.1).

133
Figure 5.1. Profits of Samsung Electronics by Division (trillion KRW)
Source: Wikiwand website
5.3. The GVC Strategy of Apple and Samsung Electronics
Apple and Samsung are well known for their different strategies for manufacturing the
world’s top branded smartphones: iPhone and Galaxy. However, if the two companies
are compared from the GVC perspective, some important similarities can be found. The
following investigates the governance (internalization vs. externalization) of nine value
chain activities of Apple and Samsung Electronics regarding their smartphone business,
and then conducts a comparative analysis and provides some useful implications.
5.3.1. Apple’s Global Value Chain
5.3.1.1. Inbound Logistics
Apple has been well-known for its superior advantage in supply chain management
(SCM). Gartner, Inc., which released the annual Supply Chain Top 25, has removed
Apple from the list and categorized Apple into New Masters Category, because of its

134
perennial leadership in the SCM since 2015. The key factor of Apple’s supply chain
competitiveness relies on its effectiveness (Johnson et al., 2012). In order to formulate
an effective supply chain system, Apple contracts with numerous different suppliers
around the world. Apple outsources most of its parts and components to about 200
suppliers and more 700 subsidiaries around the globe, particularly those in Germany, the
US, Japan, and Korea. Many come from multiple sources, which also supply to other
customer firms in addition to Apple. However, some customized components come from
a single or limited sources, and these suppliers usually have only one customer, Apple.
Although Apple does not have direct ownership over these suppliers, it highly
controls in the manner that Apple provides capital investment or design of the
components, whereas suppliers are in charge of the production only. For example, the
component of system-on-chip (apps processor) is designed by Apple and produced by
Taiwanese based company named Taiwan Semiconductor Manufacturing Company
(TSMC). Apple also invests billions of dollars in component manufacturing plants
through which it could bargain for a good price and exclusive rights for production of a
certain period time on one hand, and the supplier could enhance their production
capabilities on the other (Bloomberg, 2012/11/9).
5.3.1.2. Operations
By 2016, Apple has only contracted with two Taiwanese based companies Foxconn and
Pegatron for assembling Apple’s iPhones in China. Apple traditionally had only one
assembler, Foxconn, employing millions of workers in its manufacturing plants in China.
Although recently Foxconn has gradually increased its use of automation, it mainly
relied on the long assembly lines with little automation, which is very similar to the
Ford’s approach 90 years ago. Foxconn employed unskilled workers who engaged in the

135
tasks featuring short cycle times and high repetition.40 Such system contributes to the
low communication among workers, high productivity, and quality control.
However, since the early 2010s, Foxconn has increasingly been accused of low
working conditions (e.g., working overtime 41 ) and employing many students and
children workers. This resulted in the suicide of employees in Foxconn factories, which
had also negative impacts on Apple’s image. In response to this, Apple committed
heavily in improving the workings conditions of Foxconn. Therefore, unlike the
traditional OEM type of outsourcing, the partnership between Apple and Foxconn is
closer and inter-connected. Apple committed a certain level of capital investment in
manufacturing process equipment and technology transfer to make it sure that Foxconn
could maintain and upgrade the product quality.
In order to diversify the risks and increase the bargaining power of Apple against
Foxconn, Apple secured another assembling company named Pegatron. However,
Foxconn still produces majority of Apple’s products by employing more than one
millions workers in China. On the other hand, despite the efforts of Foxconn which tried
to decrease its reliance on Apple, about half of its sales are derived from Apple. Due to
the slowing growth of Chinese market, Apple outsourced to another Taiwanese based
company (i.e., Wistron) in addition to the existing smartphone manufacturing facilities
in India, to manufacture low-priced smartphones in India to mainly serve the fast-
growing Indian market. The reason behind employing a new assembler is that Apple
could reduce its reliance on Foxconn and Pegatron, which helped Apple’s objective of
reducing production costs and supply-chain risks.
40 These workers came from different provinces in China with different local languages. Few workers could speak English and many could also not speak or understand other region’s languages or dialects. Therefore, workers seldom communicated with each other. Moreover, the short cycles also reduced the necessity or time for workers to community and exchange the experience with others. 41 More than 70% worked 10 hours or more a day. The average overtime a month was 83.2 hours, whereas the monthly overtime allowed by official labor laws is 36 hours (Chan, 2010).

136
5.3.1.3. Outbound Logistics
Outbound logistics refers to the movement of the product to the market, and Apple’s
outbound logistics includes warehousing and distribution (Research Methodology, 2017).
Apple’s products were shipped from China to the US and are kept at its own warehouse
(Elk Grove Central warehouse) in California. Apple transformed the Elk Grove Central
warehouse into the logistics center, which plays the role of warehousing, distribution,
and customer support call center. Some other sources also mentioned Elk Grove takes in
charge of delivering iPhone repair and logistics (Business Journal, 2015/12/7). In order
to streamline the process and achieve massive cost savings, Apple has only one
centralized warehouse in the US. By combining with other functions, iPhones are
redistributed to the US and global distribution centers, or the consumers directly.
Recently, the e-commerce sales have become a key channel of sales because of its cost
effectiveness compared to the methods of offline sales. Apple in fact has become the
third largest retailer in the US after Amazon and Wal-Mart, thanks to the e-commerce
business (Research Methodology, 2017).
When iPhones are shipped to the warehouse and other distributions centers, Apple
normally chooses the air freight service provided by Fedex or UPS for fast delivery and
low cost. The organization of the distribution network is in such a manner that the
warehouses and retail stores get enough supply in order to meet high levels of demand.
Tim Cook once said “Inventory is fundamentally evil,” because inventory of
technological products like iPhone depreciates extremely fast, losing 1-2% of its value
a week for example (Pham, 2015). Therefore, the effective inventory management is
very important for costs reduction.
5.3.1.4. Marketing & Sales
Apple sells its products through both internal and external channels. Internally, iPhones
are sold through its own retail stores (i.e., Apple Store) and online through the Apple

137
website. Apple well knows the importance of interaction with customers. Firstly, the
knowledgeable salespersons can better deliver and demonstrate the value of its
innovative and differentiated products. Second, Apple also believes that the direct
contact with the customers can help it understand their needs and respond to their
feedback immediately. By 2016, it possessed 670 Apple stores around the world. These
stores are placed in high-traffic locations in quality shopping malls and urban shopping
districts in order to better attract the sophisticated consumers’ attentions.
To ensure a high-quality buying experience of its products, the company continues
to build and improve its sales capabilities by expanding the number of its own retail
stores worldwide in which service and education are emphasized. This resulted in heavy
investments in marketing and sales, which amounted to $14 billion, accounting for 7%
of its total revenue in 2016.42 Apple’s online sales are also making tremendous success.
According to Internet Retailer, the e-commerce research firm, Apple already has a great
online sales performance in 2013; it not only became one of the top retailers in the US,
but also showed faster growth than Amazon (Dormehl, 2014).
On the other hand, Apple highly relies on the external sources, including third-party
cellular network carriers, wholesales, and retailers. Although Apple Stores are much
more productive on a per-unit basis, the number of stores is very small, compared to
other retailers which possess thousands of stores. This thus keeps Apple to rely much on
other third parties such as carriers and retailers. The sales through external sources
accounted for 75% of its total sales in 2016. The two US carriers (AT&T and Verizon),
the two largest sources for selling iPhones, accounted for more than 50% of iPhone sales
during the period of 2011 and 2012. The sales of iPhone in Apple Stores accounted only
one-fifth, lower than the two carriers but at least two times that of other retailers.
Carriers play important roles in the sales promotion of iPhones. Steve Ballmer, the
former CEO of Microsoft even said Apple’s iPhone succeeded because of carrier
subsidies (Recode, 2016/11/7). The average price of iPhones is over $600, and carriers
42 Compared to other retailers in the US, Apple’s revenue per square foot is higher, and thus Apple’s retail stores are more productive than those retailers (Paczkowski, 2012).

138
are covering $400 and more of the cost of phone, while the consumers pay the rest of the
costs under the two-year contract condition of the Internet service (Business Insider,
2014/4/22). However, many argue that this is actually a cheating because carriers are
actually transferring the entire costs to the consumers through monthly payments, and
thus it could hurt the sales of Apple in the end by delaying the upgrade to new models.
Although there are still inconsistency regarding the positive role of carriers on the sales
promotion of iPhones, since the iPhone is very pricey, the two-year installment could
reduce consumers’ burden in the short term, and thus expand the potential target of
customers.
5.3.1.5. Service
Apple is famous for its exceptional quality of customer services during all three stages:
pre-purchase, during-purchase, and post-purchase (Research and Methodology, 2017).
Apple provides after-sales services through its Apple stores around the world or the
external parties such as Apple’s authorized service providers and the local network
carriers. It usually takes 3-5 business days to repair the products (see Table 5.3).
Table 5.3. The Repair Sources and Approximate Time for iPhones
Repair source Approximate time
Send to Apple 3-5 business days
Bring to an Apple Store appointment Up to 5 business days
Bring to an Apple Authorized Service Provider Up to 5 business days
Bring to your carrier Ask your representative Source: https://support.apple.com/iphone/repair/service

139
In addition to the above options, in fact, there are alternate services specializing in
fixing the iPhones which take shorter time and cheaper than the official Apple and its
authorized service providers. The iCracked is a good example. In addition to repairing
the iPhone and iPad, it also repairs other smartphone brands, such Galaxy. Once a
consumer registers through the iCracked website, the company will check whether there
are any technicians (i.e., iTech) near the customers’ location. Then iTech will send the
message within minutes and make an appointment for visit and repair. Regarding the
price, for example, it normally costs $130 to exchange a new screen for iPhone 5
(different for various iPhone models), but the repair could charge much higher by Apple
(e.g., $269 for iPhone 5) (Business Insider, 2014/5/10). Therefore, the above case shows
that Apple’s after service cannot be regarded as the most competitive at least regarding
the speed and price.
5.3.1.6. Procurement
This activity within Apple’s chain of support operations relates to the ways resources are
acquired for the business. Due to the size and scope of Apple’s business operations, the
company runs complex procurement activities on the global scale. The range of
resources used by Apple include, but are not limited to, metal, glass, and a wide range
of parts and components. Apple obtains its raw materials from the US, Europe, China
and other Asian countries for assembling in China. As shown in Table 5.4, although the
percentage of payments to manufacturing purchase obligations has decreased around by
10%, it still makes up two-thirds of the total costs of contractual payments. On the other
hand, expenditures on operating leases witnessed fast growth by 1.5 times over the last
three years (2014-2016), due to the strong investment in the retail stores and facility
leases.

140
Table 5.4. Payments under Contractual Obligations ($ million, %)
Items 2014 2015 2016
Operating leases 4,987 (15) 6,271 (15) 7,627 (18)
Manufacturing purchase obligations 24,529 (75) 29,464 (69) 28,591 (67)
Other purchase obligations 3,351 (10) 7,261 (17%) 6,620 (15)
Total 32,867 42,996 42,838 Source: Apple annual report 2016 Note: Operating leases: retail store and other facility leases; Manufacturing purchase obligations: components for outsourcing suppliers (periods up to 150 days); Other purchase obligations: commitments to acquire capital assets (e.g., product tooling and manufacturing process equipment) and advertising, licensing, R&D, internet and telecommunications services, energy, etc.
5.3.1.8. Technology Development
One of the widely acknowledged core competences of Apple is superiority in technology
development. Although, since the succession of the leadership of Tim Cook, Apple is
criticized for putting less focus on innovation, but more on introducing similar products,
the research and development (R&D) expenditure in fact has grown much faster ever
before, and has been selected as the most innovative company by PwC’s “The Global
Innovative 1000” since 2010 (PwC, 2016). In 2016, Apple spent $11 billion, which
accounted for 5% of the entire revenue, whereas it was less than 1% ten years ago. This
is because Apple has to seek new engine of growth to compliment the iPhone to sustain
its competitive position in the market (Business Insider, 2017/2/1).
Until 2012, Apple had only domestic R&D center, but since then Apple established
the first overseas R&D center in Israel, and more recently it opened and plans to open
additional R&D centers in Japan, China, Indonesia, France, Japan, Sweden, and the UK.
The two R&D centers established in Beijing and Shenzhen are aimed to strengthen
relationships with local partners and universities, whereas the R&D center in Israel aims

141
to develop apps and also encourages cooperation with Israelis. In spite of outsourcing
majority of the parts and components, Apple developed its own key software including
operation system and app store. Since Apple’s launch of its app store in 2008, the
applications (hereinafter apps) that joined the app store have increased substantially from
50,000 in 2009 to 1.8 million in 2016 (Wall Street Journal, 2017/6/29). The app store
helps numerous entrepreneurs to reach consumers directly and also generate many new
businesses.
5.3.1.7. Human Resource Management
Thanks to the surge in the sales of iPhone, the global workforce of Apple has increased
from 18,000 to 116,000 over the last decade (2006-2016) (Wall Street Journal,
2017/6/20). Like many other technology companies, Apple recruits high-quality
employees (workers and managers). However, there are also some distinctive features
(HR Strategy Tools, 2013/9/14). Firstly, instead of promising the balance between work
and life, it emphasizes hard work and high commitment to the company. Secondly,
instead of promising and supporting employees the career progression, the company
promotes its employees to design their own career paths. Therefore, employees should
look for the information of other units of the company by themselves. Thirdly, instead
of providing training and development programs used by many other firms as part of the
retention strategy, Apple promotes employees to develop their skills themselves.
Instead, Apple’s retention strategy relies mainly on the economic rewards. In order
to maintain the talents within the firm, Apple adopted the employee stock plan.
Previously limited to high-ranking executives to retain top talent, but Apple has been
extending this benefit to all employees to reduce the barriers in the corporate ladder since
2015. In addition, in order to diversify the executive members and also the workforce,
Apple continues to look for the most competitive talents from competing or related
companies for key positions and making partnership with non-profit organizations
including the US military department to employ competitive workforce.
142
5.3.1.9. Firm Infrastructure
Apple’s infrastructure activity covers a wide range of support systems and functions such
as finance, planning, quality control, and general senior management. Tim Cook is the
CEO, and under his leadership there are nine Senior Vice Presidents (SVP) (i.e., first-
line or upper-tier managers) who address various functional areas of the company. Under
these SVPs there are many vice presidents (VP) (i.e., lower-tier managers) in charge of
different outputs or products, and thus they are also named as product-based managers
(Meyer, 2017/1/29).
Apple’s organizational structure is one of the important factors that contribute to
the company’s successful development of innovative products. Apple’s company
governance follows the traditional hierarchy where the CEO has the power to control all
the divisions of the company. The simplicity is a feature of the company’s structure,
which actually contributes to fast and flexible adaptation to the market changes (Johnson
et al., 2012). However, there are significant changes during and after Steve Jobs’ era.
During the period of leadership by Steve Jobs, he was in charge of everything and every
decision making went through him. There was less cooperation among departments.
Under Tim Cook’s leadership, however, although Tim Cook is still at the center, his
control is less stiff and there are some changes. One of the critical changes is that SVP
and VP are given more autonomy and independence for making decisions and there are
more cooperation among divisions, particularly between hardware and software teams
(Business Insider, 2013/5/1; Fortune, 2011/8/29).
5.3.1.10. Summary
The geographical distribution and the key features of the organizational governance of
the nine value chain activities are summarized in Table 5.5. Regarding the locational
distribution, all activities except for firm infrastructure are globally dispersed, but show
the trend of regional concentration. For example, the upstream activities including

143
inbound logistics and operations are mainly located in the Asian area, whereas the
downstream (i.e., marketing and services) and some supporting activities are more
concentrated in developed economies and recently also expanding to emerging and
developing economies. Secondly, the locational distribution of some activities is affected
by some others. For example, the location of R&D tends to be near the upstream
activities in order to support the manufacturing and create higher synergy between
manufacturing and product development.
Regarding the feature of organizational governance, Apple basically shows high
degree of internalization in the activities of marketing and R&D, where it has
competitive advantages. However, these areas also show high degree of externalization.
Marketing, for example, although it has competitive and productive Apple stores, in
order to reach larger number of consumers and reduce the economic burden of pricey
iPhone, it has to rely much on the network carriers for their promotion and marketing
strategy. The same is for R&D, in spite of its superior capability of developing
innovative products, smartphone competitiveness relies on hardware, software, contents,
and services as well. Apple’s App store in fact depends much on the third parties’
development in the new apps and provision of contents.
On the other hand, many activities that mainly rely on externalization also show a
high degree of internalization. A representative example is that Apple is well known for
outsourcing parts and components, but less known for its high commitment in supporting
these suppliers in terms of both financial and technological perspective in order to
achieve sustainable supply from these suppliers.

144
Table 5.5. Apple’s GVC: Governance

145
5.3.2. Samsung Electronics’ Global Value Chain
This section mainly investigates the governance (internalization vs. externalization) of
nine value chain activities of Samsung’s smartphone business.
5.3.2.1. Inbound Logistics
Unlike most other smartphone makers that buy components from many different
suppliers, Samsung produces most of the components and also has strong capability in
producing many of the key components. For example, OLED, one of the core and also
most costly components, is supplied by its subsidiaries of Samsung Display, which is the
only panel maker with the capability of mass-production of OLED panels for
smartphones. In order for manufacturing plants in Korea to produce some key parts and
components, many of Samsung’s foreign subsidiaries are located in China and Malaysia
which are driven by cost reduction. That is why the two smartphone assembly plants are
located in the Northern Vietnam in order to easily get access to the supply chain in China.
Samsung’s DS division of making parts and components not only serves Samsung
but also other global manufacturers such Apple, and this actually becomes critical for
increasing the economies of scale and reducing the production costs. Moreover, it also
makes up Samsung’s key financial source. The not-so-serious impact from Samsung’s
recent recall of Galaxy S7 in fact is largely attributed to the strong global demand for its
parts and components. For this, Samsung has recently expanded its production capacities
of the key parts. For example, Samsung announced in 2016 about its $1 billion
investment in its Texas semiconductor factory. It is also considering the expansion of
semiconductor factory of Xi’an in China. Domestically, in 2017, it also invested huge
money in Pyeongtaek (3 trillion KRW) and Huasung (0.6 trillion KRW) for building or
expanding the semiconductor factories, respectively (Maeil Business Economy,
2017/7/4).

146
However, there is one key component Samsung does not produce for its
smartphones sold to the US and it is the application processor43, which is purchased from
Qualcomm (Wall Street Journal, 2013/5/8). Samsung also obtain some parts and
components from other outside companies, but most of them are Korean firms. For
example, among the first-tier suppliers for Galaxy S844, except for Samsung Electricity
and Samsung SDI which are the Samsung Group affiliates, all others are Korean firms
(Korea Investment & Securities, 2017).
Recently, Samsung also has increased outsourcing from foreign suppliers for a few
key, high-value added components used in its most recently released flagship
smartphone, the Galaxy S8. For example, Samsung added Japan’s Sony as a new battery
supplier in addition to the extant supplier (i.e., Samsung SDI) for providing lithium-ion
battery packs in order to avoid the disastrous recall of Galaxy Note 7 in 2016 (Wall Street
Journal, 2017/2/17). Samsung also adopted the Green Phosphorescent, the material used
in OLED (panel display) from another Japanese firm (Maeil Business Newspaper,
2017/4/4). Moreover, Samsung also increasingly outsourced low value-added parts and
components to Vietnamese suppliers in order to reduce the production costs.
5.3.2.2. Operations
Samsung has been the largest smartphone manufacturer in terms of unit shipments since
2012 (Version Daily, 2016). This required Samsung’s strong production capability to
meet huge demands from around the world. In addition to one smartphone factory in
Korea, there are eight manufacturing plants through foreign direct investment (FDI) in
five foreign countries, including China, Vietnam, India, Indonesia, and Brazil. Among
43 Samsung smartphones sold in Korea and other countries use a Samsung-made chip (Exynos 5 Octa) which costs less than that made by Qualcomm. 44 Samsung Electricity, Samsung SDI, BHE, Amotech, Partron, Optrontec, Sekonix, Kolen, Ndfos, Jahwa Electronics, Iljin Display, ISU Petasys, Innox, Shinhwa Contech (Korea Investment & Securities, 2017).

147
factories, manufacturing plants in Vietnam were built to serve the global market, whereas
other plants mainly serve local or regional markets. Korea’s Gumi factory mainly aimed
to produce premium models to serve local sophisticated consumers. The mobile phones
by Indian factories target Indian and neighboring countries such as Pakistan and
Bangladesh. Indonesian factory aimed to serve local market, which is growing as another
important emerging market after China and India. Brazilian manufacturing plants aimed
to serve the Latin American market. Moreover, Phones produced in Tianjin factory in
China are sold to the global market, whereas the other Chinese plant mainly aims to local
consumers.
Figure 5.2 represents global distribution of Samsung’s mobile sets (including both
smartphones and feature phones) planned to be produced in 2016. Domestic production
accounted for only around 6%. On the other hand, the largest area of production is
Vietnam, which aimed to produce 172 million units of mobile phones, accounting for
more than 40% of global production. The second largest economy is China which has
two factories, one in Huizhou and the other in Tianjin. The two factories in China
combined together accounted for 31.1% of total production. The next largest producer is
India (13.1%), followed by Brazil (4.6%) and Indonesia (3.3%). However, due to the
slowing growth of Chinese market and growing demand of smartphones in India,
Samsung announced in 2017 that it would expand the factory in Noida 45 with an
investment of Rs. 4,915 crores. The expanded factory is expected to produce 120 million
units of smartphones, which is two times of the current production capacity in India.
45 Noida plant currently produces smartphones, refrigerators, and TVs.

148
Figure 5.2. Global Production Distribution of Samsung’s Mobile Sets (2016)
(million)
Source: Premium Chosun (2016/1/13)
5.3.2.3. Outbound Logistics
Samsung’s outbound logistics is taken in charge of its major subsidiary named Samsung
Electronics Logitech. The company with 77 agent offices in 30 countries is responsible
for Samsung’s overall international logistics, such as overseas sales logistics services,
trade support services, and forwarding services.
5.3.2.4. Marketing & Sales
Samsung’s marketing strategy aims to cater diverse demands by consumers from
different market segments. This strategy is highly influenced by its production strategy.
Unlike Apple which only introduces a limited number of phone models, Samsung
pursues product diversification strategy by providing a wide range of models. The key
advantage from this diverse marketing strategy is the decrease in risks from market

149
volatility and cater a wider market. Samsung has an existing distribution network from
its existing businesses. This is of tremendous value because unlike Apple, Samsung does
not need new channels or resources to bring its phones and tablets to new markets. As
Table 5.6 shows, Samsung’s smartphones are sold in a wider geographical regions
including 50 countries, whereas Apple’s iPhones are only sold to developed and
advanced developing countries with higher purchasing capability, and about half of the
Apple Stores are located in the US.
Table 5.6. Retail Stores and Sales Corporations (2014)
Apple (Apple Stores)
US (254) Canada (29) UK (37) France (16) Italy (14) Germany (13) Spain (10) Switzerland (3) Sweden (3)
Netherlands (2) Australia (21) China (10) Japan (7) Hong Kong (3) Turkey (2) 16 countries 424 stores
Samsung Electronics (Sales Corporations)
North America (3) Latin America (7) Europe (16) CIS (3) Asia/Pacific (12)
Middle East/ Africa (10) 50 countries 51 corporations
Source: SERI (2014) Note: Figures in () represent the number of stores or sales.
However, the production diversification strategy also requires efficient and heavy
promotion strategy. Normally the marketing and promotion strategy includes pull and
push marketing strategy (Version Daily, 2016). The pull strategy heavily relies on the
creation of strong company brand and establishment of loyal customers, and Apple
mainly relies on this strategy. The push strategy refers to the promotion through

150
advertising and sales strategies using both traditional (e.g., print, broadcast) and new
medias (e.g., social media). Samsung mainly relies the traditional advertising. In 2016,
Samsung spent $3.3 billion for TV, online, and even paper advertising (McNutt,
2016/12/27). The wide presence of the products in many regions through push strategy
evidently inspires the interest of consumers and even generates a number of loyal
consumers. This in turn provides a good foundation for Samsung’s future pull marketing
strategies.
Samsung also makes partnership with network carriers, retailers, and wholesalers
for distributing and selling its Galaxy products. Samsung can sell its products anywhere
it wants as long as retailers are willing to take stock. Regarding the carriers, for example,
Apple only cooperates with a single (or only a few) carrier in some markets but Samsung
partners with all major carriers within a country. Moreover, unlike Apple which never
offers discounts for its products, Samsung offers discounts to partners in order to
motivate distribution and promotion against the rivals.
5.3.2.5. Service
Samsung deals with customers’ requirements on product purchases, repairs, and
instructions through the channels of customer service centers, contact centers, and
website. Currently Samsung has about 20,000 service centers, 61 contact centers (1 in
Korea, 60 in foreign countries) around the world (Samsung, 2016). Service centers are
normally run by retail stores and professional service agencies. The number of service
centers usually increases along with the growth in the Samsung product. The product
contact centers employ about 10,000 qualified consultants to answer customers’ inquires
on product and services. Moreover, the website also provides a useful channel through
which customers can get a general guidelines and instructions on various inquires.
Samsung is also expanding other online services (e.g., Email, live chat) which effectively
help solve customers’ various problems. In addition to the above various insourcing

151
service activities, Samsung authorizes partners, but still mainly relies on its own service
centers around the world in order to maintain high customer satisfaction.
5.3.2.6. Procurement
Unlike Apple, Samsung purchases mainly from its internal affiliates and foreign
subsidiaries. For example, the procurement for assembling smartphones in Vietnam is
largely carried out through the imports from its subsidiaries in Korea and China. Table
5.7 shows Samsung’s expenditure on procuring product or services form the suppliers
from 2012 to 2016. During this period, Samsung has witnessed a decrease by 20% since
2013 from 152.9 trillion KRW to 127 trillion KRW in 2016, which implies a falling trend
of Samsung’s internalization in terms of parts and components.
Table 5.7. (Supplier) Procurement Costs (trillion KRW)
Year Expenditure Year Expenditure
2012 138.7 2015 128.8
2013 152.9 2016 127.0
2014 139.5
Source: Samsung Electronics’ annual sustainability report from 2015 to 2017. Note: The total amount of product and service costs made for company sales.
However, Samsung has a strict control on these suppliers by providing the Supplier
Code Conduct and monitoring through annual audit in order to establish fair and
transparent trade with supplier, which in turn procures high-quality products and services.
In 2013, Samsung established a Global Procurement Code of Conduct which provides
standards and principles for procurement personnel who must follow in all
circumstances. The procurement staffs are trained through both online and offline

152
lectures. The number of trainees attending the procurement code of conduct training on
a global scale grew by more than 2 times from 1,446 in 2013 to 3,021 in 2015. Samsung
also adopts Open Sourcing System which aims to find business partners (or suppliers)
as long as they comply with the world-class technology and competitive costs. Through
this system, Samsung reviewed 900 proposals in 2015, and 45 companies were selected
as Samsung’s suppliers.
5.3.2.7. Technology Development
Samsung has established seven global design centers46 and 34 global R&D centers47 in
order to learn and acquire advanced technology. Samsung Electronics spent $13 billion
in 2016 on R&D. According to the EU Industrial R&D Investment Scoreboard, Samsung
ranked as the top one spender in R&D among the technology companies (McNutt,
2016/12/27). In more recent years, Samsung accelerated the investment in R&D for the
high value-added and advanced parts and components, such as chips, memory, and
display. Samsung in 2016 decided to acquire a US automotive technology manufacture,
Harman International Industries Inc., at $8 billion, which is Samsung’s largest M&A
ever. However, the main objective of the purchase by Samsung is not to produce cars but
to explore new areas for its semiconductors, display panels, and mobile services (Wall
Street Journal, 2016/11/14).
In addition to the increasing efforts for in-house development, Samsung also
enhances the cooperation with outside parties to enhance its technology capability. For
example, it uses Google’s Android for its Galaxy phone operating system. In 2014,
Samsung and Google established a long-term cooperative partnership, named as “Global
Patent Cross-License Agreement” which covers a broad range of technologies and
business areas. The two companies could mutually benefit from the agreement by
46 Seoul, Tokyo, Beijing, Delhi, London, San Francisco, and Sao Paulo 47 Six in Seoul, the other 28 centers across the US, UK, Russia, Israel, India, Japan, Poland, Brazil, and China.
153
gaining access to each other’s industry-leading patents (existing and those to be filed in
the next 10 years), and reduce potential or unnecessary patent disputes. Samsung also
joined a new cross license patent agreement (also named as PAX48) launched by Google.
This agreement includes nine major Android manufacturers including Samsung.
On the other hand, Samsung also transferred technology and knowledge to local
suppliers (host country such as Vietnam) to enhance their production capability, which
in turn contributed in upgrading its product quality. Samsung invested 50 billion KRW
from 2013 to 2017, to support first and second-tier suppliers’ productivity innovation
through various methods such as improving their worksites, innovation infrastructure,
and production technology. In 2016, Samsung supported 45 Korean and 19 overseas
first-tier suppliers for their innovation initiatives.
5.3.2.8. Human Resource Management
In order to maintain the talents within the company, Samsung has continuously increased
the employee remuneration by 7% from 22.5 trillion KRW in 2014 to 24.0 trillion KRW
in 2016. Unlike Apple, Samsung also supports all of its employees around the world.
The company provides extensive and various training and expertise programs to upgrade
and enhance the employees’ capabilities. Every year, it operates Expertise Development
Process which facilities employees to assess employees and help them set appropriate
learning and training plans. Table 5.8 shows the major performance indicators regarding
Samsung’s efforts on employees’ learning and development.
Moreover, unlike Apple which less concerns the life and work balances, Samsung
puts a lot of efforts for improving life quality of its employees, such as increasing the
access to cultural activities, creating in-house club, life coaching center, and healing
campus. For improving the skills of employees as well as their lives, Samsung also
makes partnership to operate those training and development programs, such as
48 The Latin word which means peace.

154
specialized corporate social responsibility (CSR) institutions. In particular, since
Samsung employs a large number of foreign local talents and workers, Samsung also
cooperates with local firms or institutions in order to develop locally customized training
programs and comply with local cultural features. For example, Samsung cooperates
with Women in Factories (WiF) (China) project to reinforce the training program for
Chinese female workers.
Table 5.8. Major Learning and Development Indicators
Major Learning and Development (L&D) Indicators
Category No. of trainees (in million persons,
including duplication)
No. of training courses
Training hours per person (average)
No. of trainers (in persons)
Korea 107 5,295 80 287
Overseas 312 17,907 77 478
Total 419 23,202 78 765
Learning and Development (L&D) Investments (Korea)
2013 2014 2015
Ratio of L&D expenses to sales (%) 0.05 0.06 0.06
Ratio of L&D expenses to payroll expenses (%) 1.1 1.1 1.1
Average hours of L&D per person 107.2 95.2 80.0
Source: Samsung Sustainability Report 2016
5.3.2.9. Firm Infrastructure
Unlike Apple which adopts professional management system, Samsung Electronics, as
a flagship of Samsung Group which is the largest Korean Chaebol, adopts the ownership
management system. Thus Samsung Electronics is often criticized for its rigid top-down
management style. However, Moon (2016b) argued that Samsung only provides the

155
general objective and guidance, while individual teams are given pretty much authorities
to design and operate the projects flexibly. Thus Samsung’s organizational features can
not only achieve long-term planning which is weak in those firms which pursue
professional management system (e.g., Apple), but also adapt to the environmental
changes in a fast and flexible manner. Samsung Electronics, on the other hand,
comprising three functions, has experienced several times of restructuring corporate
governance in order to be more flexible to adapt to the fast-changing global market.
The Future Strategy Office, which plays the role of designing the overall strategy
for the conglomerate and coordinating the businesses among its affiliates was abolished
in the late 2016 in order to respond to the public criticism due to its recent relation with
Korea’s political scandal. Without the control tower of the Future Strategy Office and
the arrest of Samsung’s de facto CEO, Lee Jae-yong, many concern and worry about the
future of Samsung. Due to these recent challenges. Samsung’s affiliates have to design
and establish the growth strategy by themselves, and thus the overall synergy effects
would diminish, and this is a challenge in the current business competition.
5.3.2.10. Summary
The key features of geographical location and organizational governance of the value
chain activities is illustrated in Table 5.9. Although the degree of globalization in terms
of geographical distribution is different among various value chain activities, Samsung
Electronics is more globalized than Apple for many activities in general. For example,
Apple has manufacturing plants located in China and India, whereas Samsung’s factories
are located in seven countries including Korea. The same are for R&D, marketing, and
service as well. Unlike Apple which mainly conducts the R&D in the home country,
Samsung, as a latecomer, has made significant efforts for long years by investing in many
developed and emerging countries in order to secure advanced technologies and adapt
to local consumers’ tastes. Regarding the market and services, as Samsung’s products

156
cover a wider range from high-end to low-end, it tends to expand into more number of
countries than Apple.
Apple is widely known for outsourcing the production activities in the value chain,
Samsung is also well known for its high degree of internalization because of its strengths
in not only parts and components but also in high capability for assembling by owning
a number of large factories around the world. However, the case study above shows that
Samsung is increasing the degree of externalization through outsourcing the capable
suppliers. Regarding the R&D activity, although it has established many global R&D
and design centers in the world in order to internalize the key technologies, it also
cooperates with other firms by sharing the industrial patents of the leading firms, such
as partnership with Google. For marketing, the partnership with carriers and retailers is
necessary in order to effectively compete with both industrial leader (e.g., Apple) and
followers (e.g., Chinese firms).

157
Table 5.9. Samsung Electronics’ GVC: Governance

158
5.3.3. Findings and Discussions
As explained above, extensive investigation of the nine value chain activities of both
Apple and Samsung Electronics was presented by focusing on the mode of value creation
- internalization or externalization. This study finds both significant differences and
similarities, and demonstrates that the latter is often neglected by the preceding studies.
The key difference mostly mentioned by extant studies (e.g., Liang, 2015; Mudambi,
2008) is that Apple concentrates on production development and marketing, and
outsource most of the other value chain activities such as upstream and some support
activities, whereas Samsung Electronics internalizes or controls almost all of the value
chain activities.
Yet, there are two main limitations for the above arguments. First, these studies
mainly stress the different areas of internalization/externalization, but did not explain
why the two companies pursue such different GVC strategy. Second, the above
arguments are right to some certain extent, because they only catch partial of the entire
picture. To be specific, they only highlight the areas of high degree of GVC activities of
internalization for both companies, but in reality there are very few activities that are
entirely internalized or externalized for both companies. This study thus can fill the gap
regarding the above two issues, and the following will explain them in more detail.
5.3.3.1. Differences: The Reasons behind the Differing GVC Strategy
The two companies pursue many different strategies in terms of value activities, and
such differences are influenced by their product strategy and their competitive position
in the market.
Apple pursues developing innovative and pricey products with only a few
variations for different models. Its first-mover advantages and strong superiority in both
hardware and software provide it with high bargaining power when outsourcing

159
suppliers of parts and components to produce at high quality and low costs.49 Its superior
position among similar product makers also helps it pursue a pull marketing strategy,
and attracts numerous talents around the world in spite of very demanding and stressful
working conditions. Therefore, all of its strategies in different activities actually are
interdependent and generate a good fit, which helps the firm to enjoy high industrial
profits in the smartphone business.
On the other hand, Samsung pursues product diversification strategy, by providing
many different models from high-end to low-end in order to cover as many customers as
possible. Regarding the market position, although Samsung is the leader of smartphone
market in terms of unit shipments, it still lags far behind Apple in terms of profit. In
particular, Apple still dominates the premium model segment of smartphones, and
Samsung still cannot reach the Apple level in terms of some core technology, such as the
software. 50 Due to its weak position and relatively low recognition in the market,
Samsung has invested heavily in push-type marketing strategy to appeal to new
customers. Moreover, although it has its own suppliers or long tradition of partnership
with many supplier companies, its bargaining power is not as high as Apple. Moreover,
due to its various models which require different sets of parts and components, in-house
production could be more effective for fast changes and saving coordination costs.
Furthermore, unlike Apple which mainly relies on in-house R&D and design, Samsung
has always been looking outside to acquire needed technology or establish R&D centers
abroad to facilitate learning advanced technology and know-how.
49 The factory-gate price of Apple’s iPhone 7 is $220.8, including direct materials and manufacturing costs (Mayo, 2016/9/20). Yet, the cost of Samsung Galaxy S7 smartphone is $255.05 (HIS, 2016/3/15). Thus, Samsung’s smartphone is about 15.5% higher than that of Apple’s. 50 Samsung has once developed its own operating system but was not well acknowledged by customers.

160
5.3.3.2. Similarities: Combining Internalization and Externalization for
Implementing GVC Activities
In addition to the differences in terms of the GVC strategy for both companies, there are
also some similarities. The differences are often predetermined by their historical
background and available resources. However, the similarities can explain the emerging
trends which are less influenced by their in-born natures. This study stresses that both
internalization and externalization can be adopted simultaneously for performing the
value chain activities which are globally spread. Firms pursue GVC strategy by
combining the three alternative options (trade, FDI, and NEMs), driven to deliver higher
values along the value chain. Therefore, the extant capability-based management
theories and traditional FDI oriented theories, which usually argue for selecting one of
them under some conditions, cannot satisfactorily explain why firms should internalize
a certain value chain activity, while pursuing externalization simultaneously, and vice
versa.
Specifically, this study finds that despite the significant differences between Apple
and Samsung, the two companies apply both internalization (FDI) and externalization
(trade, NEMs) for performing most activities that are globally spread. Samsung,
although more activities are internalized compared to Apple, five out of nine value chain
activities are carried out through both internalization and externalization. On the other
hand, although Apple externalizes many of the value chain activities, it also shows a
high degree of internalization in five value chain activities. As a result, for Apple, two
activities of marketing & sales and human resource management show a high degree in
both internalization and externalization; and for Samsung marketing & sales relies on a
high level of internalization and externalization (see Table 5.10).
Therefore, internalization and externalization modes are not substitutional but
complementary to each other. High ownership advantages can also be accompanied with
a high degree of externalization. In consistent with the theoretical discussions in
Chapters 2 and 3, the case study also well illustrates that strong ownership advantages
alone cannot well define firms’ governance choices between internalization and

161
externalization. We need additional factors for disguising them. The following section
will apply the new framework for externalization (i.e., three conditions) to both Apple
and Samsung Electronics.
Table 5.10. Comparison of Apple and Samsung Electronics’ GVC Strategy
5.4. Three Conditions for Externalization by Apple and Samsung
Electronics
The previous section mainly investigates the degree of internalization and
externalization in terms of the nine value chain activities. This section then focuses on
the drivers behind the choice of externalization in particular, using the framework of
three conditions introduced in the earlier theoretical chapter (Chapter 3), namely fast-
growing business, commercial best-practices, and multi-competences. The results are
displayed in Table 5.11, and more details and analysis will be illustrated below.
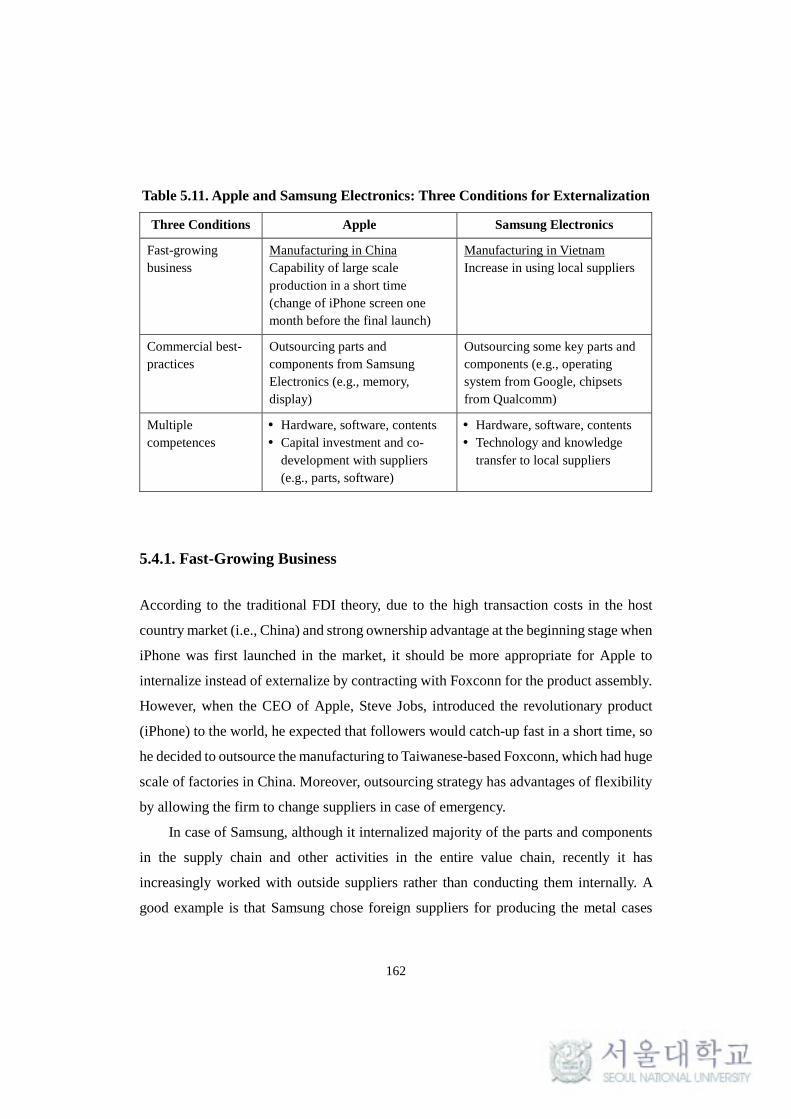
162
Table 5.11. Apple and Samsung Electronics: Three Conditions for Externalization
Three Conditions Apple Samsung Electronics
Fast-growing business
Manufacturing in China Capability of large scale production in a short time (change of iPhone screen one month before the final launch)
Manufacturing in Vietnam Increase in using local suppliers
Commercial best-practices
Outsourcing parts and components from Samsung Electronics (e.g., memory, display)
Outsourcing some key parts and components (e.g., operating system from Google, chipsets from Qualcomm)
Multiple competences
Hardware, software, contents Capital investment and co-
development with suppliers (e.g., parts, software)
Hardware, software, contents Technology and knowledge
transfer to local suppliers
5.4.1. Fast-Growing Business
According to the traditional FDI theory, due to the high transaction costs in the host
country market (i.e., China) and strong ownership advantage at the beginning stage when
iPhone was first launched in the market, it should be more appropriate for Apple to
internalize instead of externalize by contracting with Foxconn for the product assembly.
However, when the CEO of Apple, Steve Jobs, introduced the revolutionary product
(iPhone) to the world, he expected that followers would catch-up fast in a short time, so
he decided to outsource the manufacturing to Taiwanese-based Foxconn, which had huge
scale of factories in China. Moreover, outsourcing strategy has advantages of flexibility
by allowing the firm to change suppliers in case of emergency.
In case of Samsung, although it internalized majority of the parts and components
in the supply chain and other activities in the entire value chain, recently it has
increasingly worked with outside suppliers rather than conducting them internally. A
good example is that Samsung chose foreign suppliers for producing the metal cases
163
used in its flagship smartphone model. Samsung has been criticized for using plastic
casing for its high-end smartphone models. Moreover, facing growing competition from
cheaper models from Chinese companies in particular, Samsung decided to adopt metal
casing to its flagship products in a large scale since 2015 in order to differentiate its
premium models. However, compared to plastic casings, manufacturing metal casings
requires higher technology and additional huge amount of capital investment (e.g.,
purchase of computer numerical control (CNC) equipments), so this would be a big
challenge for extant suppliers of making plastic cases to upgrade the facility and
production capability in a short period.51 As a result, Samsung decided to employ the
Taiwanese company Catcher Technologies as the primary supplier, and the Chinese
company BYD and Taiwanese Company Jo Teng as the secondary suppliers.
In addition, Samsung has recently been accelerating the expansion of outsourcing
the production of mid- and low-end smartphones to Chinese companies. For example,
Samsung made a joint venture with Zhonghuan Telecommunication, a Chinese company
to produce Galaxy Trend Duos, which aims to export to other developing countries,
including India. It is expected that the volume to be outsourced would reach 10% of the
total annual production. Compared to the high-end smartphones, the parts included in
low- and mid- smartphones and manufacturing technology have been standardized, and
thus there are no significant differences in product quality among different branded
devices. However, cost reduction is not the only reason for Samsung’s decision for
outsourcing. The outsourcing strategy is also driven by fast and flexible adaptation to
the explosive market demand and effective localization in emerging markets such as
China and India. Therefore, the above examples of Apple and Samsung Electronics’
outsourcing practices show that not just cost reduction, but fast and flexible adaptation
to the market is another important factor for firms’ externalization choices.
51 The product life cycle of smartphone is so short that efficient time management has become increasingly critical for firms’ success. For example, Apple once suffered great loss from the sales of iPhone 7, due to the delay in the delivery of headphone jack.

164
5.4.2. Commercial Best-Practices
Despite the competing relationship with Samsung, Apple used relatively many parts and
components from Samsung. For example, in the case of iPhone 4, more than 25% of
parts and components were outsourced from Samsung. This is because these parts are
the industrial standards. Outsourcing them from other partners will influence the quality
of the final products, which would have caused problems in competing with Samsung’s
smartphones in the global market. However, in the case of parts and components which
had no industry standards, Apple outsourced through several competitive suppliers and
invested huge money to make them into the industrial standard. When new component
technologies first came out, they were very expensive to produce, and building a factory
to produce them in mass quantities was even more expensive and risky. This shows that
outsourcing strategy can not only largely save costs but also grant speed advantage.
In the case of Samsung, it outsources some key parts and components such as the
operating system (OS) from Google and mobile phone chipset from Qualcomm. In
particular, the chipset supplied from Qualcomm is very expensive, costing 4-5% of the
price of each mobile phone mainly because there are no other alternatives. Also, even if
Samsung could develop similar technology, it would accrue huge development costs and
go through the risk of not being acknowledged by the consumer markets. For example,
Samsung has spent three years for developing its own Tizen OS52 aiming to shift away
from the reliance on Google’s Android mobile software. However, the Tizen OS is not
as competitive as Android OS in attracting app developers. The number of apps for the
Tizen OS is only 1000, whereas the number of apps registered in both Android and iOS
has exceeded 1 million (CNBC, 2015/1/14).
The example of outsourcing metal cases from Taiwanese and Hong Kong-based
companies mentioned earlier can also be explained by the second condition of
52 The Tizen OS was launched in 2015, and first adopted in the new smartphone, named as Samsung Z1, targeting the Indian buyers. However, for the high-end smartphones, it still relies on Google’s Android OS.

165
“commercial best practices.” Catcher is a key supplier of metal cases for Apple products,
and thus its production technology and capability have been proved to be the industry
standard. Therefore, not the highest technology, but the commercial best practices
deliver higher commercial values to consumers.
5.4.3. Multiple Competences
Smartphone converges multiple functions (e.g., phone, camera, music player, Internet,
calendar, alarm) that used to be viewed as separated devices. Moreover, the introduction
of iPhone also spawns many other new businesses such as apps and services offerings.
By adopting the software of App store and Google Play, numerous app developers
provide millions of apps which help consumers easily and effectively perform numerous
functions which used to be done in the PC environment, such as on-line shopping and
office work. In addition, smartphone makers have also tried to connect the device to
everything on earth to pursue new growth engine through the device, such as link with
home appliances, health care, cars, and cash registers. All of the above functions thus
cannot make a single firm to dominate the entire businesses, and the competitiveness of
the device naturally requires multiple competences acquired from various outside firms.
Multiple competences can be either at each activity level throughout the entire value
chain. Even Apple and Samsung have different preferences of strategic choice in terms
of internalization or externalization; they have to externalize to a certain level because
of the nature of multi-competences in the smartphone business. The different degrees of
internalization/externalization were driven by their different core competences and
strategic fit among different divisions. Compared to Apple, Samsung has more
competitive advantages in manufacturing hardware, and thus internalizing more than
Apple in these areas.
Moreover, the feature of multiple competences requires strategic fit among each
elements comprising the product, which in turn creates higher synergies among them.

166
Hence, unlike the traditional drivers of outsourcing that emphasize the unilateral
exploitation of the advantages of outside firms, the cases of Apple and Samsung
Electronics show that they aim to establish a win-win relationship among all involved
partners in the GVC, and this in turn contributes to sustaining the entire ecosystem in the
long run. Apple has long been committing in co-developing the new technology of parts
and components with its suppliers, and Samsung also has made great efforts in
transferring the technology to Vietnamese suppliers, and thus more local suppliers have
joined Samsung supply chain, at competitive price, quality, and speed of delivery. The
localization rate has thus been raised significantly from 35% in 2014 to 51% in 2016
(Vietnam Business News, 2017/1/23).
5.5. Conclusions
This chapter applied two frameworks, namely the integrated GVC approach (trade, FDI,
and NEM) and three conditions for externalization to the GVC practices of Apple and
Samsung Electronics and their motivations for externalization. Based on the extensive
information and analysis, this chapter found that the two frameworks can well explain
the cases of Apple and Samsung Electronics.
Firstly, regarding the integrated framework, both companies combine the three
governances for effectively performing their GVC activities. The intermediate and
finished goods are extensively transacted through trade. In particularly, for the trade in
finished goods, most of Apple’s smartphones are produced in China and exported to the
global market. Similarly, Samsung’s Vietnam manufacturing plants serve the global
market. Almost 50% of its smartphones are produced in Vietnam and exported to rest of
the world.
Apple externalizes many GVC activities (upstream and some support activities)
through NEM, whereas Samsung internalizes through FDI almost all GVC activities
around the world. However, this study found an interesting point that the two companies
167
show a convergence between FDI and NEM modes. In other words, Apple appears to
increase GVC practices through FDI, as illustrated in its recent establishment of R&D
centers around the world. On the other hand, Samsung expands the externalization
options for GVCs, such as outsourcing of production of low- and medium-end
smartphones to Chinese companies.
Secondly, the three conditions satisfactorily explain the reasons behind the
externalization choices of the two companies. Three important findings can be
summarized as follows. (1) Not just cost reduction, but fast adaptation to the market is
the more fundamental driver for their outsourcing activities. (2) Not the highest
technology, but the commercial best practices are more concerned by both companies
when they make decisions for externalization. (3) Not just unilaterally exploiting the
partners’ resources or advantages, but co-development should be concerned for longer-
term and sustainable development of the entire business ecosystem.

168
CHAPTER 6. EMPIRICAL TESTS: THREE CONDITIONS
FOR EXTERNALIZATION
The previous chapter conducted a case study on Apple and Samsung Electronics
focusing on their smartphone business, and showed that three conditions can well
explain the reasons behind their externalization choices for various value chain activities,
despite the different degree of externalization. This chapter applies a different
methodology by conducting a statistical test and expanding the samples to test whether
the three conditions can be applied to other industries. Specifically, I study the
motivations of the strategic partnership for firms’ research and development (R&D)
activity. In Chapter 3 (see Table 3.4 in section 3.2.3), I showed how firms increasingly
offshore and outsource53 their R&D activities, which used to be conducted within the
firm in the home countries according to the traditional foreign direct investment (FDI)
theories. Strategic partnership includes both equity and non-equity partnership. The
former is often known as joint ventures, while the latter is regarded as strategic alliances.
This study only concerns the form of strategic alliance, which is a typical type of
externalization. The next section of this chapter addresses the development of three
hypotheses. It is followed by a set of empirical tests and discussions on the results.
53 Offshoring and outsourcing are two different dimensions of the configuration of value chain activities: geographical and organizational dimensions, respectively. Offshoring refers to relocation of firms’ value chain activities from domestic to foreign countries, whereas outsourcing refers to the ownership transfer from a firm to other firm. However, extant studies often use offshoring interchangeably with outsourcing.

169
6.1. Hypotheses
Based on the conceptual framework introduced in Chapter 3, this chapter proposes three
hypotheses as follows. It should be noted that the three propositions introduced in
Chapter 3 are mainly discussed at the industry or product level, but the hypotheses of the
empirical tests in this chapter will be conducted at the firm level. As the logic and
background of each of the three propositions are explained in Chapter 3, I will directly
formulate their testable hypotheses here as follows.
Hypothesis 1. The faster growing firms are more likely to make partnerships with other
firms (Condition 1: fast-growing business).
Hypothesis 2. Firms aiming to create the next generation industry standard are more
likely to make partnerships with other firms (Condition 2: commercial
best-practice).
Hypothesis 3. Firms producing products which require more areas of core competences
are more likely to make partnerships with other firms (Condition 3:
multiple competences).
6.2. Methodology
6.2.1. Sample and Data
The sample consists of 63 high-growth firms between 2011 and 2015. According to
OECD (2010), the high-growth firms54 are defined as “all firms with average annualized
growth greater than 20% per year, over a three-year period, and with ten or more
54 OECD (2010) recommended the definition of “gazelles” as “all firms up to five years old with average annualized growth greater than 20% per annum over a three-year period, and with ten or more employees at the beginning of the observation period.”

170
employees at the beginning of the observation period. Growth is measured by the number
of employees and by turnover.”
I collected the data from the report of 2016 High Growth Companies and Their
Growth Trajectories published by Korean Science and Technology Policy Institute
(STEPI), which investigated Korea’s high-growth firms and published annual report
since 2009. About 100 high growth firms are chosen every year from the listed
companies based on the five-year average growth rates either in terms of sales or
employments. In the 2016 report, STEPI selected 115 fast growing firms although firms
with different sizes show various patterns of growth rate.
According to the report, normally firms with employees between 100 and 500
experience high average growth rate. Therefore, in order to classify firms with more
similar patterns of growth, this study divides firms into large firms and small and
medium-size enterprises (SMEs) based on the criterion of the number of employees (i.e.,
less than 500)55. Out of 115 high-growth firms, I dropped 34 of them due to unavailable
data, in particular, for the dependent variable (i.e., the existence of R&D partnership or
not). Then, this study removed 18 large firms with employees more than 500, leaving 63
SMEs across seven industries for the empirical test. Table 6.1 lists the industrial
distribution of the 63 SMEs. The electrical and electronics industries accounted for the
largest share, including 22 SMEs. The next three industries with more than 10 SMEs are
chemistry & non-metal (14), IT/business service (13), and metal & machinery (10). The
other three industries – food, automotive/shipbuilding/transportation, and construction
include one or two SMEs.
55 According to the recently amended Act of Small and Medium Business in 2015, SMEs are defined based on the annual sales. According to this criterion of annual sales, around 10 out of 63 firms are not SMEs. However, before the amended version, SMEs were defined based on three criteria, including employees, assets, and equity capital. Regarding the number of employees, SMEs are defined as the firms with less than 1,000 employees (Moon and Yin, 2015).

171
Table 6.1. Samples: Industry Distribution
Industry No. of SMEs Industry No. of SMEs
Electrical and electronics 22 Food 2
Chemistry & non-metal 14 Automotive/shipbuilding/ transportation
1
IT/Business service 13 Construction 1
Metal & machinery 10 Total 63
6.2.2. Dependent Variable
The dependent variable is the governance mode of R&D activity, i.e., whether firms
pursue partnership or in-house development. STEPI report on high-growth firms
categorized four types of R&D partnership depending on the subject of partners: intra-
firm (firms within the same business group), inter-firm (firms outside the business group),
government-funded research institutes, and universities. As Table 6.2 shows, out of 38
firms with R&D partnership, inter-firm partnership makes up the largest share with 25%,
followed by partnership with government-funded research institutes which also
accounted for more than 20%. The distribution is consistent among the entire
observations of 115 firms included in STEPI 2016 report: inter-firm (22.4%),
government-funded research institutes (21.2%), universities (8.2%), and intra-firm
(4.7%). STEPI expected higher potential for the R&D partnership with public
institutions in the future.

172
Table 6.2. Samples: Distribution across Types of Partnership
Types of partnership No. of firms (unit) Percentage
Intra-firm 4 6%
Inter-firm 16 25%
Government funded research institutes 13 21%
Universities 5 8%
No partnership 25 40%
Total 63 100%
6.2.3. Independent and Control Variables
The STEPI 2016 report published the survey results which consist of around 40 survey
items for each of 115 observed firms. This study selected the most appropriate items for
conceptualizing and operationalizing the three hypotheses. To test the effects of the
degree of firm growth on firms’ externalization choice, related to Hypothesis 1, I used
five-year (2011-2015) average growth rate of employees.
To evaluate the effects of commercial best practice, which is for Hypothesis 2, I
built a dummy variable, the nature of technology. It takes value 1 if the firm aims to
develop foundational technology, and 0 for applied technology. This is because,
compared to applied technology, foundational technology has larger influences on
developing next generation industry standard, which outcompetes the rivals for
performance.
To test the effects of multiple competences, for Hypothesis 3, I used R&D intensity
which is measured as a percentage of sales. In order to minimize the fluctuations due to
the large changes of a single year, I also used the five-year average between 2011 and
2015 for this proxy variable. There can be two occasions for firms to spend a large
amount of capital on R&D. One is when a certain area of technology requires heavy
R&D investment; the other is when developing a competitive product requires many
different areas of technologies. This study in fact aims to test the second situation. The

173
variable of R&D intensity measures the mixed cases. This is mainly because it is usually
impossible to distinguish the areas of R&D spending as firms do not go open such
information. Nevertheless, we can assume that the higher the degree of R&D intensity,
it will be more likely for firms to spend in more areas of technologies.
There can be some other factors, in addition to the independent variables, which
also affect firms’ externalization choice. In this study, I controlled firm age, measured
by the number of years the firm had been in business. This is because the longer the
firms engage in the business, the more experiences and resources firms can accumulate
which may help firms involve in R&D partnership.
6.2.4. Model
In order to test the hypotheses, I estimated the probability of observing a strategic
partnership as the governance mode for the firms’ R&D activities, using the logit model,
which is commonly chosen for studies on governance mode (Hennart, 1997). The model
takes the following form:
𝑃𝑃𝑖𝑖 = 1/[1 + exp(−𝑧𝑧𝑖𝑖)]
𝑃𝑃𝑖𝑖 stands for the probability that the observed firm develops technologies through
partnership, and 𝑧𝑧𝑖𝑖 is defined as follows:
𝑧𝑧𝑖𝑖 = 𝛽𝛽0 + 𝛽𝛽1growth𝑖𝑖 + 𝛽𝛽2technology𝑖𝑖 + 𝛽𝛽3R&Dintensity𝑖𝑖 + 𝛽𝛽4age𝑖𝑖
where β represents the coefficients to be estimated; i is the time and here it covers
the period from 2011 to 2015. The following section presents the results of the estimated
model.

174
6.3. Results
Table 6.3 summarizes the descriptive statistics (means, standard deviations, minimum
and maximum values) and bivariate correlations among the variables. About 60% of
observed firms had the experiences of developing technologies through partnership.
Although there are fluctuations in terms of employment growth rate across observed
firms and also across five years, the average of five-year employment growth rate of the
63 firms still recorded two-digit growth rate, with the value of 12.5%. Moreover, the
R&D intensity also shows a relatively high value of 6.3%. The average age of observed
firms is about 20 years. Considering that the minimum firm age is 9 years, these fast-
growing firms are not very young but have accumulated relatively high business
experiences. In addition, correlations among variables in the model are smaller than |0.4|,
implying that there are no relevant issues of multicollinearity with the dataset (Crocker
et al., 1979; Lee and Noh, 2013).
I examined three variables and the results are present in Table 6.4. I show the results
using both coefficients (β), and odds ratios are calculated using the exponential function
of coefficients, i.e., Exp(β). If the coefficient value is positive, it indicates an increase in
the portability of choosing R&D partnership, and vice versa for the negative coefficients.
The odds ratio is explained as the changes in the odds of R&D partnership when the
independent variable increases by one unit. If the coefficient is negative, the odds ratio
is smaller than 1, and this means the explanatory variable reduces the odds of the R&D
partnership. On the other hand, the positive coefficient produces the odds ratio larger
than 1, which indicates an increase in the odds of the R&D partnership.

175
Table 6.3. Descriptive Statistics and Correlation Matrix
Mean S.D. Min Max 1 2 3 4 5
1 R&D partnership 0.587 0.496 0 1 1
2 Employment growth rate
12.533 6.630 0.600 28.500 0.296* 1
3 Technology 0.238 0.429 0 1 0.090 -0.330** 1
4 R&D intensity 6.297 6.026 0 30.700 0.031 -0.102 0.105 1
5 Age 20.032 5.770 9 35 0.027 -0.317* 0.244 -0.173 1
Note: N = 63. ** p<0.01; * p<0.05

176
Table 6.4. Logistic Regression
Model 1 DV: R&D partnership
Model 2 DV: R&D partnership
Coefficient OR Coefficient OR
Employment growth rate
0.222*** 1.248
Technology
2.537** 12.644
R&D intensity
0.333** 1.396
Age 0.136* 1.146 0.073 1.075
Intercept -2.063 0.127 -5.539** 0.004
N 54 54
-2LL(log likelihood) 67.629 48.294
Hosmer-Lemeshow test 7.123(0.310) 9.736(0.284) Note: p-value in parentheses, *** p<0.01; ** p<0.05, * p< 0.10; DV: dependent variable; OR: odds ratio
Model 1 includes only the control variable of age of the firm. The coefficient is
positive and significant at 10% (β = 0.136), and the odds ratio is larger than 1 (OR =
1.146). This can be explained that the odds of R&D partnership increase by 14.6% when
the firm age increase by one year. Model 2 adds three independent variables. Three
predictors are all significantly positive and support the three hypotheses.
Specifically, the coefficient of employment growth rate is positive and significant
at 1% (β = 0.222); the odds ratio is 1.248, which implies that when firms’ employment
growth rate increases by 1%, the odds of R&D partnership increase by 24.8%. The
coefficient of technology, for Hypothesis 2, is positive and significant at 5% (β = 2.537);
the odds ratio is 12.644, which implies that the nature of R&D activity focusing on
foundational technology makes the R&D partnership mode more likely. To be specific,
the odds of R&D partnership of firms engaging in foundational technology are 12 times
higher than that of firms committing in developing applied technology. Lastly, the
coefficient of R&D intensity is positive and significant at 5% (β = 0.333); the odds ratio
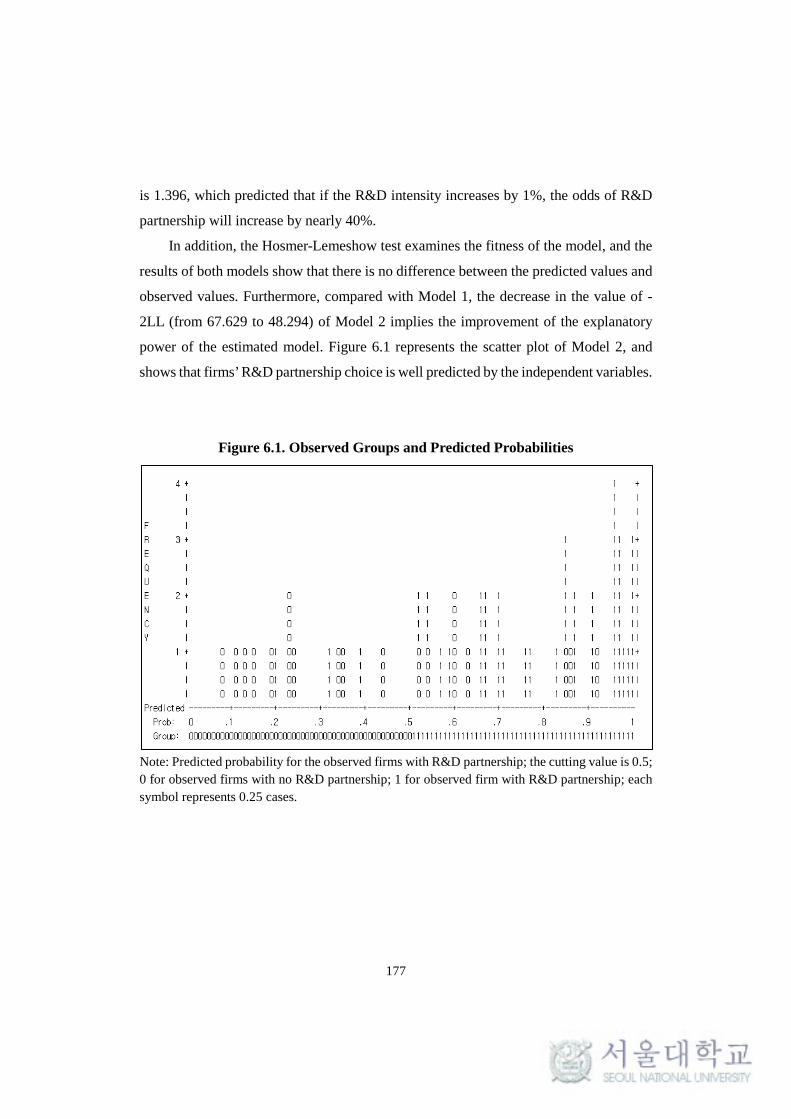
177
is 1.396, which predicted that if the R&D intensity increases by 1%, the odds of R&D
partnership will increase by nearly 40%.
In addition, the Hosmer-Lemeshow test examines the fitness of the model, and the
results of both models show that there is no difference between the predicted values and
observed values. Furthermore, compared with Model 1, the decrease in the value of -
2LL (from 67.629 to 48.294) of Model 2 implies the improvement of the explanatory
power of the estimated model. Figure 6.1 represents the scatter plot of Model 2, and
shows that firms’ R&D partnership choice is well predicted by the independent variables.
Figure 6.1. Observed Groups and Predicted Probabilities
Note: Predicted probability for the observed firms with R&D partnership; the cutting value is 0.5; 0 for observed firms with no R&D partnership; 1 for observed firm with R&D partnership; each symbol represents 0.25 cases.

178
6.4. Discussion and Conclusion
This chapter deals with the effects of three conditions (fast growing business,
commercial best practices, and multiple competences) on firms’ externalization choices.
Traditional \FDI theories mostly look at the influences of market failure and firms’
ownership advantages on the choices of MNCs governance modes. This extended the
understanding of the determinants of firms’ externalization choices. Although not all of
the observed samples are MNCs, about half of the overserved firms’ rely more on foreign
markets for their revenue generation. Therefore, the empirical results can still provide
some useful insights for firms in general.
Firm age which can proxy the firm experience or other capability shows a
meaningful result for explaining firms’ choice for R&D partnership, but when the other
variables are added, it was not statistically significant. This implies that although firm
capability is a critical factor influencing firms’ externalization choice, firms will be more
likely to choose partnership governance mode when the situation satisfies at least one of
the three conditions. This is in fact consistent with the argument by some scholars
illustrated in Chapter 3 that the motivation of firms’ externalization has been shifted from
enhancing firm competitiveness to survival. Regarding the former motivation (i.e.,
competitiveness building), firms could be more concerned with their current status of
competitive advantages, whereas for the latter motivation (i.e., survival) firms should be
concerned more about the environmental factors.
What should be noted is that the environmental factors do not mean the external
uncontrollable factors but the changing patterns of the sources of competitive advantages.
For example, the product life cycle becomes shorter and technological changes become
faster, and this requires firms to be more agile in order to be competitive in the market
competition. Firms have to incorporate these changing patterns as part of their growth
strategy.
In addition to the above empirical and theoretical contributions, there may exist
some limitations for the empirical test. The first limitation is about the industry

179
distribution. The observed firms mainly belong to the high-technology industries, which
require extensive R&D investments. Some other less technology-intensive industries
may modify the outcome of the investigation. Time horizon may be another limitation.
The research can be extended by including more years or conducting time-series analysis.
Thirdly, except for the variable of employment growth rate, related to Hypothesis 1, the
other two variables are more technology-oriented, and thus can be adjusted when
examining the governance mode for other value chain activities. Lastly, since some
factors other than the independent variables of this model may affect firms’
externalization choice, more control variables can be added for further research, such as
firm size and the status of experiences.

180
CHAPTER 7. CONCLUSIONS
The previous studies on GVC are relatively segmented and lack a comprehensive
framework in capturing the entire picture of GVCs. For this purpose, this study
incorporates three different approaches – trade, FDI, NEMs in respect to the transactions
occurred throughout the GVC, into a single framework. Theoretically, these three groups
of studies have examined the phenomenon of GVCs separately. Trade approach
highlights the international segmentation of production processes while neglecting the
integration within the GVC. This is because trade studies are mainly conducted at the
national level, and do not deal with the role of MNCs in coordinating these
internationally dispersed activities.
The limitations of trade approach can be complemented by FDI and NEMs studies,
but these two approaches emphasize the different organizational governance in
managing GVC. FDI theorists mainly focus on the internalization governance, while
NEMs emphasize externalization governance. Compared to the traditional globalization
approaches which highlight the dispersion of activities within the global scope, GVC
concerns the organizational integration along the value chain activities. Therefore, the
integrated framework can better explain the GVC than when analyzed separately.
In addition to the theoretical contribution of this integrative perspective, this study
also proposed three extensions for each theoretical approach. First, for trade approach,
this study extended the unit of analysis from country to regional level by incorporating
the cluster theory. Moreover, this study extended Porter (1990) and Moon and Jung’s
(2010) cluster theories by specifying the sources of sustainable competitiveness of
clusters in the context of GVC, by adopting Moon’s (2017b) four factors for explaining
the sources of competitiveness of Silicon Valley. The four factors are dynamism,
interaction, ecosystem, and motivation. Second, for FDI theory, this study proposed the
way of improving the most popular measurement of firms’ globalization, namely the TNI
index, by adding two elements – outsourcing and technology development activity. The

181
improved index is more comprehensive because it captures not only the types of value
chain activities but also those of transaction within the GVCs. Third, for NEMs this study
introduced a new framework of explaining the conditions for externalization, composed
of three elements which are fast-growing business, commercial best practices, and multi-
competences.
Among the three extensions, this research particularly emphasizes the third one by
proving the legitimacy of the three conditions using case studies and quantitative tests.
Regarding the case study, this research selected Apple and Samsung Electronics.
Although these two firms have different preferences in terms of organizational
governance in the GVCs, they both externalized certain technology, parts and
components, or functions. The determinants of externalization proposed by preceding
studies (e.g., transaction costs, firm capability) are useful but cannot satisfactorily
explain the two companies well. Specifically, the case study found that both firms
externalize not just to exploit the cost advantages, but to be flexibly adapt to the fast-
changing environment.
The two companies’ externalization choices are not determined by the highest
technology, but the high commercial value. Furthermore, they outsource some activities
to the third party not only to exploit the benefits or specialization, but to maximize the
value creation through co-specialization and co-development. In this respect, the three
conditions, which emphasize the changing patterns of business, can complement earlier
studies to explain the conditions for externalization. This research also conducted the
quantitative/statistical tests to complement the qualitative case study by collecting more
firm data from other industries. The result showed that the three conditions well explain
the externalization (i.e., partnership) choice by Korea’s SMEs in terms of their R&D
activities.
The integrated framework of trade, FDI, and NEMs can provide wider options for
firms to choose when expanding their global presence as well as offering important
implications for firms to enhance their international competitiveness. The trade approach
often stirs up competitive or hostile relationship among countries. However, if firms

182
flexibly combine trade with the other two types of transactions, thereby emphasizing
more cooperative relationship, it would not only create higher synergies, but also
enhance their competitive advantages. For example, if the host government (e.g., the US)
pursues import restriction policy and prefers the inward FDI by MNCs because the
inward FDI can create jobs for the host country, then the MNCs can restructure their
organizational governance in their GVCs from trade to more a FDI-oriented strategy.
For further studies, as this study mainly conducted cases for high technology
industries, the conceptual framework can be applied and tested to other labor-intensive
or service industries, which have different industrial structure and characteristics in
nature. In addition, the quantification of the three conditions for firms’ externalization
can also be improved by incorporating more samples from more diverse industries and
control variables as well as other measurements for more generalization of the arguments
of this study.

183
REFERENCES
Allee, V. 2000. Reconfiguring the value network. Journal of Business Strategy, 21(4):
36-39.
Amador, J. and Cabral, S. 2016. Global value chains: A survey of drivers and measures.
Journal of Economic Surveys, 30(2): 278-301.
Antràs, P. and Rossi-Hansberg, E. 2009. Organizations and trade. Annual Review of
Economics, 1: 43-64.
Apple. 2016. Apple annual report 2016.
Arndt, S. W. and Kierzkowski, H. (eds.). 2001. Fragmentation: New production patterns
in the world economy. New York: Oxford University Press.
ASEAN Secretariat and UNCTAD. 2016. ASEAN investment report 2016: Foreign
direct investment and MSME linkage. Jakarta: Indonesia: Association of
Southeast Asian Nations (ASEAN).
Azmeh, S. and Nadvi, K. 2014. Asian firms and the restructuring of global value chains.
International Business Review, 23(4): 708-717.
Bair, J. and Gereffi, G. 2001. Local clusters in global chains: The causes and
consequences of export dynamism in Torreon’s blue jeans industry. World
Development, 29(11): 1885-1903.
Balassa, B. 1965. Tariff protection in industrial countries: An evaluation. Journal of
Political Economy, 73(4): 573-594.
Barney, J. B. 1986. Organizational culture: Can it be a source of sustained competitive
advantage? Academy of Management Review, 11(3): 656-665.
Barney, J. B. 1991. Firm resource and sustained competitive advantage. Journal of
Management, 17(1): 99-120.
Bartlett, C. A. and Ghoshal, S. 1989. The emerging organization model. In Bartlett, C.
A. and Ghoshal, S. (eds.), Managing across borders: The transnational solution.
Boston: Harvard University Press.

184
Belderbos, R. and Carree, M., and Lokshin, B. 2006. Complementarity in R&D
cooperation strategies. Review of Industrial Organization, 28(4): 401-426.
Bhagwati, J. N. and Srinivasan, T. N. 1973. The general equilibrium theory of effective
protection and resource allocation. Journal of International Economics, 3(3):
259-281.
Bloomberg. 2012. Why only Samsung builds phones that outsell iPhones. November
10th. https://www.bloomberg.com/news/articles/2012-11-09/why-only-samsung-
builds-phones-that-outsell-iphones
Brusoni, S., Prencipe, A., and Pavitt, K. 2001. Knowledge specialization, organizational
coupling, and the boundaries of the firm: Why do firms know more than they
make? Administrative Science Quarterly, 46(4): 597-621.
Buckley, P. 2004. The role of China in the global strategy of multinational enterprises.
Journal Chinese Economic and Business Studies, 2(1): 1-25.
Buckley, P. 2009. Internalization thinking: From the multinational enterprise to the
global factory. International Business Review, 18: 224-235.
Buckley, P. J., Clegg, L. J., Cross, A. R., Liu, X., Voss, H., and Zheng, P. 2007. The
determinants of Chinese outward foreign direct investment. Journal of
International Business Studies, 38(4): 499-518.
Buckley, P. and Casson, M. 1976. The future of the multinational enterprise. New York:
Holmes and Meier Publishers.
Bunyaratavej, K., Hahn, E., and Doh, J. 2007. International offshoring of services: A
parity study. Journal of International Management, 13(1): 7-21.
Business Insider. 2012. This article explains why Apple makes iPhones in China and
why the US is screwed. January 22. http://www.businessinsider.com/you-simply-
must-read-this-article-that-explains-why-apple-makes-iphones-in-china-and-
why-the-us-is-screwed-2012-1.
Business Insider. 2014. Here’s the truth about the iPhone and carrier subsidies. April
22nd. http://www.businessinsider.com/apples-iphone-carrier-subsidies-2014-4.

185
Business Insider. 2014. This iPhone repair service is cheaper than Apple’s genius bar,
and the techs come to you. May 10th. http://www.businessinsider.com/iphone-
repair-service-2014-5
Business Insider. 2017. Apple is spending billions on secret R&D projects – and it keeps
spending more. February 1st. http://www.businessinsider.com/apple-rd-spend-
charts-2017-2
Business Journal. 2015. Something big is brewing at Apple’s Elk Grove campus.
December 7th.
http://www.bizjournals.com/sacramento/news/2015/12/07/something-huge-is-
brewing-apples-elk-grove-campus.html
Business Korea. 2014. South Korea becomes biggest investor in Vietnam, beating Japan.
http://www.businesskorea.co.kr/english/news/money/5112-largest-investor-
south-korea-becomes-biggest-investor-vietnam-beating-japan.
Calantone, R. and Stanko, M. 2007. Drivers of outsourced innovation: an exploratory
study. Journal Product Innovation Management, 24(3): 230-241.
Campbell, A. J. and Wilson, D. T. 1996. Managed networks: Creating strategic
advantage. In Lacobucci, D. (ed.), Networks in marketing. London: Sage
Publishing.
Cantwell, J. 1989. Technological innovation and multinational corporations. Oxford:
Blackwell.
Cantwell, J. 1991. A survey of theories of international production. In Pitelis, C. and
Sugden, R. (eds.), The nature of the transnational firm. London: Routledge.
Cantwell, J. 1994. The relationship between international trade and international
production. In Greenway, D. and Winters, L. A. (eds.), Surveys in international
trade. Oxford: Blackwell.
Cattaneo, O., Gereffi, G., Miroudot, S., and Taglioni, D. 2013. Joining, upgrading and
being competitive in global value chains: A strategic framework. Policy Research
Working Paper 6406, World Bank, Washington, DC.

186
Cavusgil. S., Yaprak, A., and Yeoh, P. 1993. A decision-making framework for global
sourcing. International Business Review, 2(2): 143-156.
Chen, H. and Chen, T. 1998. Network linkages and location choice in foreign direct
investment. Journal of International Business Studies, 29(3): 445-467.
Cho, D. S., Moon, H. C., and Yin, W. 2016. Enhancing national competitiveness through
national cooperation: The case of South Korea and Dubai. Competitiveness
Review, 26(5): 482-499.
Cho, D. S. and Moon, H. C. 2013. From Adam Smith to Michael Porter: Evolution of
competitiveness theory (extended edition). Singapore: World Scientific.
CNBC. 2015. Samsung makes a big bet on its own operating system. January 15th.
http://www.cnbc.com/2015/01/14/samsung-makes-a-big-bet-on-its-own-
operating-system.html.
Coase, R. 1937. The nature of the firm. Economica 4: 386-405.
Collins, J. M. 1990. A market performance comparison of U.S. firms active in domestic,
developed and developing countries. Journal of International Business Studies,
2: 271-87.
Connelly, B. L., Ketchen, D. J., Hult, G. T. 2013. Global supply chain management:
Toward a theoretically driven research agenda. Global Strategy Journal, 3(3):
227-243.
Contractor, F., Kumar, V., Kundu, S., and Pedersen, T. 2010. Reconceptualizing the firm
in a world of outsourcing and offshoring: The organizational and geographical
relocation of high-value company functions. Journal of Management Studies,
47(8): 1417-1433.
Contractor, F. J. and Lorange, P. 1988. Cooperative strategies in international business.
Lexington, MA: D.C. Health & Co.
Corden, W. M. 1971. The theory of protection. Oxford: Oxford University Press.
Cuervo-Cazurra, A. and Genc, M. 2008. Transforming disadvantages into advantages:
Developing-country MNEs in the least developed countries. Journal of

187
Cui, L, Meyer, K. E., Hu, H. W. 2014. What drives firms’ intent to seek strategic assets
by foreign direct investment? A study of emerging economy firms. Journal of
World Business, 49(4): 488-501.
D’Aveni, R. A. 1998. Waking up to the era of hypercompetition. Washington Quarterly,
21(1): 183-195.
Dess, G. G., Rasheed, A., McLaughlin, K., & Priem, R. 1995. The new corporate
architecture. Academy of Management Executive, 9(3): 7-20.
de Marchi, V., Di Maria, E., and Ponte, S. 2014. Multinational firms and the management
of global networks: Insights from global value chain studies. Advances in
International Management, 27: 463-486.
de Reuver, M. and Bouwman, H. 2012. Governance mechanisms for mobile service
innovation in value networks. Journal of Business Research, 65(3): 347-354.
Dixit, A. K. and Grossman, G. M. 1982. Trade and protection with multistage
production. Review of Economic Studies, 49: 583-594.
Dunning, J. H. 1977. Trade location of economic activity and the MNE: A search for an
eclectic approach. In B. G. Ohlin, P. Hellelborn, & P. M. Wijkman (Eds), The
international allocation of economic activity: Proceedings of a Nobel symposium
held at Stockholm (pp. 395-418). London: Macmillan.
Dunning, J. H. 1981. International production and the multinational enterprise. London:
Allen & Unwin.
Economist. 2012. The end of cheap China. March 10th.
Economist. 2016. Donald Trump’s trade bluster. December 10th.
Economist. 2017. Ford Motors courts Donald Trump by scrapping a planned plant in
Mexico. January 5th.
Economist. 2017. Shenzhen is hothouse of innovation. April 8th.
Economist. 2017. The PRD is exporting jobs but producing more goods for the home
market. April 8th.
Economist. 2017. What China can learn from the pearl river delta. April 8th.

188
Eisenhardt, K. M. 1989. Building theories from case study research. Academy of
Management Review, 14(4): 532-550.
Eisenhardt, K. M. and Martin, J. A. 2000. Dynamic capabilities: What are they? Strategic
Management Journal, 21(1): 1105-1121.
Elfing, T. and Baven, G. 1994. Outsourcing technical services: Stages of development.
Long Range Plan, 27(5): 42-51.
Ellram, L and Billington, C. 2001. Purchasing leverage considerations in the outsourcing
decision. European Journal of Purchasing and Supply, 7(1): 15-27.
Elms, D. K. and Low, P. 2013. Global value chains in a changing world. Geneva,
Switzerland: World Trade Organization (WTO).
Erkus-Öztürk, H. and Terhorst, P. 2010. Variety of modes of governance of a global value
chain: The case of tourism from Holland to Turkey. Tourism Geographies, 12(2):
217-245.
ET News. 2013. Samsung Electronics accelerates smartphone outsourcing, production
from joint venture in Tianjin exceeds 10 million. November 12th.
http://english.etnews.com/news/article.html?id=20131112200006.
Feenstra, R. C. 1998. Integration of trade and disintegration of production in the global
economy. Journal of Economic Perspectives, 12(4): 31-50.
Film Business Asia. 2013. Korean cinema, Chinese characteristics. October 7th.
Folta, T. B. 1998. Governance and uncertainty: The trade-off between administrative
control and commitment. Strategic Management Journal, 19: 1007-1028.
Forsgren, M. 2013. Theories of the multinational firm. Cheltenham, UK Northampton,
MA, USA: Edward Elgar.
Fortune. 2011. Rethinking Apple’s org chart. August 29th.
http://fortune.com/2011/08/29/rethinking-apples-org-chart/
Gans, J. S. and Stern, S. 2003. The product market and the market for “ideas”:
Commercialization strategies for technology entrepreneurs. Research Policy,
32(2): 333-350.
189
Gereffi, G. 1994. The organization of buyer-driven global commodity chains: How US
retailers shape overseas production networks. In Gereffi, G. and Korzeniewicz,
M. (eds.), Commodity chains and global capitalism. Westport, CT: Praeger.
Gereffi, G. 1999. International trade and industrial upgrading in the apparel commodity
chain. Journal of International Economics, 48: 37–70.
Gereffi, G. and Fernandez-Stark, K. 2011. Global value chain analysis.
http://www.cggc.duke.edu/pdfs/2011-05-31_GVC_analysis_a_primer.pdf
Gereffi, G., Humphrey, J., Kaplinsky, R., and Sturgeon, T. 2001. Introduction:
Globalization, value chains and development. IDS Bulletin, 32(3): 1-8.
Gereffi, G., Humphrey, J., and Sturgeon, T. 2005. The governance of global value chains.
Review of International Political Economy, 12(1): 78-104.
Geringer, J. M., Paul, W. B., Richard, C. D. 1989. Diversification strategy and
internationalization: Implications for MNE performance. Strategic Management
Journal, 10: 109-20.
Geyskens, I., Steenkamp, J. E. M., and Kumar, N. 2006. Make, buy, or ally: A transaction
cost theory meta-analysis. The Academy of Management Journal, 49(3): 519-
543.
Giachetti, C. and March, G. 2010. Evolution of firms’ product strategy over the life cycle
of technology-based industries: A case study of the global mobile phone industry,
1980-2009. Business History, 52(7): 1123-1150.
Gilbert, B. A., McDougall, P. P., and Audretsch, D. B. 2008. Clusters, knowledge
spillovers and new venture performance: An empirical examination. Journal of
Business Venturing, 23: 405-422.
Gilley, K. M. and Rasheed, A. 2000. Making more by doing less: An analysis of
outsourcing and its effects on firm performance. Journal of Management, 26(4):
763-790.
Giroud, A. and Mirza, H. 2015. Refining of FDI motivations by integrating global value
chains’ considerations. Multinational Business Review, 23(1): 67-76.

190
Gleich, W., Schmeisser, B., and Zschoche, M. 2017. The influence of competition on
international sourcing strategies in the service sector. International Business
Review, 26: 279-287.
Graf, M. and Mudambi, S. 2005. The outsourcing of IT-enabled business processes: A
conceptual model of the location decision. Journal of International Management,
11(2): 253-268.
Grant, R. 1996. Toward a knowledge-based theory of the firm. Strategic Management
Journal, 17(S2): 109-122.
Grant, R. M., Jammine, A. P., and Thomas, H. 1988. Diversity, diversification,
profitability among British manufacturing companies, 1972-84. Academy of
Management Journal, 31: 771-801.
Granstrand, O., Patel, P., and Pavitt, K. 1997. Multi-technology corporations: Why they
have “distributed” rather than “distinctive core” competencies. California
Management Review, 39(4): 8-25.
Grimes, S. and Sun, Y. 2016. China’s evolving role in Apple’s global value chain. Area
Development and Policy, 1(1): 94-112.
Grimpe, C. and Kaiser, U. 2010. Balancing internal and external knowledge acquisition:
The gains and pains from R&D outsourcing. Journal of Management Studies,
47(8): 1483-1509.
Grote, M. and Täube, F. 2007. When outsourcing is not an option: International
relocation of investment bank research – or isn’t it? Journal of International
Management, 13: 57-77.
Gunasekaran, A. 1998. Agile manufacturing: Enablers and an implementation
framework. International Journal of Production Research, 36(5): 1223-1247.
Gunasekaran, A. 1999. Agile manufacturing: A framework for research and
development. International Journal of Production Research, 62: 87-105.
Hagedoorn, J., Cloodt, D., and van Kranenburg, H. 2005. Intellectual property rights and
the governance of international R&D partnerships. Journal of International
Business Studies, 36(2): 175-186.

191
Hahn, J. and Lee, B. 2017. Mainland market in the crosshairs: Korea-China FTA’s impact
on the Korean film industry and “Hanryu” culture. Korea Observer, 48(1): 1-24.
Hamel, G. and Prahalad, C. K. 1994. Competing for the future. Boston, MA: Harvard
Business School Press.
Hätönen , J. 2009. Making the locational choice: A case approach to the development of
a theory of offshore outsourcing and internationalization. Journal International
Management, 15(1): 61-76.
Hätönen, J. and Eriksson, T. 2009. 30+ years of research and practice of outsourcing –
exploring the past and anticipating the future. Journal of International Management,
15: 142-155.
Hedlund, G. and Ridderstrale, J. 1997. Toward a theory of the self renewing MNC. In B.
Toyne and D. Nigh, editors, International business: An emerging vision.
Columbia, SC: University of South Carolina Press.
Hennart, J. F. 2009. Down with MNE-centric theories! Market entry and expansion as
bundling of MNE and local assets. Journal of International Business Studies,
40(9): 1432-1454.
Hennart, J. F. 1982. A theory of multinational enterprise. Ann Arbor, MI: University of
Michigan Press.
Hernández, V. and Pedersen, T. 2017. Global value chain configuration: A review and
research agenda. Business Research Quarterly, 20(2): 137-150.
Holcomb, T. R. and Hitt, M. A. 2007. Toward a model of strategic outsourcing. Journal
of Operations Management, 25: 464-481.
Hoskisson, R. E., Eden, L., Lau, C. M., and Wright, M. 2000. Strategy in emerging
economies. Academy of Management Journal, 43(3): 249-267.
HR Strategy Tools. 2013. HR strategy at Apple make their employees creative and
innovative. December 14th. http://management-training-guru.com/2013/12/hr-
strategy-at-apple-make-their-employees-creative-and-innovative/
Hult, G. T. M. 2004. Global supply chain management: An integration of scholarly
thoughts. Industrial Marketing Management, 33(1): 3-5.

192
Hult, G. T. M., Ketchen, D. J., and Arrfelt, M. 2007. Strategic supply chain management:
Improving performance through a culture of competitiveness and knowledge
development. Strategic Management Journal, 28(10): 1035-1052.
Hummels, D., Ishii, J., and Yi, K. M. 2001. The nature and growth of vertical
specialization in world trade. Journal of International Economics, 54: 75-96.
Hymer, S. 1976[1960]. The international operations of national firms: A study of foreign
direct investment. Cambridge: MIT Press.
HIS. 2016. Samsung Galaxy S7 teardown reveals Ho-Hum refresh. March 15.
http://news.ihsmarkit.com/press-release/technology/samsung-galaxy-s7-
teardown-reveals-ho-hum-refresh-0.
Institute for Industrial Policy Studies (IPS). 2011. Upgrading the industrial structure
Guangdong province: Lessons from the Korean experience and implications for
Guangdong province. Consulting report for Guangdong province government.
IT Chosun. 2017. The large demand for small and medium-sized screen. July 2th.
http://it.chosun.com/news/article.html?no=2836856&sec_no=371&pos=main_t
op&cc. (in Korean)
Ito, K. and Rose, E. L. 2004. An emerging structure of corporations. Multinational
Business Review, 12(3): 63-83.
Javalgi, R., Dixit, A., and Scherer, R. 2009. Outsourcing to emerging markets:
Theoretical perspectives and policy implications. Journal of International
Management, 15: 156-168.
Johnson, K., Li, Y., Phan, H., Singer, J., and Trinh, H. 2012. The innovative success that
is Apple, Inc. Thesis, Dissertations and Capstones, Paper 418. Marshall digital
Scholar, Marshall University.
JoongAng Ilbo. 2017. The reasons for the growing investment by Samsung and LG in
Viet Nam, in spite of the US withdrawal from TPP. February 27.
http://news.joins.com/article/21315592 (in Korean).
Kakabadse, N. and Kakabadse, A. 2000. Critical review – Outsourcing: A paradigm
shift. Journal of Management Development, 19(8): 670-728.

193
Kambil, A. and Short, J. E. 1994. Electronic integration and business network redesign:
A roles-linkage perspective. Journal of Management Information Systems, 10(4):
59-83.
Kedia, B. and Mukherjee, D. 2009. Understanding offshoring: A research framework
based on disintegration, location and externalization. Journal of World Business,
44: 250-261.
Ketels, C. H. M. 2011. Clusters and competitiveness: Porter’s contribution. In Huggins,
R. and Izushi, H. (eds.), Competition, competitive advantage, and clusters, New
York: Oxford University Press.
Kim, J. M. and Rhee, D. K. 2009. Trends and determinants of South Korean outward
foreign direct investment. Copenhagen Journal of Asian Studies, 27(1): 126-154.
Kogut, B. and Zander, U. 1992. Knowledge of the firm, combinative capabilities and the
replication of technology. Organization Science, 3(3): 76-92.
Kogut, B. and Zander, U. 1993. Knowledge of the firm and the evolutionary theory of
the multinational enterprise. Journal of International Business Studies, 24(4):
625-645.
Kojima, J. 1992. Internalization vs. cooperation of MNC’s business. Hitotsubashi
Journal of Economy, 33: 1-17.
Korea Eximbank FDI database. http://stats.koreaexim.go.kr/odisas.html
Korea Times. 2015. Chinese market draws Korean producers, screenwriters. January
14th.
Korean Ministry of Knowledge Economy. 2008. Global Investment Report: The
Comparative Analysis on the Investment Environment of Viet Nam and
Cambodia [in Korean]. Issue No. 5.
Koste, L. L. and Malhotra, M. K. 2000. A theoretical framework for analyzing the
dimensions of manufacturing flexibility. Journal of Operations Management, 18(1):
75-94.

194
Kotabe, M., Sahay, A., and Aulakh, P. 1996. Emerging role of technology licensing in
the development of global product strategy: Conceptual framework and research
propositions. Journal of Marketing, 60(1): 73-88.
Kotabe, M. and Mudambi, R. 2009. Global sourcing and value creation: opportunities
and challenges. Journal of International Management, 15: 121-125.
Kotabe, M., Parete, R., and Murray, J. Y. Antecedents and outcomes of modular
production in the Brazilian automobile industry: A grounded theory approach.
Journal of International Business Studies, 38: 84-106.
KOTRA (Korea Trade-Investment Promotion Agency). 2015. Will TPP be the
steppingstone for the re-takeoff of Viet Nam industries? November 13. Global
Windows, KOTRA Overseas Business Information Portal site,
http://www.globalwindow.org/gw/main/GWMAIN010M.html.
KOTRA (Korea Trade-Investment Promotion Agency). 2016. Viet Nam’s FDI in 2016
driven by Korean firms. July 25th.
http://news.kotra.or.kr/user/globalBbs/kotranews/6/globalBbsDataView.do?setIdx
=322&dataIdx=150984 (in Korean).
Koufteros, X., Vonderembse, M., and Jayaram, J. 2005. Internal and external integration
for product development: The contingency effects of uncertainty, equivocality, and
platform strategy. Decision Sciences, 36(1): 97-133.
Krugman, P. 1979. Increasing returns, monopolistic competition and international trade.
Journal of International Economics, 9(4): 469-479.
Krugman, P. 1980. Scale economies, product differentiation, and the pattern of trade.
American Economic Review, 70(5): 950-959.
Krugman, P. 1991. Increasing returns and economic geography. Journal of Political
Economy, 99(3): 483-499.
Krugman, P. R. 1995. Growing world trade: Causes and consequences. Brookings
Papers on Economic Activity, 26(1): 327-377.
Kwak, J. S. 2007. Korean OFDI: Investment strategies and corporate motivations for
investing abroad. CEPAL paper. Santiago, Chile: United Nations.

195
Lewin, A. Y., Massini, S., and Peeters, C. 2009. Why are companies offshoring
innovation? The emerging global race for talent. Journal of International
Business Studies, 40(6): 901-925.
Li, P. P. 2003. Toward a geocentric theory of multinational evolution: The implications
from the Asian MNEs as latecomers. Asia Pacific Journal of Management, 20(2):
217-242.
Li, P. P. 2007. Toward an integrated theory of multinational evolution: The evidence of
Chinese multinational enterprises as latecomers. Journal of International
Management, 13(3): 296-318.
Liang, G. 2015. A Fox-Apple partnership in the global value chain: How did foreign
direct investment and contract manufacturing reshape the landscape of the
electronics industry? In Xing, Y. (ed.), Uncovering value added in trade: New
approaches to analyzing global value chains. Singapore: World Scientific.
Liang, X., Lu, X., and Wang, L. 2012. Outward internationalization of private enterprises
in China: The effect of competitive advantages and disadvantages compared to
home market rivals. Journal of World Business, 47(1): 134-144.
Liesch, P., Buckley, P., Simonin, B., Knight, G. 2012. Organizing the modern firm in the
worldwide market for market transactions. Management International Review,
52: 3-21.
Linder, J. 2004. Outsourcing as a strategy for driving transformation. Strategy and
Leadership, 32(6): 26-31.
Linder, J., Cole, M., and Jacobson, A. 2002. Business transformation through
outsourcing. Strategy and Leadership, 30(4): 23-28.
Liu, X., Xiao, W., and Huang, X. 2008. Bounded entrepreneurship and
internationalization of indigenous Chinese private-owned firms. International
Business Review, 17(4): 488-508.
Loh, L and Venkatraman, N. 1992. Diffusion of information technology outsourcing:
Influence sources and the Kodak effect. Information System Research, 3(4): 334-358.

196
Lu, J. W. and Beamish, P. W. 2004. International diversification and firm performance:
The s-curve hypothesis. Academy of Management Journal, 47(4): 598-609.
Lukka, K. Approaches to case research in management accounting: The nature of
empirical intervention and theory linkage. In Jönsson, S., Mouritsen, J. (eds.),
Accounting in Scandinavia. Stockholm: Copenhagen Business School Press.
Lundquist, K. J., Olander, L.O., and Henning, M. S. 2008. Producer services: Growth
and roles in long-term economic development. The Service Industries Journal,
28(4), 463–477.
Luo, Y. and Tung, R. L. 2007. International expansion of emerging market enterprises:
A springboard perspective. Journal of International Business Studies, 38(4): 481-
498.
Luo, Y. and Zhang, H. 2016. Emerging market MNEs: Qualitative review and theoretical
directions. Journal of International Management, available online
http://dx.doi.org/10.1016/j.intman.2016.05.001.
Maeil Business Economy. 2017. The fast growing of DRAM… The decision by JY in
prison. July 4th.
http://news.mk.co.kr/newsRead.php?sc=30000001&year=2017&no=448541.
Mahutga, M. C. 2012. When do value chains go global? A theory of the spatialization of
global value chains. Global Networks, 12(1): 1-21.
Makadok, R. 2001. Toward a synthesis of the resource-based and dynamic-capability
views of rent creation. Strategic Management Journal, 22(5): 363-380.
Makino, S., Lau, C. M. and Yeh, R. S. 2002. Asset-exploitation versus asset-seeking:
Implications for location choice of foreign direct investment from newly
industrialized economies. Journal of International Business Studies, 33: 403-
422.
March, J. G. 1991. Exploration and exploitation in organizational learning. Organization
Science, 2(1): 71–67.
Marshall, A. 1920[1890]. Principle of economics. London: Macmillan.

197
Mathews, J. A. 2006. Dragon multinationals: New players in 21st century globalization.
Asia Pacific Journal of Management, 23: 5-27.
Martin, R. and Sunley, P. 2003. Deconstructing clusters: Chaotic concept or policy
panacea? Journal of Economic Geography, 3: 5-35.
Martinez-Noya, A. and Garcia-Canal, E. 2011. Technological capabilities and the
decision to outsource/outsource offshore R&D services. International Business
Review, 20(3): 264-277.
Mayo, B. 2016. $649 iPhone 7 estimated to cost Apple ~$200, here’s the component
breakdown. September 20. https://9to5mac.com/2016/09/20/649-iphone-7-
estimated-to-cost-apple-220-heres-the-component-breakdown/.
Mazzawi, E. 2002. Transformational outsourcing. Business Strategy Review, 13(3): 39-
43.
McCann, B. T. and Folta, T. B. 2011. Performance differentials within geographic
clusters. Journal of Business Venturing, 26: 104-123.
Melvin, J. R. 1969. Intermediate goods, the production possibility curve and gains from
trade. Quarterly Journal of Economics, 83(1): 141-151.
Meyer, P. 2017. Apple Inc. organizational structure: Features, pros & cons. January 29th.
http://panmore.com/apple-inc-organizational-structure-features-pros-cons
Mol, M. 2005. Does being R&D intensive still discourage outsourcing? Evidence from
Dutch manufacturing. Research Policy, 34: 571-582.
Moon, H. C. 1994. A revised framework of global strategy: Extending the coordination-
configuration framework. The International Executive, 36(5): 557-573.
Moon, H. C. 2010. Global business strategy: Asian perspective. Singapore: World
Scientific.
Moon, H. C. 2016a. Foreign direct investment: A global perspective. Singapore: World
Scientific.
Moon, H. C. 2016b. The strategy for Korea’s economic success. New York: Oxford
University Press.
Moon, H. C. 2017a. On competition. forthcoming book.

198
Moon, H. C. 2007b. Overcoming the crisis and sustainable growth. In Kang, D. J. (eds.),
Korea agenda. Seoul: Nanok Publishing.
Moon, H. C., Parc, J., Yim, S. H., and Yin, W. 2013, Enhancing performability through
domestic and international clustering: A case study of Samsung Electronics
Corporation (SEC). International Journal of Performability Engineering, 9(1):
75-84.
Moon, H. C., Rugman, A. M., and Verbeke, A. 1995. The generalized double diamond
approach to international competitiveness. In Rugman, A., Van Den Broeck, J.
and Verbeke, A. (Eds.), Research in global strategic management: Beyond
diamond (Volume 5). Greenwich, CT: JAI Press.
Moon, H. C., Rugman, A. M., and Verbeke, A. 1998. A generalized double diamond
approach to the international competitiveness of Korea and Singapore.
International Business Review, 7(2): 135-150.
Moon, H. C. and Jung, J. S. 2008. A stage approach to the cluster evolution and the
development of a new global-linking cluster. The Review of Business History,
23(1): 77-104 (in Korean).
Moon, H. C. and Jung, J. S. 2010. Northeast Asian cluster through business and cultural
cooperation. Journal of Korea Trade, 14(2): 29-53.
Moon, H. C. and Kim, M. Y. 2008. A new framework for global expansion: A dynamic
diversification-coordination (DDC) model. Management Decision, 46(1): 131-
151.
Moon, H. C. and Parc, J. 2014. The economic effects of outward foreign direct
investment: A case study on Samsung Electronics Co. Korean Business Review,
18(3): 125-145 (in Korean).
Moon, H. C. and Roehl, T. W. 2001. Unconventional foreign direct investment and the
imbalance theory. International Business Review, 10: 197-215.
Moon, H. C. and Yin, W. 2015. The top Korean multinationals: Changes and continued
growth of foreign investment, in Emerging Market Global Players (EMGP)

199
Project, Columbia Center on Sustainable Investment (CCSI), Columbia
University, New York.
Moon, H. C. and Yin, W. 2017a. Changing trends of Korean FDI in ASEAN (2016-
2017). Consulting paper (partially included) for UNCTAD FDI report on
ASEAN.
Moon, H. C. and Yin, W. 2017b. Korea’s strategy for attracting foreign direct investment
in response to the new US government. Seoul: KOTRA. (in Korean)
Moon, H. C. and Yin, W. 2017c. Three conditions for MNCs’ externalization in global
expansion: A case study of partnership between Korea and China in the film
industry. Working Paper
Monthly Bobbin Journal. 2017. The investment in textile and clothes in Viet Nam is
activated again. May 10. http://www.bobbinjournal.com/archives/5572. (in
Korean).
Mudambi, R. 2008. Location, control and innovation in knowledge intensive industries.
Journal of Economic Geography, 8(5): 699-725.
Mudambi, P. and Puck, J. 2016. A global value chain analysis of the ‘regional strategy’
perspective. Journal of Management Studies, 53(6): 1076-1093.
Mudambi, S. and Tallman, S. 2010. Make, buy, or ally? Theoretical perspectives on
knowledge process outsourcing through alliances. Journal of Management
Studies, 47(8): 1434-1456.
Narula, R. 2004. R&D collaboration by SMEs: New opportunities and limitations in the
face of globalization. Technovation, 24(2): 153-161.
Nicolas, F., Thomsen, S., and Bang, M. 2013. Lessons from investment policy reform in
Korea. OECD working papers on international investment 2013/02.
Nicovich, S. G., Dibrell, C. C., Davis, P. S. 2007. Integration of value chain position and
Porter’s (1980) competitive strategies into the market orientation conversation:
An examinination of upstream and downstream activities. Journal of Business
Economic Studies, 13(2): 91-106.

200
OECD. 2010. High growth enterprises: what government can do to make a difference,
OECD studies on SMEs and entrepreneurship, OECD publishing.
OECD and World Bank. 2014. Science, technology and innovation in Viet Nam.
http://dx.doi.org/10.1787/9789264213500-en.
OECD, WTO, and UNCTAD. 2013. Implications of global value chains for trade,
investment, development and jobs. Prepared for the G-20 Leaders Summit Saint
Petersburg (Russian Federation).
Ortiz-de-Urbina-Criado, M., Montoro-Sánchez, Á., and Mora-Valentín, E. 2014. Impact
of growth strategy on mode of governance in alliances. International Business
Review, 23: 838-848.
Oxley, J. E. 1999. Institutional environment and the mechanisms of governance: The
impact of intellectual property protection on the structure of inter-firm alliances.
Journal of Economic Behavior and Organization, 38(3): 283-309.
Pananond, P. 2013. Where do we go from here? Globalizing subsidiaries moving up the
value chain. Journal of International Management, 19(3): 207-219.
Paczkowski, J. 2012. Breaking down Apple’s retail distribution strategy. October 3rd.
http://allthingsd.com/20121003/apple-stores-get-the-glory-but-retail-partners-
shoulder-load/
Penrose, E. T. 1959. The theory of the growth of the firm. New York: John Wiley.
Peppard, J. and Rylander, A. 2006. From value chain to value network: Insights for
mobile operators. European Management Journal, 24(2-3): 128-141.
Peteraf, M. A. 1993. The cornerstones of competitive advantage: A resource-based view.
Strategic Management Journal, 14(3): 179-191.
Pham, J. 2015. Apple anlaysis: iPhone 6S. https://www.linkedin.com/pulse/apple-
analysis-iphone-6s-johno-pham.
Phene, A. and Tallman, S. 2012. Complexity, context and governance in biotechnology
alliances. Journal of International Business Studies, 43(1): 61-83.
Porter, M. E. 1980. Competitive strategy. New York: Free Press.

201
Porter, M. E. 1985. Competitive advantage: Creating and sustaining superior
performance. New York: Free Press.
Porter, M. E. 1986. Competition in global industries. Boston: Harvard Business School
Press.
Porter, M. E. 1990. The competitive advantage of nations. New York: Free Press.
Porter, M. E. 1996. What is strategy? Harvard Business Review, 74(6): 61-78.
Porter, M. E. 1998. On competition. Boston, MA: Harvard Business School Press.
Porter, M. E. 2008. On competition, updated and expanded edition. Boston, MA:
Harvard Business School Press.
Porter, M. E. and Heppelmann, J. E. 2014. How smart, connected products are
transforming competition. Harvard Business Review, 92(11): 64-88.
Portes, A. and Sensenbrenner, J. 1993. Embeddedness and imigration: Notes on the
social determinants of economic action. American Journal of Sociology, 98(6):
1320-1350.
Prahalad, C. K. and Doz, Y. L. 1987. The multinational mission: Balancing global
integration with local responsiveness. New York: Free Press.
Prahalad, C. K. and Hamel, G. 1990. The core competence of the corporation. Harvard
Business Review, May-June: 71-91.
Premium Chosun. 2016. The production of Samsung’s mobile phone recorded 413.12
million sets, a decrease by 1.6% compared that in last year. January 13th.
http://premium.chosun.com/site/data/html_dir/2016/01/12/2016011203693.html
Priem, R. L. and Butler, J. E. 2001. Is the resource-based view a useful perspective for
strategic management research? Academy of Management Review, 26(1): 22-40.
Priem, R. L. and Swink, M. 2012. A demand-size perspective on supply chain
management. Journal of Supply Chain Management, 48(2): 7-13.
Prize Committee of the Royal Swedish Academy of Sciences. 2008. Trade and
geography: Economies of scale, differentiated products and transport costs.
Scientific background on the Sveriges Riksbank Prize in Economic Sciences in
Memory of Alfred Nobel 2008.

202
PwC. 2015. Innovation’s new world order. October 27th.
Quélin, B. and Duhamel, F. 2003. Bring together strategic outsourcing and corporate
strategy: Outsourcing motives and risks. European Management Journal, 21(5):
647-661.
Quinn, J. B. 1999. Strategic outsourcing: Leveraging knowledge capabilities. Sloan
Management Review, 40: 9-22.
Quinn, J. B. 2000. Outsourcing innovation: The new engine of growth. Sloan
Management Review, 41(4): 13-28.
Quinn, J. B. and Hilmer, F. G. 1994. Strategic outsourcing. Sloan Management Review,
35(4): 43-55.
Ramaswamy, K. 1993. Multinationality and performance: an empirical examination of
the moderating effect of configuration. Academy of Management Proceedings,
142-146.
Ramamurti, R. 2012. What is really different about emerging market multinationals?
Global Strategic Journal, 2: 41-47.
Rao, P. M., Chandra, R., and Shin, J. 2012. R&D offshoring in multinational enterprises:
relevance of transaction cost and internalization theories. Competitiveness
Review: An International Business Journal, 22(5): 376-395.
Reurters. 2016. Smartphones lift Samsung Electronics to best profit in over two years.
July 7th. http://www.reuters.com/article/us-samsung-elec-results-
idUSKCN0ZM2N2.
Rindfleisch, A. and Heide, J. B. 1997. Transaction cost analysis: Past, present, and future
applications. Journal of Marketing, 61(4): 30-54.
Robertson, T. S. and Gatignon, H. 1998. Technology development model: A transaction
cost conceptualization. Strategic Management Journal, 19(6): 515-531.
Rugman, A. M. 1981. Inside the multinationals: The economics of internal markets. New
York: Columbia University Press.
Rugman, A. M. and Verbeke, A. 2004. A perspective on regional and global strategies of
multinational enterprises. Journal of International Business Studies, 35: 3-18.

203
Rugman, A. M. and Verbeke, A. 2008. A new perspective on the regional and global
strategies of multinational service firms. Management International Review,
48(4): 397-411.
Rui, H. and Yip, G. S. 2008. Foreign acquisitions by Chinses firms: A strategic intent
perspective. Journal of World Business, 43(2): 213-226.
Saliola, F. and Zanfei, A. 2009. Multinational firms, global value chains and the
organization of knowledge transfer. Research Policy, 38(2): 369-381.
Samsung Electronics. 2015. Samsung Electronics Sustainability Report 2015.
Sanyal, K. K. 1983. Vertical specialization in a Ricardian model with a continuum of
stages of production. Econoimca, 50: 71-78.
Singer, M. and Donoso, P. 2008. Upstream or downstream in the value chain? Journal
of Busienss Research, 61(6): 669-677.
Soh, K. and Yecies, B. 2017. Korean-Chinese film remakes in a new age of cultural
globalization: Miss Granny (2014) and 20 Once Again (2015) along the digital
road. Global Media and China, 2(1): 74-89.
Song, J. and Shin, J. 2008. The paradox of technological capabilities: A study of
knowledge sourcing from host countries of overseas R&D operations. Journal of
International Business Studies, 39(2): 291-303.
Stalk, G. 1988. Time: The next source of competitive advantage. Harvard Business
Review, 66(4): 41-51.
Sturgeon, T. J. and Gereffi, G. 2009. Measuing success in the global economy:
International trade, industrial upgrading, and business function outsourcing in
global value chains. Transnational Corporation, 18(2): 1-36.
Sullivan, D. 1994. Measuring the degree of internationalization of a firm. Journal of
International Business Studies, 25 (2): 325-342.
Swafford, P. M., Ghosh, S., and Murthy, N. N. 2006. A Framework for assessing value
chain agility. International Journal of Operations and Production Management, 26
(1/2): 118-140.

204
Swamidass, P. 1993. Import sourcing dynamics: an integrative perspective. Journal of
International Business Studies, 24(4): 671-691.
Tassey, G. 2000. Standardization in technology-based markets. Research Policy, 29:
587-602.
Tayles, M. and Drury, C. 2001. Moving from make/buy to strategic sourcing: The
outsource decision process. Long Range Planning, 34(5): 605-622.
Teece, D. J., Pisano, G., Shuen, A. 1997. Dynamic capabilities and strategic
management. Strategic Management Journal, 18(7): 509-533.
Teece, D. J., Rumelt, R., Dosi, G., and Winter, S. 1994. Understanding corporate
coherence: Theory and evidence. Journal of Economic Behavior and
Organization, 23(1): 1-30.
Trent, R. and Monczka, R. 2003. International purchasing and global sourcing – what
are the differences? Journal of Supply Chain Management, 39(4): 26-37
Tuoitrenews. 2013. Samsung Vietnam uses Korean suppliers as local firms below
standard. July 24. http://tuoitrenews.vn/business/11689/samsung-vietnam-uses-
korean-suppliers-as-local-firms-below-standard.
Ubergizmo. 2013. Samsung to outsource low-end smartphone production, make
premium devices itself [rumor]. November 13th.
http://www.ubergizmo.com/2013/11/samsung-to-outsource-low-end-
smartphone-production-make-premium-devices-itself-rumor/.
UNCTAD. 1995. World investment report 1995. New York and Geneva: United Nations.
UNCTAD. 2011. World investment report 2013: Non-equity modes of international
production and development. New York and Geneva: UNCTAD.
UNCTAD. 2013. World investment report 2013: Global value chains: Investment and
trade for development. New York and Geneva: UNCTAD.
UNCTAD. 2014. World investment report 2014. New York and Geneva: UNCTAD.
UNIDO. 2015. Global value chains and development: UNIDO’s support towards
inclusive and sustainable industrial development.

205
Vahlne, J. E. and Johanson, J. 2013. The Uppsala model on evolution of the multinational
business enterprise: From internalization to coordination of networks.
International Marketing Review, 30: 189-210.
Vanek, J. 1963. Variable factor proportions and inter-industry flows in the theory of
international trade. Quarterly Journal of Economics, 77(1): 129-142.
Verbeke, A. and Asmussen, C. G. 2016. Global, local, or regional? The locus of MNE
strategies. Journal of Management Studies, 53(6): 1051-1075.
Version Daily. 2016. The marketing strategy for Samsung Galaxy. November 28.
http://www.versiondaily.com/marketing-strategy-samsung-galaxy/
Vietnam Breaking News. 2016. Minh Nguyen to supply parts for Samsung. March 4.
https://www.vietnambreakingnews.com/2016/03/minh-nguyen-to-supply-parts-
for-samsung/
Vietnam Business News. 2017. Almost 200 Vietnam firms in Samsung chain. January
23rd. http://wji.at/Vietnam-News/almost-200-vietnam-firms-in-samsung-chain/
Vietnamplus. 2016. Samsung plans production of 200 million smartphones in Vietnam.
http://en.vietnamplus.vn/samsung-plans-production-of-200-million-
smartphones-in-vietnam/92926.vnp.
Wall Street Journal. 2010. Not really made in China. December 15th.
Wall Street Journal. 2013. Inside Samsung phone: Samsung parts. May 8th.
https://www.wsj.com/articles/SB1000142412788732405970457847130054653
1408
Wall Street Journal. 2017. Among the iPhones biggest transformations: Apple itself.
June 20th.
Wall Street Journal. 2017. The iPhone decade in 12 charts. June 29th.
Wall Street Journal. 2017. Samsung to use Sony batteries in Galaxy S8 phone. February
17th. https://www.wsj.com/articles/sony-unit-to-join-battery-suppliers-for-new-
samsung-phone-1487313394
Walker, G. and Weber, D. 1984. A transaction cost approach to make-or-buy decisions.
Administrative Science Quarterly, 29(3): 373-391.
206
Wang, Y., Lo, H-P, and Yang, Y. 2004. The constituents of core competencies and firm
performance: Evidence from high-technology firms in China. Journal of
Engineering and Technology Management, 21(4): 249-280.
Wernerfelt, B. 1984. A resource-based view of the firm. Strategic Management Journal,
5: 171-180.
Wikiwand website. http://www.wikiwand.com/en/Samsung_Electronics
Williamson, O. E. 1975. Markets and hierarchies. New York: Free Press.
Williamson, O. E. 1975. Transaction-cost economics: The governance of contractual
relations. Journal of Law and Economics, 22(2): 233-261.
Winter, S. G. 2003. Understanding dynamic capabilities. Strategic Management Journal,
24(10): 991-995.
Yang, X., Lim, Y., Sakurai, Y., and Seo, S. 2009. Internationalization of Chinese and
Korean firms. Thunderbird International Business Review, 51(1): 37-51.
Yecies, B. 2016. The Chinese-Korean co-production pact: Collaboration encounters and
the accelerating expansion of Chinese cinema. International Journal Cultural
Policy 22(5): 770-786.
Yin, R. K. 2003. Case study research: Design and methods (3rd ed., Vol. 5). Thousand
Oaks, CA: Sage.
Yin, W. 2015. Motivations of Chinese outward foreign direct investment: An organizing
framework and empirical investigation. Journal of International Business and
Economy, 16(1): 82-106.
Zhang, Q., Vonderembrse, M. A., and Lim, J. 2002. Value chain flexibility: A Dichotomy
of competence and capability. International Journal of Production Research,
40(3): 561-583.

207
APPENDIX
Table A1. Top 20 Internationalized Korean MNCs and Locations of Their Subsidiaries in ASEAN
Rank Name of company Industry Foreign assets Presence in ASEAN
1 Samsung Electronics Conglomerate 18,449 Indonesia, Malaysia, Philippines, Singapore, Thailand, Vietnam
2 POSCO Conglomerate 8,160 Cambodia, Indonesia, Malaysia, Myanmar, Philippines, Singapore, Thailand, Vietnam
3 Hyundai Motor Company Conglomerate 6,786 Malaysia, Singapore, Vietnam 4 Korea Gas Corporation Gas utility 5,419 .. 5 LG Chem Conglomerate 4,239 Singapore
6 LG Electronics Conglomerate 3,456 Indonesia, Malaysia, Philippines, Singapore, Thailand, Vietnam
7 SK Hynix Semiconductors & related devices 3,165 Singapore
8 Korea Electric Power Corporation Electricity 2,670 Indonesia, Lao PDR, Malaysia, Philippines,
Singapore, Vietnam 9 Lotte Chemical Corporation Petrochemicals 2,045 Malaysia 10 Lotte Shopping Conglomerate 2,017 Indonesia, Philippines, Singapore, Vietnam 11 Samsung Display Display panel 1,955 Singapore, Vietnam 12 Kia Motors Corporation Motor vehicles 1,617 ..
13 Samsung C&T Corporation Conglomerate 1,591 Indonesia, Malaysia, Philippines, Singapore, Thailand, Vietnam

208
14 LG Display Display panel 1,565 Singapore 15 Hyundai Mobis Automotive parts 1,162 .. 16 SK Telecom Telecommunications 1,155 Singapore 17 Hyosung Corporation Conglomerate 896 Indonesia, Singapore, Vietnam 18 Samsung SDI Display panel and battery 874 Malaysia, Thailand, Vietnam
19 Hyundai Heavy Industries Conglomerate 873 Indonesia, Malaysia, Philippines, Singapore, Vietnam
20 SK Innovation Conglomerate 812 Indonesia, Malaysia, Singapore Sources: ASEAN Secretariat and UNCTAD (2016)

209
Appendix 1. 12 Korean SMEs: Company Profiles and FDI in ASEAN
1. Hyun Jin Corporation56
The company was established in 1987, as an exporter of MX/MC apparels in the
Republic of Korea. It started as an OEM manufacture of MX/MC apparels such as gloves
and race pants in the home country in 1989. The company was then independently
incorporated in 1991. This company manly manufactures gloves and apparels (pants,
jersey, and jacket).
Operations in ASEAN
The company has three factories in Viet Nam and plans to establish a fourth factory in
the host country. The first glove production factory was established in 2003 in the Nam
Sach Industrial Zone in Viet Nam. In 2005, after two years of operation, Hyun Jin
established additional manufacturing facilities for producing race pants in the same place.
In 2006, the company constructed the second factory in Gia-Loc, Viet Nam for
producing gloves, pants, and jersey. The factory started OEM manufacture of Mx Jersey.
In 2010, Hyun Jin launched the third factory in Kim Lien, Nghe An Province, Viet Nam,
for producing high-end work wear. In 2011, it then established the gloves & garments
facilities and expanded the production capacity of the third factory in Kim Lien, Viet
Nam (see Table A2). The company exports these products to the US, EU, Oceania and
other countries, through both OEM and ODM. The major customers are the German
firms for racing apparels; French firms for ski, golf, cycle, firefighting, and gardening
gloves, and the US firms for military gloves.
56 The company information is abstracted from the company website, http://www.hyun-jin.com/eng/

210
Table A2. Hyun Jin Overseas Factories in ASEAN
Factory name Year Location Production items
1. Nam Sach factory
2003 Nam Sach Industrial Zone, Viet Nam Gloves
2005 Nam Sach Industrial Zone, Viet Nam Race pants
2. Gia Loc factory 2006 Gia-Loc, Viet Nam Gloves, pants, jersey
3. Kim Lien factory
2010 Kim Lien, Nghe An, Viet Nam high-end Work wear
2011 Kim Lien, Nghe An, Viet Nam gloves & garments
Source: http://www.hyun-jin.com/eng
2. Sees Global57
Sees Global was established in 1970 to produce winter sports gears for ski and
snowboard. It has then expanded its product coverage into four-season sports gears for
outdoor, bicycle, motor cycle, and fitness field as well as industrial safety gloves. The
company currently accounts for 20% of the world’s sports glove production.
Operations in ASEAN Sees Global has many overseas production factories, including in Cambodia and Viet
Nam. The factory in Viet Nam was established in 2008 with 1,000 employees. Sees
Global expanded its Vietnamese factory in 2011, which employs 2,000 workers. The
Cambodian subsidiary was founded in 2015. Sees Global has built a strong partnership
with the world’s top sports brands (e.g., The North Face, Ziener, Reusch, Lafuma, Head),
including some Korean ones (e.g., Fila, Nepa, Kolon Sport). Its factories in Cambodia
(SEES Cambodia in Phnom Penh) and Viet Nam (SEES Vina in Hai Duing Province)
supply to some of these top brands.
57 The company information is abstracted from the company website, http://eng.sees.co.kr/.
211
3. MSA58
MSA was established in 1992 to produce pants (e.g., outdoor, snow board, and girls &
boys pants) and jackets (e.g., down, wellon, snow board jacket, toddler jacket, kids
padding) to domestic and global clients.
Operations in ASEAN In ASEAN, MSA established overseas factories only in Viet Nam. MSA opened an office
in Viet Nam in 1995, with subsidiaries and two factories established after the mid-2000s.
The two factories were established in Hanoi in 2000 and 2006, and MSA VN in 2007.
The major function of these subsidiaries is to handle direct order from customers and
product orders from head office in Republic of Korea. MSA VN is also responsible for
new development, sample production, sourcing, and some high-tech functions, such as
laser cut and special wash.
The company has continuously expanded its operations in Viet Nam after 2010s,
by opening two factories – one in 2010 and the other in 2011. Unlike other factories in
Viet Nam, MSA Dong-do was established by acquiring local company (Dong-do),
whereas MSA YB was the only factory located outside Hanoi (see Table A3). The
factories all produce mainly pants and jackets.
58 The company information is abstracted from the company website, http://www.msa.co.kr/

212
Table A3. MSA Overseas Factories in Vietnam
Factory Year Location
MSA Hapro 1 2000 Saidong B Industrial Zone, Gialam, Hanoi
MSA Hapro 2 2006 Phonoi A Industrial Zone, Hungyen, Hanoi
MSA VN 2007 Tu Liem, Hanoi
MSA Dong-do 2010 Tu Liem Small and Medium Industrial Complex, Tu Liem, Hanoi
MSA YB 2011 Tuyen Quang city, Tuyen Quang province
Source: http://www.msa.co.kr/
4. Suy Co., Ltd.59
Suy, founded in 1991, is a textile company producing and exporting garments. In 2014,
the company earned sales revenue of $250 million.
Operations in ASEAN Its overseas factories are located in four countries – three in ASEAN (i.e. Indonesia,
Philippines and Viet Nam) and one in Guatemala. Its Indonesian factories produce men’s
and ladies’ knitwear involving almost 5,000 local workers. Its factories in the Philippines
and Viet Nam manufacture all kinds of knits, employing about 5,000 and 4,000 local
workers, respectively. Another feature of Suy's operation is that it not only established
wholly-owned factories, but also actively involved with outsourcing arrangement (see
Table A4). These products are mainly exported to major retailers in the United States
(e.g. Ann Taylor, Express, Lands’ end, Loft) as part of OEM contracts.
59 The company information is abstracted from the company website, http://www.suy.co.kr/gnu/bbs/index-eng.htm

213
Table A4. Suy Overseas Factories in ASEAN
Country Factory Year Location Employment Relationship
Indonesia
PT. HANOL INDONESIA
1999 Bekasi Timur L: 1500/ K: 5 Subcontractor
PT. LEADERS WORLD
2005 Jawa Barat L: 1600/ K: 6 Fully owned
PT. INKOSINDO 2008 JAKARTA UTARA L: 1500/ K: 5 Subcontractor
Philippines
DONG SEUNG INCORPORATED
1995 Rosario, Cavite L: 867/ K: 4 Subcontractor
LS PHIL 1998 Rosario, Cavite L: 1700/ K: 7 Fully owned
LEE & CHOI 2011 Rosario, Cavite L: 2300/ K: 6 Subcontractor
Viet Nam
DONGBANG 2005 Ho Chi Minh City L: 550/ K: 2 Subcontractor
L&S VINA 2006 Thuan An District, Binh Doung Province
L: 900/ K: 6 Fully owned
LEE & VINA 2006 Thuan An District, Binh Doung Province
L: 1800/ K: 10
Fully owned
SS VINA 2006 Thuan Giao, Thuan An Binh Doung Province
L: 580/ K: 7 Subcontractor
Source: http://www.suy.co.kr/gnu/bbs/index-eng.htm Note : L: Local empoyees, K: Korean employees
5. Gomundang Printing Inc.60
Gomundang, established in 1962, provides printing and packaging services. Before 2000,
it served the Korean domestic market by concluding agreements with various business
departments of LG Electronics, which was its main customer. It has presence overseas
servicing Korean and international customers in various host countries.
60 The company information is abstracted from the company website, http://www.gomun.co.kr/eng/index.php

214
Operations in ASEAN
Three of Gomundang’s overseas factories are located in China (Haeju in 2001, Tsingtao
in 2004, and Tianjin in 2007) and one in Viet Nam (Hanoi in 2009). These factories
target foreign buyers and provide them with the items of printout, box, pulp mod, and
label development service (Maeil News, 2010). The company contracted with Korean
firms (e.g., LG Electronics, CJ Cheil Jedang) and foreign subsidiaries in Korea (e.g.,
Nokia) for the delivery of printouts and other strategic package business. Gomundang
has also continuously engaged in the foreign marketing business over the past decade.
For this, the company established operation and logistics offices in Yantai, China and
Hong Kong. This company is recognized as one of the few Korean printing companies
that have successfully established and operated large-scale factories overseas. The
company has also been regarded as a good example for Korean firms’ overseas
expansion.
6. Dada61
Dada was established in 1974 to manufacture headwear. It has expanded its business
portfolio to knitwear and bags, and has grown to a leading company of producing
diversified textile products. Dada currently has four main businesses, including
headwear, apparel, bag, and IT businesses. As the world’s leading headwear
manufacturer, it accounts for 45% of the global sports cap market.
61 The company information is abstracted from the company website, https://e-dada.com:446/main/index.asp

215
Operations in ASEAN
Dada, as the early mover in establishing overseas production facilities in the headwear
industry, has six global operations located in four countries, Indonesia, Viet Nam,
Bangladesh, and China. The company provides various ODM products, by partnering
with about 80 major global retailers. The Indonesian production facilities (P.T. Dada
Indonesia) were established in 1984, for knitwear production, and 50 knit lines were
added in 2007. Its major global customers include Adidas, Reebok, Gap, Walmart and
Sears.
There are two factories in Viet Nam. UNIPAX Co., Ltd. was established in 2002 in
Bien Hoa City, Dong Nai Province, for producing headwear. Unlike most headwear
manufacturers using subcontractors and using dyes for logo printing, Dada adopts in-
house embroidery. Its major customers include Nike, Adidas, and Callaway. The other
factory in Viet Nam (Moland Co., Ltd) was established in 2006, in Trang Bom District,
Dong Nai Province, for production of handbag, casual bag, and back pack. This factory
also adopts in-house printing and embroidery, CAM cutting, and laboratory and testing.
7. Molax Trading62
The company was established in 1996, starting with apparel business. Currently its main
business is manufacturing women’s outerwear apparel.
Operations in ASEAN
The company opened manufacturing plants in four cut & sew knit factories in Indonesia,
and one in Viet Nam. The first overseas manufacturing plant in Indonesia was
62 The company information is abstracted from the company website, http://www.molaxtrading.com/index.html

216
established in 1997. Today, the company has four factories in Indonesia. The factory in
Viet Nam was established in the early 2000s (see Table A5). The scale of Vietnamese
factory is smaller than the Indonesian ones. For example, the number of sewing lines in
Vietnamese factory is 12. This is comparable to Indonesian second and third factories
with around 15 sewing lines. However, the larger-scale factories (first and fourth factory)
in Indonesia have much more sewing lines – one with 28 lines, and the other with 38
lines.
Because of the differences in the production capacity among factories, the
employment scale also varies. The Vietnamese factory employs 800 persons, whereas
the Indonesian factories employ from 1,100 to 2,500 persons. These figures include both
Korean and local workforce, but majority of them are local labor force, and the number
of Koreans ranges from 2 to 7 persons, depending on the size of factory. The products
manufactured in these overseas plants are provided to both Korean and foreign retailers
and wholesalers, such as NY & C, GAP, Wal-Mart, H&M, Who.A.U., Target, and Sears.
Table A5. Molax Overseas Factories in ASEAN
Country Factory Year Location
Indonesia
PT. Molax International 1997, 2004 Cakung Jakarta
PT. Amos Indah 2000 Cakung Jakarta
PT. Molax Global Sukabumi III
2006 Sukabumi Provinsi Jawa Barat
PT. Busana Indah Global 2013 Cakung Jakarta
Viet Nam Molax Vina Co., Ltd 2002 Binh Chanh District, Ho Chi Minh
Source: http://www.molaxtrading.com/index.html

217
8. Kyung Seung Co., Ltd63
Kyung Seung Co., Ltd, founded in 1994 is a knit cut and sewn specialized apparel
company. It offers a large spectrum of knit cut and sewn products such as novelty
top/dress and sportswear, and design (PD&D) services.
Operations in ASEAN
Kyung Seung has a total of six overseas manufacturing plants, three in each of Indonesia
and Viet Nam (see Table A6). The factories in Viet Nam have a combined capacity of 69
lines, accounting for about two thirds of its total foreign production by 2016. The
Indonesian factories have a capacity of 44 lines, accounting for the remaining one-third
of its foreign production by 2016.
Kyung Seung expanded more than 30% of its production in Viet Nam by 2016 and
reduced production outputs in Indonesian factories by 2016. The company plans to
further expand the production capacity in Viet Nam in 2017 to 77 lines for VINA CKGF
factory and to 48 lines for VINA KNF factory. In order to enhance speed advantage, the
company localizes working process (in-house TD function for rapid response) and
utilizes local raw material suppliers. The United States and Sweden retail fashion
companies are its main customers - four American retailers (Gap Inc., 36%; Ann Inc.,
20%; Chico’s/WHBM, 16%; Talbot’s, 11%) and one Sweden-based company, H&M
(9%). The sales to these companies accounted for 92% of Kyung Seung’s total sales by
2016.
63 The company information is abstracted from the company website, http://www.kyungseung.com/

218
Table A6. Kyung Seung Overseas Factories in ASEAN
Country Factory Location
Viet Nam
Vina Kyungseung Trading Co., Ltd Hanoi and Ho Chi Minh
Vina CKGF Co., Ltd
Vina KNF International Co., Ltd
Indonesia PT. Tiga Kyung Seung Garmen Jakarta, Subang, and Bekasi
PT. Gunung Abadi
PT. Kyung Seung Global
Source: http://www.kyungseung.com/
9. Dong-In Entech Co., Ltd64
The company was established in 1992 to produce aluminum tubes and extruded products.
It has grown as a globally well-known company in manufacturing high quality technical
products of four businesses areas, including pack, aluminum frame, aluminum forging,
and injection & injection mold. The leading products are outdoor backpack, hydration
backpack, travel luggage, climbing harness, car seat, and stretcher. Dong-In accounted
for about 40% market share in the global backpack ODM market in 2013.
Operations in ASEAN
The company now has seven factories in the Philippines and one in Viet Nam. The first
factory was established in the Philippines in 1996. Most other factories in the Philippines
and Viet Nam were subsequently established in the 2000s (see Table A7). The company
provides its products to the global high-end outdoor brands from the US, Canada,
Switzerland, and Japan, through ODM and OEM. Korean operations employing more
64 The company information is abstracted from the company website, http://dong-in.com/home/en/

219
than 100 workers, are in charge of overseas operations, procurement of materials,
management support, and product design and development.
On the other hand, the factories in ASEAN engage in less sophisticated production
activities, such as sewing and post-process of aluminum. However, Dong-In transfers
manufacturing system and skills to local factories to improve factory productivity. Dong-
In employs 800 staff for examining the quality of products, accounting for almost 10%
of its total overseas employment to reduce defect rate (Hankyung, 2013).
Table A7. Doing-In Entech Overseas Factories in ASEAN
Country Factories Year Location
Philippines
Dong-In Entech K-1, Inc. 1996
Phase 11 Bataan Economic Zone, Mariveles, Bataan
Mountaineering Instrument 2001
East Cam Tech Corp. 2002
ALMATECH Manufacturing Corp. 2003
Edge Soft Good Solution, Inc. 2005
Dong-In Dawn Patrol Manufacturing Corp.
2009
Dong-In Sunbirds Corp. 2013
Viet Nam Dong-In Vina 2007
Dat Do District, Baria-Vung Tau Province
Source: http://dong-in.com/home/en/
10. PSMC65
The company, established in 1978, is an electronics parts and die manufacturing
company. It first started producing leadframes, one of the core components of
65 The company information is abstracted from the company website, http://eng.psmc.kr/

220
semiconductor, in 1985. It has grown to become Korea’s largest and the world 10th largest
stamping leadframe supplier. More than 70% of its sales are through exports.
Operations in ASEAN
The first overseas subsidiary was established in 1996 in the Clark Special Economic
Zone in the Philippines to strengthen sales network and achieve price competitiveness.
This foreign subsidiary started mass production in 1998, and it is also PSMC’s only
overseas factory. This subsidiary manufactures electronics parts and molds. While its
Korean factory produces high-tech products, the factory in the Philippines manufactures
relatively low-tech products such as power transistors and universal ICs. The company
supplies its products to more than 70 Korean and foreign clients around the world.
11. FTN66
FTN was founded in 1974 as a specialty garment manufacturer in LG Group. The
company was separated from LG Group in 2002.
Operations in ASEAN
Since 2003, FTN has established overseas manufacturing plants in Indonesia, the
Philippines and Viet Nam. The three factories, one each in the three ASEAN member
countries, accounted for the majority of the company’s global production (see Table A8).
By 2015, Viet Nam accounted for 70% of the global production, followed by the
66 Information for this case study is abstracted from the websites: http://www.forthenew.com/index.php, http://www.kookje.co.kr/news2011/asp/newsbody.asp?code=2500&key=20070927.22016201033

221
Philippines (25%) and Indonesia (5%). FTN sources quality and cheap materials from
around the world, and supplies its products to world-wide buyers, while more value-
added activities, including market research and technology R&D investment, are
performed in Korea.
The factory in Viet Nam was established in 2006, producing and exporting apparels
under the global fashion brands, such as DKNY, Burberry, Calvin Klein. With the
growing factory capacity, employment has also increased more than three times that
employed in 2006 (1,000 persons). In contrast with the 30% increase in production
capacity in Viet Nam, the scale of Chinese factory was reduced.
Table A8. FTN Overseas Factories in ASEAN
Country Factory Year Location
Philippines FTN Garment Corp. 2003 Maguyam, Silang, Cavite
Viet Nam FTN Vietnam Co., Ltd 2006 Ben Cat, Binh Duong Province
Indonesia PT. Fajar Tunggal Nasional 2013 Jawa Barat
Source: http://www.forthenew.com/index.php
12. Sungshin Global
The company, established in 1987, specializes in manufacturing advanced footwear
materials and parts (e.g., sole).
Operations in ASEAN
The company has three factories, one each in Indonesia, Thailand, and Viet Nam. The
three factories in ASEAN were established between 1994 and 1997. These ASEAN
factories mainly produce various injection soles (e.g., midsoles, unit soles, functional

222
soles) and sandals for global sports brand, such as Nike, Adidas, Reebok, Puma, K-Swiss,
and Newbalance.
In establishing the overseas factories, Sungshin formed a joint venture (usually with
50-70% ownership) with local firms. Local firms are responsible for dealing with various
document processes for permission and management of local human resources, whereas
Sungshin Korea commits in technology development, marketing, and other related and
supporting activities. These factories are equipped with the latest production processes
(e.g., Anti-Gloss Advanced Process, Post Curing System, Insert Multi Color/Multi
Density) and equipment to maintain high productivity and production of high quality
footwear materials.

223
국문초록
글로벌가치사슬(Global Value Chains, GVC)에 대해 다양한 학문분야에서
서로 다른 측면에서 연구를 해왔으나, 이들은 여전히 GVC의 전체적 그림에
대한 이해가 부족하다. 따라서 본 연구는 GVC에 대한 다양한 접근법인 무
역(trade), 해외직접투자(foreign direct investment, FDI), 비자본 참여방식
(non-equity mode, NEM)을 통합함으로써 이론적으로 기업의 GVC 전략을
더욱 포괄적으로 분석하였다. 또한 본 논문에서는 각각의 접근법에 대해 향
후 연구 방향을 제시하였다. 무역 접근법에서는 분석단위를 국가에서 지역
으로 전환할 필요성을 제시하였다. 글로벌 기업이 각각의 가치활동을 가장
효율적으로 수행할 수 있는 곳은 국제 연계 클러스터라는 것을 강조하였다.
즉, 특정 국가 내의 개별 클러스터가 아닌 他 국가 클러스터와의 연계가 글
로벌 기업이 GVC 활동의 지리적 위치를 선정하는데 중요한 영향을 미친다
는 것을 보여주었다. 한편, FDI 접근법에서는 글로벌 기업의 국제화 수준을
측정하는 UNCTAD의 transnationality index (TNI)의 문제점을 제시하고
가치사슬활동 특성과 지배구조의 두 가지 측면에서 보완적인 방향을 제시하
였다. 마지막으로, NEM 접근법에서는 글로벌 기업의 NEM 모드를 선택하는
조건에 관한 기존 연구의 한계점을 제시하고 NEM에 특화된 조건의 필요성
을 강조하였다.
본 연구에서는 세 가지 향후 연구 중에서 특히 세 번째를 중점으로, 글
로벌 기업이 NEM을 선택하는 세 가지 조건(빠르게 성장하는 비즈니스, 상
업적 베스트 프랙티스의 존재, 여러 핵심역량의 필요성)을 제시하였다. 기업
이 세 가지 조건 중 일부 또는 전부를 만족할 경우, 가치사슬의 일부 활동
을 외부화하는 경향이 크다는 것을 주장하였다. 또한 본 연구에서는 두 가

224
지 분석 모델(통합적 모델, 세 가지 외부화 조건)을 사례연구와 통계적 검
증을 통해 높은 설명력이 있음을 보여주었다.
우선 사례연구에서는 스마트폰 사업에서 애플과 삼성전자의 GVC 전략
을 비교함으로써, 두 기업이 국제경영전략에서 서로 다른 점을 주로 강조하
는 기존연구와는 달리 본 연구에서는 GVC 측면에서 두 기업의 유사한 점
과 다른 점을 종합적으로 분석하였다. 즉, 두 기업은 내부화와 외부화 전략
을 혼합적으로 활용함으로써, 빠르게 변화하는 경쟁환경에 더욱 잘 대응하
고, 더욱 높은 가치를 창출할 수 있음을 입증하였다. 또한, 기업의 내부화와
외부화 전략을 대체관계로 보는 기존 연구와 달리, 본 연구에서는 이들이
상호 보완 관계를 가지고 있음을 보여주었다. 이러한 연구결과는 애플과 삼
성전자를 포함하여 글로벌 기업이 더욱 효율적인 GVC 전략을 수립하는데
도움을 줄 수 있을 것이다. 이와 더불어, 세 가지 외부화 조건의 설명력을
높이기 위해 통계적 검증을 하였는데 한국의 중소기업이 연구개발에서의 외
부화 결정을 하는데 있어서 세 가지 조건이 모두 통계적으로 유의함을 입증
하였다. 이러한 이론과 실증 분석을 통해 본 연구에서는 글로벌 기업과 관
련된 유용한 시사점도 제시하였다.
주요어: 글로벌가치사슬, 무역, 해외직접투자, 비자본 참여방식, 내부화, 외
부화, 애플, 삼성전자, 공동연구개발