GLOBAL The Global Macro Outlook -...
74
Please refer to page 72 for important disclosures and analyst certification, or on our website www.macquarie.com/research/disclosures. GLOBAL Key forecasts, changes this month 1) Tables for real GDP growth, CPI, interest rates, currencies and commodity prices are on pages 11-13. Online access to our global macro forecasts is available on request 2) With the global industrial production growth trough now ten months ago (December 2015) and the OECD LI trough already eight months ago (February 2016), the question has become the durability of the up-cycle 3) We present 32 charts over ten pages, arguing that the cycle continues through 2017 4) Being less than halfway into the upswing, unsurprisingly, our forecasts are largely unchanged this month Analyst(s) Macquarie Capital Securities (Japan) Limited Peter Eadon-Clarke +81 3 3512 7850 [email protected] Macquarie Capital Markets Canada Ltd. David Doyle, CFA +1 416 848 3663 [email protected] Macquarie Securities (Australia) Limited James McIntyre, CFA +61 2 8232 8930 [email protected] Macquarie Capital Limited Larry Hu PhD +852 3922 3778 [email protected] Jerry Peng +852 3922 3548 [email protected] Macquarie Capital Securities India (Pvt) Ltd Tanvee Gupta Jain +91 22 6720 4355 [email protected] Macquarie Equities South Africa (Pty) Ltd Elna Moolman +27 11 583 2570 [email protected] Macquarie Capital (Europe) Limited Matthew Turner +44 20 3037 4340 [email protected] Colin Hamilton +44 20 3037 4061 [email protected] 18 October 2016 The Global Macro Outlook 2017: in 10 pages and 32 charts After a February 2016 trough, the OECD Leading Indicator has recovered for six months. Please see the data on page 2. The industrial cycle was, we believe, the principal cause of the 2014-16 deceleration in global growth, and will be the driver of the forecast 2017-18 recovery. The durability of this upswing is strengthened by: 1) the employment-led recovery underway in Europe, 2) the healing of private sector balance sheets in advanced economies, and 3) the expected second leg up in the US consumption growth story, pages 2-10. Global real GDP growth; Macquarie’s the long grinding cycle forecast Note: The Total-16 is the IMF’s 10-advanced and 6 EM economies. Forecasts are Macquarie where available, alternatively the IMF – please see Fig 170. The country weights use market exchange rates, not PPP Source: IMF, Macquarie Research, October 2016 Our 2016-18 global real GDP growth forecasts are 2.2%, 2.6% and 2.7%, respectively, a continuation of our “the long grinding cycle” of neither global lift- off nor slump. There are three core forecasts underpinning our outlook: 1) A slow and cautious trajectory of Fed Funds rate increases: Our base case has a 25bp increase in December and then 25bps every six months thereafter, eventually reaching 2% in 2019: 7 October 2016 US Economics Wages, construction & edging to full employment. 2) We believe the Chinese authorities have the willingness and ability to maintain control of the RMB. We expect the RMB to appreciate modestly in 2017: 7 September 2016 China Macro: What is missing from the Trilemma and the implications for the RMB. 3) Oil prices trade higher in 2017 and 2018, to (Brent) $61/bbl and $68/bbl, whilst commodity prices are mixed reflecting China’s housing sector softening, Fig.36. Short-term business-cycle judgements are more likely to succeed with a deep awareness of more medium- and longer-term issues. In global macroeconomics, there are a considerable number of the latter. We examine 20 of them from page 30; topical issues investigated in our Macq-ro insights reports. 2.60 2.77 2.69 2.53 2.22 2.65 2.70 2.66 2.62 0.0 1.0 2.0 3.0 4.0 5.0 2012 2013 2014 2015 2016 2017 2018 2019 2020 16-Total Average 1980-2011, 3.0% p.a The long grinding cycle, 2.5% p.a Average 1980- 2011, 3.0% p.a The long grinding cycle, 2.5% p.a (Global real GDP growth)
Transcript of GLOBAL The Global Macro Outlook -...

Please refer to page 72 for important disclosures and analyst certification, or on our website
www.macquarie.com/research/disclosures.
GLOBAL
Key forecasts, changes this month
1) Tables for real GDP growth, CPI, interest
rates, currencies and commodity prices
are on pages 11-13. Online access to our
global macro forecasts is available on
request
2) With the global industrial production
growth trough now ten months ago
(December 2015) and the OECD LI
trough already eight months ago
(February 2016), the question has
become the durability of the up-cycle
3) We present 32 charts over ten pages,
arguing that the cycle continues through
2017
4) Being less than halfway into the upswing,
unsurprisingly, our forecasts are largely
unchanged this month
Analyst(s) Macquarie Capital Securities (Japan) Limited Peter Eadon-Clarke +81 3 3512 7850 [email protected] Macquarie Capital Markets Canada Ltd. David Doyle, CFA +1 416 848 3663 [email protected] Macquarie Securities (Australia) Limited James McIntyre, CFA +61 2 8232 8930 [email protected] Macquarie Capital Limited Larry Hu PhD +852 3922 3778 [email protected] Jerry Peng +852 3922 3548 [email protected] Macquarie Capital Securities India (Pvt) Ltd Tanvee Gupta Jain +91 22 6720 4355 [email protected] Macquarie Equities South Africa (Pty) Ltd Elna Moolman +27 11 583 2570 [email protected] Macquarie Capital (Europe) Limited Matthew Turner +44 20 3037 4340 [email protected] Colin Hamilton +44 20 3037 4061 [email protected]
18 October 2016
The Global Macro Outlook 2017: in 10 pages and 32 charts After a February 2016 trough, the OECD Leading Indicator has recovered for six
months. Please see the data on page 2. The industrial cycle was, we believe, the
principal cause of the 2014-16 deceleration in global growth, and will be the
driver of the forecast 2017-18 recovery.
The durability of this upswing is strengthened by: 1) the employment-led
recovery underway in Europe, 2) the healing of private sector balance sheets in
advanced economies, and 3) the expected second leg up in the US
consumption growth story, pages 2-10.
Global real GDP growth; Macquarie’s the long grinding cycle forecast
Note: The Total-16 is the IMF’s 10-advanced and 6 EM economies. Forecasts are Macquarie where available, alternatively the IMF – please see Fig 170. The country weights use market exchange rates, not PPP
Source: IMF, Macquarie Research, October 2016
Our 2016-18 global real GDP growth forecasts are 2.2%, 2.6% and 2.7%,
respectively, a continuation of our “the long grinding cycle” of neither global lift-
off nor slump. There are three core forecasts underpinning our outlook:
1) A slow and cautious trajectory of Fed Funds rate increases: Our
base case has a 25bp increase in December and then 25bps every six
months thereafter, eventually reaching 2% in 2019: 7 October 2016 US
Economics Wages, construction & edging to full employment.
2) We believe the Chinese authorities have the willingness and ability
to maintain control of the RMB. We expect the RMB to appreciate
modestly in 2017: 7 September 2016 China Macro: What is missing
from the Trilemma and the implications for the RMB.
3) Oil prices trade higher in 2017 and 2018, to (Brent) $61/bbl and
$68/bbl, whilst commodity prices are mixed reflecting China’s housing
sector softening, Fig.36.
Short-term business-cycle judgements are more likely to succeed with a deep
awareness of more medium- and longer-term issues. In global macroeconomics,
there are a considerable number of the latter. We examine 20 of them from page
30; topical issues investigated in our Macq-ro insights reports.
2.60 2.77 2.69 2.532.22 2.65 2.70 2.66 2.62
0.0
1.0
2.0
3.0
4.0
5.0
2012 2013 2014 2015 2016 2017 2018 2019 2020
16-Total Average 1980-2011, 3.0% p.a The long grinding cycle, 2.5% p.a
Average 1980-2011, 3.0% p.a
The long grinding cycle, 2.5% p.a
(Global real GDP growth)
Macquarie Research The Global Macro Outlook
18 October 2016 2
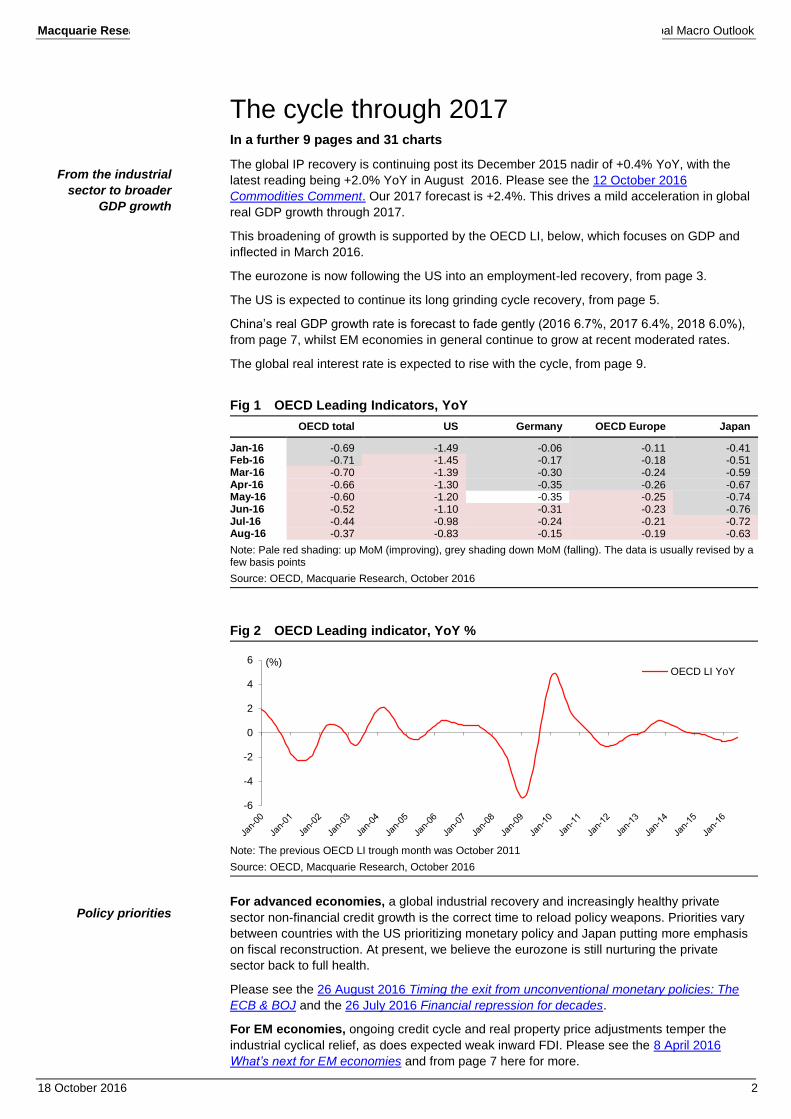
The cycle through 2017 In a further 9 pages and 31 charts
The global IP recovery is continuing post its December 2015 nadir of +0.4% YoY, with the
latest reading being +2.0% YoY in August 2016. Please see the 12 October 2016
Commodities Comment. Our 2017 forecast is +2.4%. This drives a mild acceleration in global
real GDP growth through 2017.
This broadening of growth is supported by the OECD LI, below, which focuses on GDP and
inflected in March 2016.
The eurozone is now following the US into an employment-led recovery, from page 3.
The US is expected to continue its long grinding cycle recovery, from page 5.
China’s real GDP growth rate is forecast to fade gently (2016 6.7%, 2017 6.4%, 2018 6.0%),
from page 7, whilst EM economies in general continue to grow at recent moderated rates.
The global real interest rate is expected to rise with the cycle, from page 9.
Fig 1 OECD Leading Indicators, YoY
OECD total US Germany OECD Europe Japan
Jan-16 -0.69 -1.49 -0.06 -0.11 -0.41 Feb-16 -0.71 -1.45 -0.17 -0.18 -0.51 Mar-16 -0.70 -1.39 -0.30 -0.24 -0.59 Apr-16 -0.66 -1.30 -0.35 -0.26 -0.67 May-16 -0.60 -1.20 -0.35 -0.25 -0.74 Jun-16 -0.52 -1.10 -0.31 -0.23 -0.76 Jul-16 -0.44 -0.98 -0.24 -0.21 -0.72 Aug-16 -0.37 -0.83 -0.15 -0.19 -0.63
Note: Pale red shading: up MoM (improving), grey shading down MoM (falling). The data is usually revised by a few basis points
Source: OECD, Macquarie Research, October 2016
Fig 2 OECD Leading indicator, YoY %
Note: The previous OECD LI trough month was October 2011
Source: OECD, Macquarie Research, October 2016
For advanced economies, a global industrial recovery and increasingly healthy private
sector non-financial credit growth is the correct time to reload policy weapons. Priorities vary
between countries with the US prioritizing monetary policy and Japan putting more emphasis
on fiscal reconstruction. At present, we believe the eurozone is still nurturing the private
sector back to full health.
Please see the 26 August 2016 Timing the exit from unconventional monetary policies: The
ECB & BOJ and the 26 July 2016 Financial repression for decades.
For EM economies, ongoing credit cycle and real property price adjustments temper the
industrial cyclical relief, as does expected weak inward FDI. Please see the 8 April 2016
What’s next for EM economies and from page 7 here for more.
-6
-4
-2
0
2
4
6 (%)OECD LI YoY
From the industrial
sector to broader
GDP growth
Policy priorities

Macquarie Research The Global Macro Outlook
18 October 2016 3
Advanced economies: Private sector balance sheet repair & revival
Debt is not inherently a problem. Intermediated by the financial system, it is the main way that
savers earn returns. Savers, to be sustainably paid, however, require debt to be deployed into
debt-serviceable activities. We regard private sector non-financial credit growth broadly in line
with nominal GDP growth to be healthy.
Private sector balance sheet repair and the revival of private sector non-financial credit
growth is a sign of progress, of the economy healing from its previous excesses.
The revival of private sector credit demand is a prerequisite for the successful withdrawal of
extraordinary central bank support for the economy.
In the case of Japan, the excess of credit growth over nominal GDP growth over the 1980s
“Bubble” was followed by a protracted period of balance sheet adjustment (credit growth
beneath nominal GDP growth, Fig.3). We believe Japan endured a vicious cycle of policy and
regulatory mistakes, which US policy avoided after the Global Financial Crisis, Fig.4.
Fig 3 Japan: private non-financial credit growth vs. Nominal GDP growth
Fig 4 US private sector nonfinancial credit is growing faster than GDP for the first time since 2008
Source: FRB of St Louis, Datastream, Macquarie Research, October 2016 Source: FRB of St. Louis, Macquarie Securities, October 2016
Nevertheless, even in the US, the repair process took a total of seven years. It took three
years from when private sector credit growth first collapsed (2008) until it first went positive
again (2011) and another four years until it exceeded nominal GDP growth (2015).
Fig 5 Euro Area: private nonfinancial credit growth vs. Nominal GDP growth
Fig 6 The fiscal impulse: the eurozone’s 2011-13 fiscal squeeze
Source: FRB of St Louis, Datastream, Macquarie Research, October 2016
Note: Year-over-year change in the cyclically adjusted net lending (+) or net borrowing (-) of general government, adjusted based on potential GDP, excessive deficit procedure. Forecasts for 2015-17 from the European Commission. Source: EC Annual Macroeconomic Database, Macquarie Research, October 2016
-12
-9
-6
-3
0
3
6
1992 1993 1995 1997 1999 2001 2003 2005 2007 2009 2011 2013 2015
(YoY % change)
Private nonfinancial credit
Nominal GDP
late
-4
-2
0
2
4
6
8
10
12(YoY% change) Private nonfinancial credit
Nominal GDP
latest
-6
-4
-2
0
2
4
6
8
10
12
14(YoY % change) Private nonfinancial credit
Nominal GDP
-2
-1
0
1
2
2007 2008 2009 2010 2011 2012 2013 2014 2015 2016 2017
(% of potential GDP)
YoY change in cyclically adjusted budget balance
The case of Japan
The US

Macquarie Research The Global Macro Outlook
18 October 2016 4
The eurozone is behind the US because of the 2011-13 fiscal squeeze, Fig 6, and a second
credit crunch in 2011-13, Fig 7, such that private sector credit growth double-dipped and has
only gone positive again in 2015, four years behind the US (2015 versus 2011), Fig 5.
Nonetheless, a recovery is underway, led by strengthening employment. As employment
increases, Fig 8, households become more confident to borrow, Fig 9 and Fig 10. Auto sales
are also recovering across Europe, Fig 11 and Fig 12.
Fig 7 Euro-zone: Tight lending conditions 2007-09 and 2011-13
Fig 8 Eurozone employment growth, YoY, %, 2002 to latest: +1.5% YoY
Note: Net percentage is used. The net percentage is defined as the difference between the sum of the percentages for “tightened considerably” and “tightened somewhat”, and the sum of the percentages for “eased somewhat” and “eased considerably”. Positive numbers imply tight lending conditions.
Source: left-hand chart: ECB, Macquarie Research, October 2016, right-hand chart: Eurostat, Macquarie Research, October 2016
Fig 9 Euro area consumer credit outstanding, YoY, %, 2005 to latest
Fig 10 Germany, France and Spain: consumer credit outstanding, YoY, %, 2005 to latest
Note: the latest value is 605.4 billion Euro. Source: ECB, Macquarie Research, October 2016
Source: ECB, Macquarie Research, October 2016
Fig 11 European new vehicle registrations, YoY, % Fig 12 European car sales, units, SA
Source: National car data, Macquarie Research, October 2016 Source: ECB, Macquarie Research, October 2016
-40
-20
0
20
40
60
80
2003 2004 2005 2006 2007 2008 2009 2010 2011 2012 2013 2014 2015 2016
(%)Changes in credit standards applied to enterprises over the past three months
-2.5
-2.0
-1.5
-1.0
-0.5
0.0
0.5
1.0
1.5
2.0
2.5
2002 2003 2004 2005 2006 2007 2008 2009 2010 2011 2012 2013 2014 2015 2016
(%, YoY)Eurozone unemployment growth
-6
-4
-2
0
2
4
6
8
10
2005 2006 2007 2008 2009 2010 2011 2012 2013 2014 2015 2016
(%, YoY)Loans to households consumer credit
-20
-15
-10
-5
0
5
10
15
20
25
30
2005 2006 2007 2008 2009 2010 2011 2012 2013 2014 2015 2016
(%, YoY)Germany - Loans to households consumer credit
France - Loans to households consumer credit
Spain- Loans to households consumer credit
(20%)
(15%)
(10%)
(5%)
0%
5%
10%
15%
2010 2011 2012 2013 2014 2015 2016
YoY change12m moving average
800,000
850,000
900,000
950,000
1,000,000
1,050,000
1,100,000
1,150,000
1,200,000
1,250,000
Jan-12 Jan-13 Jan-14 Jan-15 Jan-16
The eurozone

Macquarie Research The Global Macro Outlook
18 October 2016 5
Whilst the eurozone is now following the US into an employment-led recovery, the US is
expected to continue its long grinding cycle recovery.
The energy-capex collapse induced growth slowdown in the US over 2015 and the 1H 2016
is over. After a forecast 1.5% real GDP growth this year, we are forecasting 2.4% pa real
GDP growth for both 2017 and 2018. Sometimes it is valuable to look backwards, to increase
one’s confidence in the future.
Fig 13 Energy-capex (red), Residential investment (green) and non-energy, non-resi. (blue) 2010=1.0
Fig 14 Energy & mining related investment as a share of non-residential investment, %
Source: BEA, Macquarie Research, October 2016 Source: BEA, Macquarie Research, October 2016
Fig 15 Average hourly earnings, YoY, %, oil states (blue), non-oil states (red), 3/2008 to latest
Fig 16 Civilian non-institutional population 25-54 year olds (12-month ma), 2002 to 2025E
Source: BLS, Macquarie Research, October 2016 Source: BLS, Census Bureau, Macquarie Research, October 2016
Fig 17 US residential investment share in GDP (%) Fig 18 US construction employment, % of total
Source: BEA, BLS, Macquarie Research, October 2016 Source: BEA, BLS, Macquarie Research, October 2016
0.3
0.5
0.7
0.9
1.1
1.3
1.5
1.7
1.9
2.1
2.3
1Q10 1Q11 1Q12 1Q13 1Q14 1Q15 1Q16 1Q17
Private investment (nominal $) (1Q 2010=1.00)
1Q10 = 1.00energy & mining
investment
non-residential investment ex-energy & mining investment
residentialinvestment
0%
2%
4%
6%
8%
10%
12%
14%
1959 1964 1969 1974 1979 1984 1989 1994 1999 2004 2009 2014
Energy & mining related investment as a share of non-residential investment
Average
+1STDEV
-1STDEV
0.0%
0.5%
1.0%
1.5%
2.0%
2.5%
3.0%
3.5%
4.0%
4.5%
Mar-08 Mar-09 Mar-10 Mar-11 Mar-12 Mar-13 Mar-14 Mar-15 Mar-16
Average hourly earnings YoY% change (3moMA)
current = 2.9%
non-oil
states
oil states
121,000,000
122,000,000
123,000,000
124,000,000
125,000,000
126,000,000
127,000,000
128,000,000
129,000,000
130,000,000
2002 2004 2006 2008 2010 2012 2014 2016 2018 2020 2022 2024
Civilian noninstitutional population25-54 years (12moMA)
Note: Projections in 25-54 population from BLS
2.0%
2.5%
3.0%
3.5%
4.0%
4.5%
5.0%
5.5%
6.0%
6.5%
7.0%
1970 1975 1980 1985 1990 1995 2000 2005 2010 2015
US residential investment share of GDP
+1 STDEV
Average
-1 STDEV
2005-6
1987
1973 1978
1999
Recession risks elevated when housing's importance is high
Expansions are likely when housing's importance is low and rising
4.0%
4.2%
4.4%
4.6%
4.8%
5.0%
5.2%
5.4%
5.6%
5.8%
1970 1975 1980 1985 1990 1995 2000 2005 2010 2015
2006
2000
1990
1979
1973
US construction employment as share of total employment
+1 STDEV
Avg
-1 STDEV
The US energy-
capex collapse
Macquarie Research The Global Macro Outlook
18 October 2016 6
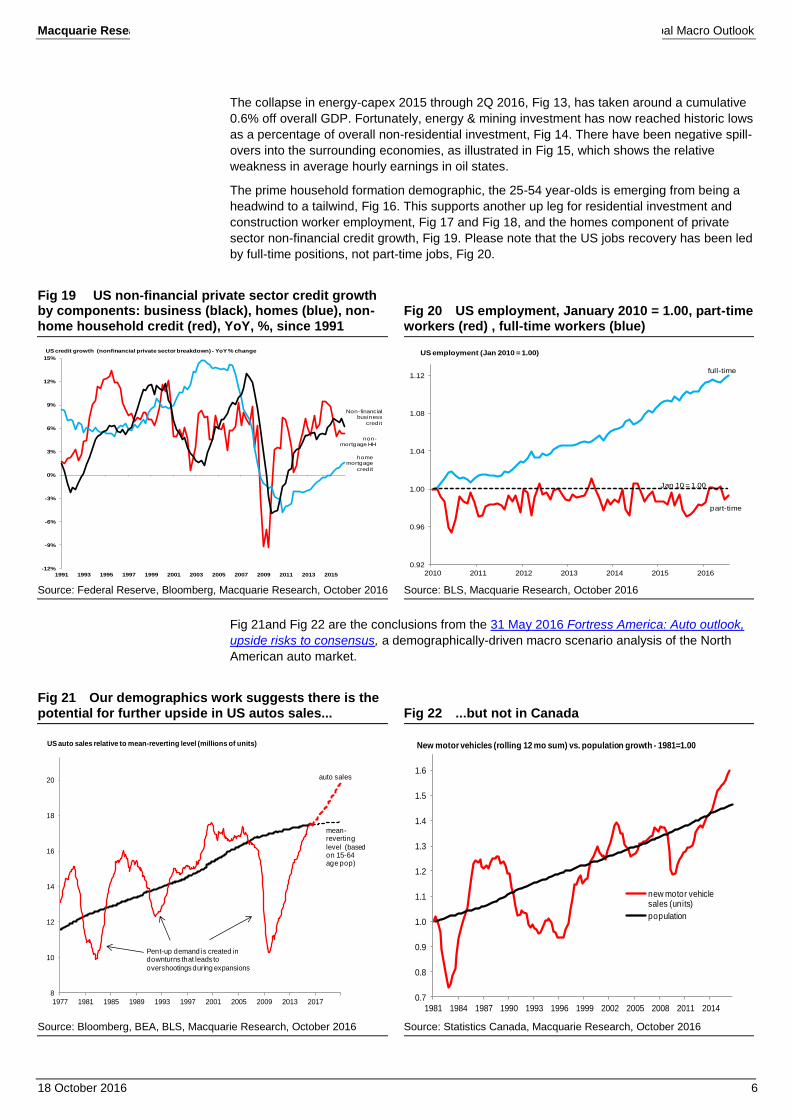
The collapse in energy-capex 2015 through 2Q 2016, Fig 13, has taken around a cumulative
0.6% off overall GDP. Fortunately, energy & mining investment has now reached historic lows
as a percentage of overall non-residential investment, Fig 14. There have been negative spill-
overs into the surrounding economies, as illustrated in Fig 15, which shows the relative
weakness in average hourly earnings in oil states.
The prime household formation demographic, the 25-54 year-olds is emerging from being a
headwind to a tailwind, Fig 16. This supports another up leg for residential investment and
construction worker employment, Fig 17 and Fig 18, and the homes component of private
sector non-financial credit growth, Fig 19. Please note that the US jobs recovery has been led
by full-time positions, not part-time jobs, Fig 20.
Fig 19 US non-financial private sector credit growth by components: business (black), homes (blue), non-home household credit (red), YoY, %, since 1991
Fig 20 US employment, January 2010 = 1.00, part-time workers (red) , full-time workers (blue)
Source: Federal Reserve, Bloomberg, Macquarie Research, October 2016 Source: BLS, Macquarie Research, October 2016
Fig 21and Fig 22 are the conclusions from the 31 May 2016 Fortress America: Auto outlook,
upside risks to consensus, a demographically-driven macro scenario analysis of the North
American auto market.
Fig 21 Our demographics work suggests there is the potential for further upside in US autos sales... Fig 22 ...but not in Canada
Source: Bloomberg, BEA, BLS, Macquarie Research, October 2016 Source: Statistics Canada, Macquarie Research, October 2016
-12%
-9%
-6%
-3%
0%
3%
6%
9%
12%
15%
1991 1993 1995 1997 1999 2001 2003 2005 2007 2009 2011 2013 2015
non-mortgage HH
home mortgage
credit
US credit growth (nonfinancial private sector breakdown) - YoY % change
Non-financialbusiness
credit
0.92
0.96
1.00
1.04
1.08
1.12
2010 2011 2012 2013 2014 2015 2016
US employment (Jan 2010 = 1.00)
Jan 10 = 1.00
part-time
full-time
8
10
12
14
16
18
20
22
1977 1981 1985 1989 1993 1997 2001 2005 2009 2013 2017
US auto sales relative to mean-reverting level (millions of units)
auto sales
mean-reverting
level (based on 15-64 age pop)
Pent-up demand is created in downturns that leads to
overshootings during expansions
0.7
0.8
0.9
1.0
1.1
1.2
1.3
1.4
1.5
1.6
1.7
1981 1984 1987 1990 1993 1996 1999 2002 2005 2008 2011 2014
new motor vehicle sales (units)
population
New motor vehicles (rolling 12 mo sum) vs. population growth - 1981=1.00

Macquarie Research The Global Macro Outlook
18 October 2016 7
China, EM more generally and global trade growth
With the advanced economies doing a little better, global growth is able to accommodate the
ongoing gentle fade in China’s growth.
Rather than a hard stop of the investment-driven, credit-driven growth models of Malaysia,
Thailand, Indonesia and Korea as occurred in 1997, below, as marginal capital providers
(cross-border bank lending) withdrew, we expect the Chinese-case marginal capital providers
(households depositing into the Chinese banking system) to persist.
Fig 23 Gross fixed capital formation, % of GDP
Note: Investment is private investment and includes residential investment. The last two data points are IMF forecasts
Source: BIS, Macquarie Securities, October 2016
Whilst China’s ratio of investment (including residential investment) to GDP is declining
(Fig.24) as the rate of growth of investment slows (Fig 25), it still has a lot further to decline to
meet international norms.
Fig 24 China’s investment, % of GDP Fig 25 China’s investment (US$ tr)
Source: IMF WEO database, Macquarie Research, October 2016 Source: IMF WEO database, Macquarie Research, October 2016
China’s real GDP growth continues to fade as the relative productivity of marginal investment
deteriorates.
We are forecasting Chinese real GDP growth to be 6.4% in 2017 and 6.0% in 2018 after
6.7% this year.
For emerging market economies more generally, growth has been fading since 2012 as the
economies looks for a new growth engine, and unwinds the credit excesses of the past.
Fig 26 shows the ratio of private non-financial credit to GDP and its growth over the last five
years.
10
20
30
40
50
1970
1972
1974
1976
1978
1980
1982
1984
1986
1988
1990
1992
1994
1996
1998
2000
2002
2004
2006
2008
2010
2012
2014
(% of GDP) Malaysia Thailand Indonesia Korea
25
30
35
40
45
50
1980
1982
1984
1986
1988
1990
1992
1994
1996
1998
2000
2002
2004
2006
2008
2010
2012
2014
2016
(%GDP) China's investment, % of GDP
0.0
1.0
2.0
3.0
4.0
5.0
6.0
1980
1982
1984
1986
1988
1990
1992
1994
1996
1998
2000
2002
2004
2006
2008
2010
2012
2014
2016
(US$tr) China's investment
The ongoing gentle
fade in China’s
growth
Emerging market
economies more
generally

Macquarie Research The Global Macro Outlook
18 October 2016 8
Whilst the ratio to GDP generally increases with economic development and financial
deepening, relative to other EM economies shown below, some countries appear elevated,
implying a need to go through a period of private debt adjustment.
Fig 26 Private non-financial credit, level and growth, for leading EM economies
Note: The BIS does not have data for the Philippines
Source: BIS, Macquarie Research, October 2016
A particular challenge for non-China EM is our belief that China began a serious import
substitution phase in 2015 and this will continue for as long as the old growth model
persists, and SOE’s invest with a perceived near zero cost of capital.
The 1980-2008 6% pa global world trade volume growth average has stepped down, in our
opinion, to a new trend growth rate of 2-3% pa, Fig 27.
Fig 27 World Merchandise Trade, from 1992 to latest, rolling 3 months, YoY
Note: as a consistency check, we are looking for real GDP growth to accelerate 50bp, 2018 versus 2016 (chart front cover), and if advanced economies are the source of this (with global GDP 60:40 advanced economies: EM on market exchange rates) it implies advanced economies will accelerate by 80bp (80bp times 0.6 equals 48bp, approximately equal to 50bp). If the OECD LI needs to rise 80bp from its low of -71bp in February 2016, then it is only going to go marginally positive in this cycle, at +10bp or so. Given the relationship in the above chart, the reacceleration in world trade could be very modest
Source: CPB, Macquarie Research, October 2016
This reflects:
1) The maturing of a 50-year containerization trend
2) The completion of the integration of China into global supply chains post its
December 2001 WTO entry
3) The move by MNCs to regionalize production to dampen exchange rate risk
4) The transition of China’s investment and credit-driven growth model into an import
substitution stage for intermediate and capital goods, especially by those companies
that perceive their cost of capital to be very low
Brazil
Mexico
Russia
Turkey
India
China
Indonesia
Malaysia
Singapore
Thailand
0
10
20
30
40
50
60
0 50 100 150 200 250
2015 3Q vs 2010 3Q
Private debt as % of GDP
Change in five years (%)
-6
-4
-2
0
2
4
6
-23
-13
-3
7
17
1992 1993 1994 1995 1996 1997 1998 1999 2000 2001 2002 2003 2004 2005 2006 2007 2008 2009 2010 2011 2012 2013 2014 2015 2016
World Merchandise Trade, YoY [LHS] OECD LI, YoY [RHS]
(%) (%)

Macquarie Research The Global Macro Outlook
18 October 2016 9
The late 2014/early 2015 air pocket in emerging market economies’ import growth, along with
the trend decline in its growth rate, is shown in Fig 28, red line, which uses rolling three-
month average YoY data.
These headwinds will persist even as the OECD LI recovers to a positive YoY level.
Fig 28 EM & Advanced economies import volumes
Source: CPB, Macquarie Research, October 2016
One consequence of the above is the muted response relative to history of the trade account
to exchange rate movements. This probably results in greater currency volatility. In the case
of EM currency depreciations, the consequence is likely to be more import volume
compression than export volume expansion.
The long, grinding cycle and low real interest rates
The principal driver of record low bond yields has evolved from cyclical factors (secular
stagnation), through a private sector balance sheet recession (completed in the US and
Japan, progressing, but ongoing in the eurozone) to fiscal reconstruction (reloading the fiscal
policy tool weapon) using the tool of financial repression.
The political consequences of ‘the long grinding cycle’ have been intensifying. Entitlement
program promises are under pressure. Politicians are not only looking to boost global growth,
somehow, but also to ensure low funding costs persist for as long as possible.
Fig 29 10-year real bond yields, G7 ex Italy, 1985-2013, quarterly, %
Note: National Bureau of Economic research (NBER) working paper “Measuring the world interest rate” by Mervyn King & David Low (2014) The US enters the sample in 1999 with the first TIPS issue.
Source: NBER above, Macquarie Research, October 2016
The 26 July 2016 Macq-ro insights: Financial repression for decades examined these issues,
and concluded that the 10-year US TIP yield was a reasonable proxy to monitor, Fig.30.
Please note how it (the red line) has trended down from ~2% in 2003 to ~10bps recently.
-5
0
5
10
15
20
25
2010 2011 2012 2013 2014 2015 2016
Advanced EM
(per 12 month % change)
LAST 3 MONTHS ON YEAR AGO
-1
0
1
2
3
4
5
6
1985 1987 1989 1991 1993 1995 1997 1999 2001 2003 2005 2007 2009 2011 2013
(%) Weighted real rate Unweighted real rate
Financial repression
for decades

Macquarie Research The Global Macro Outlook
18 October 2016 10
The 10-year TIPS yield was lowest during the most aggressive phase of US monetary easing
in 2012 (QE3), increased sharply with the May 2013 ‘Taper Tantrum’, and has drifted lower
since the Fed began to slowly and cautiously withdraw its extraordinary monetary easing.
Fig 30 US TIPs yields, %
Source: US Department of the Treasury, FED, Macquarie Research, October 2016
The cycle and the trend: Integrated global capital markets imply that we should expect a
mild recovery in global real GDP growth over 2017-18 to lead to a mild increase in the global
real interest rate (50bp or so). In addition to the global real interest rate, nominal bond yields
have an additional element relating to inflationary expectations. Fig.31 illustrates this for the
US 10-year bond. Our forecasts for US inflation suggest that the inflation compensation
element will increase going forward; leading to an overall increase in nominal US bond yields.
Nonetheless, real interest rates are expected to remain well beneath our 2.5% pa global real
GDP growth forecast.
Fig 31 We anticipate the inflation compensation element to drive an increase in the 10-year Treasury yield
Note: Over time US 10-year bond yields are expected to have a global real interest rate component of around 0.5%, and an inflation compensation component of around 2%.
Source: Bloomberg, Macquarie Research, October 2016
For advanced economies, a global industrial recovery and increasingly healthy private sector
non-financial credit growth is the correct time to reload policy weapons. Priorities vary
between countries with the US prioritizing monetary policy and Japan putting more emphasis
on fiscal reconstruction. The eurozone continues to focus on nurturing the private sector back
to robust health, in our opinion.
-2
-1
0
1
2
3
4
5
2003 2004 2005 2006 2007 2008 2009 2010 2011 2012 2013 2014 2015 2016
(yield, %)Treasury inflation protected securities - 5 yearTreasury inflation protected securities - 7 yearTreasury inflation protected securities - 10 yearTreasury inflation protected securities - 20 yearTreasury inflation protected securities - long term
-1.5
-1.0
-0.5
0.0
0.5
1.0
1.5
2.0
2.5
3.0
3.5
2005 2006 2007 2008 2009 2010 2011 2012 2013 2014 2015 2016
real yield
inflation compensation
2005-14 infl. comp avg
10 year Treasury yield components
forecast
forecast
Real interest rates
are expected to
remain well beneath
our 2.5% pa global
real GDP growth
forecast

Macquarie Research The Global Macro Outlook
18 October 2016 11
Forecasts and revisions Fig.32 & Fig.33 present our principal real GDP forecasts and revisions.
Revisions over the last month have been minor. Over the last four months:
1) UK real GDP growth forecasts are: 2016 2.0% (versus 1.9%), 2017 1.2% (2.3%).
2) Eurozone real GDP growth forecasts are: 2016 1.6% (1.8%), 2017 1.4% (1.7%)
For 2017, we are beneath consensus on Canada, Australia and Japan.
We are above-consensus in our 2017 forecasts for the US and most of Asia.
Fig 32 Macquarie’s real GDP forecasts
Calendar Year YoY (%) 4Q on 4Q (%) 2014 2015 2016 2017 2018 2014 2015 2016 2017 2018
US 2.4 2.6 1.6 2.4 2.1 2.5 1.9 2.0 2.3 2.0 Eurozone 0.9 1.9 1.6 1.4 1.6 1.0 1.9 1.5 1.6 1.6 Japan -0.1 0.6 0.4 0.6 0.7 -0.9 0.8 0.4 0.6 0.7 UK 2.9 2.2 2.0 1.2 1.2 2.9 2.2 2.0 1.2 1.2 Canada 2.5 1.1 1.2 1.8 1.6 2.4 0.3 1.6 1.7 1.5 Australia 2.6 2.4 2.8 2.3 3.2 2.2 2.8 2.3 2.7 3.5 New Zealand 3.7 2.5 3.4 3.3 2.4 4.1 2.3 3.5 3.0 2.2
China 7.2 6.8 6.7 6.4 6.0 7.2 6.8 6.7 6.4 6.0 S. Korea 3.3 2.6 2.9 2.9 2.7 2.7 3.1 2.7 2.8 2.7 Taiwan 3.9 0.6 1.3 2.0 2.3 3.4 -0.9 2.3 2.0 2.3 Hong Kong 2.6 2.4 1.2 1.5 2.0 2.5 1.9 1.2 1.5 2.0 Indonesia 5.0 4.8 4.9 5.0 5.2 5.0 5.0 4.5 5.0 5.2 Malaysia 6.0 5.0 4.3 4.7 5.1 5.7 4.5 5.0 4.7 5.1 Singapore 3.3 2.0 1.9 2.1 2.4 2.9 1.7 1.9 2.1 2.4 Philippines 6.2 5.9 6.2 6.1 6.3 6.6 6.6 5.6 6.1 6.3 Thailand 0.8 2.8 3.2 3.3 3.5 2.1 2.8 3.0 3.3 3.5 India 6.7 7.2 7.6 7.8 7.7 6.6 7.2 7.9 7.8 7.5
South Africa 1.5 1.2 0.4 0.9 1.7 1.3 0.0 0.7 0.9 1.3
Source: Macquarie Research, October 2016
Fig 33 Macquarie’s real GDP forecasts: revisions, and versus consensus
2016 YoY (%) 2017 YoY (%) Previous
Macquarie forecast (*)
Current Macquarie
Forecast Consensus Spread (2) versus (3)
Previous Macquarie forecast (*)
Current Macquarie
Forecast Consensus Spread (6) versus (7)
(1) (2) (3) (4) (5) (6) (7) (8)
US (**) 1.9 2.0 1.9 0.1 2.3 2.3 2.1 0.2 Eurozone 1.6 1.6 1.5 0.1 1.4 1.4 1.3 0.1 Japan 0.4 0.4 0.6 -0.2 0.6 0.6 0.8 -0.2 UK 1.9 2.0 1.7 0.3 1.1 1.2 0.7 0.5 Canada (**) 1.6 1.6 1.5 0.1 1.7 1.7 2.0 -0.3 Australia 3.0 2.8 2.9 -0.1 2.3 2.3 2.8 -0.5 New Zealand 3.2 3.4 3.0 0.4 3.3 3.3 2.8 0.5
China 6.7 6.7 6.6 0.1 6.4 6.4 6.3 0.1 S. Korea 2.9 2.9 2.6 0.3 2.9 2.9 2.6 0.3 Taiwan 1.3 1.3 1.0 0.3 2.4 2.0 1.7 0.3 Hong Kong 2.0 1.2 1.2 0.0 2.6 1.5 1.5 0.0 Indonesia 4.9 4.9 5.0 -0.1 5.0 5.0 5.3 -0.3 Malaysia 4.3 4.3 4.1 0.2 4.7 4.7 4.3 0.4 Singapore 1.9 1.9 1.7 0.2 2.1 2.1 1.8 0.3 Philippines 6.2 6.2 6.4 -0.2 6.1 6.1 6.1 0.0 Thailand 3.2 3.2 3.1 0.1 3.3 3.3 3.2 0.1 India (***) 7.6 7.6 7.6 0.0 7.6 7.6 7.7 -0.1
South Africa 0.3 0.4 0.4 0.0 0.9 0.9 1.3 -0.4
Note: (*) August 2016. Calendar year numbers for all countries bar the US and Canada, marked with a (**) which are 4Q on 4Q, and India, marked with a (***) which is fiscal year (to FY3/17 and FY3/18) and is based on the new series, growth measured on a GVA basis. Consensus numbers for calendar year countries are from Consensus Economics, otherwise the numbers are from Bloomberg.
Source: Consensus Economics, Bloomberg, Macquarie Research, October 2016
For 2017, we are
beneath consensus
on Canada,
Australia and Japan
We are above
consensus in our
2017 forecasts for
the US and most of
Asia

Macquarie Research The Global Macro Outlook
18 October 2016 12
In line with the continuation of moderate real and nominal global real GDP growth, The Long
Grinding Cycle, our interest rate forecasts are commensurately subdued. Please note that we
are forecasting the US 10-year bond yield to have a cycle high in 2018 of only 2.70%.
Fig 34 Macquarie’s interest rate forecasts
Year end Policy or cash rate (*) (%) 10-year bond yield (%) 2014 2015 2016 2017 2018 2014 2015 2016 2017 2018
US 0.00 0.25 0.50 1.00 1.50 2.17 2.27 1.90 2.30 2.70 Eurozone 0.05 0.05 0.00 0.00 0.00 0.54 0.63 0.50 1.00 1.50 Japan 0.07 0.04 0.00 0.00 0.00 0.33 0.27 -0.10 -0.10 0.20 UK 0.50 0.50 0.25 0.25 0.50 1.79 1.96 1.20 1.20 1.75 Canada 1.00 0.50 0.50 0.50 0.75 1.79 1.39 1.25 1.40 1.50 Australia 2.50 2.00 1.50 1.00 1.00 2.81 2.88 1.75 1.90 2.10 New Zealand 3.50 2.50 1.75 1.25 1.75 3.67 3.58 2.40 2.60 2.70
China 5.60 4.35 4.10 4.10 4.10 S. Korea 2.00 1.50 1.25 1.50 1.75 Taiwan 1.88 1.63 1.50 2.00 2.50 Indonesia 7.75 7.50 6.50 6.50 6.50 Malaysia 3.25 3.25 2.75 2.50 2.50 Singapore 0.50 0.88 1.50 1.80 2.00 Philippines 4.00 4.00 2.75 2.50 2.50 Thailand 2.00 1.50 1.50 1.75 2.25 India 8.00 6.75 6.25 6.00 6.00
South Africa 5.75 6.25 7.00 7.00 7.00
Note: (*) Policy or cash rate, US: Fed Funds rate, Eurozone: EMU Refi Rate, Japan: overnight call rate, UK: Repo rate, Canada: Cash rate, Australia: Cash rate, New Zealand: Official cash rate, China: 1-year working capital, South Korea: Overnight call rate, Taiwan: Official discount rate; HK: discount window base; Indonesia: 1-month SBI rate, Malaysia: Overnight policy rate, Singapore: 3-month interbank rate, Philippines: Reverse repo rate, Thailand: 14-day repo rate, India: Repo rate, South Africa: Repo rate
Source: Macquarie Research, October 2016
We are forecasting calendar year 2016 CPI of 1.3% YoY in the US, 0.4% YoY in the Euro-
zone, and 2.0% YoY in China: so moderate inflation, not deflation. In 2017, the US and
eurozone inflation forecasts are 2.5% and 1.6% respectively.
After a period of broad US$ strength in 2015, we believe individual currencies will at different
times pass their lows versus the US$. Whilst relative monetary policy stances will remain
important, resulting capital flows now have to exceed mounting current account surpluses in
Japan and the Eurozone (partially reflecting the falls in oil and other resource prices). On our
forecasts, the Yen passes its weakest point first (4Q 2015), and then the Euro (1Q 2017).
Fig 35 Macquarie’s CPI and currency forecasts
Year end CPI (%, YoY) Currency versus US$ (Year-end) 2014 2015 2016 2017 2018 2014 2015 2016 2017 2018
US 1.6 0.1 1.3 2.5 2.4 Eurozone 0.4 0.0 0.4 1.6 1.5 1.21 1.09 1.08 1.11 1.12 Japan 2.7 0.8 -0.1 0.3 0.5 119.8 120.41 105.00 101.00 97.00 UK 1.5 0.0 0.7 2.3 2.5 1.56 1.47 1.27 1.35 1.40 Canada 1.9 1.1 1.5 1.8 2.0 1.16 1.39 1.36 1.45 1.45 Australia 2.5 1.5 1.2 1.9 1.8 0.82 0.73 0.76 0.72 0.73 New Zealand 1.2 0.3 0.5 1.1 1.6 0.78 0.68 0.72 0.68 0.67
China 1.5 1.5 2.0 2.0 2.5 6.20 6.49 6.60 6.40 6.20 S. Korea 1.3 0.7 1.1 1.9 2.0 1099 1173 1130 1150 1130 Taiwan 1.2 -0.3 1.3 1.4 1.5 31.60 32.85 33.40 34.00 35.00 Hong Kong 4.4 3.0 2.5 2.0 2.2 7.75 7.75 7.80 7.80 7.80 Indonesia 6.4 6.4 4.1 4.9 5.0 12440 13795 13500 13700 13500 Malaysia 3.1 2.1 2.7 2.8 2.6 3.50 4.29 4.20 4.15 4.10 Singapore 1.0 -0.5 -0.3 1.0 1.4 1.31 1.42 1.37 1.35 1.33 Philippines 4.2 1.4 1.6 2.8 3.3 44.73 47.06 46.50 46.00 45.50 Thailand 1.9 -0.9 0.3 1.7 2.2 32.92 36.04 35.50 36.20 36.00 India 6.7 4.9 5.2 5.0 5.0 62.71 66.50 68.20 69.69 70.57
South Africa 6.1 4.6 6.5 5.5 5.5 11.57 15.50 14.50 14.50 14.00
Note: The currency forecasts are presented in the most common format. Normally, this is per US$, but exceptions where it is US$ per other currency include: the Euro, Sterling, Australia and NZ dollars
Source: Macquarie Research, October 2016
We forecast the US
10-year bond yield
to have a cycle high
in 2018 of only
2.70%
We are not
forecasting deflation
After a period of
broad US$ strength
in 2015, we believe
individual
currencies will at
different times reach
their lows versus
the US$
Whilst relative
monetary policy
stances will remain
important, resulting
capital flows now
have to exceed
mounting current
account surpluses
in Japan and the
Eurozone
On our forecasts the
Yen passes its
weakest point first,
(4Q 2015) and then
the Euro (1Q 2017)

Macquarie Research The Global Macro Outlook
18 October 2016 13
The latest Macquarie commodity team commodity price forecasts are below. Commentary
follows the table. The next page looks at oil, with comments on other commodities on the
subsequent pages.
Fig 36 Macquarie’s commodity price forecasts
2015 2016 2016 2016 2017 2017 2017 2018 2019 2020 2021
Unit CY CY Q3 Q4 Q1 Q2 CY CY CY CY CY LT $2016
Base Metals Copper $/tonne 5,503 4,693 4,772 4,600 4,500 4,650 4,563 4,413 4,650 5,188 6,100 5,900 Aluminium $/tonne 1,663 1,547 1,620 1,480 1,450 1,450 1,438 1,425 1,413 1,413 1,450 1,350 Zinc $/tonne 1,932 2,038 2,255 2,300 2,200 2,400 2,425 2,700 2,825 2,663 2,380 2,300 Nickel $/tonne 11,836 9,522 10,265 10,500 11,000 11,500 11,625 13,000 14,000 15,000 16,000 15,000 Lead $/tonne 1,786 1,819 1,873 1,940 1,910 1,960 2,003 2,190 2,085 1,945 1,928 1,950 Tin $/tonne 16,077 17,141 18,624 17,500 17,500 17,500 17,500 18,000 18,500 19,000 19,500 18,000 Steel and Raw Materials Iron ore - 62% Fe $/t CFR 56 53 59 50 52 52 50 47 50 60 60 60 Hard coking coal $/t FOB 102 107 93 170 140 115 121 115 120 125 125 105 Steel - World Export HRC
$/tonne 370 363 372 380 370 370 370 350 335 345 345 380
Energy Crude Oil - Brent $/barrel 52 44 45 52 56 62 61 68 73 75 77 68 Crude Oil - WTI $/barrel 49 43 44 49 51 57 56 62 67 69 71 63 Henry Hub Gas $/MMBTU 2.6 2.5 2.9 2.9 3.2 3.0 3.2 3.3 3.3 3.2 3.2 2.9 Thermal coal - Aus Spot $/t FOB 59 58 67 63 60 58 58 55 53 50 50 48 Uranium $/lb 37 28 26 27 29 29 29 31 34 37 40 43 Lithium carbonate $/t CFR
China 5,190 7,547 8,300 8,275 8,300 8,300 8,250 7,500 7,000 6,750 6,750 6,000
Precious Metals Gold $/oz 1,160 1,262 1,335 1,275 1,325 1,375 1,381 1,375 1,406 1,438 1,388 1,250 Silver $/oz 16 17 20 18 19 20 20 21 22 23 23 18 Platinum $/oz 1,053 1,000 1,085 1,000 1,025 1,050 1,094 1,219 1,331 1,363 1,325 1,400 Palladium $/oz 692 604 675 650 625 625 644 775 781 763 738 800 Agriculture MacPI 1997-
2000=100 149 148 145 152 153 154 155
Potash $/t FOB 303 247 220 225 225 220 221 230 240 250 250 280 Urea $/t FOB 273 195 184 190 220 200 203 200 200 210 215 240 Ammonia $/t FOB 385 231 204 185 215 225 223 230 230 230 245 250 Natural Rubber USc/kg 137 126 117 118 118 120 118 120 123 126 129 115 Others Alumina $/t FOB 301 236 234 235 250 250 248 240 223 223 230 225 Manganese ore $/mtu CIF 2.9 3.5 4.0 3.5 3.0 3.0 3.0 3.3 3.3 3.5 3.8 2.8 Ferrochrome (EU contract)
c/lb 107 96 98 110 100 105 103 100 105 110 110 105
Source: Macquarie Research, October 2016
Whilst the US Federal Reserve and their policies are regarded as the fulcrum of global capital
markets, the commodity complex provides a useful spyglass on global developments.
Based on a simple up/down ratio, 2016 is expected to be another challenging year of trying to
align supply with sluggish demand growth, Fig.37.
Fig 37 Macquarie commodity price forecasts, YoY simple up/down ratio
2015 2016 2017 2018 2019 2020 2021
YoY, number of forecasts up 2 8 16 15 16 17 12 YoY, number of forecasts down 23 19 10 11 6 6 5 YoY, number of forecasts unchanged 0 3 1 0 4 3 9
Note: The two commodity price rises in 2015 were uranium and potash
Source: Macquarie Research, October 2016

Macquarie Research The Global Macro Outlook
18 October 2016 14
Oil The oil supply and demand modelling undertaken by Vikas Dwivedi indicates that beyond short-term disruptions, crude remains on a path to structural rebalance.
Vikas continues to believe that the market will reach a more sustainable balance marked by
seasonally normal draws in 4Q16, driven by further U.S. onshore declines and continued
demand growth.
Fig 38 Oil demand remains highly correlated to global growth
Source: World Bank, BP Statistical, Macquarie Research, October 2016
Vikas’ crude price forecasts remains unchanged; believing that the price levels forecast at the
start of the year continue to remain appropriate given the global crude fundamental backdrop.
Vikas expects Brent prices to average $45/bbl in 2016, and WTI to average $42/bbl.
Beyond the current year, he expects Brent to average $61/bbl in 2017 and $68/bbl in 2018,
and for WTI to average $56/bbl and $62/bbl, respectively.
Fig 39 Annual Brent & WTI forecast
Source: Macquarie Research, Annual Price Forecasts, October 2016
Fig 40 Quarterly Brent and WTI forecast
Source: Macquarie Research, Bloomberg, October 2016
For more detail behind the above, please see 22 June 2016 Through the looking glass: stage
set for global crude rebalance and 30 September 2016 OPEC’s fuzzy agreement.
2016 2017 2018
Base Case $45 $61 $68
WTI Base Case $42 $56 $62
WTI - Brent ($3) ($5) ($6)
$68
($6)
Normalized Price
$74
3Q16E 4Q16E 1Q17E 2Q17E 3Q17E 4Q17E 1Q18E 2Q18E 3Q18E 4Q18E
Brent forecast $47 $52 $56 $62 $65 $62 $65 $67 $70 $69
WTI - Brent ($3) ($3) ($5) ($5) ($5) ($5) ($6) ($6) ($6) ($6)
WTI $45 $49 $51 $57 $60 $57 $59 $61 $64 $63
Consensus $46 $49 $51 $54 $56 $59 $61 $62 $62 $63
Forward Curve $51 $52 $52 $53 $53 $54 $54 $55 $55 $55
Brent vs. Cons $1 $3 $5 $9 $10 $3 $4 $5 $8 $6
Brent vs. Fwds ($4) $0 $4 $9 $12 $8 $11 $12 $15 $14
We expect Brent to
average $61/bbl in
2017 and $68/bbl
in 2018
Vikas continues to
believe that the
market will reach a
more sustainable
balance marked by
seasonally normal
draws in 4Q16,
driven by further
U.S. onshore
declines and
continued demand
growth

Macquarie Research The Global Macro Outlook
18 October 2016 15
Commodities If the first leg of the recovery in commodity prices this year was sentiment-driven, being a
realisation that China was not going to collapse and the Fed was not going to tighten
aggressively, the second has been based more on the fundamentals. For some, especially
the industrial-focused commodities, stronger demand growth has driven the delta. In others,
supply cuts have been overdone. The end result is similar. Prices across a broad range of
commodities have had to rise to invoke a positive supply reaction, the polar opposite of end-
2015. These are topics we explore further in our recent Commodities Compendium.
We are comfortable that, after a year-end dip, the first half of 2017 will see a continuation of
the factors that have assisted commodity markets in recent times, with manufacturing and
Chinese construction outperforming. Our confidence that January 2016 marked the nadir
continues to grow.
But to be clear, fundamentals do not point to any sustained inflationary bottlenecks ex raw
material constraints. The long-term challenges of overcapacity and lower industrial demand
growth than recent norms are still very much in place, while the semi-permanent state of low
interest rates means the ‘reset button’ of producer failures has essentially been removed,
particularly as governments become more and more involved.
Thus, if 2016 was the year of relief for commodity producers, then 2017 provides a window of
opportunity for sustainable strategy to be formed, as the long-term prognosis of weaker
economic growth has not changed. Commodity price inflation over 2016 has eased the
pressure on producer balance sheets, but growth options remain limited in the main. In both
metals and energy, we expect 2017 to mark a pick-up in industry capex and also a return to
cost inflation.
Fig 41 Current price levels are unlikely to yield further supply cuts
Fig 42 The 4Q hard coking coal contract rose over 100% QoQ
Source: Wood Mackenzie, CRU, Macquarie Research, October 2016 Source: TEX Report, Macquarie Research, October 2016
In oil, the agreement among OPEC members to cut production to a range between 32.5 and
33.0 MM BPD certainly stunned the market. The agreement, even if it is ratified at the
November 30th OPEC meeting and tightly executed, only changes our rebalancing base
marginally. It does however cut off the upwardly biased production skews that could have
stretched the rebalancing period out as far as one year beyond our mid-2017 base case. In
our assessment, the 33.0 MM BPD target is achievable and may turn out to be a smart move.
In a recent note we analysed scenarios below which allow the agreement to work. The deal
will have to (1) allow members which have ongoing supply disruptions to grow, (2) allow
weaker members to stay flat, (3) have buy-in from rich members for material production cuts,
and (4) have Russia participate. The risk to OPEC is that the desired price response may be
a needle threading exercise – not enough price action results in a market share giveaway and
too much price action accelerate shale growth, i.e. market share giveaway.
The coal markets remain a key area of focus. Notably, 4Q hard coking coal has settled at
$200/t FOB Australia – up over 100% QoQ. This level, while still slightly below current spot,
comes in above most expectations (our forecast was for $170/t) and marks the highest USD
settlement since 3Q12 and the highest in AUD since 2011.
0%
10%
20%
30%
40%
50%
60%
70%
80%
Mn O
re
Met C
oal
Therm
al
Co
al
Zin
c
Go
ld
PG
M B
asket
Alu
min
ium
Iro
n O
re
Co
pp
er
Ura
niu
m
Nic
kel
Proportion of supply losing money - cash basis
As of Jan 16 Current
20
0 22
52
09
22
53
30
31
52
85
23
52
10
22
51
70
16
51
72
14
51
52
14
31
20
12
01
19
11
71
10
93
89
81 84 93
20
00
50
100
150
200
250
300
350
2Q
10
3Q
10
4Q
10
1Q
11
2Q
11
3Q
11
4Q
11
1Q
12
2Q
12
3Q
12
4Q
12
1Q
13
2Q
13
3Q
13
4Q
13
1Q
14
2Q
14
3Q
14
4Q
14
1Q
15
2Q
15
3Q
15
4Q
15
1Q
16
2Q
16
3Q
16
4Q
16
$/t
, F
OB
Austr
alia
Premium hard coking coal settlements
If the first leg of the
recovery in
commodity prices
this year was
sentiment-driven,
being a realisation
that China was not
going to collapse
and the Fed was not
going to tighten
aggressively, the
second has been
based more on the
fundamentals

Macquarie Research The Global Macro Outlook
18 October 2016 16
The catalyst for tightness in the coal market has been the Chinese supply restrictions seen
this year. However, with prices now accelerating higher, these restrictions are being eased.
Prior to the October Golden Week holiday, the NDRC issued a notice that 791 coal mines that
met the “Level 1 safety standard” in 2015 would be allowed to lift their operating rate to their
previous 330-day registered capacity level rather than operate at the restricted 276-day
output level for the remainder of the year. In all, our industry contacts expect up to 900 mines
could lift output in 4Q16. The impact of these coal mines lifting output back to the full 330-day
output rate should be around 60–80mt of additional coal supply in 4Q alone, but this supply is
likely to be biased more to thermal coal than met. Nonetheless, we expect this supply
increment to result in lower coal prices for both thermal and met in the months ahead.
Agricultural commodity markets have underperformed other commodities since the start of
the year, dragged down by continued weakness in grains. Indeed, Macquarie’s proprietary
MacPI agricultural commodity index ended August at 143.1, just below end-December levels,
but with the staple grains component down 13.5% over the same period. While weather risks
may have been building into mid-year, they have since dissipated. As a result, we have now
seen four seasons in a row with close on perfect production, and with crops all but realised,
US ending stocks are set to be once again higher. With this, the pressures on agricultural
supply are increasing. Even in a low-interest-rate environment, farmers are struggling. The
potential for more widespread farmer bankruptcies in the US is rising, and while this will not
cause permanent supply reduction it may lead to a loss of planted area in 2017.
For the remainder of 2016, a combination of a likely Federal Reserve rate hike and the
standard 4Q Northern Hemisphere industrial slowdown does not bode well for commodity
prices. Already in October bullion prices have tumbled as a hike comes into view, while the
noticeable increase in long-term bond yields could mark the start of a structural shift which
may have large repercussions, something we considered here.
While improved Chinese confidence means the 2015 whiplash event and subsequent
demand vacuum is highly unlikely to be repeated, we expect steel and bulk commodities to
come under some pressure, while precious metals will also underperform. In contrast, we
believe US natural gas, nickel, alumina and nitrogen will outperform. Met coal is very much a
special situation, with acute supply constraint likely to be transient.
In the medium to longer term, supply remains a differentiating factor across commodity
markets. Exposure to those commodities for which demand growth will need to reincentivise
latent supply through price inflation is preferable, while exposure to those with true raw
material constraints is a must. On an 18-month view we are bullish on US natural gas, crude
oil, nickel, zinc, gold, silver and chrome from today’s levels.
We are concerned that the longer-term challenges of persistent overcapacity are
underappreciated for potash, alumina, aluminium and steel.
Fig 43 Positions of key mined/extracted commodities in the fundamental cycle – arrow shows 2-year progression
Source: Macquarie Research, October 2016
Strong Demand Push Demand destruction Market back in balance Strong supply grow th High stocks Stocks Draw ing Supply constraint
or deficit market Capex accelerating Capex peaking Stocks building Strong supply reaction Limited new supply Capex lagging
Price Acceleration Price peaking Prices falling Severe price decline Prices stablise at low level Prices stable Pricing to encourage supply
Manganese
Lead
Uranium
Thermal Coal
Met Coal
Iron Ore
Aluminium
Zinc
Copper
Nickel
Chrome
Palladium
Gold
Potash
Platinum
Tin
Oil
US Natural Gas
Silver
Bauxite
LNG
Diamonds
Nitrogen
Steel
Alumina
Lithium
Macquarie’s
proprietary MacPI
agricultural
commodity index
ended August at
143.1, just below
end-December
levels, but with the
staple grains
component down
13.5% over the
same period

Macquarie Research The Global Macro Outlook
18 October 2016 17
United States Economic activity appears to once again be expanding at an above potential pace following a
slower pace of growth around the turn of the year. In Fortress America – It’s go time: Growth
drags complete we highlighted that inventories and energy & mining investment were a
substantial headwind to growth, subtracting ~ 1.1 percentage points from GDP over the last
four quarters. These drags now look to have dissipated, a development that should lead to a
firmer underlying trend.
Further supporting this view is that the ISM manufacturing PMI has now shown expansion in
6 of the last 7 months, with particular strength in the forward-looking new orders component.
Additionally, readings on consumer spending have continued to be strong, supported by
persistent job gains and improving wage growth. With a personal savings rate that is 1.8 ppt
above its 2002-7 average, the consumer is well positioned to continue to support the outlook.
September’s employment report further solidified that the job market remains on firm footing.
Over the past 3 months job gains have averaged ~190k, a healthy rate that should dispel the
notion that the economy is slowing. However, employment gains are now showing signs of
moderating amidst a labour market that is close to full employment. Thus far in 2016 job gains
have averaged ~180k/month which is noticeably slower than the monthly pace of ~230k seen
in 2015.
We attribute the slowdown in job growth to reduced labour market slack as opposed to
decreased employment demand. Jobless claims remain at historically low levels while job
openings are at an all-time high, suggesting worker demand remains healthy. As unabsorbed
worker capacity increasingly diminishes we expect jobs gains to further slow to ~150k/month
through end-17, a pace nearly double what is required to further reduce slack. This should
continue to put upward pressure on wages, which have already shown clear signs of moving
higher particularly in the construction industry (Fig 44).
Most importantly, the outlook for residential investment remains strong despite a softer
reading in 2Q. It is low and rising as a share of GDP, a dynamic that insulates the economy
from any potential downturn. We believe that this area can rise at a double-digit pace for the
next 3-4 years, a thesis we outlined in Accelerating Housing, Macro Impact.
On the policy front, we believe that the Federal Reserve is poised to continue a rate hike
cycle that should prove gradual, cautious, and supportive of risk-taking. The pace of hikes is
likely to be, on average, 50bps per year until the upper end of the fed funds rate range
reaches our forecasted terminal level of 2%. We foresee this occurring in mid-2019. A key
input into our thesis is our belief that the neutral policy rate in the US is likely to remain at
present levels rather than increase over time. This will lead to a slower pace of rate hikes for
the duration of the cycle than the FOMC currently projects.
Fig 44 Construction wages are showing particular strength
Source: BLS, Macquarie Research, October 2016
0%
1%
2%
3%
4%
5%
6%
1995 1997 1999 2001 2003 2005 2007 2009 2011 2013 2015
YoY % change
YoY % change (3moMA)
Average hourly earnings of prod & nonsupervisory employees: construction
After subtracting ~
1.1 percentage
points from growth
over the past four
quarters, the drag
from inventories
and energy &
mining investment
looks complete
We expect
employment gains
to average
~150k/month
through end-17 as
the economy nears
full employment
The Fed is likely to
raise rates gradually
and to a lower level
than in previous
expansions

Macquarie Research The Global Macro Outlook
18 October 2016 18
China Recovery continued in September: China will release September and 3Q data on October
19. Thanks to the property market and price reflation, the economy continues to improve. For
September, industrial production (IP) growth could be stable at around 6.3% YoY. We expect
real GDP to grow 6.7% YoY in 3Q16, the same as in the previous two quarters. But nominal
GDP growth, which improved to 7.2% YoY in 1H16 from 6.4% in 2015, is set to pick up
further in 2H16 (see September data preview: Recovery on reflation and real estate).
PMIs suggest stable growth in Sep: The NBS manufacturing PMI came in flat at 50.4 in
Sep, which is the highest level since Nov 2014. Meanwhile, the Caixin PMI edged up slightly
to 50.1 from 50.0 in Aug. At this moment, the economy is supported by the property market
and price reflation, which has led to a rebound in corporate earnings. Industrial profits jumped
20% yoy in Aug, the fastest growth in three years. As such, the PBoC would postpone cutting
the interest rate. Rather, the focus has shifted to managing the financial risks in the bond and
property markets
A temporary triumph on capital outflows: The detailed 2Q16 Balance of Payment data
released last month gives us more information on the current state of capital outflows. It
shows that China’s FX reserves dropped by US$35bn in 2Q16, which is much improved from
the US$100+bn decline in each of the prior three quarters. Meanwhile, hot money outflows
started to stall in 2Q16 (Fig 45). It’s in line with our previous analysis of capital flows based on
the 2015 BoP data (Dissecting China’s capital outflows in 2015 ). Essentially, because hot
money has been largely exhausted after two years of outflows, also capital controls are more
effective for domestic money than foreign money, China’s capital outflows pressure would be
much eased in 2016. Therefore, the market fears on capital outflows earlier this year are
overdone. That said, for the PBoC, it’s just a triumph of a battle, not a war, because the
slowdown of capital outflows has been achieved with tightened capital controls, which run
against China’s long-term goal of the RMB internationalization and Capital Account
openness.
The next battle for the PBoC: Last month, we published a report on the long-term outlook
for the RMB (How to think about the RMB?). Against the consensus, which expects the RMB
to have a trend depreciation, we forecast the USD/CNY to end 2017 at 6.4 and appreciate
more in the long run. The report has received a lot of push-back, just like many of our reports
related to the RMB. For instance, on the same day of the RMB devaluation last August, we
forecasted that the depreciation would be less than 5% from then on to the year-end (link). In
our 2016 outlook (link), we forecasted the USD/CNY to end 2016 at 6.6. Earlier this year, we
forecasted that capital outflows are easily manageable as hot money has largely gone (link).
Fig 45 Carry trade unwinding reversed in 2Q16
Source: CEIC, Macquarie Research, October 2016
-150
-100
-50
0
50
100
150
Mar-
09
Jun
-09
Sep
-09
Dec-0
9
Mar-
10
Jun
-10
Sep
-10
Dec-1
0
Mar-
11
Jun
-11
Sep
-11
Dec-1
1
Mar-
12
Jun
-12
Sep
-12
Dec-1
2
Mar-
13
Jun
-13
Sep
-13
Dec-1
3
Mar-
14
Jun
-14
Sep
-14
Dec-1
4
Mar-
15
Jun
-15
Sep
-15
Dec-1
5
Mar-
16
Jun
-16
Capital flows due to carry tradeUSD bn
Outflows
Inflows (1Q09-2Q14)US$742bn
Outflows (3Q14-1Q16)US$452bn
Recovery continued
in Sep
Capital outflows
have slowed
We expect RMB to
appreciate in 2017

Macquarie Research The Global Macro Outlook
18 October 2016 19
Admittedly, the dominant expectation is a trend depreciation for the RMB. With that, the RMB
internationalization has backtracked as the RMB deposits in HK have already dropped to
RMB670bn from the peak of RMB1tn in Dec 2014. For the Chinese government, which has
spent tons of effort on things like the SDR and AIIB, it has so much to lose from the
termination of RMB internationalization, which is also important to One-Belt-One-Road.
Therefore, the next target for the PBoC has to be the prevalent depreciation expectations.
How to win the battle with depreciation expectation? Over the past year, the RMB has
had a slow depreciation and limited volatility. Since most people are trend-followers, no
wonder the depreciation expectation is so prevalent at this moment. To win the battle with
depreciation expectation, the PBoC needs a new strategy, which is to guide the RMB
stronger while increasing the volatility. Under the new strategy, the market knows the long-
term direction of the RMB but not the short-term trading band. Therefore, when the RMB falls
to some extent, speculators would expect it to reverse and start buying. By doing so, the
PBoC essentially changes the one-way expectation by winning allies among market
participants. Over time, the PBoC could gradually increase the band and ultimately let the
RMB be determined by market forces. To be sure, at the beginning of the year when lots of
people forecasted a one-off depreciation, we argued that the best strategy for the PBoC in
2016 is a stable RMB (link), because at that time the credibility for the PBoC was not enough
and capital outflow pressure was high. It turns out that a stable RMB is also the actual
strategy adopted by the PBoC. However, the situation has changed as capital flows have
eased. So it’s time to move on.
Property prices and exchange rate: One push-back to our positive RMB view is that the
PBoC has to depreciate the currency to keep property prices near the current level. We agree
that rising home prices could cause more Chinese residents to sell their property in China and
buy foreign assets. However, there are other and probably more important channels to
influence the RMB, such as trade balances and economic growth. That’s why China’s home
prices have increased rapidly over the past 15 years but the RMB has also appreciated.
Moreover, while in this round of property up-cycle, home prices do increase quickly in certain
cities, but the rise is not a broad-based one (Fig 46). Over the past 12 months, 48 out of the
70 biggest cities had home price growth of less than 5%. As such, if the property market
could cool down in the next six months as we are expecting, the negative impact on the RMB
will be limited.
More cities introducing property curbs: Over the past couple of weeks, more than a dozen
cities tightened their property measures. It’s not surprising at all, as China had four such
property short-cycles in the past decade. This is just the fifth one. According to past
experience, the sector could cool down in 1H17 and the rate-cutting cycle would resume
around mid-2017 to support the economy. But for 4Q16, the property sector should remain
supportive, as developers are quickening the pace of construction after the strong sales in the
past few months.
Fig 46 Home prices increase mainly in top cities
Source: CEIC, Macquarie Research, October 2016
100
110
120
130
140
150
160
170
180
190
Feb-1
1
Aug
-11
Feb-1
2
Aug
-12
Feb-1
3
Aug
-13
Feb-1
4
Aug
-14
Feb-1
5
Aug
-15
Feb-1
6
Aug
-16
Tier 1 Tier 2 Tier 3
2010=100
More volatility for
RMB is needed
Limited impact of
property market on
RMB
Property sector to
cool down in 2017

Macquarie Research The Global Macro Outlook
18 October 2016 20
Eurozone The Euro-zone economy continues its recent trend of steady but slow growth. We see some
darker clouds on the horizon however from higher oil prices and the collapse in Sterling.
Economic data in the last month has been mixed. The PMI surveys remain gloomy - in
September the Eurozone composite was just 52.6, its lowest since January 2015, and
averaged over the quarter pointing to slower GDP than 2Q’s 0.3%. But the PMIs look a little
strange, with a very weak Germany services sector the main drag. In contrast the European
Commission sentiment indicator in September saw its highest since January 2016.
Both surveys agree the industrial sector has improved. The manufacturing PMI rose to 52.6 in
September, its best in three months. Industrial output gained 1.6% MoM, and over the quarter
as whole - assuming a flat September - will eke out a modest 0.4% QoQ growth. In the past
this has been consistent with our forecast for GDP of around 0.3% QoQ.
Fig 47 Eurozone IP growth, QoQ (assuming Sep flat) Fig 48 Oil to take toll on buoyant retail sector, % YoY
Source: Eurostat, Macquarie Research, October 2016 Source: Macrobond, Macquarie Research, October 2016
Two new concerns on the growth front are coming in to view. The first is the higher oil price
and the impact it will have on consumer incomes. From being down 50% YoY in the middle of
2015, oil is now higher YoY, and if the current euro price is maintained will be up 30% YoY in
1Q. We think this is likely to see retail sales growth slow, something that we have already
seen initial signs of (Fig.48).
Second, Brexit. The recession in the UK many forecast hasn’t materialised, and as such our
expectation of only a modest impact on the Eurozone economic is playing out. But a new
problem is the steep devaluation of Sterling against the euro. There is a good correlation
between the exchange rate and Eurozone exports to the UK, and if the current devaluation is
sustained history suggests imports might fall 15% - €3bn a month. This is not a huge amount
in the context of a €10 trillion economy. But it is a fair amount in the context of a 1.5% growth
rate. We think it means Eurozone GDP will be a below consensus 1.4% in 2017, and the euro
will weaken against Sterling.
This brings us onto the ECB, and the thorny issue of its QE programme expiring in March.
Ahead of its October and - more importantly - December meetings the usual series of press
leaks about policy have started. Some excitement came from a press report that the bank
was considering ‘tapering’, but a closer reading suggests policymakers were only saying
when the time comes to end QE they would ‘taper’, rather than do a hard stop. We think that
time is a long way off (see “Timing the exit from unconventional monetary policies: the ECB &
BOJ) and December is likely to see the ECB announce an extension plus changes to its rules
on eligibility. It remains debatable whether the ECB should have started QE; we see no
reason why they should now stop.
Survey data mixed,
IP improving
Oil and Sterling
present new
headwinds
ECB will not taper

Macquarie Research The Global Macro Outlook
18 October 2016 21
United Kingdom Sterling is becoming an issue. The UK currency suffered a torrid time in the wake of a speech
by the UK Prime Minister, Theresa May, on 2 October putting some flesh on how the UK
government plans to exit from the European Union (EU). By 13 October it had fallen 4%
against the euro and 6% against the dollar, against the latter hitting repeated 31-yr lows.
The Chancellor (finance minister) Phillip Hammond attributed the weakness to financial
markets only now realising the UK really was going to leave the EU. But May’s
announcement that the UK would by March 2017 file Article 50 to start the two-year process
of leaving was not that remarkable (if at the earlier end of consensus).
We see two more plausible reasons for sterling’s slump. First, the extent of the powers the
government wants to take back from the EU - basically all of them (May cited the need to
control immigration, prevent the ECJ having a sway in the UK and even the right to ‘label our
food’) means Single Market membership is a long shot, and being outside will hit trade.
Second, the government has radical plans for what it wants to do with that power, with the PM
in a second speech promised a ‘revolution’, outlining a more interventionist economic policy
with politics such as worker board representation. For good measure she added a critique of
the side-effects of the Bank of England’s cheap money policy. If she is serious then a weaker
currency is likely to be a feature, not a fault.
But how serious is she? The remarks came at a party conference, not the most reliable guide,
and a number of clarifications have since been made, suggesting there is still much left
undecided about both Brexit and future economic policy. Sterling is probably due a bounce -
something which should be aided by a record short-position on the CME futures market.
Fig 49 Sterling v USD/EUR/BoE Index, 1995 = 100
Fig 50 UK core goods inflation (lagged 12m) v sterling, % YoY
Source: Macrobond, Markit, Macquarie Research, September 2016 Source: ONS, Macquarie Research, September 2016
That said, FX markets are not so prone to be being ‘too short’ - after all natural longs and
shorts are so large - and there seems little reason to expect a quick strengthening while so
much uncertainty prevails. Neither the government nor Bank of England officials seem too
concerned. The question that now arises is how the sterling devaluation will start to feed into
the real economy.
The bad news will come from inflation, and down the line consumer spending. The headline
rate was set to rise sharply on the back of the higher oil price, and now imported food, but
even the core rate will be affected – Fig.50 shows a good correlation between the change in
Sterling on a YoY basis and that index lagged 12 months. Market inflation measures are
rising sharply - the 5yr implied rate reached 3%, its highest in 15months.
The good news should be a better economy. Oxford Economics’ global model suggests a 5%
fall in Sterling adds about 0.1% QoQ to GDP growth. Of course if FX markets are selling
Sterling on fears of lower growth this might be offset by other factors, but very short-term we
raise our GDP forecasts modestly.
Trade and the
economy threaten
Sterling
Inflation and growth
to be boosted…at
least in the
short-term

Macquarie Research The Global Macro Outlook
18 October 2016 22
Japan Our real GDP growth forecasts remain anaemic, with modest contributions expected from
consumption and net exports.
Fig 51 Japan: key macroeconomic forecasts
CY11 CY12 CY13 CY14 CY15 CY16E CY17E CY18E CY19E
GDP (YoY, %) -0.5 1.7 1.6 -0.1 0.6 0.4 0.6 0.7 0.8 CPI (YoY, %) -0.3 0.0 0.4 2.7 0.8 -0.1 0.3 0.5 0.9 (**) Overnight call rate (*) 0.1 0.1 0.0 0.1 0.0 0.0 0.0 0.0 0.0 10-year JGB (*) 0.99 0.79 0.74 0.3 0.3 -0.1 -0.1 0.2 0.3 ¥/$ (*) 77.6 86.3 105.4 119.8 120.4 105 101 97 95 Note: CPI is the headline CPI ex fresh foods. (*): per period end, Macquarie forecasts. (**) The consumption tax rate increase to 10% from 8% is now scheduled for October 2019
Source: Bloomberg, Macquarie Research, September 2016
The impact of financial repression on savings is leading households to be subdued
consumers. For more, please see the 5 October 2016 PEC’s Japan strategy: Accentuated
sector rotation.
One developing positive is the return to export growth to the US and the EU, Fig 52.
Fig 52 Japan export to US and EU
Source: BOJ, Macquarie Research, September 2016
Whilst we have been forecasting a trend appreciation in the Yen, the move has been much
stronger than expected. The Yen has been very low/cheap on a REER, and the current
account surplus has improved from 0.5% in 2014 to an estimated 3.3% in 2015 mainly due to
lower energy prices, and 3.5–4.0% is possible in 2016.
As such, the BOJ’s campaign against deflation and entrenched deflationary expectations has
entered a new phase, with the currency now a headwind to the policy goal. Even our modest
inflation forecasts above could prove to be optimistic.
We believe the BOJ is now essentially subordinate to fiscal reconstruction, working to
minimize the government’s interest expense through a policy of financial repression. The new
arrangement to target the 10-year JGB yield “around zero” makes this more explicit. Please
see the 26 July 2016 Macq-ro insights: Financial repression for decades and the 12 October
2016 PEC’s Japan strategy: the cycle through 2017. The BOJ’s FY3/18 of 1.3% assumes a
big boost from the government’s headline ¥28.1tr supplementary budget, just announced. We
are much more cautious.
PM Abe has established a panel to make labour market reform proposals and instructed them
to prioritize “equal pay for equal work” and the reduction in long work hours. There have been
trial balloons suggesting a 10% increase in hourly rates for part-time workers, i.e. the
government becoming directly involved in wage setting.
.
-30
-15
0
15
30
45
60(%, YoY) US EU
Our real GDP
growth forecasts
remain anaemic
One developing
positive is the return
to export growth to
the US and the EU
PM Abe has
established a panel
to make labour
market reform
proposals

Macquarie Research The Global Macro Outlook
18 October 2016 23
Canada In 2Q16 Canada saw growth contract at the fastest pace since 2009. While the majority of
this weakness can be attributed to the wildfire in Fort McMurray, even after excluding this
impact underlying activity slowed markedly. However, looking ahead, we expect the domestic
economy to continue to improve in 2H as a result of: i) a pickup in US activity, ii) federal fiscal
stimulus, iii) a snapback in oil production and exports, iv) a lessening drag from energy
investment, and v) strong monthly GDP numbers for June and July.
Despite our expectation for a near-term rebound, beyond this growth should be subdued.
Significant structural headwinds are likely to weigh on the outlook including i) elevated levels
of household debt, ii) stretched residential investment, iii) unfavourable demographics, and
iv) a lack of competiveness.
Due to these headwinds, we expect the BoC overnight rate will rise to just 1.0% in the current
expansion with the next hike not coming until 2Q19. This forecast reflects increased
confidence in the theme of economic divergence in North America as tailwinds to growth in
the US (consumer spending and residential investment) are substantial headwinds in
Canada. As a result, we remain below consensus in our currency forecast. We anticipate that
a widening in the two year sovereign yield differential between Canada and the US will lead to
a $0.74 CADUSD ($1.36 USDCAD) at the end-16 and $0.69 ($1.45 USDCAD) at end-17.
Although signs that inflation is softening as well as the federal government’s recently
announced housing measures argue in favour of additional monetary accommodation, we
think the BoC will remain on hold. Low estimates of potential together with high debt levels
suggest there is a high threshold to cut rates. Consequently, we expect that the stimulus
baton will increasingly rest with the fiscal authorities, rather than their monetary counterparts.
While federal government stimulus will provide a boost to activity, the impact will be modest.
Federal spending represents just 30% of total government expenditures and will be partially
offset by continued weak spending growth from municipal and provincial governments. We
anticipate another federal stimulus announcement will occur in 2017/18.
Hopes for a reorientation in the economy towards non-energy exports have been slow to
transpire. Canada’s manufacturing sector continues to be challenged from a prolonged period
of weak investment and growing competition from Mexico (Fig 53). These factors will limit the
potential benefit to Canada’s outlook despite improvements in the US.
Fig 53 Canada has continued to under-invest in manufacturing
Source: BEA, Statistics Canada, Macquarie Research, October 2016
0.7
1.1
1.5
1.9
2.3
1991 1993 1995 1997 1999 2001 2003 2005 2007 2009 2011 2013 2015
Manufacturing investment (nominal local$) - indexed to 1991
US
CAN
1991 = 1.00
Growth should
rebound in 2H, but
remain subdued in
the years ahead
Canada’s
manufacturing
sector continues to
be challenged
We expect the BoC
overnight rate will
peak at just 1.0% in
the current
expansion
The stimulus baton
will increasingly
rest with the fiscal
authorities

Macquarie Research The Global Macro Outlook
18 October 2016 24
Australia With few pieces of ‘big news’ on the Australian macro front our key views remain unchanged.
Australia’s new central bank Governor, Philip Lowe, assumed the reins at the RBA with little
perceptible change in tone (see: Aussie Macro Moment – RBA: New message, or
messenger). The RBA’s communications became a little more nuanced, but the messages
remained broadly unchanged.
Improved commodity prices and a somewhat more positive tone from the RBA, particularly
around the terms of trade bottoming, have seen market expectations of further easing
reduced. This has, arguably, supported the A$ over recent weeks in the face of a firmer US$.
The RBA’s description of the Australian dollar has shifted slightly from ‘is helping’ the
economy’s transition, to ‘has been’.
New nuance around the housing market was delivered in the RBA’s semi-annual Financial
Stability Review. Trends in Australia’s house prices are dominated by Sydney and Melbourne.
And as illustrated by the chart below established house prices across the rest of Australia
have remained well contained. The risks now predominantly lie in how well the oncoming
surge of supply of new medium density housing in Brisbane and Melbourne are absorbed.
On the commodities front, as we highlighted last month, a sustainment of current commodity
prices is likely to lead to an improvement in the outlook for mining investment. The latest
capex expectations survey contained an upgrade to mining investment expectations.
However, this was for FY17, the final year of decline following the mining capex boom.
We estimate that, based on the improvement in actual and projected commodity prices, a
new mining capex cycle could begin from FY18. The pace and extent of investment upswing
will be determined by a number of factors, particularly the commodity price trajectory.
However, the weakest of the last few capex cycles saw a near doubling of investment
expenditure in the 5 years from the low point of spending.
Whilst FY18 may appear to be a better year for mining investment, any upswing in mining
investment is unlikely to become labour intensive until the latter years of the cycle, if major
greenfield projects are brought forward. The economy still needs to negotiate FY17, which, in
our view, is likely to see continued accumulation of slack, disinflation, and further RBA cash
rate cuts. Rate cuts in February and May 2017 remain our base case.
Fig 54 House prices outside of Sydney and Melbourne have remained, in aggregate, well contained over recent years
Source: ABS, Macquarie Research, October 2016
95
105
115
125
135
145
95
105
115
125
135
145
Sep-13 Mar-14 Sep-14 Mar-15 Sep-15 Mar-16
Sydney
Melbourne
Rest of Australia
Index Index
Australia: House Prices(Index, September 2013 = 100)
2.2% CAGR
8.0% CAGR
12.3% CAGR
The RBA’s
description of the
A$ has morphed
from ‘is helping’ to
‘has been’ for the
economy

Macquarie Research The Global Macro Outlook
18 October 2016 25
New Zealand There is little change in our outlook for the New Zealand economy. Incoming data over the
month has revealed a continuation of our major themes. The NZ$ remains too high, dairy
prices have softened somewhat. Inflation expectations remain contained, but initial signs from
the latest tightening of macro prudential policy suggest some potential easing of concerns.
New Zealand’s growth pulse remains intact, but there are continued signs that growth
remains disinflationary. The latest NZIER Quarterly Survey of Business Opinion suggests that
confidence and activity remain high. But inflation, indicated by selling prices, remains weak.
Net migration inflows also remain elevated, with the annual total returning to a record high.
Financial stability concerns could still ultimately provide a handbrake to our base case for
RBNZ rate cuts. Our monitoring of weekly housing finance approvals – which the RBNZ will
shortly cease publishing – suggests that the most recent tightening may be having a more
enduring impact than previous (October 2013 and November 2015) efforts. Fewer, smaller,
loans are being taken out.
Initial signs of progress on the financial stability front should provide the RBNZ with more
comfort around cutting rates, if needed. That need will be based on two factors, in our view.
Inflation expectations, and the currency.
The latest quarterly reading on inflation expectations showed that the critical 2yr-ahead
expectations held steady. Inflation outcomes have undershot the RBNZ’s 1-3% target band
for some time, and we think they will disappoint again in the upcoming 3Q16 CPI outcome.
Where the RBNZ continues to face a challenge is on the currency. The NZ$ remains, on a
trade weighted basis, above the RBNZ’s currency ‘risk case’ published in the August
Monetary Policy Statement. That’s despite a softer outcome in the most recent dairy auction.
We remain of the view that the RBNZ is likely to cut rates further, with the next move at the
November 10 OCR review. This will be one of the first central bank moves following the
outcome of the US Presidential election.
Fig 55 Weekly housing finance data demonstrates the – initial – impacts on borrowing activity from the latest tightening of macro prudential policy.
Source: RBNZ, Macquarie Research, October 2016
-10
-5
0
5
10
15
20
25
30
35
-10
-5
0
5
10
15
20
25
30
35
01-Jun-15 01-Dec-15 01-Jun-16
New Zealand: Housing loan approvals(experimental weekly estimates, 3m YoY%change)% %
Value of loans approved
Number ofloansapproved
Signs that macro
prudential policy
tightening may be
having an impact
should clear the way
for the RBNZ to
lower the OCR
further

Macquarie Research The Global Macro Outlook
18 October 2016 26
South Africa We are not making any changes to our South African economic forecasts this month, but we
highlight key forecast risks. Our baseline view is for a gradual economic growth recovery,
supported by a smaller drag from agricultural and mining commodities, marginal fiscal
tightening (as per the latest official forecasts) and steady monetary policy. This scenario
assumes that the rand remains relatively steady around R14-R14.50/$ in nominal terms (thus
appreciating slightly in real terms) although political noise and global newsflow and changes
in risk appetite will likely continue to underpin significant volatility. This assumes the rand is
pricing in a single-notch downgrade by S&P in December (only).
In the absence of a political shock, similar to the “9/12” Finance Minister reshuffling, we
believe that the currency risks are biased towards the stronger side. This increases the
possibility of inflation that retreats sufficiently to compel the SARB to cut interest rates. We
believe that inflation forecasts persistently below 5% would open the door for monetary
easing. We recently illustrated the significant boost to consumers’ spending power in this
scenario (see Economic insights - Consumer cross-currents unpacked). We attach a
relatively high probability to this scenario.
Unfortunately there is still a non-negligible risk of a political shock, although the probability
seems to have eased since “9/12” given inter alia the growing strength of open civil society.
Slow traction with growth reform adds to the longer-term fiscal and credit rating risks, and
means that growth will not resolve the elevated poverty and unemployment problems. We do
not at this stage believe that the recent summonsing of the Finance Minister to appear in
court on charge of fraud will lead to his removal, but the situation remains very fluid and partly
dependent on civil society’s responses to political events.
The market’s focus will increasing shift to the Medium-Term Budget Policy Statement on 26
October. We expect government to keep the cornerstone of its fiscal consolidation plan, the
expenditure ceiling, to remain intact, despite additional spending pressures including to fund
the freezing of poor students’ university fees. Although the revenue risks remain biased
downwards given sluggish economic growth, the tax revenue performance has been
improving in recent months and the outperformance of non-tax revenues (including forex
gains on historical foreign exchange purchases) is at this stage sufficient to offset the
potential tax shortfall. We therefore do not expect the fiscal announcements and choices to
support credit rating downgrades in the upcoming rating reviews; instead this will largely
depend on whether the rating agencies will regard the incremental progress to improve the
growth framework as sufficient for now.
Fig 56 Consumer real income growth after tax and interest rates (2017, baseline view)
Fig 57 Consumer real income growth after tax and interest rates (2017, with lower inflation and interest rates)
Source: Eighty20, Stats SA, Treasury, SARB, Macquarie Research, October 2016
Source: Eighty20, Stats SA, Treasury, SARB, Macquarie Research, October 2016
0.0%
0.5%
1.0%
1.5%
2.0%
2.5%
% YoY
Real income growth Real after-tax Real after tax and interest
0.0%
0.5%
1.0%
1.5%
2.0%
2.5%
3.0%
3.5%
% YoY
Real income growth Real after-tax Real after tax and interest
Key forecast risks

Macquarie Research The Global Macro Outlook
18 October 2016 27
India US$80bn of dollar flows and counting: India has the second-largest overseas population
after China, and it is the largest recipient of remittances (in value terms) in the world. Inflows
from overseas Indians (including private transfers and NRI deposits) stood at US$79bn in
FY16. These flows (a) help boost household income and, hence, support private
consumption, (b) play a key role in bringing stability to India’s CAD, and (c) act as a source of
foreign exchange reserves to help bridge the funding gap in the event of global risk aversion
and restoring external stability. Going forward, we believe policymakers should try to leverage
these flows to fund infrastructure and other development projects to have a multiplier effect
on overall growth.
Rich overseas Indians have an annual GDP >US$750bn: An estimated ~27mn Indians
resided overseas as of April 2016, with an annual GDP of ~US$750bn, on our estimates,
implying an average per capita income of ~US$29,000. This is ~18x the per capita income of
India, with an annual GDP of US$2tn and a 1.3bn population. We believe overseas Indians’
wealth, including gold, property and other assets, to be much higher, at above US$1.5tn.
Private transfers critical for stabilising India’s CAD: India has been the top recipient of
migrant remittance inflows (private transfers) in 16 out of last 20 years and for the past 8
years consecutively. The migrant remittance (net) inflows to India increased nearly 2.8 times
in the last decade to US$67bn (3% of GDP) in CY15 from US$24bn in CY05. The private
transfers (including remittances) have been largely stable, in the 3–4% range of GDP in the
past 10 years, and helped offset India’s wide trade deficit to a large extent. Indeed, India’s
FY16 current account deficit (CAD) excluding private transfers was a high US$85bn (4.1% of
GDP) vs US$22bn (1.1% of GDP) including private transfers.
Slowing private transfers, not quite a worry: For the first time since FY05, India saw a
decline in private transfers, by 5% YoY in FY16. This weakness seems to be driven by (a)
slowing global economic growth and (b) a weakened economic environment in the GCC
countries due to a sharp fall in global crude oil prices. We believe the narrowing of India’s
CAD and rising FDI flows imply that slowing remittance flows would not result in exacerbating
the macro stability risks. Indeed, we do not expect the trend of falling remittances to be
sustained beyond a few quarters, because a) our global commodities team expects the Brent
crude oil price to pick up to US$61/bbl in 2017 and US$68/bbl in 2018 and b) improving
growth and employment prospects in the US economy will likely support remittances.
Inflows under NRI deposits are interest rate-sensitive: The outstanding NRI deposits
have increased 2.5 times to US$127bn as of March 2016 (vs US$52bn five years ago). Unlike
remittances, inflows under NRI deposits are interest rate-sensitive and add to India’s external
vulnerability. Hence, policymakers should try to use them judiciously to meet the capital-flow
requirement in the event of a crisis (like measures to attract dollar deposits in 2013 to deal
with taper tantrums) or to fund infrastructure development projects.
Fig 58 Flows from overseas Indians
Fig 59 Current account balance: With and without support of private transfers
Source: CEIC, Macquarie Research, October 2016 Source: CEIC, Macquarie Research, October 2016
-10
10
30
50
70
90
110
FY00 FY03 FY06 FY09 FY12 FY15
Private transfers (including remittances) Non Resident Deposit
US$ bn
-9%
-7%
-5%
-3%
-1%
1%
3%
FY
00
FY
01
FY
02
FY
03
FY
04
FY
05
FY
06
FY
07
FY
08
FY
09
FY
10
FY
11
FY
12
FY
13
FY
14
FY
15
FY
16
Current Account
Current Account excluding Private Transfers
as % of GDP
India has the
second-largest
overseas population
after China, and it is
the largest recipient
of remittances (in
value terms) in the
world

Macquarie Research The Global Macro Outlook
18 October 2016 28
ASEAN Growth has been fading across ASEAN since 2012, Fig 60, as the region looks for a new
growth engine, and unwinds the credit excesses of the past. Fig 2661 shows the ratio of
private non-financial credit to GDP and its growth over the last five years.
Whilst the ratio to GDP generally increases with economic development and financial
deepening, relative to other EM economies shown below, some ASEAN countries appear
elevated, implying a need to go through a period of private debt adjustment.
Fig 60 Real GDP growth for ASEAN-5 (weighted by GDP in current US$), 2000 to 2020. 2016-20 are Macquarie forecasts
Note: Please see Fig 169 and Fig 170 for the underlying data. The horizontal dashed line above is 5% pa real GDP growth. The ADB estimates 4.9% pa over 2011-20 and 4.2% pa over 2021-30, whilst the Economic Complexity Project forecasts 4.3% pa. 5% pa is therefore a potential future “lid”.
Source: IMF, World Bank, Macquarie Research, October 2016
Fig 61 Private non-financial credit, level and growth, for leading EM economies
Note: The BIS does not have data for the Philippines
Source: BIS, Macquarie Research, October 2016
A subdued external environment and restrained credit expansion is suggestive of real GDP
growth modestly beneath potential, which we estimate at around 5.0% pa for the ASEAN-5,
Fig.60, and the room for monetary policy to have an easing bias.
However, in advance of an expected December 25bp increase in US policy interest rates, we
judge most ASEAN central banks to be on hold for now, Fig.62.
For EM economies generally, ongoing credit cycle and real property price adjustments temper
the industrial cyclical relief, as does expected weak inward FDI. Please see the 8 April 2016
What’s next for EM economies and page 51 in this report for more.
0
2
4
6
8
10
2000 2002 2004 2006 2008 2010 2012 2014 2016 2018 2020
(%)
ASEAN
Brazil
Mexico
Russia
Turkey
India
China
Indonesia
Malaysia
Singapore
Thailand
0
10
20
30
40
50
60
0 50 100 150 200 250
2015 3Q vs 2010 3Q
Private debt as % of GDP
Change in five years (%)
A subdued external
environment and
restrained credit
expansion is
suggestive of real
GDP growth
modestly beneath
potential, which we
estimate at around
5.0% pa for the
ASEAN-5...
...and the room for
monetary policy to
have an easing bias

Macquarie Research The Global Macro Outlook
18 October 2016 29
Fig 62 Monetary policy, key interest rates, in basis points (bp)
End 2014 End 2015 End 2Q 2016 Outlook
Singapore 50 125 125 Stable Malaysia 325 325 325 25bp cut 13 July, more likely Thailand 200 150 150 Stable Indonesia 775 750 650 Another 25bp cut possible Philippines 400 400 300 (*) Stable
Korea 200 125 150 Another 25bp made on 9 June Taiwan 188 163 150 Another 12.5bp cut possible
Note: Singapore: 3-month interbank rate, Malaysia: overnight policy rate, Thailand: 14-day repo rate, Indonesia: 1-month SEBI rate, Philippines: reverse repo rate, Korea: overnight call rate, Taiwan: official discount rate. Please note that the exchange rate, not interest rates, is the main policy in Singapore. (*) The new institutional arrangements mean that the old 400bp policy target rate is now equivalent to a 300bp rate.
Source: Macquarie Research, October 2016
A particular challenge for ASEAN is their role in the East Asian export supply chain. Our
house view has a gradual fade in Chinese growth as the old investment/credit growth model
persists, but generates diminishing returns. China began a serious import substitution phase
in 2015 and this will continue for as long as the old growth model persists, and SOEs invest
with an essentially zero cost of capital.
Fig 63 Import volumes and import prices/unit values, YoY, %
Source: CPB, Macquarie Research, October 2016
As shown above, in 2015 on CPB data Asia emerging economies had -1.0% import volume
growth, whilst prices/unit values fell -12.2%. Please note that the import volume shrinkage
was an Asia emerging economies’ experience, not a worldwide event.
Service sector development, more broadly than just tourism, is one possible region-wide
growth driver. Please see the 9 May 2016 Macq-ro insights: Global services, a new
economic order.
We believe the next global growth engine is innovation clusters, or “brain-belts” as described
in the book by Antoine van Agtmael and Fred Bakker: The Smartest Places on Earth (2016).
Please see page 34. These tend to be leading-university centred and more difficult for
ASEAN in general to develop.
-20
-15
-10
-5
0
5
10
15(%, YoY)
World import volumesAsia emerging economies import volumesWorld import prices/unit valuesAsia emerging economies import prices/unit values
The need for a new
growth engine

Macquarie Research The Global Macro Outlook
18 October 2016 30
Macq-ro insights Short-term business-cycle judgements are more likely to succeed with a deep awareness of
more medium- and longer-term issues. In global macroeconomics there are a considerable
number of the latter.
The following pages provide “executive summaries” on:
Fig 64 Medium- and longer-term global macro issues
1) Global policy coordination 11) Chinese corporate debt
2) Global services 12) Oil & sovereign defaults
3) Innovation clusters/”brainbelts” 13) What’s next for EM economies?
4) The private sector’s appetite for credit 14) Global private investment indicators
5) Global trade in goods 15) Local factors determine core inflation
6) Global trade in services 16) Income shares: from labour to capital
7) Fading fiscal policy tailwinds 17) The corporate savings “glut”
8) Financial repression for decades 18) Global income distribution
9) Housing, globally, a good news story 19) Demographic Tectonics
10) Global liquidity & EM credit cycles 20) The long grinding cycle continues
Source: Macquarie Research, October 2016
Our Macq-ro insights series have been tackling these with an emphasis on quality data,
presented in numerous tables and charts.
Fig 65 Macq-ro insights 2016 publications
Date Title Topic Pages Data banks
12 Jan. Diminishing “Japanization” fears The revival of private sector credit demand in advanced economies
34 BIS domestic credit growth
21 Jan. The corporate savings ”glut” & cross-border M&A
Company cash-flow choices 16 Cross-border M&A (Factset, RECOF, Reuters, Datastream)
25 Jan. Global liquidity The credit down-cycle in emerging market economies 19 BIS cross-border debt
05 Feb. Global liquidity #2, ASEAN Contrasting today with the Asian Financial Crisis 24 ASEAN Economic Community
11 Feb. Oil & sovereign defaults A decade-long wave of defaults in the 1980s, then and now
19 CRAG sovereign defaults
26 Feb. The G-20 in Shanghai Policy coordination challenges 3
08 Apr What’s next for EM economies? An extended period of subdued growth 45 UNCTAD FDI, Conference Board productivity statistics
14 Apr. Global policy coordination dreams From fiscal stimulus to boosting consumption 24 BIS real residential property prices
9 May Global services: a new economic order The rise of services, now the key driver of global growth 34 ILO, UN: Labour/Services
20 May Income shares: from labour to capital A 5% shift over the last 35 years 21
28 June Brexit: stay calm and carry on Economic impacts: the UK, eurozone and beyond 8
18 July Fiscal winds of change Global fiscal policy tailwinds fade significantly from 2017 30 IMF, World Bank fiscal sustainability databases
22 July Residential investment, globally A good news story: around 4% of global GDP and will grow between 3.5% and 4.0% pa through 2020
58 Residential investment/GDP ratios, BIS price indices
26 July Financial Repression for decades A conscious policy choice to minimise public debt funding costs that began in Japan and is spreading to Europe
21 Global real interest rates, inflation-linked bonds
11 Aug. The Great Divergence: Inflation and Policy
Core inflation is determined by local factors, such that policy divergence is expected to persist
28 Model-based monetary policy rules
26-Aug Timing the exit from unconventional monetary policies: The ECB & BOJ
Using the US experience as a roadmap, but the analysis is complicated by relative fiscal reconstruction priorities
24
Source: Macquarie Research, October 2016
Short-term
business-cycle
judgements are
more likely to
succeed with a deep
awareness of more
medium and longer-
term issues
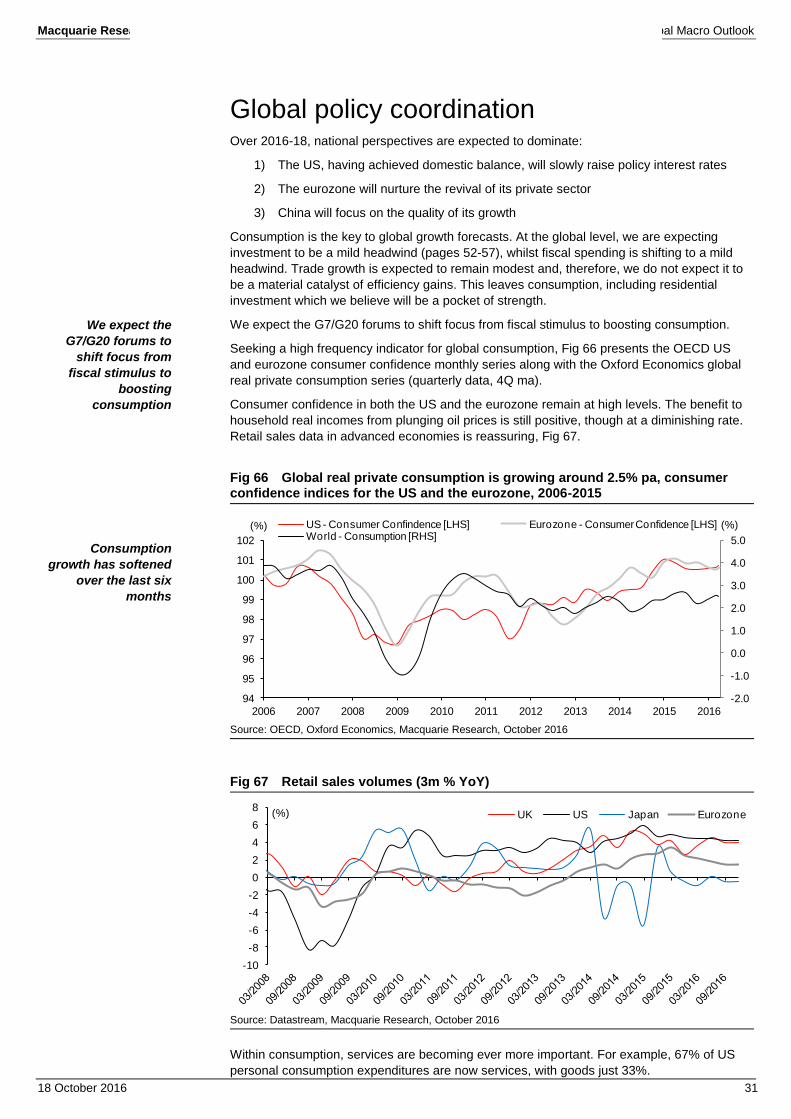
Macquarie Research The Global Macro Outlook
18 October 2016 31
Global policy coordination Over 2016-18, national perspectives are expected to dominate:
1) The US, having achieved domestic balance, will slowly raise policy interest rates
2) The eurozone will nurture the revival of its private sector
3) China will focus on the quality of its growth
Consumption is the key to global growth forecasts. At the global level, we are expecting
investment to be a mild headwind (pages 52-57), whilst fiscal spending is shifting to a mild
headwind. Trade growth is expected to remain modest and, therefore, we do not expect it to
be a material catalyst of efficiency gains. This leaves consumption, including residential
investment which we believe will be a pocket of strength.
We expect the G7/G20 forums to shift focus from fiscal stimulus to boosting consumption.
Seeking a high frequency indicator for global consumption, Fig 66 presents the OECD US
and eurozone consumer confidence monthly series along with the Oxford Economics global
real private consumption series (quarterly data, 4Q ma).
Consumer confidence in both the US and the eurozone remain at high levels. The benefit to
household real incomes from plunging oil prices is still positive, though at a diminishing rate.
Retail sales data in advanced economies is reassuring, Fig 67.
Fig 66 Global real private consumption is growing around 2.5% pa, consumer confidence indices for the US and the eurozone, 2006-2015
Source: OECD, Oxford Economics, Macquarie Research, October 2016
Fig 67 Retail sales volumes (3m % YoY)
Source: Datastream, Macquarie Research, October 2016
Within consumption, services are becoming ever more important. For example, 67% of US
personal consumption expenditures are now services, with goods just 33%.
-2.0
-1.0
0.0
1.0
2.0
3.0
4.0
5.0
94
95
96
97
98
99
100
101
102
2006 2007 2008 2009 2010 2011 2012 2013 2014 2015 2016
(%) US - Consumer Confindence [LHS] Eurozone - Consumer Confidence [LHS]World - Consumption [RHS]
(%)
-10
-8
-6
-4
-2
0
2
4
6
8(%) UK US Japan Eurozone
We expect the
G7/G20 forums to
shift focus from
fiscal stimulus to
boosting
consumption
Consumption
growth has softened
over the last six
months

Macquarie Research The Global Macro Outlook
18 October 2016 32
Global services The service sector has been understudied due to its relative stability. This is despite the
increasing role it is playing in the global economy as its share of output has grown steadily.
Over the past quarter century, ~1 billion new jobs have been created globally; ~75% of these
have been in services. This has caused services employment to rise from ~34% of the global
total in 1991 to ~46% in 2016, a gain of half a percentage point per year. Output data tells a
similar story, with the services share of GDP having risen steadily in both developed and
emerging markets over the past four decades, Fig 68.
Fig 68 Services as a share of GDP, 1970-2014: a secular shift to services
Source: United Nations, Macquarie Research, October 2016
These trends are likely to persist. Growth in per-capita incomes (particularly in EMs),
demographics (aging populations), and firmer relative trends in services inflation all suggest
services will form a greater share of consumer spending and total output in the years ahead.
Fig 69 Services become more important with a higher GDP per capita
Source: IMF, UN, Macquarie Research, October 2016
Country 1970 1975 1980 1985 1990 1995 2000 2005 2010 2014
change
1970 to
2014
change
1995 to
2014
Australia 53.8 57.1 56.9 60.0 66.3 67.8 70.2 69.1 69.0 70.1 16.4 2.3
Canada 59.4 58.7 58.3 61.4 65.8 66.4 64.5 65.8 70.8 69.9 10.5 3.5
France 59.9 62.9 65.2 67.9 69.6 72.7 74.3 76.6 78.6 78.9 19.0 6.1
Germany 48.9 55.2 56.8 59.0 61.1 66.0 68.0 69.8 69.1 69.0 20.1 2.9
Italy 53.4 55.4 57.4 62.4 65.6 67.6 70.0 71.9 73.7 74.3 21.0 6.7
Japan 49.8 54.6 58.1 59.4 59.6 65.2 67.3 70.6 71.3 72.0 22.2 6.8
Republic of Korea 41.2 40.9 46.3 49.5 51.6 54.6 57.5 59.4 59.3 59.4 18.2 4.8
Spain 47.8 49.4 55.0 59.4 60.5 65.1 65.1 66.5 71.4 75.1 27.3 9.9
United Kingdom 58.5 61.6 60.1 62.6 67.0 68.5 72.0 76.0 78.5 78.4 19.9 9.9
United States 65.5 66.5 67.2 70.0 72.6 74.5 76.3 77.5 78.8 78.4 12.9 3.9
DM average (level) 53.8 56.2 58.1 61.2 64.0 66.8 68.5 70.3 72.0 72.5 18.7 5.7
Argentina 48.1 47.0 55.1 56.1 59.1 68.3 69.2 56.9 60.9 63.0 14.8 -5.3
Brazil 52.6 48.9 49.2 46.7 52.9 68.5 67.7 65.9 67.8 71.0 18.4 2.5
China 24.7 22.2 21.8 29.0 32.0 33.3 39.5 40.9 43.7 47.7 23.0 14.3
India 32.5 34.4 33.9 35.9 36.6 39.1 44.2 46.4 48.2 53.0 20.5 13.8
Indonesia 40.1 40.9 37.7 47.1 47.9 47.6 42.9 44.8 41.8 43.3 3.3 -4.2
Mexico 54.1 53.5 49.5 46.8 53.0 57.9 57.1 58.1 58.3 59.0 4.9 1.1
Russian Federation 32.5 53.5 54.0 57.0 61.4 59.1 26.6 5.6
Saudi Arabia 36.8 27.3 27.8 55.2 45.7 45.5 41.5 35.0 39.2 40.6 3.7 -5.0
South Africa 54.4 51.0 45.7 51.5 55.4 61.3 64.8 67.1 67.2 68.0 13.6 6.8
Turkey 41.0 43.4 49.5 51.0 47.8 50.0 59.4 61.4 64.2 64.9 23.9 14.9
EM average 42.7 41.0 41.1 46.6 46.3 52.5 54.0 53.3 55.3 57.0 15.3 4.5
Emerging markets
Services share of GDP
Developed markets
$-
$10
$20
$30
$40
$50
$60
$70
40 45 50 55 60 65 70 75 80 85
GD
P p
er cap
ita (th
ou
san
ds) U
S$
Services share of output (%)
AUS
CAN
DEU
USA
GBR
FRA
ITAJPN
KOR
BRA
ZAF
TUR
ARG
MEX
RUS
IND
CHN
IDN
SAU
line of best fit
GDP per capita vs. services share of output (2014)
ESP
Over the past
quarter century ~1
billion new jobs
have been created
globally; ~75% of
these have been in
services
We expect services
will form a greater
share of consumer
spending and total
output in the years
ahead

Macquarie Research The Global Macro Outlook
18 October 2016 33
The rising importance of services has played a key role in our view that the current expansion
should continue to be characterized by structurally lower growth rates, but also by incredible
persistency and resiliency. We see five major implications:
1) Reduced volatility in economic growth
Services output is much less volatile than industrial output leading to more stable
employment trends. This also means that the business cycle will be less cyclical
supporting longer expansions and limiting the severity of downturns.
2) Central bank policy divergence and less inflation variability
The rise of services means that inflation prospects are going to be increasingly driven by
domestic forces, such as wage growth, and less by external factors such as commodity
prices and exchange rates. As a result, divergent domestic outlooks are likely to enable
desynchronized central bank policy.
Fig 70 US services inflation has shown far more stability relative to goods
Fig 71 ...and has been stronger on average with lower variation
Source: BEA, Macquarie Research, October 2016 Source: Bloomberg, Macquarie Research, October 2016
Fig 72 Euro area services inflation has shown greater stability than goods...
Fig 73 ...and a similar story in China, with services more stable and stronger than goods
Source: Bloomberg, Macquarie Research, October 2016 Source: Bloomberg, Macquarie Research, October 2016
-5%
-3%
-1%
1%
3%
5%
1991 1994 1997 2000 2003 2006 2009 2012 2015
US PCE price index YoY % change
services
goods
0.0%
0.5%
1.0%
1.5%
2.0%
2.5%
3.0%
3.5%
Average STDEV
Services
PCE price inflation descriptive statistics: 1991 to 2015
GoodsServices
Goods
-3
-2
-1
0
1
2
3
4
5
6
7
1991 1994 1997 2000 2003 2006 2009 2012 2015
services
goods
Euro area CPI price index YoY % change
-4
-2
0
2
4
6
8
10
12
2005 2006 2007 2008 2009 2010 2011 2012 2013 2014 2015 2016
goods
services
China CPI price index YoY % change
The current
expansion should
continue to be
characterized by
structurally lower
growth rates, but
also by incredible
persistency and
resiliency

Macquarie Research The Global Macro Outlook
18 October 2016 34
3) Increased trade in services
Trade in services has been rising rapidly worldwide, but a steep run-up in commodity
prices between 1998 and 2014 led to disproportionate gains in the trade of goods,
particularly from EM exports. Going forward, our expectation for a flatter commodity price
environment means that services exports are likely to make up a greater share of overall
export growth and rise in importance worldwide. Please see page 40.
4) Relative investment in IT and intellectual property
Service economies, which tend to be centred on knowledge-based industries, are
increasingly investing in IT and intellectual property relative to other investment areas. This
shift is likely to influence growth globally as these forms of investment tend to be less trade
dependent and contribute the majority of the economic benefit to the domestic economy.
Fig 74 Intellectual property products have risen to one-third of non-commodity US business investment
Fig 75 ...and the biggest increases have come from the R&D and software components
Source: BEA, Macquarie Research, October 2016 Source: BEA, Macquarie Research, October 2016
5) Lower productivity growth and real rates
The services sector has historically had lower productivity levels and growth rates than the
goods/manufacturing sector. A greater share of services employment and output will act as
a drag on productivity growth as a higher share of output will come from areas with lower
productivity growth.
In the years ahead, EMs are likely to continue to experience the strongest output gains as
productivity growth rates tend to be highest when countries undergo urbanization. This
allows workers with very low marginal productivity in the agricultural sector to be
redeployed into higher productivity employment in either the industrial/goods or service
sector.
0%
10%
20%
30%
40%
50%
60%
70%
80%
1959 1964 1969 1974 1979 1984 1989 1994 1999 2004 2009 2014
all other non-resi
investment
intellectual property
products
information processing
equipment
Share of US nonresidential private investment (ex mining and oil & gas)
0%
2%
4%
6%
8%
10%
12%
14%
16%
18%
20%
1959 1964 1969 1974 1979 1984 1989 1994 1999 2004 2009 2014
Share of US nonresidential private investment excl mining and oil & gas
Software
R&D
Enetertainment, literary, and
artistic orginals

Macquarie Research The Global Macro Outlook
18 October 2016 35
Innovation clusters, “Brainbelts” After a week visiting the Southern California brain belt bringing to life the book by Antoine van
Agtmael and Fred Bakker: The Smartest Places on Earth (2016), we are optimistic about a
new global growth engine.
The catalyst for the above book was the insight that “Making things cheap to gain an edge
over high-cost Western companies just wasn’t cutting it anymore. The days of the low-cost
advantage were essentially over”. This led to an understanding that cheap is giving way to
smart, where high value-added products are being created in collaborative environments, in
“brainbelts”. The latter, to quote Antoine van Agtmael and Fred Bakker are:
Research facilities with deep, specialist knowledge; educational institutions; government
support for basic research; appealing work and living environments; capital; and, most
important, the atmosphere of trust and the freedom of thinking that stimulates unorthodox
ideas and accepts failure as a necessary part of innovation – different from the hierarchical,
regimented thinking so prevalent in many Asian and MIST economies.
MIST stands for Mexico, Indonesia, South Korea and Turkey.
In addition to the brainbelts listed in Fig 76, Antoine van Agtmael and Fred Bakker identified
many others in their book, but virtually all were in North America and Europe.
Fig 76 “Brainbelts”: The Smartest Places on Earth
Country Region Name/place Focus Universities, research institutes, hospitals
United States: Well-known
California West Silicon Valley IT, bioscience, electric car, next gen bendable and wearable electronic devices
Stanford, University of California, Caltech
Massachusetts East Cambridge (and Route 128) Bioscience, robotics MIT, Harvard
Texas South Austin (Silicon Hills) Computers, new materials, bioscience University of Texas
Focus of the book
North Carolina South-East Durham-Raleigh-Chapel Hill (Research Triangle Park)
Bioscience, new materials, energy (LED) Duke, UNC, NC State
New York East Albany (Hudson Tech Valley) Semiconductors SUNY, RPI
Ohio Midwest Akron New materials, polymers University of Akron, Kent State
Minnesota Midwest Minneapolis-St.Paul Medical devices/bioscience University of Minnesota
Oregon West Portland (Silicon Forest) Bioscience OHSU
Northern Europe: in book
Netherlands Eindhoven (High Tech Campus)
Semiconductors. New materials Technical University
Sweden Lund-Malmo (Ideon) Life science, new materials Lund University
Finland Oulu (Technopolis) Medical instruments, wireless Oulu University
Germany Dresden (Silicon Saxony) Semiconductors Max Planck
Switzerland Zurich Life science Technical University
Note: from the book by Antoine van Agtmael and Fred Bakker: The Smartest Places on Earth (2016)
Source: Antoine van Agtmael and Fred Bakker above, Macquarie Research, October 2016
Beyond expensive, multidisciplinary, complex new product development, these innovation
clusters are also undertaking manufacturing, highly automated, custom runs, using 3-D
printers, produced in close proximity to the customer.
From an employment perspective, Antoine van Agtmael and Fred Bakker are optimistic, citing
Enrico Moretti’s book The New Geography of Jobs (2013).
For each new urban high-tech job there are five additional jobs created, three for
professionals and two for lower-wage non-professionals.
For each new urban
high-tech job there
are five additional
jobs created
Cheap is giving way
to smart, where high
value-added
products are being
created in
collaborative
environments, in
“brainbelts”

Macquarie Research The Global Macro Outlook
18 October 2016 36
The private sector’s appetite for credit Debt is not inherently a problem. Intermediated by the financial system, it is the main way that
savers earn returns. Savers, to be sustainably paid, however, require debt to be deployed into
debt-serviceable activities. We regard private sector non-financial credit growth broadly in line
with nominal GDP growth to be healthy.
The revival of private sector credit demand is a prerequisite for the successful withdrawal of
extraordinary central bank support for the economy.
In the case of Japan, the excess of credit growth over nominal GDP growth over the 1980s
“Bubble” was followed by a protracted period of balance sheet adjustment (credit growth
beneath nominal GDP growth, Fig.77). We believe Japan endured a vicious cycle of policy
and regulatory mistakes, which US policy avoided after the Global Financial Crisis, Fig.78.
Fig 77 Japan: private non-financial credit growth vs. Nominal GDP growth
Fig 78 US private sector nonfinancial credit is growing faster than GDP for the first time since 2008
Source: FRB of St Louis, Datastream, Macquarie Research, October 2016 Source: FRB of St. Louis, Macquarie Securities, October 2016
Nevertheless, even in the US it took four years between the year private sector credit growth
turned positive (2011) until it exceeded nominal GDP growth (2015).
The eurozone is behind the US because of the 2011-13 fiscal squeeze, Fig.79, such that
private sector credit growth double-dipped and has only gone positive again in 2015, four
years behind the US (2011), Fig.80.
Fig 79 The fiscal impulse: the eurozone’s 2011-13 fiscal squeeze
Fig 80 Euro Area: private nonfinancial credit growth vs. Nominal GDP growth
Note: Year-over-year change in the cyclically adjusted net lending (+) or net borrowing (-) of general government, adjusted based on potential GDP, excessive deficit procedure. Forecasts for 2015-17 from the European Commission. Source: EC Annual Macroeconomic Database, Macquarie Research, October 2016 Source: FRB of St Louis, Datastream, Macquarie Research, October 2016
-12
-9
-6
-3
0
3
6
1992 1993 1995 1997 1999 2001 2003 2005 2007 2009 2011 2013 2015
(YoY % change)
Private nonfinancial credit
Nominal GDP
late
-4
-2
0
2
4
6
8
10
12(YoY% change) Private nonfinancial credit
Nominal GDP
latest
-2
-1
0
1
2
2007 2008 2009 2010 2011 2012 2013 2014 2015 2016 2017
(% of potential GDP)
YoY change in cyclically adjusted budget balance
-6
-4
-2
0
2
4
6
8
10
12
14(YoY % change) Private nonfinancial credit
Nominal GDP
The case of Japan
The US
The eurozone

Macquarie Research The Global Macro Outlook
18 October 2016 37
The BIS Financial cycle
Claudio Borio in his December 2012 BIS working paper: The financial cycle and
macroeconomics: What have we learnt? (http://www.bis.org/publ/work395.pdf) detailed the
existence of financial cycles: “Arguably, the most parsimonious description of the financial
cycle is in terms of credit and property prices (Drehmann et al (2012)). These variables tend
to co-vary rather closely with each other, especially at low frequencies, confirming the
importance of credit in the financing of construction and the purchase of property.”
Like business cycles, financial cycles are not mechanistic, but do appear as patterns in the
data. One problem is that whilst business cycles average 3-4 years, financial cycles average
16. Averages are just that, so let's say 16 years plus or minus 5. A lot depends on how policy
responds in the business cycle downturns prior to the financial cycle's peak/bust. On average
there will be three prior business cycle downturns, and if policy aggressively counteracts them
then moral hazard/credit leverage builds. We believe the private sectors of the major
economies/blocs are at very different stages in this “financial cycle”, below. The credit cycle in
EM economies is examined on page 45.
Fig 81 BIS-defined 16-year private sector “financial cycle”
Source: Macquarie Research, October 2016
Fig 82 presents the last 35 years of financial history in one chart. The rise and fall in the ratio
of private non-financial credit/GDP has coincided with major events. China is included to put
the relentless rise in its private non-financial credit/GDP ratio into context. China’s corporate
debt issue is examined on page 47.
Fig 82 Private non-financial credit as a % of GDP: significant peaks*
Note: (*) 1) 1990 saw the start of Japan’s lost decade 2) 1995 was Mexico’s peso crisis 3) 1997 saw Thailand kick-off the Asian crisis 4) 2008 was the USA’s subprime crisis 5) 2011 was the start of the Euro crisis that included Spain
Source: The Economist, BIS, Macquarie Research, October 2016
0
50
100
150
200
250(% of GDP)
Japan US Spain Mexico Thailand China
Like business
cycles, financial
cycles are not
mechanistic, but do
appear as patterns
in the data
We believe the
private sectors of
the major
economies/blocs
are at very different
stages in this
“financial cycle”
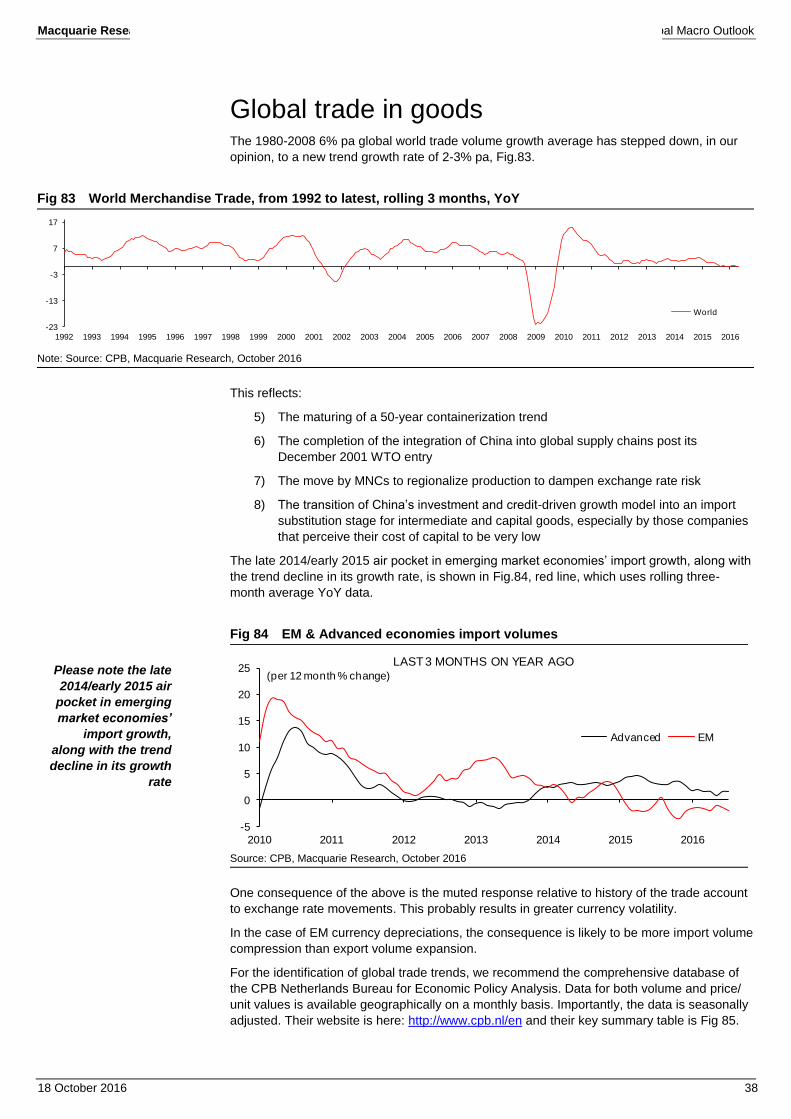
Macquarie Research The Global Macro Outlook
18 October 2016 38
Global trade in goods The 1980-2008 6% pa global world trade volume growth average has stepped down, in our
opinion, to a new trend growth rate of 2-3% pa, Fig.83.
Fig 83 World Merchandise Trade, from 1992 to latest, rolling 3 months, YoY
Note: Source: CPB, Macquarie Research, October 2016
This reflects:
5) The maturing of a 50-year containerization trend
6) The completion of the integration of China into global supply chains post its
December 2001 WTO entry
7) The move by MNCs to regionalize production to dampen exchange rate risk
8) The transition of China’s investment and credit-driven growth model into an import
substitution stage for intermediate and capital goods, especially by those companies
that perceive their cost of capital to be very low
The late 2014/early 2015 air pocket in emerging market economies’ import growth, along with
the trend decline in its growth rate, is shown in Fig.84, red line, which uses rolling three-
month average YoY data.
Fig 84 EM & Advanced economies import volumes
Source: CPB, Macquarie Research, October 2016
One consequence of the above is the muted response relative to history of the trade account
to exchange rate movements. This probably results in greater currency volatility.
In the case of EM currency depreciations, the consequence is likely to be more import volume
compression than export volume expansion.
For the identification of global trade trends, we recommend the comprehensive database of
the CPB Netherlands Bureau for Economic Policy Analysis. Data for both volume and price/
unit values is available geographically on a monthly basis. Importantly, the data is seasonally
adjusted. Their website is here: http://www.cpb.nl/en and their key summary table is Fig 85.
-23
-13
-3
7
17
1992 1993 1994 1995 1996 1997 1998 1999 2000 2001 2002 2003 2004 2005 2006 2007 2008 2009 2010 2011 2012 2013 2014 2015 2016
World
-5
0
5
10
15
20
25
2010 2011 2012 2013 2014 2015 2016
Advanced EM
(per 12 month % change)
LAST 3 MONTHS ON YEAR AGO
Please note the late
2014/early 2015 air
pocket in emerging
market economies’
import growth,
along with the trend
decline in its growth
rate

Macquarie Research The Global Macro Outlook
18 October 2016 39
For those interested in going deeper into last year’s developments in China, the May 2016
IMF working paper by Joong Shik Kang and Wei Liao: Chinese imports, What’s behind the
slowdown? provides a comprehensive analysis of recent trends in Chinese trade.
Fig 85 World merchandise trade (% changes) – latest month July 2016
YoY QoQ momentum (note #1) MoM
Volumes (s.a) 2013 2014 2015 2015q4 2016q1 2016q2 2016m06 2016m07 2016m05 2016m06 2016m07
World trade 2.6 2.9 1.6 0.6 0.0 -0.8 -0.8 -0.8 -0.4 0.8 -1.1
World imports 2.2 2.9 1.4 0.9 -0.5 -0.8 -0.9 -0.4 0.6 0.8 -1.2
Advanced economies 0.0 3.3 3.6 0.9 0.9 -0.7 -0.7 -0.6 -0.8 1.3 -0.6 US 0.7 5.1 6.2 0.1 0.2 -0.6 -0.7 0.4 0.7 1.6 -1.1 Japan 1.6 2.2 0.1 -0.9 0.9 -1.3 -1.3 1.5 5.0 0.4 -1.1 Eurozone -0.3 2.8 3.3 1.2 1.0 -1.8 -1.8 -1.6 -1.5 0.3 0.7 Other advanced economies -0.8 2.8 2.5 1.7 1.3 1.5 1.6 -0.6 -3.0 3.4 -2.3
Emerging economies 5.6 2.3 -1.7 0.9 -2.4 -1.0 -1.2 0.0 2.7 0.0 -2.1 Asia 6.6 3.8 -1.0 0.6 -3.1 -0.1 -0.2 1.6 5.3 -1.3 -2.1 Central & Eastern Europe -2.1 -12.0 -25.1 1.4 6.9 -0.3 -0.6 -1.6 -1.3 1.0 -2.1 Latin America 5.2 3.0 -0.8 1.1 -2.1 -2.2 -2.1 -3.8 -5.3 5.8 -3.9 Africa & Middle East 4.9 0.3 5.6 2.1 -2.4 -5.6 -6.3 -3.5 -0.9 1.0 0.1
World exports 2.9 2.9 1.8 0.4 0.3 -0.7 -0.7 -1.2 -1.3 0.9 -0.9
Advanced economies 1.7 2.0 2.0 0.8 -0.3 -0.7 -0.6 -1.2 -1.8 0.9 -0.5 US 2.6 3.2 -1.1 -1.3 -0.8 0.4 0.4 0.1 -1.3 0.1 2.8 Japan -1.4 1.7 2.7 1.7 -0.1 1.0 1.0 1.1 0.0 4.2 -3.2 Eurozone 0.6 2.0 2.4 1.5 0.4 -0.7 -0.5 -1.5 -1.9 0.5 -0.7 Other advanced economies 5.1 1.2 3.3 0.7 -1.5 -2.5 -2.1 -2.7 -2.7 1.2 -1.2
Emerging economies 4.4 3.9 1.5 -0.1 1.0 -0.6 -0.9 -1.1 -0.7 0.8 -1.4 Asia 6.0 4.6 0.2 -0.5 1.1 -0.7 -1.0 -1.5 -0.9 0.6 -1.9 Central & Eastern Europe 0.1 -0.8 -0.4 3.6 -1.9 1.4 0.8 0.3 -0.4 1.4 -0.3 Latin America 2.4 5.2 9.8 1.2 4.0 -4.1 -4.2 -4.4 -2.1 1.6 -1.8 Africa & Middle East -0.6 1.1 2.8 -0.6 -1.0 2.8 2.8 3.9 2.3 0.6 0.8
Prices/unit values US$ (s.a.)
World trade -1.0 -1.8 -13.4 -2.9 -2.9 2.9 3.1 2.0 0.2 0.9 -1.0
World imports -1.3 -1.7 -13.2 -3.2 -2.5 2.7 2.9 1.6 -0.1 0.8 -1.4
Advanced economies -0.6 -1.2 -14.1 -2.8 -2.8 2.5 2.5 1.1 0.0 0.5 -1.8 US -1.1 -1.1 -10.2 -2.4 -2.5 1.8 1.8 2.3 1.2 0.7 0.1 Japan -7.3 -4.7 -20.2 -5.6 -3.4 2.1 2.1 1.9 -3.0 3.5 1.0 Eurozone 1.8 -1.5 -17.4 -2.7 -1.7 3.0 3.0 1.3 0.1 0.5 -1.8 Other advanced economies -2.3 0.8 -9.4 -2.6 -5.1 2.5 2.4 -0.6 -0.3 -0.7 -4.5
Emerging economies -2.4 -2.3 -11.6 -3.8 -2.0 3.1 3.4 2.3 -0.2 1.2 -0.8 Asia -3.5 -3.0 -12.2 -3.4 -2.5 4.0 4.0 2.6 -0.7 2.0 -0.7 Central & Eastern Europe 1.3 -1.7 -12.6 -11.2 12.3 -5.5 -6.1 -5.9 -1.7 0.5 -5.8 Latin America -1.5 -2.8 -9.6 -5.1 -1.4 1.2 1.3 2.1 1.1 0.4 -0.9 Africa & Middle East 0.7 2.2 -11.3 -2.3 -3.7 4.5 6.7 3.7 2.1 -1.7 0.0
World exports -0.6 -1.9 -13.6 -2.5 -3.3 3.1 3.2 2.4 0.5 1.0 -0.6
Advanced economies 0.3 -0.8 -12.9 -2.5 -1.9 2.7 2.6 1.5 0.3 0.3 -1.2 US -0.4 -0.5 -6.3 -1.9 -2.2 1.3 1.3 1.9 1.1 0.7 0.2 Japan -9.1 -5.2 -11.9 -3.4 0.6 2.7 2.7 3.0 -0.7 0.8 2.9 Eurozone 3.0 -0.1 -15.3 -2.0 -0.9 2.8 2.8 1.1 0.1 0.2 -1.5 Other advanced economies -1.8 -0.9 -12.9 -3.7 -4.7 3.6 3.2 1.3 0.7 0.1 -3.5
Emerging economies -1.8 -3.2 -14.3 -2.5 -5.0 3.6 4.0 3.5 0.7 1.9 0.0 Asia -1.2 -1.2 -5.8 -0.8 -3.4 1.5 1.8 1.5 -0.2 1.4 0.3 Central & Eastern Europe -2.8 -5.3 -31.8 -8.5 -9.8 1.4 1.6 2.8 0.2 7.2 -3.5 Latin America -2.1 -6.3 -19.7 -3.0 -5.5 4.2 4.4 3.9 0.7 -0.2 1.1 Africa & Middle East -0.7 -6.9 -38.7 -10.3 -14.4 23.5 26.6 22.2 9.1 5.0 -0.9
World prices/unit values in US$
Fuels (HWWI) 1.5 -6.8 -44.1 -13.8 -20.3 28.9 28.9 24.7 10.8 7.0 -4.9 Primary commodities ex fuels -6.6 -9.2 -22.8 -6.2 -1.2 10.2 10.2 6.6 0.8 1.2 0.7
Notes: (#1): average of the three months up to the report month over average of the preceding three months
Source: CPB, Macquarie Research, October 2016

Macquarie Research The Global Macro Outlook
18 October 2016 40
Global trade in services The share of global trade in services has been flat for close to 20 years, Fig 86, as much of
the delta in global trade growth has come from EM goods.
The result of this development is that services have become far less trade-intensive relative
to goods. To provide some context, the average dollar value of world exports per employee in
the goods sector is ~$11,000, nearly 3x the same figure for the services sector, Fig 87. This
represents a significant increase from just ~2x in 1991.
Fig 86 Flat global services export share, 1982-2015 Fig 87 A higher trade intensity in goods
Source: WTO, Macquarie Research, October 2016 Source: WTO, Macquarie Research, October 2016
Partially fuelled by a boom in commodity prices from 1998 to 2014, global trade growth has
been increasingly driven by EMs, where exports are more concentrated in goods. We believe
this contributed to outsized gains in the exports of goods.
Prior to 1998, growth in services exports for both EMs and DMs outpaced the growth in goods
(Fig 88) whereas after 1998 EM goods exports outperformed (Fig 89).
Fig 88 Services trade outperformed from 86 to 98 … Fig 89 Underperformed during the commodity boom
Source: WTO, Macquarie Research, October 2016 Source: WTO, Macquarie Research, October 2016
Going forward, it may be many years before there is another commodity boom. As a result,
global trade growth is likely to come increasingly from services.
Policymakers are already showing signs of awareness on this front. Recent trade
agreements, such as the Trans-Pacific Partnership, have chapters dedicated specifically to
liberalizing the trade in services and removing barriers.
5%
10%
15%
20%
25%
30%
1982 1987 1992 1997 2002 2007 2012
Share of exports that are services (USD basis)
G20-DM
G20-EM
world
$-
$2,000
$4,000
$6,000
$8,000
$10,000
$12,000
1991 1994 1997 2000 2003 2006 2009 2012
goods
services
World exports (USD basis) per employee
0
1
2
3
4
5
1982 1984 1986 1988 1990 1992 1994 1996 1998
Export growth - G20 countries (1982= 1.00)
EM services
DM services
DM goods
EM goods
1982 = 1.00
During flat commodity price period EM service
exports outperformed
0
1
2
3
4
5
6
7
8
1998 2000 2002 2004 2006 2008 2010 2012 2014
DM goods
Export growth - G20 countries (1998 = 1.00)
EM goods
EM services
DM services
1998 = 1.00
During commodity boom EM goods
exports outperformed
The share of global
trade in services
has been flat for
close to 20 years
Going forwards,
global trade growth
is likely to come
increasingly from
services

Macquarie Research The Global Macro Outlook
18 October 2016 41
Fading fiscal policy tailwinds In the immediate aftermath of the global financial crisis (GFC), global fiscal policy was very
expansionary, with global budget deficits widening by nearly 2% of GDP in 2008 and a further
5% of GDP in 2009, Fig 90. Aggregate revenue weakness was accommodated and spending
was increased. However, the fiscal expansion was tempered from 2010, when global budget
balances improved by 1% of GDP (each) in 2010 and 2011, as economies began reloading
their fiscal arsenal.
This continued, albeit less aggressively, in 2012-13, with an average improvement of 0.7%
of GDP per year. From 2014-16, however, aggregate fiscal budget balances deteriorated
modestly (on average by 0.2% of GDP per year), as the global economic recovery became
less sure-footed and put pressure on developing economy tax revenues in particular. Global
fiscal policy has now reached an inflexion point again, as it is forecast to become a
significantly weaker cyclical tailwind, with aggregate budget balances forecast to improve
modestly (by around 0.5% of GDP each in 2017 and 2018).
Fig 90 Advanced versus developing countries: primary budget balances
Source: IMF, Macquarie Research, October 2016
Fig 91 Budget balance 2016 and change to 2017
Source: IMF, Macquarie Research, October 2016
-6.00
-5.00
-4.00
-3.00
-2.00
-1.00
0.00
1.00
2.00
3.00
% of GDP, YoY change
Advanced weighted Developing economies (weighted)
Philippines
Hungary
Mauritius
Thailand
Indonesia SingaporeIsrael Chile
Brazil SAUSNZ
IndiaChinaNigeria
Croatia
MalaysiaMexico
TurkeyCanada
Ireland
Japan Australia
ArgentinaUK
EgyptRussia
Swaziland
Namibia
-0.5
0.0
0.5
1.0
1.5
2.0
-12 -10 -8 -6 -4 -2 0 2
2017 - 2016 (% of GDP)
(2016, % of GDP)
Fiscal headwind that fades
Fiscal tailwind that intensifies
Fiscal tailwind that fades
Global fiscal policy
has now reached an
inflexion point, as it
is forecast to
become a
significantly weaker
cyclical tailwind,
with aggregate
budget balances
forecast to improve
modestly (by around
0.5% of GDP each in
2017 and 2018)
Those countries
with larger budget
deficits (horizontal
scale) are forecast,
on average, to see
the biggest
improvements
(reduction in the
budget deficit) 2017
versus 2016
(vertical scale)

Macquarie Research The Global Macro Outlook
18 October 2016 42
Financial repression for decades We disagree that record low bond yields are signalling a global slump. Rather, we believe that
it is a conscious policy choice to minimise public debt funding costs that began in Japan and
is spreading to Europe. Nonetheless, budget realities, below, will leave government
investment expenditure under pressure. The secular trends of privatisation and public-private
infrastructure partnerships are expected to continue.
Fig 92 G7 public debt/GDP ratios, %
2007 2016E 2020E
Gross Net Gross Net Gross Net
US 64.0 44.5 107.5 82.2 106.1 81.4 Japan 183.0 80.5 249.3 129.6 251.8 132.2 Germany 63.6 48.1 68.2 46.7 58.4 39.1 UK 43.5 38.2 89.1 80.6 79.4 70.8 France 64.2 57.7 98.2 90.5 95.4 87.7 Italy 99.8 84.1 133.0 111.8 124.2 104.4 Canada 66.8 22.1 92.3 27.5 83.4 18.6
G7 81.1 52.1 120.1 84.4 115.8 81.3 Euro area 64.9 45.5 92.5 69.3 85.5 64.3
Note. 2016 and 2020 estimates IMF. Source: IMF, Macquarie Research, October 2016
Fig 93 10-Advanced economies: Government investment to GDP ratio
Note: 10-Advanced economies are US, Japan, Germany, France, Italy, Spain, UK, Australia, Canada, and South Korea. Oxford Economics’ forecasts. Source: Oxford Economics, Macquarie Research, October 2016
The principal driver of record low bond yields since 2009 has evolved, from cyclical
factors (secular stagnation), through a private sector balance sheet recession (completed in
the US and Japan; ongoing, but progressing in the eurozone) to fiscal reconstruction
(reloading the fiscal policy tool weapon) using the seductive tool of financial repression.
Fig 94 10-year real bond yields, G7 ex Italy, 1985-2013, quarterly, %
Note: National Bureau of Economic research (NBER) working paper “Measuring the world interest rate” by Mervyn King & David Low (2014) The US enters the sample in 1999 with the first TIPS issue.
Source: NBER above, Macquarie Research, October 2016
3.0
3.3
3.6
3.9
4.2
4.5
2000 2002 2004 2006 2008 2010 2012 2014 2016 2018 2020
10-Total
-1
0
1
2
3
4
5
6
1985 1987 1989 1991 1993 1995 1997 1999 2001 2003 2005 2007 2009 2011 2013
(%) Weighted real rate Unweighted real rate
We disagree that
record low bond
yields are signalling
a global slump
Rather, we believe
that it is a
conscious policy
choice to minimise
public debt funding
costs that began in
Japan and is
spreading to Europe
The principal driver
of record low bond
yields since 2009
has evolved
...to fiscal
reconstruction
(reloading the fiscal
policy tool weapon)
using the seductive
tool of financial
repression

Macquarie Research The Global Macro Outlook
18 October 2016 43
Japan illustrates well the pressures being faced by policymakers.
Japan’s public debt to GDP ratio built over the 24 years 1990-2014 from around 65% to
240%. Only in 2006 and 2007 did the ratio decline. Japan’s public debt to GDP has far
exceeded the previous high in 1945, Fig 95.
Please note, however, that Japan’s public debt ratio has stabilised over the last few years.
Fig 95 Japan’s gross government debt, as a percentage of GDP
Source: IMF, Datastream, Macquarie Research, October 2016
Japan’s considerable progress over the last three years towards stabilizing its public debt to
GDP ratio can be illustrated by using the formula for the primary budget balance necessary
for stabilization:
(Bond yields minus nominal GDP growth) x (Public debt/GDP)
In 2012, Japan needed a primary budget surplus of 2.4% (1% minus 0% times 2.4).
Today, thanks to the consequences of financial recession, Japan only needs a primary
budget deficit of 2.4% (zero minus 1% times 2.4) to stabilize the public debt to GDP ratio.
That’s a 4.8% of GDP swing. There is no “free lunch,” however.
An implicit tax on savers resulting in weak consumption
Savings behaviour is not mechanical, but the hypothesis that households smooth their
consumption by saving for retirement seems to work well in practice. Reducing the returns on
savings leads to higher required savings. The implicit tax on savings leads to weak
consumption. If consumption stagnates, companies do not invest and do not raise wages.
Achieving fiscal reconstruction with financial repression, in the context of very high (around
250% of GDP) household financial assets, has led Japan into a low growth trap.
Fig 96 Household saving rate, 1990 to latest
Source: Datastream, Macquarie Research, October 2016
0
50
100
150
200
250
1875 1885 1895 1905 1915 1925 1935 1945 1955 1965 1975 1985 1995 2005 2015
Gross government debt(as % of GDP)
Gross government debt (as % of GDP)
Bubble bursts
1936 Takahashi assassinated for trying to
rein in military expenditures
(%)
-5
0
5
10
15
20
1990 1992 1995 1997 2000 2002 2005 2007 2010 2012 2015
Housholds saving rate(%, seasonally adjusted, 6m average)
Japan’s public debt
ratio has stabilised
If consumption
stagnates,
companies do not
invest and do not
raise wages

Macquarie Research The Global Macro Outlook
18 October 2016 44
Housing, globally, a good news story Private sector credit growth needs to revive for central banks to end their extraordinary
support. A recovery in home loan demand could be the key driver. Home loans are on
average ~40% of total loans.
A good news story: We believe residential investment is around 4% of global GDP and will
grow between 3.5% and 4.0% pa through 2020. The latter is supported by recovery in many
advanced economies, whilst financial deepening and the upgrading of the housing stock
underpin growth in EM economies. There are exceptions.
Housing is a lead indicator and an important driver of the business cycle, as well as being
intertwined with credit growth and financial stability. Nonetheless, there is a paucity of globally
consistent data.
Fig 97 10-Advanced economies residential investment to GDP ratio
Note: 10-Advanced economies are US, Japan, Germany, France, Italy, Spain, UK, Australia, Canada, and South Korea. Source: IMF, National sources, Oxford Economics, Macquarie Research, October 2016
The 22 July 2016 Macq-ro insights: Residential investment, globally looked at residential
investment data and residential price trends across 23 countries. The key observations are
summarized below.
Fig 98 Key residential investment observations
Country
USA 10% pa real growth through 2019 would only return residential investment/GDP to the post-1970 average level
France Germany has been recovering since 2010, whilst France is still at cyclical lows. We believe a mild recovery is beginning
Japan The Affluent Elderly is supporting renovation and reform, with the upgrading of the housing stock a major government priority
China Due to lower mortgage rates and aggressive policy relaxation, 2016 will be remembered as a year of a property up-cycle like 2013. From a long-term perspective, we believe China’s housing demand has peaked
Source: Macquarie Research, September 2016
Fig 99 Residential investment to GDP ratio for Germany and France
Source: Oxford Economics, Macquarie Research, October 2016
3.5
4.0
4.5
5.0
5.5
6.0
2000 2001 2002 2003 2004 2005 2006 2007 2008 2009 2010 2011 2012 2013 2014 2015 2016 2017 2018 2019 2020
10-Total
4.0
5.0
6.0
7.0
8.0
9.0
10.0 (%) Germany residential investment - % share of GDP
France residential investment - % share of GDP
Residential
investment is
around 4% of global
GDP and will grow
between 3.5%-4.0%
pa through 2020
Recovery in many
advanced
economies...
Financial deepening
and the upgrading
of the housing stock
underpin growth in
EM economies
We looked at
residential
investment data and
residential price
trends across 23
countries

Macquarie Research The Global Macro Outlook
18 October 2016 45
Global liquidity & EM credit cycles Global liquidity, as defined by the BIS, is the ease of financing by companies in international
markets.
Global liquidity moves in irregular and powerful waves, appearing to be stronger when the
US$ is depreciating, and weaker when the US$ is appreciating, chart below.
Fig 100 Cumulative flows, gross, in US$-denominated cross-border loans outside the US (US$tr): The dark shaded areas indicate depreciations in the US dollar effective exchange rate
Sources: S Avdjiev, C Koch and H S Shin “Exchange rates and foreign borrowing in international currencies” (2015, in progress); BIS effective exchange rate statistics; BIS locational banking statistics by residence. In addition to cross-border bank loans shown above, the BIS include bond issues in their total debt data
Source: BIS as noted above, Macquarie Research, October 2016
Swings in global liquidity are associated with credit booms and subsequent financial
vulnerability in emerging market economies (EMEs). Into the credit-growth contraction phase
across EMEs, we expect 2016 to see some major debt restructurings, but no cascading
cross-border banking crisis.
This will provide opportunities for well-funded MNCs. Please see the 21 January 2016 Macq-
ro insights: The corporate savings “glut” & cross-border M&A.
We believe the EM private non-financial credit cycle peaked with the May-June 2013 ‘taper
tantrum’. However, the following three charts on the next page suggest that this could be
optimistic as private sector credit ratios are still increasing in most EMEs.
The distribution of debt by currency and sectors
We believe that within foreign currency denominated debt, private sector debt is more
vulnerable to destabilization than sovereign debt (the government sector), Fig 101. For more
comprehensive tables, please see the 25 January 2016 Macq-ro insights: Global liquidity.
Fig 101 Key debt ratios, % of GDP
Singapore Malaysia Thailand Indonesia China Brazil S. Korea
External debt1/GDP NA 40 NA 32 10 31 13
US$-denominated corporate debt2/GDP
NA 6 NA 12 8 9 8
Corporate debt2/GDP 82 64 51 23 157 49 105
Notes: (1): all sectors, all currencies, (2): non-financial corporate debt
Source: BIS, Macquarie Research October 2016
Chinese corporate debt is examined in the next section.
Global liquidity, as
defined by the BIS,
is the ease of
financing by
companies in
international
markets
We believe the EM
private non-financial
credit cycle peaked
with the May-June
2013 ‘taper tantrum’
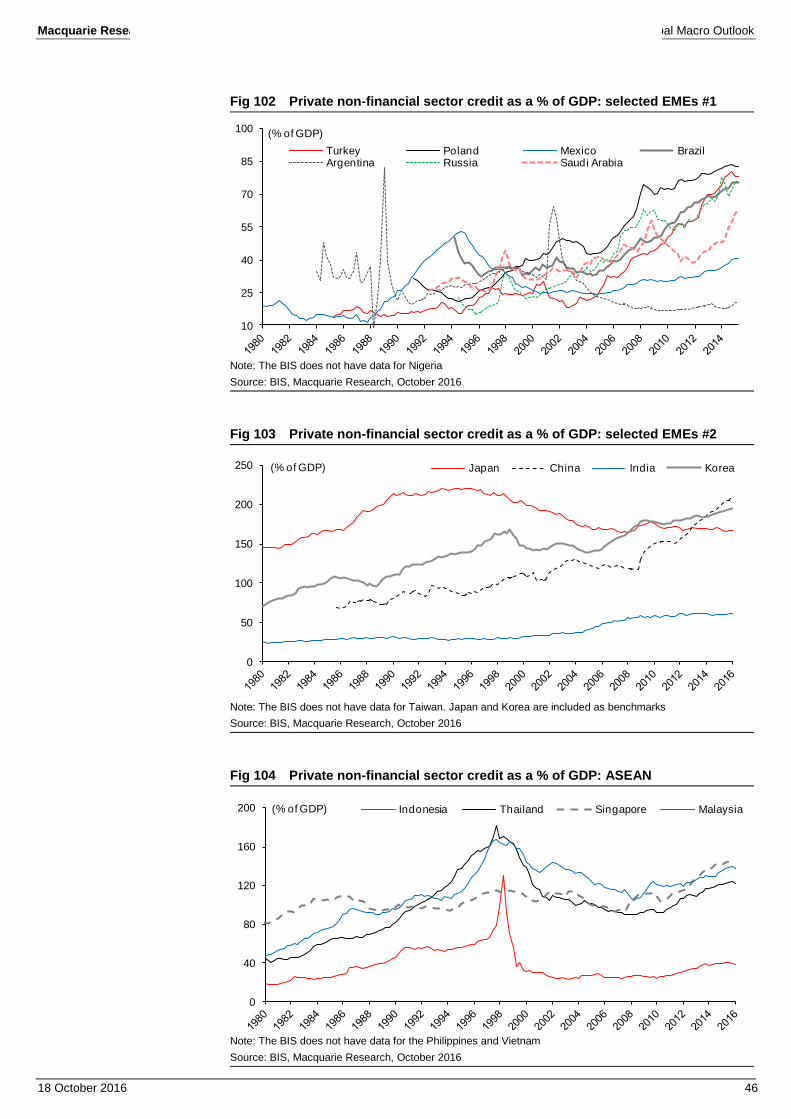
Macquarie Research The Global Macro Outlook
18 October 2016 46
Fig 102 Private non-financial sector credit as a % of GDP: selected EMEs #1
Note: The BIS does not have data for Nigeria
Source: BIS, Macquarie Research, October 2016
Fig 103 Private non-financial sector credit as a % of GDP: selected EMEs #2
Note: The BIS does not have data for Taiwan. Japan and Korea are included as benchmarks
Source: BIS, Macquarie Research, October 2016
Fig 104 Private non-financial sector credit as a % of GDP: ASEAN
Note: The BIS does not have data for the Philippines and Vietnam
Source: BIS, Macquarie Research, October 2016
10
25
40
55
70
85
100 (% of GDP)
Turkey Poland Mexico BrazilArgentina Russia Saudi Arabia
0
50
100
150
200
250 (% of GDP) Japan China India Korea
0
40
80
120
160
200 (% of GDP) Indonesia Thailand Singapore Malaysia

Macquarie Research The Global Macro Outlook
18 October 2016 47
Chinese corporate debt Please see Fig 82 on page 37 and Fig 101 on page 45 for context. For more details, please
see Larry Hu’s 8 June 2016 China’s debt: Myths and Realities.
It’s popular to argue that China will run into a debt crisis in either local government debt or
corporate debt. By contrast, our long-held view is that China’s debt problem is very different
from many other countries. The risk of a debt crisis is small because policy-makers could
reshuffle debt among different entities: central government, local government, SOEs and
banks. In 2015, China’s total government debt was RMB37tn, of which RMB27tn was owned
by local governments, Fig 105 and Fig 106). Since last year, China has conducted local
government debt swaps, which essentially converts local government debt to sovereign debt.
Banks also share the costs by swapping loans to bonds, which are safe but offer lower yields.
Fig 105 Corporate leverage is high in China
Fig 106 China’s debt breakdown
Source: CEIC, Macquarie Research, October 2016 Source: CEIC, Macquarie Research, October 2016
In 2015, China’s total corporate debt was RMB106tn, or 157% of GDP. While it’s large, over
70% of China’s corporate debt is owned by SOEs. The discussion on debt/equity swap
suggests that it’s possible to transfer the SOE debt burden to governments and banks. By
doing so, the government also lowers the odds for a corporate debt crisis.
Fig 107 Annual new loans vs. interest payments Fig 108 Leverage ratio: SOE vs. private enterprises
Source: CEIC, Macquarie Research, October 2016 Source: CEIC, Macquarie Research, October 2016
In our view, the real risk behind China’s debt is capital misallocation, as the majority of credit
is poured to the less-efficient SOEs and local governments rather than the private sector. The
debt swap for local governments and SOEs could worsen the problem if it is not designed
well, as it could delay the exit of inefficient firms and worsen the soft budget constrains for
SOEs. Such capital misallocation could undermine China’s potential growth in the long run,
causing the country to become stuck in the so-called “middle-income trap”.
0
20
40
60
80
100
120
Non-financial corporate Government Households
RMB tn China's debt breakdown
SOE
Private enterprise
Local govt
Central govt
11 13 14 15 17 21 24 32 40 46 5462 70 76
2 3 3 4 5 6 79
1214
18
2125
30
1 2 2 2 23
4
6
89
10
13
15
19
2 2 2 3 45
5
6
7
7
8
9
10
11
1 2 2 3 45
6
9
11
13
16
20
24
27
0
20
40
60
80
100
120
140
160
180 SOE debt
Private corporate debt
Household debt
Central governmt debt
Local government debt
RMB tn
5
10
87
89
10
12
2 23
44
56 6
0
2
4
6
8
10
12
14
20
08
20
09
20
10
20
11
20
12
20
13
20
14
20
15
Annual new loans
Loan interest payment
RMB tn
50
52
54
56
58
60
62
64
1999
2000
2001
2002
2003
2004
2005
2006
2007
2008
2009
2010
2011
2012
2013
2014
SOE
Private enterprise
% Industrial enterprise: Debt-to-assets ratio
Government debt
Corporate debt
Capital misallocation

Macquarie Research The Global Macro Outlook
18 October 2016 48
Fig 109 Gross fixed capital formation, % of GDP, 1970-2015
Note: Latest data for Thailand is 2014.
Source: CAO, World Bank, Macquarie Research, October 2016
During the Asian Financial Crisis, the average step-down in gross capital formation to GDP,
1996-98, for Malaysia, Thailand, Indonesia and Korea was approximately 14%. The catalyst
was a hard-stop by capital providers, cross-border bank lending. The equivalent today in
China would be a hard-stop of capital provision by the household sector, i.e. bank deposits
leaving the Chinese banking system en masse.
Fig 110 Core debt of the non-financial sectors, as a % of GDP
Level in 2014 Change since end-2007 (1)
Households Corporate Government Total Households Corporate Government Total
Advanced economies (2) 73 81 110 265 -7 1 41 36
Australia 119 77 35 230 11 -4 26 33
Canada 93 104 70 267 15 15 19 49
France 56 124 109 288 10 20 43 72
Germany 54 54 82 191 -7 -1 18 10
Italy 43 78 151 272 5 3 46 53
Japan 66 105 222 393 0 5 72 77
Spain 71 111 110 293 -10 -14 74 50
Sweden 83 165 47 295 18 27 7 52
Switzerland 120 91 34 245 13 15 -4 26
United Kingdom 87 77 107 271 -9 -11 61 41
United States 78 69 92 239 -18 -1 39 21
Eurozone 61 103 106 270 1 4 39 45
Emerging market economies (2) 30 94 44 167 10 35 4 50
Argentina (3) 6 9 43 58 2 -1 -1 -1
Brazil (4) 25 49 64 139 12 18 1 32
China 36 157 41 235 17 58 6 82
Hong Kong SAR 66 217 5 287 14 85 3 103
India 9 50 66 125 -1 8 -8 -1
Indonesia 17 23 25 64 6 8 -8 5
Korea 84 105 38 228 12 14 14 40
Malaysia (3) 69 64 53 186 15 4 13 32
Mexico 15 22 33 70 1 7 13 21
Russia (3) 20 58 18 95 8 16 9 33
Singapore 61 82 99 242 22 24 13 59
South Africa 37 33 55 125 -4 -2 23 17
Thailand 69 51 30 151 25 5 7 37
Turkey 21 33 34 108 9 28 -8 30
Notes: (1): in percentage points of GDP. (2): weighted average of the economies listed based on rolling GDP and PPP exchange rates. (3): breakdown of household and corporate debt is estimated based on bank credit data. Please note that Government debt data is the BIS core debt (credit to the government) at market values except for countries where only nominal values are available.
Source: BIS, Macquarie Research October 2016
10
20
30
40
50
1970
1972
1974
1976
1978
1980
1982
1984
1986
1988
1990
1992
1994
1996
1998
2000
2002
2004
2006
2008
2010
2012
2014
(% of GDP) Malaysia Thailand Indonesia Korea
The Asian Financial
Crisis

Macquarie Research The Global Macro Outlook
18 October 2016 49
Oil & sovereign defaults The last great collapse in oil and commodity prices from the end of the 1970s led to a
decade-long wave of sovereign defaults, below. The defaults data is available both by creditor
and defaulting country, below.
Fig 111 Sovereign debt default as a share of world public debt and world GDP
Source: CRAG, Macquarie Securities, October 2016
Fig 112 Total sovereign debt in default, by creditor
Source: CRAG, Macquarie Securities, October 2016
In the 1980s, there was a reluctance to address the fiscal deficits that resulted from less tax
revenues from lower oil and commodity prices. Fifteen countries saw an increase of public
debt to GDP in excess of 40%. With global capital markets up until 1980 consisting largely of
fixed exchange rates and national controls on capital flows, falling exports led to current
account deficits and persistent forex reserves erosion, Fig 113.
Fig 113 Foreign exchange reserves, in US$, the 1980s and now
1980 forex reserves
as a % of GDP Decline in forex reserves,
start 1980 to 1980s low End-2015 reserves
as a % of GDP
Forex reserves to GDP difference:
2015 vs 1980
Nigeria 4.9 -93% 5.9 1.0 South Africa 8.2 -79% 14.4 6.2 Argentina 3.9 -77% 4.4 0.5 Saudi Arabia 10.1 -66% 98.6 88.5 Brazil 5.8 -64% 19.8 14.0 Colombia 9.1 -64% 17.0 7.9 Indonesia 4.9 -38% 12.1 7.3 Malaysia 14.3 -23% 27.7 13.4 Venezuela 10.4 -15% 12.4 2.0
Note: The above does not include an analysis of forward book positions, which is important for sum including
Brazil. Source: IMF/Oxford Economics/Haver, Macquarie Research, October 2016
0
1
2
3
4
5
6
71980
1981
1982
1983
1984
1985
1986
1987
1988
1989
1990
1991
1992
1993
1994
1995
1996
1997
1998
1999
2000
2001
2002
2003
2004
2005
2006
2007
2008
2009
2010
2011
2012
2013
2014
(%) % of World Public Debt % of Gross World Product
0
100
200
300
400
500 US$bnIMF World Bank Paris Club Other official creditorsPrivate creditors FC Bank Loans FC Bonds LC Debt
Falling exports led
to current account
deficits and
persistent forex
reserves erosion
A decade-long wave
of sovereign
defaults

Macquarie Research The Global Macro Outlook
18 October 2016 50
Whilst this time, greater exchange rate flexibility is absorbing some of the risk related to
capital flight, Fig 114, cross-border capital account flows are enormously more important.
The decade from 2011
For countries with a high export dependency on oil and commodities, the decade from 2011
could evolve as follows:
1) A major fall in export revenues leading to a current account deficit, and the policy
decision to allow the currency to depreciate.
2) The latter could be of the order of 30-50%, chart below, causing a significant
increase in inflation, and the need for nominal local interest rates to increase.
Fig 114 Emerging Market currencies (nominal)
Note: Latest data point: June 2016
Source: Bloomberg, Macquarie Research, October 2016
3) Initially, there is a reluctance to increase policy interest rates rapidly given concerns
for economic growth, but capital outflows and an increase in sovereign risk spreads
lead to a tightening of monetary policy.
4) The fiscal position deteriorates with a fall in oil- and commodity-related taxes, and the
weakening economy. The initial reluctance to cut public expenditures is reinforced by
the tightening of monetary policy’s negative impact on economic growth, and the
escalating debt service costs.
At this point, fiscal deficits become persistent.
The ratio of public debt to GDP begins to trend higher.
The following formula gives the primary budget balance (excludes interest expense)
necessary for public debt/GDP stabilization:
(Bond yields minus nominal GDP growth) x (Public debt/GDP)
For example, 10% bond yields, nominal GDP growth of 5% and a public debt/GDP ratio of 50%
would require a primary budget balance of 2.5% of GDP (a surplus).
As the public debt/GDP ratio rises over time, then the required primary budget balance
becomes bigger, e.g. at 100%, not 50%, the required primary balance would be a surplus of 5%
of GDP, not 2.5% of GDP.
The last great collapse in oil and commodity prices from the end of the 1970s led to a
decade-long wave of sovereign defaults.
We believe another wave is coming, involving multiple debt restructurings over many
years.
60
80
100
120
1999 2001 2003 2005 2007 2009 2011 2013 2015
Emerging Market Currencies (nominal)
Fiscal deficits
become persistent

Macquarie Research The Global Macro Outlook
18 October 2016 51
What’s next for EM economies? An extended period of subdued growth: The major six emerging market economies’
aggregate real GDP growth is expected to trend around 4.6% pa 2017-20, some 2.8% pa less
than the 7.4% pa achieved over 2003-11.
Versus the ten advanced economies, the real GDP growth premium was +5.2% pa over
2003-11, falling to an expected +2.9% over 2013-18. Contributions from all three growth
accounting factors (labour supply, capital accumulation, and total factor productivity) are
fading.
Fig 115 Seven negative headwinds for emerging market economies since 2011
1) The headwind from falling commodity prices since 2011
2) The turn in the EME credit cycle post the 22 May 2013 to 28 June 2013 ‘Taper tantrum’
3) The deceleration in global industrial production growth since early 2014 has led to a fading of the export growth engine
4) The US$, which had been appreciating gradually since mid-2011, rose rapidly from mid-2014 through end-2015
5) Oil prices breaking decisively through US$100 from July 2014
6) Declining import volumes into China since early 2015 partially reflecting import substitution. Whilst not a net negative for EM economies initially, second round effects such as the tightening of policy by countries suffering deteriorating trade balances is a negative.
7) The start of a US Fed Funds policy interest rate up-cycle since December 2015, which puts upward pressure on nominal local rates in fixed/semi-fixed exchange rate regimes
Note: Remembering the good times: The 2009-11 commodity price boom, a weak US$ facilitating access to global capital markets and strong credit growth had enabled rapid growth to persist across the EM economies. However, over the past five years, conditions have become progressively tougher
Source: Macquarie Research, October 2016
Emerging market economies (EME) have been battered by seven negatives since 2011, table
above. Whilst some of these are abating, two new headwinds worry us: falling property values
with the credit down-cycle, and declining FDI inflows as the elevated global investment-to-
GDP ratio adjusts.
These are headwinds for consumption and investment, respectively.
Fig 116 Real residential property prices, YoY growth
Note: Housing price movements are deflated by the CPI. Aggregates are weighted by GDP in current US$. Advanced consists of 10 advanced countries (US, Japan, Germany, France, Italy, Spain, UK, Aust, Canada and South Korea) and emerging consists of 6 emerging countries (Brazil, Mexico, Russia, Turkey, India and China). 16-Total is the sum of advanced and emerging countries. ASEAN consists of 5 ASEAN countries (Indonesia, Malaysia, Singapore, Philippines and Thailand).
Source: BIS, IMF, Macquarie Research, October 2016
-12
-9
-6
-3
0
3
6
9
12
2000 2001 2002 2003 2004 2005 2006 2007 2008 2009 2010 2011 2012 2013 2014 2015 2016
(%) Advanced Emerging 16-Total ASEAN
Two new headwinds
worry us:
1) Falling
property
values with
the credit
down-cycle
2) Declining FDI
inflows as the
elevated global
investment-to-GDP
ratio adjusts
These are
headwinds for
consumption and
investment,
respectively

Macquarie Research The Global Macro Outlook
18 October 2016 52
Global private investment indicators This is a six-page section, as we believe that there is widespread misunderstanding about the
existing elevated level of global private investment. Given the relative volatility of private
investment, this implies that it is the major downside risk to global growth.
Lead indicators of capital expenditure
We are unaware of any composite global machinery order indicators. We present indicators
for the US, China, Germany and Japan. The overall impression is one of softness.
We believe Germany is the key series to follow, Fig 119, below (bottom), for the reasons
shown in Fig 117 and Fig 118.
On the basis of exports as a percentage of that country’s GDP, Germany is the most exposed
to emerging markets, at roughly 11.0%, Fig 117. Japan has the highest exports to GDP ratio
to China but emerging markets in total are just 7%. The US is approximately 5%.
Fig 117 Emerging Market export exposures Fig 118 Germany: Goods exports to China
Source: Oxford Economics/Haver Analytics, Macquarie Research, October 2016
Source: Oxford Economics/Haver Analytics, Macquarie Research, October 2016
Fig 119 shows trends in Germany, which are currently a little beneath zero.
Fig 119 Germany VDMA plant & machinery orders, 1999 to latest
Source: VDMA, Bloomberg, Macquarie Research, October 2016
Fig 120 is the well-known US non-defence capital goods orders (excluding aircraft). The case
for excluding aircraft orders relates to both the lumpiness of orders historically and the long
lag between order receipt and the start of work on such orders.
Energy and other commodity-related capital expenditures are expected to stay weak, but the
fall is almost complete, in our opinion.
-40%
-30%
-20%
-10%
0%
10%
20%
30% Germany Plant&Machinery Orders(YoY%, 3mma)
The overall
impression is one of
softness
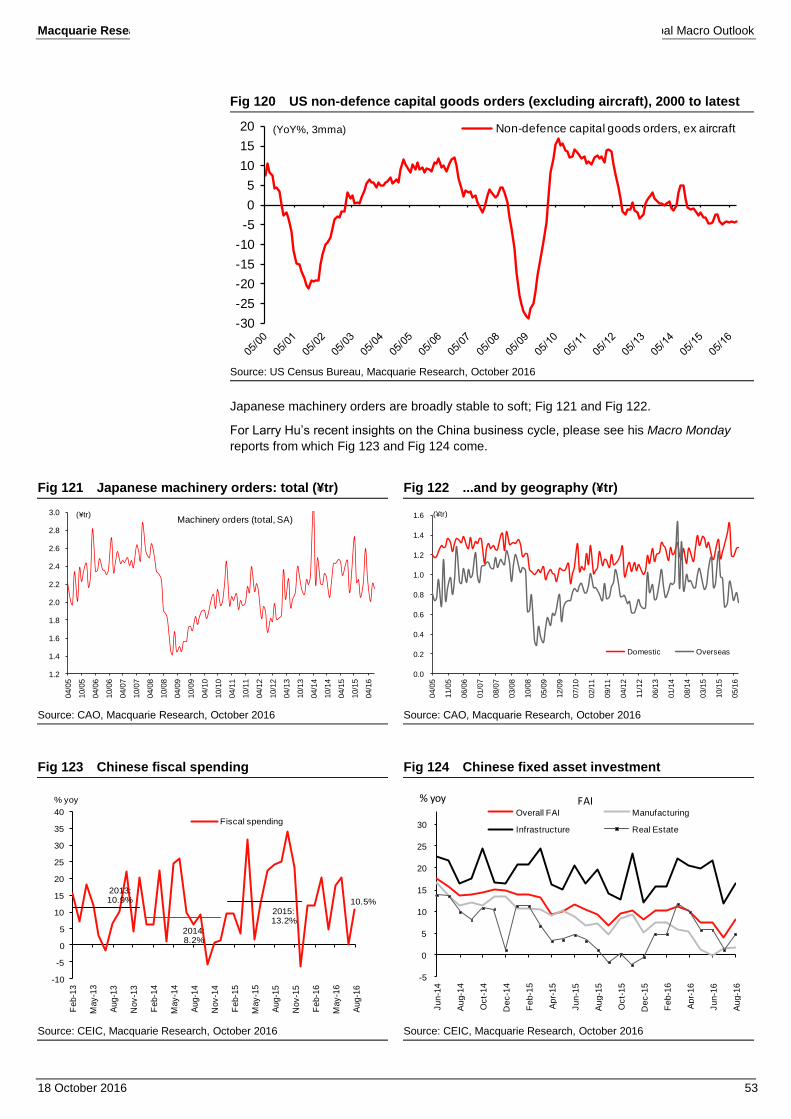
Macquarie Research The Global Macro Outlook
18 October 2016 53
Fig 120 US non-defence capital goods orders (excluding aircraft), 2000 to latest
Source: US Census Bureau, Macquarie Research, October 2016
Japanese machinery orders are broadly stable to soft; Fig 121 and Fig 122.
For Larry Hu’s recent insights on the China business cycle, please see his Macro Monday
reports from which Fig 123 and Fig 124 come.
Fig 121 Japanese machinery orders: total (¥tr) Fig 122 ...and by geography (¥tr)
Source: CAO, Macquarie Research, October 2016 Source: CAO, Macquarie Research, October 2016
Fig 123 Chinese fiscal spending Fig 124 Chinese fixed asset investment
Source: CEIC, Macquarie Research, October 2016 Source: CEIC, Macquarie Research, October 2016
-30
-25
-20
-15
-10
-5
0
5
10
15
20 (YoY%, 3mma) Non-defence capital goods orders, ex aircraft
1.2
1.4
1.6
1.8
2.0
2.2
2.4
2.6
2.8
3.0
04/0
5
10/0
5
04/0
6
10/0
6
04/0
7
10/0
7
04/0
8
10/0
8
04/0
9
10/0
9
04/1
0
10/1
0
04/1
1
10/1
1
04/1
2
10/1
2
04/1
3
10/1
3
04/1
4
10/1
4
04/1
5
10/1
5
04/1
6
(¥tr)Machinery orders (total, SA)
0.0
0.2
0.4
0.6
0.8
1.0
1.2
1.4
1.6
04/0
5
11/0
5
06/0
6
01/0
7
08/0
7
03/0
8
10/0
8
05/0
9
12/0
9
07/1
0
02/1
1
09/1
1
04/1
2
11/1
2
06/1
3
01/1
4
08/1
4
03/1
5
10/1
5
05/1
6
Domestic Overseas
(¥tr)
-10
-5
0
5
10
15
20
25
30
35
40
Fe
b-1
3
Ma
y-1
3
Au
g-1
3
No
v-1
3
Fe
b-1
4
Ma
y-1
4
Au
g-1
4
No
v-1
4
Fe
b-1
5
Ma
y-1
5
Au
g-1
5
No
v-1
5
Fe
b-1
6
Ma
y-1
6
Au
g-1
6
Fiscal spending
% yoy
2013: 10.9% 10.5%
2014: 8.2%
2015: 13.2%
-5
0
5
10
15
20
25
30
Jun
-14
Au
g-1
4
Oct-
14
Dec-1
4
Fe
b-1
5
Apr-
15
Jun
-15
Au
g-1
5
Oct-
15
Dec-1
5
Feb-1
6
Apr-
16
Jun
-16
Au
g-1
6
Overall FAI Manufacturing
Infrastructure Real Estate
% yoy FAI

Macquarie Research The Global Macro Outlook
18 October 2016 54
The following charts from the IMF include residential investment; 2015-16 are IMF forecasts
Please note that at the global level, private investment is already at elevated levels.
Fig 125 World investment (US$tr) Fig 126 World investment (% of current GDP)
Source: IMF WEO database, Macquarie Research, October 2016 Source: IMF WEO database, Macquarie Research, October 2016
Fig 127 Advanced economies’ investment (US$ tr)
Fig 128 Advanced economies’ investment (% of current GDP)
Source: IMF WEO database, Macquarie Research, October 2016 Source: IMF WEO database, Macquarie Research, October 2016
Fig 129 US investment (US$tr) Fig 130 US investment (% of current GDP)
Source: IMF WEO database, Macquarie Research, October 2016 Source: IMF WEO database, Macquarie Research, October 2016
0
5
10
15
20
25
1980
1982
1984
1986
1988
1990
1992
1994
1996
1998
2000
2002
2004
2006
2008
2010
2012
2014
2016
(US$tr) World investment
20
21
22
23
24
25
26
27
19
80
19
82
19
84
19
86
19
88
19
90
19
92
19
94
19
96
19
98
20
00
20
02
20
04
20
06
20
08
20
10
20
12
20
14
20
16
(%)World investment, % of GDP
0
2
4
6
8
10
12
1980
1982
1984
1986
1988
1990
1992
1994
1996
1998
2000
2002
2004
2006
2008
2010
2012
2014
2016
(US$tr) Advanced economies, investment
15
17
19
21
23
25
27
1980
1982
1984
1986
1988
1990
1992
1994
1996
1998
2000
2002
2004
2006
2008
2010
2012
2014
2016
(%) Advanced economies, investment, % of GDP
0.0
0.5
1.0
1.5
2.0
2.5
3.0
3.5
4.0
4.5
1980
1982
1984
1986
1988
1990
1992
1994
1996
1998
2000
2002
2004
2006
2008
2010
2012
2014
2016
(US$tr) US's investment
10
12
14
16
18
20
22
24
26
1980
1982
1984
1986
1988
1990
1992
1994
1996
1998
2000
2002
2004
2006
2008
2010
2012
2014
2016
(%GDP) US's investment, % of GDP

Macquarie Research The Global Macro Outlook
18 October 2016 55
Anxiety normally revolves around China, which is the difference between a currently strong
level of world investment activity, Fig 126, and the depressing picture presented in Fig 128.
As Fig 129 and Fig 130 show, the IMF has positive 2015-16 growth forecasts for the US.
Fig 131 World investment by economic groups
Fig 132 World investment by economic groups (% of current GDP)
Source: IMF WEO database, Macquarie Research, October 2016 Source: IMF WEO database, Macquarie Research, October 2016
Fig 133 Emerging & developing economies’ investment (US$tr)
Fig 134 Emerging & developing economies’ investment (% of current GDP)
Source: IMF WEO database, Macquarie Research, October 2016 Source: IMF WEO database, Macquarie Research, October 2016
Fig 135 China’s investment (US$tr) Fig 136 China’s investment, % of GDP
Source: IMF WEO database, Macquarie Research, October 2016 Source: IMF WEO database, Macquarie Research, October 2016
0
5
10
15
20
25
1980
1982
1984
1986
1988
1990
1992
1994
1996
1998
2000
2002
2004
2006
2008
2010
2012
2014
2016
(US$tr) Emerging and developing economies investment
Advanced economies, investment
15
17
19
21
23
25
27
29
31
33
35
1980
1982
1984
1986
1988
1990
1992
1994
1996
1998
2000
2002
2004
2006
2008
2010
2012
2014
2016
(%) Advanced economies, investment, % of GDP
Emerging and developing economies investment, % of GDP
0
2
4
6
8
10
12
1980
1982
1984
1986
1988
1990
1992
1994
1996
1998
2000
2002
2004
2006
2008
2010
2012
2014
2016
(US$tr) Emerging and developing economies investment
20
22
24
26
28
30
32
34
1980
1982
1984
1986
1988
1990
1992
1994
1996
1998
2000
2002
2004
2006
2008
2010
2012
2014
2016
(%)
Emerging and developing economies investment, % of GDP
0.0
1.0
2.0
3.0
4.0
5.0
6.0
1980
1982
1984
1986
1988
1990
1992
1994
1996
1998
2000
2002
2004
2006
2008
2010
2012
2014
2016
(US$tr) China's investment
25
30
35
40
45
50
1980
1982
1984
1986
1988
1990
1992
1994
1996
1998
2000
2002
2004
2006
2008
2010
2012
2014
2016
(%GDP) China's investment, % of GDP

Macquarie Research The Global Macro Outlook
18 October 2016 56
Whilst China is still growing in absolute terms (Fig 135, previous page), a slow rebalancing of
the economy is underway (Fig 136). EM ex China has been stagnant, 2011-15, Fig 137.
Fig 137 Emerging and developing economies ex China investment
Fig 138 Emerging and developing economies ex China investment, % of GDP
Source: IMF WEO database, Macquarie Research, October 2016 Source: IMF WEO database, Macquarie Research, October 2016
Fig 139 India’s investment Fig 140 India’s investment, % of GDP
Source: IMF WEO database, Macquarie Research, October 2016 Source: IMF WEO database, Macquarie Research, October October 2016
Fig 141 Brazil’s investment Fig 142 Brazil’s investment, % of GDP
Source: IMF WEO database, Macquarie Research, October 2016 Source: IMF WEO database, Macquarie Research, October 2016
0.0
1.0
2.0
3.0
4.0
5.0
6.0
1980
1982
1984
1986
1988
1990
1992
1994
1996
1998
2000
2002
2004
2006
2008
2010
2012
2014
2016
(US$tr) Emerging and developing economies ex China
15
17
19
21
23
25
27
29
1980
1982
1984
1986
1988
1990
1992
1994
1996
1998
2000
2002
2004
2006
2008
2010
2012
2014
2016
(%) Emerging and developing economies ex China, % of GDP
0.0
0.1
0.2
0.3
0.4
0.5
0.6
0.7
0.8
1980
1982
1984
1986
1988
1990
1992
1994
1996
1998
2000
2002
2004
2006
2008
2010
2012
2014
2016
(US$tr) India's investment
15
20
25
30
35
40
45
1980
1982
1984
1986
1988
1990
1992
1994
1996
1998
2000
2002
2004
2006
2008
2010
2012
2014
2016
(%GDP) India's investment, % of GDP
0.0
0.1
0.2
0.3
0.4
0.5
0.6
1980
1982
1984
1986
1988
1990
1992
1994
1996
1998
2000
2002
2004
2006
2008
2010
2012
2014
2016
(US$tr) Brazil's investment
10
12
14
16
18
20
22
24
26
1980
1982
1984
1986
1988
1990
1992
1994
1996
1998
2000
2002
2004
2006
2008
2010
2012
2014
2016
(%GDP) Brazil's investment, % of GDP

Macquarie Research The Global Macro Outlook
18 October 2016 57
Fig 143 Russia’s investment Fig 144 Russia’s investment, % of GDP
Source: IMF WEO database, Macquarie Research, October 2016 Source: IMF WEO database, Macquarie Research, October 2016
Fig 145 Indonesia’s investment Fig 146 Indonesia’s investment, % of GDP
Source: IMF WEO database, Macquarie Research, October 2016 Source: IMF WEO database, Macquarie Research, October 2016
Fig 147 Investment by World ex China
Fig 148 Investment by World ex China, % of GDP
Source: IMF WEO database, Macquarie Research, October 2016 Source: IMF WEO database, Macquarie Research, October 2016
0.0
0.1
0.2
0.3
0.4
0.5
1980
1982
1984
1986
1988
1990
1992
1994
1996
1998
2000
2002
2004
2006
2008
2010
2012
2014
2016
(US$tr) Russia's investment
10
15
20
25
30
35
40
1980
1982
1984
1986
1988
1990
1992
1994
1996
1998
2000
2002
2004
2006
2008
2010
2012
2014
2016
2018
2020
(%GDP) Russia's investment, % of GDP
0.00
0.05
0.10
0.15
0.20
0.25
0.30
0.35
1980
1982
1984
1986
1988
1990
1992
1994
1996
1998
2000
2002
2004
2006
2008
2010
2012
2014
2016
(US$tr) Indonesia's investment
0
5
10
15
20
25
30
35
40
45
501980
1982
1984
1986
1988
1990
1992
1994
1996
1998
2000
2002
2004
2006
2008
2010
2012
2014
2016
(%GDP) Indonesia's investment, % of GDP
0
4
8
12
16
19
80
19
82
19
84
19
86
19
88
19
90
19
92
19
94
19
96
19
98
20
00
20
02
20
04
20
06
20
08
20
10
20
12
20
14
20
16
(US$tr)
Investmet by World ex China
18
19
20
21
22
23
24
25
26
27
19
80
19
82
19
84
19
86
19
88
19
90
19
92
19
94
19
96
19
98
20
00
20
02
20
04
20
06
20
08
20
10
20
12
20
14
20
16
(% GDP)
Investment by World ex China, % of GDP

Macquarie Research The Global Macro Outlook
18 October 2016 58
Local factors determine core inflation One popular perspective holds a global view of inflation - that global slack determines local
inflation. However, there is significant evidence that local conditions drive underlying inflation.
For example, Fig 149 shows that divergence in CPI-services for the US and the eurozone. Of
personal consumption expenditures in advanced economies, three-quarters is on services.
Fig 149 A dramatic divergence between the US and Euro area services inflation
Source: Bloomberg, Macquarie Research, October 2016
We believe Fig 150 explains the confusion. Currently, the average pair-wise correlation on
core inflation measures is near zero, and near 40-year lows. At the same time, the average
pair-wise correlation on headline inflation measures is as elevated today as during the first oil
shock of the early 1970s. From late 2014 until February 2016 oil prices plunged 80%.
Fig 150 International synchronisation of inflation (headline and core)
Notes: From Bank of England Governor, Mark Carney’s speech at the 2015 Jackson Hole symposium: Inflation in a globalised world. Average pair-wise rolling (15 years) correlation of seasonally-adjusted quarterly headline and core inflation. Source: OECD, Global Financial Data, DataStream, National sources, and Bank Staff calculation
Source: BoE, Macquarie Research, October 2016
We believe that core inflation is driven locally, through the influence of local output gaps and
the slack in the local labour market.
The US: The CPI services for the US, shown in Fig 149, reflects the acceleration in US wage
growth, following six years of employment growth above labour force growth, and the
unemployment rate approaching full employment.
The eurozone: Conversely, the tightening of fiscal policy in the eurozone over 2011-13 and a
second credit crunch there during 2011-12, leaves the eurozone approximately four years
behind the US in the business cycle. Nonetheless, we are forecasting accelerating eurozone
inflation from 0.0% in 2015, to 0.5% this year, and to 1.5% in 2017.
0%
1%
2%
3%
4%
5%
1998 2000 2002 2004 2006 2008 2010 2012 2014 2016
1998-2011 correl = +0.47 2012-16 correl = -0.55
Services CPI
US
Euro area
We believe that core
inflation is driven
locally, through the
influence of local
output gaps and the
slack in the local
labour market
Of personal
consumption
expenditures in
advanced
economies, three-
quarters is on
services

Macquarie Research The Global Macro Outlook
18 October 2016 59
Income shares: from labour to capital To the benefit of capital, there has been a 5% decline in the labour share globally since 1980,
Fig 151.
We believe the main driver has been technology, facilitated by globalisation with MNCs as the
main agents of change. As a consequence, MNCs have been the major beneficiaries.
Fig 151 Declining global labour share: 0.65 means 65%
Note: Loukas Karabarbounis & Brent Neiman, The global decline of the labour share, June 2013. “The figure shows year fixed effects from a regression of corporate and overall labour shares that also include country fixed effects to account for entry and exit during the sample. The regressions are weighted by corporate gross value added and GDP measured in U.S. dollars at market exchange rates. We normalize the fixed effects to equal the level of the global labour share in our dataset in 1975”
Source The global decline of the labour share above, Macquarie Research, October 2016
MNCs are a global macro dimension needing attention. The last 30 years have seen the
emergence of global oligopolistic competition. Following waves of M&A activity, the top MNCs
now dominate their global markets, entrenching their position by undertaking the vast
proportion of R&D in their industries. The result is the control of leading technologies and
brands.
We believe one consequence of global oligopolistic competition is to limit the diffusion of new
techniques and labour productivity growth across the economy.
Fig 152 Labour productivity growth: the issue of diffusion
Note: Each line shows the average labour productivity (value added per worker). The “Top 5%” and “Top 100” are the globally most productive firms in each two-digit industry. “Non-frontier firms” is the average of all firms, excluding the Top 5%. Included industries are manufacturing and business services, excluding the financial sector. The coverage of firms in the dataset varies across the 24 countries in the sample and is restricted to firms with at least 20 employees. Source: OECD preliminary results based on Andrews, D., C. Criscuolo and P. Gal (2016), “Mind the Gap: Productivity Divergence between the Global Frontier and Laggard Firms”, OECD Productivity Working Papers, forthcoming; Orbis data of Bureau van Dijk Source: OECD, Macquarie Research, October 2016
We believe one
consequence of
global oligopolistic
competition is to
limit diffusion of
new techniques,
labour productivity
growth across the
economy
The last 30 years
have seen the
emergence of global
oligopolistic
competition
We believe the main
driver has been
technology,
facilitated by
globalisation with
MNCs as the main
agents of change
There has been a
5% decline in the
labour share
globally since 1980

Macquarie Research The Global Macro Outlook
18 October 2016 60
The corporate saving “glut” Savings-Investment balances, net lending/borrowing by sector, the net acquisition of financial
assets (NAFA) are terms used interchangeably in the literature.
The corporate sector in most advanced economies is running a savings-investment surplus.
We believe this is an unintended by-product of the monetary policy response to credit bubble/
busts that transfers income from the household sector to the corporate sector: the lowering of
policy interest rates to near zero and the flattening of the yield curve.
The corporate sector in Japan is a representative example. Japan’s data goes back to 1994,
just far enough to capture the swing from net investing (borrowing) to net saving (lending),
below. Looking at the numbers:
The ¥35.4tr swing over 1994-2013 from annual net borrowing (-¥2.0bn) to net lending
(¥33.4bn, pale red highlights) compares to reduced interest payments of ¥28.6tr (from
¥32.2bn to ¥3.6bn, blue highlights).
We’ve also highlighted (in orange) how the surplus of gross fixed capital formation over
consumption of fixed capital has shrunk from ¥11.9tr in 1994 to ¥2.0tr in 2013.
In turn, this narrowing of ¥9.9tr reflects a gradual upward drift in the consumption of fixed
capital charge (¥2.7tr) and a marked fall in gross fixed capital formation (¥7.2tr).
Dividend payments increased from ¥4.6tr in 1994 to ¥15.1tr in 2013, for an increase over the
period of ¥10.5tr.
So rather than paying interest, non-financial corporations have paid down net debt.
Rather than growing their fixed capital base, non-financial corporations have paid out
dividends.
Fig 153 Non-financial corporations’ flow of funds (¥tr), 1994 to latest available (2013)
CY 1994 1995 1996 1997 1998 1999 2000 2001 2002 2003
Gross fixed capital formation 72.9 74.5 75.6 81.1 74.7 70.6 74.2 71.0 64.6 65.3 Consumption of fixed capital 61.0 59.5 60.2 63.3 64.9 64.0 63.7 63.6 63.3 61.8 changes in inventories -1.4 1.6 2.2 2.5 1.4 -3.5 -0.5 -0.1 -1.9 -0.4 purchases of land, net -7.7 3.9 -3.1 0.5 -0.2 -0.3 9.3 5.7 -4.9 3.7 Net lending/net borrowing -2.0 -13.7 -2.5 -8.3 22.3 9.3 3.4 3.8 28.4 21.5 Net saving -3.7 1.7 6.7 8.3 5.2 11.7 17.3 13.2 19.7 24.0 Net capital transfers 4.5 5.0 5.2 4.3 28.1 0.4 5.6 3.7 3.3 4.3 Interest payable 32.2 28.8 23.8 21.9 17.3 13.9 12.1 9.4 7.0 6.3 Dividends 4.6 5.1 5.2 5.2 5.0 5.6 4.8 5.3 7.1 6.8
CY 2004 2005 2006 2007 2008 2009 2010 2011 2012 2013
Gross fixed capital formation 66.3 69.2 73.4 76.9 74.8 62.2 61.2 62.6 64.8 65.7 Consumption of fixed capital 61.8 62.2 64.4 66.5 68.6 67.7 65.0 63.4 62.8 63.7 changes in inventories 1.7 0.5 -0.5 1.7 2.9 -5.2 1.1 -1.7 -0.9 -2.8 purchases of land, net -1.8 -8.7 -0.1 5.1 3.8 5.3 -0.6 5.8 0.2 2.2 Net lending/net borrowing 29.8 32.0 17.7 13.1 12.5 29.9 39.3 27.4 33.5 33.4 Net saving 31.4 28.0 24.0 28.1 23.3 22.1 33.0 27.2 31.6 31.5 Net capital transfers 2.7 2.8 2.1 2.1 2.1 2.5 3.0 3.5 3.3 3.3 Interest payable 5.3 4.6 4.9 5.8 5.1 4.8 4.7 4.2 3.7 3.6 Dividends 9.3 13.0 15.7 16.4 14.3 11.6 11.9 11.3 13.5 15.1
Source: CAO, ESRI, CEIC, Datastream, Macquarie Research October 2016
The corporate savings “glut”: variations by geography
Fig 154 presents the US data. In the case of the US, below, the weakness of investment post
the TMT Bubble (1998-2001) led to a small corporate surplus over the years 2002-05. The
post Global Financial Cycle corporate Saving-Investment surpluses, however, have been
much more substantial, 2-3% versus 1%. The corporate surplus calculation used in Fig 154 is
net of both dividend payments and share buy-back activity.
The corporate
sector in most
advanced
economies is
running a savings-
investment surplus
….an unintended
by-product of the
monetary policy
response to credit
bubble/busts that
transfers income
from the household
sector to the
corporate sector
The US

Macquarie Research The Global Macro Outlook
18 October 2016 61
Fig 154 Net lending of US non-financial corporations
Note: Savings (the blue line) is calculated as the undistributed profits of non-financial corporations, that is after-tax profits less dividends to shareholders. Investment (the red line) represents spending by non-financial companies on capital formation. Any excess of savings over investment represents net lending to the rest of the economy, the black bars at the bottom of the charts. More precisely:
Source: Gruber, Joseph W., and Steven B. Kamin (2015). The Corporate Saving Glut in the Aftermath of the Global Financial Crisis International Finance Discussion Papers 1150, Macquarie Research, October 2016
Japan is as has been indicated earlier: A rapid growth in gross saving since the 1987-1991
bubble-bust, and a trend decline in gross investment. The trend decline in investment in
Japan began a decade earlier in Japan than in the USA (1991 versus 2001). The post-GFC
corporate Saving-Investment surplus has averaged 5%.
Germany has seen similar trends, a trend increase in gross savings, a trend decrease in
gross investment, but the latter could be described two ways: either as a very mild downtrend
since 1991, or broadly sideways until the Global Financial Crisis, and then a step-decline
thereafter. However, the German corporate sector surplus is less than 1%.
The trends are far from uniform. Canada has seen a trend improvement in gross savings,
but gross investment has been broadly stable. The UK does not appear to have experienced
a trend improvement in gross savings, but a trend decline in gross investment has occurred.
Both Canada and UK do have corporate sector surpluses, of 1-2%.
However, since 1990 the corporate sectors in both France and Italy have had persistent
deficits of 2-3%. As a consequence, a weighted average of the corporate Saving-Investment
balances for the three euro-zone majors of Germany, France and Italy is mildly negative.
We believe the above is facilitating global cross-border M&A, which in 2015 was 40% above
its previous high of 2007. We expect 2016 to be another year of intense cross-border M&A,
with the trend towards global oligopolistic competition amongst MNCs continuing.
Fig 155 Total & cross-border M&A, 2007 to latest
Total M&A (US$bn) Cross-border M&A (US$bn) % of cross-border M&A to
total M&A Global Japan Global Japan Global Japan
2007 2391.6 111.7 1050.3 52.4 43.9 46.9 2008 1398.9 138.2 569.4 87.1 40.7 63.1 2009 1033.3 85.2 286.5 38.4 27.7 45.1 2010 1369.9 82.0 551.6 51.7 40.3 63.0 2011 1465.8 139.1 556.2 94.5 37.9 67.9 2012 1405.4 123.5 598.8 89.6 42.6 72.5 2013 1489.5 78.1 468.0 62.1 31.4 79.6 2014 2400.9 71.9 1075.4 58.3 44.8 81.2 2015 3429.4 127.3 1298.0 102.8 37.9 80.7
2016 YTD 1404.3 84.5 624.4 66.9 44.5 79.2
Note: Data for Japan from RECOF. Cross-border for Japan is both In-Out and Out-In.
Source: FactSet, RECOF, Macquarie Research, October 2016
Japan
Germany
Canada, U.K.
France and Italy
We expect 2016 to
be another year of
intense cross-
border M&A

Macquarie Research The Global Macro Outlook
18 October 2016 62
Global income distribution Income gains have varied markedly over the 20 years since 1988, Fig.156. The relative
winners have been “the top 1%” and the one-fifth of the world’s population in the 40th to 60th
percentile range. In nine out of ten cases, the latter live in the emerging Asia economies of
China, India, Thailand, Vietnam and Indonesia, and are around the median income earners in
their countries. Whilst they are often referred to in the media as the “emerging global middle
class” they are still economically below the lower middle class of the rich nations, as
commonly understood.
Fig 156 Relative gain in real per capita income by global income level, 1988-2008
Note: World Bank Economic Review, Lakner, Christoph & Branko Milanovic, 2015, Global income distribution: From the fall of the Berlin Wall to the great Recession. The following notes come from the book Global inequality by Branko Milanovic:
This graph shows relative (percentage) gain in household per capita income (measured in 2005 international dollars) between 1988 and 2008 at different points of the global income distribution (ranging from the poorest ventile, at 5, to the richest global percentile, at 100). Real income gains were greatest around the 50th percentile of the global income distribution (the median; at point A) and among the richest (the top 1%; at point C). They were lowest among people who were around the 80th percentile globally (point B), most of whom are in the lower middle class of the rich world
Source: World Bank above, Macquarie Securities, October 2016
The relative losers are the lower middle class of the rich nations, who cluster around the 80th
percentile, point B above. As a consequence estimates of global income distribution have
shown declined inequality, but increased inequality in advanced economies such as the US.
Please note that US inequality is currently much lower than global inequality.
Fig 157 Global and US inequality, 1820-2011
Note: This graph shows global and US income inequalities (calculated across world and US citizens, respectively). In the recent period, global inequality is decreasing while US inequality is going up.
Sources: Milanovic Branko: Global inequality, page 124, with the 2003, 2008 and 2013 estimates and the 2035 forecast for global inequality from the paper The future of worldwide income distribution, April 2015, by Tomas Hellebrandt and Paolo Mauro
Source: Various as noted above, Macquarie Research, October 2016
0
10
20
30
40
50
60
70
80
90
100
0 10 20 30 40 50 60 70 80 90 100
Cum
ulat
ive
gain
in re
al i
ncom
e (in
%)
Ventile/percentile of global income distribution
A
B
C
30
35
40
45
50
55
60
65
70
75
1800 1850 1900 1950 2000 2050
US inequality Global (B-M series) Global (L-M series) Global (H-M series)
The relative winners
have been “the top
1%” and the one-
fifth of the world’s
population in the
40th to 60th
percentile range
The relative losers
are the lower middle
class of the rich
nations, who cluster
around the 80th
percentile
As a consequence
estimates of global
income distribution
have shown
declined inequality,
but increased
inequality in
advanced
economies such as
the US
Please note that US
inequality is
currently much
lower than global
inequality
Macquarie Research The Global Macro Outlook
18 October 2016 63
Demographic Tectonics Demographic Tectonic reports so far have included:
a) China – A V-shaped age profile
b) ASEAN – The rise of ASEAN affluence
c) Japan – Aging Japan it’s wonderful (the Affluent Elderly)
d) India – The young and restless
The affluent Elderly
To focus on the Affluent Elderly, for those that have prepared well for retirement, this
demographic cluster has both the cash-flow and the time to be a prime consumer. One
example is Japan. The Affluent Elderly are approximately 20% of Japan’s population, and
30% of annual consumption. Their total income in 2015 at US$1tr makes them equal to about
half the size of Italian GDP, and unlike Italy, the Affluent Elderly in Japan remains a growing
market.
Fig 158 The Affluent Elderly: a massive market that will continue to grow
Persons, by household head age and income bracket (millions) 2005 2015 2025 2025 vs 2015
65+ with income $50,000 to $120,000 13.3 18.4 20.0 +1.6
65+ with income $120,001 plus 3.0 5.0 5.7 +0.7
Affluent Elderly households’ total 16.3 23.4 25.7 +2.3
Affluent Elderly households’ total
household income (US$ billions) 629 1,022 1,223 +201
Note: The total income of the above affluent, elderly in 2015 at US$1tr makes them equal to about half the size of Italian GDP
Source: Global Demographics Ltd, Macquarie Research, October 2016
This group are consumers of premium services and goods: a) luxury brands, b) increased
quality of living through the progressive upgrading in the unit size of dwellings and the overall
building and furnishing standards; and c) increased wellness & health expenditures –
increased expenditures on wellbeing, covering everything from skin care and nutritional
supplements through to medical expenses.
The global labour supply
This is a demographic headwind.
Fig 159 Global changes in working age populations (2025 less 2015)
Note: To calculate working age population we have used the definition of 15-64 years for economies including Africa, Central & South America, Developing Asia, India, North Africa & Middle East and South Asia. For the rest, we have used the definition of 15-74 years to calculate working age population as the life expectancy in these countries is higher
Source: Global Demographics, Macquarie Research, October 2016
100
5344 39 35
2814
1 0
-1 -5
-29
-60
-20
20
60
100
140
Ind
ia
No
rth
Afr
ica
& M
idd
le E
as
t
Afr
ica
De
ve
lop
ing
Asia
So
uth
Asia
Ce
ntr
al
& S
ou
th A
me
rica
No
rth
Am
eri
ca
We
ste
rn E
uro
pe
Ru
ss
ia
Ea
ste
rn E
uro
pe
Aff
lue
nt
As
ia
Ch
ina
Persons mn
Affluent Elderly
demographic
opportunities

Macquarie Research The Global Macro Outlook
18 October 2016 64
The world’s working age population is now growing quite modestly, Fig 159. An extra 260m
over a decade on 4.6bn is approximately 0.5% pa. Please note the divergence in working
age populations, 2025 versus 2015, for India and China.
Fig 160 shows the impact of labour retirement ages.
Fig 161 shows the ongoing fade in growth of the working population in EM economies.
Fig 160 Global population & labour supply Fig 161 Annual growth in the working population
Note: from the December 2015, Bank of England staff working paper No. 571, Secular drivers of the global real interest rate by Lukasz Rachel and Thomas D Smith. Black lines shows growth in the global working aged 20 to retirement. Retirement ages are calculated using OECD data on average effective retirement ages. Over the future, global retirement ages are assumed to grow by one and a half years every decade to keep pace with expected rises in longevity
Source: UN population projections, OECD, Macquarie Research, October 2016
Source: Oxford Economics, Macquarie Research, October 2016
The US labour supply
One of David Doyle’s key themes has been lower potential growth for the United States, of
around 1.5% to 2% pa, with US labour force growth only able to provide 0.5% pa of that. Due
to an ageing population, the unemployment rate can be reduced by jobs growth as low as
55,000-115,000 per month.
Fig 162 The US labour force growth has been in a multi-decade decline
Source: Bureau of Labour Statistics, Macquarie Research, October 2016
-1.0%
0.0%
1.0%
2.0%
3.0%
4.0%
1971 1976 1981 1986 1991 1996 2001 2006 2011
Labour force growth YoY change in twelve month moving average
Due to an ageing
population, the
unemployment rate
can be reduced by
jobs growth as low
as 55,000-115,000
per month

Macquarie Research The Global Macro Outlook
18 October 2016 65
The Long Grinding Cycle continues We believe the pace of the current expansion should continue to prove to be structurally
lower than in previous cycles, as fiscal reconstruction, demographic factors, low productivity
growth and sub-optimal global policy making are likely to remain as headwinds.
Fig 163 shows data since 1999, breaking real GDP growth down into contributing parts:
labour, “capital deepening” (labour quality, non-IT capital, IT capital) and total factor
productivity (TFP) growth. Fig 164 provides more detail on TFP.
Fig 163 Contributions of sources of growth to aggregate GDP growth, 1999-2014
GDP Growth Labour Labour Quality Non-IT Capital IT Capital TFP Growth
World
99-06 4.1 0.7 0.2 1.2 0.7 1.3 07-12 3.3 0.3 0.1 1.7 0.7 0.5 2012 3.0 0.6 0.1 1.7 0.7 -0.1 2013 3.1 0.5 0.1 1.7 0.7 0.0 2014 3.2 0.6 0.1 2.0 0.6 -0.2
Mature
99-06 2.7 0.3 0.2 0.8 0.6 0.8 07-12 0.9 -0.1 0.1 0.5 0.4 0.0 2012 1.1 0.4 0.1 0.4 0.4 -0.2 2013 1.4 0.2 0.1 0.4 0.5 0.2 2014 1.8 0.8 0.1 0.6 0.5 -0.2
EM economies
99-06 5.9 1.1 0.2 2.0 0.7 1.9 07-12 5.8 0.6 0.1 3.3 1.0 0.8 2012 4.7 0.7 0.1 3.3 0.9 -0.3 2013 4.6 0.7 0.1 3.3 1.0 -0.5 2014 4.3 0.4 0.1 3.6 0.8 -0.7
United States
99-06 3.0 0.3 0.2 0.7 0.7 1.0 07-12 0.8 -0.3 0.1 0.4 0.4 0.2 2012 2.3 1.0 0.1 0.3 0.4 0.5 2013 2.2 0.7 0.1 0.3 0.5 0.6 2014 2.4 1.1 0.1 0.6 0.4 0.1
Japan
99-06 1.2 -0.4 0.2 0.4 0.2 0.7 07-12 0.2 -0.4 0.1 0.1 0.3 0.2 2012 1.7 0.6 0.1 0.0 0.4 0.7 2013 1.6 0.0 0.1 0.1 0.4 1.0 2014 0.0 0.3 0.1 0.4 0.3 -1.2
Euro Area
99-06 2.2 0.5 0.2 0.7 0.4 0.4 07-12 0.3 -0.2 0.2 0.5 0.3 -0.4 2012 -0.8 -1.0 0.2 0.2 0.4 -0.6 2013 -0.5 -0.7 0.2 0.1 0.5 -0.5 2014 0.9 0.5 0.2 0.3 0.4 -0.4
China
99-06 10.4 0.3 0.2 4.4 1.2 4.4 07-12 9.6 0.0 0.1 5.8 0.9 2.7 2012 7.4 0.2 0.1 5.9 0.9 0.4 2013 7.4 0.4 0.1 5.8 0.9 0.1 2014 7.1 0.1 0.1 6.2 0.8 -0.1
India
99-06 6.6 1.8 0.2 2.6 0.6 1.3 07-12 7.4 0.1 0.2 3.4 1.0 2.7 2012 4.7 1.0 0.2 2.9 1.4 -0.7 2013 4.6 0.9 0.2 2.5 1.5 -0.5 2014 5.5 0.9 0.2 2.9 1.4 0.2
Brazil
99-06 2.8 1.3 0.1 0.8 0.9 -0.4 07-12 3.6 0.9 0.2 1.6 1.0 -0.1 2012 1.0 1.2 0.2 1.9 0.0 -2.2 2013 2.5 0.3 0.2 2.0 0.2 -0.2 2014 0.1 -0.1 0.2 2.0 0.3 -2.3
Source: The Conference Board Summary Table, Macquarie Research, October 2016
Fiscal reconstruction,
demographic factors,
low productivity
growth and sub-
optimal global policy
making are likely to
remain as headwinds

Ma
cq
ua
rie R
es
ea
rch
T
he
Glo
ba
l Macro
Outlo
ok
18
Octo
be
r 20
16
66
Fig 164 Growth of total factor productivity (TFP) per annum, %, aggregates weighted by GDP in current US$ shares
Country Name 2000 2001 2002 2003 2004 2005 2006 2007 2008 2009 2010 2011 2012 2013 2014
Advanced US 0.9 -0.1 1.0 1.8 2.0 1.3 0.2 -0.1 -0.9 -0.2 2.1 0.1 0.4 -0.2 0.1 Japan 1.2 -0.1 0.6 0.8 1.8 0.7 0.5 1.2 -1.0 -3.3 4.0 -0.5 0.7 1.0 -1.1 Germany 2.0 1.3 -0.1 -0.5 0.5 1.4 1.9 1.2 -0.5 -4.4 2.8 1.9 -0.3 -0.6 -0.2 France 1.7 -0.4 0.9 0.1 0.1 0.0 1.4 -0.4 -1.7 -2.6 0.9 0.6 -0.7 0.4 -0.9 Italy 1.6 -0.5 -1.9 -1.6 0.1 -0.4 -0.2 -0.5 -1.7 -4.0 1.9 0.3 -1.4 -0.5 -0.5 Spain -0.6 -1.2 -1.0 -0.7 -1.1 -1.0 -0.5 -0.5 -1.8 -1.6 0.4 -0.3 -0.5 -0.5 -0.2 UK 0.7 -0.1 0.4 1.9 0.5 0.1 1.2 0.4 -1.6 -4.3 0.8 0.4 -1.5 -0.5 0.0 Australia 0.0 0.8 0.9 -0.9 0.1 -1.2 -1s.6 -0.4 -1.5 -1.6 -1.1 -1.0 -0.7 -2.0 -1.7 Canada 1.2 -0.7 0.2 -0.6 -0.4 0.6 -0.6 -1.4 -1.6 -2.3 1.0 0.5 -0.8 -0.2 -0.3 S. Korea 2.4 0.4 3.3 1.8 2.4 1.9 2.3 3.5 2.0 -0.6 4.7 3.0 -3.1 2.5 -1.2
10-advanced total 1.1 0.0 0.6 0.9 1.2 0.7 0.5 0.2 -0.9 -1.7 1.8 0.2 -0.1 0.0 -0.2
Emerging Brazil 1.9 -0.2 0.3 -1.4 2.0 -0.7 -0.7 1.0 -0.9 -3.7 1.7 -1.0 -2.1 -0.4 -2.8 Mexico 3.4 -2.7 -3.5 -0.3 1.0 -0.9 1.4 -0.5 -3.5 -6.2 -0.6 0.7 -0.2 -2.3 -1.2 Russia 5.6 6.5 4.5 7.6 6.2 4.4 4.4 2.9 -0.2 -8.3 4.0 3.5 2.8 1.1 -0.3 Turkey 3.8 -8.7 3.9 2.4 3.9 0.6 -1.5 -1.8 -4.3 -8.0 3.6 2.1 -3.6 -1.3 -2.5 India 0.1 -1.2 -0.6 1.6 0.6 3.4 4.1 3.3 2.2 1.2 3.7 2.0 -0.6 0.8 China – Old series 3.3 4.7 5.9 7.8 2.7 3.5 4.6 5.9 2.2 1.8 2.7 2.0 0.5 0.4 -0.1
6-EM total 2.4 0.5 1.9 4.1 2.9 2.7 3.9 4.8 0.6 -2.6 5.3 3.5 0.1 0.2 -1.3
16-Total 1.3 0.0 0.8 1.3 1.5 1.1 1.1 1.2 -0.6 -1.9 2.7 1.2 -0.1 0.0 -0.6
Other Indonesia 1.6 0.2 1.9 1.9 0.5 2.4 1.1 -0.5 1.0 -0.6 0.9 2.3 1.5 -0.1 2.1 Malaysia 4.0 -2.6 1.9 2.0 3.8 2.5 2.0 2.5 1.6 -4.9 1.3 1.2 1.3 0.0 0.6 Singapore 4.0 -1.5 1.0 0.7 3.8 0.7 2.4 3.3 -0.3 -2.2 3.2 -1.8 3.7 3.2 1.4 Philippines 4.7 -7.3 3.2 3.7 8.4 5.0 2.5 3.7 -4.3 -4.1 8.1 1.7 -1.9 -0.3 -0.9 Thailand 2.9 1.2 2.8 4.3 2.3 1.0 1.1 1.5 -2.1 -4.0 4.5 -2.1 4.0 0.4 -0.3
ASEAN 5 -Total 3.2 -1.4 2.2 2.6 3.1 2.4 2.0 1.9 -0.6 -3.7 4.8 1.3 3.4 0.8 1.7
China – New series 1.3 0.5 3.8 1.1 1.7 0.7 3.8 3.6 -2.7 -0.5 3.1 -1.6 -3.3 -2.1 -2.7
Note: estimated as a Tornqvist index
Source: The Conference Board, IMF, Macquarie Research, October 2016
Fig 165 China’s growth of total factor productivity, (TFP) per annum, %
Country 1990 1991 1992 1993 1994 1995 1996 1997 1998 1999 2000 2001 2002 2003 2004 2005 2006 2007 2008 2009 2010 2011 2012 2013 2014
China - Old -0.6 2.4 4.6 3.4 3.4 8.0 -4.4 -1.1 -5.7 0.6 3.3 4.7 5.9 7.8 2.7 3.5 4.6 5.9 2.2 1.8 2.7 2.0 0.5 0.4 -0.1
China - New -4.5 1.1 4.1 2.9 1.1 2.0 -1.1 0.4 -6.3 -0.9 1.3 0.5 3.8 1.1 1.7 0.7 3.8 3.6 -2.7 -0.5 3.1 -1.6 -3.3 -2.1 -2.7
Note: estimated as a Tornqvist index
The Conference board provides an explanation of the methodological differences between the old and new series here: https://www.conference-board.org/retrievefile.cfm?filename=FAQ-for-China-GDP-vs4_10nov15.pdf&type=subsite. “The Maddison-Wu approach, which the Conference Board has adopted, reconstructs aggregate real GDP growth from the bottom-up, on a sector-by-sector basis. The biggest adjustments are for the industrial sector and the so-called “non-material services” sector, which includes banking & financing, real estate, professional services, education, healthcare, culture & entertainment services, and government services. We argue that the upward bias in the published GDP numbers in China is attributable to two sources: (1) a ‘misreporting effect” which accounts for about two-thirds of the upward bias; and (2) a “price effect” which accounts for the remaining one third. The price effect includes the adjustment for the “non-material services” sector, where the Conference Board has introduced judgemental labour productivity growth estimate of 1% pa 1982-91 and 2% from 1992 onwards – in line with common experience at China’s level of development. In contrast, the official data has 6% pa growth on average.”
Source: The Conference Board, Macquarie Research, October 2016
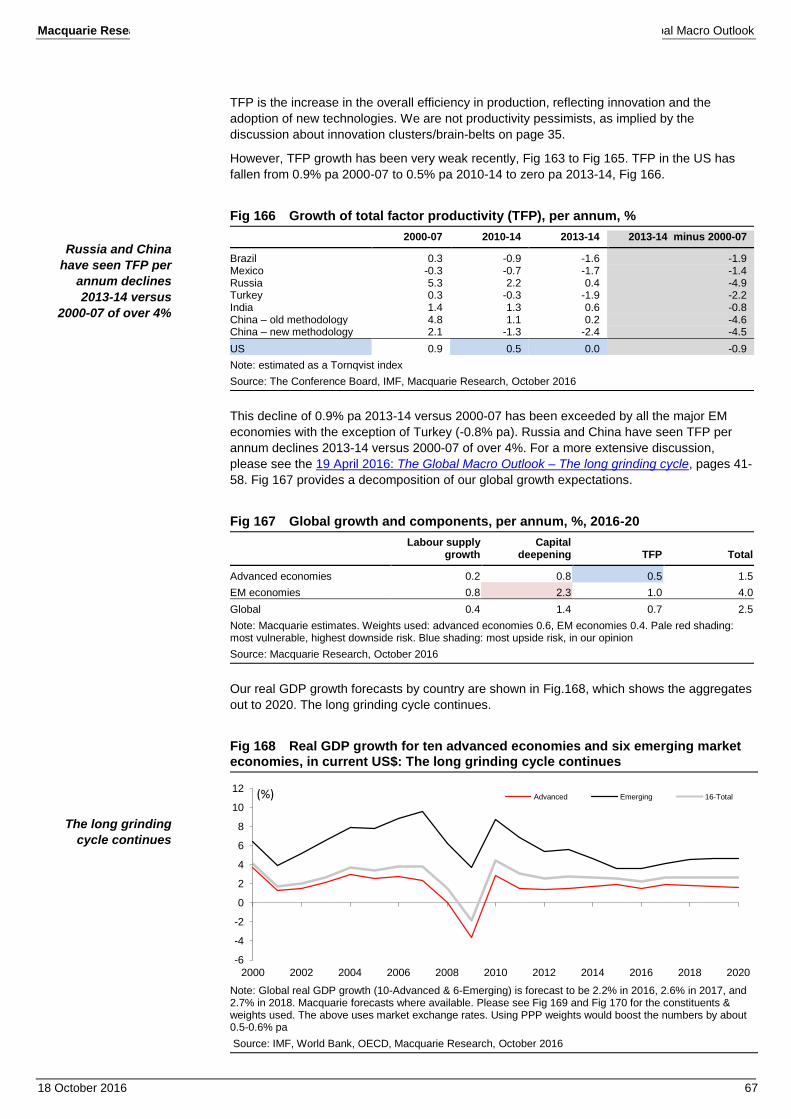
Macquarie Research The Global Macro Outlook
18 October 2016 67
TFP is the increase in the overall efficiency in production, reflecting innovation and the
adoption of new technologies. We are not productivity pessimists, as implied by the
discussion about innovation clusters/brain-belts on page 35.
However, TFP growth has been very weak recently, Fig 163 to Fig 165. TFP in the US has
fallen from 0.9% pa 2000-07 to 0.5% pa 2010-14 to zero pa 2013-14, Fig 166.
Fig 166 Growth of total factor productivity (TFP), per annum, %
2000-07 2010-14 2013-14 2013-14 minus 2000-07
Brazil 0.3 -0.9 -1.6 -1.9 Mexico -0.3 -0.7 -1.7 -1.4 Russia 5.3 2.2 0.4 -4.9 Turkey 0.3 -0.3 -1.9 -2.2 India 1.4 1.3 0.6 -0.8 China – old methodology 4.8 1.1 0.2 -4.6 China – new methodology 2.1 -1.3 -2.4 -4.5
US 0.9 0.5 0.0 -0.9
Note: estimated as a Tornqvist index
Source: The Conference Board, IMF, Macquarie Research, October 2016
This decline of 0.9% pa 2013-14 versus 2000-07 has been exceeded by all the major EM
economies with the exception of Turkey (-0.8% pa). Russia and China have seen TFP per
annum declines 2013-14 versus 2000-07 of over 4%. For a more extensive discussion,
please see the 19 April 2016: The Global Macro Outlook – The long grinding cycle, pages 41-
58. Fig 167 provides a decomposition of our global growth expectations.
Fig 167 Global growth and components, per annum, %, 2016-20
Labour supply
growth Capital
deepening TFP Total
Advanced economies 0.2 0.8 0.5 1.5
EM economies 0.8 2.3 1.0 4.0
Global 0.4 1.4 0.7 2.5
Note: Macquarie estimates. Weights used: advanced economies 0.6, EM economies 0.4. Pale red shading: most vulnerable, highest downside risk. Blue shading: most upside risk, in our opinion
Source: Macquarie Research, October 2016
Our real GDP growth forecasts by country are shown in Fig.168, which shows the aggregates
out to 2020. The long grinding cycle continues.
Fig 168 Real GDP growth for ten advanced economies and six emerging market economies, in current US$: The long grinding cycle continues
Note: Global real GDP growth (10-Advanced & 6-Emerging) is forecast to be 2.2% in 2016, 2.6% in 2017, and 2.7% in 2018. Macquarie forecasts where available. Please see Fig 169 and Fig 170 for the constituents & weights used. The above uses market exchange rates. Using PPP weights would boost the numbers by about 0.5-0.6% pa
Source: IMF, World Bank, OECD, Macquarie Research, October 2016
-6
-4
-2
0
2
4
6
8
10
12
2000 2002 2004 2006 2008 2010 2012 2014 2016 2018 2020
Advanced Emerging 16-Total(%)
Russia and China
have seen TFP per
annum declines
2013-14 versus
2000-07 of over 4%
The long grinding
cycle continues

Ma
cq
ua
rie R
es
ea
rch
T
he
Glo
ba
l Macro
Outlo
ok
18
Octo
be
r 20
16
68
Fig 169 GDP in current US$ for 10-Advanced countries and 6-Emerging market economies. Also for the 5-ASEAN majors
Country Name
2000 % of total
2001 % of total
2002 % of total
2003 % of total
2004 % of total
2005 % of total
2006 % of total
2007 % of total
2008 % of total
2009 % of total
2010 % of total
2011 % of total
2012 % of total
2013 % of total
2014 % of total
2015 % of total
10-advanced countries (GDP in trillion) US 10.3 38% 10.6 40% 11.0 40% 11.5 37% 12.3 36% 13.1 35% 13.9 35% 14.5 33% 14.7 31% 14.4 32% 15.0 30% 15.5 29% 16.2 29% 16.8 30% 17.3 30% 17.9 32% Japan 4.7 18% 4.2 16% 4.0 14% 4.3 14% 4.7 13% 4.6 12% 4.4 11% 4.4 10% 4.8 10% 5.0 11% 5.5 11% 5.9 11% 6.0 11% 4.9 9% 4.6 8% 4.1 7% Germany 1.9 7% 1.9 7% 2.1 7% 2.5 8% 2.8 8% 2.9 8% 3.0 8% 3.4 8% 3.7 8% 3.4 8% 3.4 7% 3.8 7% 3.5 6% 3.7 7% 3.9 7% 3.4 6% France 1.4 5% 1.4 5% 1.5 5% 1.8 6% 2.1 6% 2.2 6% 2.3 6% 2.7 6% 2.9 6% 2.7 6% 2.6 5% 2.9 5% 2.7 5% 2.8 5% 2.8 5% 2.4 4% Italy 1.1 4% 1.2 4% 1.3 5% 1.6 5% 1.8 5% 1.9 5% 1.9 5% 2.2 5% 2.4 5% 2.2 5% 2.1 4% 2.3 4% 2.1 4% 2.1 4% 2.1 4% 1.8 3% Spain 0.6 2% 0.6 2% 0.7 3% 0.9 3% 1.1 3% 1.2 3% 1.3 3% 1.5 3% 1.6 3% 1.5 3% 1.4 3% 1.5 3% 1.4 2% 1.4 2% 1.4 2% 1.2 2% United Kingdom
1.5 6% 1.5 6% 1.7 6% 1.9 6% 2.3 7% 2.4 7% 2.6 7% 3.0 7% 2.8 6% 2.3 5% 2.4 5% 2.6 5% 2.6 5% 2.7 5% 3.0 5% 2.8 5%
Australia 0.4 2% 0.4 1% 0.4 1% 0.5 2% 0.6 2% 0.7 2% 0.7 2% 0.9 2% 1.1 2% 0.9 2% 1.1 2% 1.4 3% 1.5 3% 1.6 3% 1.5 2% 1.3 2% Canada 0.7 3% 0.7 3% 0.8 3% 0.9 3% 1.0 3% 1.2 3% 1.3 3% 1.5 3% 1.5 3% 1.4 3% 1.6 3% 1.8 3% 1.8 3% 1.8 3% 1.8 3% 1.6 3% S. Korea 0.6 2% 0.5 2% 0.6 2% 0.7 2% 0.8 2% 0.9 2% 1.0 3% 1.1 3% 1.0 2% 0.9 2% 1.1 2% 1.2 2% 1.2 2% 1.3 2% 1.4 2% 1.4 2%
(Advanced) 23.3 87% 23.1 87% 23.9 86% 26.6 86% 29.4 85% 30.9 84% 32.4 82% 35.0 79% 36.7 77% 34.8 76% 36.3 74% 38.8 71% 39.0 71% 39.1 69% 39.8 68% 38.0 68%
6-emerging market economies (GDP in trillion) Brazil 0.6 2% 0.6 2% 0.5 2% 0.6 2% 0.7 2% 0.9 2% 1.1 3% 1.4 3% 1.7 3% 1.6 4% 2.1 4% 2.5 5% 2.2 4% 2.2 4% 2.4 4% 1.8 3% Mexico 0.7 3% 0.7 3% 0.7 3% 0.7 2% 0.8 2% 0.9 2% 1.0 2% 1.0 2% 1.1 2% 0.9 2% 1.1 2% 1.2 2% 1.2 2% 1.3 2% 1.3 2% 1.1 2% Russia 0.3 1% 0.3 1% 0.3 1% 0.4 1% 0.6 2% 0.8 2% 1.0 2% 1.3 3% 1.7 3% 1.2 3% 1.5 3% 1.9 4% 2.0 4% 2.1 4% 2.0 3% 1.3 2% Turkey 0.3 1% 0.2 1% 0.2 1% 0.3 1% 0.4 1% 0.5 1% 0.5 1% 0.6 1% 0.7 2% 0.6 1% 0.7 1% 0.8 1% 0.8 1% 0.8 1% 0.8 1% 0.7 1% India 0.5 2% 0.5 2% 0.5 2% 0.6 2% 0.7 2% 0.8 2% 0.9 2% 1.2 3% 1.2 3% 1.4 3% 1.7 3% 1.8 3% 1.8 3% 1.9 3% 2.0 3% 2.1 4% China 1.2 4% 1.3 5% 1.5 5% 1.6 5% 1.9 6% 2.3 6% 2.7 7% 3.5 8% 4.5 10% 5.0 11% 5.9 12% 7.3 13% 8.2 15% 9.2 16% 10.4 18% 10.9 19%
(Emerging) 3.5 13% 3.6 13% 3.8 14% 4.3 14% 5.1 15% 6.1 16% 7.2 18% 9.1 21% 10.9 23% 10.7 24% 13.1 26% 15.5 29% 16.3 29% 17.5 31% 18.9 31% 17.9 31%
Total 26.9 26.7 27.7 30.9 34.5 37.0 39.6 44.1 47.5 45.5 49.4 54.3 55.3 56.7 58.7 55.9
5-Asean Countries (GDP in trillion) Indonesia 0.2 30% 0.2 30% 0.2 33% 0.2 35% 0.3 34% 0.3 34% 0.4 36% 0.4 36% 0.5 37% 0.5 39% 0.8 42% 0.9 43% 0.9 43% 0.9 41% 0.9 40% 0.9 40% Malaysia 0.1 17% 0.1 17% 0.1 17% 0.1 16% 0.1 16% 0.1 17% 0.2 16% 0.2 16% 0.2 17% 0.2 15% 0.3 14% 0.3 15% 0.3 14% 0.3 14% 0.3 15% 0.3 14% Singapore 0.1 17% 0.1 17% 0.1 15% 0.1 14% 0.1 15% 0.1 15% 0.1 15% 0.2 15% 0.2 14% 0.2 14% 0.2 13% 0.3 13% 0.3 13% 0.3 13% 0.3 14% 0.3 14% Philippines 0.1 15% 0.1 14% 0.1 14% 0.1 12% 0.1 12% 0.1 12% 0.1 12% 0.1 12% 0.2 12% 0.2 12% 0.2 11% 0.2 11% 0.3 12% 0.3 12% 0.3 13% 0.3 14% Thailand 0.1 22% 0.1 22% 0.1 21% 0.2 22% 0.2 22% 0.2 22% 0.2 22% 0.3 21% 0.3 21% 0.3 20% 0.3 19% 0.4 18% 0.4 18% 0.4 19% 0.4 18% 0.4 18%
5-ASEAN 0.6 100 0.5 100 0.6 100 0.7 100 0.8 100 0.8 100 1.0 100 1.2 100 1.4 100 1.4 100 1.8 100 2.1 100 2.2 100 2.2 100 2.2 100 2.1 100
Note: The GDP trillions numbers are to one decimal point, so rounding plays an important part in the ASEAN part of the table
Source: IMF, World Bank, Macquarie Research, October 2016

Ma
cq
ua
rie R
es
ea
rch
T
he
Glo
ba
l Macro
Outlo
ok
18
Octo
be
r 20
16
69
Fig 170 Real GDP growth (annual %), totals weighted by GDP in current US$ shares, Macquarie where available (shaded in grey)
Country Name 1990 1991 1992 1993 1994 1995 1996 1997 1998 1999 2000 2001 2002 2003 2004 2005 2006 2007 2008 2009 2010 2011 2012 2013 2014 2015 2016 2017 2018 2019 2020
Advanced US 1.9 -0.1 3.6 2.7 4.0 2.7 3.8 4.5 4.5 4.8 4.1 1.0 1.8 2.8 3.8 3.3 2.7 1.8 -0.3 -2.8 2.5 1.6 2.3 2.2 2.2 2.6 1.6 2.4 2.1 1.9 1.8 Japan 5.6 3.3 0.8 0.2 0.9 1.9 2.6 1.6 -2.0 -0.2 2.3 0.4 0.3 1.7 2.4 1.3 1.7 2.2 -1.0 -5.5 4.7 -0.5 1.8 1.6 0.4 0.6 0.4 0.6 0.7 0.8 0.8 Germany 5.3 5.1 1.9 -1.0 2.5 1.7 0.8 1.8 2.0 2.0 3.0 1.7 0.0 -0.7 1.2 0.7 3.7 3.3 1.1 -5.6 4.1 3.6 0.4 0.4 1.6 1.5 1.5 1.6 1.5 1.3 1.3 France 2.9 1.0 1.6 -0.6 2.3 2.1 1.4 2.3 3.6 3.4 3.9 2.0 1.1 0.8 2.8 1.6 2.4 2.4 0.2 -2.9 2.0 2.1 0.3 0.7 0.2 1.2 1.2 1.5 1.6 1.7 1.9 Italy 2.0 1.5 0.8 -0.9 2.2 2.9 1.3 1.8 1.6 1.6 3.7 1.8 0.3 0.2 1.6 0.9 2.0 1.5 -1.0 -5.5 1.7 0.6 -2.3 -1.7 -0.4 0.8 0.8 1.3 1.2 1.1 1.1 Spain 3.8 2.5 0.9 -1.0 2.4 2.8 2.7 3.7 4.3 4.5 5.3 4.0 2.9 3.2 3.2 3.7 4.2 3.8 1.1 -3.6 0.0 -0.6 -2.1 -1.2 1.4 3.1 3.1 2.5 2.2 2.0 1.9 UK 0.5 -1.2 0.4 2.6 4.0 2.5 2.7 2.6 3.5 3.2 3.8 2.7 2.5 4.3 2.5 2.8 3.0 2.6 -0.3 -4.3 1.9 1.6 0.7 1.7 2.9 2.2 2.0 1.2 1.2 1.6 1.7 Australia 3.5 -0.4 0.4 4.0 4.0 3.9 3.9 3.9 4.4 5.0 3.9 1.9 3.9 3.1 4.2 3.2 3.0 3.8 3.7 1.7 2.0 2.3 3.7 2.5 2.6 2.4 2.8 2.3 3.2 2.8 2.3 Canada 0.1 -2.1 0.9 2.6 4.6 2.7 1.7 4.3 4.1 5.0 5.1 1.7 2.8 1.9 3.1 3.2 2.6 2.0 1.2 -2.7 3.4 2.5 1.7 2.0 2.5 1.1 1.2 1.8 1.6 1.4 1.4 S. Korea 9.3 9.7 5.8 6.3 8.8 8.9 7.2 5.8 -5.7 10.7 8.8 4.5 7.4 2.9 4.9 3.9 5.2 5.5 2.8 0.7 6.5 3.7 2.3 3.0 3.3 2.6 2.9 2.9 2.7 2.6 2.6 10-Total 3.7 1.3 1.5 2.1 3.0 2.5 2.7 2.3 0.1 -3.6 2.9 1.5 1.4 1.5 1.7 2.0 1.5 1.9 1.8 1.7 1.6 Emerging Brazil -4.3 1.5 -0.5 4.7 5.3 4.4 2.1 3.4 0.0 0.3 4.3 1.3 2.7 1.1 5.7 3.2 4.0 6.1 5.2 -0.3 7.5 2.7 1.0 2.7 0.1 -3.0 -3.0 -1.0 2.3 2.4 2.5 Mexico 5.1 4.2 3.6 4.1 4.7 -5.8 5.9 7.0 4.7 2.7 5.3 -0.6 0.1 1.4 4.3 3.0 5.0 3.1 1.4 -4.7 5.1 4.0 4.0 1.4 2.1 2.3 2.3 2.8 3.1 3.2 3.3 Russia -3.0 -5.0 -14.5 -8.7 -12.6 -4.1 -3.6 1.4 -5.3 6.4 10.0 5.1 4.7 7.3 7.2 6.4 8.2 8.5 5.2 -7.8 4.5 4.3 3.4 1.3 0.6 -3.8 -3.8 -0.6 1.0 1.5 1.5 Turkey 9.3 0.7 5.0 7.7 -4.7 7.9 7.4 7.6 2.3 -3.4 6.8 -5.7 6.2 5.3 9.4 8.4 6.9 4.7 0.7 -4.8 9.2 8.8 2.1 4.2 2.9 3.0 3.0 2.9 3.7 3.5 3.5 India 5.5 1.1 5.5 4.8 6.7 7.6 7.5 4.0 6.2 8.8 3.8 4.8 3.8 7.9 7.9 9.3 9.3 9.8 3.9 8.5 10.3 6.6 5.1 6.9 6.7 7.2 7.6 7.8 7.7 7.5 7.5 China 3.8 9.2 14.2 14.0 13.1 10.9 10.0 9.3 7.8 7.6 8.4 8.3 9.1 10.0 10.1 11.3 12.7 14.2 9.6 9.2 10.4 9.3 7.7 7.7 7.2 6.8 6.7 6.4 6.0 6.0 6.0
6-Total 6.4 3.9 5.2 6.5 7.9 7.8 8.8 9.6 6.2 3.8 8.8 6.9 5.4 5.6 4.7 3.7 3.7 4.2 4.6 4.6 4.7
16-Total 4.1 1.7 2.0 2.7 3.7 3.4 3.9 3.8 1.5 -1.8 4.5 3.0 2.6 2.8 2.7 2.5 2.2 2.6 2.7 2.7 2.6
ASEAN Indonesia 9.0 8.9 7.2 7.3 7.5 8.4 7.6 4.7 -13.1 0.8 4.9 3.6 4.5 4.8 5.0 5.7 5.5 6.3 6.0 4.6 6.2 6.5 6.3 5.8 5.0 4.8 4.9 5.0 5.2 5.0 5.0 Malaysia 9.0 9.5 8.9 9.9 9.2 9.8 10.0 7.3 -7.4 6.1 8.9 0.5 5.4 5.8 6.8 5.3 5.6 6.3 4.8 -1.5 7.4 5.2 5.6 4.7 6.0 5.0 4.3 4.7 5.1 5.1 5.1 Singapore 10.0 6.7 7.1 11.5 10.9 7.0 7.5 8.3 -2.2 6.1 8.9 -1.0 4.2 4.4 9.5 7.5 8.9 9.1 1.8 -0.6 15.2 6.1 2.5 3.9 2.9 2.0 1.9 2.1 2.4 2.6 2.6 Philippines 3.0 -0.6 0.3 2.1 4.4 4.7 5.8 5.2 -0.6 3.1 4.4 2.9 3.6 5.0 6.7 4.8 5.2 6.6 4.2 1.1 7.6 3.7 6.8 7.2 6.1 5.9 6.2 6.1 6.3 6.0 6.0 Thailand 11.2 8.6 8.1 8.3 9.0 9.2 5.9 -1.4 -10.5 4.4 4.8 2.2 5.3 7.1 6.3 4.6 5.1 5.0 2.5 -2.3 7.8 0.1 7.7 1.8 0.9 2.8 3.2 3.3 3.5 3.5 3.5 5-ASEAN 6.2 1.9 4.7 5.4 6.5 5.5 5.9 6.5 4.3 1.2 8.0 4.8 6.0 4.8 4.2 4.2 4.3 4.4 4.6 4.5 4.5
Note: Totals are weighted by the respective year ‘GDP in current US$’ weights from Fig 169. 2016-20 use 2015 weights.
Source: IMF, World Bank, Macquarie Research, October 2016

Ma
cq
ua
rie R
es
ea
rch
T
he
Glo
ba
l Macro
Outlo
ok
18
Octo
be
r 20
16
70
Fig 171 CPI, YoY, forecasts Macquarie where available (shaded in grey), totals weighted by GDP in current US$ shares
Country Name 1990 1991 1992 1993 1994 1995 1996 1997 1998 1999 2000 2001 2002 2003 2004 2005 2006 2007 2008 2009 2010 2011 2012 2013 2014 2015 2016 2017 2018 2019 2020
Advanced US 5.4 4.2 3.0 3.0 2.6 2.8 2.9 2.3 1.6 2.2 3.4 2.8 1.6 2.3 2.7 3.4 3.2 2.9 3.8 -0.4 1.6 3.2 2.1 1.5 1.6 0.1 1.3 2.5 2.4 2.4 2.4 Japan 3.0 3.3 1.7 1.3 0.7 -0.1 0.1 1.8 0.7 -0.3 -0.7 -0.8 -1.3 0.2 0.0 -0.3 0.2 0.1 1.4 -1.3 -0.7 -0.3 0.0 0.4 2.8 0.8 -0.1 0.3 0.5 0.9 1.3 Germany 5.1 4.4 2.7 1.7 1.4 1.9 0.9 0.6 1.5 2.0 1.4 1.0 1.7 1.5 1.6 2.3 2.6 0.3 1.1 2.1 2.0 1.5 0.8 0.2 1.2 1.5 1.6 1.8 1.9 France 3.4 3.2 2.4 2.1 1.7 1.8 2.0 1.2 0.6 0.5 1.7 1.6 1.9 2.1 2.1 1.7 1.7 1.5 2.8 0.1 1.5 2.1 2.0 0.9 0.6 0.1 1.0 1.1 1.3 1.5 1.7 Italy 6.5 6.3 5.1 4.5 4.0 5.2 4.0 2.0 2.0 1.7 2.5 2.8 2.5 2.7 2.2 2.0 2.1 1.8 3.4 0.8 1.5 2.7 3.0 1.2 0.2 0.2 0.7 1.0 1.1 1.2 1.3 Spain 6.7 5.9 5.9 4.6 4.7 4.7 3.6 2.0 1.8 2.3 3.4 3.6 3.1 3.0 3.0 3.4 3.5 2.8 4.1 -0.3 1.8 3.2 2.4 1.4 -0.2 -0.3 0.9 1.0 1.2 1.4 1.5 UK 7.0 7.5 4.3 2.5 2.0 2.7 2.5 1.8 1.6 1.3 0.8 1.2 1.3 1.4 1.3 2.0 2.3 2.3 3.6 2.2 3.3 4.5 2.8 2.6 1.5 0.0 0.7 2.3 2.5 1.7 1.8 Australia 7.3 3.2 1.0 1.8 1.9 4.6 2.6 0.3 0.9 1.5 4.5 4.4 3.0 2.8 2.3 2.7 3.5 2.3 4.4 1.8 2.8 3.4 1.8 2.4 2.5 1.5 1.2 1.9 1.8 2.0 2.0 Canada 4.8 5.6 1.5 1.8 0.2 2.2 1.6 1.6 1.0 1.7 2.7 2.5 2.3 2.8 1.9 2.2 2.0 2.1 2.4 0.3 1.8 2.9 1.5 0.9 1.9 1.1 1.5 1.8 2.0 2.0 2.0 S. Korea 8.6 9.3 6.3 4.7 6.3 4.5 4.9 4.4 7.5 0.8 2.3 4.1 2.8 3.5 3.6 2.8 2.2 2.5 4.7 2.8 3.0 4.0 2.2 1.3 1.3 0.7 1.1 1.9 2.0 2.0 2.0 10-Total 2.1 2.0 1.3 1.8 2.0 2.3 2.4 2.2 3.2 0.0 1.4 2.5 1.8 1.4 1.5 0.3 1.0 1.9 1.9 2.0 2.0 Emerging Brazil 2948 432.8 951.6 1928 2076 66.0 15.8 6.9 3.2 4.9 7.0 6.8 8.5 14.7 6.6 6.9 4.2 3.6 5.7 4.9 5.0 6.6 5.4 6.2 8.9 8.9 6.3 5.2 5.0 4.8 4.6 Mexico 26.7 22.7 15.5 9.8 7.0 35.0 34.4 20.6 15.9 16.6 9.5 6.4 5.0 4.5 4.7 4.0 3.6 4.0 5.1 5.3 4.2 3.4 4.1 3.8 4.0 2.8 3.0 3.0 3.0 3.0 3.0 Russia 874.6 307.6 197.5 47.7 14.8 27.7 85.7 20.8 21.5 15.8 13.7 10.9 12.7 9.7 9.0 14.1 11.7 6.9 8.4 5.1 6.8 7.8 15.8 8.6 7.3 5.0 4.0 4.0 Turkey 60.3 66.0 70.1 66.1 106.3 88.1 80.3 85.7 84.6 64.9 54.9 54.4 45.0 25.3 10.6 10.1 9.6 8.8 10.4 6.3 8.6 6.5 8.9 7.5 8.9 7.4 7.0 6.5 6.5 6.5 6.5 India 9.0 13.9 11.8 6.4 10.2 10.2 9.0 7.2 13.2 4.7 4.0 3.7 4.4 3.8 3.8 4.2 6.1 6.4 8.4 10.9 12.0 8.9 9.3 10.9 6.7 4.9 5.2 5.0 5.0 5.0 5.0 China 3.1 3.5 6.3 14.6 24.2 16.9 8.3 2.8 -0.8 -1.4 0.3 0.7 -0.8 1.2 3.9 1.8 1.5 4.8 5.9 -0.7 3.3 5.4 2.7 2.6 1.5 1.5 2.0 2.0 2.5 2.5 2.5 6 -Total 9.4 7.9 6.6 6.9 5.7 5.2 4.5 5.6 7.6 3.9 5.5 6.3 4.5 4.8 4.3 4.2 3.7 3.4 3.6 3.5 3.4 16-Total 3.0 2.8 2.0 2.5 2.5 2.8 2.7 2.9 4.2 0.9 2.5 3.6 2.6 2.4 2.4 1.5 1.8 2.3 2.4 2.4 2.5 ASEAN Indonesia 7.8 9.4 7.5 9.7 8.5 9.4 8.0 6.2 58.4 20.5 3.7 11.5 11.9 6.6 6.2 10.5 13.1 6.4 9.8 4.8 5.1 5.4 4.3 6.4 6.5 6.4 4.1 4.9 5.0 5.0 5.0 Malaysia 2.6 4.4 4.8 3.5 3.7 3.5 3.5 2.7 5.3 2.7 1.5 1.4 1.8 1.0 1.5 3.0 3.6 2.0 5.4 0.6 1.7 3.2 1.7 2.1 2.1 2.1 2.7 2.8 2.6 2.5 2.5 Singapore 3.5 3.4 2.3 2.3 3.1 1.7 1.4 2.0 -0.3 0.0 1.4 1.0 -0.4 0.5 1.7 0.4 1.0 2.1 6.5 0.6 2.8 5.3 4.5 2.4 -0.4 -0.5 -0.3 1.0 1.4 1.5 1.5 Philippines 12.7 18.5 8.6 6.9 8.4 6.7 7.5 5.6 9.3 5.9 4.0 5.3 2.7 2.3 4.8 6.5 5.5 2.9 8.3 4.2 3.8 4.6 3.2 3.0 1.4 1.4 1.6 2.8 3.3 3.0 3.0 Thailand 5.9 5.7 4.1 3.3 5.0 5.8 5.8 5.6 8.0 0.3 1.6 1.6 0.7 1.8 2.8 4.5 4.6 2.2 5.5 -0.8 3.3 3.8 3.0 2.2 -0.8 -0.9 0.3 1.7 2.2 2.0 2.0 5-ASEAN 2.5 5.0 4.7 3.2 3.8 5.9 7.1 3.7 7.5 2.4 3.8 4.7 3.6 4.0 2.9 2.8 2.2 3.2 3.4 3.4 3.3
Note: On the above data, for advanced countries the CPI increases at 1.8% pa1999-2020, emerging economies 5.3% and the 16-Total 2.6%. Brazil’s inflation 1990-1994 has been rounded to the nearest percent.
For advanced countries the GDP deflator increases at 1.5% pa1999-2014, emerging economies 6.8% and the 16-Total 2.5%
Source: World Bank, IMF, Macquarie Research, October 2016

Ma
cq
ua
rie R
es
ea
rch
T
he
Glo
ba
l Macro
Outlo
ok
18
Octo
be
r 20
16
71
Fig 172 G20 real GDP growth softened over 3Q and 4Q 2015, YoY based on quarterly data
2011 2012 2013 2014 2015 2016
Q1 Q2 Q3 Q4 Q1 Q2 Q3 Q4 Q1 Q2 Q3 Q4 Q1 Q2 Q3 Q4 Q1 Q2 Q3 Q4 Q1 Q2 Q3 Q4
G20 4.8 4.3 3.9 3.5 3.5 3.2 3.0 2.6 2.6 2.9 3.2 3.6 3.5 3.3 3.2 3.1 3.2 3.2 3.1 3.0 3.1
Argentina 9.5 5.3 5.6 4.3 0.8 -3.7 -1.5 0.2 1.1 5.3 2.7 0.2 -1.0 -2.5 -4.0 -2.6 0.3 2.9 3.8 2.6 0.2
Australia 2.0 2.5 3.1 3.1 4.4 3.9 3.2 2.7 1.8 2.0 2.0 2.3 3.0 2.7 2.6 2.3 2.3 2.1 2.7 2.9 3.1
Brazil 5.0 4.7 3.5 2.6 1.6 1.0 2.6 2.6 3.0 3.8 2.8 2.5 2.5 -0.4 -1.0 -0.6 -2.2 -2.9 -4.4 -5.9 -5.1
Canada 3.1 2.8 3.5 3.1 2.4 2.6 1.4 0.7 1.7 1.8 2.3 3.1 2.2 2.7 2.5 2.4 2.0 1.0 1.0 0.3 1.1
China 10.2 9.9 9.4 8.7 8.0 7.5 7.4 8.0 7.8 7.5 7.9 7.6 7.3 7.4 7.1 7.2 7.0 7.0 6.9 6.8 6.7
France 2.8 2.1 1.9 1.5 0.4 0.3 0.2 0.0 0.0 0.9 0.7 0.9 0.9 0.4 0.7 0.7 1.3 1.1 1.1 1.3 1.3
Germany 5.6 3.7 3.3 2.4 0.9 0.8 0.6 0.1 -0.5 0.3 0.5 1.3 2.3 1.4 1.2 1.5 1.1 1.6 1.7 1.3 1.6
India 9.8 8.5 5.3 4.7 4.2 4.3 6.2 5.8 6.1 6.5 6.3 6.9 6.8 7.1 7.4 7.1 7.3 7.3 7.3 7.6 8.0
Indonesia 6.3 6.2 6.2 6.0 6.1 6.1 6.0 5.9 5.7 5.6 5.5 5.4 5.2 5.1 5.0 4.8 4.8 4.7 4.8 4.9 4.9
Italy 2.0 1.5 0.5 -1.1 -2.3 -3.2 -3.2 -2.7 -2.7 -2.0 -1.4 -0.9 -0.1 -0.2 -0.4 -0.4 0.1 0.6 0.8 1.1 1.0
Japan 0.1 -1.6 -0.5 0.3 3.3 3.5 0.3 0.0 0.1 1.1 2.1 2.1 2.4 -0.4 -1.5 -0.9 -0.9 0.7 1.8 0.8 0.0
Korea 4.8 3.7 3.4 2.9 2.6 2.4 2.1 2.1 2.2 2.7 3.2 3.5 3.9 3.5 3.3 2.7 2.4 2.2 2.8 3.1 2.8
Mexico 4.2 3.6 4.2 4.2 4.0 4.5 3.3 3.4 3.1 0.6 1.5 1.1 1.1 3.0 2.3 2.6 2.5 2.4 2.7 2.5 2.8
Russia 3.3 4.2 4.0 4.6 5.3 4.3 3.1 1.8 0.6 1.1 1.2 2.1 0.6 1.1 0.9 0.2 -2.8 -4.5 -3.7 -3.8 -1.2
Saudi Arabia .. .. .. .. .. .. .. .. .. .. .. .. .. .. .. .. .. .. .. .. ..
South Africa 3.9 3.8 2.9 2.6 2.1 2.4 2.4 2.0 2.0 2.1 2.2 3.0 2.2 1.4 1.6 1.4 2.3 1.6 1.1 0.2 -0.6
Turkey 11.9 9.1 9.2 5.2 2.3 2.9 1.9 1.4 3.4 4.4 4.5 4.6 4.6 2.2 2.3 3.0 2.5 4.0 4.7 4.7 4.4
United Kingdom 2.3 1.3 1.2 1.3 1.2 1.0 1.8 1.3 1.5 2.1 1.7 2.4 2.6 3.1 3.1 3.5 2.9 2.3 2.0 1.8 2.0
United States 1.9 1.7 1.2 1.7 2.8 2.5 2.4 1.3 1.3 1.0 1.7 2.7 1.6 2.4 2.9 2.5 3.3 3.0 2.2 1.9 1.6
European Union (28 countries) 2.8 1.9 1.6 0.8 -0.1 -0.4 -0.6 -0.7 -0.6 0.1 0.5 1.1 1.5 1.3 1.3 1.4 1.7 1.9 1.9 2.0 1.8
Euro area (19 countries) 2.8 1.8 1.4 0.5 -0.5 -0.8 -0.9 -1.0 -1.1 -0.4 0.0 0.6 1.1 0.8 0.8 1.0 1.3 1.6 1.6 1.7 1.7
Note: all data from the OECD with the exception of the pale green highlighted numbers which come from National Statistics sources
Aggregates above use PPP weights. Using market exchange rates would reduce the G20 real GDP growth numbers by 0.5-0.6%
“The G7 was established in 1976 as an informal forum of seven major industrial economies: Canada, France, Germany, Italy, Japan, the United Kingdom and the United States of America. It was re-named the G8 after the entry of Russia in 1998. In March 2014, the G7 voted to suspend Russia in response to escalating tensions with Ukraine that led to Russia's annexation of Crimea. However, the suspension is designed to be temporary. Where the G7 seeks agreement on current economic issues based on the interests of those countries, the G20 reflects the wider interests of both industrial and emerging-market economies. The G20 is made up of the finance ministers and central bank governors of 19 countries: Argentina, Australia, Brazil, Canada, China, France, Germany, India, Indonesia, Italy, Japan, Mexico, Russia, Saudi Arabia, South Africa, South Korea, Turkey, the United Kingdom, the United States of America” - plus the EU (Source: the Telegraph newspaper)
Source: OECD, Macquarie Research, October 2016

Macquarie Research The Global Macro Outlook
18 October 2016 72
Important disclosures:
Recommendation definitions
Macquarie - Australia/New Zealand Outperform – return >3% in excess of benchmark return Neutral – return within 3% of benchmark return Underperform – return >3% below benchmark return Benchmark return is determined by long term nominal GDP growth plus 12 month forward market dividend yield
Macquarie – Asia/Europe Outperform – expected return >+10% Neutral – expected return from -10% to +10% Underperform – expected return <-10%
Macquarie – South Africa Outperform – expected return >+10% Neutral – expected return from -10% to +10% Underperform – expected return <-10%
Macquarie - Canada Outperform – return >5% in excess of benchmark return Neutral – return within 5% of benchmark return Underperform – return >5% below benchmark return
Macquarie - USA Outperform (Buy) – return >5% in excess of Russell 3000 index return
Neutral (Hold) – return within 5% of Russell 3000 index return Underperform (Sell)– return >5% below Russell 3000 index return
Volatility index definition*
This is calculated from the volatility of historical price movements. Very high–highest risk – Stock should be expected to move up or down 60–100% in a year – investors should be aware this stock is highly speculative. High – stock should be expected to move up or down at least 40–60% in a year – investors should be aware this stock could be speculative. Medium – stock should be expected to move up or down at least 30–40% in a year. Low–medium – stock should be expected to move up or down at least 25–30% in a year. Low – stock should be expected to move up or down at least 15–25% in a year. * Applicable to Asia/Australian/NZ/Canada stocks only
Recommendations – 12 months Note: Quant recommendations may differ from
Fundamental Analyst recommendations
Financial definitions
All "Adjusted" data items have had the following adjustments made: Added back: goodwill amortisation, provision for catastrophe reserves, IFRS derivatives & hedging, IFRS impairments & IFRS interest expense Excluded: non recurring items, asset revals, property revals, appraisal value uplift, preference dividends & minority interests EPS = adjusted net profit / efpowa* ROA = adjusted ebit / average total assets ROA Banks/Insurance = adjusted net profit /average total assets ROE = adjusted net profit / average shareholders funds Gross cashflow = adjusted net profit + depreciation *equivalent fully paid ordinary weighted average number of shares All Reported numbers for Australian/NZ listed stocks are modelled under IFRS (International Financial Reporting Standards).
Recommendation proportions – For quarter ending 30 September 2016
AU/NZ Asia RSA USA CA EUR Outperform 47.26% 55.50% 38.46% 45.47% 59.09% 48.21% (for US coverage by MCUSA, 8.20% of stocks followed are investment banking clients)
Neutral 38.01% 29.31% 42.86% 48.77% 37.88% 36.79% (for US coverage by MCUSA, 8.25% of stocks followed are investment banking clients)
Underperform 14.73% 15.19% 18.68% 5.76% 3.03% 15.00% (for US coverage by MCUSA, 8.00% of stocks followed are investment banking clients)
Company-specific disclosures: Important disclosure information regarding the subject companies covered in this report is available at www.macquarie.com/research/disclosures.
Analyst certification: We hereby certify that all of the views expressed in this report accurately reflect our personal views about the subject company or companies and its or their securities. We also certify that no part of our compensation was, is or will be, directly or indirectly, related to the specific recommendations or views expressed in this report. The Analysts responsible for preparing this report receive compensation from Macquarie that is based upon various factors including Macquarie Group Ltd total revenues, a portion of which are generated by Macquarie Group’s Investment Banking activities. General disclaimers: Macquarie Securities (Australia) Ltd; Macquarie Capital (Europe) Ltd; Macquarie Capital Markets Canada Ltd; Macquarie Capital Markets North America Ltd; Macquarie Capital (USA) Inc; Macquarie Capital Limited and Macquarie Capital Limited, Taiwan Securities Branch; Macquarie Capital Securities (Singapore) Pte Ltd; Macquarie Securities (NZ) Ltd; Macquarie Equities South Africa (Pty) Ltd; Macquarie Capital Securities (India) Pvt Ltd; Macquarie Capital Securities (Malaysia) Sdn Bhd; Macquarie Securities Korea Limited and Macquarie Securities (Thailand) Ltd are not authorized deposit-taking institutions for the purposes of the Banking Act 1959 (Commonwealth of Australia), and their obligations do not represent deposits or other liabilities of Macquarie Bank Limited ABN 46 008 583 542 (MBL) or MGL. MBL does not guarantee or otherwise provide assurance in respect of the obligations of any of the above mentioned entities. MGL provides a guarantee to the Monetary Authority of Singapore in respect of the obligations and liabilities of Macquarie Capital Securities (Singapore) Pte Ltd for up to SGD 35 million. This research has been prepared for the general use of the wholesale clients of the Macquarie Group and must not be copied, either in whole or in part, or distributed to any other person. If you are not the intended recipient you must not use or disclose the information in this research in any way. If you received it in error, please tell us immediately by return e-mail and delete the document. We do not guarantee the integrity of any e-mails or attached files and are not responsible for any changes made to them by any other person. MGL has established and implemented a conflicts policy at group level (which may be revised and updated from time to time) (the "Conflicts Policy") pursuant to regulatory requirements (including the FCA Rules) which sets out how we must seek to identify and manage all material conflicts of interest. Nothing in this research shall be construed as a solicitation to buy or sell any security or product, or to engage in or refrain from engaging in any transaction. In preparing this research, we did not take into account your investment objectives, financial situation or particular needs. Macquarie salespeople, traders and other professionals may provide oral or written market commentary or trading strategies to our clients that reflect opinions which are contrary to the opinions expressed in this research. Macquarie Research produces a variety of research products including, but not limited to, fundamental analysis, macro-economic analysis, quantitative analysis, and trade ideas. Recommendations contained in one type of research product may differ from recommendations contained in other types of research, whether as a result of differing time horizons, methodologies, or otherwise. Before making an investment decision on the basis of this research, you need to consider, with or without the assistance of an adviser, whether the advice is appropriate in light of your particular investment needs, objectives and financial circumstances. There are risks involved in securities trading. The price of securities can and does fluctuate, and an individual security may even become valueless. International investors are reminded of the additional risks inherent in international investments, such as currency fluctuations and international stock market or economic conditions, which may adversely affect the value of the investment. This research is based on information obtained from sources believed to be reliable but we do not make any representation or warranty that it is accurate, complete or up to date. We accept no obligation to correct or update the information or opinions in it. Opinions expressed are subject to change without notice. No member of the Macquarie Group accepts any liability whatsoever for any direct, indirect, consequential or other loss arising from any use of this research and/or further communication in relation to this research. Clients should contact analysts at, and execute transactions through, a Macquarie Group entity in their home jurisdiction unless governing law permits otherwise. The date and timestamp for above share price and market cap is the closed price of the price date. #CLOSE is the final price at which the security is traded in the relevant exchange on the date indicated. Country-specific disclaimers: Australia: In Australia, research is issued and distributed by Macquarie Securities (Australia) Ltd (AFSL No. 238947), a participating organisation of the Australian Securities Exchange. New Zealand: In New Zealand, research is issued and distributed by Macquarie Securities (NZ) Ltd, a NZX Firm. Canada: In Canada, research is prepared, approved and distributed by Macquarie Capital Markets Canada Ltd, a participating organisation of the Toronto Stock Exchange, TSX Venture Exchange & Montréal Exchange. Macquarie Capital Markets North America Ltd., which is a registered broker-dealer and member of FINRA, accepts responsibility for the contents of reports issued by Macquarie Capital Markets Canada Ltd in the United States and sent to US persons. Any US person wishing to effect transactions in the securities described in the reports issued by Macquarie Capital Markets Canada Ltd should do so with Macquarie Capital Markets North America Ltd. The Research Distribution Policy of Macquarie Capital Markets Canada Ltd is to allow all clients that are entitled to have equal access to our research. United Kingdom: In the United Kingdom, research is issued and

Macquarie Research The Global Macro Outlook
18 October 2016 73
distributed by Macquarie Capital (Europe) Ltd, which is authorised and regulated by the Financial Conduct Authority (No. 193905). Germany: In Germany, this research is issued and/or distributed by Macquarie Capital (Europe) Limited, Niederlassung Deutschland, which is authorised and regulated by the UK Financial Conduct Authority (No. 193905). and in Germany by BaFin. France: In France, research is issued and distributed by Macquarie Capital (Europe) Ltd, which is authorised and regulated in the United Kingdom by the Financial Conduct Authority (No. 193905). Hong Kong & Mainland China: In Hong Kong, research is issued and distributed by Macquarie Capital Limited, which is licensed and regulated by the Securities and Futures Commission. In Mainland China, Macquarie Securities (Australia) Limited Shanghai Representative Office only engages in non-business operational activities excluding issuing and distributing research. Only non-A share research is distributed into Mainland China by Macquarie Capital Limited. Japan: In Japan, research is Issued and distributed by Macquarie Capital Securities (Japan) Limited, a member of the Tokyo Stock Exchange, Inc. and Osaka Exchange, Inc. (Financial Instruments Firm, Kanto Financial Bureau (kin-sho) No. 231, a member of Japan Securities Dealers Association). India: In India, research is issued and distributed by Macquarie Capital Securities (India) Pvt. Ltd. (CIN: U65920MH1995PTC090696), 92, Level 9, 2 North Avenue, Maker Maxity, Bandra Kurla Complex, Bandra (East), Mumbai – 400 051, India, which is a SEBI registered Research Analyst having registration no. INH000000545. Malaysia: In Malaysia, research is issued and distributed by Macquarie Capital Securities (Malaysia) Sdn. Bhd. (Company registration number: 463469-W) which is a Participating Organisation of Bursa Malaysia Berhad and a holder of Capital Markets Services License issued by the Securities Commission. Taiwan: In Taiwan, research is issued and distributed by Macquarie Capital Limited, Taiwan Securities Branch, which is licensed and regulated by the Financial Supervisory Commission. No portion of the report may be reproduced or quoted by the press or any other person without authorisation from Macquarie. Nothing in this research shall be construed as a solicitation to buy or sell any security or product. Research Associate(s) in this report who are registered as Clerks only assist in the preparation of research and are not engaged in writing the research. Thailand: In Thailand, research is produced, issued and distributed by Macquarie Securities (Thailand) Ltd. Macquarie Securities (Thailand) Ltd. is a licensed securities company that is authorized by the Ministry of Finance, regulated by the Securities and Exchange Commission of Thailand and is an exchange member of the Stock Exchange of Thailand. The Thai Institute of Directors Association has disclosed the Corporate Governance Report of Thai Listed Companies made pursuant to the policy of the Securities and Exchange Commission of Thailand. Macquarie Securities (Thailand) Ltd does not endorse the result of the Corporate Governance Report of Thai Listed Companies but this Report can be accessed at: http://www.thai-iod.com/en/publications.asp?type=4. South Korea: In South Korea, unless otherwise stated, research is prepared, issued and distributed by Macquarie Securities Korea Limited, which is regulated by the Financial Supervisory Services. Information on analysts in MSKL is disclosed at http://dis.kofia.or.kr/websquare/index.jsp?w2xPath=/wq/fundMgr/DISFundMgrAnalystStut.xml&divisionId=MDIS03002001000000&serviceId=SDIS03002001000. South Africa: In South Africa, research is issued and distributed by Macquarie Equities South Africa (Pty) Ltd, a member of the JSE Limited. Singapore: In Singapore, research is issued and distributed by Macquarie Capital Securities (Singapore) Pte Ltd (Company Registration Number: 198702912C), a Capital Markets Services license holder under the Securities and Futures Act to deal in securities and provide custodial services in Singapore. Pursuant to the Financial Advisers (Amendment) Regulations 2005, Macquarie Capital Securities (Singapore) Pte Ltd is exempt from complying with sections 25, 27 and 36 of the Financial Advisers Act. All Singapore-based recipients of research produced by Macquarie Capital (Europe) Limited, Macquarie Capital Markets Canada Ltd, Macquarie Equities South Africa (Pty) Ltd and Macquarie Capital (USA) Inc. represent and warrant that they are institutional investors as defined in the Securities and Futures Act. United States: In the United States, research is issued and distributed by Macquarie Capital (USA) Inc., which is a registered broker-dealer and member of FINRA. Macquarie Capital (USA) Inc, accepts responsibility for the content of each research report prepared by one of its non-US affiliates when the research report is distributed in the United States by Macquarie Capital (USA) Inc. Macquarie Capital (USA) Inc.’s affiliate’s analysts are not registered as research analysts with FINRA, may not be associated persons of Macquarie Capital (USA) Inc., and therefore may not be subject to FINRA rule restrictions on communications with a subject company, public appearances, and trading securities held by a research analyst account. Information regarding futures is provided for reference purposes only and is not a solicitation for purchases or sales of futures. Any persons receiving this report directly from Macquarie Capital (USA) Inc. and wishing to effect a transaction in any security described herein should do so with Macquarie Capital (USA) Inc. Important disclosure information regarding the subject companies covered in this report is available at www.macquarie.com/research/disclosures, or contact your registered representative at 1-888-MAC-STOCK, or write to the Supervisory Analysts, Research Department, Macquarie Securities, 125 W.55th Street, New York, NY 10019. © Macquarie Group

Asia Research Head of Equity Research
Peter Redhead (Global – Head) (852) 3922 4836
Jake Lynch (Asia – Head) (852) 3922 3583
David Gibson (Japan – Head) (813) 3512 7880
Conrad Werner (ASEAN – Head) (65) 6601 0182
Automobiles/Auto Parts
Janet Lewis (China) (852) 3922 5417
Zhixuan Lin (China) (8621) 2412 9006
Leo Lin (China) (852) 3922 1098
Takuo Katayama (Japan) (813) 3512 7856
James Hong (Korea) (822) 3705 8661
Amit Mishra (India) (9122) 6720 4084
Financials
Scott Russell (Asia) (852) 3922 3567
Dexter Hsu (China, Taiwan) (8862) 2734 7530
Elaine Zhou (Hong Kong) (852) 3922 3278
Keisuke Moriyama (Japan) (813) 3512 7476
Chan Hwang (Korea) (822) 3705 8643
Suresh Ganapathy (India) (9122) 6720 4078
Thomas Stoegner (65) 6601 0854 (Malaysia, Singapore)
Gilbert Lopez (Philippines) (632) 857 0892
Passakorn Linmaneechote (Thailand) (662) 694 7728
Conglomerates
David Ng (China, Hong Kong) (852) 3922 1291
Conrad Werner (Singapore) (65) 6601 0182
Gilbert Lopez (Philippines) (632) 857 0892
Consumer and Gaming
Linda Huang (Asia, China, Hong Kong) (852) 3922 4068
Zibo Chen (China, Hong Kong) (852) 3922 1130
Terence Chang (China, Hong Kong) (852) 3922 3581
Satsuki Kawasaki (Japan) (813) 3512 7870
Mike Allen (Japan) (813) 3512 7859
Kwang Cho (Korea) (822) 3705 4953
KJ Lee (Korea) (822) 3705 9935
Stella Li (Taiwan) (8862) 2734 7514
Amit Sinha (India) (9122) 6720 4085
Fransisca Widjaja (65) 6601 0847 (Indonesia, Singapore)
Karisa Magpayo (Philippines) (632) 857 0899
Chalinee Congmuang (Thailand) (662) 694 7993
Emerging Leaders
Jake Lynch (Asia) (852) 3922 3583
Aditya Suresh (Asia) (852) 3922 1265
Timothy Lam (China, Hong Kong) (852) 3922 1086
Mike Allen (Japan) (813) 3512 7859
Kwang Cho (Korea) (822) 3705 4953
Corinne Jian (Taiwan) (8862) 2734 7522
Marcus Yang (Taiwan) (8862) 2734 7532
Conrad Werner (ASEAN) (65) 6601 0182
Industrials
Janet Lewis (Asia) (852) 3922 5417
Patrick Dai (China) (8621) 2412 9082
Leo Lin (China) (852) 3922 1098
Kunio Sakaida (Japan) (813) 3512 7873
James Hong (Korea) (822) 3705 8661
Inderjeetsingh Bhatia (India) (9122) 6720 4087
Internet, Media and Software
Wendy Huang (Asia, China) (852) 3922 3378
David Gibson (Asia, Japan) (813) 3512 7880
Hillman Chan (China, Hong Kong) (852) 3922 3716
Nathan Ramler (Japan) (813) 3512 7875
Soyun Shin (Korea) (822) 3705 8659
Abhishek Bhandari (India) (9122) 6720 4088
Oil, Gas and Petrochemicals
Polina Diyachkina (Asia, Japan) (813) 3512 7886
Aditya Suresh (Asia, China) (852) 3922 1265
Anna Park (Korea) (822) 3705 8669
Duke Suttikulpanich (ASEAN) (65) 6601 0148
Isaac Chow (Malaysia) (603) 2059 8982
Pharmaceuticals and Healthcare
Abhishek Singhal (India) (9122) 6720 4086
Wei Li (China, Hong Kong) (852) 3922 5494
Property
Tuck Yin Soong (Asia, Singapore) (65) 6601 0838
David Ng (China, Hong Kong) (852) 3922 1291
Raymond Liu (China, Hong Kong) (852) 3922 3629
Wilson Ho (China) (852) 3922 3248
William Montgomery (Japan) (813) 3512 7864
Corinne Jian (Taiwan) (8862) 2734 7522
Abhishek Bhandari (India) (9122) 6720 4088
Aiman Mohamad (Malaysia) (603) 2059 8986
Kervin Sisayan (Philippines) (632) 857 0893
Patti Tomaitrichitr (Thailand) (662) 694 7727
Resources / Metals and Mining
Polina Diyachkina (Asia, Japan) (813) 3512 7886
Coria Chow (China) (852) 3922 1181
Anna Park (Korea) (822) 3705 8669
Technology
Damian Thong (Asia, Japan) (813) 3512 7877
George Chang (Japan) (813) 3512 7854
Daniel Kim (Korea) (822) 3705 8641
Allen Chang (Greater China) (852) 3922 1136
Jeffrey Ohlweiler (Greater China) (8862) 2734 7512
Patrick Liao (Greater China) (8862) 2734 7515
Louis Cheng (Greater China) (8862) 2734 7526
Kaylin Tsai (Greater China) (8862) 2734 7523
Telecoms
Nathan Ramler (Asia, Japan) (813) 3512 7875
Danny Chu (Greater China) (852) 3922 4762
Soyun Shin (Korea) (822) 3705 8659
Chirag Jain (India) (9122) 6720 4352
Prem Jearajasingam (ASEAN) (603) 2059 8989
Kervin Sisayan (Philippines) (632) 857 0893
Transport & Infrastructure
Janet Lewis (Asia) (852) 3922 5417
Corinne Jian (Taiwan) (8862) 2734 7522
Azita Nazrene (ASEAN) (603) 2059 8980
Utilities & Renewables
Alan Hon (Hong Kong) (852) 3922 3589
Inderjeetsingh Bhatia (India) (9122) 6720 4087
Prem Jearajasingam (Malaysia) (603) 2059 8989
Karisa Magpayo (Philippines) (632) 857 0899
Commodities
Colin Hamilton (Global) (44 20) 3037 4061
Ian Roper (65) 6601 0698
Jim Lennon (44 20) 3037 4271
Lynn Zhao (8621) 2412 9035
Matthew Turner (44 20) 3037 4340
Economics
Peter Eadon-Clarke (Global) (813) 3512 7850
Larry Hu (China, Hong Kong) (852) 3922 3778
Tanvee Gupta Jain (India) (9122) 6720 4355
Quantitative / CPG
Gurvinder Brar (Global) (44 20) 3037 4036
Woei Chan (Asia) (852) 3922 1421
Danny Deng (Asia) (852) 3922 4646
Per Gullberg (Asia) (852) 3922 1478
Strategy/Country
Viktor Shvets (Asia, Global) (852) 3922 3883
Chetan Seth (Asia) (852) 3922 4769
David Ng (China, Hong Kong) (852) 3922 1291
Erwin Sanft (China, Hong Kong) (852) 3922 1516
Peter Eadon-Clarke (Japan) (813) 3512 7850
Chan Hwang (Korea) (822) 3705 8643
Jeffrey Ohlweiler (Taiwan) (8862) 2734 7512
Inderjeetsingh Bhatia (India) (9122) 6720 4087
Jayden Vantarakis (Indonesia) (6221) 2598 8310
Anand Pathmakanthan (Malaysia) (603) 2059 8833
Gilbert Lopez (Philippines) (632) 857 0892
Conrad Werner (Singapore) (65) 6601 0182
Alastair Macdonald (Thailand) (662) 694 7753
Find our research at Macquarie: www.macquarie.com.au/research Thomson: www.thomson.com/financial Reuters: www.knowledge.reuters.com Bloomberg: MAC GO Factset: http://www.factset.com/home.aspx CapitalIQ www.capitaliq.com Email [email protected] for access
Sales - Japan Tokyo Sales
David Shirt (Head of Equities) (813) 3512 7922 Nick Cant (Head of Sales) (65) 6601 0210 Hiroyuki Yokoyama (813) 3512 7822 Tomohiro Takahashi (813) 3512 7823 Mark Wild (813) 3512 7820 George Hamada (813) 3512 7836 Alisaun Binder (813) 3512 7924 Eileen Lee (813) 3512 7921 Shunsuke Kuriyama (813) 3512 7919
Europe Sales
London
Ben Musgrave (Head of Japan Equity Sales) (44 20) 3037 4882 Daniel Pittorino (Head of Intl Equity Sales) (44 20) 3037 4831 Brent Smith (44 20) 3037 4887 Christina Lee (44 20) 3037 4873
Europe Sales
Geneva
Thomas Renz (41 22) 818 7712
US Sales
New York
Eric Roles (Head of Intl Equity Sales) (1 212) 231 2559 Jeff Seo (1 212) 231 2422 Alex Mirarchi (1 212) 231 2562 Jean Zhang (1 212) 231 6397
Boston
Jeff Evans (1 617) 598 2508 Shun Aonuma (1 617) 598 2535
San Francisco
Todd Narter (1 415) 835 1239 Paul Colaco (1 415) 762 5003
Japan Sales Trading
Christopher Miller (Head of Sales Trading) (813) 3512 7831 Mateen Chaudhry (813) 3512 7819 Takehiko Masuzawa (813) 3512 7837 Kazuya Kuramochi (813) 3512 7832 Christopher Schaffner (813) 3512 7838 Akihiro Ohara (813) 3512 7828 Mitsuharu Tanaka (813) 3512 7834 Naoya Kikuchi (813) 3512 7835 Scott Sakima (813) 3512 7915 Mike Keen (44 20) 3037 4905 Mike Gray (1 212) 231 2555 Chris Reale (1 212) 231 2616 Marc Rosa (1 212) 231 2531
This publication was disseminated on 17 October 2016 at 19:00 UTC.