Global synthesis of leaf area index observations - UCL Department
16
RESEARCH PAPER © 2003 Blackwell Publishing Ltd. http://www.blackwellpublishing.com/journals/geb Global Ecology & Biogeography (2003) 12, 191–205 Blackwell Publishing Ltd. Global synthesis of leaf area index observations: implications for ecological and remote sensing studies GREGORY P. ASNER,*† JONATHAN M. O. SCURLOCK‡ and JEFFREY A. HICKE† †Department of Global Ecology, Carnegie Institution of Washington, Stanford, CA 94305, U.S.A. E-mail: [email protected]; [email protected] and ‡Environmental Sciences Division, Oak Ridge National Laboratory, PO Box 2008, Oak Ridge, TN 37831 U.S.A. E-mail: [email protected] ABSTRACT Aim We present the first global synthesis of plant canopy leaf area index (LAI) measurements from more than 1000 published estimates representing ∼400 unique field sites. LAI is a key variable for regional and global models of biosphere- atmosphere exchanges of energy, carbon dioxide, water vapour, and other materials. Location The location is global, geographically distributed. Results Biomes with LAI values well represented in the liter- ature included croplands, forests and plantations. Biomes not well represented were deserts, shrublands, tundra and wet- lands. Nearly 40% of the records in the database were pub- lished in the past 10 years (1991–2000), with a further 20% collected between 1981 and 1990. Mean (± SD) LAI, distributed between 15 biome classes, ranged from 1.3 ± 0.9 for deserts to 8.7 ± 4.3 for tree plantations, with temperate evergreen forests (needleleaf and broadleaf) displaying the highest average LAI (5.1– 6.7) among the natural terrestrial vegetation classes. Following a statistical outlier analysis, the global mean (± SD) LAI decreased from 5.2 (4.1) to 4.5 (2.5), with a maximum LAI of 18. Biomes with the highest LAI values were planta- tions > temperate evergreen forests > wetlands. Those with the lowest LAI values were deserts < grasslands < tundra. Mean LAI values for all biomes did not differ statistically by the method- ology employed. Direct and indirect measurement approaches produced similar LAI results. Mean LAI values for all biomes combined decreased significantly in the 1990s, a period of substantially more studies and improved methodologies. Main conclusions Applications of the LAI database span a wide range of ecological, biogeochemical, physical, and cli- mate research areas. The data provide input to terrestrial eco- system and land-surface models, for evaluation of global remote sensing products, for comparisons to field studies, and other applications. Example uses of the database for global plant productivity, fractional energy absorption, and remote sensing studies are highlighted. Key words canopy structure, ecosystem modelling, global ecology, LAI, leaf area index, remote sensing. INTRODUCTION The plant canopy is a locus of physical and biogeochemical processes in an ecosystem. The functional and structural attributes of plant canopies are affected by microclimatic conditions, nutrient dynamics, herbivore activities, and many other factors. The amount of foliage contained in plant cano- pies is one basic ecological characteristic indicating the inte- grated effect of these factors. In turn, canopy leaf area serves as the dominant control over primary production (photosyn- thesis), transpiration, energy exchange, and other physiologi- cal attributes pertinent to a range of ecosystem processes. Subsequently, canopy leaf area is often treated as a core ele- ment of ecological field and modelling studies (e.g. Sellers et al., 1988; Sellers, 1997; Bondeau et al., 1999). Leaf area index (LAI) is a measure of canopy foliage content commonly employed in studies of vegetation and eco- systems. LAI is broadly defined as the amount of leaf area (m 2 ) in a canopy per unit ground area (m 2 ). Because it is a dimen- sionless quantity, LAI can be measured, analysed and mod- elled across a range of spatial scales, from individual tree crowns or clusters to whole regions or continents. As a result, LAI has become a central and basic descriptor of vegetation condition in a wide variety of physiological, climatological, and biogeochemical studies (Asner et al., 1998a). LAI is a key vegetation characteristic needed by the global change research community (e.g. Running & Coughlan, 1988; Sellers * Corresponding author.
Transcript of Global synthesis of leaf area index observations - UCL Department

RESEARCH PAPER
© 2003 Blackwell Publishing Ltd. http://www.blackwellpublishing.com/journals/geb
Global Ecology & Biogeography
(2003)
12
, 191–205
Blackwell Publishing Ltd.
Global synthesis of leaf area index observations: implications for ecological and remote sensing studies
GREGORY P. ASNER,*† JONATHAN M. O. SCURLOCK‡ and JEFFREY A. HICKE†
†
Department of Global Ecology, Carnegie Institution of Washington, Stanford, CA 94305, U.S.A. E-mail: [email protected]; [email protected] and
‡
Environmental Sciences Division, Oak Ridge National Laboratory, PO Box 2008, Oak Ridge, TN
37831 U.S.A. E-mail: [email protected]
ABSTRACT
Aim
We present the first global synthesis of plant canopy leafarea index (LAI) measurements from more than 1000published estimates representing
∼
400 unique field sites. LAIis a key variable for regional and global models of biosphere-atmosphere exchanges of energy, carbon dioxide, water vapour,and other materials.
Location
The location is global, geographically distributed.
Results
Biomes with LAI values well represented in the liter-ature included croplands, forests and plantations. Biomes notwell represented were deserts, shrublands, tundra and wet-lands. Nearly 40% of the records in the database were pub-lished in the past 10 years (1991–2000), with a further 20%collected between 1981 and 1990. Mean (
±
SD) LAI, distributedbetween 15 biome classes, ranged from 1.3
±
0.9 for deserts to8.7
±
4.3 for tree plantations, with temperate evergreen forests(needleleaf and broadleaf) displaying the highest average LAI(5.1–6.7) among the natural terrestrial vegetation classes.Following a statistical outlier analysis, the global mean (
±
SD)
LAI decreased from 5.2 (4.1) to 4.5 (2.5), with a maximumLAI of 18. Biomes with the highest LAI values were planta-tions > temperate evergreen forests > wetlands. Those with thelowest LAI values were deserts < grasslands < tundra. MeanLAI values for all biomes did not differ statistically by the method-ology employed. Direct and indirect measurement approachesproduced similar LAI results. Mean LAI values for all biomescombined decreased significantly in the 1990s, a period ofsubstantially more studies and improved methodologies.
Main conclusions
Applications of the LAI database span awide range of ecological, biogeochemical, physical, and cli-mate research areas. The data provide input to terrestrial eco-system and land-surface models, for evaluation of globalremote sensing products, for comparisons to field studies, andother applications. Example uses of the database for globalplant productivity, fractional energy absorption, and remotesensing studies are highlighted.
Key words
canopy structure, ecosystem modelling, globalecology, LAI, leaf area index, remote sensing.
INTRODUCTION
The plant canopy is a locus of physical and biogeochemicalprocesses in an ecosystem. The functional and structuralattributes of plant canopies are affected by microclimaticconditions, nutrient dynamics, herbivore activities, and manyother factors. The amount of foliage contained in plant cano-pies is one basic ecological characteristic indicating the inte-grated effect of these factors. In turn, canopy leaf area servesas the dominant control over primary production (photosyn-thesis), transpiration, energy exchange, and other physiologi-cal attributes pertinent to a range of ecosystem processes.
Subsequently, canopy leaf area is often treated as a core ele-ment of ecological field and modelling studies (e.g. Sellers
et al
., 1988; Sellers, 1997; Bondeau
et al
., 1999).Leaf area index (LAI) is a measure of canopy foliage
content commonly employed in studies of vegetation and eco-systems. LAI is broadly defined as the amount of leaf area (m
2
)in a canopy per unit ground area (m
2
). Because it is a dimen-sionless quantity, LAI can be measured, analysed and mod-elled across a range of spatial scales, from individual treecrowns or clusters to whole regions or continents. As a result,LAI has become a central and basic descriptor of vegetationcondition in a wide variety of physiological, climatological,and biogeochemical studies (Asner
et al
., 1998a). LAI is a keyvegetation characteristic needed by the global changeresearch community (e.g. Running & Coughlan, 1988; Sellers
* Corresponding author.

192
G. P. Asner
et al
.
© 2003 Blackwell Publishing Ltd,
Global Ecology & Biogeography
,
12
, 191–205
& Schimel, 1993). For example, LAI is required for scalingbetween leaf and canopy measurements of water vapour andCO
2
conductance and flux, and for estimates of these variablesacross the global biosphere–atmosphere interface (McWilliam
et al
., 1993).Despite the widely recognized importance of LAI across
such a broad range of physical and ecological research, andalthough there is an abundance of individual plot and stand-based LAI studies, there are few comprehensive reviews ofLAI data in the literature. Waring (1983) discussed LAI offorests as an index of growth and canopy light competition,but did not tabulate data from previous studies. Schulze(1982) analysed leaf area and canopy light interception in areview of 62 LAI estimates from 12 biomes. Asner (1998)studied canopy reflectance variation using a compilation of29 LAI estimates from 20 vegetation types. Gower
et al
.(1999) reviewed LAI estimation techniques, but again did notsummarize many previous data. In general, the highest valuesreported previously for LAI are for coniferous canopies, insome cases LAI > 15, although this is partly a function of howLAI is defined and measured (see next section). Beadle (1993)reported observed LAI maxima from 6 to 8 in deciduousforest and 2–4 for annual crops. Schulze (1982) suggested thattypical leaf area index values for most biomes (apart fromdesert and tundra) ranged from about 3–19, the highestvalues being reported for boreal coniferous forests. Despite thereports provided by these and other authors, no studies haveprovided the comprehensive data compilation and synthesisneeded for broad determinations of the range and propertiesof LAI values by biome, either globally or through time.
In this paper we present a literature review, database andsynthesis of 1008 LAI measurements collected from 15 globalbiomes. This paper serves as an extension to a technicalreport developed by us for the Oak Ridge National Labora-tory (Scurlock
et al
., 2001), with additional analyses pertinentto ecological and remote sensing applications of the database.The specific goals of this paper are: (1) to present our LAIcompilation to a broad global ecological research audience tomaximize the exposure and availability of the database; (2) todetermine the differences in LAI by biome and over differentpublication periods; (3) to highlight weaknesses in the ecolog-ical and geographical coverage of LAI measurements on aglobal basis; and (4) to demonstrate the value of the databasefor studying linkages between canopy structure and function.
To reach these goals, we first provide a detailed definitionof leaf area index and the various methods that have beenused to estimate LAI over the past several decades of ecologi-cal research. We then discuss several geographical, statistical,and taxonomic characteristics of the database. Finally, weshow by example how the database can be employed in stud-ies of global net primary productivity (NPP), canopy energyabsorption, and validation of LAI estimates derived fromsatellite observations.
METHODS
Definition of LAI
LAI may be described most simply as:
LAI =
s
/
G
(1)
where
s
is the functional (green) leaf area of the canopy perground area
G
(terminology after Beadle, 1993). The
s
term ismost commonly measured as the projected area; that is, afterplacing a sampled leaf on a horizontal surface. However, LAImay be more precisely defined in a number of different ways,and this bears on the results synthesized in this paper. Forexample, leaf area may be measured as the total surface areaof leaves in a canopy. This is equal to 2
s
for flat leaves andgreater than 2
s
for needles, succulent leaves and photosyn-thetic stems. This complicates comparisons between LAImeasurements collected using different methodologies (Chen& Black, 1992).
Barclay (1998) indicated that at least five common meas-ures of LAI exist, which partly reflect the different purposesfor which LAI is determined (e.g. vegetation growth, physio-logical activity, light attenuation). The four most common ofthese are defined as:(1) Total LAI based on the total outside area of the leaves,taking leaf shape into account, per unit area of horizontalland below the canopy;(2) One-sided LAI, as half the total LAI, even if the two sidesof the leaves are not symmetrical;(3) Horizontally projected LAI as the area of ‘shadow’ thatwould be cast by each leaf in the canopy with a light source atinfinite distance and perpendicular to it, summed up for allleaves in the canopy;(4) Inclined projected LAI, or ‘silhouette’ LAI, representingthe projected area of leaves while accounting for leaf inclina-tions. An additional fifth definition, according to Barclay(1998), is a variation on this approach, counting overlappingleaf areas only once.
Most published values of LAI utilize definition (2) or defi-nition (3), with an increasing number of definition (4) in therecent literature (Barclay, 1998). Definition (1) is rarely employed.Definition (2) suffers from the problem that the meaning of‘one-sided’ is unclear for coniferous needles, highly clumpedfoliage or rolled leaves. Chen & Black (1992) suggested thatthe LAI of nonflat leaves should be defined as half the totalintercepting area per unit ground area, and that definition (3)should be abandoned. LAI according to definition (2) mayexceed LAI according to definition (3) by a factor rangingfrom 1.28 (hemi-circular cylinders representing coniferneedles), through 1.57 (representing cylindrical green branches)to 2.0 (spheres or square bars representing highly clumpedshoots and some spruce needles) (Chen & Cihlar, 1996).Regrettably, many individual reports of LAI in the literature

Global leaf area index
193
© 2003 Blackwell Publishing Ltd,
Global Ecology & Biogeography
,
12
, 191–205
fail to provide any details of the LAI definition assumed, anda significant fraction do not describe the methodology used.
Methods of determining LAI
Methodologies for ground-based estimation of LAI include:(a) Destructive harvesting and direct determination of one-sided leaf area, using squared grid paper, weighing of paperreplicates, or an optically based automatic area measurementsystem;(b) Collection and weighing of total leaf litterfall, convertedto leaf area by determining specific leaf area (leaf area/ leafmass) of foliar subsamples;(c) Allometry (based on simple physical dimensions such asstem diameter at breast height), using species-specific or stand-specific relationships based on detailed destructive measure-ment of a subsample of leaves, branches or whole individuals;(d) Indirect contact methods such as plumb lines or inclinedpoint quadrats;(e) Indirect noncontact methods such as the Decagon Cep-tometer (Decagon Devices, Inc. Pullman, Washington, U.S.A.),the LICOR LAI-2000 (Li-Cor, Inc., Lincoln, Nebraska, U.S.A.),or analysis of hemispheric photographs.
Methodologies (a) and (b) are commonly used in conjunc-tion with definition (2) of LAI, while methodologies (d) and(e) are used with definitions (3) and (4), respectively. Method-ology (c) may be used with any of the LAI definitions, includingdefinition (1), depending upon the details of the calibration ofthe allometric equations. Whereas all of these methodologiesmay be used for forest canopies, (a) tends to be the mostcommon for grasslands and crops, and (d) or (c) for irregularlyshaped canopies such as shrublands. In many cases, thechoice of methodology is a matter of ease of use in a particu-lar field situation.
The user of LAI data should note that almost all of thesemethodologies are subject to limitations such as sampling error(small plots, etc.) for direct determination, and nonrandomleaf distribution and inclination in the case of the indirectmethods. For example, specific leaf area in an experimentalstand of sweetgum (
Liquidambar styraciflua
) may vary bya factor of more than two between sun and shade leaves,making it difficult to utilize an annual average value for thedetermination of LAI by methodology (b) above (Norby
et al
.,2001). The wide range of leaf turnover times, from less than12 months to about six years, may also present problems forthis methodology. Some knowledge of the dynamics of leafarea production and abscission is really required to estimateLAI. Leaf spatial distribution, leaf angle distribution and thecontribution of nonphotosynthetic tissue to light attenuationare all complicating factors in methodology (e), the opticaldetermination of LAI, which was originally developed forcrop canopies (Chen, 1996). Strictly speaking, optical methodsestimate ‘plant area index’ (PAI), which includes projected
stem area as well as leaves. For certain types of vegetation,instruments such as the LAI-2000 have also been found tounder-estimate LAI systematically compared with othermethodologies (Deblonde
et al
., 1994; Kucharik
et al
., 1998;Gower
et al
., 1999).The seasonal timing of LAI measurements is also an im-
portant consideration. In deciduous canopies, reported valueswill vary substantially by sampling time relative to maximumseasonal LAI. Even for evergreen canopies, there may be animportant difference between annual maximum LAI and theaverage LAI during the growing season. LAI phenology tendsto be overlooked in much of the literature.
Data compilation
The process of compiling the database involved identifyingsites and sources of data, acquiring the data, meta-data andother documentation, performing quality assessment checks,and reformatting the data into a consistent and comparableform. The data compiled for the LAI database representedmostly natural ecosystems; however, some data from crops,pastures and tree plantations were included for comparison.As far as possible, the minimum criteria for inclusion of datain this compilation were the following:• A geographical or place-name reference to the site ofmeasurement (data related to vegetation types only were notconsidered);• At least some ancillary data on vegetation type, stand age,etc. and preferably other physiological parameters such asabove-ground NPP;• A citation to the source of the data.
Where the geographical coordinates of the experimentalsite were not included in the original literature, coordinateswere selected from national or regional maps, based upon sitedescriptions. A variety of published maps, road atlases, andonline maps were used for this purpose.
The initial data compilation yielded 1008 unique recordsfrom 339 known field sites, with an additional 69 records forwhich coordinates could not be estimated (
∼
400 locations).Each record represented a unique value reported for a partic-ular vegetation type, treatment or vegetation condition(maximum LAI, minimum LAI) at an individual study site.Records were matched to a bibliography of over 300 originalliterature references, which can be accessed in the technicalmemorandum provided by Scurlock
et al
. (2001).Criteria for maximizing data consistency included the use
of common systems of names, units, etc., including names ofcountries and a biome assignment to one of 15 classes(Appendix 1). These classes are based upon those developedfor the Ecosystem Model-Data Intercomparison workshopsunder the auspices of the Global Primary Production DataInitiative (Scurlock
et al
., 1999; Olson
et al
., 2001). They rep-resent a compromise between biome and land-cover classes
194
G. P. Asner
et al
.
© 2003 Blackwell Publishing Ltd,
Global Ecology & Biogeography
,
12
, 191–205
that are meaningful to ecologists, ecosystem modellers andusers of satellite remote sensing data. Geographical co-ordinates were converted to decimal degrees (ddd.dd) and map-ped using Geographical Information System software (ArcGIS,ESRI, Inc.) to check for erroneous coordinates located inwater bodies or other unlikely locations.
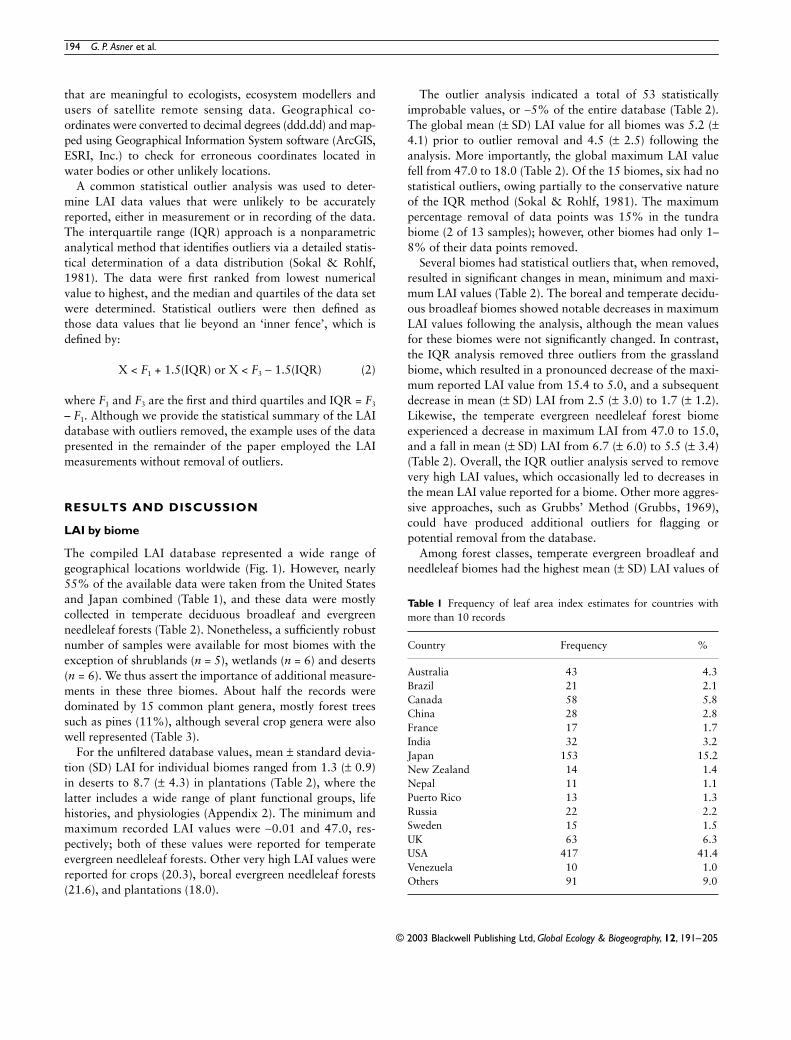
A common statistical outlier analysis was used to deter-mine LAI data values that were unlikely to be accuratelyreported, either in measurement or in recording of the data.The interquartile range (IQR) approach is a nonparametricanalytical method that identifies outliers via a detailed statis-tical determination of a data distribution (Sokal & Rohlf,1981). The data were first ranked from lowest numericalvalue to highest, and the median and quartiles of the data setwere determined. Statistical outliers were then defined asthose data values that lie beyond an ‘inner fence’, which isdefined by:
X <
F
1
+ 1.5(IQR) or X <
F
3
−
1.5(IQR) (2)
where
F
1
and
F
3
are the first and third quartiles and IQR =
F
3
–
F
1
. Although we provide the statistical summary of the LAIdatabase with outliers removed, the example uses of the datapresented in the remainder of the paper employed the LAImeasurements without removal of outliers.
RESULTS AND DISCUSSION
LAI by biome
The compiled LAI database represented a wide range ofgeographical locations worldwide (Fig. 1). However, nearly55% of the available data were taken from the United Statesand Japan combined (Table 1), and these data were mostlycollected in temperate deciduous broadleaf and evergreenneedleleaf forests (Table 2). Nonetheless, a sufficiently robustnumber of samples were available for most biomes with theexception of shrublands (
n
= 5), wetlands (
n
= 6) and deserts(
n
= 6). We thus assert the importance of additional measure-ments in these three biomes. About half the records weredominated by 15 common plant genera, mostly forest treessuch as pines (11%), although several crop genera were alsowell represented (Table 3).
For the unfiltered database values, mean
±
standard devia-tion (SD) LAI for individual biomes ranged from 1.3 (
±
0.9)in deserts to 8.7 (
±
4.3) in plantations (Table 2), where thelatter includes a wide range of plant functional groups, lifehistories, and physiologies (Appendix 2). The minimum andmaximum recorded LAI values were
∼
0.01 and 47.0, res-pectively; both of these values were reported for temperateevergreen needleleaf forests. Other very high LAI values werereported for crops (20.3), boreal evergreen needleleaf forests(21.6), and plantations (18.0).
The outlier analysis indicated a total of 53 statisticallyimprobable values, or
∼
5% of the entire database (Table 2).The global mean (
±
SD) LAI value for all biomes was 5.2 (
±
4.1) prior to outlier removal and 4.5 (
±
2.5) following theanalysis. More importantly, the global maximum LAI valuefell from 47.0 to 18.0 (Table 2). Of the 15 biomes, six had nostatistical outliers, owing partially to the conservative natureof the IQR method (Sokal & Rohlf, 1981). The maximumpercentage removal of data points was 15% in the tundrabiome (2 of 13 samples); however, other biomes had only 1–8% of their data points removed.
Several biomes had statistical outliers that, when removed,resulted in significant changes in mean, minimum and maxi-mum LAI values (Table 2). The boreal and temperate decidu-ous broadleaf biomes showed notable decreases in maximumLAI values following the analysis, although the mean valuesfor these biomes were not significantly changed. In contrast,the IQR analysis removed three outliers from the grasslandbiome, which resulted in a pronounced decrease of the maxi-mum reported LAI value from 15.4 to 5.0, and a subsequentdecrease in mean (
±
SD) LAI from 2.5 (
±
3.0) to 1.7 (
±
1.2).Likewise, the temperate evergreen needleleaf forest biomeexperienced a decrease in maximum LAI from 47.0 to 15.0,and a fall in mean (
±
SD) LAI from 6.7 (
±
6.0) to 5.5 (
±
3.4)(Table 2). Overall, the IQR outlier analysis served to removevery high LAI values, which occasionally led to decreases inthe mean LAI value reported for a biome. Other more aggres-sive approaches, such as Grubbs’ Method (Grubbs, 1969),could have produced additional outliers for flagging orpotential removal from the database.
Among forest classes, temperate evergreen broadleaf andneedleleaf biomes had the highest mean (
±
SD) LAI values of
Table 1 Frequency of leaf area index estimates for countries withmore than 10 records
Country Frequency %
Australia 43 4.3Brazil 21 2.1Canada 58 5.8China 28 2.8France 17 1.7India 32 3.2Japan 153 15.2New Zealand 14 1.4Nepal 11 1.1Puerto Rico 13 1.3Russia 22 2.2Sweden 15 1.5UK 63 6.3USA 417 41.4Venezuela 10 1.0Others 91 9.0

Global leaf area index
195
© 2003 Blackwell Publishing Ltd,
Global Ecology & Biogeography
,
12
, 191–205
Fig. 1 Global distribution of field sites in the LAI database.

196
G. P. Asner
et al
.
© 2003 Blackwell Publishing Ltd,
Global Ecology & Biogeography
,
12
, 191–205
5.7 (
±
2.4) and 5.5 (
±
3.4), respectively (Table 2). In contrastto an often assumed high LAI range for tropical evergreenand deciduous forests, these biomes displayed highest valuesof only 8.0–8.9 while comparable temperate forests had maximaof 11.6–15.0. Boreal deciduous and evergreen needleleafforests had the lowest mean (
±
SD) LAI values of 2.6 (
±
0.7)and 2.7 (
±
1.3), respectively (Table 2).
Highly managed crop and plantation systems were wellrepresented in the LAI database, with sample sizes of 88and 77, respectively (Table 2). The mean (
±
SD) LAI was3.6 (
±
2.1) for crops and 8.7 (
±
4.3) for plantations. Evenfollowing IQR outlier analysis, the maximum LAI for plan-tations was 18.0, the highest value remaining in the entiredatabase.
The variation of reported LAI values ranged dramaticallyby biome (Fig. 2). Coefficients of variation (CV) showed thattemperate and tropical evergreen broadleaf forests were mostconsistent (CV = 2–24%), while grasslands, shrublands andtundra were the most variable (CV = 70–78%). CVs were notsignificantly correlated with number of samples compiled(Table 2; regression not shown). For both temperate andtropical forest biomes, deciduous broadleaf canopies weremore variable than their evergreen counterparts (Fig. 2). Thisis likely due to the seasonal LAI cycle undergone in thedeciduous canopies and captured in the field measurementscompiled here.
LAI collections by methodology
LAI values for the entire database were separated into groupsby methodology (Fig. 3). Although the litterfall method tendedto produce the highest mean (
±
SD) values (4.5
±
2.0) and theallometry method produced the lowest (3.3
±
2.1), none ofthe LAI groupings were statistically different. The indirectmethods, such as from the LAI-2000) canopy analyser (Welles& Norman, 1991), had a group mean (
±
SD) of 3.8
±
1.9 and
Table 2 Statistical distribution of leaf area index by biome for the original data compilation and after removal of statistical outliers using Inter-Quartile Range (IQR) analysis (see Appendix 2 for key to acronyms)
Biome
Original data Data after IQR analysis
Observations MeanStandard deviation Min Max
Outliers Removed Mean
Standard deviation Min Max
All 931 5.2 4.1 0.01 47.0 53 4.5 2.5 0.01 18.0Crops 88 4.2 3.3 0.2 20.3 5 3.6 2.1 0.2 8.7Desert 6 1.3 0.9 0.6 2.8 0 1.3 0.9 0.6 2.8Forest/BoDBL 58 2.6 1.0 0.3 6.0 5 2.6 0.7 0.6 4.0Forest/BoENL 94 3.5 3.3 0.5 21.6 8 2.7 1.3 0.5 6.2Forest/BoTeDNL 17 4.6 2.4 0.5 8.5 0 4.6 2.4 0.5 8.5Forest/TeDBL 187 5.1 1.8 0.4 16.0 3 5.1 1.6 1.1 8.8Forest/TeEBL 58 5.8 2.6 0.8 12.5 1 5.7 2.4 0.8 11.6Forest/TeENL 215 6.7 6.0 0.01 47.0 16 5.5 3.4 0.01 15.0Forest/TrDBL 18 3.9 2.5 0.6 8.9 0 3.9 2.5 0.6 8.9Forest/TrEBL 61 4.9 2.0 1.5 12.3 1 4.8 1.7 1.5 8.0Grasslands 28 2.5 3.0 0.3 15.4 3 1.7 1.2 0.3 5.0Plantations 77 8.7 4.3 1.6 18.0 0 8.7 4.3 1.6 18.0Shrublands 5 2.1 1.6 0.4 4.5 0 2.1 1.6 0.4 4.5Tundra 13 2.7 2.4 0.2 7.2 2 1.9 1.5 0.2 5.3Wetlands 6 6.3 2.3 2.5 8.4 0 6.3 2.3 2.5 8.4
Table 3 Frequency of leaf area index records by dominant genus
Genus Frequency %
Acer 14 1.4Cryptomeria 13 1.3Eucalyptus 23 2.3Fagus 16 1.6Helianthus 17 1.7Metrosideros 17 1.7Picea 71 7.0Pinus 111 11.0Populus 48 4.8Pseudotsuga 18 1.8Quercus 50 5.0Shorea 14 1.4Triticum 19 1.9Vicia 10 1.0Zea 15 1.5Others 223 22.1Genus not reported 329 32.6

Global leaf area index
197
© 2003 Blackwell Publishing Ltd,
Global Ecology & Biogeography
,
12
, 191–205
was statistically closest in value to LAI measurementscollected via destructive harvests (3.5
±
2.4).Given that indirect methods are significantly easier to
collect, they can be applied to many studies over very largegeographical areas (e.g. Asner
et al
., 2002). Destructive harvests(and litterfall) methods are extremely labour intensive andlogistically expensive in comparison to the indirect approaches.This perspective continues to promote an increasing use ofindirect measurement approaches in field studies. However, it
is important to note that the indirect methods appear to per-form more accurately in broadleaf canopies of horizontallycontinuous cover, while they underestimate LAI in needleleafcanopies (e.g. Chen & Cihlar, 1995), forest canopies withsignificant foliar clumping (e.g. Herbert & Fownes, 1997),and in canopies comprised of discrete crowns (e.g. White
et al
.,2000). In these cases, destructive harvests and other directmethods can be used to correct measurements acquired byindirect methods (e.g. Asner
et al
., 1998b).
Fig. 2 Coefficients of variation of LAI by biome following IQR outlier analysis (see Appendix 2 for key to acronyms).
Fig. 3 Statistics of LAI database organized by measurement methodology.

198
G. P. Asner
et al
.
© 2003 Blackwell Publishing Ltd,
Global Ecology & Biogeography, 12, 191–205
LAI collections over time
The earliest LAI record in the database was from 1932, andthe latest from 2000. When the data were plotted by decade,there was a noticeable increase in the number of records overa 68-year period (Fig. 4). About 40% of the records werepublished in the past 10 years (1991–2000), with a further20% collected between 1981 and 1990. There was also adecline in the mean measured LAI value for all biomes bydecade, especially in the 1990s (mean ± SD; 3.8 ± 2.4).
The decline in mean LAI in the 1990s may reflect thetendency towards indirect methodologies, which can under-estimate LAI for some types of canopy (see last section). Thisdecrease may also result from a noticeable decline in studiesusing direct measurement and allometry approaches in thedatabase; these methods are often thought to contain smallmethodological errors that result in significant overestimationof LAI (Chen & Cihlar, 1995; Gower et al., 1999).
Sample applications of LAI database
There are many possible uses for this LAI database. Ecologi-cal applications range from input to and validation of eco-system and biogeochemical models to the prediction of LAIvalues for field studies in a particular biome or geographicalregion (e.g. Running & Gower, 1991; Schimel, 1995; Asneret al., 1998a). Other Earth science applications span a widerange of climate, hydrological, and energy balance studies(e.g. Yang et al., 1997; Kergoat, 1998; Lacaze et al., 1999). Insupport of these applications, many remote sensing approacheshave been developed to estimate LAI at spatial scales ranging
from plot (< 10 m2) to large regions (> 100 km2) (e.g. Asraret al., 1986; Verstraete & Pinty, 1991; Gobron et al., 1997).These efforts require calibration and evaluation information,and this LAI database could contribute in this way. In thissection, we highlight some example uses of the database toemphasize its role across a wide range of these applications.
The total amount of foliage in canopies reflects bothbiological and environmental controls over plant growth. Vege-tation productivity is partially controlled by the efficiency oflight capture in canopies, and this assumption forms the basisof many ecological models (Field et al., 1995). The relation-ship between above-ground net primary productivity (ANPP)and LAI was investigated with a subset of locations in the LAIdatabase for which both parameters were available (exclud-ing unlikely values of ANPP > 4000 g/m2/year; Schimel, 1995).A modest but significant correlation (r2 = 0.33; P < 0.05) wasfound between these two ecological variables (Fig. 5). Othercontrols over ANPP — climate, nutrients, land-use history, etc.— probably account for the remaining variance in the relation-ship. Nonetheless, this type of evaluation is statistically robustfor only a relatively large data compilation such as providedhere. Extension of this analysis could be achieved by consider-ing the contributory effects of climate, soil type, land use andother intrabiome variables affecting the relationship betweenANPP and LAI.
The fraction of photosynthetically active radiation (PAR)absorbed by plant canopies (fAPAR) is another key variabledescribing the functional attributes of vegetation (Field et al.,1995). The range and variability of fAPAR is only generallyknown by biome, region or vegetation type. However, fAPARcan be calculated using measurements of LAI, assuming the
Fig. 4 Statistics of LAI database organized by year of publication.

Global leaf area index 199
© 2003 Blackwell Publishing Ltd, Global Ecology & Biogeography, 12, 191–205
architectural properties of the vegetation canopies as well astheir leaf optical properties (Asrar et al., 1992; Huemmrich &Goward, 1997). We used the LAI database to estimate fAPARby biome using a three-dimensional canopy radiative transfermodel employed in the NASA-MODIS program (Myneni &Asrar, 1993). The model uses an explicit parameterization ofcanopy architecture and optical properties provided byMyneni et al. (1997) — along with LAI values — to estimatefAPAR for each entry in the database. We found that meanfractional PAR absorption by biome ranged from about 0.51–0.98 (Fig. 6). Deserts, grasslands, tundra, and shrublands had
the lowest fAPAR values (0.51, 0.56, 0.59 and 0.68, respec-tively) corresponding to mean LAI values of 1.3, 1.7, 1.9 and2.1, respectively (Table 2). Among these four sparsely vege-tated land covers, fAPAR variability was lowest in deserts(SD = 0.15) and highest in shrublands (SD = 0.26). This trendof increasing variance with increasing mean fAPAR concurswith other studies spanning the arid and semiarid ecosystems(Asner 1998). However, the trend did not continue into theother biomes containing higher LAI and fAPAR values (Fig. 6).
The highest mean fAPAR values were calculated for planta-tions (0.98), wetlands (0.96), and temperate evergreen broadleaf
Fig. 5 LAI vs. above-ground net primary production (ANPP). LAI values are for all sites corresponding to ANPP field sites provided by Scurlocket al. (1996).
Fig. 6 Fractional photosynthetically active radiation absorption (fAPAR) modelled using NASA-MODIS radiative transfer model (Myneni et al.,1997). Error bars show standard deviation of the mean by biome (see Appendix 2 for key to acronyms).

200 G. P. Asner et al.
© 2003 Blackwell Publishing Ltd, Global Ecology & Biogeography, 12, 191–205
(0.95) and needleleaf forests (0.93) (Fig. 6). Based on thisanalysis, light absorption approaches saturation at canopyLAI values of roughly 5.5, a value often cited in field andmodelling studies. Among these densely foliated biomes,wetlands showed the greatest fAPAR variability (SD = 0.28),while temperate evergreen needleleaf forests had the lowestvariance (SD = 0.06). Greater spatial and temporal variationin fAPAR within wetlands is not surprising since ecosystemsin this biome often undergo a period of senescence resulting inmeasurable LAI changes (e.g. Rouse et al., 1992; Bartlett &Harriss, 1993). In contrast, evergreen forests do not havesuch a wide range of biophysical variation.
A likely use for the database is in validating LAI estimatesderived from airborne and spaceborne remote sensing obser-vations. Remote sensing does not directly measure LAI or anybiophysical property of plant canopies; observations of theradiation reflected by vegetation are converted to estimatesof biophysical variables using field studies or models (e.g.Myneni et al., 1997). Evaluation of remotely sensed LAI (orany other surface variable) is challenged by the inherent dif-ferences in the spatial scale of the field and remote measure-ments. New methodologies are still needed to employ fieldLAI measurements at spatial scales commensurate withremote sensing studies (e.g. Atkinson et al., 2000). None-theless, to demonstrate the potential use of the database, wecompared field LAI observations to estimates derived from acombination of the NASA SeaWIFS sensor and the Myneniet al. (1997) LAI algorithm (in use now with NASA MODISsatellite data).
The SeaWIFS product was acquired from the MODISLAI website (http://www.cybele.bu.edu/modismisr/product/seawifs/seqwifslaifpar.html) as quarterly mean LAI maps at8 km spatial resolution with global coverage. The quarterly datawere then averaged to produce a digital map of mean annualLAI (Fig. 7). Simply plotting the LAI values from the databaseagainst the colocated SeaWIFS-LAI values yielded a regres-sion with r2 = 0.12 (data not shown). However, using themean LAI value from the database (for biomes matchingthose available from the SeaWIFS algorithm) resulted in a sig-nificant correlation with the biome-averaged LAI valuesderived from SeaWIFS (r2 = 0.87, P < 0.05; Fig. 8). This basicvalidation approach is useful for determining the overallaccuracy of the SeaWIFS LAI product, but additional studiesare needed to evaluate the sensor/algorithm performance on asite, biome, or regional basis. Our example serves only tohighlight this issue and call for improved scaling approachesfor field-to-sensor validation efforts.
Additional issues and caveats
As mentioned, despite our effort to produce a comprehensiveLAI database, the values represented in this compilationare weighted more heavily on certain biomes and less so on
others (Table 2). There are also biases toward certain geogra-phical regions (countries) and plant genera (Table 3). Additionalcaveats and issues related to the use and interpretation of thedata within this compilation should be mentioned here.
In developing the database, we found that LAI in needleleafcanopies stood out from other vegetation cover types in termsof maximum values (Table 2). An exception was the cropsbiome, for which LAI values were sometimes also reported asvery high. Some of the needleleaf biomes included measure-ments of all-sided LAI, which is clearly a different parameterfrom one-sided broadleaf LAI. Older estimates of needleleafLAI obtained using allometric equations tend to be biased bythe larger, open-grown trees used to develop the relationshipsbetween foliage mass and tree diameter (R. Waring, personalcommunication). Indirect LAI estimates (e.g. Licor LAI-2000)are comparable with destructive harvesting or allometry forbroadleaf canopies, but in needleleaf canopies it appears thata ‘clumping factor’ must also be taken into account (Chenet al., 1997). Such techniques estimate an ‘effective’ LAI,which may be an underestimate when foliage in the canopy isnonrandomly distributed or clumped (Gower et al., 1999).
The vast majority of these field-based LAI data are fromsmall sample plots, often 0.2 ha in size or less, but manystudies do not clearly report the number of samples or theirspatial extent. Such data represent the LAI of individual can-opies or canopy clusters. However, as the integrated area ofthe measurements increases, the reported LAI decreasesbecause the fractional cover of the canopies becomes a con-tributing factor:
LAIgrid-cell = LAIplant * fc (3)
where LAIplant is the leaf area index of the individual canopyor canopy cluster, and fc is the fractional area covered by thatcanopy or cluster.
A small number of field studies have worked along homog-enous transects, but very few studies have actually addressedthe issue of extending field-based LAI measurements toscales commensurate with regional and global modellingor remote sensing studies. However, the Bigfoot initiative(http://www.fsl.orst.edu/larse/bigfoot/) is addressing the topicof scaling from point field measurements to the relativelycoarse resolution of satellite products, by measuring LAI andother land-surface parameters for 5 × 5 km grids in theUnited States.
CONCLUSIONS
In this paper, we present the most comprehensive database todate of leaf area index (LAI) measurements collected through-out the world. The LAI database includes more than 1000samples collected in 15 biomes (or land-cover types) spanningarid, semiarid, temperate, tropical, boreal and human-managed

Global leaf area index
201
© 2003 Blackw
ell Publishing Ltd, Global Ecology &
Biogeography, 12, 191–205
Fig. 7 Global mean annual LAI derived from the NASA SeaWIFS sensor and the Myneni et al. (1997) canopy radiative transfer model.

202 G. P. Asner et al.
© 2003 Blackwell Publishing Ltd, Global Ecology & Biogeography, 12, 191–205
ecosystems. The global extent of the database provides ameans to test ecological, biogeochemical and physical models,to evaluate remote sensing studies, and to compare data fromforthcoming field studies to previous work and across biomes.Here we presented the LAI database, carried out a statisticalanalysis of its contents, and provided some examples ofhow the database can be used in a variety of applications.The database is now available from the Oak Ridge NationalLaboratory (http://www.daac.ornl.gov) by referring toTechnical Memorandum ORNL/TM-2001/268 (Scurlocket al., 2001).
While our effort to compile a global LAI dataset was intendedto be comprehensive, we cannot assert that it is complete, giventhe availability of additional measurements often embeddedin studies covering a wide range of topics such as plant phys-iology, carbon and nutrient cycling, micrometeorology andfaunal ecology. As such we recognize the limitations of thedatabase, and acknowledge that some biomes — deserts, wetlandsand shrublands in particular — are under-represented here(Table 2). However, we also note that the coefficients of vari-ation (CV) did not differ systematically by sample size (Fig. 2),and thus our findings and conclusions are not specifically drivenby these shortcomings in sample size for certain biomes.
The conclusions of this paper are drawn from an initialanalysis of the LAI data compilation and include:• Biomes with LAI values that are well represented in theliterature include croplands, forests and plantations. Biomesthat are not well represented are deserts, shrublands, tundra
and wetlands. Additional measurements are needed fromthese biomes, particularly considering their high spatial andtemporal variability of plant productivity, vegetation cover,and biomass.• The global mean LAI is 4.5 (SD = 2.5), following outlier anal-ysis. Biomes with the highest mean LAI values are plantations> temperate evergreen forests > wetlands. Those with thelowest mean LAI values are deserts < grasslands < tundra.The highest recorded LAI was found in temperate and borealevergreen needleleaf forests, but following outlier analysis,the plantation group had the highest recorded value of 18.Extremely high LAI values for needleleaf forests in the un-filtered database are likely due to older methodologies thattend to overestimate one-sided LAI.• Mean LAI values for all biomes did not differ statisticallyby the methodology employed. Direct and indirect measure-ment approaches produced similar results. However, theaccuracy of each method varies by vegetation type (architec-ture) and landscape structure.• Mean LAI values for all biomes combined decreased signif-icantly in the 1990s, a period of substantially more studiesand use of indirect measurement approaches.• The potential applications of this LAI database span a widerange of ecological, biogeochemical, physical, and climateresearch areas. The data can be used as input to or validationof terrestrial ecosystem and land-surface models, for evaluationof remotely sensed LAI estimates, for comparisons to forth-coming field studies, and in a variety of other applications.
Fig. 8 Mean LAI derived from SeaWIFS (Fig. 7) and from the LAI database. Error bars show standard deviation of the mean for each biome (seeAppendix 2 for key to acronyms).

Global leaf area index 203
© 2003 Blackwell Publishing Ltd, Global Ecology & Biogeography, 12, 191–205
DATA AVAILABILITY
The LAI database is maintained and distributed by ORNLDistributed Active Archive Center (DAAC) for BiogeochemicalDynamics (http://www.daac.ornl.gov). The DAAC providesinformation about the Earth’s biogeochemical dynamics tothe global-change research community, policymakers, educa-tors, and the interested general public. The ORNL DAAC ispart of the Earth Observing System Data and InformationSystem Project of the National Aeronautics and Space Admin-istration (NASA), which forms an integral part of NASA’scontribution to the U.S. Global Change Research Program.
ACKNOWLEDGMENTS
We thank S.T. Gower and R. Myneni for contributing to theLAI database, R. Myneni for use of the MODIS canopy radi-ative transfer model, and two anonymous reviewers of themanuscript. We thank V. Morris for assisting with the statis-tical analyses and B. Braswell for providing helpful commentson the manuscript. We thank R. Olson for helping with Fig. 1and for guidance in developing the manuscript. This workwas supported by NASA New Investigator Program (NIP)grant NAG5-8709 and the NASA Terrestrial Ecology Pro-gram (TE/99–0005) under Interagency Agreement number2013-M164-A1 with the U.S. Department of Energy.
REFERENCES
Asner, G.P. (1998) Biophysical and biochemical sources of variability incanopy reflectance. Remote Sensing of Environment, 64, 234–253.
Asner, G.P., Braswell, B.H., Schimel, D.S. & Wessman, C.A. (1998a)Ecological research needs from multiangle remote sensing data.Remote Sensing of Environment, 63, 155–165.
Asner, G.P., Keller, M., Pereira, R. & Zweede, J. (2002) Remotesensing of selective logging in Amazonia: Assessing limitationsbased on detailed field measurements, Landsat ETM+ and texturalanalysis. Remote Sensing of Environment, 80, 483–496.
Asner, G.P., Wessman, C.A. & Archer, S. (1998b) Scale dependenceof absorption of photosynthetically active radiation in terrestrialecosystems. Ecological Applications, 8, 1003–1021.
Asrar, G., Kanemasu, E.T., Miller, G.P. & Weiser, R.L. (1986) Lightinterception and leaf area estimates from measurements of grasscanopy reflectance. IEEE Transactions of Geoscience and RemoteSensing, 1, 76–81.
Asrar, G., Myneni, R.B. & Choudhury, B.J. (1992) Spatial heteroge-neity in vegetation canopies and remote sensing of absorbedphotosynthetically active radiation: a modeling study. RemoteSensing of Environment, 41, 85–103.
Atkinson, P.M., Foody, G.M., Curran, P.J. & Boyd, D.S. (2000)Assessing the ground data requirements for regional scale remotesensing of tropical forest biophysical properties. InternationalJournal of Remote Sensing, 21, 2571–2587.
Barclay, H.J. (1998) Conversion of total leaf area to projected leaf areain lodgepole pine and Douglas-fir. Tree Physiology, 18, 185–193.
Bartlett, K.B. & Harriss, R.C. (1993) Review and assessment ofmethane emissions from wetlands. Chemosphere, 26, 261–320.
Beadle, C.L. (1993) Growth analysis. Photosynthesis and productionin a changing environment: a field and laboratory manual (ed.by D.O. Hall), pp. 36–46. Chapman & Hall, London.
Bondeau, A., Kicklighter, D.W. & Kaduk, J. (1999) Comparingglobal models of terrestrial net primary productivity (NPP): im-portance of vegetation structure on seasonal NPP estimates. GlobalChange Biology, 5, 35–45.
Chen, J.M. (1996) Optically-based methods for measuring seasonalvariation in leaf area index in boreal confier stands. Agricultureand Forest Meteorology, 80, 135–163.
Chen, J.M. & Black, T.A. (1992) Defining leaf area index for non-flatleaves. Plant, Cell and Environment, 15, 421–429.
Chen, J.M. & Cihlar, J. (1995) Quantifying the effect of canopyarchitecture on optical measurements of leaf area index using twogap size analysis methods. IEEE Transactions of Geoscience andRemote Sensing, 33, 777–787.
Chen, J.M. & Cihlar, J. (1996) Retrieving leaf area indices of borealconifer forests using Landsat TM images. Remote Sensing of Envi-ronment, 55, 153–162.
Chen, J.M., Rich, P.M., Gower, S.T., Norman, J.M. & Plummer, S.(1997) Leaf area index of boreal forests: theory, techniques andmeasurements. Journal of Geophysics Research — Atmospheres,102, 29, 429–29, 429, 443.
Deblonde, G., Penner, M. & Royer, A. (1994) Measuring leaf areaindex with the Licor LAI-2000 in pine stands. Ecology, 75, 1507–1511.
Field, C.B., Randerson, J.T. & Malmstrom, C.M. (1995) Global netprimary production: Combining ecology and remote sensing.Remote Sensing of Environment, 51, 74–88.
Gobron, N., Pinty, B. & Verstraete, M.M. (1997) Theoretical limitsto the estimation of the leaf area index on the basis of visible andnear-infrared remote sensing data. IEEE Transactions of Geo-science and Remote Sensing, 35, 1438–1445.
Gower, S.T., Kucharik, C.J. & Norman, J.M. (1999) Direct and indirectestimation of leaf area index, fAPAR and net primary production ofterrestrial ecosystems. Remote Sensing of Environment, 70, 29–51.
Grubbs, F.E. (1969) Procedures for detecting outlying observations insamples. Technometrics, 11, 1–21.
Herbert, D.A. & Fownes, J.H. (1997) Effects of leaf aggregation in abroadleaf canopy on estimates of leaf area index by the gap frac-tion method. Forest and Ecological Management, 3, 277–282.
Huemmrich, K.F. & Goward, S.N. (1997) Vegetation canopy PARabsorptance and NDVI: an assessment for ten tree species with theSAIL model. Remote Sensing of Environment, 61, 254–269.
Kergoat, L. (1998) A model for hydrological equilibrium of leaf areaindex on a global scale. Journal of Hydrology, 212, 268–286.
Kucharik, C.J., Norman, J.M. & Gower, S.T. (1998) Measurementsof branch area and adjusting leaf area index indirect measure-ments. Agriculture and Forest Meteorology, 91, 69–88.
Lacaze, R., Roujean, J.L. & Goutorbe, J.P. (1999) Spatial distribu-tion of Sahelian land surface properties from airborne POLDERmultiangular observations. Journal of Geophysics Research, 104,12131–12146.
McWilliam, A.L.-C., Roberts, J.M., Cabral, O.M.R., Leitao,M.V.B.R., Decosta, A.C.L., Maitelli, G.T. & Zamparoni, C.A.(1993) Leaf-area index and aboveground biomass of terra-firme

204 G. P. Asner et al.
© 2003 Blackwell Publishing Ltd, Global Ecology & Biogeography, 12, 191–205
rainforest and adjacent clearings in Amazonia. Functional Ecol-ogy, 7, 310–317.
Myneni, R.B. & Asrar, G. (1993) Radiative transfer in three-dimensional atmosphere-vegetation media. Journal of QuantitativeSpectroscopy and Radiative Transfer, 49, 585–598.
Myneni, R.B., Ramakrishna, R.N. & Running, S.W. (1997) Estima-tion of global leaf area index and absorbed PAR using radiativetransfer models. IEEE Transactions Geoscience Remote Sensing,35, 1380–1393.
Norby, R.J., Todd, D.E., Fults, J. & Johnson, D.W. (2001) Allometricdetermination of tree growth in a CO2-enriched sweetgum stand.New Phytologist, 150, 477–487.
Olson, R.J., Johnson, K.R., Zheng, D.L. & Scurlock, J.M.O. (2001)Global and regional ecosystem modeling: databases of modeldrivers and validation measurements. ORNL/TM-2001/196.p. 81. Oak Ridge National Laboratory, Oak Ridge, USA.
Rouse, W.R., Carlson, D.W. & Weick, E.J. (1992) Impacts of summerwarming on the energy and water balance of wetland tundra. Cli-mate Change, 22, 305–326.
Running, S.W. & Coughlan, J.C. (1988) A general model of forestecosystem processes for regional applications. I. Hydrologic bal-ance, canopy gas exchange and primary production processes.Ecological Modeling, 42, 125–154.
Running, S.W. & Gower, S.T. (1991) Forest-BGC, A general modelof forest ecosystem processes for regional applications. II. Dynamiccarbon allocation and nitrogen budgets. Tree Physiology, 9, 147–160.
Schimel, D.S. (1995) Terrestrial biogeochemical cycles: Global esti-mates with remote sensing. Remote Sensing of Environment, 51,49–56.
Schulze, E.-D. (1982) Plant life forms and their carbon, water andnutrient relations. Encyclopedia of plant physiology. New Series,12B (ed. by O.L. Lange, P.S. Nobel, C.B. Osmond & H. Ziegler),pp. 615–676. Springer-Verlag, Berlin.
Scurlock, J.M.O., Asner, G.P. & Gower, S.T. (2001) Worldwide his-torical estimates of Leaf Area Index, 1932–2000. ORNL/TM-2001/268. p. 34. Oak Ridge National Laboratory, Oak Ridge,USA.
Scurlock, J.M.O., Cramer, W., Olson, R.J., Parton, W.J. & Prince,S.D. (1999) Terrestrial NPP: towards a consistent data set for glo-bal model evaluation. Ecological Applications, 9, 913–919.
Scurlock et al. (1996) Article title. Journal, 00, 000–000.Sellers, P.J. (1997) BOREAS in 1997: Experiment overview, scientific
results and future directions. Journal of Geophysics Research, 102,28731–28770.
Sellers, P.J., Hall, F.G., Asrar, G., Strebel, D.E. & Murphy, R.E.(1988) The first ISLSCP field experiment (FIFE). Bulletin of theAmerican Meteorological Society, 69, 22–27.
Sellers, P. & Schimel, D.S. (1993) Remote-sensing of the land bio-sphere and biogeochemistry in the EOS era — science priorities,methods and implementation. Global and Planetary Change, 7,279–297.
Sokal, R.R. & Rohlf, F.J. (1981) Biometry, 2nd edn. Freeman, NewYork. p. 413
Verstraete, M.M. & Pinty, B. (1991) The potential contribution ofsatellite remote sensing to the understanding of arid lands proc-esses. Vegetatio, 91, 59–72.
Waring, R.H. (1983) Estimating forest growth and efficiency in rela-tion to canopy leaf area. Advances in Ecological Research, 13,327–354.
Welles, J.M. & Norman, J.M. (1991) Instrument for indirect meas-urement of canopy architecture. Agronomy Journal, 83, 818–825.
White, M.A., Asner, G.P., Nemani, R.R., Privette, J.L. & Running,S.W. (2000) Monitoring fractional cover and leaf area index in aridecosystems: digital camera, radiation transmittance, and laseraltimetry results. Remote Sensing of Environment, 74, 45–57.
Yang, L., Wylie, B.K., Tieszen, L.L. & Reed, B.C. (1997) An analysisof relationships among climate forcing and time-integrated NDVIof grasslands over the U.S. northern and central Great Plains.Remote Sensing of Environment, 65, 25–37.
BIOSKETCHES
Gregory P. Asner is a faculty member of the Carnegie Institution’s Department of Global Ecology and in the Department of Geological and Environmental Sciences at Stanford University. His scientific research combines field studies, airborne and satellite remote sensing, and computer modelling to study the effects of land-use change and climate variability on ecosystem functions at the regional scale. He focuses much of his research in the humid tropical forests and deserts of the world.
Jonathan M.O. Scurlock is a staff scientist at the Oak Ridge National Laboratory. His research spans the areas of global carbon cycling, plant productivity, and canopy processes.
Jeffrey A. Hicke is a postdoctoral fellow in the Department of Global Ecology, Carnegie Institution of Washington. His research focuses on combining models and remote sensing data for analysis of carbon cycling and climate variability at the regional to global scales. He also maintains interests in land-use and land-cover change.

Global leaf area index 205
© 2003 Blackwell Publishing Ltd, Global Ecology & Biogeography, 12, 191–205
APPENDIX 1
List of column headings in the ORNL leaf area index database.
APPENDIX 2
Biome/land-cover classes based upon the Ecosystem Model-Data Intercomparison (Olson et al., 2001), and acronyms that appear in the ORNLleaf area index database.
Variable Definition
Sitename Unique common name for study site, where reportedCountry Country of studyLatitude —Longitude —LAI Leaf area index, as reported (m2/m2 or dimensionless)Time of Measurement Season, month, occasionally exact dateYear_LAI Year of original study, where reported (otherwise assumed to be equal to Year of publication)Methodology/remarks Methodologies:
A — Destructive harvestB — LitterfallC — AllometryD — Point quadrat/plumb lineE — Indirect noncontact (LAI-2000 or other)X — Unknown
Biome Biome/land-cover type, as reportedBiome cover Biome/land-cover type assigned to one of 15 classes (see Appendix 2)Dominant species Major species/genus/family, where reportedAuthor Name of first author of original referenceYear pub Year of publicationANPP Above-ground net primary productivity (g/m2/year dry matter)BNPP Below-ground net primary productivity (g/m2/year dry matter)TNPP Total net primary productivity (ANPP + BNPP) (g/m2/year dry matter)Elevation Elevation of study site in meters, as reportedAge Age of vegetation stand in years (mostly reported for forests)Remarks/original source Additional remarks about peculiarities of the study; references to previous or related studies
Biome/land cover Acronym or terminology used
Crops (temperate and tropical) CropsDeserts DesertGrasslands (temperate and tropical) GrasslandPlantations (managed forests of temperate
deciduous broadleaf, temperate evergreen needleleaf and tropical deciduous broadleaf lifeforms and species)
Plantation
Shrublands (heath or Mediterranean) ShrublandTundra (circumpolar and alpine) TundraWetlands, temperate and tropical WetlandForest, boreal deciduous broadleaf BoDBLForest, boreal evergreen needleleaf BoENLForest, boreal /temperate deciduous needleleaf BoTeDNLForest, temperate deciduous broadleaf TeDBLForest, temperate evergreen needleleaf TeENLForest, temperate evergreen broadleaf TeEBLForest, tropical deciduous broadleaf TrDBLForest, tropical evergreen broadleaf TrEBL