Global Science and Engineering: A Status Report Engineering Globalization Workshop Arlington,...
41
Global Science and Engineering: A Status Report Engineering Globalization Workshop Arlington, Virginia May 17, 2012 Rolf Lehming Program Director, S&E Indicators National Science Foundation/NCSES www.nsf.gov/statistics/
-
Upload
britton-moody -
Category
Documents
-
view
216 -
download
0
Transcript of Global Science and Engineering: A Status Report Engineering Globalization Workshop Arlington,...
Global Science and Engineering: A Status Report
Engineering Globalization WorkshopArlington, Virginia
May 17, 2012
Rolf LehmingProgram Director, S&E Indicators
National Science Foundation/NCSESwww.nsf.gov/statistics/
The United States in the global S&E system
• Research and development expenditures
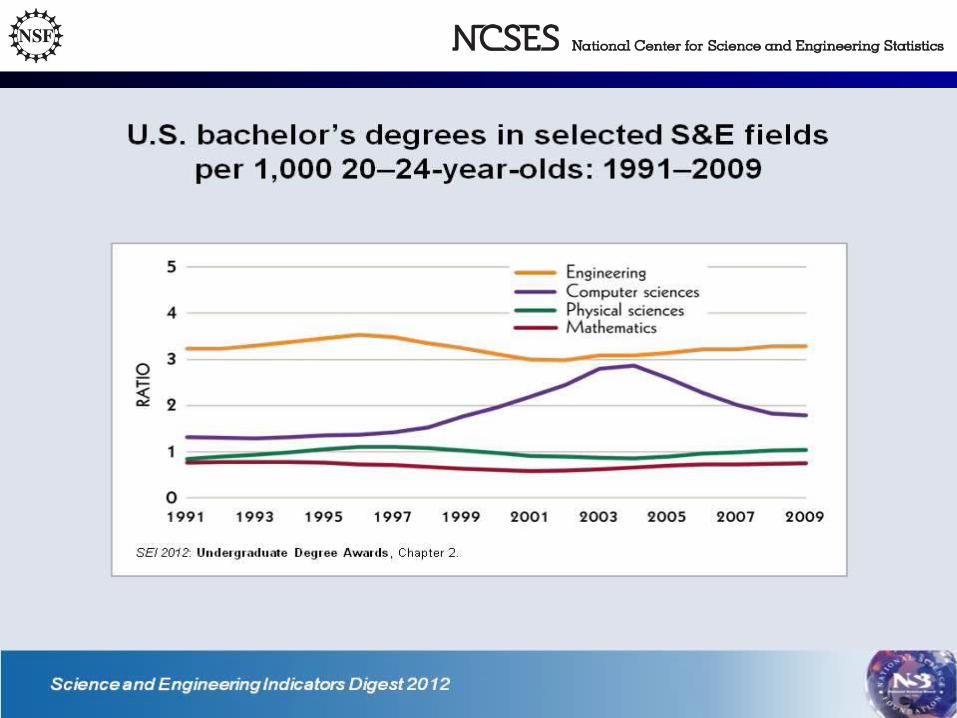
• STEM education
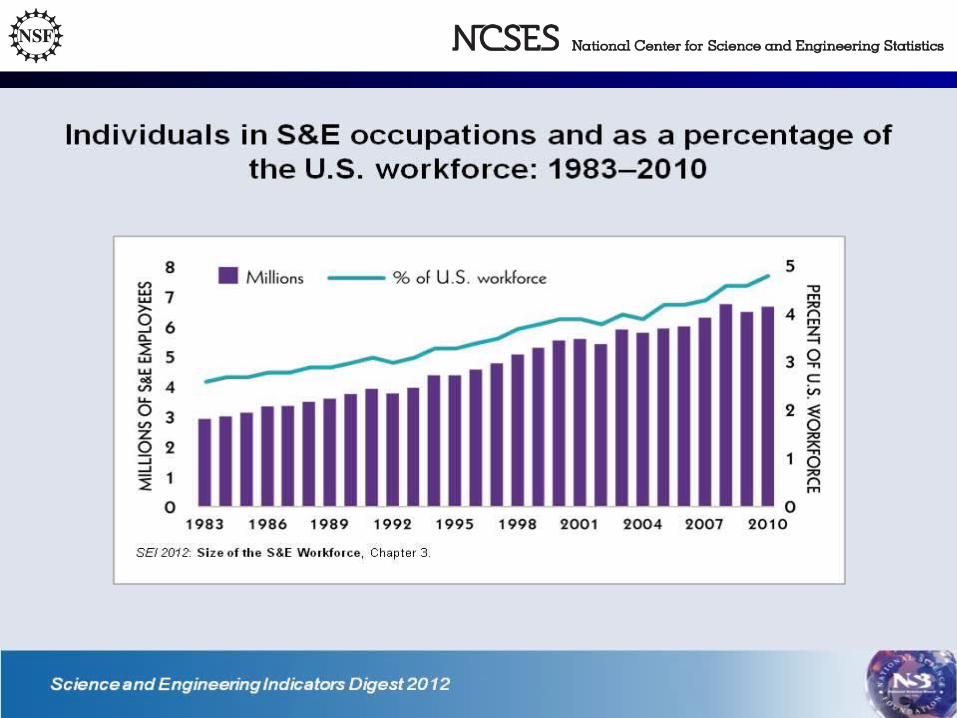
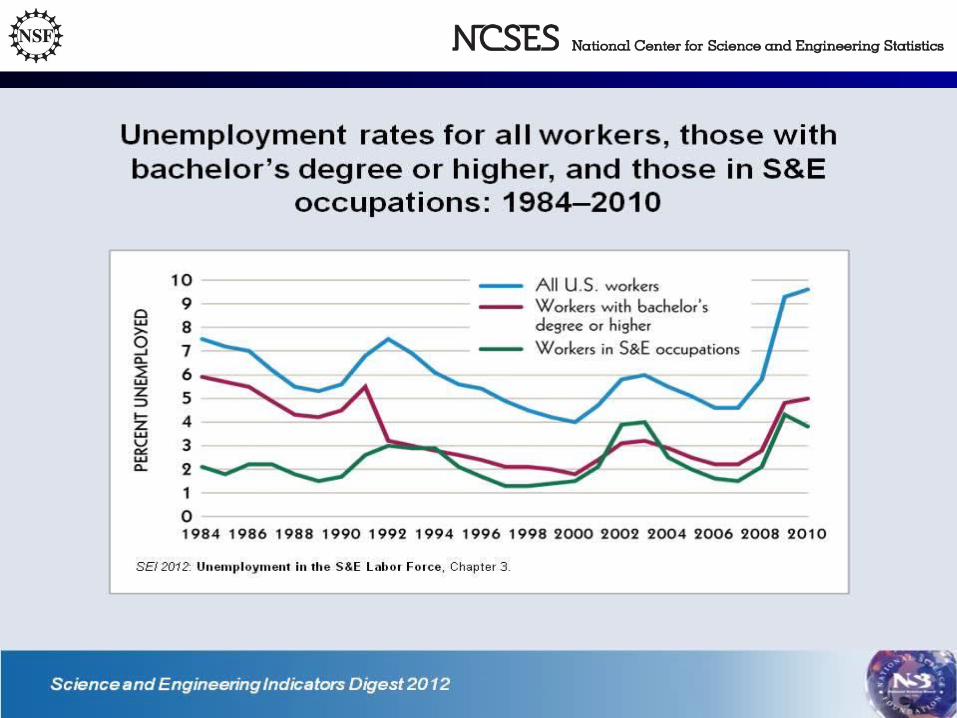
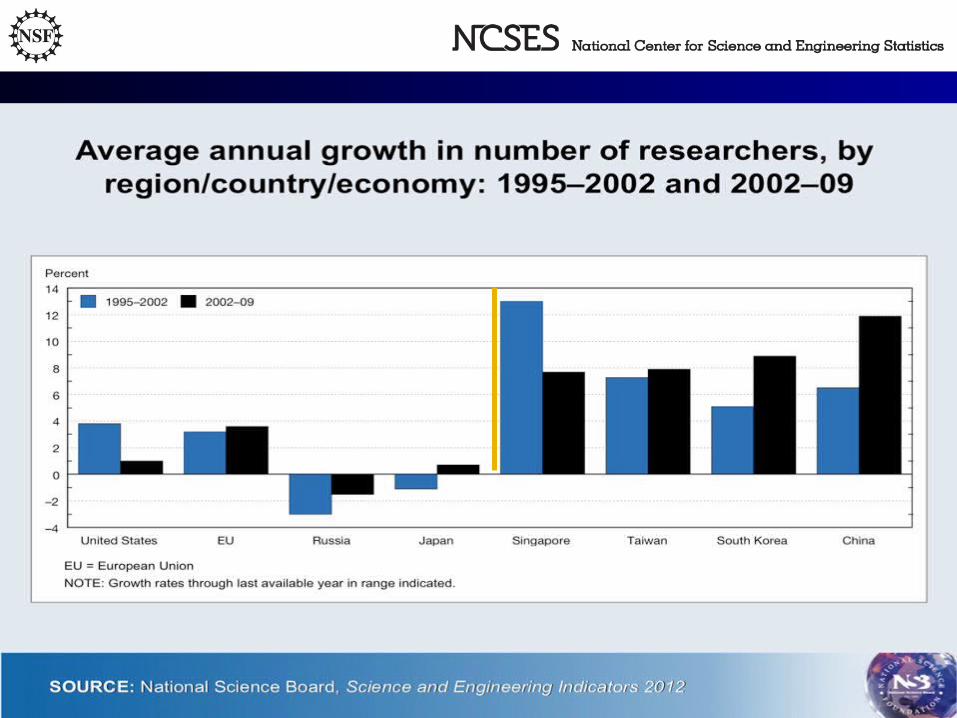
• STEM workforce including researchers
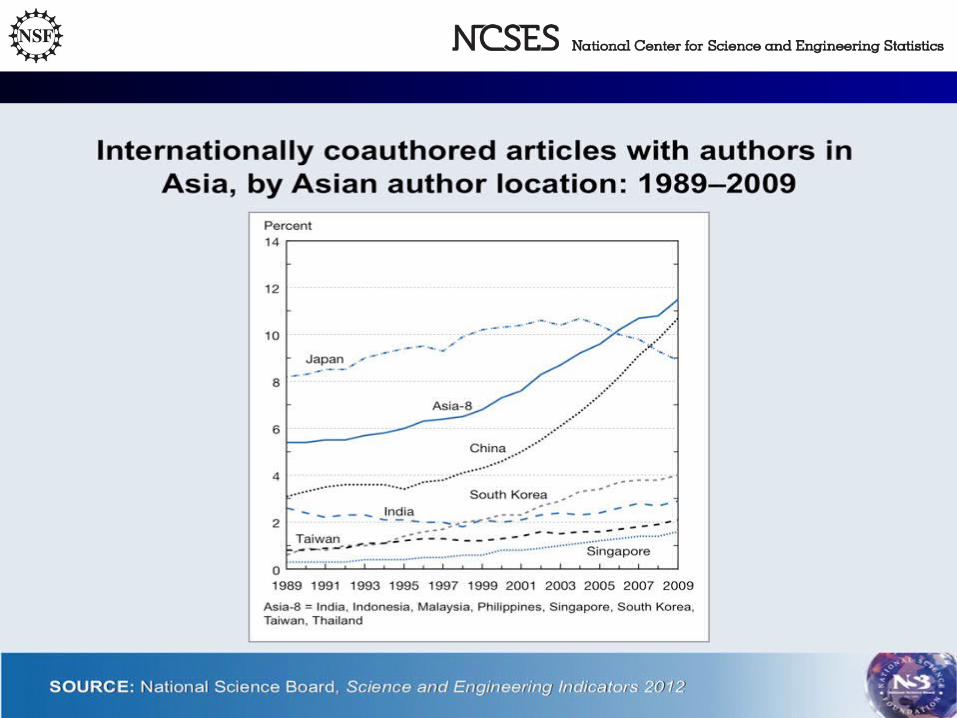
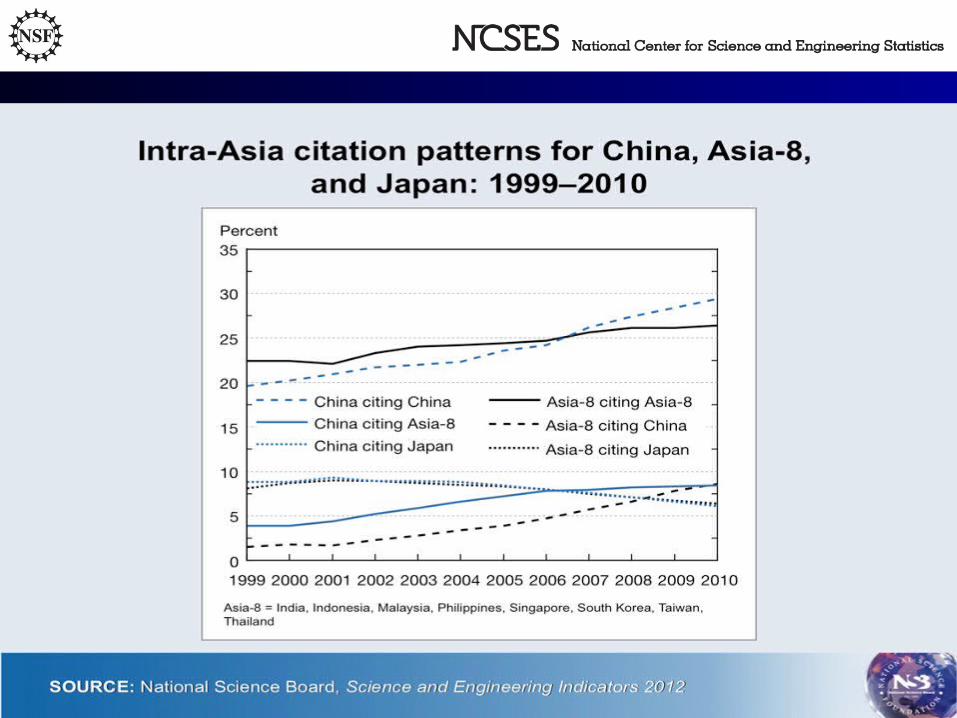
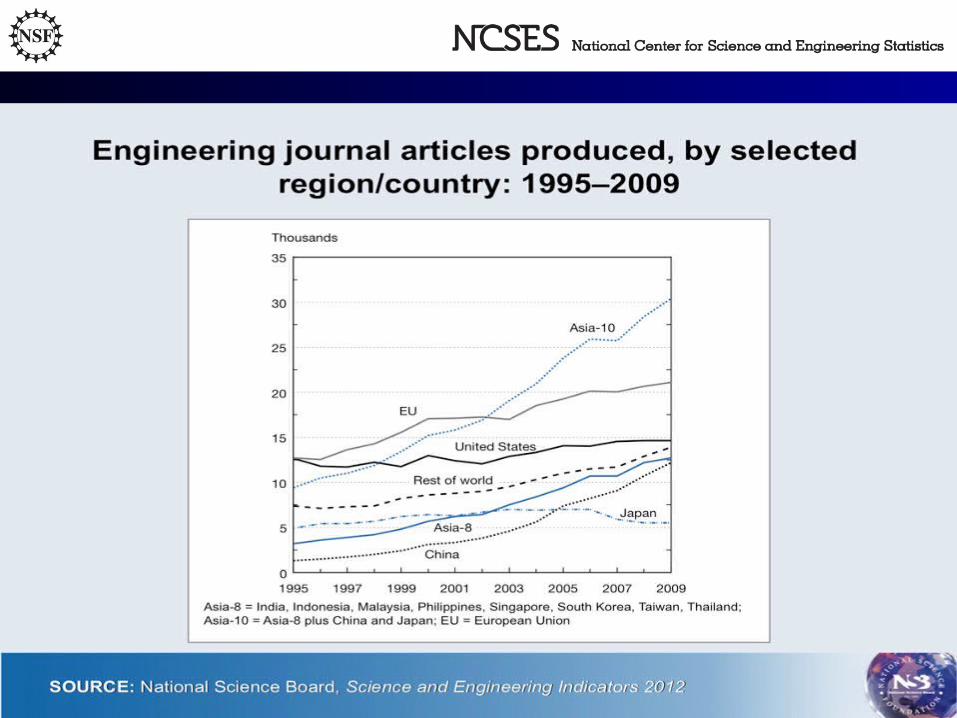
• Research outputs
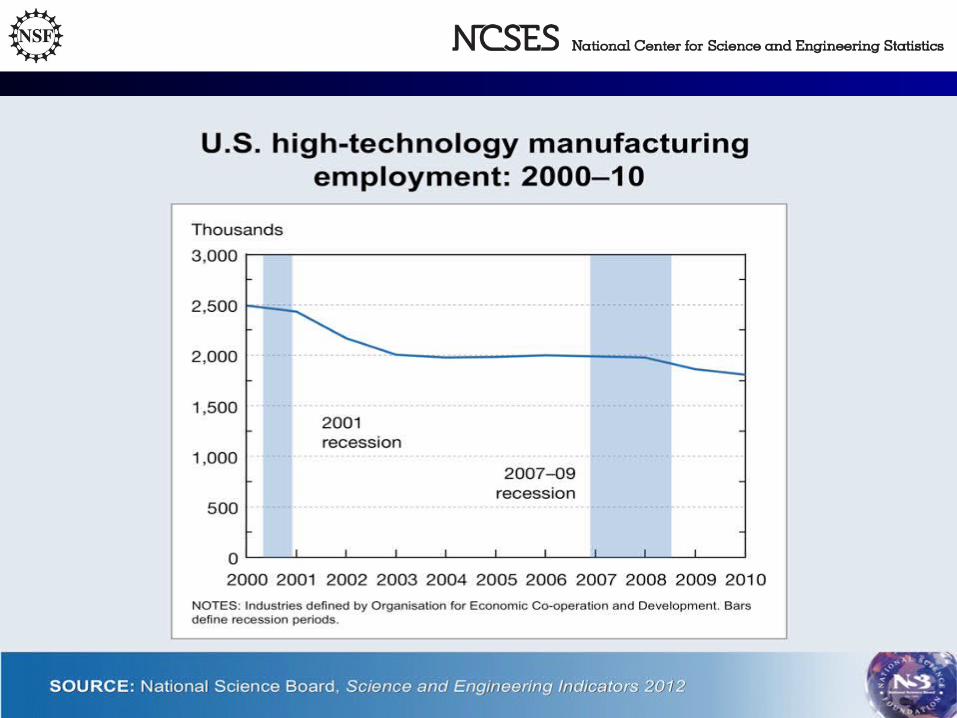
• High-tech manufacturing, knowledge intensive services
• ICT
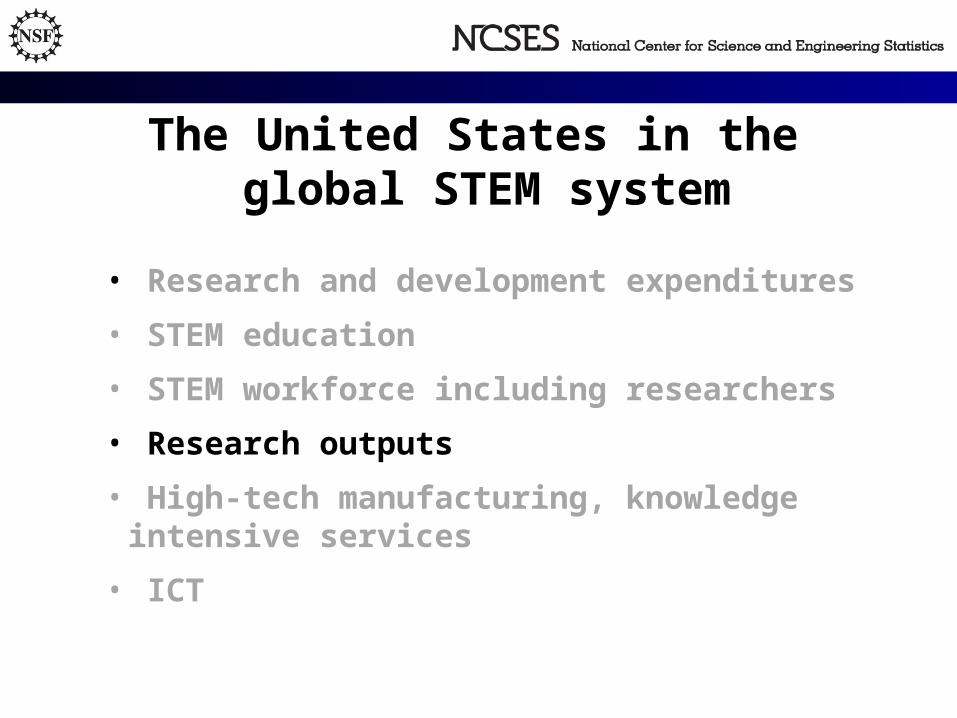
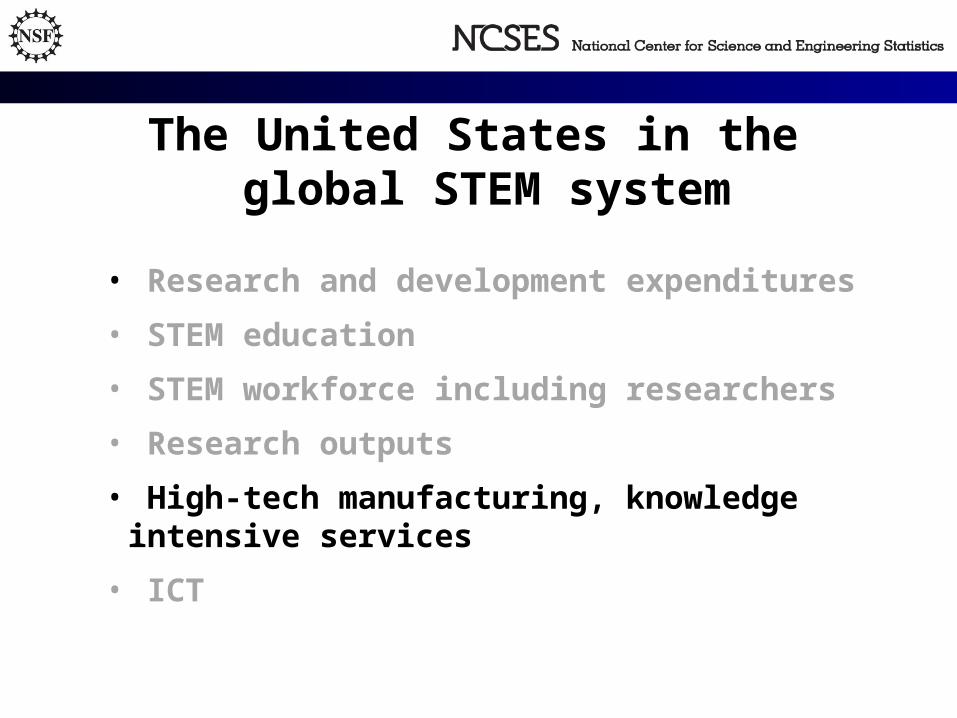
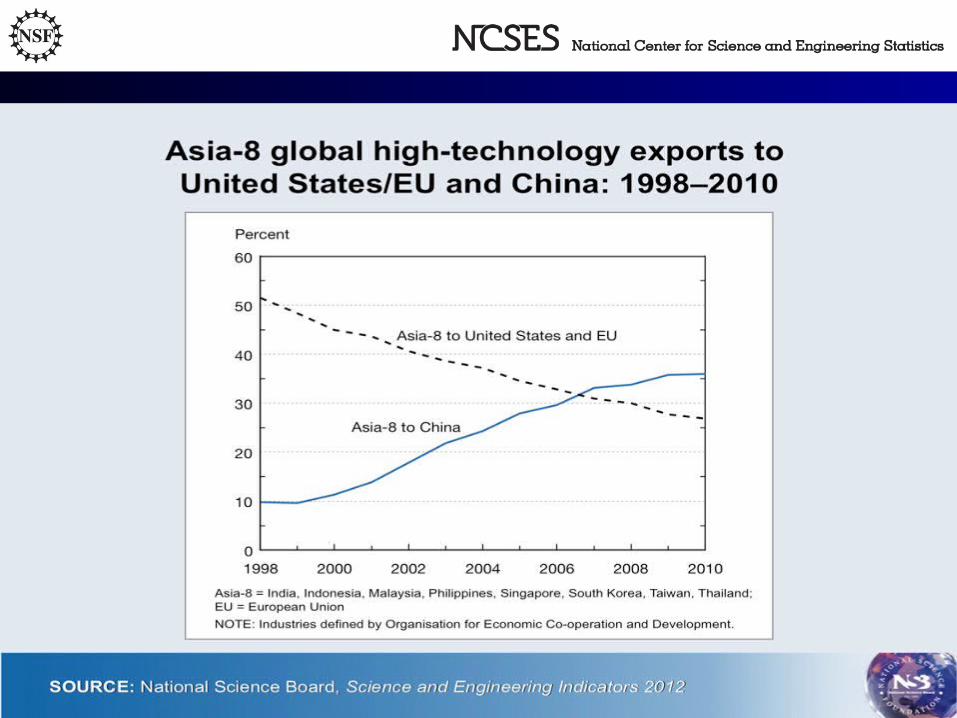
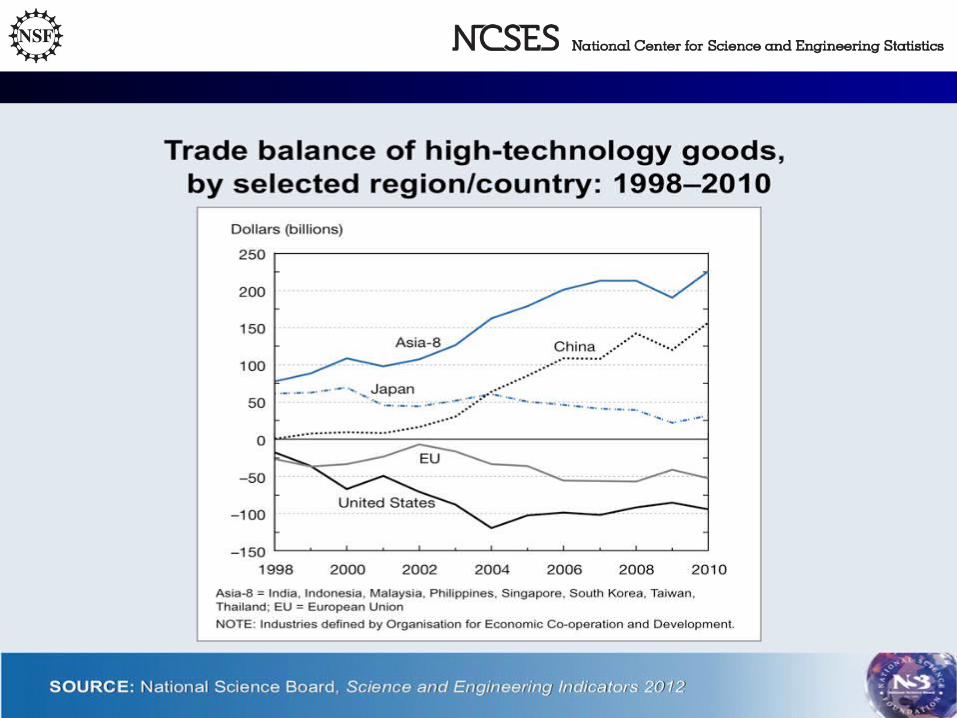
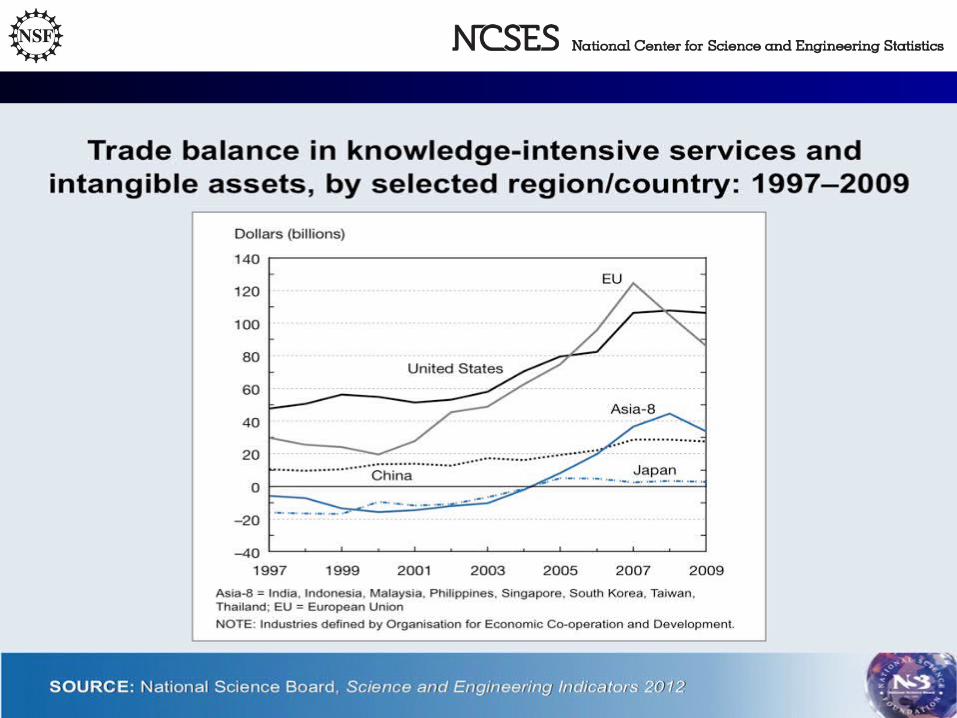
The United States in the global STEM system
• Research and development expenditures
• STEM education
• STEM workforce including researchers
• Research outputs
• High-tech manufacturing, knowledge intensive services
• ICT

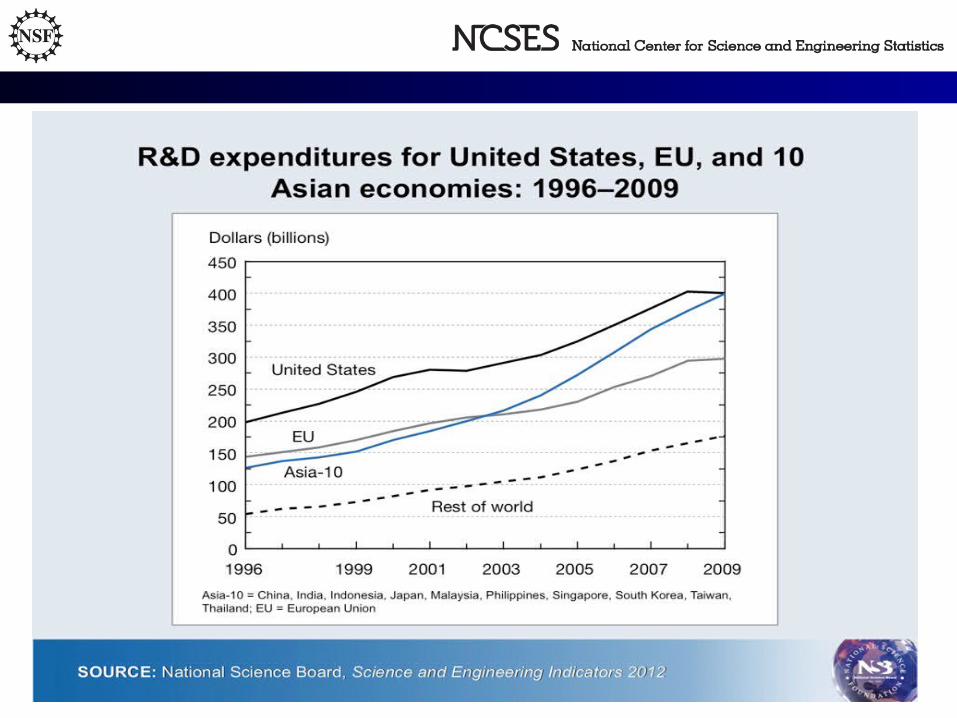
Estimated R&D expenditures worldwide: 1996–2009
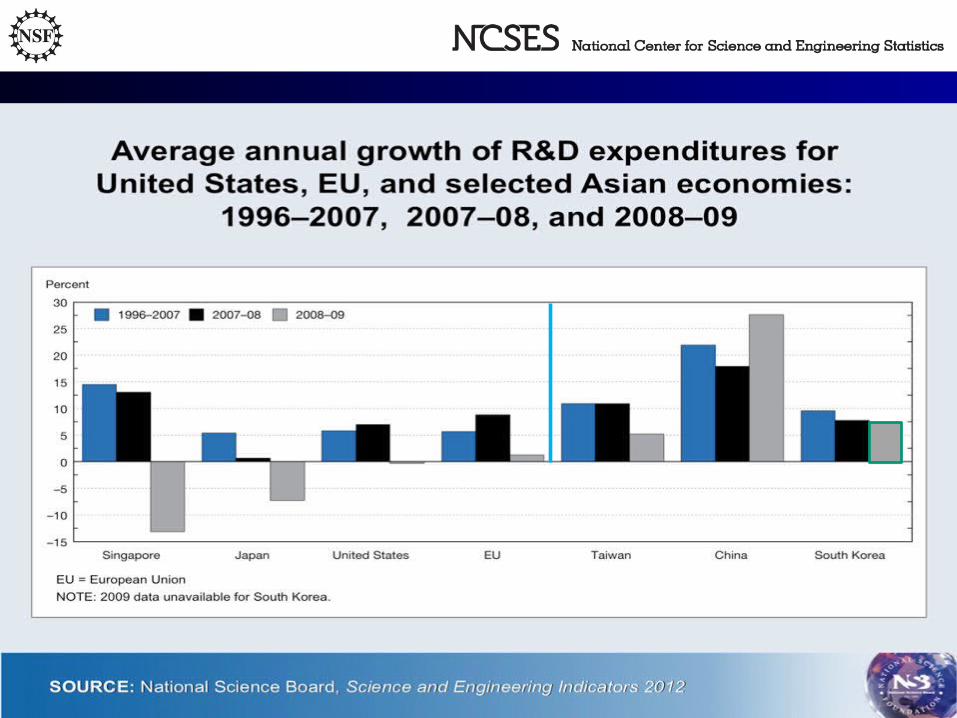
SOURCE: National Science Board Science and Engineering Indicators 2012


Total In U.S. Overseas Percent overseas
1999 144,435 126,291 18,144 12.62000 155,924 135,467 20,457 13.12001 162,719 143,017 19,702 12.12002 158,040 136,977 21,063 13.32003 162,677 139,884 22,793 14.02004 190,029 164,189 25,840 13.62005 205,251 177,598 27,653 13.52006 214,011 184,428 29,583 13.82007 238,124 203,678 34,446 14.52008 236,096 199,105 36,991 15.7
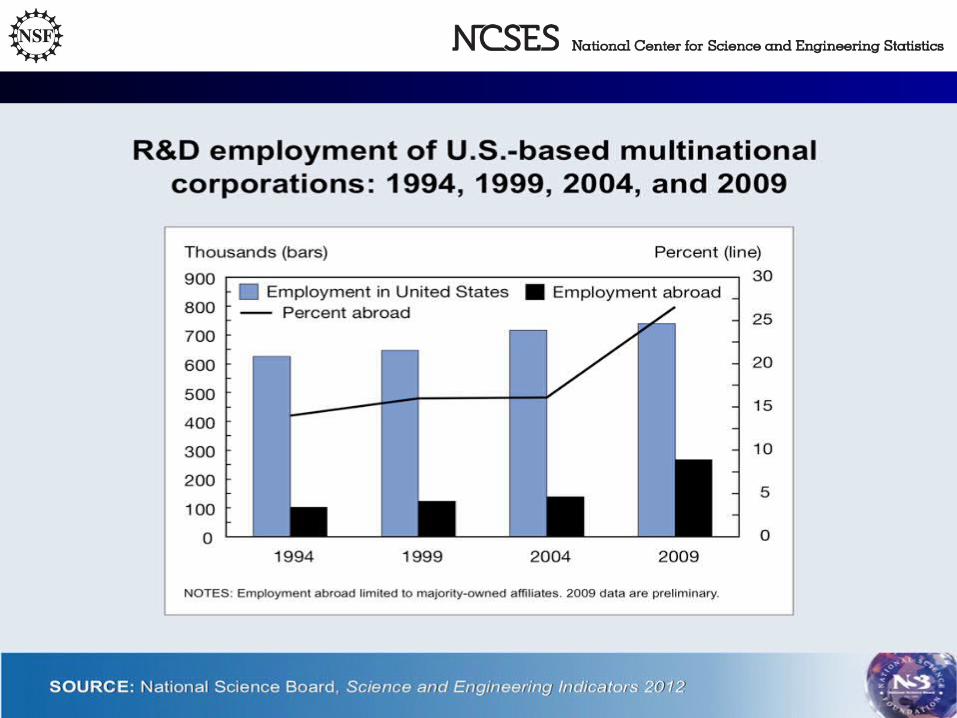
R&D performed by U.S. multinational companies: 1999-2008
National Science Board, Science and Engineering Indicators 2012
The United States in the global STEM system
• Research and development expenditures
• STEM education
• STEM workforce including researchers
• Research outputs
• High-tech manufacturing, knowledge intensive services
• ICT
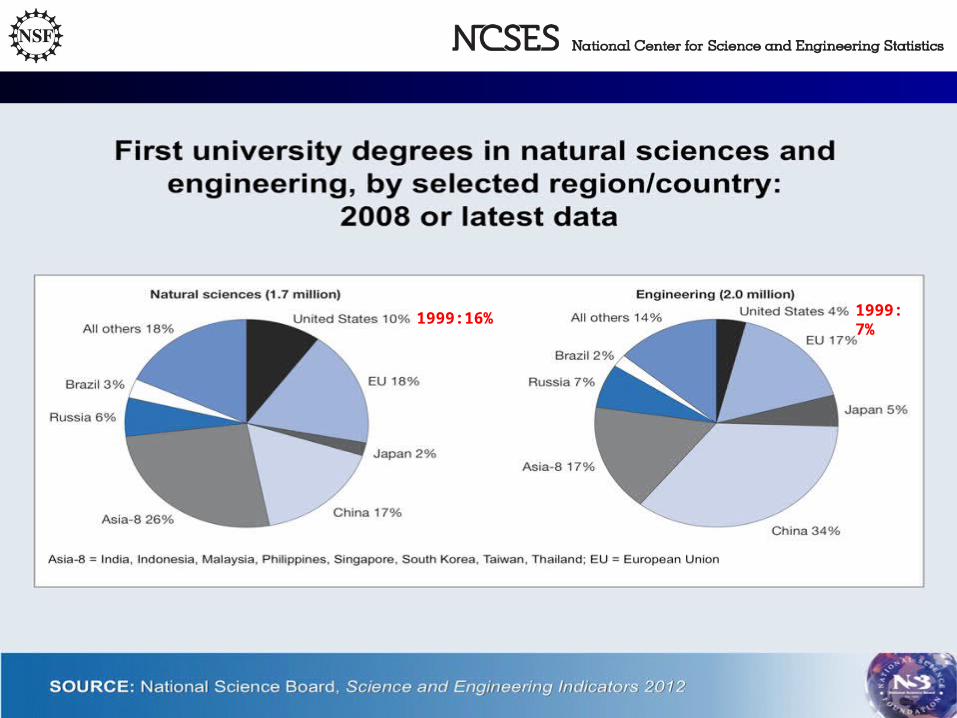
1999:16% 1999: 7%

The United States in the global STEM system
• Research and development expenditures
• STEM education
• STEM workforce including researchers
• Research outputs
• High-tech manufacturing, knowledge intensive services
• ICT
The United States in the global STEM system
• Research and development expenditures
• STEM education
• STEM workforce including researchers
• Research outputs
• High-tech manufacturing, knowledge intensive services
• ICT

The United States in the global STEM system
• Research and development expenditures
• STEM education
• STEM workforce including researchers
• Research outputs
• High-tech manufacturing, knowledge intensive services
• ICT
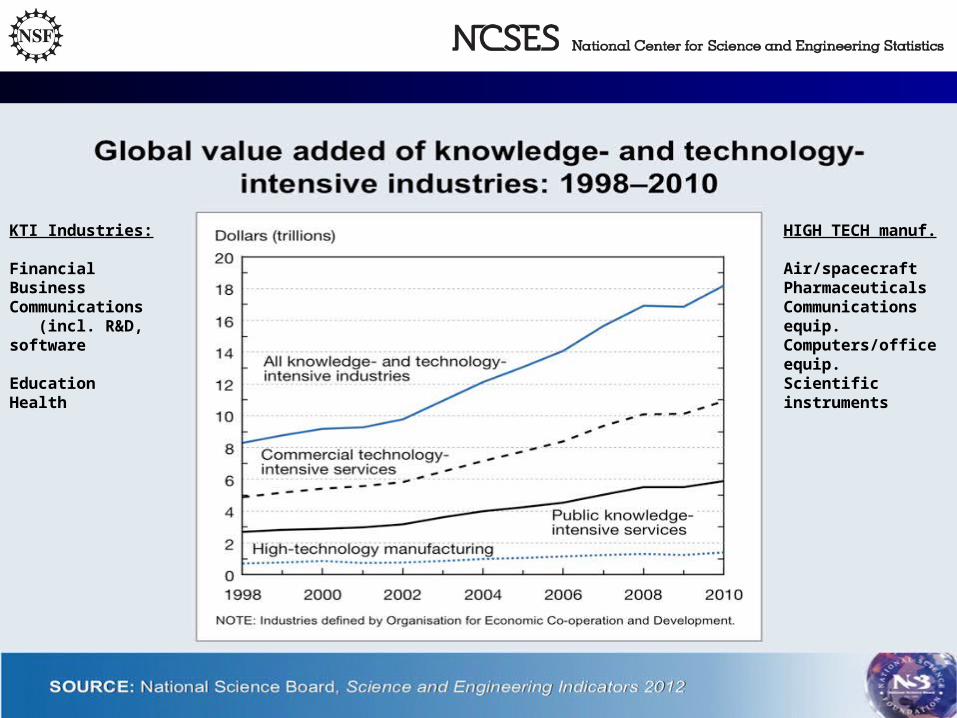
KTI Industries:
FinancialBusinessCommunications (incl. R&D, software
EducationHealth
HIGH TECH manuf.
Air/spacecraftPharmaceuticalsCommunications equip.Computers/office equip.Scientific instruments

The United States in the global STEM system
• Research and development expenditures
• STEM education
• STEM workforce including researchers
• Research outputs
• High-tech manufacturing, knowledge intensive services
• ICT
Information and Communications Technologies--ICT
Vital infrastructure platform for many social and economic activities. Combination of 3 high-tech manufacturing, 2 KI services
• Communications equipment, computer/office equipment, semiconductors
• Communications services, computer programming
SOURCE: National Science Board, Science and Engineering Indicators, 2012
1995 1996 1997 1998 1999 2000 2001 2002 2003 2004 2005 2006 2007 2008 2009 20100
100
200
300
400
500
600
700
800
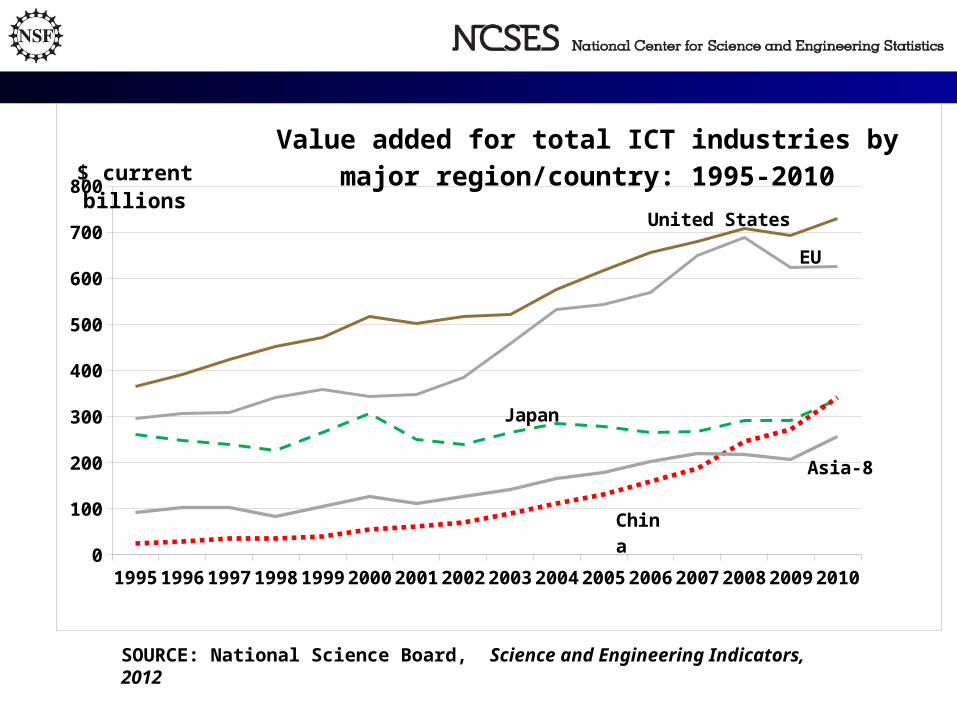
Value added for total ICT industries by major region/coun-try: 1995-2010$ current billions
United States
EU
Japan
Asia-8
China

SOURCE: National Science Board, Science and Engineering Indicators, 2012
19951996199719981999200020012002200320042005200620072008200920100
20
40
60
80
100
120
140
160
180
Value added for ICT manufacturing industries, by region/country: 1995-2010
$ current billions
China
Asia-8
Japan
EU
United States
SOURCE: National Science Board, Science and Engineering Indicators, 2012
0
5
10
15
20
25
30
35
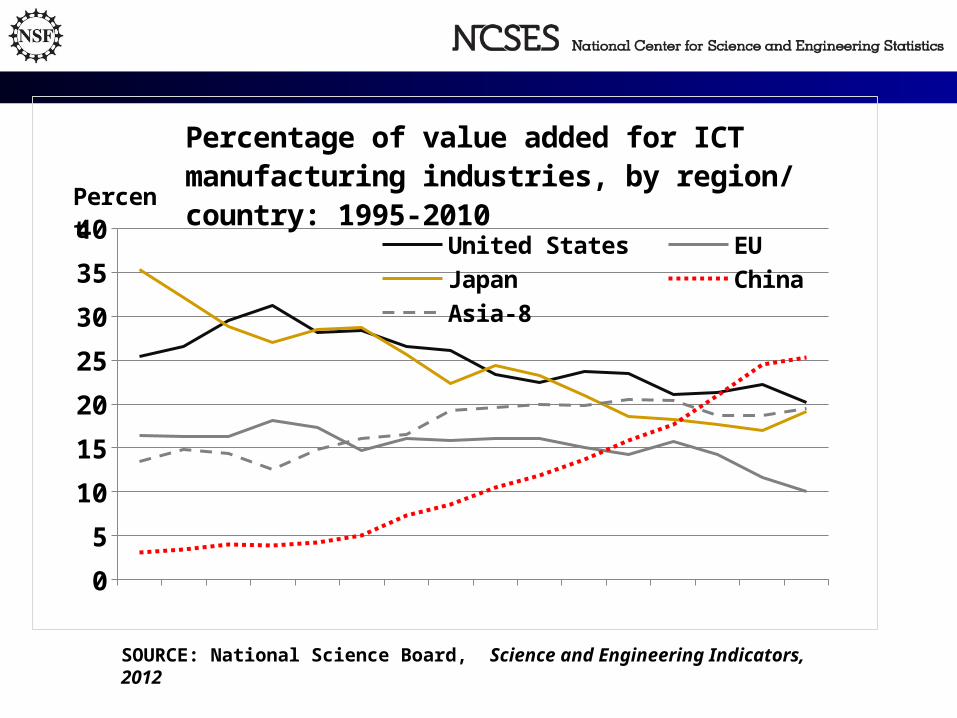
40United States EU Japan
China Asia-8
Percent
Percentage of value added for ICT manufacturing industries, by region/country: 1995-2010

SOURCE: National Science Board, Science and Engineering Indicators, 2012
0
100
200
300
400
500
600
700
Value added for ICT service industries, by region/country: 1995-2010
United States EU JapanChina Asia-8
$ current bil-lions
SOURCE: National Science Board, Science and Engineering Indicators, 2012
0
100
200
300
400
500
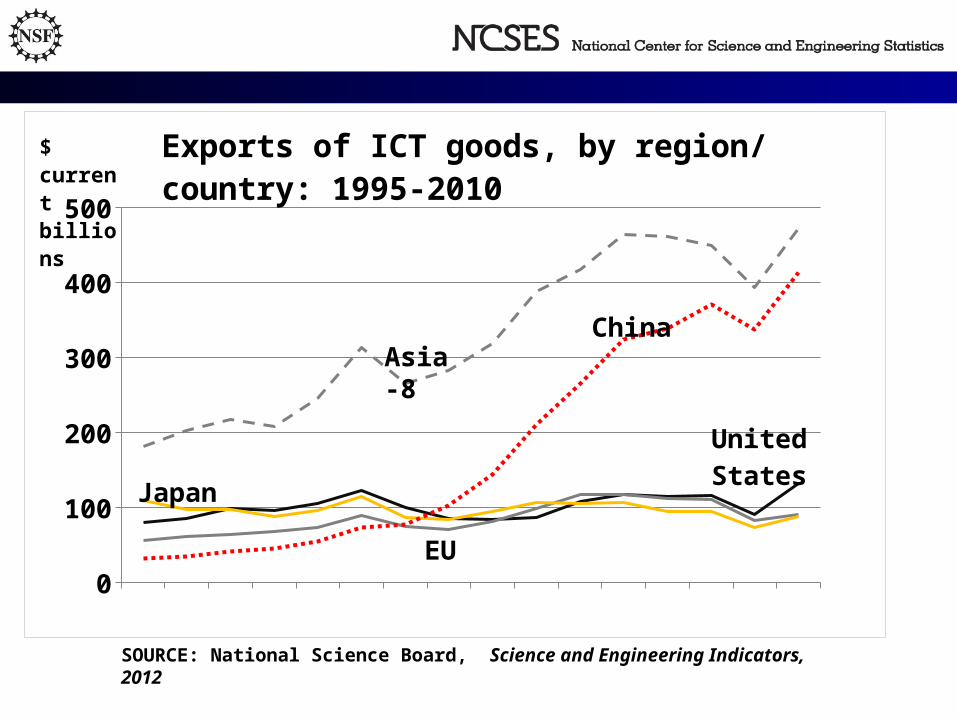
Exports of ICT goods, by region/country: 1995-2010
$ current billions
China
United States
EU
Asia-8
Japan
SOURCE: National Science Board, Science and Engineering Indicators, 2012
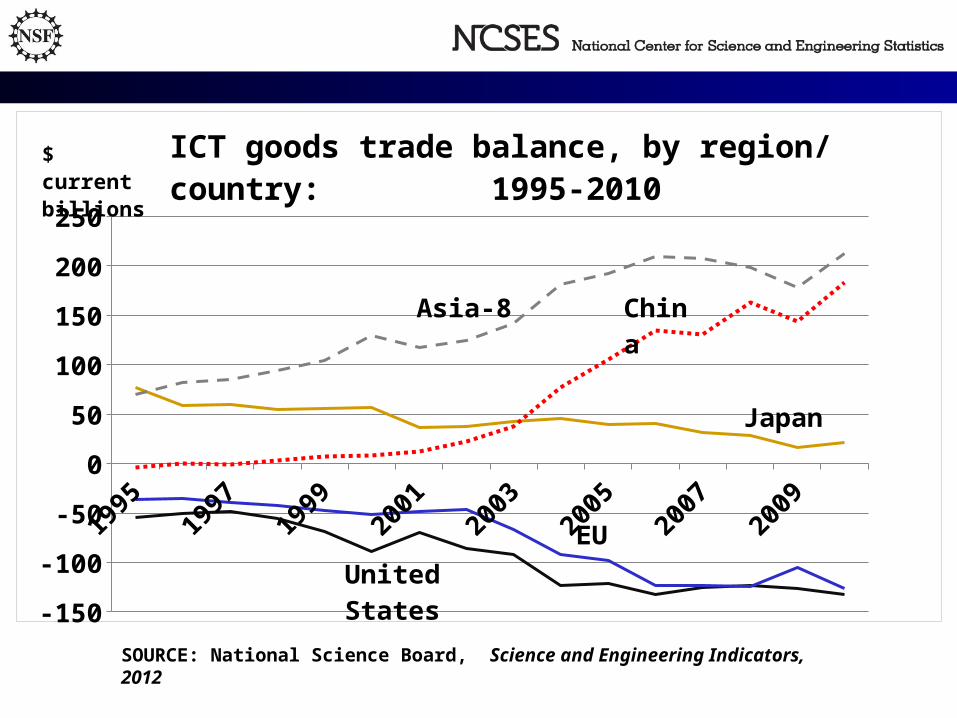
-150
-100
-50
0
50
100
150
200
250
Asia-8
Japan
China
EU
United States
$ current billions
ICT goods trade balance, by region/country: 1995-2010