Global Savannah Phenology Integrating Earth Observation ... fileGlobal Savannah Phenology...
55
Global Savannah Phenology Integrating Earth Observation, Ecosystem Modeling, and PhenoCams Boke-Olén, Niklas 2017 Document Version: Publisher's PDF, also known as Version of record Link to publication Citation for published version (APA): Boke-Olén, N. (2017). Global Savannah Phenology: Integrating Earth Observation, Ecosystem Modeling, and PhenoCams. Lund: Lund University, Faculty of Science, Department of Physical Geography and Ecosystem Science. General rights Copyright and moral rights for the publications made accessible in the public portal are retained by the authors and/or other copyright owners and it is a condition of accessing publications that users recognise and abide by the legal requirements associated with these rights. • Users may download and print one copy of any publication from the public portal for the purpose of private study or research. • You may not further distribute the material or use it for any profit-making activity or commercial gain • You may freely distribute the URL identifying the publication in the public portal Take down policy If you believe that this document breaches copyright please contact us providing details, and we will remove access to the work immediately and investigate your claim.
Transcript of Global Savannah Phenology Integrating Earth Observation ... fileGlobal Savannah Phenology...

LUND UNIVERSITY
PO Box 117221 00 Lund+46 46-222 00 00
Global Savannah Phenology
Integrating Earth Observation, Ecosystem Modeling, and PhenoCamsBoke-Olén, Niklas
2017
Document Version:Publisher's PDF, also known as Version of record
Link to publication
Citation for published version (APA):Boke-Olén, N. (2017). Global Savannah Phenology: Integrating Earth Observation, Ecosystem Modeling, andPhenoCams. Lund: Lund University, Faculty of Science, Department of Physical Geography and EcosystemScience.
General rightsCopyright and moral rights for the publications made accessible in the public portal are retained by the authorsand/or other copyright owners and it is a condition of accessing publications that users recognise and abide by thelegal requirements associated with these rights.
• Users may download and print one copy of any publication from the public portal for the purpose of private studyor research. • You may not further distribute the material or use it for any profit-making activity or commercial gain • You may freely distribute the URL identifying the publication in the public portalTake down policyIf you believe that this document breaches copyright please contact us providing details, and we will removeaccess to the work immediately and investigate your claim.

Nik
las B
ok
e-oléN
G
lobal Savannah Phenology 2017
Global Savannah Phenology Integrating Earth Observation, Ecosystem Modeling,
and PhenoCams
Niklas Boke-oléN
DePaRTMeNT oF PHYsiCal GeoGRaPHY aND eCosYsTeM sCieNCe | lUND UNiVeRsiTY
Department of Physical Geography and Ecosystem Science
Faculty of Science
ISBN: 978-91-85793-75-4
Global savannah vegetation phenology has important consequences for the carbon cycle by affecting the timing and amount of growth. To increase our understanding of how climatic variables can and will alter savannah vegetation phenology, new tools and methods are needed. This thesis con-tributed to the development of those tools by combining earth observation, ecosystem modelling, site based measurements, and PhenoCams.

Global Savannah Phenology


Global Savannah Phenology
Integrating Earth Observation, Ecosystem Modeling, and PhenoCams
Niklas Boke-Olén
DOCTORAL DISSERTATION by due permission of the Faculty of Science, Lund University, Sweden.
To be defended at Pangea, Geocentrum II, Sölvegatan 12, Lund.
Friday March 10, 2017, at 10:00 am
Faculty opponent Professor Dr. Thomas Hickler

Organization LUND UNIVERSITY Department of Physical Geography and Ecosystem Science Sölvegatan 12, SE-223 62 Lund, Sweden
Document name DOCTORAL DISSERTATION
Date of disputation 2017-03-10
Author(s) Niklas Boke-Olén
Sponsoring organization
Title and subtitle Global Savannah Phenology: Integrating Earth Observation, Ecosystem Modeling, and PhenoCams
Abstract Savannahs are land areas where grass and trees co-exists to create a landscape that is neither a grassland nor a forest. It is estimated that savannahs cover approximately one sixth of the global land surface. They also play an important role in the global carbon cycle due to their total size. Most savannahs are characterized with two distinct seasons, one dry season and one wet season where a majority of rainfall and vegetation growth is occurring. This makes the seasonality in climate especially important since it controls the timing of growth by affecting for example leaf emergence and leaf fall. Those timing of growth are most often collectively termed vegetation phenology. Phenology is the science of observing and describing life cycles and events of plants or animals over time. Vegetation phenology has a long history and observations were probably used for the first time thousands of years ago to note down changes in vegetation and harvests. Nowadays we can represent vegetation phenology at different scales using many different techniques. It can, for example, be analyzed and estimated using earth observation, site level measurements, or ecosystem modelling. Earth observation, or remote sensing, is the science of obtaining information about an object or area from a distance. For phenology vegetation indices measured from satellites are normally used. They often take advantage of the fact that plants during photosynthesis absorb the light in specific wavelengths. Site level measurements are instead carried out on the ground to monitor the ecosystem properties at the site level. They typically consist of measurement of temperature, soil moisture, precipitation, and carbon fluxes. But they could also be expanded with PhenoCams which is term referring to a digital camera producing images of the vegetation at a regular interval. Finally, ecosystem models are a mathematical representation of the ecological system and are used to understand and predict the real system. However, there exists a knowledge gap regarding the precise mechanisms affecting the vegetation phenology on savannahs. The aim of this thesis was therefore to use all of the above mentioned fields to improve our understanding and ability to estimate savannah vegetation phenology. The main results showed that soil water is of great importance for estimation of savannah vegetation phenology. It further showed the potential of using remotely sensed soil moisture and PhenoCams to improve our estimates of savannah vegetation phenology.
Key words Savannah, phenology, earth observation, ecosystem modelling, PhenoCams.
Classification system and/or index terms (if any)
Supplementary bibliographical information Language: English
ISSN and key title ISBN: 978-91-85793-75-4 (print) ISBN: 978-91-85793-76-1 (pdf)
Recipient’s notes Number of pages Price
Security classification
I, the undersigned, being the copyright owner of the abstract of the above-mentioned dissertation, hereby grant to all reference sources permission to publish and disseminate the abstract of the above-mentioned dissertation.
Signature Date

Global Savannah phenology
Integrating Earth Observation, Ecosystem Modeling, and PhenoCams
Niklas Boke-Olén

Cover art by Niklas Boke-Olén
Copyright Niklas Boke-Olén
Faculty of Science Department of Physical Geography and Ecosystem Science ISBN: 978-91-85793-75-4 (print) ISBN: 978-91-85793-76-1 (pdf) Printed in Sweden by Media-Tryck, Lund University Lund 2017

To my wife and family

Content
Abbreviations ........................................................................................................... 10
List of included papers ............................................................................................. 11 Paper contributions ....................................................................................... 11
Abstract ................................................................................................................... 13
Sammanfattning ...................................................................................................... 15
Introduction ............................................................................................................ 17 Savannahs ...................................................................................................... 17 Vegetation phenology .................................................................................... 18 Global carbon budget .................................................................................... 19 Climate change .............................................................................................. 21 Measuring and Modelling the Environment .................................................. 21
Earth Observation ................................................................................ 21 Earth System Models ............................................................................ 23 Ecosystem-Scale Measurements............................................................. 23
Aim and objectives ........................................................................................ 24
Material & Methods ................................................................................................ 25 Ecosystem scale phenology ............................................................................ 25
Statistical phenological model ............................................................... 25 Water stress controls on GPP ................................................................ 27 Phenopictures ....................................................................................... 28
Coarse scale phenology .................................................................................. 29 Remotely sensed soil moisture for estimating NDVI ............................. 29 Daily carbon allocation in LPJ-GUESS ................................................. 30
Result and Discussion .............................................................................................. 33 Ecosystem scale phenology ............................................................................ 33
Statistical phenological model ............................................................... 33 Water stress controls on GPP ................................................................ 34

Phenopictures ....................................................................................... 35 Coarse scale phenology .................................................................................. 37
Remotely sensed soil moisture to estimate NDVI.................................. 37 Daily carbon allocation in LPJ-GUESS ................................................. 38
Conclusion .............................................................................................................. 41 Main findings ................................................................................................ 41
Outlook ................................................................................................................... 43
Acknowledgement ................................................................................................... 45
References ................................................................................................................ 47

10
Abbreviations
AI Aridity IndexAPI Antecedent Precipitation IndexCO2 Carbon DioxideDGVM Dynamic Global Vegetation ModelEC Eddy CovarianceEVI Enhanced Vegetation Index GPP Gross Primary ProductionIPCC Intergovernmental Panel on Climate ChangeLPJ-GUESS Lund Potsdam Jena – General Ecosystem SimulatorLST Land Surface TemperatureLUE Light Use EfficiencyMAP Mean Annual PrecipitationMODIS MODerate Imaging SpectroradiometerNDVI Normalized Difference Vegetation IndexNEE Net Ecosystem ExchangeNPP Net Primary ProductionPAR Photosynthetic Active RadiationPAW Plant Available WaterPFT Plant Functional TypeRMSE Root Mean Squared ErrorROI Region Of InterestTLU Tropical Livestock UnitsVPD Vapor Pressure DeficitESA European Space Agency
11
List of included papers
I. Boke-Olén, N., Lehsten, V., Ardö, J., Beringer, J., Eklundh, L., Holst, T., Veenendaal, E., & Tagesson, T. (2016). Estimating and Analyzing Savannah Phenology with a Lagged Time Series Model. Plos One, 11(4), e0154615.
II. Boke-Olén, N., Lehsten, V., Ardö, J., Eklundh, L., Holst, T., (2017). Remotely sensed soil moisture to estimate savannah NDVI. Submitted.
III. Boke-Olén, N., Lehsten, V., Abdi, A. M., Ardö, J., & Khatir, A. (2017). Estimating grazing potentials in Sudan using daily carbon allocation in a dynamic vegetation model. In review for publication in Journal of Rangeland Ecology & Management
IV. Abdi, A. M., Boke-Olén, N., Tenenbaum, D.E., Tagesson, T., Cappelaere, B., Ardö, J. (2017). Evaluating water controls on vegetation growth in the semi-arid Sahel using field and Earth observations data. Submitted
Paper contributions
I. Niklas Boke-Olén was responsible for the design of the study, performed the analysis and led the writing of the manuscript.
II. Niklas Boke-Olén was responsible for the design of the study, performed the analysis and led the writing of the manuscript.
III. Niklas Boke-Olén was responsible for the design of the study, performed the analysis and led the writing of the manuscript.
IV. Niklas Boke-Olén contributed to the analysis and writing of the manuscript.

12

13
Abstract
Savannahs are land areas where grass and trees co-exists to create a landscape that is neither a grassland nor a forest. It is estimated that savannahs cover approximately one sixth of the global land surface. They also play an important role in the global carbon cycle due to their total size. Most savannahs are characterized with two distinct seasons, one dry season and one wet season where a majority of rainfall and vegetation growth is occurring. This makes the seasonality in climate especially important since it controls the timing of growth by affecting for example leaf emergence and leaf fall. Those timing of growth are most often collectively termed vegetation phenology.
Phenology is the science of observing and describing life cycles and events of plants or animals over time. Vegetation phenology has a long history and observations were probably used for the first time thousands of years ago to note down changes in vegetation and harvests. Nowadays we can represent vegetation phenology at different scales using many different techniques. It can, for example, be analyzed and estimated using earth observation, site level measurements, or ecosystem modelling. Earth observation, or remote sensing, is the science of obtaining information about an object or area from a distance. For phenology vegetation indices measured from satellites are normally used. They often take advantage of the fact that plants during photosynthesis absorb the light in specific wavelengths. Site level measurements are instead carried out on the ground to monitor the ecosystem properties at the site level. They typically consist of measurement of temperature, soil moisture, precipitation, and carbon fluxes. But they could also be expanded with PhenoCams which is term referring to a digital camera producing images of the vegetation at a regular interval. Finally, ecosystem models are a mathematical representation of the ecological system and are used to understand and predict the real system. However, there exists a knowledge gap regarding the precise mechanisms affecting the vegetation phenology on savannahs. The aim of this thesis was therefore to use all of the above mentioned fields to improve our understanding and ability to estimate savannah vegetation phenology. The main results showed that soil water is of great importance for estimation of savannah vegetation phenology. It further showed the potential of using remotely sensed soil moisture and PhenoCams to improve our estimates of savannah vegetation phenology.

14

15
Sammanfattning
Savanner är ett landskap med både träd och gräs som skapar en miljö som varken är skog eller gräsmark. Savanner tar upp cirka en sjättedel av världens totala landyta och de har på grund av detta en stor betydelse för den globala kolbalansen. De flesta savanner har två distinkta säsonger, en regnperiod då vegetationen grönskar samt en period med torka utan nederbörd. Detta gör att förändringar i det säsongsbetonade klimatet har stor betydelse eftersom det påverkar längden på växtperioden men även tidpunkten för när gräset börjar växa, når maximum och vissnar. Dessa tidpunkter kan kollektivt benämnas växtfenologi.
Fenologi är läran eller vetenskapen som beskriver de återkommande händelserna inom djur- och växtriket. För växter handlar det om de naturligt återkommande händelserna som till exempel knoppsprickning och lövfällning men kan också handla om den kompletta säsongsvarierande cykeln. Växtfenologi användes troligen redan för tusentals år sedan, för enkla manuella observationer av växtlighet och skörd. Nuförtiden uppskattar man växtfenologi på olika skalor med hjälp av olika mätmetoder och modeller. Det uppskattas med hjälp av till exempel fjärranalys, platsbaserade automatiska mätinstrument eller ekosystemmodellering. Fjärranalys är ett begrepp som handlar om att på avstånd mäta och kvantifiera information om ett objekt eller område. För fenologi kan olika satellitbaserad vegetationsindex användas. De nyttjar kunskapen att växter använder specifika våglängder av ljus i fotosyntesen. Platsbaserade mätningar genomförs istället på lokal nivå och består vanligtvis av mätningar av nederbörd, temperatur, markfuktighet och kolutbyten mellan växtlighet och atmosfär. De kan även utökas med PhenoCams, digitalkameror som regelbundet tar bilder av växtligheten. Ekosystemmodeller är en matematisk beskrivning av ett eller flera ekologiska system som används för att förstå och förutspå hur till exempel förändringar i klimatet påverkar ekosystemet. Det finns ett kunskapsgap när det gäller de exakta mekanismerna som styr savanners växtfenologi. Det slutgiltiga målet med denna avhandling är därför att använda metoder och data från fjärranalys, platsbaserad mätningar och ekosystemodeller för att öka förståelsen och möjligheten att simulera savanners växtfenologi. Det huvudsakliga resultatet visade att markfuktighet är en avgörande faktor vid uppskattning av savanners växtfenologi. Det visas även att markfuktighet uppmätt med fjärranalys samt PhenoCams båda har potential till att användas för att förbättra växtfenologi för savanner.

16

17
Introduction
Vegetation phenology of savannah ecosystems has important consequences for the carbon cycle by affecting the timing and amount of growth at both regional and global scales (Myneni, Keeling, Tucker, Asrar, & Nemani, 1997). To increase our understanding of how climatic variables can and will alter savannah vegetation phenology, new tools and methods are needed. The aim of this thesis was therefore to contribute to the development of those tools by combining earth observation, ecosystem modelling, site based measurements, and PhenoCams1.
Savannahs
Savannahs are according to the Cambridge Advanced Learner’s Dictionary “a large, flat area of land covered with grass, usually with few trees, that is found in hot countries, especially in Africa” (McIntosh, 2013). Approximately one sixth of the world’s land surface is a savannah, where grass and scattered trees coexist to create a land that is neither a grassland nor a forest (Grace, San Jose, Meir, Miranda, & Montes, 2006; Scholes & Archer, 1997). An approximate spatial distribution of savannahs can be seen in Figure 1. It has been shown in a continental analysis of the African savannahs that the maximum tree cover were limited by the mean annual precipitation and that other disturbances control the amount of woody cover below the upper limit (Sankaran et al., 2005). Most savannahs are characterized with at least two distinct seasons, one dry season and one wet season where a majority of rainfall and vegetation growth is occurring. They are generally grazing rich and strongly controlled by fire which is also used for ecosystem management (Bond, Woodward, & Midgley, 2005; Freckleton, 2004).
The study of savannahs is particularly important because they can be populated with societies depending on farming (Armah et al., 2011) or livestock grazing (Thornton et al., 2007). In these areas a production loss due to unsuitable climate conditions during the growing season can have major consequences. Savannahs also play a major
1 PhenoCam is a term referring to any digital camera used to take images of the vegetation at a regular
interval.

18
role in the carbon cycle due to their high total net primary productivity (Grace et al., 2006; Scurlock & Hall, 1998). Despite their importance for the global carbon cycle and food needs, these ecosystems and especially their phenological characteristics which ultimately drive the carbon exchange are poorly represented in global vegetation models (Beringer et al., 2011). It is therefore vital to assess savannah phenology and its feedback to the global carbon cycle and effect on local communities.
Figure 1. Global map showing the extent of the terrestrial ecoregions; temperate, tropical and subtropical grasslands savannahs, and shrub lands. Source: Olson et al. (2001).
Vegetation phenology
All ecosystems in the world are affected by seasonal variations in climate and life cycles (Bourlière, 1983). For savannahs, the seasonality in climate is especially important since it controls the timings of growth on an annual timescale. The term vegetation phenology is thereby used to describe those natural reoccurring events such as budburst or leaf fall but can also be used as a description of the full seasonal cycle of changing vegetation states. Phenology as a descriptive measure was probably first used to note changes in vegetation and harvest by primitive farming societies thousands of years ago (Puppi, 2007).

19
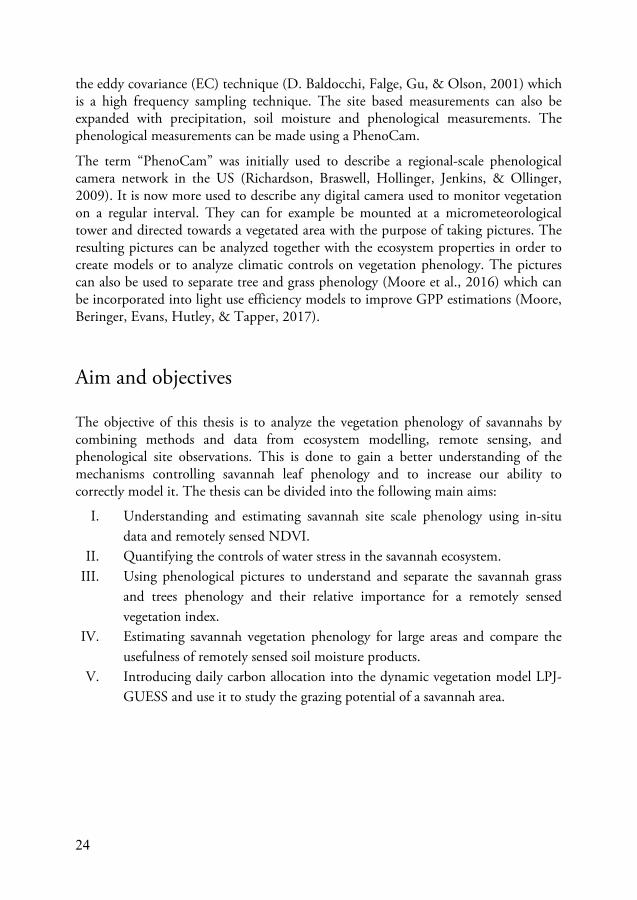
The phenology of an area can be represented by remotely sensed vegetation indices or images originating from PhenoCams (Figure 2). The climatic controls on savannah grass growth have been shown to be related to water availability, soil moisture, and day length (Archibald & Scholes, 2007; Dye & Walker, 1987; Prins, 1988). Tree phenology is proposed to be influenced by temperature and day length (Archibald & Scholes, 2007; Chidumayo, 2001; Seghieri et al., 2012).
Figure 2. Differences in vegetation state between wet/growing (left) and dry (right) season for Dahra, Senegal as seen in phenopictures. Photos taken and modified by Niklas Boke-Olén.
Global carbon budget
The global carbon regulates the concentration of greenhouse gases such as carbon dioxide (CO2) in the atmosphere. Roughly 55% of the anthropogenic emissions from fossil fuel burning, industry, and land use change are taken up by the land and oceans (Figure 3). This implies that around 45% of the emissions stay in the atmosphere which will increase the atmospheric CO2 concentration and enhance the greenhouse effect. The long wave radiation emitted from earth is absorbed in the atmosphere by water vapor, CO2, nitrous oxide, methane, and industrial products like chlorofluorocarbon. The radiation is re-emitted in all directions and the part directed back to the earth surface is the phenomenon termed the greenhouse effect and can be seen as a blanket warming the earth. Without the greenhouse effect, the earth surface would be about 33 °C colder than it is today (Chapin III, Matson, & Vitousek, 2011).

20
Vegetation phenology affects the global carbon cycle by influencing the timing and length of vegetation growth. This plays a role in the global CO2 budget by affecting the ecosystem uptake (the land sink in Figure 3). The plants take up CO2 through the process of photosynthesis. Photosynthesis is a process in which the plant utilizes sunlight to convert carbon dioxide and water into oxygen and energy. The total amount of carbon uptake by photosynthesis is termed Gross Primary Production (GPP) and about 50% of the GPP are left in the plant after respiration. The remaining C that was taken up by plants is called Net Primary Production (NPP) and is the building material for the biosphere and provides us with for example wood and food. Hence a change in the timing of, for example, bud burst and leaf shedding will not only affect the global carbon cycle but also potentially the wood and food availability.
Figure 3. Global Carbon Dioxide budget. Average for year 2005-2014. Figure reproduced with permission from Global Carbon Project. Source: (Boden, Andres, & Marland, 2016; Dlugokencky & Tans, 2013; Le Quéré et al., 2015)

21
Climate change
According to the Fifth Assessment Report of the Intergovernmental Panel on Climate Change (IPCC) there is unequivocal evidence of ongoing climate change (Stocker et al., 2013). This is characterized by a global increase of temperature and modification of rainfall patterns. The carbon sequestration of savannahs are likely to decrease due to an increase of soil respiration following the temperature increase and rainfall changes (Fischlin et al., 2007). However, a possible increment in carbon stocks from an increase of woody cover due to a CO2 fertilization cannot be ruled out (Fischlin et al., 2007). Further, the size of the savannah aboveground carbon stocks is mainly dependent on disturbances. For example, the Australian savannahs are estimated to be a net carbon sink but the level of the sink is dependent on fire occurrences (R. J. Williams et al., 2004). For tropical areas studies have shown an indication of a potential future shift from forest to a savannah ecosystems due to climatic change (Anadon, Sala, & Maestre, 2014; Franchito, Rao, & Fernandez, 2012). Overall, the ecosystem functioning and species composition of savannahs are projected to be mostly affected by changes in temperature and precipitation for the temperate systems but also to CO2 fertilization, herbivores and fires in the tropical systems (Fischlin et al., 2007). Only a few studies have examined the multifactorial effect of the above mentioned factors. This indicates that further work is still needed to assess the effect of climate change on savannah ecosystems.
Measuring and Modelling the Environment
This thesis uses a combination of remote sensing, earth system models and site measure data to understand and model savannah ecosystems. Each method comes with its own advantages and assumptions but together they allow us to paint a more complete picture compared to using them separately.
Earth Observation
Remote sensing is the science of obtaining information about an object or area from a distance. This is typically done from active or passive sensors mounted on towers, drones, aircrafts, or satellites. An active sensor uses the reflection of an emitted signal, e.g. a laser-beam, to collect data. In contrast, a passive sensor records the natural energy that is reflected or emitted from an object or surface, most commonly reflected sunlight. Remote sensing is used in many fields and can be used to measure and estimate for example vegetation growth, soil moisture, land cover, or topography.

22
Satellite remotely sensed data is often recorded in pre-set spatial and temporal resolutions dependent on satellite and sensor properties. The spatial resolution defines the area that each measured value is representing, often referred to as a pixel or cell. Many pixels together form, for each temporal instant, a gridded representation of the surface which can be referred to as a raster (Figure 4). A raster of vegetation properties can be acquired by using the difference between the visible (red) and the near infrared wavelengths in the electromagnetic spectrum. This is because plant leaves strongly absorb visible light for use in photosynthesis but strongly reflecting the near infrared light. Such a representation is referred to as a vegetation index.
Figure 4. Observing the earth from space. An example of how a land area is divided into pixels/cells (squares) and how it together forms a raster surface, in this case for Africa. Graphics created by Niklas Boke-Olén.
An example of a vegetation index is the Normalized Difference Vegetation Index (NDVI) which is a spectral index of photosynthetic activity (Sellers, 1985). It ranges from -1 to 1 where a value close to zero indicates no vegetation and a value of close to +1 indicates the highest possible density of green leaves (Weier & Herring, 2011). Negative values of NDVI are associated with clouds or water. Remotely sensed NDVI can be used for observing vegetation phenology in regions which are lacking field data (Heumann, Seaquist, Eklundh, & Jonsson, 2007; Reed et al., 1994). By instead using

23
the microwave parts (1mm – 1m wavelength) of the electormagnetic spectrum it is possible to get an estimation of the soil moisture of the top soil layer (Wang & Qu, 2009). A good knowledge of large extent soil moisture can be useful for meteorological and agricultural applications but also for plant growth modelling (Boke-Olén et al., 2016).
Earth System Models
Dynamic global vegetation models (DGVMs) are processed based terrestrial ecosystem models created to simulate vegetation dynamics in response to climate variability. The Lund Potsdam Jena - General Ecosystem Simulator (LPJ-GUESS) is an example of a state of the art DGVM which is using a set of plant functional types (PFTs) each being represented by a set of parameters that control the influence of climate on growth and allocation of carbon (Smith, Prentice, & Sykes, 2001). PTFs can be described as the model’s representation of plant species groups. It could for example be a temperate broadleaved evergreen tree or a grass species. Each PFT is represented with its own parameters controlling how much it grows dependent on the climate.
DGVMs are normally used to simulate the potential natural vegetation by using a gridded representation of the entire world, or parts of it. Each grid cell is provided with its own climate data and soil information which is a representation of the average for the area which the grid cell covers. The output spatial resolution of the DGVMs is therefore dependent on its data input, meaning that if climate and soil data is provided in a higher resolution the result of the model runs will also be in the same higher resolution, up to a certain limit for which the model can still be considered valid. Each grid cell is simulated independently of others and there is therefore a direct tradeoff between spatial resolution and computing requirement.
Many of the processes within LPJ-GUESS are typically represented at a daily scale while others are performed at the annual scale. For example, the allocation of carbon between PFT compartments is done at the end of each simulation year while photosynthesis is usually modeled on a daily time scale.
Ecosystem-Scale Measurements
Ecosystem scale measurements are carried out to monitor the ecosystem properties at a specific site location and how they respond to changes in the environment (Tagesson et al., 2015). They typically consist of a micrometeorological tower measuring temperature, wind velocities and carbon fluxes. The carbon, water, and energy exchanges between the ecosystem and atmosphere are normally acquired using
24
the eddy covariance (EC) technique (D. Baldocchi, Falge, Gu, & Olson, 2001) which is a high frequency sampling technique. The site based measurements can also be expanded with precipitation, soil moisture and phenological measurements. The phenological measurements can be made using a PhenoCam.
The term “PhenoCam” was initially used to describe a regional-scale phenological camera network in the US (Richardson, Braswell, Hollinger, Jenkins, & Ollinger, 2009). It is now more used to describe any digital camera used to monitor vegetation on a regular interval. They can for example be mounted at a micrometeorological tower and directed towards a vegetated area with the purpose of taking pictures. The resulting pictures can be analyzed together with the ecosystem properties in order to create models or to analyze climatic controls on vegetation phenology. The pictures can also be used to separate tree and grass phenology (Moore et al., 2016) which can be incorporated into light use efficiency models to improve GPP estimations (Moore, Beringer, Evans, Hutley, & Tapper, 2017).
Aim and objectives
The objective of this thesis is to analyze the vegetation phenology of savannahs by combining methods and data from ecosystem modelling, remote sensing, and phenological site observations. This is done to gain a better understanding of the mechanisms controlling savannah leaf phenology and to increase our ability to correctly model it. The thesis can be divided into the following main aims:
I. Understanding and estimating savannah site scale phenology using in-situ data and remotely sensed NDVI.
II. Quantifying the controls of water stress in the savannah ecosystem. III. Using phenological pictures to understand and separate the savannah grass
and trees phenology and their relative importance for a remotely sensed vegetation index.
IV. Estimating savannah vegetation phenology for large areas and compare the usefulness of remotely sensed soil moisture products.
V. Introducing daily carbon allocation into the dynamic vegetation model LPJ-GUESS and use it to study the grazing potential of a savannah area.

25
Material & Methods
This thesis was centered on savannah vegetation phenology but combined data and methods from a range of different sources and fields. It used site scale flux measurements, PhenoCams, and environmental data in combination with large extent remotely sensed data and ecosystem models. The understanding and ability to model savannah vegetation phenology were improved by combining the different types of measurements and models, each with its own spatial and temporal domain.
Site scale savannah phenology was analyzed and estimated which resulted in a statistical phenological model. The model uses mean annual precipitation, soil moisture and day length to estimate NDVI which was used as a proxy for phenology. To investigate water stress the GPP was analyzed with both climatic and remotely sensed variables for a selection of African sites. The site scale analysis was further expanded by using phenopictures from which tree and grass phenology was separated.
To extend the analysis to a larger region, the developed statistical phenological model was used to evaluate four global remotely sensed soil moisture datasets and their usability in phenological studies for savannah regions. To improve the ability to model savannah vegetation on a large extent, a daily carbon allocation component for grasses was developed and added into the dynamic global vegetation model LPJ-GUESS. The addition allowed improved vegetation dynamics for the savannah regions and a more detailed study of livestock grazing with a potential regrowth on a daily scale which was not possible without the addition.
Ecosystem scale phenology
Statistical phenological model
The site scale phenology was analyzed using observation data from 15 sites2 as indicated in Figure 5 together with satellite remotely sensed NDVI from the MODerate Imaging Spectroradiometer (MODIS) (ORNL DAAC, 2011) with a 2 For more detailed site and method information see Paper I and references therein.

26
spatial resolution of 250 meters. MODIS is an instrument onboard the Terra and Aqua satellites which together are viewing the entire earth surface every one to two days. The sites were selected based on data availability and their aridity index (AI) which is the ratio between potential evapotranspiration (evaporation plus transpiration) and mean annual precipitation that can be used to classify the aridity of an area. Only sites classified as arid, semi-arid or dry sub-humid were included in the analysis.
Figure 5. Locations of the 15 sites used to study the vegetation phenology showed on top of the aridity index divided into five classes; Humid, Dry sub-Humid, Semi-Arid, Arid, and Hyper-Arid. Some of the sites are located too close to each other to be able to distinguish them in this map (especially for North America and Australia). For a complete list and description of the sites see paper I.
The aim was to create a common model that could estimate the phenology for all the sites. NDVI was in this case used as a proxy for phenology and modelled with the variables soil moisture, day length, and mean annual precipitation (MAP). Each variable was allowed to be time delayed to account for a previously shown potential lag between climatic events and vegetation activity (Schultz & Halpert, 1993; C. A. Williams, Hanan, Scholes, & Kutsch, 2009). Many different models were tested, from which the model with the best results for all sites was selected. The model was tested for its sensitivity to adding more sites by estimating the root mean squared error (RMSE) many times for increasing model sizes (number of sites). The test was done to ensure that the model was stable with respect to the incorporated sites and did not change substantially when adding more sites. The model was further validated using a cross validation hold-out method which is a method that divides the data into many training and evaluation subsets. Twelve of the sites were chosen randomly as training sites and the remaining three were used to evaluate the performance of the

27
trained model. The process was repeated 1000 times and the average root mean squared error and coefficient of determination (r2) were assumed to be representative for the overall model. RMSE is measure of the model error compared to observed values. It was calculated using the root of the average of the squared error. A lower RMSE indicates in this case a better model fit to observations. The coefficient of determination (r2) shows how much the proportion of the variance in the observed variable is explained by the model. It ranges from zero to one where a higher value is better, i.e. more variance explained.
Water stress controls on GPP
The analysis was further expanded for three of the African sites3 (Dahra, Senegal; Demokeya, Sudan; Wankama Fallow, Niger; Figure 6) located in the semi-arid area of Sahel4. For these sites the relationship between hydrology, remote sensing product and GPP was studied. GPP was for all three sites estimated from eddy covariance (EC) flux data and evaluated against plant available water (PAW), vapor pressure deficit (VPD), and antecedent precipitation index (API). PAW is the amount of water in the soil that the plants are able to extract and takes into account soil type, water content at field capacity and permanent wilting point. VPD is the difference between the moisture in the air and the amount of moisture in the air at saturation which is dependent on the temperature. VPD has a nearly linear relationship to the rate of evapotranspiration, which is the sum of evaporation and plant transpiration. API is used to characterize how the influence of previous rainfall affects GPP by using rainfall from up to 8 days before with a decay factor built in.
3 For more detailed site descriptions see Paper IV and references therein. 4 Sahel is a region that separates the Sahara desert from more arid regions in the south. It stretches from
the Atlantic Ocean in the west to the red sea in the east. For a more detailed description see paper III and especially Figure 1 within that paper.

28
Figure 6. Locations of PhenoCam sites (circle) and GPP water stress sites (stars). Kordofan region in Sudan is outlined with a solid black line. Background map is Normalized Difference Vegetation Index (NDVI) from GIMMS (Global Inventory Modeling and Mapping Studies) NDVI version 3 (Tucker et al., 2005) for August year 2000.
The analysis of EC GPP together with API, PAW, and VPD made it possible to identify the limitations of water stress on vegetation growth. However, to be able to link this to earth observation data these metrics were also evaluated against remotely sensed data from MODIS5. Both in-situ and remotely sensed variables were compared against EC GPP using ordinary least square regression from which statistical metrics were calculated and compared. Water stress controls on GPP were evaluated using the calculated statistical evaluation metrics. From this a multiple linear regression (MLR-GPP) model based on remotely sensed data was identified. Such a GPP model, that uses only remotely sensed data, is especially important for regions as Sahel where field data is very limited (Ardö, 2016).
Phenopictures
For two of the African sites (Dahra, Senegal and Demokeya, Sudan; Figure 6) the measured data were complemented with daily phenological observations from
5 For a complete description of the remotely sensed products and variables used see paper III.

29
PhenoCams (Wingscapes® TimeLapseCam 8.0). The PhenoCams were mounted on micrometeorological towers and in operation between July 2012 and July 2014 for Dahra and June 2013 to April 2015 for Demokeya. The images were checked for field of view (FOV) movements due to wind and other disturbances which introduced camera movements between the days. These shifts were corrected for by adjusting horizontal and vertical movement, making sure that a reference point had a constant location in all of the images. The FOV correction allowed regions to be chosen and analyzed for all images without a considerable amount of image movement influencing the result.
Two regions of interest (ROI) were for each site chosen, one covering a grass area and one covering a tree crown. The average green proportion (Gp) was for each ROI calculated. Gp is a measure of the greenness of the ROI that also take the total brightness into account (Richardson et al., 2009) and has been shown to be less affected by changes in illumination (Sonnentag et al., 2012). It is calculated using the red (R), green (G), and blue (B) channel of the images using equation 1 below.
= + + (Equation 1)
Gp was calculated for each image and for the tree and grass separately which created a time series of greenness. The time series of Gp for each site were evaluated with respect to the differences in tree and grass phenology. It was further compared to MODIS-NDVI in order to assess the relative contribution of grass and tree in the remotely sensed 250 x 250 m NDVI pixel location covering each of the sites. This was done comparing the time series of Gp together with MODIS-NDVI to estimate their relative performance. It was further expanded by calculating the coefficient of determination (r2) between MODIS-NDVI and Gp for grass and tree separately.
Coarse scale phenology
Remotely sensed soil moisture for estimating NDVI
The site scale analysis was extended by using the developed statistical phenological model for savannahs globally to evaluate the European Space Agency (ESA) Climate Change Initiative (CCI) soil moisture dataset and three of its included products with respect to their relative performance in estimating NDVI. This was done since there is

30
a potential for combing remotely sensed soil moisture with other products to extract enhanced land surface information (Njoku, Jackson, Lakshmi, Chan, & Nghiem, 2003) or to estimate missing NDVI data. Remotely sensed soil moisture has in contrast to remotely sensed NDVI the benefit of being unaffected by cloud cover due to the measurements being made in the microwave domain (Bartalis, Naeimi, Hasenauer, & Wagner, 2008; Njoku et al., 2003). There exists therefore a potential to combine remotely sensed soil moisture with other products to extract enhanced land surface information (Njoku et al., 2003) or to estimate missing data.
CCI soil moisture combines data from four active and two passive satellite sensors to create a long term merged dataset (Liu et al., 2012). The three evaluated products included in the CCI datasets were from the advanced scatterometer (ASCAT) on board METOP (Naeimi, Scipal, Bartalis, Hasenauer, & Wagner, 2009; Wagner, Lemoine, & Rott, 1999), Land Parameter Retrieval Model-Advanced Microwave Scanning Radiometer-Earth Observing System (AMSRE) (Owe, de Jeu, & Holmes, 2008), and Soil Moisture and Ocean Salinity (SMOS)6 (Kerr et al., 2010). To convert the datasets into NDVI, the statistical time phenology model was used, which required soil moisture, long term mean annual precipitation (MAP), and day length. MAP was derived from a global climate dataset (Weedon et al., 2014) and day length were calculated from latitude and date. Only savannahs according to their land cover classification, from MODIS, were considered and the NDVI modelled from soil moisture were evaluated against MODIS-NDVI. The correlation (r) was used as the evaluation measure since it allowed an evaluation of the temporal dynamics which is important in vegetation phenology studies. Correlation is the measure of the linear relationship between two variables. It ranges between -1 and +1 where -1 indicates a perfect negative relationship and +1 indicates a perfect positive relationship.
Daily carbon allocation in LPJ-GUESS
To improve our ability to model global savannah vegetation and its impact on the carbon cycle and local grazing potential, the DGVM LPJ-GUESS was updated. The update was an improved representation of how the grass was modelled by including a daily carbon allocation routine. The routine was based on the model developed by theory from Johnson and Thornley (1983)7. It was calibrated using measured Net Ecosystem Exchange (NEE) from one Australian grassland site and validated using a site located in the study region and remotely sensed NDVI for the area. The addition allowed us to allocate the carbon from photosynthesis into leaf and root on a daily
6 See paper II and references therein for a detailed description of the remotely sensed soil moisture
dataset used. 7 See paper III for details regarding the implemented daily carbon allocation for grass PFTs

31
scale. This differs from the previous implementation in which the carbon was allocated to leaf and roots with an annual time step. The change also allowed the model to include a more detailed representation of livestock grazing potentials since it can simulate a grass regrowth on a daily scale.
The grazing potential was estimated between 1995 and 2005 for the Kordofan region (North and South Kordofan), in Sudan (Figure 6). The area is approximately 380 000 km2 with mostly rural inhabitants (63%) and pastoralists (24%) and is a region which depends on the high livestock population (El Tahir, Mohammed Fadl, & Fadlalmula, 2010). The modelled grazing potential was compared against reported livestock Tropical Livestock Units (TLU) information for 2005 from the Food and Agricultural Organization (FAO) to identify regions which overused the grazing resources or can handle increased grazing. TLU was used as the livestock unit measurement because official estimates of livestock numbers roughly correspond to surveyed livestock biomass consumption when different species are converted to their TLU equivalent (Behnke & Osman, 2012). One unit of TLU represents the grazing demand for one camel, or 0.7 cattle, or 0.1 sheep.

32

33
Result and Discussion
Ecosystem scale phenology
Statistical phenological model
The development of the statistical phenological model showed that two time steps (16 days) delayed day length (dayL) and soil moisture (sm) together with MAP were the most important variables for estimating savannah vegetation phenology. The 16 days delay means that the soil moisture and day length from 16 days before was used to estimate the current state of NDVI as described by the final model equation below.
= 0.12 ∙ ∙ + 0.01 ∙ + 0.22 (Equation 2)
The found result indicates that the average vegetation response to an increase or decrease in soil moisture was 16 days across the 15 sites used for model estimation. The cross validation of the model gave an average RMSE of 0.10 ± 0.02 and an average r2 of 0.60 ± 0.18. However, when evaluated at the site scale some of the sites (Nylvsley, Mongu, Skukuza, and Bira) were standing out with a lower performance (higher RMSE) compared to the others (Figure 7). The reason for that was attributed to site specific differences which the simplified approach could not include. This could for example be soil type, which previously has been shown to have an effect on the relationship between NDVI and soil moisture (Farrar, Nicholson, & Lare, 1994). However, the RMSE of the model did not increase when increasing the number of sites above seven. This indicates that the cross validated result will be a representative average when applying the model to a new savannah site or region.

34
Figure 7. Statistical phenological model evaluation for each site separately. Bars showing the root mean squared error (RMSE) between model and MODIS-NDVI. The dashed line shows the average value for all sites.
Water stress controls on GPP
The analysis of water stress control on GPP showed that a combination of PAW and VPD explained the largest variation across all three studied African sites. However, VPD and PAW influenced different parts of the season. The growth phase was started by a quick decrease in VPD after the onset of the rain which was followed by an expected increase in PAW. The maximum rate of growth (EC GPP) was occurring when PAW was above 50 mm and VPD below roughly 2 kPa which is in line with previous studies (Merbold et al., 2009; Tagesson et al., 2016; Zhao & Ji, 2016). At the end of the growing season, PAW was declining and VPD was increasing which affects the photosynthetic activity by causing stomatal closure to prevent a moisture loss. The variance explained by PAW and VPD was highest when data from both the dry and growing seasons were included. This was attributed to a potential effect of the dry season conditions on the subsequent growing season. It has for example been shown that increased rainfall has less impact on growth compared to the intensity and duration of the dry season (Murray‐Tortarolo et al., 2016).
For the remotely sensed product it was found that between 88% and 96% of the variance in EC GPP could be explained by a multiple linear regression GPP (MLR-GPP) model consisting of the enhanced vegetation index (EVI), land surface temperature (LST), and spectral band 7 (2105 – 2155 nm). In this case EVI is a
NalohouDalyDemokeyaMaunTonziVairaMalopeniLas MajadasDahraWankamaDry RiverBiraSkukuzaMonguNylsvley
0 0.05 0.1 0.15 0.2RMSE

35
proxy for the photosynthetic activity, band 7 a proxy for soil moisture and LST is linked to VPD. The concept of modelling GPP in water limited systems is nothing new. For example, Sjöström et al. (2011) found that the ability to model GPP for seven African sites improved by using a combination of flux tower evaporative fraction, EVI and photosynthetically active radiation (PAR). Further, Ma et al. (2014) were able to explain 88% of the variability in GPP using EVI, soil moisture, and top of atmosphere PAR. However, in contrast to the MLR-GPP model, none of these studies used only earth observation data which makes estimates for larger areas impossible. The presented MLR-GPP estimation used only remotely sensed data and can be used to make estimations for larger areas and a longer temporal domain for which remotely sensed data is available.
Phenopictures
Due to the mixture of tree and grass in savannahs a satellite base vegetation index, such as MODIS-NDVI, cannot sufficiently be used to predict phenological metrics such as leaf onset and offset (Archibald & Scholes, 2007). This is since the NDVI signal recorded for 250x250 m by the satellite consists of a combination of trees and grass. There is therefore a need to develop methods that can separate the NDVI signal into the relative contributions of tree and grass.
The MODIS-NDVI signal was dominated for both of the studied sites by the grass green proportion (Gp) (Figure 8 and Figure 9) showing a higher r2 compared to the tree Gp. For Demokeya the r2 was 0.75 and 0.52 for grass and trees respectively. The result was similar for Dahra with tree r2 = 0.76 and grass r2 = 0.54. The higher correlation between grass Gp and NDVI was attributed to the relative low tree canopy cover at the two sites, estimated to 6% for Dahra and 12% for Demokeya8. For both the sites the phenology of the trees and grass differed by having different timings for the onset of growth. The trees were developing their leaves before grass and kept their green material longer which was visible in the Gp signals (further shown in the example pictures included in Figure 8 and Figure 9). The difference in phenological strategy between the grass and trees are attributed to that the trees are able to sustain a longer photosynthetic activity because they can access deeper soil water (D. D. Baldocchi, Xu, & Kiang, 2004).
8 Tree canopy cover as estimated in paper I.

36
Figure 8. Result of PhenoCam analysis in Demokeya, Sudan (lat=13.28 lon=30.48). Top figure shows normalized (between 0 and 1) tree and grass greenness proportion (Gp) together with normalized MODIS-NDVI covering the site location.
The advantage of using Gp is that the phenological signal for the trees and grass can be separated relatively easily using field mounted PhenoCams from which the tree and grass phenology can be studied separately. The separation of tree and grass phenology has been shown to positively influence the result of a GPP light use efficiency model for Australian savannahs (Moore et al., 2017) which further highlights the potential use to separate the NDVI signal. Previous work included environmental cues for a South African savannah to identify the leaf green up for trees and grass separately.

37
Figure 9. Result of PhenoCam analysis in Dahra, Senegal (lat=15.40 lon=-15.43). Top figure shows normalized (between 0 and 1) tree and grass greenness proportion (Gp) together with normalized MODIS-NDVI covering the site location.
Coarse scale phenology
Remotely sensed soil moisture to estimate NDVI
The statistical phenological model (equation 2) was used to convert the four remotely sensed soil moisture datasets to NDVI. NDVI modelled with the combined remotely sensed soil moisture product gave a higher correlation to MODIS-NDVI compared to its included products. It gave the highest average correlation of 0.81 when compared to MODIS-NDVI. It was further estimated to be the best dataset in 64% of the tested pixels (Figure 10) and the performance only decreased slightly (correlation decreased with 0.01) when using CCI compared to using the best dataset per pixel (Figure 10). These results are promising since CCI has a long temporal

38
extent (1978 to 2014), which will allow for a greater use than one of the single products.
The advantage of converting the remotely sensed soil moisture into NDVI is that it can be directly comparable to MODIS-NDVI and there is a potential to combine to two products. There are many studies dedicated to combining of remotely sensed data from different sources to enhance spatial and temporal resolution (Hansen et al., 2008; Meng, Du, & Wu, 2013). The results shows that there could be a potential to combine the CCI modelled NDVI with other remotely sensed datasets to enhance phenological information by offering additional information from a dataset not sensitive to cloud cover.
Figure 10. Best remoteley sensed soil moisture dataset map. Best dataset identified as the one with the highest correlation between modelled NDVI and MODIS-NDVI. All NA class (grey) indicates missing data in all datasets, no significant correlation to NDVI, or correlation below 0.5 in all datasets. Data has for visual purposes been filtered with a 3x3 modal filter. Figure adapted from paper III.
Daily carbon allocation in LPJ-GUESS
The estimated grazing potential for the Kordofan area, Sudan, was approximately 133% higher than the reported feed requirement (Figure 11). From this a spatial mismatch between the reported carbon demand and modelled grazing potential was found for the area. The spatial mismatch indicated a positive difference for latitudinal band 13 – 15 °N and a negative difference for the 9.5 - 12 °N band (Figure 11). This indicated a potential migration potential in the area in the form of a potential re-location of herds. However, such a potential might only exist in the modelling framework since it can be highly problematic to attain in reality due to land

39
ownership, cultural problems, distance to water supply, or infrastructure. The result can still be valuable since it provides decision makers or land owners with information about which areas that have the vegetative potential for an increased grazing.
Figure 11. Difference between modelled grazing potentials and Tropical livestock units (TLU) reported grazing demand for Korodfan region, Sudan. Positive values indicate a higher grazing potential compared to the reported grazing demand. Figure adapted from paper IV.

40

41
Conclusion
This thesis has investigated the savannah ecosystem from different aspects and the main conclusions linked to the main aims are;
I. Global savannah vegetation phenology can be estimated from soil moisture, mean annual precipitation and day length.
II. The GPP of three savannah sites can be sufficiently estimated from PAW and VPD. Those products can be substituted with the remotely sensed products; EVI, LST and MODIS band 7.
III. Phenopictures shows potential to be useful for estimating and separating vegetation phenology of savannah tree and grass.
IV. The merged remotely sensed soil moisture dataset from ESA shows a better capability to model savannah NDVI compared to using one of its included soil moisture datasets.
V. The inclusion of daily carbon allocation for grasses into the DVM LPJ-GUESS improved the model capabilities by allowing a more detailed estimation of grazing potentials for savannah areas.
Main findings
This thesis has shown that water availability is one of the main controlling factors for the savannah ecosystem. This is since soil moisture was identified as an important model variable for the statistical phenological model and plant available water was identified as the main controlling variable (together with VPD) of EC-GPP. Because of this, it was important to investigate the suitability of using remotely sensed soil moisture for savannah regions to estimate NDVI. It was found that the merged CCI soil moisture from ESA was the most suitable remotely sensed soil moisture dataset for savannahs. It was further found that phenopictures can be useful to estimate and separate the vegetation phenology of trees and grass. Finally, the inclusion of daily carbon allocation for grasses into LPJ-GUESS showed a great potential in estimating the grazing potentials of the savannah environment. The results increased our understanding and ability to model savannah vegetation phenology. However, further

42
work is still needed to assess the potential effect of climate change on the savannah ecosystem.

43
Outlook
This thesis has studied savannahs from different perspectives using a combination of earth observation, models and site measured data. The acquired knowledge and tools can be used for further research of the savannah ecosystem.
This could for example be related to the vegetative possibility to provide a value to the population living in the areas in form of food, feed, or firewood. There exists studies which relate NPP to food, feed, and firewood (Abdi, Seaquist, Tenenbaum, Eklundh, & Ardö, 2014; Sallaba et al., 2016). However, the daily carbon allocation addition to LPJ-GUESS, developed in the framework of this thesis, allows this to be studied in more detail and to make future predictions. By combining it with the already existing LPJ-GUESS crop model a detailed representation of the climate driven food supply can be estimated for current and future conditions. A step further can be taken by combining that information with food demand functions (Abdi et al., 2014) and gridded population datasets (Boke-Olén, Abdi, Hall, & Lehsten, 2017) which will allow analyses between food supply and food demand. It also opens up for a range of research questions in which the model can be used to predict future vegetation conditions but still account for disturbances or changes to the grass on a daily temporal scale.
It has further been shown within this thesis that PhenoCams can be used to separate grass and tree phenology at the ecosystem scale. Therefore, there exists a potential to use that information to develop methods that can be used to separate the relative contribution of tree and grass in a remotely sensed vegetation index. The information from the PhenoCams could potentially be used to analyze the different mechanisms controlling savannah tree and grass phenology. For this a more detailed study is needed.

44

45
Acknowledgement
First of all I would like to express my gratitude to my supervisor Veiko Lehsten. I have been very fortunate to have a supervisor with a great expertise but also with many great ideas and suggestions. I have also appreciated that the door has always been open for me and that you always have a few minutes over to discuss. Your great appreciation and motivation for science has inspired me. I also want to thank my other supervisors, Jonas Ardö, Lars Eklundh and Thomas Holst. I have really enjoyed and learned a lot from the supervisor meetings we have had and I am grateful for your input and help to my PhD project.
I am also very grateful to have been a part Physical Geography and Ecosystem Science department. It has been a wonderful workplace with many happy working hours with great colleagues. A warm thanks to all my PhD-student colleagues for making my time at the department joyful. Florian, you have been a great colleague and are a great friend. I have really enjoyed our tennis matches; it will not be long until you beat me with ease. Jan, I am so happy that I got to know you, you are a great friend and you will forever be my color guru, may the viridis always be with you. Hakim, you are an inspiration and a great college and friend. I am happy for all the work we shared and for the scientific and none scientific discussions. Wille, Bala, Zhengdong, Julie, Geert; you have all been the best office mates I could ask for. I remember the occasions when we were all at our desks with joy. Ylva, thank you for always being so positive and joyful, it has been a pleasure co-sharing the R3I leadership with you.
A big thanks goes out to all my co-authors and collaborators. It has been great to work with all of you. I am also happy that I got the opportunity to take part in the Senegal field trip and I would like to give my warmest thanks to everyone involved.
A special thanks to my parents Kia and Anders for all your support and encouragement. It means a lot. Also a special thanks to my brother Martin and his sambo Klara for all the nice times we have had together and for showing us the real Copenhagen. I am also happy for being surrounded by a big, warm and caring extended family. It is great to share so many of my interests with all of you. I know that I would not have been as effective with my PhD-studies without all the game evenings, golf days, and skiing trips, so thank you all for that.
Last but not least, an enormous thanks to my wife Sara, your support and love has been invaluable. You have been my biggest supporter and for that I will always be

46
grateful. The positive, smart and kind ways you are handling life with has been a great inspiration from which I have learned a lot. I am so happy that we now also have a son together. Erik, so great to get to know you and that you came into the world to experience my PhD-defense. 2017 is truly a great year.

47
References
Abdi, A. M., Seaquist, J., Tenenbaum, D. E., Eklundh, L., & Ardö, J. (2014). The supply and demand of net primary production in the Sahel. Environmental Research Letters, 9(9), 094003.
Anadon, J. D., Sala, O. E., & Maestre, F. T. (2014). Climate change will increase savannas at the expense of forests and treeless vegetation in tropical and subtropical Americas. Journal of Ecology, 102(6), 1363-1373.
Archibald, S., & Scholes, R. J. (2007). Leaf green-up in a semi-arid African savanna - separating tree and grass responses to environmental cues. Journal of Vegetation Science, 18(4), 583-594. doi:10.1111/j.1654-1103.2007.tb02572.x
Ardö, J. (2016). Increasing the Confidence of African Carbon Cycle Assessments. Paper presented at the EGU General Assembly Conference Abstracts.
Armah, F., Odoi, J., Yengoh, G., Obiri, S., Yawson, D., & Afrifa, E. A. (2011). Food security and climate change in drought-sensitive savanna zones of Ghana. Mitigation and Adaptation Strategies for Global Change, 16(3), 291-306. doi:10.1007/s11027-010-9263-9
Baldocchi, D., Falge, E., Gu, L., & Olson, R. (2001). FLUXNET: A new tool to study the temporal and spatial variability of ecosystem-scale carbon dioxide, water vapor, and energy flux densities. Bulletin of the American Meteorological Society, 82(11), 2415.
Baldocchi, D. D., Xu, L., & Kiang, N. (2004). How plant functional-type, weather, seasonal drought, and soil physical properties alter water and energy fluxes of an oak–grass savanna and an annual grassland. Agricultural and Forest Meteorology, 123(1), 13-39.
Bartalis, Z., Naeimi, V., Hasenauer, S., & Wagner, W. (2008). ASCAT soil moisture product handbook. ASCAT Soil Moisture Rep. Ser, 15.
Behnke, R., & Osman, H. M. (2012). The contribution of livestock to the Sudanese economy.
Beringer, J., Hacker, J., Hutley, L. B., Leuning, R., Arndt, S. K., Amiri, R., . . . Hensley, C. (2011). SPECIAL—Savanna Patterns of Energy and Carbon Integrated across the Landscape. Bulletin of the American Meteorological Society, 92(11), 1467.
Boden, T., Andres, B., & Marland, G. (2016). Global CO2 Emissions from Fossil-Fuel Burning, Cement Manufacture, and Gas Flaring: 1751-2013. Retrieved from http://cdiac.ornl.gov/ftp/ndp030/global.1751_2013.ems
Boke-Olén, N., Abdi, A. M., Hall, O., & Lehsten, V. (2017). High-resolution African population projections from radiative forcing and socio-economic

48
models, 2000 to 2100. Scientific Data, 4, 160130. doi:10.1038/sdata.2016.130
Boke-Olén, N., Lehsten, V., Ardö, J., Beringer, J., Eklundh, L., Holst, T., . . . Tagesson, T. (2016). Estimating and analyzing savannah phenology with a lagged time series model. Plos One, 11(4), e0154615.
Bond, W. J., Woodward, F. I., & Midgley, G. F. (2005). The global distribution of ecosystems in a world without fire. New Phytologist, 165(2), 525-538.
Bourlière, F. (Ed.) (1983). Ecosystems of the world 13: tropical savannas. Chapin III, F. S., Matson, P. A., & Vitousek, P. (2011). Principles of terrestrial
ecosystem ecology: Springer Science & Business Media. Chidumayo, E. N. (2001). Climate and phenology of savanna vegetation in southern
Africa. Journal of Vegetation Science, 12(3), 347-354. doi:10.2307/3236848 Dlugokencky, E., & Tans, P. (2013). NOAA/ESRL
(www.esrl.noaa.gov/gmd/ccgg/trends/). Dye, P. J., & Walker, B. H. (1987). Patterns of shoot growth in a semiarid grassland
in Zimbabwe. Journal of Applied Ecology, 24(2), 633-644. doi:10.2307/2403898
El Tahir, B. A., Mohammed Fadl, K. E., & Fadlalmula, A. G. D. (2010). Forest biodiversity in Kordofan Region, Sudan: Effects of climate change, pests, disease and human activity. Biodiversity, 11(3-4), 34-44.
Farrar, T. J., Nicholson, S. E., & Lare, A. R. (1994). The influence of soil type on the relationships between NDVI, rainfall, and soil moisture in semiarid Botswana. II. NDVI response to soil oisture. Remote Sensing of Environment, 50(2), 121-133. doi:10.1016/0034-4257(94)90039-6
Fischlin, A., Midgley, G., Price, J., Leemans, R., Gopal, B., Turley, C., . . . Velichko, A. (2007). Ecosystems, their properties, goods, and services. In ‘Climate change 2007: impacts, adaptation and vulnerability’.(Eds ML Parry, OF Canziani, JP Palutikof, PJ van der Linden, CE Hanson) pp. 211–272: Cambridge University Press: Cambridge, UK.
Franchito, S. H., Rao, V. B., & Fernandez, J. P. R. (2012). Tropical land savannization: impact of global warming. Theoretical and Applied Climatology, 109(1-2), 73-79.
Freckleton, R. P. (2004). The problems of prediction and scale in applied ecology: the example of fire as a management tool. Journal of Applied Ecology, 41(4), 599-603.
Grace, J., San Jose, J., Meir, P., Miranda, H. S., & Montes, R. A. (2006). Productivity and carbon fluxes of tropical savannas. Journal of Biogeography, 33(3), 387-400.
Heumann, B. W., Seaquist, J. W., Eklundh, L., & Jonsson, P. (2007). AVHRR derived phenological change in the Sahel and Soudan, Africa, 1982-2005. Remote Sensing of Environment, 108(4), 385-392. doi:10.1016/j.rse.2006.11.025
Johnson, I. R., & Thornley, J. H. M. (1983). Vegetative crop growth model incorporating leaf area expansion and senescence, and applied to grass. Plant Cell and Environment, 6(9), 721-729. doi:10.1111/1365-3040.ep11589349
49
Kerr, Y. H., Waldteufel, P., Wigneron, J.-P., Delwart, S., Cabot, F., Boutin, J., . . . Gruhier, C. (2010). The SMOS mission: New tool for monitoring key elements ofthe global water cycle. Proceedings of the IEEE, 98(5), 666-687.
Le Quéré, C., Moriarty, R., Andrew, R. M., Canadell, J. G., Sitch, S., Korsbakken, J. I., . . . Zeng, N. (2015). Global Carbon Budget 2015. Earth Syst. Sci. Data, 7(2), 349-396. doi:10.5194/essd-7-349-2015
Liu, Y. Y., Dorigo, W. A., Parinussa, R. M., de Jeu, R. A. M., Wagner, W., McCabe, M. F., . . . van Dijk, A. (2012). Trend-preserving blending of passive and active microwave soil moisture retrievals. Remote Sensing of Environment, 123, 280-297. doi:10.1016/j.rse.2012.03.014
Ma, X., Huete, A., Yu, Q., Restrepo-Coupe, N., Beringer, J., Hutley, L. B., . . . Eamus, D. (2014). Parameterization of an ecosystem light-use-efficiency model for predicting savanna GPP using MODIS EVI. Remote Sensing of Environment, 154, 253-271.
McIntosh, C. (2013). Cambridge advanced learner’s dictionary. Cambridge: Cambridge University Press.
Merbold, L., Ardo, J., Arneth, A., Scholes, R. J., Nouvellon, Y., de Grandcourt, A., . . . Kutsch, W. L. (2009). Precipitation as driver of carbon fluxes in 11 African ecosystems. Biogeosciences, 6(6), 1027-1041.
Moore, C. E., Beringer, J., Evans, B., Hutley, L. B., & Tapper, N. J. (2017). Tree–grass phenology information improves light use efficiency modelling of gross primary productivity for an Australian tropical savanna. Biogeosciences, 14(1), 111-129. doi:10.5194/bg-14-111-2017
Moore, C. E., Brown, T., Keenan, T. F., Duursma, R. A., van Dijk, A. I. J. M., Beringer, J., . . . Liddell, M. J. (2016). Reviews and syntheses: Australian vegetation phenology: new insights from satellite remote sensing and digital repeat photography. Biogeosciences, 13(17), 5085-5102. doi:10.5194/bg-13-5085-2016
Murray‐Tortarolo, G., Friedlingstein, P., Sitch, S., Seneviratne, S. I., Fletcher, I., Mueller, B., . . . Ahlström, A. (2016). The dry season intensity as a key driver of NPP trends. Geophysical Research Letters, 43(6), 2632-2639.
Myneni, R. B., Keeling, C. D., Tucker, C. J., Asrar, G., & Nemani, R. R. (1997). Increased plant growth in the northern high latitudes from 1981 to 1991. Nature, 386(6626), 698-702. doi:10.1038/386698a0
Naeimi, V., Scipal, K., Bartalis, Z., Hasenauer, S., & Wagner, W. (2009). An improved soil moisture retrieval algorithm for ERS and METOP scatterometer observations. Geoscience and Remote Sensing, IEEE Transactions on, 47(7), 1999-2013.
Njoku, E. G., Jackson, T. J., Lakshmi, V., Chan, T. K., & Nghiem, S. V. (2003). Soil moisture retrieval from AMSR-E. Geoscience and Remote Sensing, IEEE Transactions on, 41(2), 215-229.
Olson, D. M., Dinerstein, E., Wikramanayake, E. D., Burgess, N. D., Powell, G. V., Underwood, E. C., . . . Morrison, J. C. (2001). Terrestrial Ecoregions of the World: A New Map of Life on Earth A new global map of terrestrial

50
ecoregions provides an innovative tool for conserving biodiversity. BioScience, 51(11), 933-938.
ORNL DAAC, O. R. N. L. D. A. A. C. (2011). MODIS subsetted land products, Collection 5.
Owe, M., de Jeu, R., & Holmes, T. (2008). Multisensor historical climatology of satellite-derived global land surface moisture. Journal of Geophysical Research-Earth Surface, 113(F1). doi:10.1029/2007jf000769
Prins, H. (1988). Plant phenology patterns in Lake Manyara National Park, Tanzania. Journal of Biogeography, 15(3), 465-480.
Puppi, G. (2007). Origin and development of phenology as a science. Ital J Agrometeorol, 3, 24-29.
Reed, B. C., Brown, J. F., VanderZee, D., Loveland, T. R., Merchant, J. W., & Ohlen, D. O. (1994). Measuring phenological variability from satellite imagery. Journal of Vegetation Science, 5(5), 703-714.
Richardson, A. D., Braswell, B. H., Hollinger, D. Y., Jenkins, J. P., & Ollinger, S. V. (2009). Near-surface remote sensing of spatial and temporal variation in canopy phenology. Ecological Applications, 19(6), 1417-1428. doi:10.1890/08-2022.1
Sallaba, F., Olin, S., Engström, K., Abdi, A. M., Boke-Olén, N., Lehsten, V., . . . Seaquist, J. W. (2016). Future supply and demand of net primary production in the Sahel. Earth Syst. Dynam. Discuss., 2016, 1-41. doi:10.5194/esd-2016-58
Sankaran, M., Hanan, N. P., Scholes, R. J., Ratnam, J., Augustine, D. J., Cade, B. S., . . . Ludwig, F. (2005). Determinants of woody cover in African savannas. Nature, 438(7069), 846-849.
Scholes, R., & Archer, S. (1997). Tree-grass interactions in savannas. Annual Review of Ecology and Systematics, 517-544.
Schultz, P. A., & Halpert, M. S. (1993). Global correlation of temperature, NDVI and precipitation. Advances in Space Research, 13(5), 277-280. doi:10.1016/0273-1177(93)90559-T
Scurlock, J. M. O., & Hall, D. O. (1998). The global carbon sink: a grassland perspective. Global Change Biology, 4(2), 229-233. doi:10.1046/j.1365-2486.1998.00151.x
Seghieri, J., Carreau, J., Boulain, N., De Rosnay, P., Arjounin, M., & Timouk, F. (2012). Is water availability really the main environmental factor controlling the phenology of woody vegetation in the central Sahel? Plant Ecology, 213(5), 861-870. doi:10.1007/s11258-012-0048-y
Sellers, P. J. (1985). Canopy reflectance, photosynthesis and transpiration. International Journal of Remote Sensing, 6(8), 1335-1372.
Sjöström, M., Ardö, J., Arneth, A., Boulain, N., Cappelaere, B., Eklundh, L., . . . Nouvellon, Y. (2011). Exploring the potential of MODIS EVI for modeling gross primary production across African ecosystems. Remote Sensing of Environment, 115(4), 1081-1089.
Smith, B., Prentice, I. C., & Sykes, M. T. (2001). Representation of vegetation dynamics in the modelling of terrestrial ecosystems: comparing two

51
contrasting approaches within European climate space. Global Ecology and Biogeography, 10(6), 621-637. doi:10.1046/j.1466-822X.2001.t01-1-00256.x
Sonnentag, O., Hufkens, K., Teshera-Sterne, C., Young, A. M., Friedl, M., Braswell, B. H., . . . Richardson, A. D. (2012). Digital repeat photography for phenological research in forest ecosystems. Agricultural and Forest Meteorology, 152, 159-177. doi:10.1016/j.agrformet.2011.09.009
Stocker, T., Qin, D., Plattner, G., Tignor, M., Allen, S., Boschung, J., . . . Midgley, P. (2013). IPCC, 2013: summary for policymakers in climate change 2013: the physical science basis, contribution of working group I to the fifth assessment report of the intergovernmental panel on climate change.
Tagesson, T., Fensholt, R., Cappelaere, B., Mougin, E., Horion, S., Kergoat, L., . . . Demarty, J. (2016). Spatiotemporal variability in carbon exchange fluxes across the Sahel. Agricultural and Forest Meteorology, 226, 108-118.
Tagesson, T., Fensholt, R., Guiro, I., Rasmussen, M. O., Huber, S., Mbow, C., . . . Ardö, J. (2015). Ecosystem properties of semiarid savanna grassland in West Africa and its relationship with environmental variability. Global Change Biology, 21(1), 250-264. doi:10.1111/gcb.12734
Thornton, P., Boone, R., Galvin, K., BurnSilver, S., Waithaka, M., Kuyiah, J., . . . Herrero, M. (2007). Coping Strategies in Livestock-dependent Households in East and Southern Africa: A Synthesis of Four Case Studies. Human Ecology, 35(4), 461-476. doi:10.1007/s10745-007-9118-5
Tucker, C. J., Pinzon, J. E., Brown, M. E., Slayback, D. A., Pak, E. W., Mahoney, R., . . . El Saleous, N. (2005). An extended AVHRR 8‐km NDVI dataset compatible with MODIS and SPOT vegetation NDVI data. International Journal of Remote Sensing, 26(20), 4485-4498.
Wagner, W., Lemoine, G., & Rott, H. (1999). A method for estimating soil moisture from ERS scatterometer and soil data. Remote Sensing of Environment, 70(2), 191-207.
Wang, L., & Qu, J. J. (2009). Satellite remote sensing applications for surface soil moisture monitoring: A review. Frontiers of Earth Science in China, 3(2), 237-247. doi:10.1007/s11707-009-0023-7
Weedon, G. P., Balsamo, G., Bellouin, N., Gomes, S., Best, M. J., & Viterbo, P. (2014). The WFDEI meteorological forcing data set: WATCH Forcing Data methodology applied to ERA‐Interim reanalysis data. Water Resources Research, 50(9), 7505-7514.
Weier, J., & Herring, D. (2011). Measuring vegetation (ndvi & evi). NASA online publication.
Williams, C. A., Hanan, N., Scholes, R. J., & Kutsch, W. (2009). Complexity in water and carbon dioxide fluxes following rain pulses in an African savanna. Oecologia, 161(3), 469-480. doi:10.1007/s00442-009-1405-y
Williams, R. J., Hutley, L. B., Cook, G. D., Russell-Smith, J., Edwards, A., & Chen, X. (2004). Viewpoint: Assessing the carbon sequestration potential of mesic savannas in the Northern Territory, Australia: approaches, uncertainties and

52
potential impacts of fire. Functional Plant Biology, 31(5), 415-422. doi:10.1071/FP03215
Zhao, W., & Ji, X. (2016). Spatio-temporal variation in transpiration responses of maize plants to vapor pressure deficit under an arid climatic condition. Journal of Arid Land, 8(3), 409-421.