Global roadshow report 2012 merrill lynch
12
ALSO INSIDE: Top broker rankings – global and regional lists Global Roadshow Report 2012 Sponsored by Bank of America Merrill Lynch Independent research from IR Magazine CITY STATUS NEW YORK Most visited LONDON Favorite city HONG KONG Longest stay AMSTERDAM New stop-off
Transcript of Global roadshow report 2012 merrill lynch
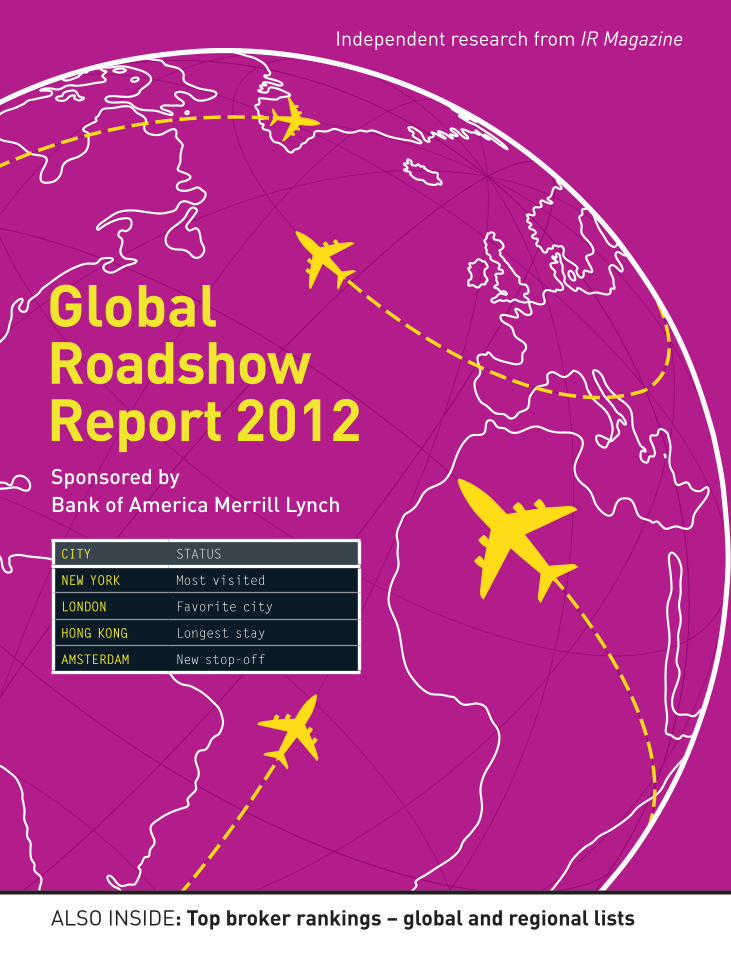
Also inside: Top broker rankings – global and regional lists
Global Roadshow Report 2012Sponsored by Bank of America Merrill Lynch
independent research from IR Magazine
CITY STATUS
NEW YORK Most visited
LONDON Favorite city
HONG KONG Longest stay
AMSTERDAM New stop-off
2
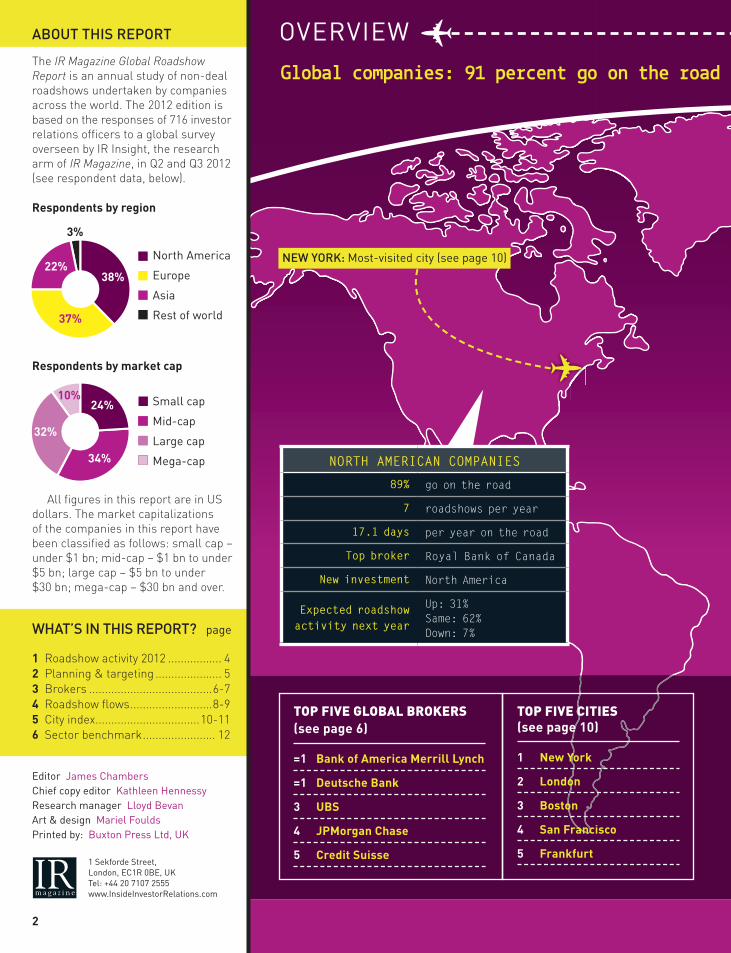
All fi gures in this report are in US dollars. The market capitalizations of the companies in this report have been classifi ed as follows: small cap – under $1 bn; mid-cap – $1 bn to under $5 bn; large cap – $5 bn to under $30 bn; mega-cap – $30 bn and over.
WHAT’S IN THIS REPORT? page
1 Roadshow activity 2012 ................. 42 Planning & targeting ..................... 53 Brokers .......................................6-74 Roadshow fl ows ..........................8-95 City index .................................10-116 Sector benchmark ....................... 12
editor James ChambersChief copy editor Kathleen HennessyResearch manager lloyd BevanArt & design Mariel FouldsPrinted by: Buxton Press ltd, UK
1 sekforde street, london, eC1R 0Be, UKTel: +44 20 7107 2555www.insideinvestorRelations.com
38%
24%
32%
10%
34%
22%
3%
37%
Respondents by region
Respondents by market cap
Small cap
Mid-cap
Large cap
Mega-cap
North America
Europe
Asia
Rest of world
ABOUT THIS REPORT
The IR Magazine Global Roadshow Report is an annual study of non-deal roadshows undertaken by companies across the world. The 2012 edition is based on the responses of 716 investor relations offi cers to a global survey overseen by IR Insight, the research arm of IR Magazine, in Q2 and Q3 2012 (see respondent data, below).
TOP FIVE GLOBAL BROKERS (see page 6)
=1 Bank of America Merrill Lynch
=1 Deutsche Bank
3 UBS
4 JPMorgan Chase
5 Credit Suisse
TOP FIVE CITIES (see page 10)
1 New York
2 London
3 Boston
4 San Francisco
5 Frankfurt
NORTH AMERICAN COMPANIES
89% go on the road
7 roadshows per year
17.1 days per year on the road
Top broker Royal Bank of Canada
New investment North America
Expected roadshow activity next year
Up: 31% Same: 62% Down: 7%
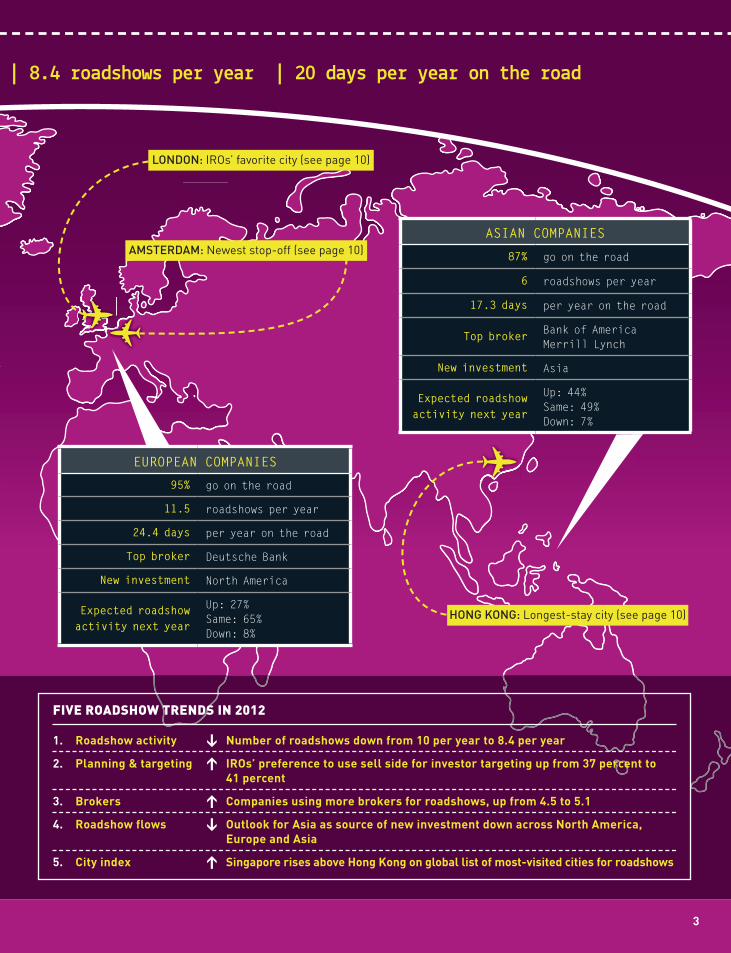
Global companies: 91 percent go on the road | 8.4 roadshows per year | 20 days per year on the road
oVeRVieW
NEW YORK: Most-visited city (see page 10)
3
FIVE ROADSHOW TRENDS IN 2012
1. Roadshow activity Number of roadshows down from 10 per year to 8.4 per year
2. Planning & targeting IROs’ preference to use sell side for investor targeting up from 37 percent to41 percent
3. Brokers Companies using more brokers for roadshows, up from 4.5 to 5.1
4. Roadshow flows Outlook for Asia as source of new investment down across North America, Europe and Asia
5. City index Singapore rises above Hong Kong on global list of most-visited cities for roadshows
ASIAN COMPANIES
87% go on the road
6 roadshows per year
17.3 days per year on the road
Top broker Bank of America Merrill Lynch
New investment Asia
Expected roadshow activity next year
Up: 44% Same: 49% Down: 7%
EUROPEAN COMPANIES
95% go on the road
11.5 roadshows per year
24.4 days per year on the road
Top broker Deutsche Bank
New investment North America
Expected roadshow activity next year
Up: 27% Same: 65% Down: 8%
Global companies: 91 percent go on the road | 8.4 roadshows per year | 20 days per year on the road
LONDON: iRos’ favorite city (see page 10)
AMSTERDAM: newest stop-off (see page 10)
HONG KONG: longest-stay city (see page 10)
44
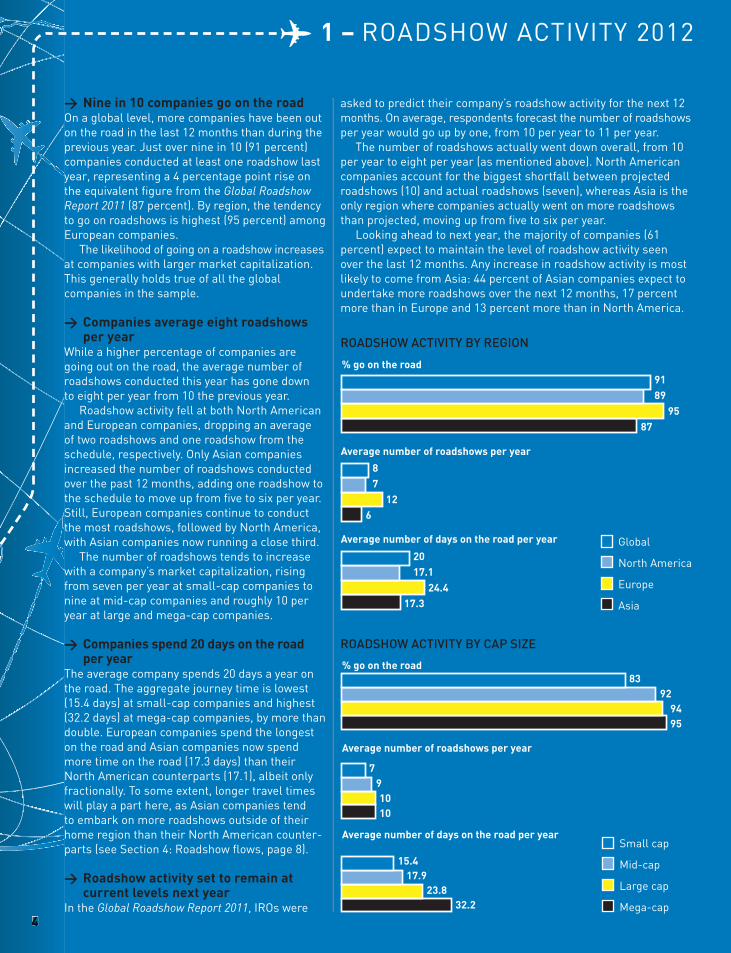
w Nine in 10 companies go on the roadon a global level, more companies have been out on the road in the last 12 months than during the previous year. Just over nine in 10 (91 percent) companies conducted at least one roadshow last year, representing a 4 percentage point rise on the equivalent fi gure from the Global Roadshow Report 2011 (87 percent). By region, the tendency to go on roadshows is highest (95 percent) among european companies.
The likelihood of going on a roadshow increases at companies with larger market capitalization. This generally holds true of all the global companies in the sample.
w Companies average eight roadshows per year
While a higher percentage of companies are going out on the road, the average number of roadshows conducted this year has gone down to eight per year from 10 the previous year.
Roadshow activity fell at both north American and european companies, dropping an average of two roadshows and one roadshow from the schedule, respectively. only Asian companies increased the number of roadshows conducted over the past 12 months, adding one roadshow to the schedule to move up from fi ve to six per year. still, european companies continue to conduct the most roadshows, followed by north America, with Asian companies now running a close third.
The number of roadshows tends to increase with a company’s market capitalization, rising from seven per year at small-cap companies to nine at mid-cap companies and roughly 10 per year at large and mega-cap companies.
w Companies spend 20 days on the road per year
The average company spends 20 days a year on the road. The aggregate journey time is lowest (15.4 days) at small-cap companies and highest (32.2 days) at mega-cap companies, by more than double. european companies spend the longest on the road and Asian companies now spend more time on the road (17.3 days) than their north American counterparts (17.1), albeit only fractionally. To some extent, longer travel times will play a part here, as Asian companies tend to embark on more roadshows outside of their home region than their north American counter-parts (see section 4: Roadshow fl ows, page 8).
w Roadshow activity set to remain at current levels next year
in the Global Roadshow Report 2011, iRos were
asked to predict their company’s roadshow activity for the next 12 months. on average, respondents forecast the number of roadshows per year would go up by one, from 10 per year to 11 per year.
The number of roadshows actually went down overall, from 10 per year to eight per year (as mentioned above). north American companies account for the biggest shortfall between projected roadshows (10) and actual roadshows (seven), whereas Asia is the only region where companies actually went on more roadshows than projected, moving up from fi ve to six per year.
looking ahead to next year, the majority of companies (61 percent) expect to maintain the level of roadshow activity seen over the last 12 months. Any increase in roadshow activity is most likely to come from Asia: 44 percent of Asian companies expect to undertake more roadshows over the next 12 months, 17 percent more than in europe and 13 percent more than in north America.
8392
9495
Small cap
Mid-cap
Large cap
Mega-cap
791010
15.417.9
23.832.2
% go on the road
Average number of roadshows per year
Average number of days on the road per year
Global
North America
Europe
Asia
9189
9587
87
126
2017.1
24.417.3
% go on the road
Average number of days on the road per year
Average number of roadshows per year
ROADSHOW ACTIVITY BY CAP SIZE
ROADSHOW ACTIVITY BY REGION
1 – RoAdsHoW ACTiViTY 2012
55
2 – Pl
An
nin
G &
TAR
Ge
Tin
G
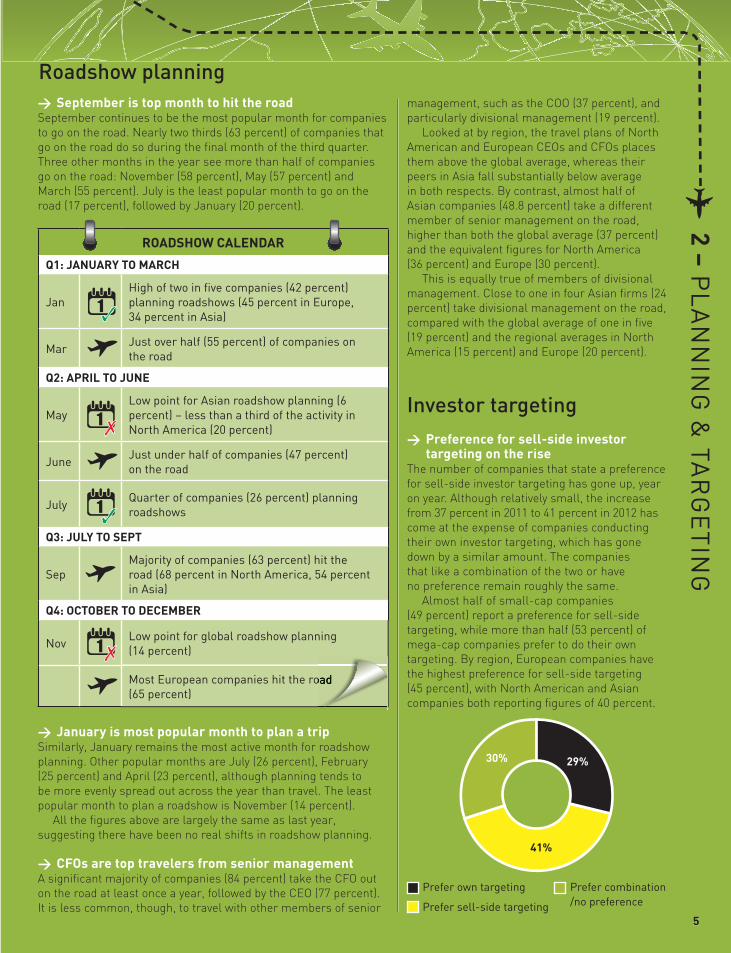
w September is top month to hit the roadSeptember continues to be the most popular month for companies to go on the road. Nearly two thirds (63 percent) of companies that go on the road do so during the fi nal month of the third quarter. Three other months in the year see more than half of companies go on the road: November (58 percent), May (57 percent) and March (55 percent). July is the least popular month to go on the road (17 percent), followed by January (20 percent).
management, such as the COO (37 percent), and particularly divisional management (19 percent).
Looked at by region, the travel plans of North American and European CEOs and CFOs places them above the global average, whereas their peers in Asia fall substantially below average in both respects. By contrast, almost half of Asian companies (48.8 percent) take a different member of senior management on the road, higher than both the global average (37 percent) and the equivalent fi gures for North America (36 percent) and Europe (30 percent).
This is equally true of members of divisional management. Close to one in four Asian fi rms (24 percent) take divisional management on the road, compared with the global average of one in fi ve (19 percent) and the regional averages in North America (15 percent) and Europe (20 percent).
Investor targeting w Preference for sell-side investor targeting on the rise
The number of companies that state a preference for sell-side investor targeting has gone up, year on year. Although relatively small, the increase from 37 percent in 2011 to 41 percent in 2012 has come at the expense of companies conducting their own investor targeting, which has gone down by a similar amount. The companies that like a combination of the two or have no preference remain roughly the same.
Almost half of small-cap companies (49 percent) report a preference for sell-side targeting, while more than half (53 percent) of mega-cap companies prefer to do their own targeting. By region, European companies have the highest preference for sell-side targeting (45 percent), with North American and Asian companies both reporting fi gures of 40 percent.
Roadshow planning
w January is most popular month to plan a trip Similarly, January remains the most active month for roadshow planning. Other popular months are July (26 percent), February (25 percent) and April (23 percent), although planning tends to be more evenly spread out across the year than travel. The least popular month to plan a roadshow is November (14 percent).
All the fi gures above are largely the same as last year, suggesting there have been no real shifts in roadshow planning.
w CFOs are top travelers from senior managementA signifi cant majority of companies (84 percent) take the CFO out on the road at least once a year, followed by the CEO (77 percent). It is less common, though, to travel with other members of senior
Prefer own targeting
Prefer sell-side targeting
29%
41%
30%
Prefer combination/no preference
ROADSHOW CALENDAR
Q1: JANUARY TO MARCH
JanHigh of two in fi ve companies (42 percent) planning roadshows (45 percent in europe, 34 percent in Asia)
MarJust over half (55 percent) of companies on the road
Q2: APRIL TO JUNE
May low point for Asian roadshow planning (6 percent) – less than a third of the activity in north America (20 percent)
JuneJust under half of companies (47 percent) on the road
July Quarter of companies (26 percent) planning roadshows
Q3: JULY TO SEPT
sepMajority of companies (63 percent) hit the road (68 percent in north America, 54 percent in Asia)
Q4: OCTOBER TO DECEMBER
novlow point for global roadshow planning (14 percent)
Most european companies hit the road (65 percent) Most european companies hit the road
66
3 – BRoKeRs
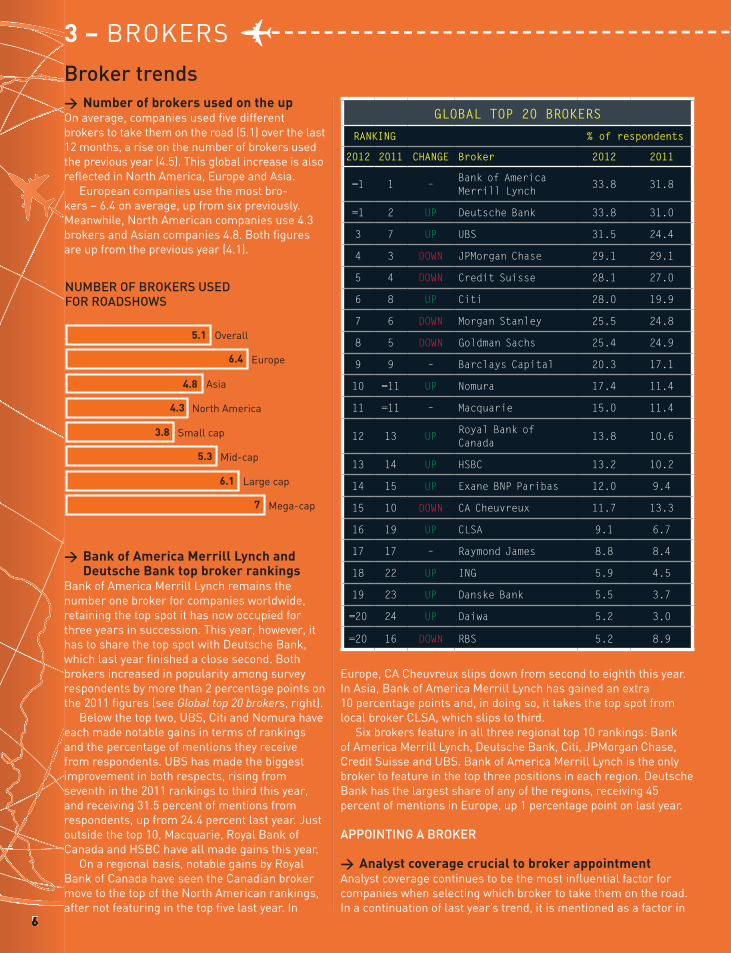
w Number of brokers used on the upon average, companies used fi ve different brokers to take them on the road (5.1) over the last 12 months, a rise on the number of brokers used the previous year (4.5). This global increase is also refl ected in north America, europe and Asia.
european companies use the most bro-kers – 6.4 on average, up from six previously. Meanwhile, north American companies use 4.3 brokers and Asian companies 4.8. Both fi gures are up from the previous year (4.1).
NUMBER OF BROKERS USED FOR ROADSHOWS
Broker trends
w Bank of America Merrill Lynch and Deutsche Bank top broker rankings
Bank of America Merrill lynch remains the number one broker for companies worldwide, retaining the top spot it has now occupied for three years in succession. This year, however, it has to share the top spot with deutsche Bank, which last year fi nished a close second. Both brokers increased in popularity among survey respondents by more than 2 percentage points on the 2011 fi gures (see Global top 20 brokers, right).
Below the top two, UBs, Citi and nomura have each made notable gains in terms of rankings and the percentage of mentions they receive from respondents. UBs has made the biggest improvement in both respects, rising from seventh in the 2011 rankings to third this year, and receiving 31.5 percent of mentions from respondents, up from 24.4 percent last year. Just outside the top 10, Macquarie, Royal Bank of Canada and HsBC have all made gains this year.
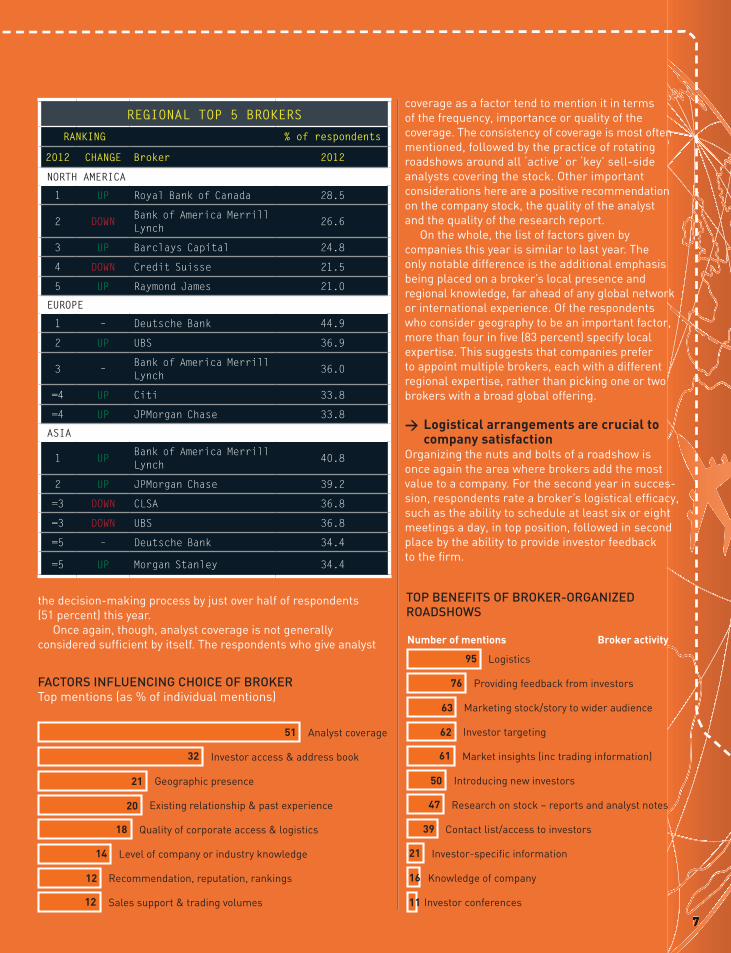
on a regional basis, notable gains by Royal Bank of Canada have seen the Canadian broker move to the top of the north American rankings, after not featuring in the top fi ve last year. in
GLOBAL TOP 20 BROKERS
RANKING % of respondents
2012 2011 CHANGE Broker 2012 2011
=1 1 –Bank of America Merrill Lynch
33.8 31.8
=1 2 UP Deutsche Bank 33.8 31.0
3 7 UP UBS 31.5 24.4
4 3 DOWN JPMorgan Chase 29.1 29.1
5 4 DOWN Credit Suisse 28.1 27.0
6 8 UP Citi 28.0 19.9
7 6 DOWN Morgan Stanley 25.5 24.8
8 5 DOWN Goldman Sachs 25.4 24.9
9 9 – Barclays Capital 20.3 17.1
10 =11 UP Nomura 17.4 11.4
11 =11 – Macquarie 15.0 11.4
12 13 UPRoyal Bank of Canada
13.8 10.6
13 14 UP HSBC 13.2 10.2
14 15 UP Exane BNP Paribas 12.0 9.4
15 10 DOWN CA Cheuvreux 11.7 13.3
16 19 UP CLSA 9.1 6.7
17 17 – Raymond James 8.8 8.4
18 22 UP ING 5.9 4.5
19 23 UP Danske Bank 5.5 3.7
=20 24 UP Daiwa 5.2 3.0
=20 16 DOWN RBS 5.2 8.9
europe, CA Cheuvreux slips down from second to eighth this year. in Asia, Bank of America Merrill lynch has gained an extra 10 percentage points and, in doing so, it takes the top spot from local broker ClsA, which slips to third.
six brokers feature in all three regional top 10 rankings: Bank of America Merrill lynch, deutsche Bank, Citi, JPMorgan Chase, Credit suisse and UBs. Bank of America Merrill lynch is the only broker to feature in the top three positions in each region. deutsche Bank has the largest share of any of the regions, receiving 45 percent of mentions in europe, up 1 percentage point on last year.
APPOINTING A BROKER
w Analyst coverage crucial to broker appointmentAnalyst coverage continues to be the most infl uential factor for companies when selecting which broker to take them on the road. in a continuation of last year’s trend, it is mentioned as a factor in
Overall
Europe
Asia
North America
Small cap
Mid-cap
Large cap
Mega-cap
5.1
6.4
4.8
4.3
3.8
5.3
6.1
7
77
TOP BENEFITS OF BROKER-ORGANIZED ROADSHOWS
FACTORS INFLUENCING CHOICE OF BROKERTop mentions (as % of individual mentions)
REGIONAL TOP 5 BROKERS
RANKING % of respondents
2012 CHANGE Broker 2012
NORTH AMERICA
1 UP Royal Bank of Canada 28.5
2 DOWNBank of America Merrill Lynch
26.6
3 UP Barclays Capital 24.8
4 DOWN Credit Suisse 21.5
5 UP Raymond James 21.0
EUROPE
1 – Deutsche Bank 44.9
2 UP UBS 36.9
3 –Bank of America Merrill Lynch
36.0
=4 UP Citi 33.8
=4 UP JPMorgan Chase 33.8
ASIA
1 UPBank of America Merrill Lynch
40.8
2 UP JPMorgan Chase 39.2
=3 DOWN CLSA 36.8
=3 DOWN UBS 36.8
=5 – Deutsche Bank 34.4
=5 UP Morgan Stanley 34.4
Analyst coverage
Investor access & address book
Geographic presence
Existing relationship & past experience
Quality of corporate access & logistics
Level of company or industry knowledge
Recommendation, reputation, rankings
Sales support & trading volumes
51
32
21
20
18
14
12
12
Logistics
Providing feedback from investors
Marketing stock/story to wider audience
Investor targeting
Market insights (inc trading information)
Introducing new investors
Research on stock – reports and analyst notes
Contact list/access to investors
Investor-specific information
Knowledge of company
Investor conferences
95
76
63
62
61
50
47
39
21
16
11
Broker activityNumber of mentions
coverage as a factor tend to mention it in terms of the frequency, importance or quality of the coverage. The consistency of coverage is most often mentioned, followed by the practice of rotating roadshows around all ‘active’ or ‘key’ sell-side analysts covering the stock. other important considerations here are a positive recommendation on the company stock, the quality of the analyst and the quality of the research report.
on the whole, the list of factors given by companies this year is similar to last year. The only notable difference is the additional emphasis being placed on a broker’s local presence and regional knowledge, far ahead of any global network or international experience. of the respondents who consider geography to be an important factor, more than four in fi ve (83 percent) specify local expertise. This suggests that companies prefer to appoint multiple brokers, each with a different regional expertise, rather than picking one or two brokers with a broad global offering.
w Logistical arrangements are crucial to company satisfaction
organizing the nuts and bolts of a roadshow is once again the area where brokers add the most value to a company. For the second year in succes-sion, respondents rate a broker’s logistical effi cacy, such as the ability to schedule at least six or eight meetings a day, in top position, followed in second place by the ability to provide investor feedback to the fi rm.
the decision-making process by just over half of respondents (51 percent) this year.
once again, though, analyst coverage is not generally considered suffi cient by itself. The respondents who give analyst
88
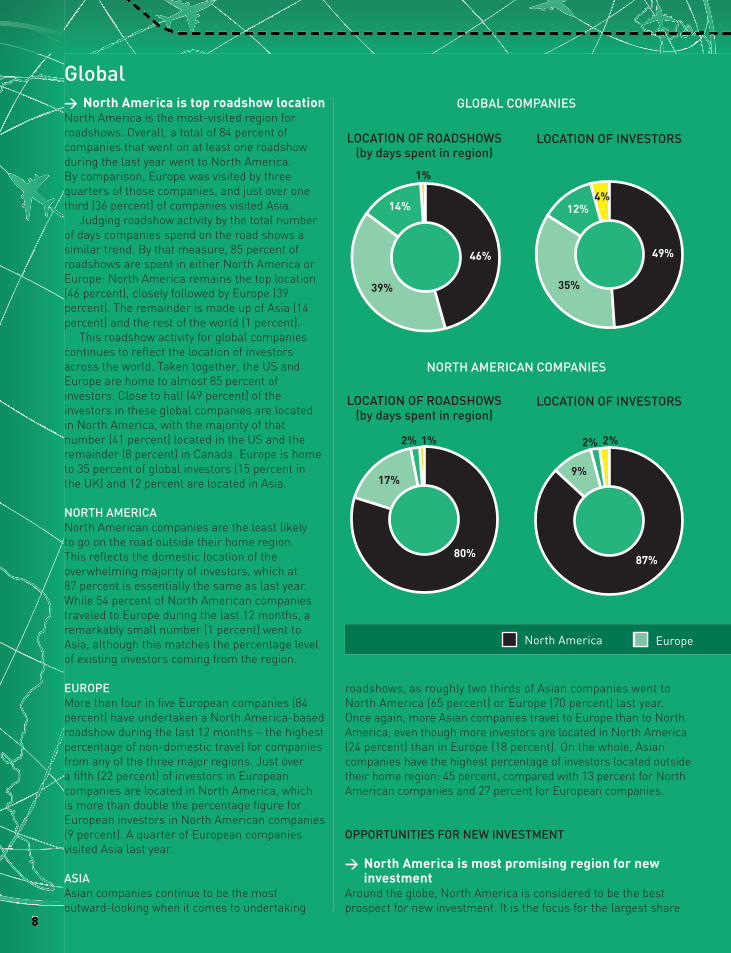
w North America is top roadshow locationNorth America is the most-visited region for roadshows. Overall, a total of 84 percent of companies that went on at least one roadshow during the last year went to North America. By comparison, Europe was visited by three quarters of those companies, and just over one third (36 percent) of companies visited Asia.
Judging roadshow activity by the total number of days companies spend on the road shows a similar trend. By that measure, 85 percent of roadshows are spent in either North America or Europe: North America remains the top location (46 percent), closely followed by Europe (39 percent). The remainder is made up of Asia (14 percent) and the rest of the world (1 percent).
This roadshow activity for global companies continues to refl ect the location of investors across the world. Taken together, the US and Europe are home to almost 85 percent of investors. Close to half (49 percent) of the investors in these global companies are located in North America, with the majority of that number (41 percent) located in the US and the remainder (8 percent) in Canada. Europe is home to 35 percent of global investors (15 percent in the UK) and 12 percent are located in Asia.
NORTH AMERICANorth American companies are the least likely to go on the road outside their home region. This refl ects the domestic location of the overwhelming majority of investors, which at 87 percent is essentially the same as last year. While 54 percent of North American companies traveled to Europe during the last 12 months, a remarkably small number (1 percent) went to Asia, although this matches the percentage level of existing investors coming from the region.
EUROPEMore than four in fi ve European companies (84 percent) have undertaken a North America-based roadshow during the last 12 months – the highest percentage of non-domestic travel for companies from any of the three major regions. Just over a fi fth (22 percent) of investors in European companies are located in North America, which is more than double the percentage fi gure for European investors in North American companies (9 percent). A quarter of European companies visited Asia last year.
ASIAAsian companies continue to be the most outward-looking when it comes to undertaking
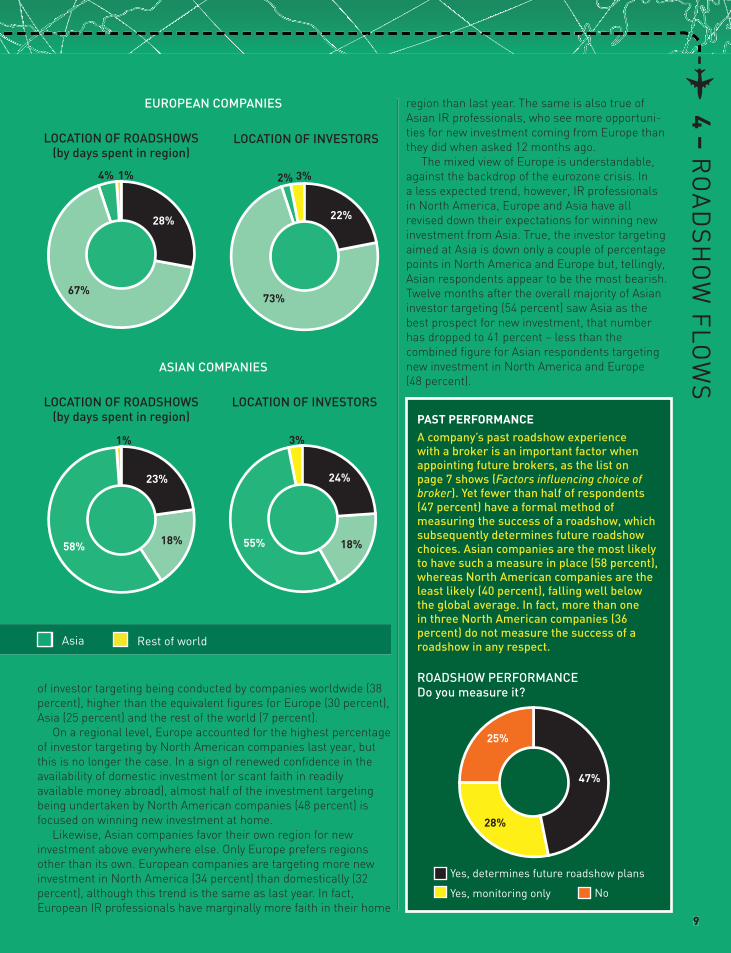
GLOBAL COMPANIES
Global
roadshows, as roughly two thirds of Asian companies went to North America (65 percent) or Europe (70 percent) last year. Once again, more Asian companies travel to Europe than to North America, even though more investors are located in North America (24 percent) than in Europe (18 percent). On the whole, Asian companies have the highest percentage of investors located outside their home region: 45 percent, compared with 13 percent for North American companies and 27 percent for European companies.
OPPORTUNITIES FOR NEW INVESTMENT
w North America is most promising region for new investment
Around the globe, North America is considered to be the best prospect for new investment. It is the focus for the largest share
46%
39%
1%
14%
49%
35%
12%4%
LOCATION OF ROADSHOWS (by days spent in region)
LOCATION OF INVESTORS
NORTH AMERICAN COMPANIES
80%
17%
2% 1%
87%
9%
2% 2%
LOCATION OF ROADSHOWS (by days spent in region)
LOCATION OF INVESTORS
north America europe
99
4 – Ro
Ad
sH
oW
Flo
WsASIAN COMPANIES
23%
18%58%
1%
24%
18%55%
3%
LOCATION OF ROADSHOWS (by days spent in region)
LOCATION OF INVESTORS
EUROPEAN COMPANIES
28%
67%
4% 1%
22%
73%
2% 3%
LOCATION OF ROADSHOWS (by days spent in region)
LOCATION OF INVESTORS
Asia Rest of world
region than last year. The same is also true of Asian IR professionals, who see more opportuni-ties for new investment coming from Europe than they did when asked 12 months ago.
The mixed view of Europe is understandable, against the backdrop of the eurozone crisis. In a less expected trend, however, IR professionals in North America, Europe and Asia have all revised down their expectations for winning new investment from Asia. True, the investor targeting aimed at Asia is down only a couple of percentage points in North America and Europe but, tellingly, Asian respondents appear to be the most bearish. Twelve months after the overall majority of Asian investor targeting (54 percent) saw Asia as the best prospect for new investment, that number has dropped to 41 percent – less than the combined fi gure for Asian respondents targeting new investment in North America and Europe (48 percent).
of investor targeting being conducted by companies worldwide (38 percent), higher than the equivalent fi gures for Europe (30 percent), Asia (25 percent) and the rest of the world (7 percent).
On a regional level, Europe accounted for the highest percentage of investor targeting by North American companies last year, but this is no longer the case. In a sign of renewed confi dence in the availability of domestic investment (or scant faith in readily available money abroad), almost half of the investment targeting being undertaken by North American companies (48 percent) is focused on winning new investment at home.
Likewise, Asian companies favor their own region for new investment above everywhere else. Only Europe prefers regions other than its own. European companies are targeting more new investment in North America (34 percent) than domestically (32 percent), although this trend is the same as last year. In fact, European IR professionals have marginally more faith in their home
PAST PERFORMANCEA company’s past roadshow experience with a broker is an important factor when appointing future brokers, as the list on page 7 shows (Factors infl uencing choice of broker). Yet fewer than half of respondents (47 percent) have a formal method of measuring the success of a roadshow, which subsequently determines future roadshow choices. Asian companies are the most likely to have such a measure in place (58 percent), whereas North American companies are the least likely (40 percent), falling well below the global average. In fact, more than one in three North American companies (36 percent) do not measure the success of a roadshow in any respect.
Yes, determines future roadshow plans
Yes, monitoring only No
47%
28%
25%
ROADSHOW PERFORMANCE Do you measure it?
1010
5 –
CiT
Y in
de
X
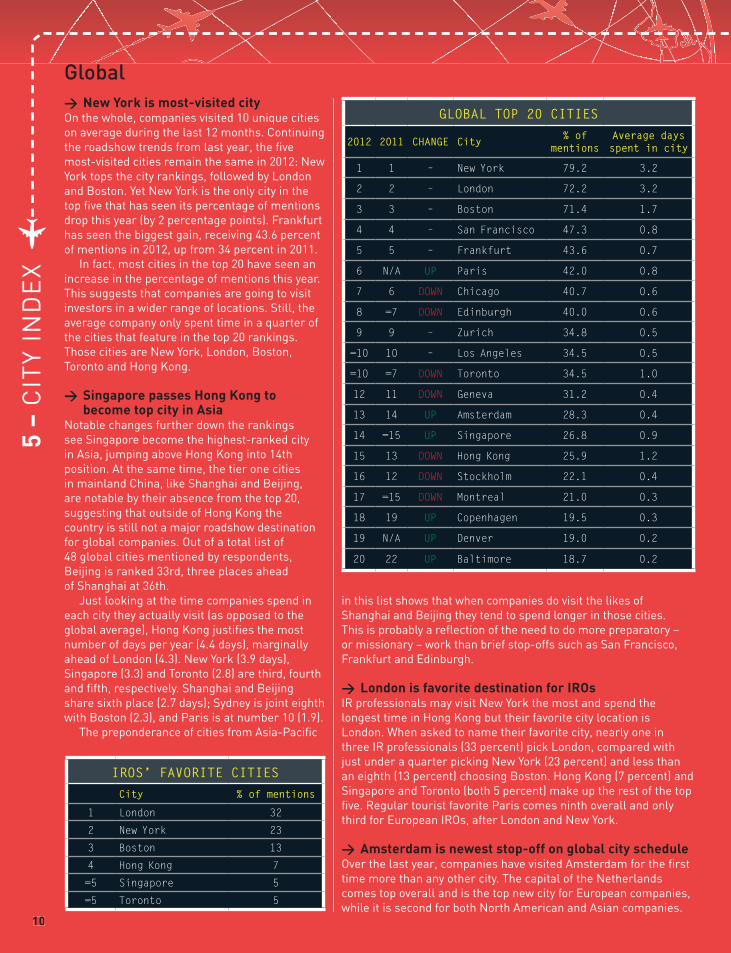
Global w New York is most-visited city
on the whole, companies visited 10 unique cities on average during the last 12 months. Continuing the roadshow trends from last year, the fi ve most-visited cities remain the same in 2012: new York tops the city rankings, followed by london and Boston. Yet new York is the only city in the top fi ve that has seen its percentage of mentions drop this year (by 2 percentage points). Frankfurt has seen the biggest gain, receiving 43.6 percent of mentions in 2012, up from 34 percent in 2011.
in fact, most cities in the top 20 have seen an increase in the percentage of mentions this year. This suggests that companies are going to visit investors in a wider range of locations. still, the average company only spent time in a quarter of the cities that feature in the top 20 rankings. Those cities are new York, london, Boston, Toronto and Hong Kong.
w Singapore passes Hong Kong to become top city in Asia
notable changes further down the rankings see singapore become the highest-ranked city in Asia, jumping above Hong Kong into 14th position. At the same time, the tier one cities in mainland China, like shanghai and Beijing, are notable by their absence from the top 20, suggesting that outside of Hong Kong the country is still not a major roadshow destination for global companies. out of a total list of 48 global cities mentioned by respondents, Beijing is ranked 33rd, three places ahead of shanghai at 36th.
Just looking at the time companies spend in each city they actually visit (as opposed to the global average), Hong Kong justifi es the most number of days per year (4.4 days), marginally ahead of london (4.3). new York (3.9 days), singapore (3.3) and Toronto (2.8) are third, fourth and fi fth, respectively. shanghai and Beijing share sixth place (2.7 days); sydney is joint eighth with Boston (2.3), and Paris is at number 10 (1.9).
The preponderance of cities from Asia-Pacifi c
GLOBAL TOP 20 CITIES
2012 2011 CHANGE City % of mentions
Average days spent in city
1 1 – New York 79.2 3.2
2 2 – London 72.2 3.2
3 3 – Boston 71.4 1.7
4 4 – San Francisco 47.3 0.8
5 5 – Frankfurt 43.6 0.7
6 N/A UP Paris 42.0 0.8
7 6 DOWN Chicago 40.7 0.6
8 =7 DOWN Edinburgh 40.0 0.6
9 9 – Zurich 34.8 0.5
=10 10 – Los Angeles 34.5 0.5
=10 =7 DOWN Toronto 34.5 1.0
12 11 DOWN Geneva 31.2 0.4
13 14 UP Amsterdam 28.3 0.4
14 =15 UP Singapore 26.8 0.9
15 13 DOWN Hong Kong 25.9 1.2
16 12 DOWN Stockholm 22.1 0.4
17 =15 DOWN Montreal 21.0 0.3
18 19 UP Copenhagen 19.5 0.3
19 N/A UP Denver 19.0 0.2
20 22 UP Baltimore 18.7 0.2
IROS’ FAVORITE CITIESCity % of mentions
1 London 32
2 New York 23
3 Boston 13
4 Hong Kong 7
=5 Singapore 5
=5 Toronto 5
in this list shows that when companies do visit the likes of shanghai and Beijing they tend to spend longer in those cities. This is probably a refl ection of the need to do more preparatory – or missionary – work than brief stop-offs such as san Francisco, Frankfurt and edinburgh.
w London is favorite destination for IROsiR professionals may visit new York the most and spend the longest time in Hong Kong but their favorite city location is london. When asked to name their favorite city, nearly one in three iR professionals (33 percent) pick london, compared with just under a quarter picking new York (23 percent) and less than an eighth (13 percent) choosing Boston. Hong Kong (7 percent) and singapore and Toronto (both 5 percent) make up the rest of the top fi ve. Regular tourist favorite Paris comes ninth overall and only third for european iRos, after london and new York.
w Amsterdam is newest stop-off on global city scheduleover the last year, companies have visited Amsterdam for the fi rst time more than any other city. The capital of the netherlands comes top overall and is the top new city for european companies, while it is second for both north American and Asian companies.
111111
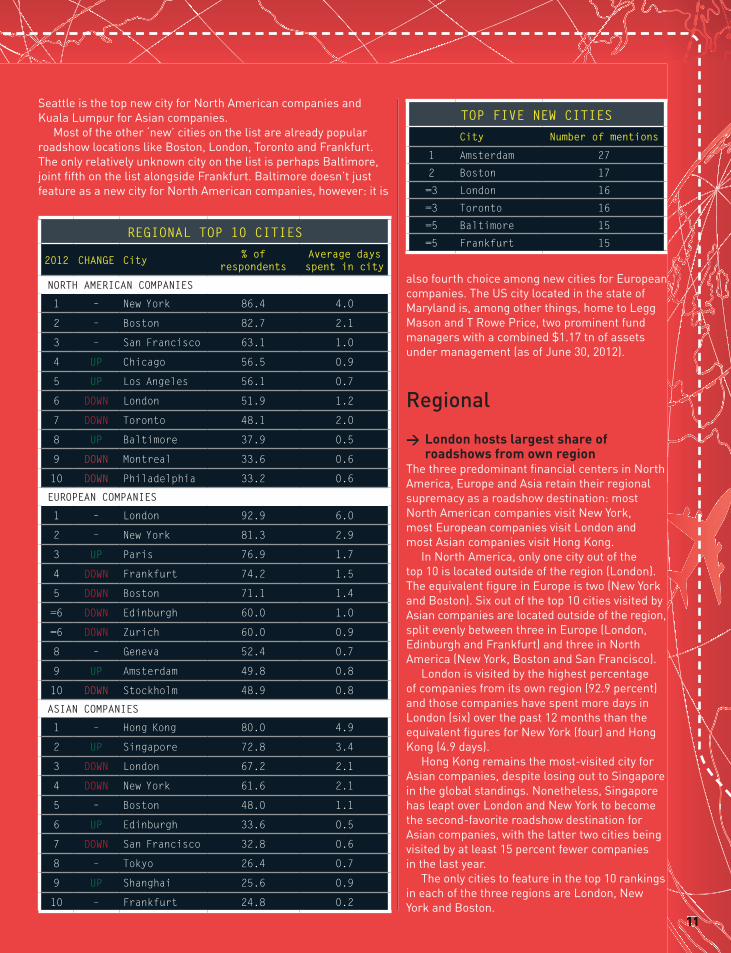
REGIONAL TOP 10 CITIES
2012 CHANGE City % of respondents
Average days spent in city
NORTH AMERICAN COMPANIES
1 – New York 86.4 4.0
2 – Boston 82.7 2.1
3 – San Francisco 63.1 1.0
4 UP Chicago 56.5 0.9
5 UP Los Angeles 56.1 0.7
6 DOWN London 51.9 1.2
7 DOWN Toronto 48.1 2.0
8 UP Baltimore 37.9 0.5
9 DOWN Montreal 33.6 0.6
10 DOWN Philadelphia 33.2 0.6
EUROPEAN COMPANIES
1 – London 92.9 6.0
2 – New York 81.3 2.9
3 UP Paris 76.9 1.7
4 DOWN Frankfurt 74.2 1.5
5 DOWN Boston 71.1 1.4
=6 DOWN Edinburgh 60.0 1.0
=6 DOWN Zurich 60.0 0.9
8 – Geneva 52.4 0.7
9 UP Amsterdam 49.8 0.8
10 DOWN Stockholm 48.9 0.8
ASIAN COMPANIES
1 – Hong Kong 80.0 4.9
2 UP Singapore 72.8 3.4
3 DOWN London 67.2 2.1
4 DOWN New York 61.6 2.1
5 – Boston 48.0 1.1
6 UP Edinburgh 33.6 0.5
7 DOWN San Francisco 32.8 0.6
8 – Tokyo 26.4 0.7
9 UP Shanghai 25.6 0.9
10 – Frankfurt 24.8 0.2
TOP FIVE NEW CITIES City Number of mentions
1 Amsterdam 27
2 Boston 17
=3 London 16
=3 Toronto 16
=5 Baltimore 15
=5 Frankfurt 15
w London hosts largest share of roadshows from own region
The three predominant fi nancial centers in north America, europe and Asia retain their regional supremacy as a roadshow destination: most north American companies visit new York, most european companies visit london and most Asian companies visit Hong Kong.
in north America, only one city out of the top 10 is located outside of the region (london). The equivalent fi gure in europe is two (new York and Boston). six out of the top 10 cities visited by Asian companies are located outside of the region, split evenly between three in europe (london, edinburgh and Frankfurt) and three in north America (new York, Boston and san Francisco).
london is visited by the highest percentage of companies from its own region (92.9 percent) and those companies have spent more days in london (six) over the past 12 months than the equivalent fi gures for new York (four) and Hong Kong (4.9 days).
Hong Kong remains the most-visited city for Asian companies, despite losing out to singapore in the global standings. nonetheless, singapore has leapt over london and new York to become the second-favorite roadshow destination for Asian companies, with the latter two cities being visited by at least 15 percent fewer companies in the last year.
The only cities to feature in the top 10 rankings in each of the three regions are london, new York and Boston.
Regional
seattle is the top new city for north American companies and Kuala lumpur for Asian companies.
Most of the other ‘new’ cities on the list are already popular roadshow locations like Boston, london, Toronto and Frankfurt. The only relatively unknown city on the list is perhaps Baltimore, joint fi fth on the list alongside Frankfurt. Baltimore doesn’t just feature as a new city for north American companies, however: it is
also fourth choice among new cities for european companies. The Us city located in the state of Maryland is, among other things, home to legg Mason and T Rowe Price, two prominent fund managers with a combined $1.17 tn of assets under management (as of June 30, 2012).
1212
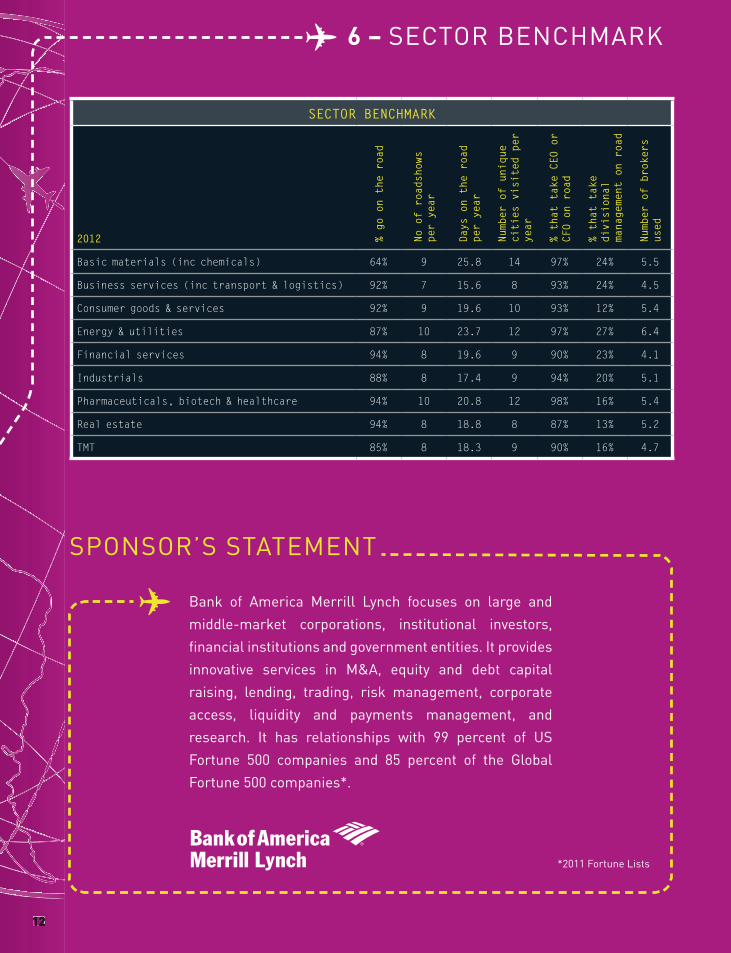
SECTOR BENCHMARK
2012 % go on the road
No of roadshows
per year
Days on the road
per year
Number of unique
cities visited per
year
% that take CEO or
CFO on road
% that take
divisional
management on road
Number of brokers
used
Basic materials (inc chemicals) 64% 9 25.8 14 97% 24% 5.5
Business services (inc transport & logistics) 92% 7 15.6 8 93% 24% 4.5
Consumer goods & services 92% 9 19.6 10 93% 12% 5.4
Energy & utilities 87% 10 23.7 12 97% 27% 6.4
Financial services 94% 8 19.6 9 90% 23% 4.1
Industrials 88% 8 17.4 9 94% 20% 5.1
Pharmaceuticals, biotech & healthcare 94% 10 20.8 12 98% 16% 5.4
Real estate 94% 8 18.8 8 87% 13% 5.2
TMT 85% 8 18.3 9 90% 16% 4.7
Bank of America Merrill lynch focuses on large and
middle-market corporations, institutional investors,
fi nancial institutions and government entities. it provides
innovative services in M&A, equity and debt capital
raising, lending, trading, risk management, corporate
access, liquidity and payments management, and
research. it has relationships with 99 percent of Us
Fortune 500 companies and 85 percent of the Global
Fortune 500 companies*.
*2011 Fortune lists
6 – seCToR BenCHMARK
sPonsoR’s sTATeMenT