Global reefer trades - 2014 - JOC.com | Container … reefer trades - 2014 Neil Dekker Containers...
18
Global reefer trades - 2014 Neil Dekker Containers – Director of research [email protected] TPM –Cool Cargoes, Long Beach, 3rd March 2014
Transcript of Global reefer trades - 2014 - JOC.com | Container … reefer trades - 2014 Neil Dekker Containers...
Global reefer
trades - 2014
Neil Dekker Containers – Director of research
TPM –Cool Cargoes, Long Beach, 3rd March 2014
© Drewry 2013
2 Drewry | Global reefer trades - 2014
1. Demand
2. Supply trends
3. Reefer equipment
4. Trade route reviews
5. Freight rates
6. Review and outlook
Agenda
© Drewry 2013
3 Drewry | Global reefer trades - 2014
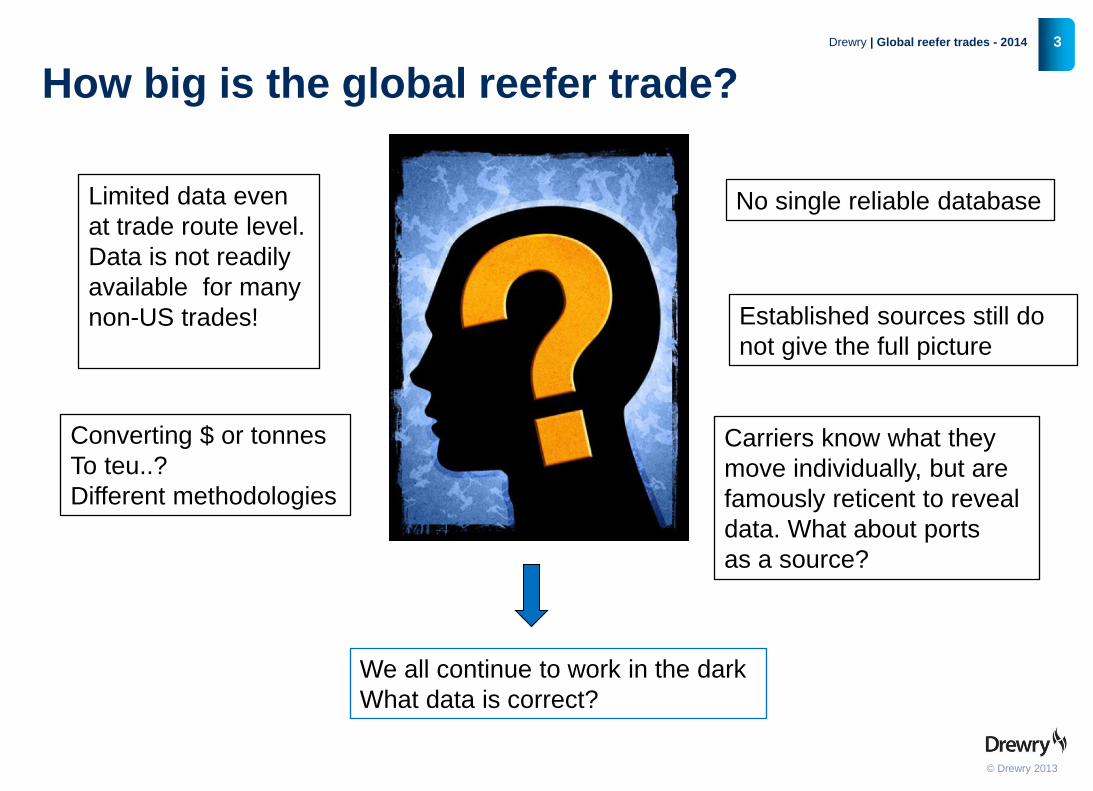
How big is the global reefer trade?
No single reliable database Limited data even
at trade route level.
Data is not readily
available for many
non-US trades!
Converting $ or tonnes
To teu..?
Different methodologies
Established sources still do
not give the full picture
We all continue to work in the dark
What data is correct?
Carriers know what they
move individually, but are
famously reticent to reveal
data. What about ports
as a source?
© Drewry 2013
4 Drewry | Global reefer trades - 2014
How big is the global reefer trade?
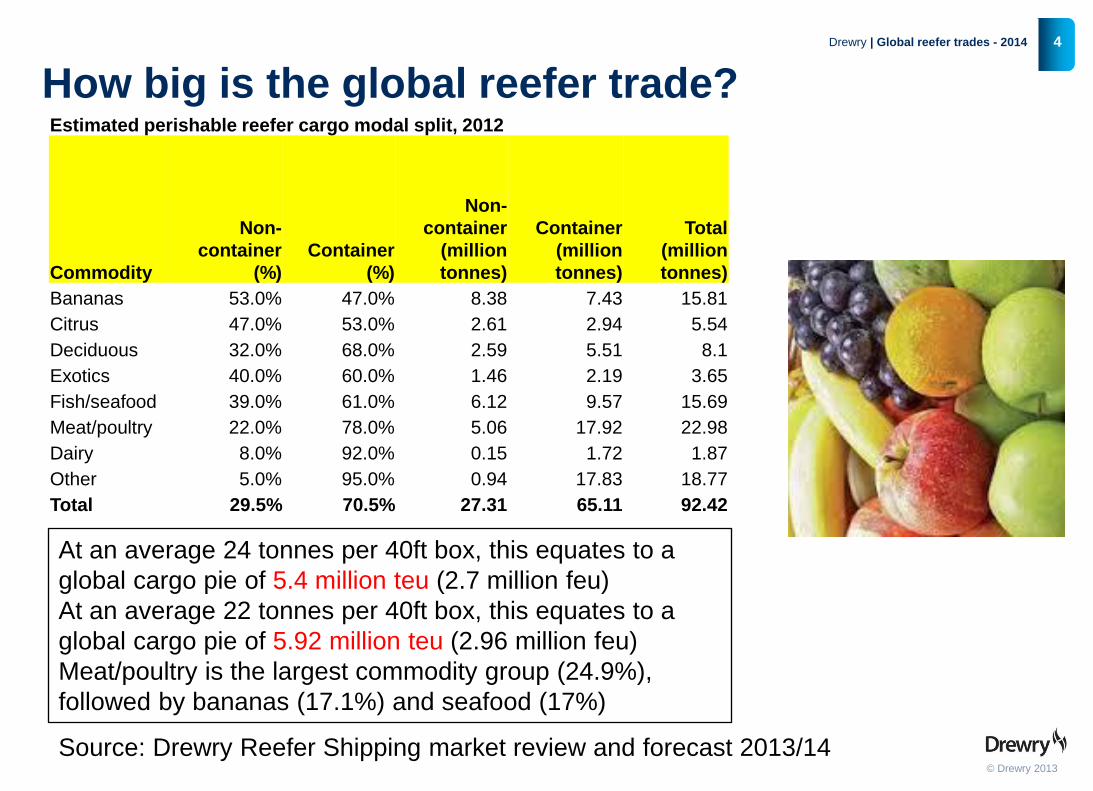
At an average 24 tonnes per 40ft box, this equates to a
global cargo pie of 5.4 million teu (2.7 million feu)
At an average 22 tonnes per 40ft box, this equates to a
global cargo pie of 5.92 million teu (2.96 million feu)
Meat/poultry is the largest commodity group (24.9%),
followed by bananas (17.1%) and seafood (17%)
Estimated perishable reefer cargo modal split, 2012
Commodity
Non-
container
(%)
Container
(%)
Non-
container
(million
tonnes)
Container
(million
tonnes)
Total
(million
tonnes)
Bananas 53.0% 47.0% 8.38 7.43 15.81
Citrus 47.0% 53.0% 2.61 2.94 5.54
Deciduous 32.0% 68.0% 2.59 5.51 8.1
Exotics 40.0% 60.0% 1.46 2.19 3.65
Fish/seafood 39.0% 61.0% 6.12 9.57 15.69
Meat/poultry 22.0% 78.0% 5.06 17.92 22.98
Dairy 8.0% 92.0% 0.15 1.72 1.87
Other 5.0% 95.0% 0.94 17.83 18.77
Total 29.5% 70.5% 27.31 65.11 92.42
Source: Drewry Reefer Shipping market review and forecast 2013/14
© Drewry 2013
5 Drewry | Global reefer trades - 2014
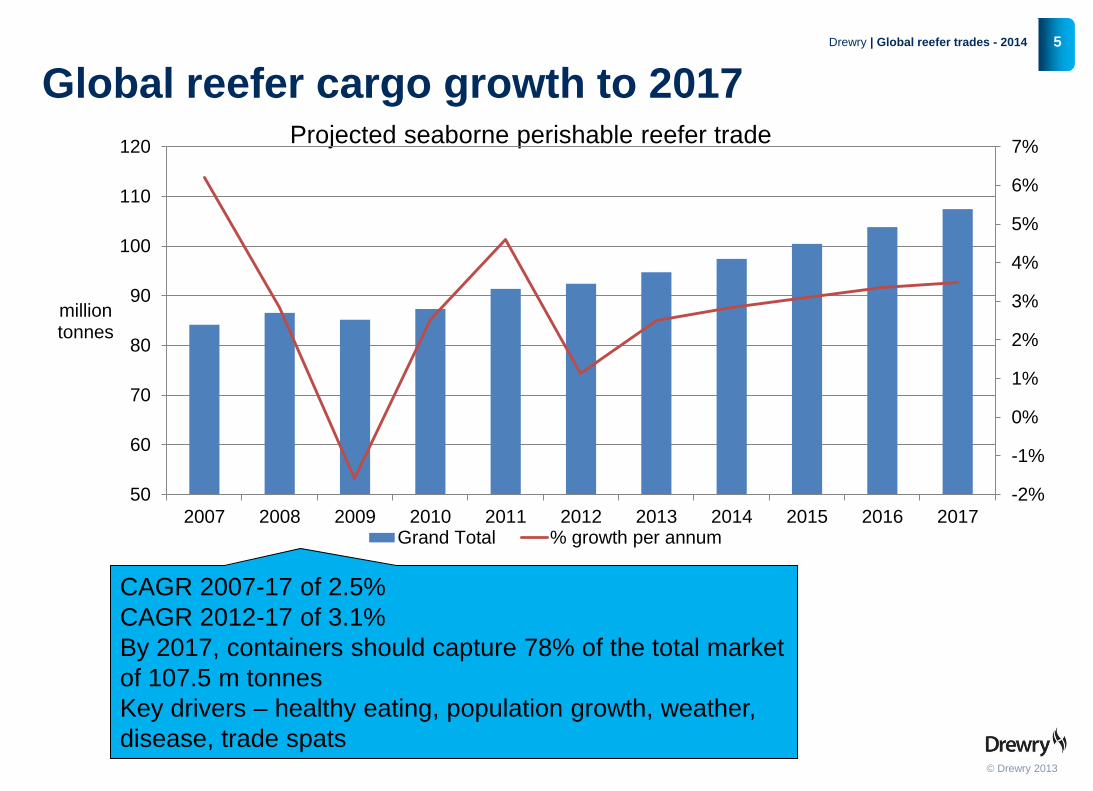
Global reefer cargo growth to 2017 Projected seaborne perishable reefer trade
CAGR 2007-17 of 2.5%
CAGR 2012-17 of 3.1%
By 2017, containers should capture 78% of the total market
of 107.5 m tonnes
Key drivers – healthy eating, population growth, weather,
disease, trade spats
-2%
-1%
0%
1%
2%
3%
4%
5%
6%
7%
50
60
70
80
90
100
110
120
2007 2008 2009 2010 2011 2012 2013 2014 2015 2016 2017
million tonnes
Grand Total % growth per annum
© Drewry 2013
6 Drewry | Global reefer trades - 2014
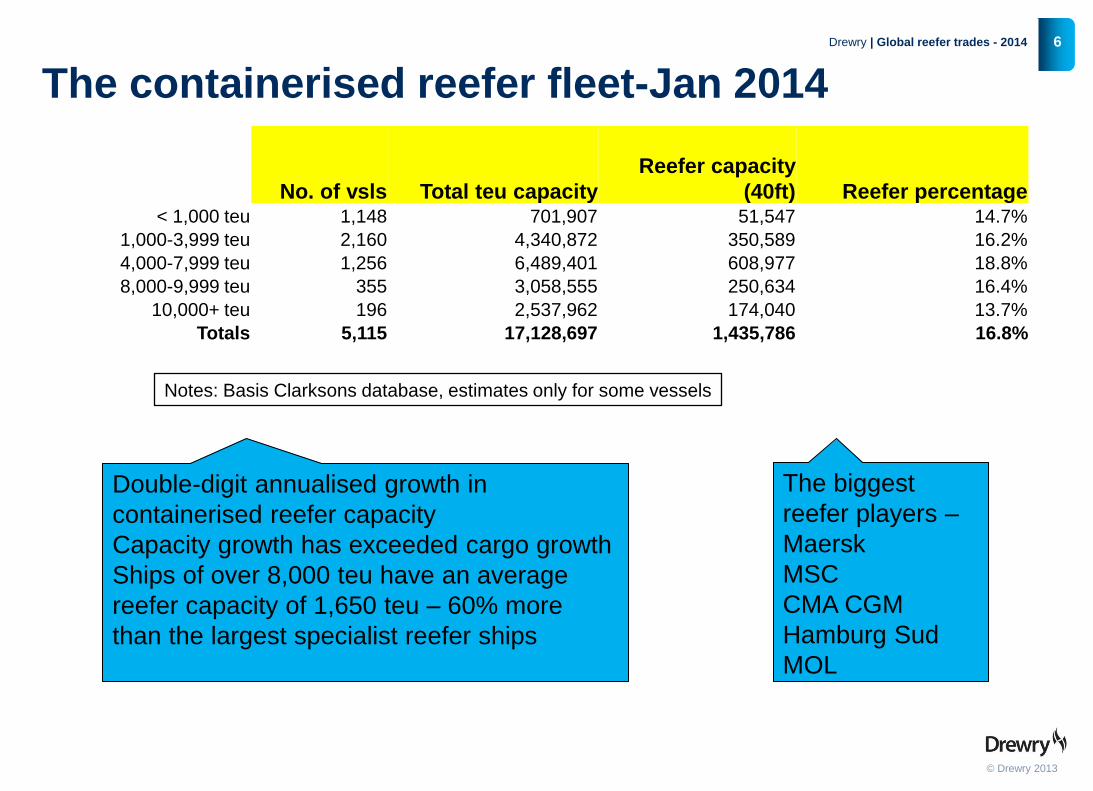
The containerised reefer fleet-Jan 2014
Notes: Basis Clarksons database, estimates only for some vessels
No. of vsls Total teu capacity
Reefer capacity
(40ft) Reefer percentage < 1,000 teu 1,148 701,907 51,547 14.7%
1,000-3,999 teu 2,160 4,340,872 350,589 16.2%
4,000-7,999 teu 1,256 6,489,401 608,977 18.8%
8,000-9,999 teu 355 3,058,555 250,634 16.4%
10,000+ teu 196 2,537,962 174,040 13.7%
Totals 5,115 17,128,697 1,435,786 16.8%
Double-digit annualised growth in
containerised reefer capacity
Capacity growth has exceeded cargo growth
Ships of over 8,000 teu have an average
reefer capacity of 1,650 teu – 60% more
than the largest specialist reefer ships
The biggest
reefer players –
Maersk
MSC
CMA CGM
Hamburg Sud
MOL
© Drewry 2013
7 Drewry | Global reefer trades - 2014
Specialist versus containers – the future
0
500
1000
1500
2000
2500
3000
3500
4000
4500
Specialised Reefer Reefer containers
Million Cu. ft
Mid 2013 Jan-16
0%
10%
20%
30%
40%
50%
60%
70%
80%
90%
Specialised Reefer Reefer containers
% share of market
Mid 2013 Jan-16
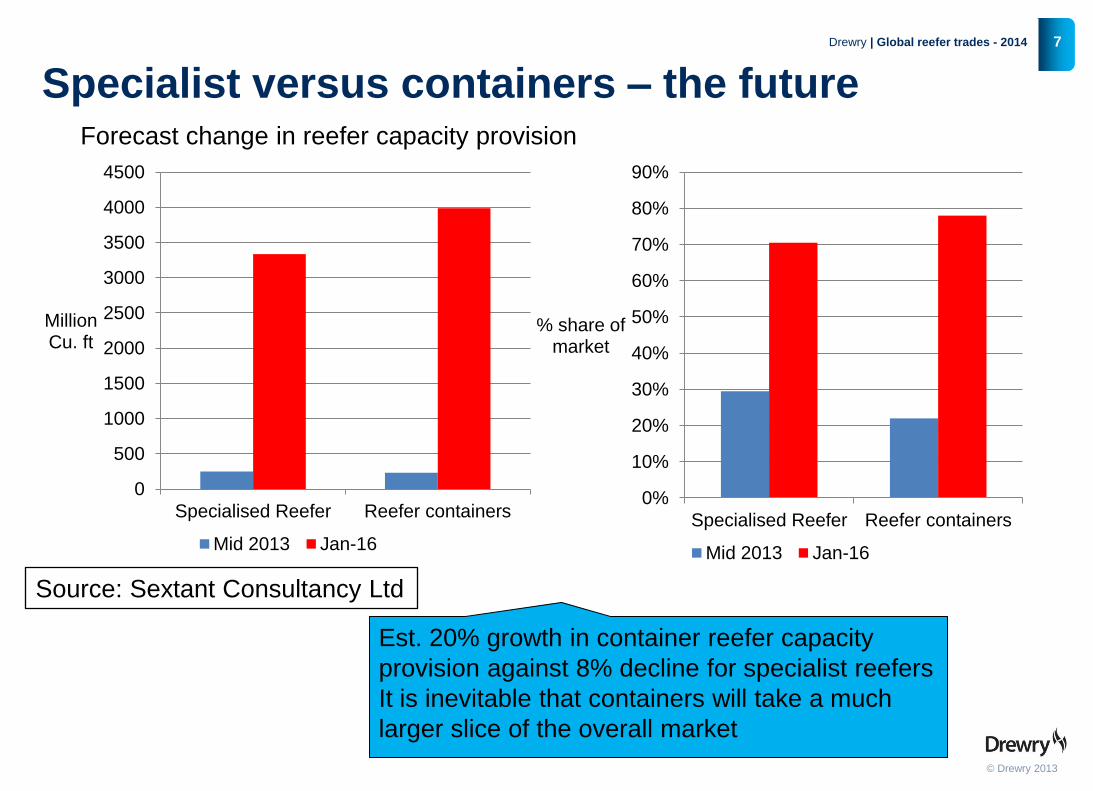
Forecast change in reefer capacity provision
Est. 20% growth in container reefer capacity
provision against 8% decline for specialist reefers
It is inevitable that containers will take a much
larger slice of the overall market
Source: Sextant Consultancy Ltd
© Drewry 2013
8 Drewry | Global reefer trades - 2014
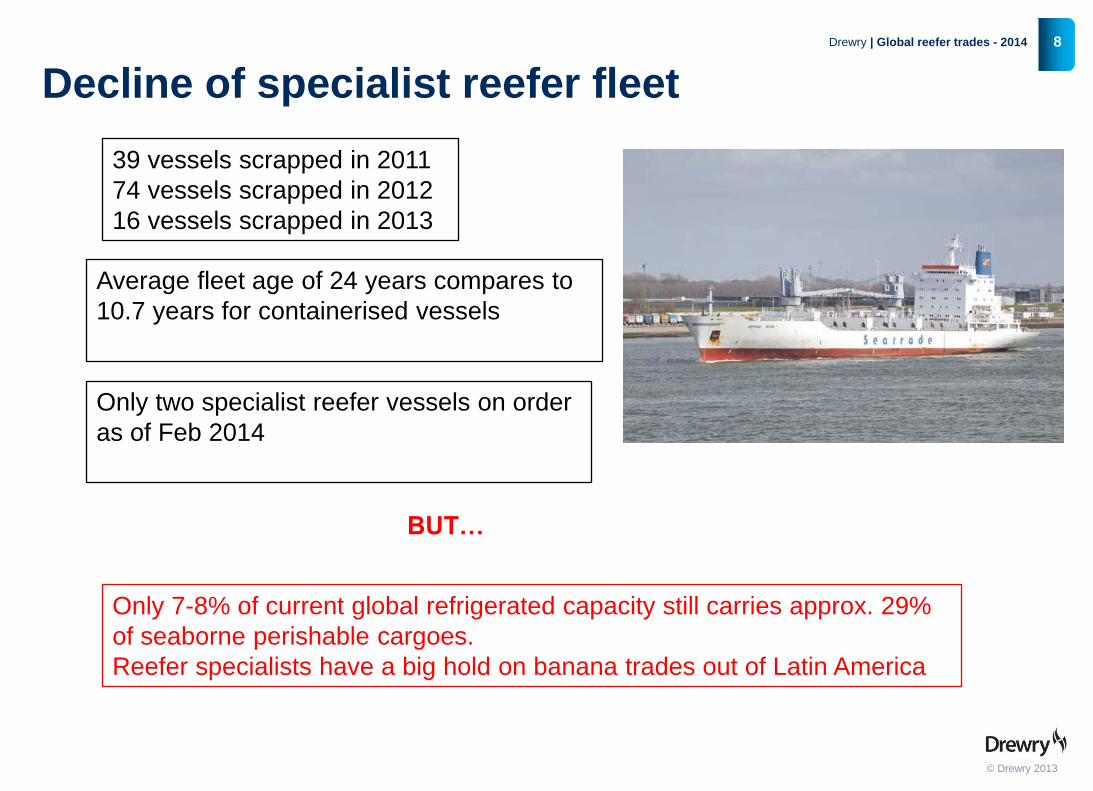
Decline of specialist reefer fleet
39 vessels scrapped in 2011
74 vessels scrapped in 2012
16 vessels scrapped in 2013
Average fleet age of 24 years compares to
10.7 years for containerised vessels
Only two specialist reefer vessels on order
as of Feb 2014
BUT…
Only 7-8% of current global refrigerated capacity still carries approx. 29%
of seaborne perishable cargoes.
Reefer specialists have a big hold on banana trades out of Latin America
© Drewry 2013
9 Drewry | Global reefer trades - 2014
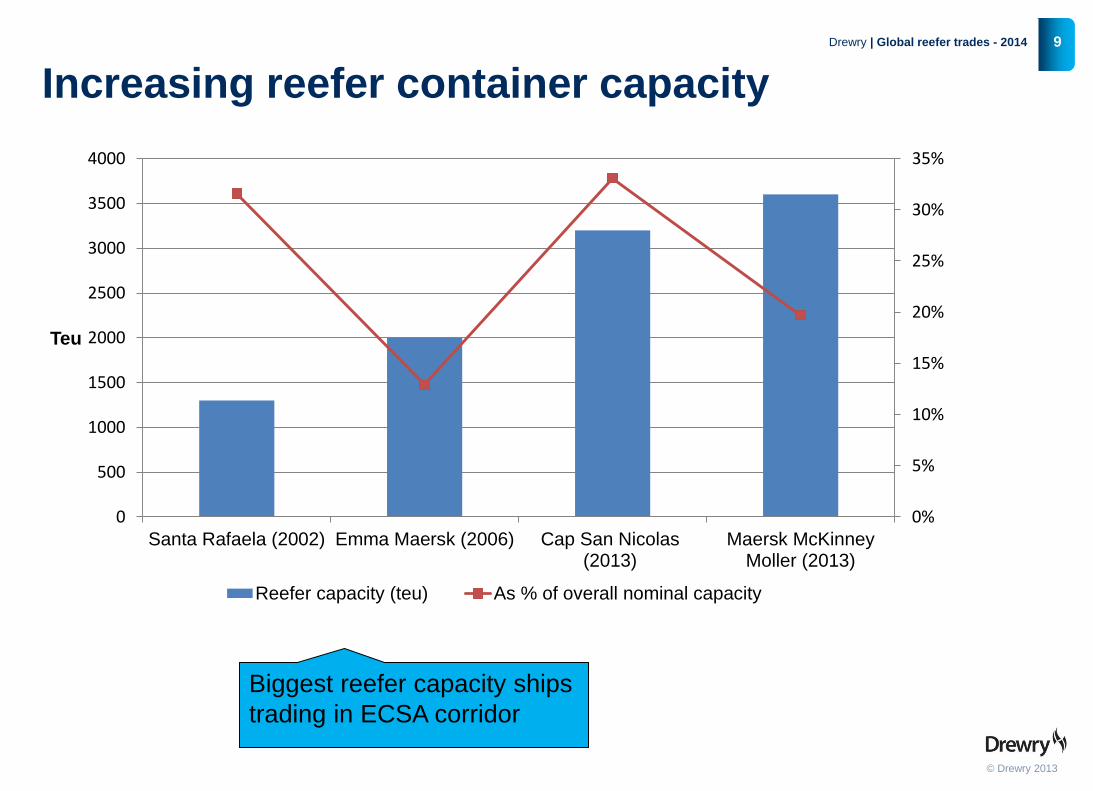
Increasing reefer container capacity
0%
5%
10%
15%
20%
25%
30%
35%
0
500
1000
1500
2000
2500
3000
3500
4000
Santa Rafaela (2002) Emma Maersk (2006) Cap San Nicolas(2013)
Maersk McKinneyMoller (2013)
Teu
Reefer capacity (teu) As % of overall nominal capacity
Biggest reefer capacity ships
trading in ECSA corridor
© Drewry 2013
10 Drewry | Global reefer trades - 2014
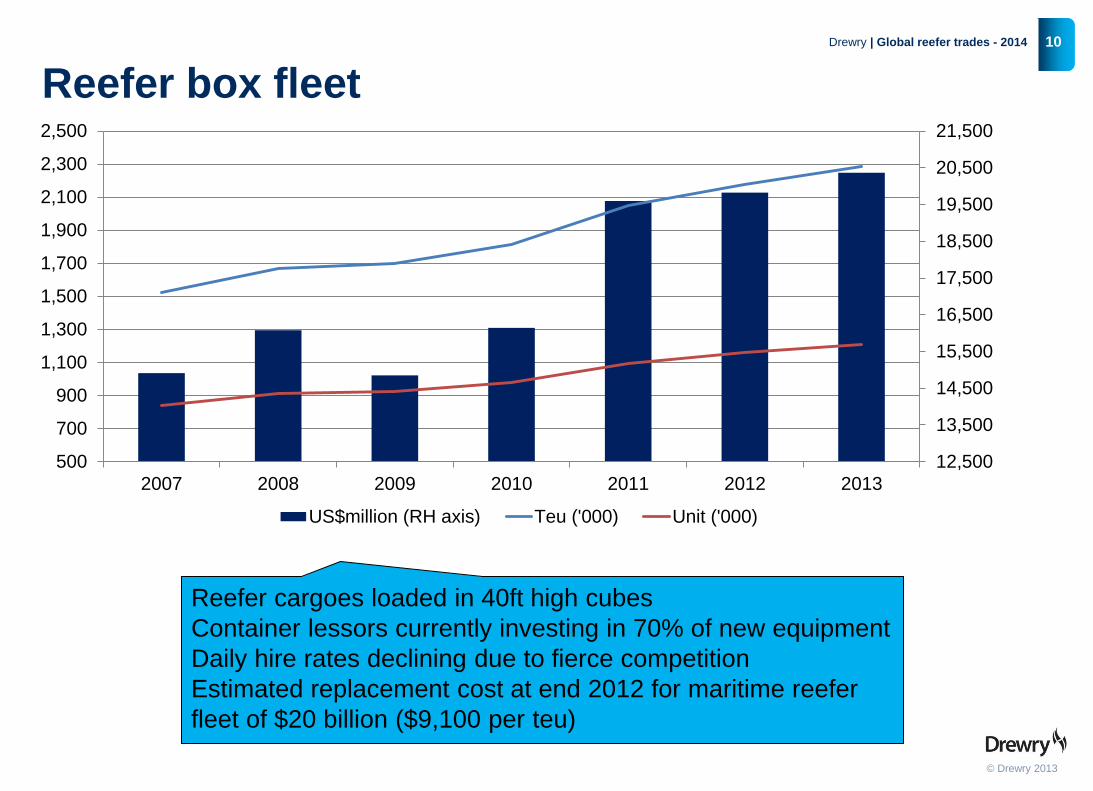
Reefer box fleet
Reefer cargoes loaded in 40ft high cubes
Container lessors currently investing in 70% of new equipment
Daily hire rates declining due to fierce competition
Estimated replacement cost at end 2012 for maritime reefer
fleet of $20 billion ($9,100 per teu)
12,500
13,500
14,500
15,500
16,500
17,500
18,500
19,500
20,500
21,500
500
700
900
1,100
1,300
1,500
1,700
1,900
2,100
2,300
2,500
2007 2008 2009 2010 2011 2012 2013
US$million (RH axis) Teu ('000) Unit ('000)
© Drewry 2013
11 Drewry | Global reefer trades - 2014
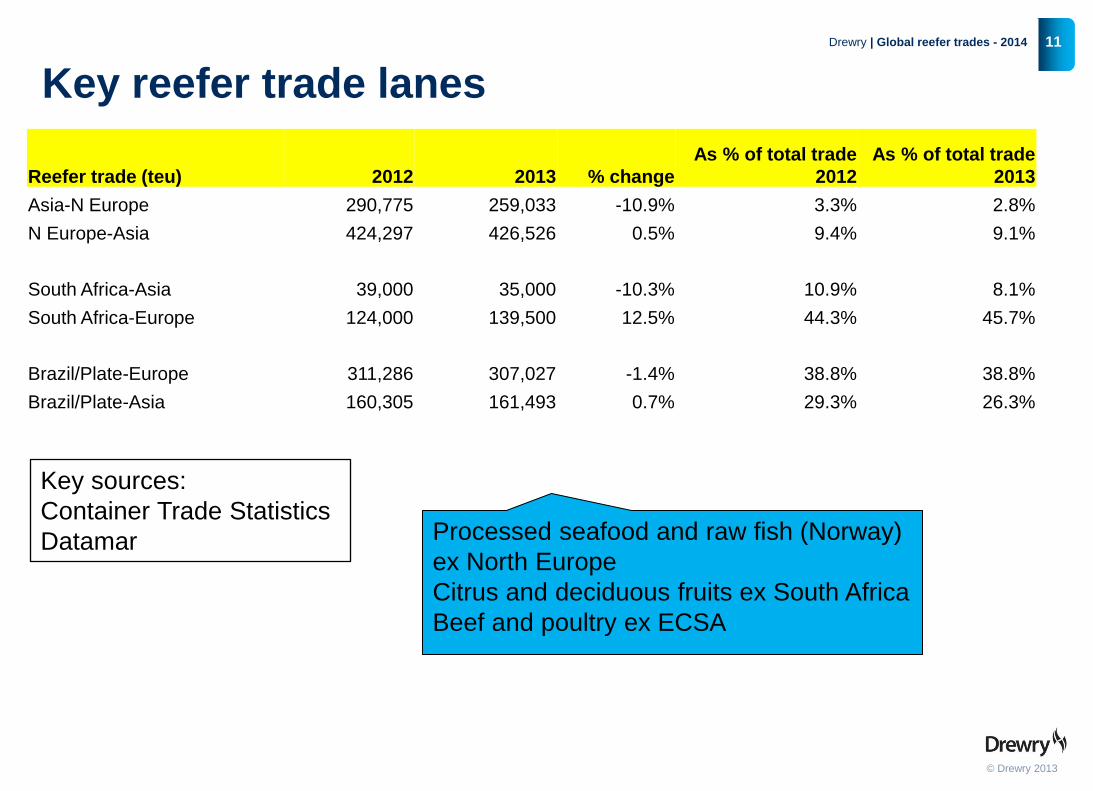
Key reefer trade lanes
Processed seafood and raw fish (Norway)
ex North Europe
Citrus and deciduous fruits ex South Africa
Beef and poultry ex ECSA
Key sources:
Container Trade Statistics
Datamar
Reefer trade (teu) 2012 2013 % change
As % of total trade
2012
As % of total trade
2013
Asia-N Europe 290,775 259,033 -10.9% 3.3% 2.8%
N Europe-Asia 424,297 426,526 0.5% 9.4% 9.1%
South Africa-Asia 39,000 35,000 -10.3% 10.9% 8.1%
South Africa-Europe 124,000 139,500 12.5% 44.3% 45.7%
Brazil/Plate-Europe 311,286 307,027 -1.4% 38.8% 38.8%
Brazil/Plate-Asia 160,305 161,493 0.7% 29.3% 26.3%
© Drewry 2013
12
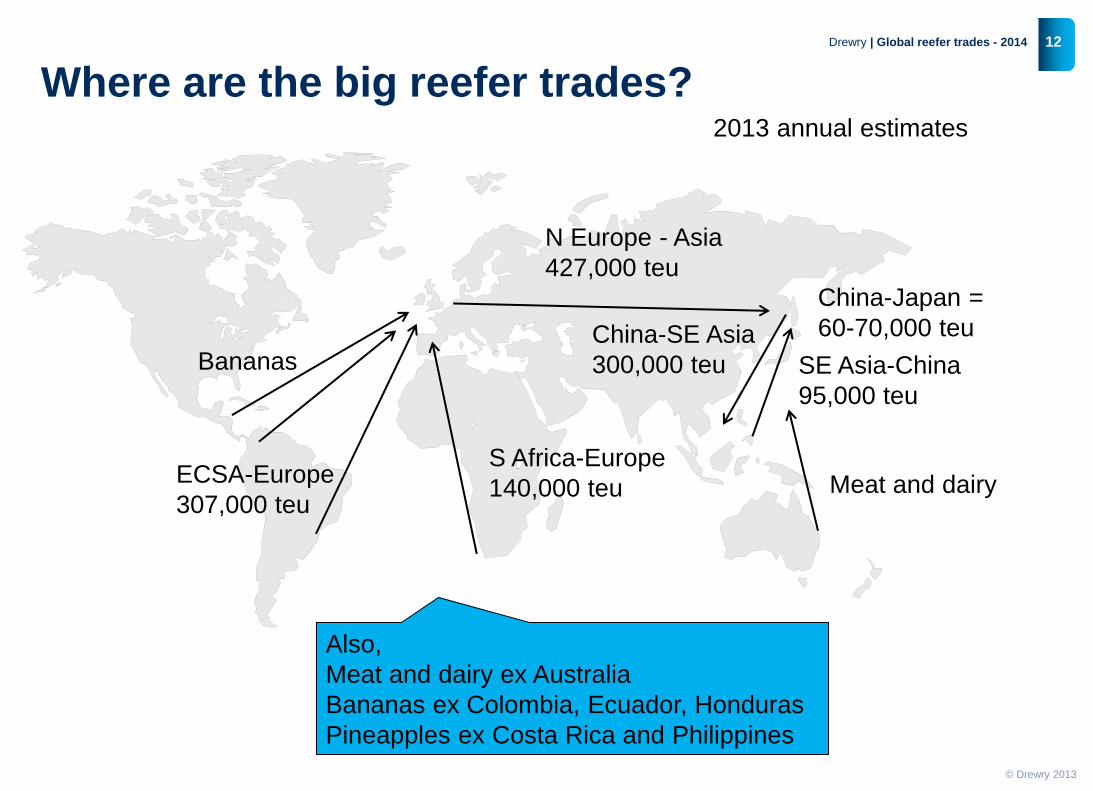
Where are the big reefer trades?
Drewry | Global reefer trades - 2014
N Europe - Asia
427,000 teu
S Africa-Europe
140,000 teu ECSA-Europe
307,000 teu
China-SE Asia
300,000 teu SE Asia-China
95,000 teu
2013 annual estimates
Also,
Meat and dairy ex Australia
Bananas ex Colombia, Ecuador, Honduras
Pineapples ex Costa Rica and Philippines
Meat and dairy
Bananas
China-Japan =
60-70,000 teu
© Drewry 2013
13 Drewry | Global reefer trades - 2014
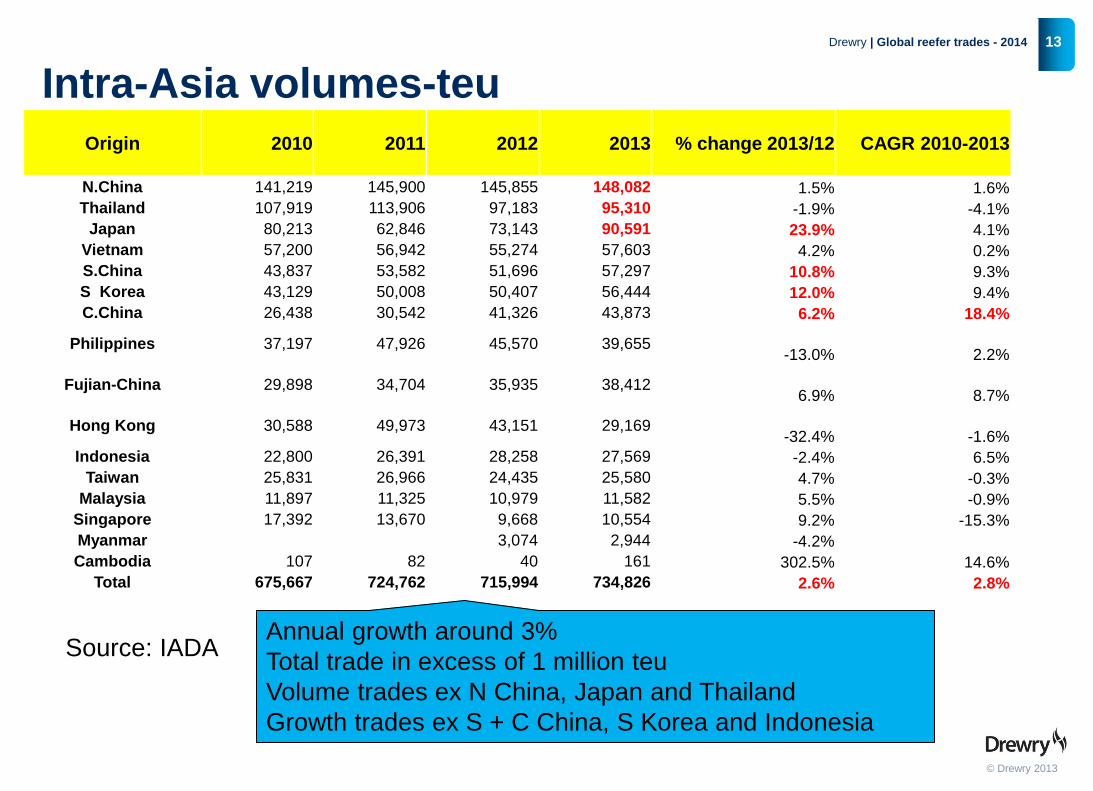
Intra-Asia volumes-teu
Origin 2010 2011 2012 2013 % change 2013/12 CAGR 2010-2013
N.China 141,219 145,900 145,855 148,082 1.5% 1.6%
Thailand 107,919 113,906 97,183 95,310 -1.9% -4.1%
Japan 80,213 62,846 73,143 90,591 23.9% 4.1%
Vietnam 57,200 56,942 55,274 57,603 4.2% 0.2%
S.China 43,837 53,582 51,696 57,297 10.8% 9.3%
S Korea 43,129 50,008 50,407 56,444 12.0% 9.4%
C.China 26,438 30,542 41,326 43,873 6.2% 18.4%
Philippines 37,197 47,926 45,570 39,655 -13.0% 2.2%
Fujian-China 29,898 34,704 35,935 38,412 6.9% 8.7%
Hong Kong 30,588 49,973 43,151 29,169 -32.4% -1.6%
Indonesia 22,800 26,391 28,258 27,569 -2.4% 6.5%
Taiwan 25,831 26,966 24,435 25,580 4.7% -0.3%
Malaysia 11,897 11,325 10,979 11,582 5.5% -0.9%
Singapore 17,392 13,670 9,668 10,554 9.2% -15.3%
Myanmar 3,074 2,944 -4.2%
Cambodia 107 82 40 161 302.5% 14.6%
Total 675,667 724,762 715,994 734,826 2.6% 2.8%
Annual growth around 3%
Total trade in excess of 1 million teu
Volume trades ex N China, Japan and Thailand
Growth trades ex S + C China, S Korea and Indonesia
Source: IADA
© Drewry 2013
14 Drewry | Global reefer trades - 2014
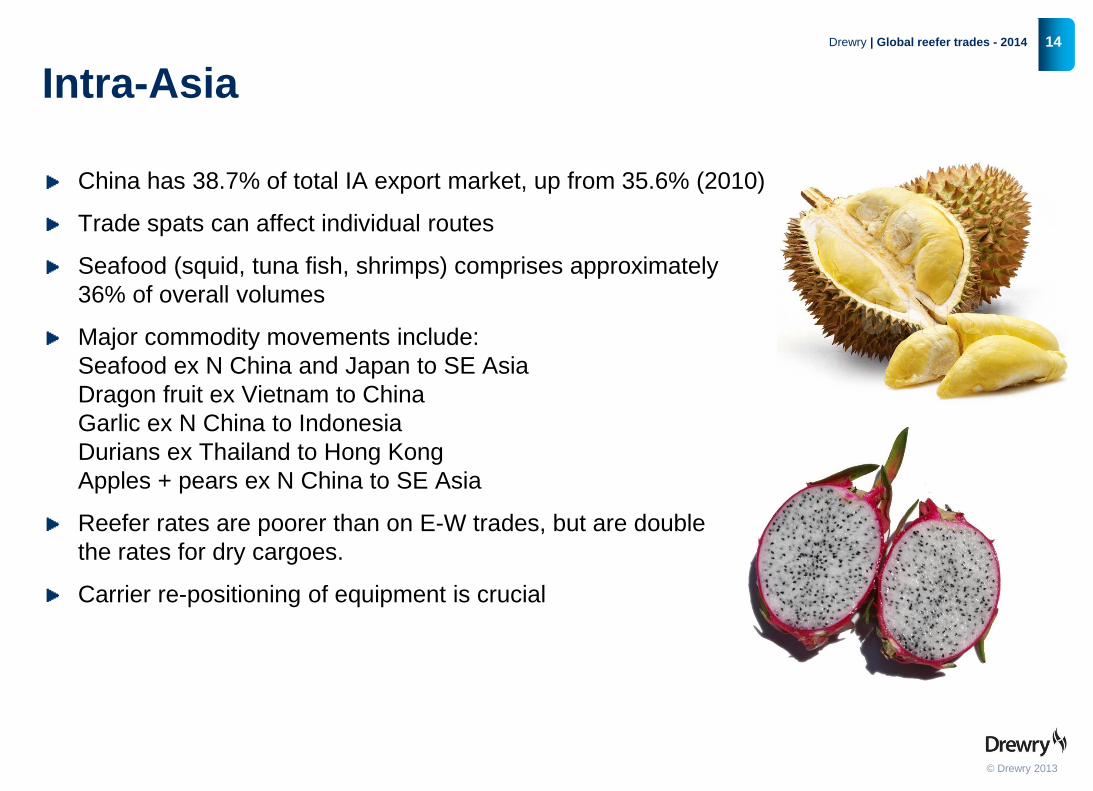
Intra-Asia
China has 38.7% of total IA export market, up from 35.6% (2010)
Trade spats can affect individual routes
Seafood (squid, tuna fish, shrimps) comprises approximately
36% of overall volumes
Major commodity movements include:
Seafood ex N China and Japan to SE Asia
Dragon fruit ex Vietnam to China
Garlic ex N China to Indonesia
Durians ex Thailand to Hong Kong
Apples + pears ex N China to SE Asia
Reefer rates are poorer than on E-W trades, but are double
the rates for dry cargoes.
Carrier re-positioning of equipment is crucial
© Drewry 2013
15 Drewry | Global reefer trades - 2014
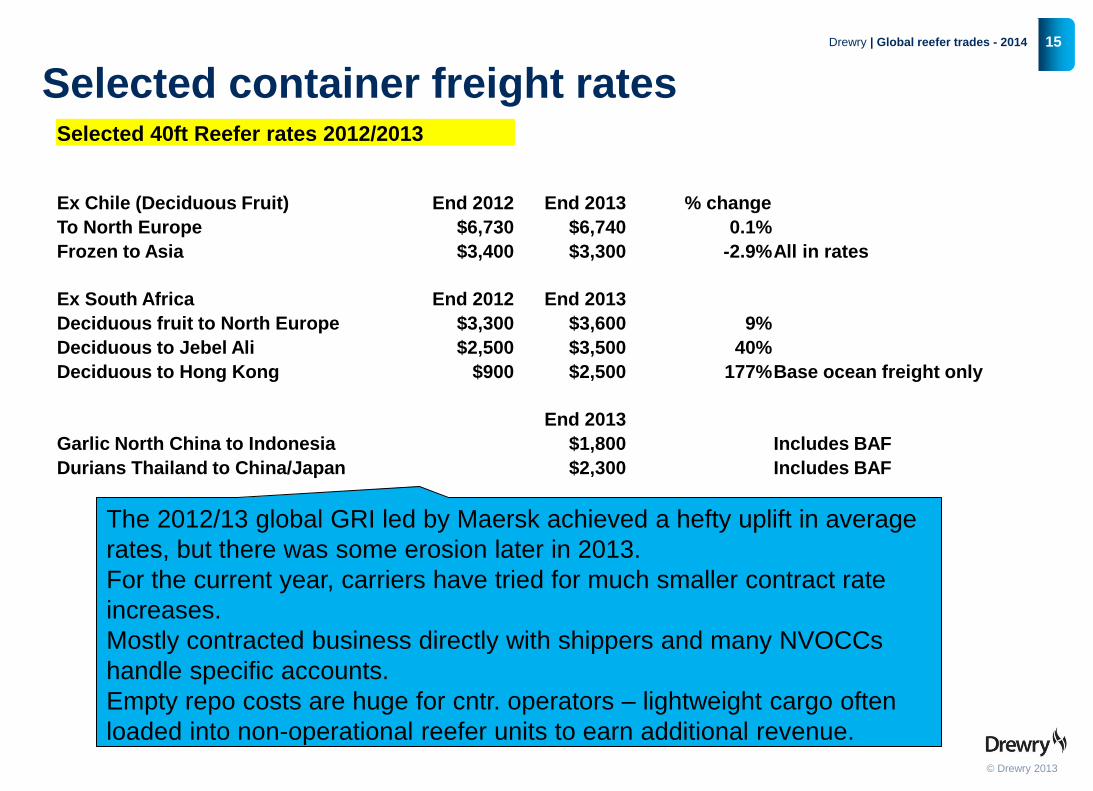
Selected container freight rates
The 2012/13 global GRI led by Maersk achieved a hefty uplift in average
rates, but there was some erosion later in 2013.
For the current year, carriers have tried for much smaller contract rate
increases.
Mostly contracted business directly with shippers and many NVOCCs
handle specific accounts.
Empty repo costs are huge for cntr. operators – lightweight cargo often
loaded into non-operational reefer units to earn additional revenue.
Selected 40ft Reefer rates 2012/2013
Ex Chile (Deciduous Fruit) End 2012 End 2013 % change
To North Europe $6,730 $6,740 0.1%
Frozen to Asia $3,400 $3,300 -2.9% All in rates
Ex South Africa End 2012 End 2013
Deciduous fruit to North Europe $3,300 $3,600 9%
Deciduous to Jebel Ali $2,500 $3,500 40%
Deciduous to Hong Kong $900 $2,500 177% Base ocean freight only
End 2013
Garlic North China to Indonesia $1,800 Includes BAF
Durians Thailand to China/Japan $2,300 Includes BAF
© Drewry 2013
16 Drewry | Global reefer trades - 2014
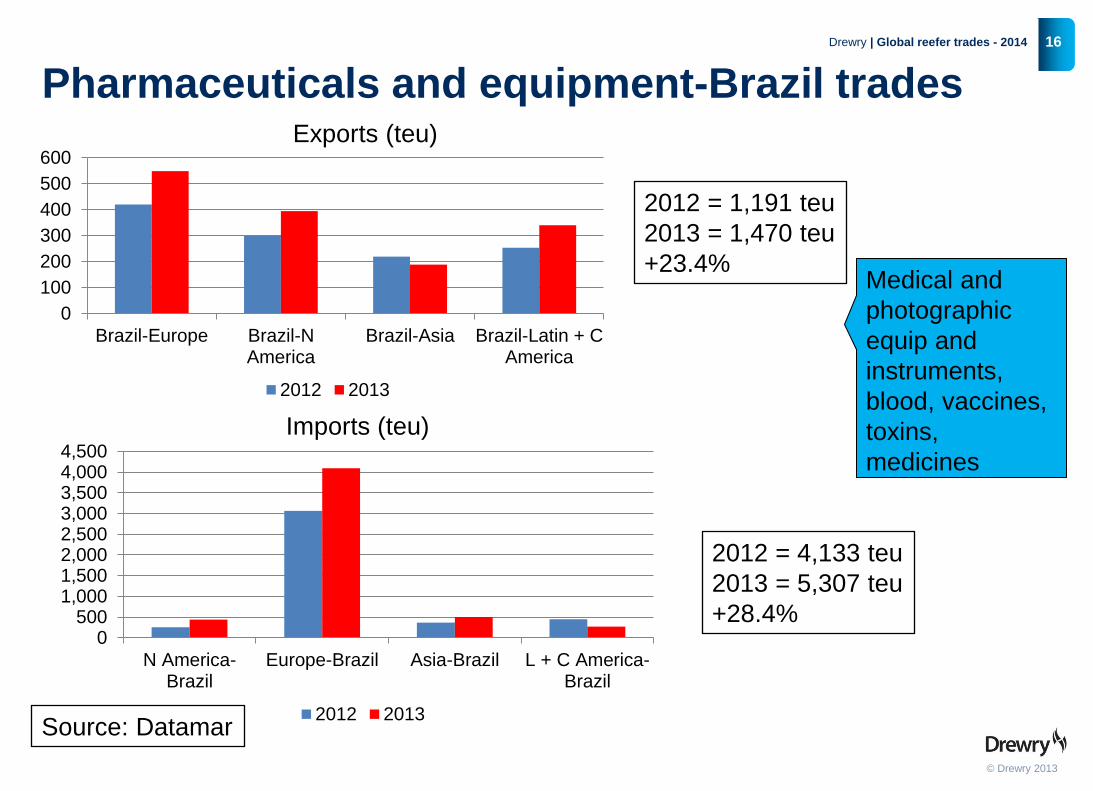
Pharmaceuticals and equipment-Brazil trades
0
100
200
300
400
500
600
Brazil-Europe Brazil-NAmerica
Brazil-Asia Brazil-Latin + CAmerica
2012 2013
0500
1,0001,5002,0002,5003,0003,5004,0004,500
N America-Brazil
Europe-Brazil Asia-Brazil L + C America-Brazil
2012 2013
2012 = 1,191 teu
2013 = 1,470 teu
+23.4%
2012 = 4,133 teu
2013 = 5,307 teu
+28.4%
Exports (teu)
Imports (teu)
Medical and
photographic
equip and
instruments,
blood, vaccines,
toxins,
medicines
Source: Datamar
© Drewry 2013
17 Drewry | Global reefer trades - 2014
Key takeaways for 2014 and beyond
Specialist vessels are full and will continue to compete with container ships even though
rates are more expensive
Fast growth of containerised reefer capacity and box fleet – exceeds cargo growth
Containers dominate reefer shipping
Container services specifically built around reefer cargo flows
Worldwide seaborne trade of perishable reefer cargoes is a positive growth market
New growth commodity sectors appearing – pharmaceuticals
Exotic fruits are growing fast (avocadoes, pineapples, kiwi fruit)
Freight rates should increase by relatively small margins only this year
Considerable investment by container operators on vessels and equipment

© Drewry 2013
18 Drewry | Global reefer trades - 2014
Thank you!
Maritime research and publications
Bespoke consultancy
Investment advisory
Maritime Equity research
World Container Index
Our services include:
Providing maritime intelligence for over 40 years
Unique expertise of shipping industry senior executives and knowledge base
www.drewry.co.uk