Global Ports Investments PLC Global Ports to acquire … Ports Investments PLC Global Ports to...
41
Page 1 For immediate release 02 September 2013 Global Ports Investments PLC Global Ports to acquire NCC Group Limited Global Ports Investments PLC (“Global Ports” or the “Company”, together with its subsidiaries and joint ventures, the “Group”; LSE ticker: GLPR) today announces that it has entered into binding arrangements to acquire 100% of the share capital of NCC Group Limited (together with its subsidiaries the “NCC Group”), for a cash consideration of USD 291.0 million and new shares representing approximately 18% 1 of the enlarged share capital of Global Ports 2 to be issued to Ilibrinio Establishment Limited and Polozio Enterprises Limited (the “Sellers”) in equal proportions (the “Transaction”). The acquisition of NCC Group, the second largest container terminals operator in Russia 3 , strengthens Global Ports’ leading position in the growing Russian container market and provides potential for greater operational efficiency through improved terminal network management and a reduction in overhead costs as well as the centralisation of support functions. In addition, the enlarged group will have approximately 1.12 4 million TEU of available capacity enabling it to accommodate throughput growth while reducing the Group’s CAPEX outlays for the next few years. The combination of NCC Group and Global Ports will enable shipping line customers to benefit from network savings through improved call rationalization, improved berth utilisation and enhanced productivity. NCC Group’s container terminal operations are located on the Baltic Sea, the principal gateway for Russian containerized cargo. Its key assets include 100% ownership of First Container Terminal (“FCT”) in St. Petersburg, 80% ownership of the recently launched Ust-Luga Container Terminal (“ULCT”) in the port of Ust-Luga and 100% ownership of Logistika-Terminal (“LT”), an inland container terminal located close to St. Petersburg which serves primarily as an inland container yard for FCT. As at the end of 2012 NCC Group’s marine terminals’ annual container handling capacity was approximately 1.69 million TEUs which can be significantly expanded in response to market demand. NCC Group’s inland container facility has a capacity of 200,000 TEUs. In 2012 NCC Group generated revenues of USD 253 million and Adjusted EBITDA of USD 164 million 5 . The Transaction also includes a call option for Global Ports to acquire 50% of the Illichevsk Container Terminal (“CTI”) for the strike price of USD 60 million 6 from NCC Group's current shareholders. The term of the call option is three years following the closing of the Transaction. CTI, which is located on the Black Sea, has a market share 7 of the Ukrainian container handling market of approximately 30%. As part of the Transaction, at closing, the Sellers will transfer loans provided to their related parties by NCC Group to Global Ports in the amount of USD 568.2 million and the interest accrued for the period from 31 December 2012 until the closing. Further, USD 155 million of loans outstanding from the related 1 On a fully diluted basis, consisting of 103,170,730 shares of Global Ports (market value of USD 361.1 million based on a GDR price of USD 10.50 per GDR on the London Stock Exchange as of 30 August 2013) of which 50% will be voting shares and 50% will be non-voting shares. 2 50% of the equity component (i.e. 9% of new Global Ports’ shares) will be in the form of GDRs representing ordinary voting shares (corresponding to approximately 15% of Global Ports’ enlarged voting share capital) and the other 50% will be issued as non-voting shares. 3 By 2012 throughput, according to the Association of Sea Commercial Ports (“ASOP”). 4 Calculated as NCC Group’s and the Group’s marine terminal's container handling capacity as of 31 December 2012 less combined maritime container throughput in 2012. 5 See Appendix 2. 6 Adjusted for the proportionate amount of the net debt at the time of exercise. 7 Source: http://portsukraine.com/
Transcript of Global Ports Investments PLC Global Ports to acquire … Ports Investments PLC Global Ports to...
Page 1
For immediate release 02 September 2013
Global Ports Investments PLC
Global Ports to acquire NCC Group Limited
Global Ports Investments PLC (“Global Ports” or the “Company”, together with its subsidiaries and joint
ventures, the “Group”; LSE ticker: GLPR) today announces that it has entered into binding arrangements to
acquire 100% of the share capital of NCC Group Limited (together with its subsidiaries the “NCC Group”),
for a cash consideration of USD 291.0 million and new shares representing approximately 18%1 of the
enlarged share capital of Global Ports2 to be issued to Ilibrinio Establishment Limited and Polozio
Enterprises Limited (the “Sellers”) in equal proportions (the “Transaction”).
The acquisition of NCC Group, the second largest container terminals operator in Russia3, strengthens
Global Ports’ leading position in the growing Russian container market and provides potential for greater
operational efficiency through improved terminal network management and a reduction in overhead costs
as well as the centralisation of support functions. In addition, the enlarged group will have approximately
1.124 million TEU of available capacity enabling it to accommodate throughput growth while reducing the
Group’s CAPEX outlays for the next few years. The combination of NCC Group and Global Ports will
enable shipping line customers to benefit from network savings through improved call rationalization,
improved berth utilisation and enhanced productivity.
NCC Group’s container terminal operations are located on the Baltic Sea, the principal gateway for Russian
containerized cargo. Its key assets include 100% ownership of First Container Terminal (“FCT”) in St.
Petersburg, 80% ownership of the recently launched Ust-Luga Container Terminal (“ULCT”) in the port of
Ust-Luga and 100% ownership of Logistika-Terminal (“LT”), an inland container terminal located close to
St. Petersburg which serves primarily as an inland container yard for FCT. As at the end of 2012 NCC
Group’s marine terminals’ annual container handling capacity was approximately 1.69 million TEUs which
can be significantly expanded in response to market demand. NCC Group’s inland container facility has a
capacity of 200,000 TEUs. In 2012 NCC Group generated revenues of USD 253 million and Adjusted
EBITDA of USD 164 million5.
The Transaction also includes a call option for Global Ports to acquire 50% of the Illichevsk Container
Terminal (“CTI”) for the strike price of USD 60 million6 from NCC Group's current shareholders. The term
of the call option is three years following the closing of the Transaction. CTI, which is located on the Black
Sea, has a market share7 of the Ukrainian container handling market of approximately 30%.
As part of the Transaction, at closing, the Sellers will transfer loans provided to their related parties by
NCC Group to Global Ports in the amount of USD 568.2 million and the interest accrued for the period
from 31 December 2012 until the closing. Further, USD 155 million of loans outstanding from the related
1 On a fully diluted basis, consisting of 103,170,730 shares of Global Ports (market value of USD 361.1 million based on a GDR price
of USD 10.50 per GDR on the London Stock Exchange as of 30 August 2013) of which 50% will be voting shares and 50% will be non-voting shares. 2 50% of the equity component (i.e. 9% of new Global Ports’ shares) will be in the form of GDRs representing ordinary voting shares
(corresponding to approximately 15% of Global Ports’ enlarged voting share capital) and the other 50% will be issued as non-voting shares. 3 By 2012 throughput, according to the Association of Sea Commercial Ports (“ASOP”). 4 Calculated as NCC Group’s and the Group’s marine terminal's container handling capacity as of 31 December 2012 less combined maritime container throughput in 2012. 5 See Appendix 2. 6 Adjusted for the proportionate amount of the net debt at the time of exercise. 7 Source: http://portsukraine.com/

Page 2
parties of the Sellers as of 31 December 2012 together with USD 17 million of further loans advanced
during 2013 and all accrued interest thereto are to be set-off against non-cash dividends to be declared by
NCC Group.
The Sellers are expected to receive two seats (one each) on the Board of Directors without any special
voting or veto rights. The Sellers will be subject to certain non-compete restrictions for as long as they have
rights to board representation and will cease to be entitled to board representation if they sell any of the
interests in the Company they received as a consideration in the Transaction. The non-compete restrictions
will remain in effect for a two year period after the Sellers cease to have board representation. All the
Global Ports' shares received by the Sellers as a consideration in the Transaction (representing
approximately 18% of Global Ports’ enlarged share capital) will be locked up for 6 months following
completion. This lock up will extend for an additional 18 months with respect to a portion of such of shares
(representing approximately 10% of Global Ports’ enlarged share capital). Transportation Investments
Holding Limited (“TIHL”) and APM Terminals B.V. (“APM Terminals”) have pre-emptive rights over any
Sellers’ disposals of these shares.
The Transaction has been approved by the Board of Directors of Global Ports. In connection with such
approval, Deutsche Bank provided an opinion addressed to the Board of Directors of Global Ports as to
whether the consideration to be paid by Global Ports pursuant to the Transaction is fair, from a financial
point of view, to Global Ports. The increase in the authorised share capital of Global Ports is subject to
approval at an Extraordinary General Meeting to be held on 27 September 2013.
The cash element of the Transaction will be financed through bank financing. The transaction is expected
to complete by the end of 2013, subject to customary conditions precedent, including regulatory approvals
and the issuance of a prospectus for the enlarged Global Ports Group approved by the UK Listing
Authority.
The Company is today also releasing the consolidated financial statements of NCC Group for the years
ended 31 December 2012, 2011 and 2010 in a separate announcement.
Nikita Mishin, Chairman of the Board of Global Ports, commented:
“By acquiring NCC Group and bringing the two companies together, Global Ports confirms its market
leadership and creates a company with an enviable position in the high-growth Russian container market.
NCC Group is not only considered to be one of the best container terminal operators in Russia and Eastern
Europe, it is also highly profitable with a track record of more than 10 years of excellent performance.
Global Ports’ development over the past five years has made it possible for us to seize this unique
opportunity. The decision to list the company in London in 2011, the improved access to capital alongside
its cash-generative operations and the introduction of APM Terminals, a major international ports operator,
into the shareholder base have all played key roles. We believe we have strengths and competencies that
few can replicate and therefore have an unparalleled ability to capitalise on the opportunities that we see
ahead to create significant value for the Group and all of its stakeholders.”
Further information is available in the following Appendices
Appendix 1: Extracts from the Financial Statements of the NCC Group for 2010-2012
Appendix 2: Management’s Discussion and Analysis of Financial Condition and Results of Operations
of NCC Group Limited and its Consolidated Subsidiaries
Appendix 3: Unaudited Selected Illustrative Combined Financial Metrics
Appendix 4: Declarations with regard to information
Appendix 5: Presentation of information and definitions
Appendix 6: Investor Presentation

Page 3
Analyst and investor conference call
A slide presentation for the analyst and investor conference call is available as Appendix 6 to this
presentation and is available at www.globalports.com.
The analyst and investor conference call will be hosted by:
Nikita Mishin, Chairman of the Board of Global Ports
Kim Fejfer, Vice Chairman of the Board of Global Ports and CEO of APM Terminals
Alexander Nazarchuk, CEO of Global Ports
Oleg Novikov, CFO of Global Ports
Roy Cummins, Chief Commercial Officer of Global Ports
And will be held on 02 September 2013 at 11.00am London time / 14.00pm Moscow time. To participate in
the conference call, please dial one of the following numbers and ask to be put through to the “Global
Ports” call:
UK toll free: 0808 109 0700
International: +44 (0) 20 3003 2666
There will also be a webcast of the call, available through the Global Ports’ website
(www.globalports.com). Please note that this will be a listen-only facility.
A replay of the conference call will also be available shortly after the conclusion of the call on the Global
Ports website.
ENQUIRIES
Global Ports Investor Relations
Mikhail Grigoriev
+357 25 503 163
Email: [email protected]
Global Ports Media Relations
Anna Vostrukhova
+357 25 503 163
E-mail: [email protected]
StockWell Communications
Laura Gilbert/ Zoe Watt
+44 20 7240 2486
E-mail: [email protected]
NOTES TO EDITORS
Global Ports
Global Ports Investments PLC is the leading operator of container terminals in the Russian market.
Global Ports' terminals are located in the Baltic and Far East Basins, key regions for foreign trade cargo
flows. Global Ports operates three container terminals in Russia (Petrolesport and Moby Dik in St.
Petersburg, Vostochnaya Stevedoring Company in the Vostochny Port) and two container terminals in
Page 4
Finland (Multi-Link Terminals Helsinki and Multi-Link Terminals Kotka). Global Ports group also owns
75% in Yanino Logistics Park, located in the vicinity of St. Petersburg, and a 50% share in the major oil
product terminal, AS Vopak E.O.S., in Estonia.
Global Ports' consolidated revenue8 for 2012 was USD 501.8 million. Adjusted EBITDA for 2012 was
USD 288 million. The Group's Russian Ports segment handled a total container throughput of
approximately 1.45 million TEUs in 2012 (excluding Yanino).
Global Ports major shareholders are Transportation Investments Holding Limited (operating under the
brand name of N-Trans), one of the largest private transportation and infrastructure groups in Russia
(37.5%), and APM Terminals B.V., whose core expertise is the design, construction, management and
operation of ports, terminals and inland services with a global terminal network of 62 operating port
facilities and 160 Inland Services operations, giving APM Terminals a global presence in 68 countries
(37.5%). The remaining 25% of Global Ports shares are in public hands and held in the form of global
depositary receipts listed on the Main Market of the London Stock Exchange (LSE ticker: GLPR).
For more information please see: www.globalports.com
NCC Group
NCC Group Limited was founded in 2002 and is the second largest container terminal operator in Russia,
by gross throughput in 2012, according to ASOP. Its key assets include 100% of the First Container
Terminal in St. Petersburg, 80% of the recently launched Ust-Luga Container Terminal in the port of Ust-
Luga and 100% of Logistika-Terminal, an inland container terminal close to St. Petersburg. NCC Group’s
container terminal operations are located on the Baltic Sea, one of the key gateways for Russian container
cargo. NCC Group's marine terminals had an annual container handling capacity of approximately 1.69
million TEUs and have the potential to be expanded to accommodate increases in demand for container
handling services in the Baltic region of Russia. The annual capacity of NCC Group’s inland container
facility, LT, currently amounts to 200 thousand TEUs.
NCC Group’s marine container terminals had a total container throughput of approximately 1,069 thousand
TEUs in 2012. In the first six months of 2013, NCC Group’s marine terminals handled approximately 561
thousand TEUs, which represented growth of approximately 7% compared to the first six months of 2012.
In 2012, NCC Group’s consolidated revenue and Adjusted EBITDA were USD 253.3 million and
USD 164 million, respectively.
LEGAL DISCLAIMER
Some of the information in these materials may contain projections or other forward-looking statements
regarding future events or the future financial performance of the Company. You can identify forward
looking statements by terms such as "expect", "believe", "anticipate", "estimate", "intend", "will", "could,"
"may" or "might" or the negative of such terms or other similar expressions. The Company wishes to
caution you that these statements are only predictions and that actual events or results may differ
materially. The Company does not intend to update these statements to reflect events and circumstances
occurring after the date hereof or to reflect the occurrence of unanticipated events. Many factors could
cause the actual results to differ materially from those contained in projections or forward-looking
statements of the Company, including, among others, general economic conditions, the competitive
environment, risks associated with operating in Russia and market change in the industries the Company
operates in, as well as many other risks specifically related to the Company and its operations, including the
completion of the acquisition of NCC Group and the Company’s ability to realise the benefits of that
acquisition.
8 According to the consolidated financial statements of Global Ports as of and the year ended 31 December 2012.

Page 5
APPENDIX 1: EXTRACTS FROM THE FINANCIAL STATEMENTS OF NCC GROUP FOR
2012-2010
NCC Group Selected Financial Information
The selected consolidated financial information on NCC Group set out below, as at and for each of the
three years ended 31 December 2012, 2011 and 2010, has been extracted from the audited consolidated
financial statements of NCC Group which were made available to the Company. Those financial statements
were prepared in accordance with IFRS as adopted by the EU.
NCC Group Limited key financials
For the year ended 31 December
2012 2011 2010
(USD thousand)
Consolidated Statement of Comprehensive income
Revenue .................................................................................... 253,291 317,539 260,215
Cost of sales .............................................................................. (67,817) (64,322) (57,590)
Gross profit ............................................................................... 185,474 253,217 202,625
Depreciation and amortization expenses ................................... (33,400) (20,141) (18,045)
Selling, general and administrative expenses ............................ (14,436) (15,147) (14,904)
Other (expenses)/income, net .................................................... (6,154) 9,702 (6,777)
Finance income ......................................................................... 39,994 54,892 5,974
Finance costs ............................................................................. (71,973) (57,286) (8,329)
Foreign exchange gain / (loss), net ........................................... 7,848 (10,059) 3,550
Profit before income tax expense .............................................. 107,353 215,178 164,094
Income tax expense ................................................................... (27,680) (30,735) (22,776)
Profit for the year ...................................................................... 79,673 184,443 141,318

Page 6
As at 31 December
2012 2011 2010
(USD thousand)
Consolidated Statement of Financial Position
NON-CURRENT ASSETS
Goodwill ........................................................................... 106,127 100,117 105,765
Property, plant and equipment .......................................... 579,478 557,044 512,531
Finance lease receivables .................................................. 1,833 - -
Other intangible assets ...................................................... - - 1,580
Loans receivable ............................................................... 568,271 539,502 755,443
Deferred tax assets ............................................................ 324 576 284
Other non-current assets ................................................... 1,741 3,638 12,266
Total non-current assets .................................................... 1,257,774 1,200,877 1,387,869
CURRENT ASSETS
Inventories ........................................................................ 3,064 2,810 3,214
Trade and other receivables .............................................. 19,844 25,591 27,531
Advances paid and prepaid expenses ................................ 3,306 3,770 4,462
Finance lease receivables .................................................. 480 - -
Taxes reimbursable and prepaid........................................ 3,807 31,981 10,429
Prepaid current income tax ............................................... 2,404 - -
Loans receivable ............................................................... 154,988 176,244 92
Cash and cash equivalents................................................. 36,971 60,388 27,415
Total current assets ........................................................... 224,864 300,784 73,143
TOTAL ASSETS .............................................................. 1,482,638 1,501,661 1,461,012
EQUITY AND LIABILITIES
SHAREHOLDERS’ EQUITY
Share capital ...................................................................... 9 9 9
Share premium .................................................................. 294,995 294,995 294,995
Retained earnings .............................................................. 194,303 192,983 111,275
Foreign currency translation reserve ................................. (50,463) (68,174) (48,619)
Equity attributable to shareholders of the Parent .............. 438,844 419,813 357,660
Non-controlling interests .................................................. (8,229) (1,547) (8,005)
Total shareholders' equity ................................................. 430,615 418,266 349,655
NON-CURRENT LIABILITIES
Loans and borrowings ....................................................... 700,706 970,089 886,527
Deferred tax liabilities....................................................... 36,953 30,474 30,493
Long-term obligations under finance leases ...................... 2,094 - -
Total non-current liabilities ............................................... 739,753 1,000,563 917,020
CURRENT LIABILITIES
Trade and other payables .................................................. 3,139 3,650 1,886
Loans and borrowings ....................................................... 303,035 71,647 174,870
Taxes payable ................................................................... 1,576 2,711 12,132
Current income tax payable - 1,266 2,903
Obligations under finance lease ........................................ 402 - -
Other current liabilities and accrued expenses .................. 4,118 3,558 2,546
Total current liabilities ...................................................... 312,270 82,832 194,337
Total liabilities .................................................................. 1,052,023 1,083,395 1,111,357
TOTAL SHAREHOLDERS' EQUITY AND
LIABILITIES ...................................................................
1,482,638
1,501,661
1,461,012
For the year ended 31 December

Page 7
2012 2011 2010
(USD thousand)
Consolidated Statement of Cash Flows
CASH FLOWS FROM OPERATING ACTIVITIES
Receipts from customers .................................................... 265,205 329,141 286,338
Other receipts ..................................................................... 36,820 25,423 15,916
Payments to suppliers and employees ................................ (74,827) (76,073) (96,996)
Other payments .................................................................. (27,368) (48,689) (21,264)
Cash generated from operations ......................................... 199,830 229,802 183,994
Interest paid ....................................................................... (66,943) (77,226) (10,795)
Income tax paid .................................................................. (26,789) (30,357) (22,110)
Net cash generated from operating activities ..................... 106,098 122,219 151,089
CASH FLOWS FROM INVESTING ACTIVITIES
Purchases of property, plant and equipment ...................... (18,490) (84,017) (45,212)
Cash received on settlement of loans receivable and time
deposits .............................................................................. 20,000 221,771 8,072
Payments of loans receivable and time deposits ................ (33,000) (182,532) (713,649)
Acquisition of subsidiary under common control .............. (237) - -
Interest received ................................................................. 1,010 365 1,718
Proceeds from disposal of property, plant and equipment . - - 787
Net cash used in investing activities .................................. (30,717) (44,413) (748,284)
CASH FLOWS FROM FINANCING ACTIVITIES
Proceeds from borrowings ................................................. 117,000 340,105 855,734
Principal payments on borrowings ..................................... (171,592) (329,724) (54,292)
Payments for finance lease ................................................. (475) - -
Proceeds from finance sublease ......................................... 432 - -
Dividends paid ................................................................... (44,000) (49,400) (217,950)
Distributions to shareholders paid ...................................... - - (7,065)
Net cash (used in) / generated by financing activities ........ (98,635) (39,019) 576,427
NET (DECREASE) / INCREASE IN CASH AND CASH
EQUIVALENTS ................................................................ (23,254) 38,787 (20,768)
Effect of foreign exchange rate changes ............................ (163) (5,814) (179)
CASH AND CASH EQUIVALENTS, at the beginning of
the year .............................................................................. 60,388 27,415 48,362
CASH AND CASH EQUIVALENTS, at the end of the
year .................................................................................... 36,971 60,388 27,415
The Company is not aware of any significant differences between the accounting policies of NCC Group
compared to the accounting policies of the Group except for differences in presentation and classification
of financial statement line items.

Page 8
APPENDIX 2: MANAGEMENT’S DISCUSSION AND ANALYSIS OF FINANCIAL CONDITION
AND RESULTS OF OPERATIONS OF NCC GROUP LIMITED AND ITS CONSOLIDATED
SUBSIDIARIES
This appendix should be read in conjunction with Appendix 5 (Presentation of information and definitions).
The financial information considered in Management’s Discussion and Analysis of Financial Condition
and Results of Operations is extracted from the consolidated financial statements of NCC Group Limited as
at and for the years ended 31 December 2010, 2011 and 2012. The consolidated financial statements
referred to in this discussion have been prepared in accordance with International Financial Reporting
Standards as adopted by the European Union (“IFRS”). This appendix also includes certain non-IFRS
financial information, identified using capitalised terms below. For further information on the calculation
of such non-IFRS financial information, see Appendix 5 (Presentation of information and definitions) and
the section entitled “Non-IFRS Measures: Adjusted EBITDA and Adjusted EBITDA Margin” below.
Readers of this appendix should read the entire announcement together with the consolidated financial
statements of NCC Group Limited as at and for the years ended 31 December 2010, 2011 and 2012 also
released on the date hereof, and not just rely on the summary information set out below.
The following discussion of NCC Group’s results of operations and financial conditions contains certain
forward-looking statements. NCC Group’s actual results could differ materially from those that it discusses
in these forward-looking statements. See also the discussion of forward-looking statements under the
heading “Legal Disclaimer” in the main body of this announcement.
OVERVIEW
NCC Group Limited (“NCCGL”), a company incorporated in Cyprus, together with its consolidated
subsidiaries (“NCC Group”) is the second largest container terminals operator in Russia, by gross container
throughput for 2012, according to the Association of Sea Commercial Ports (“ASOP”). Its key assets
include First Container Terminal (“FCT”) in St. Petersburg and the Ust-Luga Container Terminal
(“ULCT”), a green-field development in the port of Ust-Luga, as well as Logistika–Terminal (“LT”), an
inland container terminal close to St. Petersburg. NCC Group’s container terminal operations are located on
the Baltic Sea, one of the key gateways for Russian container cargo.
NCC Group was founded in 2002, initially consisting of the dedicated container terminal, FCT. This
terminal has demonstrated impressive volume growth, from approximately 439 thousand TEUs in 2002 to
959 thousand TEUs and 1,072 thousand TEUs in 2007 and 2008, respectively, approaching its full
operating capacity. FCT has operated at high capacity utilisation levels since 2008, with the exception of
decreases in capacity utilisation in 2009 due to the global economic slowdown. In response to these
potential capacity constraints, NCC Group constructed and developed both LT (which was launched in
2010) and ULCT (construction for which began in 2007 and which was launched in December 2011).
NCC Group’s marine container terminals had a gross container throughput of approximately 1,069
thousand TEUs in 2012, which represented a decrease of approximately 9% from 2011. In the first six
months of 2013, NCC Group’s marine terminals handled approximately 561 thousand TEUs, which
represented growth of approximately 7% compared to the first six months of 2012.
NCC Group estimates that its marine terminals had an annual container handling capacity of approximately
1,690 thousand TEUs as at 31 December 2012. NCC Group also has the ability to expand its capacity at
both FCT and ULCT to accommodate increasing demand for container handling services in the Baltic
region of Russia. The capacity of NCC Group’s inland container facility, LT, amounted to 200 thousand
TEUs as at 31 December 2012.
In 2012, NCC Group’s revenue and Adjusted EBITDA was USD 253.3 million and USD 164.0 million,
respectively.
NCC Group’s main operations consist of the following terminals.

Page 9
FCT
FCT was the largest container terminal in Russia by gross throughput for 2012, according to ASOP, and
also by capacity as at 31 December 2012, according to NCC Group’s estimates. It is located in the St.
Petersburg harbour, Russia’s primary gateway for container cargo and was one of the first specialised
container terminals to be established in the USSR. In the period between 2002 and 2008, NCC Group
implemented a major capital expenditure programme, modernising FCT’s facilities and improving its
efficiency, ultimately resulting in an increase in throughput capacity to approximately 1,250 thousand
TEUs. As at 31 December 2012, FCT’s annual container handling capacity was 1,250 thousand TEUs and
NCC Group estimates that the terminal has the potential to increase this capacity to 1,500 thousand TEUs,
subject to market demand. See also “—Capacity”.
FCT’s gross container throughput was 1,160 thousand TEUs, 1,174 thousand TEUs, 1,058 thousand TEUs
and 540 thousand TEUs in 2010, 2011, 2012 and in the first six months of 2013, respectively.
FCT covers a total area of 89 hectares, with four operating container quays totalling 780 metres in length
and a construction depth of up to 11.5 metres. FCT leases the site (other than the quays) from the City
Property Management Committee of St. Petersburg. FCT leases three of its operating quays from FSUE
Rosmorport under a long-term lease agreement which is currently due to expire in 2022, and one quay from
the Arctic and Antarctic Research Institute under a five year lease which is currently due to expire in
December 2013 but is expected to be extended by another five years before the completion of the
Transaction.
FCT has 3.3 kilometres of internal railway tracks, which can accommodate up to 114 flatcars. The terminal
has a container yard with 2,905 electrical plugs for refrigerated containers. FCT predominantly uses
straddle carrier and RTG technology for yard container handling operations. As at 30 June 2013, the key
equipment at the terminal included 8 STS cranes9, 1 MHC
10, 3 RMG
11 cranes, 19 RTG
12 cranes, 33 straddle
carriers and other equipment.
FCT is located in the Big Port of St. Petersburg cluster and has good railway connections, direct access to
major city roads, and access to the Western High-Speed Diameter road, which connects to the St.
Petersburg ring road and enables customers to bypass the city traffic. The terminal has 942 employees as at
30 June 2013. NCC Group controls 100% of FCT.
ULCT
ULCT is located in the large multi-purpose Ust-Luga port cluster on the Baltic Sea, 140 kilometres
westwards from St. Petersburg city ring road. ULCT began operations in December 2011 and has annual
gross container throughput capacity of 440 thousand TEUs with the potential to expand this capacity
significantly.
The Ust-Luga port cluster is the most western port in the Russian hinterland. It is estimated to be the largest
transportation infrastructure project in post-Soviet Russia and consists of several marine terminals and
related infrastructure, providing the location for a critical mass of shipping related operations. The project
has attracted significant State support, including for the development of the offshore navigational
infrastructure as well as onshore infrastructure and utilities. It offers several advantages to the Big Port of
St. Petersburg cluster, such as improved maritime navigation, with a wider two-way approaching channel, a
shorter ice period and deeper water access. ULCT is the only container terminal in the cluster. It is also
well-positioned to service industrial cargo flows to/from the central region of Russia, providing shorter
9 Ship-to-shore crane
10 Mobile harbour crane
11 Rail mounted gantry crane
12 Rubber-tyred gantry crane
Page 10
hinterland connections and better railway connectivity compared to other ports in the Baltic states.
ULCT’s customer base includes Unifeeder, Maersk, CMA CMG, Hapag Lloyd and Team Lines.
ULCT’s annual container handling capacity as at 31 December 2012 was 440 thousand TEUs. ULCT’s
gross container throughput was 11 thousand TEUs and 21 thousand TEUs in 2012 and in the first six
months of 2013, respectively. In addition, the average monthly gross container throughput at ULCT in the
first six months of 2013 was 3.5 thousand TEUs.
ULCT covers a total area of 40 hectares, with two container dedicated quays totalling 440 metres in length
and a construction depth of up to 13.5 metres. ULCT owns 2 hectares at the site, leases 32 hectares under a
long-term lease expiring in 2059 as well as 6 hectares of other land under short-term leases (subject to a 3
month termination notice with ULCT having a pre-emptive right to renew). ULCT has five internal railway
tracks of 525 metres (or 25 rail cars) each. It is designed to have 1,700 reefer plugs, of which 420 have
been commissioned and a further 420 require only relatively low additional expenditure to commission. As
at 30 June 2013, the key equipment at the terminal included 4 STS cranes, 2 RMG cranes, 11 RTG cranes
and other equipment. ULCT relies substantially on the railway transportation of containers, with
approximately 50% of its throughput in the first six month of 2013 transported by rail.
NCC Group controls 80% of ULCT. The remainder is controlled by the international container terminal
operator, Eurogate. In this appendix, all operational data for ULCT is shown on a 100% basis, unless
otherwise stated.
LT
LT’s inland multi-purpose container logistics complexes provide a comprehensive range of container and
logistics services at one location. LT started its operations in 2010 and owns 92 hectares of land, of which
approximately two-thirds is currently utilised. The site has good road and railway connections. It is directly
connected to the St. Petersburg city ring road and has access to an existing railway spur. The terminal is
located to the side of the St. Petersburg - Moscow road, approximately 17 kilometres from FCT.
LT was launched in 2010 at a time of storage capacity constraints at FCT. LT was primarily intended to
provide an off-dock facility for FCT customers and increase its service offering, including stuffing and un-
stuffing longer-term storage, and the ability to temporarily store large volumes of goods.
Its gross container throughput was approximately 113 thousand TEUs and 50 thousand TEUs in 2012 and
in the first six months of 2013, respectively.
The terminal comprises container yards with an annual container handling capacity of 200 thousand TEUs,
50 reefer container plugs, one heated warehouse of approximately 10,000 square metres, and one unheated
warehouse of approximately 6,000 square metres. LT has a customs office which enables import laden
containers to be transported between FCT and LT prior to customs clearance.
NCC Group controls 100% of LT.
Capacity
NCC Group estimates that the current capacity of its terminals and the long-term expansion potential for
each to be as set out in the table below, based on its general master plans of the future potential of each site.
Any such expansion will depend on the then prevailing market conditions and various other factors. Given
the higher capacity utilisation of FCT, future development at that terminal is currently expected to occur
ahead of further development at ULCT.

Page 11
Container
capacity as at 31
December 2012
Estimated
container
capacity at full
development
Growth
potential(1)
Growth
potential
expressed as a
percentage of
capacity as at 31
December 2012
('000 TEUs) ('000 TEUs) ('000 TEUs) (%)
FCT .................................................. 1,250 1,500 250 20%
ULCT ................................................ 440 2,600 2,160 491%
Total marine container capacity .... 1,690 4,100 2,410 143%
LT (inland) ........................................ 200 200 - 0%
Total container capacity ................. 1,890 4,300 2,410 128%
(1) Growth potential is calculated as the difference between the estimated container capacity at full development and the
relevant container capacity as at 31 December 2012.
DESCRIPTION OF ANY KEY DIFFERENCES IN ACCOUNTING POLICIES
The Company is not aware of any key differences between the accounting policies of NCC Group
compared to those used by Global Ports Investments PLC, except for certain differences in the presentation
and layout.
KEY FACTORS AFFECTING NCC GROUP’S FINANCIAL CONDITION AND RESULTS OF OPERATIONS
NCC Group’s financial results have been affected, and may be affected in the future, by a variety of factors,
including those set out below.
Throughput volumes
NCC Group’s revenue is affected by the throughput volumes at each of its terminals. These volumes are in
turn, to a large extent, affected by the total volume of containerised cargo in Russia. Container handling
generates the most significant part of the revenues of NCC Group. The share of revenue from cargo
handling and storage services represented 98%, 96% and 96% of total revenue in 2010, 2011 and 2012,
respectively.
The following table sets out NCC Group’s throughput for the years ended 31 December 2010, 2011 and
2012.
Year ended 31 December
2010 2011 2012
('000 TEUs)
FCT ...................................................................................... 1,160 1,174 1,058
ULCT ................................................................................... - - 11
Total marine container throughput .................................. 1,160 1,174 1,069
LT (inland) ........................................................................... 19 99 113
Total container throughput ............................................... 1,179 1,273 1,182
NCC Group’s gross marine container throughput increased by 1% in 2011 compared to 2010 to 1,174
thousand TEUs. NCC Group’s gross marine container throughput decreased by 9% in 2012 compared to
2011 to 1,069 thousand TEUs. The overall decrease in NCC Group’s volumes between 2010 and 2012 was
primarily caused by the shift by MSC of cargo volumes (a significant customer of FCT in 2010 and 2011)
previously directed through FCT to Container Terminal Saint-Petersburg following the acquisition by
Terminal Investment Limited (“TIL”) (an entity related to MSC) of a 20% equity interest in that terminal.

Page 12
This shift began in the second half of 2011, ahead of the formal acquisition of that interest in the first half
of 2012.
NCC Group’s inland container terminal LT started its operations in 2010. In 2011, container throughput at
LT terminal increased 5.2 times compared to 2010, from 19 thousand TEUs to 99 thousand TEUs. The
gross inland container throughput of the LT terminal in 2012 was 113 thousand TEUs, a 14% increase
compared to 2011.
Pricing
NCC Group’s revenue is dependent upon the prices it charges for its services. The maximum prices NCC
Group charges for cargo handling and storage services at FCT were regulated by the applicable Russian
regulatory authority for the period until mid-2010 when the Federal Tariff Service, the Russian competent
authority to regulate tariffs of port terminals, suspended the regulation of tariffs in the Big Port of St.
Petersburg cluster, while maximum prices for those services at ULCT and LT are not currently, nor were
they for the periods under review, regulated. The prices for NCC Group’s other services are, and were for
the periods under review, unregulated.
The prices NCC Group can charge for its services are driven by market demand. During the periods under
review, contract prices were typically set towards the end of the calendar year for the following year. NCC
Group generally agreed increases in the level of basic tariffs with its customers for 2011 and 2012
(excluding a congestion charge, which applied for part of 2011), while general tariff levels for 2013 have
remained relatively unchanged compared to the levels for 2012.
The following table sets out NCC Group’s revenue from cargo handling and storage services (in USD
millions), NCC Group’s total marine container throughput and the revenue per TEU (in USD) for the years
ended 31 December 2010, 2011 and 2012.
Year ended 31 December
2010 2011 2012
Revenue from cargo handling and storage
services USD million 254.4 304.5 242.2
Total marine container throughput '000 TEUs 1,160 1,174 1,069
Revenue per TEU USD per TEU 219 259 227
Revenue per TEU in 2011 increased by USD 40 or 18% compared to 2010 mainly due to significant
increases in the dwell time for containers as a result of severe winter conditions (which led to increased
storage revenues), an increase in the level of basic tariffs and a congestion surcharge introduced by NCC
Group in April 2011 in response to market conditions.
Revenue per TEU in 2012 decreased by USD 32 or 12% compared to 2011 mainly due to an industry wide
decrease in the dwell time for containers in 2012 largely due to the wide-spread adoption of electronic
customs clearance processes (which resulted in a decrease in revenue from storage services), improvements
in the efficiency of its customers’ logistics operations and the cancellation in 2012 of the congestion
surcharge referred to above, partially offset by an increase in the general tariff levels agreed with customers
for 2012.
The revenue per TEU in the periods under review was also driven by the service mix, which comprising a
relatively large share of laden export containers (for which NCC Group charged higher tariffs than empty
containers) and import containers.
Changes in NCC Group’s customer base
NCC Group’s revenue is affected by changes in its customer base. In 2010, 2011 and 2012, approximately
76%, 74% and 76% of the gross container throughput at FCT was derived from main-line operators. The

Page 13
relatively stable throughput at FCT from main-line operators has provided FCT with a more stable revenue,
compared to terminals that rely more heavily on feeder lines, cargo volumes from which typically vary
more significantly, depending on market conditions.
In the first half of 2012, TIL (an entity related to MSC, the second largest global main-line operator at FCT
in 2010 and 2011), acquired a 20% equity interest in a competing terminal in St. Petersburg (Container
Terminal Saint-Petersburg). While the effect of this was a significant decrease in container volumes from
this customer at FCT, this was partially offset by increases in container volumes from some of FCT’s other
customers. See also “—Throughput volumes”.
Capacity
From 2010 to 2012, NCC Group increased its capacity, with the LT terminal commencing its operations in
2010 (with an annual gross container handling capacity of 200 thousand TEUs) and with the launch of
ULCT in December 2011 (with an estimated annual capacity of 440 thousand TEUs).
As at 31 December 2012, the total estimated capacity of NCC Group’s terminals was 1,890 thousand TEU,
including 200 thousand TEUs of inland terminal capacity at LT. NCC Group’s total utilisation rate across
all terminals was 63% in 2012.
The following table sets out the estimated annual capacity (as at the relevant year end) and annual capacity
utilisation rate of NCC Group’s terminals for 2010, 2011 and 2012.
2010 2011 2012
('000 TEUs)
Capacity
FCT ..................................................................................... 1,250 1,250 1,250
ULCT .................................................................................. - 440 440
Total marine container capacity ....................................... 1,250 1,690 1,690
LT (inland) .......................................................................... 200 200 200
Total container capacity .................................................... 1,450 1,890 1,890
Capacity utilisation
FCT ..................................................................................... 93% 94% 85%
ULCT .................................................................................. - - 3%
Total marine container capacity utilisation rate ................... 93% 69% 63%
LT (inland) .......................................................................... 10% 50% 57%
Total container capacity utilisation rate .......................... 81% 67% 63%
NCC Group’s ability to grow its gross container handling throughput further is, to a significant extent,
limited by the expansion potential of its existing terminals. Any expansion will depend on the then
prevailing market conditions and various other factors. See also “—Overview—Capacity”.

Page 14
FCT
As shown in the table above, NCC Group’s key terminal, FCT, has a gross annual container handling
capacity of 1,250 thousand TEUs and works with a relatively high utilisation rate, which therefore limits
growth in container volumes without additional investments. The utilisation rates at FCT were 93%, 94%,
85% and 86% in 2010, 2011, 2012 and six months of 2013, respectively. The potential for FCT to further
increase its capacity is geographically constrained. NCC Group estimates that FCT’s maximum potential
annual capacity is approximately 1,500 thousand TEUs, a 20% increase in comparison to its current
capacity.
ULCT
ULCT was launched in December 2011 and its throughput has been progressively increased since that time.
As shown in the table above, its utilisation rate was 3% in 2012, being the first full year of its operation,
and this reflected the initial commissioning and ramp-up of container volumes. However, ULCT’s
utilisation rate increased to 10% in the first six months of 2013.
Loans to shareholders and related borrowings
In the periods under review, finance income derived from loans made by NCC Group to certain of its
shareholders and finance costs relating to borrowings used to fund those loans and have influenced its
profitability, as further described below.
Loans borrowed by NCC Group to fund loans to shareholders
In December 2010, FCT entered into two loan agreements with Sberbank of Russia for a total principal
amount of approximately USD 710 million with the main purpose to provide loans to some of NCC
Group’s shareholders to partly finance the purchase of a 50% stake in NCC Group from a third party,
FESCO. In 2011 and 2012, these loans were partially refinanced with the main purpose to extend their
maturity and decrease the effective borrowing costs.
Loans to shareholders
In the periods under review, NCC Group had several loans to its related parties outstanding, with balances
as set out below, as at 31 December 2010, 2011 and 2012.
As at 31 December
2010 2011 2012
(USD millions)
Perlen Holdings Limited ...................................................... 652.6 539.5 568.3
FQ International Limited ..................................................... 60.2 88.1 77.5(1)
Perlen Holdings Limited ...................................................... - 88.1 77.5(1)
Other related parties ............................................................. 42.6 - -
Other loans to third parties ................................................... 0.1 - -
Total loans receivable ........................................................ 755.5 715.7 723.3
(1) In the first six months of 2013, a further USD 8.5 million was advanced under each of these loans.
The first three lines items in the table above relate to funds initially advanced to certain of NCC Group’s
shareholders to partly finance the purchase of a 50% stake in NCCGL from a third party, FESCO. As part
of completion of the Transaction, the outstanding balance (together with accrued interest) of the first line
item in the table above is to be transferred to Global Ports as part of the consideration for the acquisition of
100% of the shares in NCCGL. Prior to completion of the Transaction, the second and third line items
(totalling USD 155.0 million as at 31 December 2012, together with an additional total amount of USD
17.0 million advanced in the first half of 2013 as described in “—Recent Developments—Loans to
shareholders” and all accrued interest) are to be transferred to the direct shareholders of NCCGL and set-
off against dividends to be declared by NCCGL.

Page 15
Service mix
The extent to which its customers purchase different services affects NCC Group’s revenues and margins.
For example, an increase of the share of laden export containers compared with empty containers, which
generally yield lower rates, should have a positive effect on NCC Group’s revenue and profitability, while
a reduction in the average period containers are stored at NCC Group’s terminals would have a negative
effect on profitability. Further, reefer containers generally generate higher revenue per container. In
particular, industry-wide decreases in storage dwell time for containers in the second half of 2011 and the
first half of 2012 resulted in decreases in revenue from storage services in the relevant periods.
Seasonality
The demand for certain of NCC Group’s services and certain of its expenses related to its container
terminals tend to be seasonal. Historically, unless impacted by other factors, NCC Group’s container
throughput has been lower during the first half of each year (and in particular, the first quarter of each year)
and higher in the second half of the year. This has been due primarily to higher demand for consumer
goods in the months prior to the winter holiday season. NCC Group’s staff costs reflect the payment of
bonuses in the second half of the year.
Operating leverage
Some of NCC Group’s expenses fluctuate in line with increases or decreases in its throughput volume,
while others remain more fixed and tend to increase or decrease as NCC Group’s cargo handling capacity is
expanded or contracted. The expenses that fluctuate in line with changes in throughput volume include
transportation expenses, fuel and electricity while expenses such as staff costs, depreciation of property,
plant and equipment, rent and repair and maintenance expenses are more fixed. NCC Group seeks to
manage its fixed and variable costs in response to changes in market conditions.
Staff costs
A large portion of NCC Group’s expenses are related to its staff. In 2010, 2011 and 2012, staff costs and
related taxes were 40%, 44% and 45% of NCC Group’s cost of sales, respectively, and 57%, 57% and 65%
of NCC Group’s selling, general and administrative expenses, respectively. FCT has entered into a
collective bargaining agreement in respect of its employees, which provides for, among other matters,
wages indexation. The agreement is for the period until 31 January 2014.
Exchange rates
Unless otherwise stated, the financial information contained in this appendix is presented in United States
dollars (“US dollars”), while the functional currency of the most companies within NCC Group is the
Russian rouble (the “Rouble”).
The individual financial statements of each entity in NCC Group is prepared in the currency of the primary
economic environment in which the relevant entity operates (being its functional currency). The function
currency for Russian subsidiaries of NCC Group is the Rouble and for Cypriot and British Virgin Islands
subsidiaries, it is the US dollar. For the purposes of the consolidated financial statements, the results and
financial position of each NCC Group entity are expressed in US Dollars, which is the function currency of
NCCGL and the presentation currency for the consolidated financial statements.
In preparing the financial statements of the individual entities, transactions in currencies other than the
entity’s functional currency (being foreign currencies) are recorded at the rates of exchange prevailing at
the dates of the transactions. At each reporting date, monetary items denominated in foreign currencies are
retranslated at the rates prevailing at the reporting date. Non-monetary items carried at fair value that are
denominated in foreign currencies are retranslated at the rates prevailing at the date when the fair value was

Page 16
determined. Non-monetary items that are measured in terms of historical cost in a foreign currency are not
retranslated.
For the purpose of presenting consolidated financial statements, the assets and liabilities of NCC Group’s
foreign operations are translated into US dollars using exchange rates prevailing at the reporting date.
Income and expense items are translated at the average exchange rates for the period, unless exchange rates
fluctuated significantly during that period, in which case the exchange rates at the dates of the transactions
are used. Exchange differences (recorded in “Foreign currency translation reserve”) arising, if any, are
recognised in other comprehensive income and accumulated in equity (attributed to non-controlling
interests, as appropriate). Cash flows are translated using the exchange rates existing at the dates of the
significant transactions or at the average rate for a period. Resulting differences are presented separately as
the effect of exchange rate changes on cash and cash equivalents.
The following table sets out the rates for the conversion of Roubles/US dollars for the periods under
review.
Year
Closing rate
Average rate for the
period
Year ended 31 December 2010 ................................................................................ 30.4769 30.3692
Year ended 31 December 2011 ................................................................................ 32.1961 29.3874
Year ended 31 December 2012 ................................................................................ 30.3727 31.0938
RECENT DEVELOPMENTS
Trading update
NCC Group management estimates that total revenue in the six months ended 30 June 2013 increased by
approximately [10]% (compared with the corresponding period in 2012) to in excess of USD [130] million,
primarily reflecting a [6.5%] increase in marine container handling volumes (as shown in the table below),
broadly stable headline pricing along with a slight improvement in service mix and increase in other
revenues. In the same period, NCC Group’s operating costs were well controlled, resulting in [a continuing
strong Adjusted EBITDA margin] during the period.
The table below sets out the total gross container throughput of NCC Group’s terminals for the periods
indicated.
Gross Container Throughput
Terminal First six
months of 2012
First six months
of 2013
('000 TEUs)
FCT ........................................................................................................................... 525 540
ULCT ........................................................................................................................ 2 21
LT .............................................................................................................................. 50 50
Total .......................................................................................................................... 577 611
In addition, the average monthly gross container throughput at ULCT in the first six months of 2013 was
3.5 thousand TEUs and in July 2013, gross container throughput was 7.3 thousand TEUs.
Indebtedness
In June and July 2013, NCC Group borrowed a total of USD 250 million under a loan agreement with VTB
Capital PLC, with a maturity in 2020. The loan was used to refinance some existing loans. The terms of
the loan provide for repayments to begin in 2017, with the majority of repayments falling due in 2018 and
2019.

Page 17
In May 2013, NCC Group refinanced its existing loan facility from Sberbank of Russia with a principal
amount of USD 288 million, effectively extending the maturity to 2020 and making some of the financial
covenants more favourable to the borrower. The terms of the new loan provide for repayments to begin in
2017, with the majority of repayments falling due in 2018 and 2019.
In March 2013, NCC Group also entered into a swap arrangement (the “Swap Arrangement”) with an
affiliate of Sberbank of Russia to swap the payments under a Rouble-denominated loan from Sberbank of
Russia (shown in NCC Group’s consolidated statement of financial position as at 31 December 2012 in an
amount of USD 212 million) into US dollars and to swap the floating rate of interest on that loan to a fixed
rate. This arrangement was entered into to fix the interest costs under the relevant loan and to hedge NCC
Group’s Rouble currency exposure as its revenues are largely in US dollars.
Prior to completion of the Transaction, a loan owing by ULCT to Eurogate, the minority shareholder of
ULCT, is expected to be converted into equity in ULCT, together with all accrued interest up to the point of
such conversion, together with a similar conversion of a pro rata amount of indebtedness owing by ULCT
to another member of the NCC Group (which will be eliminated on consolidation). As at 31 December
2012, this loan was included in NCC Group’s loans and borrowings in an amount of USD 53.4 million (the
“Eurogate Loan”).
As at 30 June 2013, the scheduled cash principal repayments (excluding any interest or other amounts and
excluding any effect or adjustment from the Swap Arrangement, but applying the relevant exchange rate
under the Swap Arrangement) of NCC Group’s loans and borrowings from banks (excluding, for the
avoidance of doubt, the Eurogate Loan) was as set out in the table below. This information is not prepared
in accordance with IFRS and differs in its calculation from the presentation in NCC Group’s consolidated
financial statements or the notes thereto.
As at 30 June 2013
(USD millions)
Due in the second half of 2013 ............................................................................................................... 55
Due in 2014 ............................................................................................................................................ 62
Due in 2015 ............................................................................................................................................ 40
Due in 2016 ............................................................................................................................................ 135
Due after 2016 ........................................................................................................................................ 645
Total loans and borrowings from banks(1)(2) ........................................................................................ 937
(1) The Rouble-denominated loans and borrowings from banks to which the Swap Arrangement relates are converted into US
dollars at the rate under such swap.
(2) Excludes the Eurogate Loan referred to above.
As at 30 June 2013, the weighted average interest rate on NCC Group’s loans and borrowings was 6.4%
per annum (calculated as the weighted average of loans and borrowings as at 30 June 2013, according to
management accounts) and applying the applicable exchange rate under the Swap Arrangement (but
excluding the effect of fees and commissions), which will differ to the calculation for the purposes of
presentation in the notes to NCC Group’s consolidated financial statements).
Loans to shareholders
In February and March 2013, NCC Group advanced an aggregate principal amount of USD 17.0 million to
its shareholders under existing loan agreements. See also “—Key Factors Affecting NCC Group’s
Financial Condition and Results of Operations—Loans to shareholders and related borrowings—Loans to
shareholders”.
Acquisition of IT service provider
In April 2013, NCC Group acquired Rolis, a software and IT services company providing services to NCC
Group, from NCC Group’s related party for USD 3.5 million, in anticipation of the Transaction.

Page 18
Acquisition of Balt Container
In August 2013, NCC Group acquired LLC Balt Container, from NCC Group’s related party for USD 0.3
thousand, in anticipation of the Transaction.
DESCRIPTION OF KEY LINE ITEMS
The following discussion provides a description of the composition of the principal line items on NCC
Group’s income statement for the periods presented.
Revenue
NCC Group generates revenue primarily from cargo handling and storage services. Revenue is measured at
the fair value of the consideration received or receivable and represents amounts receivable for goods and
services provided in the normal course of business, net of sales related taxes. Revenue is recognised to the
extent that it is probable that the economic benefits will flow to NCC Group and the revenue can be reliably
measured. Revenue is reduced for estimated trade discounts and other similar allowances. Revenue from
cargo and handling services is recognised in the accounting period in which the services are rendered.
Revenue from storage services is recognised on a straight-line basis over the accounting period in which
the services are rendered.
Cost of sales
Cost of sales consists of staff costs and related taxes, services (which include electricity supply, security
services and transportation services), property insurance, inventory costs (which include fuel, gas and spare
parts), rent, repairs and maintenance and other expenses net.
Gross profit
Gross profit is calculated by subtracting cost of sales from revenue.
Selling, general and administrative expenses
Selling, general and administrative expenses consists of staff costs and related taxes, other third parties
services, audit and consulting services, bank charges, rent, repair and maintenance, communication
expenses and other expenses.
Depreciation and amortization expenses
Depreciation and amortization expenses consists of NCC Group’s depreciation and amortization expenses.
Other income/(expenses), net
Other income/(expenses), net consists of taxes other than income taxes, loss on disposal of property, plant
and equipment, other income/(expenses) net and prior period value added tax for refund.
Finance income
Finance income includes interest income on bank balances, short-term bank deposits, and loans to related
parties.
Finance costs
Finance costs include interest expenses on bank borrowings, on finance leases, on loans from related
parties, and on loans from third parties.

Page 19
Foreign exchange gain/(loss), net
Foreign exchange gain/(loss), net consists of foreign exchange gains and losses relating to certain non-
financial assets and liabilities.
Profit before income tax expense
Profit before income tax expense is calculated by subtracting selling, general and administrative expenses,
depreciation and amortization expenses, other income/(expenses), net, finance income, finance costs and
foreign exchange gain/(loss), net from gross profit.
Income tax expense
Income tax expense represents the sum of current and deferred income taxes.
Profit for the year
Profit for the year is calculated by subtracting income tax expense from profit before income tax expense.
RESULTS OF OPERATIONS FOR NCC GROUP FOR THE YEARS ENDED 31 DECEMBER 2010, 2011 AND 2012
The following table sets out the principal components of NCC Group’s consolidated income statement for
the years ended 31 December 2010, 2011 and 2012.

Page 20
Year ended 31 December
2010 2011 2012
(USD millions)
Revenue ........................................................................... 260.2 317.5 253.3
Cost of sales ..................................................................... (57.6) (64.3) (67.8)
Gross Profit .................................................................... 202.6 253.2 185.5
Depreciation and amortization expenses .......................... (18.0) (20.1) (33.4)
Selling, general and administrative expenses ................... (14.9) (15.1) (14.4)
Operating profit ............................................................. 169.7 217.9 137.6
Other (expenses)/income, net ........................................... (6.8) 9.7 (6.2)
Finance income ................................................................ 6.0 54.9 40.0
Finance costs .................................................................... (8.3) (57.3) (72.0)
Foreign exchange gain/(loss), net .................................... 3.6 (10.1) 7.8
Profit before income tax expense .................................. 164.1 215.2 107.4
Income tax expense .......................................................... (22.8) (30.7) (27.7)
Profit for the year .......................................................... 141.3 184.4 79.7
Non-IFRS financial information13
Gross profit margin14 ....................................................... 77.9% 79.7% 73.2%
Adjusted EBITDA15 ......................................................... 181.4 230.8 164.0
Adjusted EBITDA margin16 ............................................ 69.7% 72.7% 64.7%
Revenue
Revenue primarily comprises cargo handling and storage services. NCC Group handles containers in its sea
ports and containers and bulk cargoes in its inland facility, LT.
The following table sets out NCC Group’s revenue for the years ended 31 December 2010, 2011 and 2012.
13 Gross profit margin, Adjusted EBITDA and Adjusted EBITDA margin (the “Supplemental Non-IFRS Measures”) are presented as
supplemental measures of NCC Group’s operating performance, which NCC Group believes are frequently used by securities
analysts, investors and other interested parties in the evaluation of companies in the Russian market and global ports sector. The Supplemental Non-IFRS Measures are measures of NCC Group’s operating performance that are not required by, or prepared in
accordance with, IFRS. All of these supplemental measures have limitations as analytical tools, and investors should not consider any
one of them in isolation, or any combination of them together, as a substitute for analysis of NCC Group’s operating results as reported under IFRS and should not be considered as alternatives to revenues, profit, operating profit, net cash provided by operating
activities or any other measures of performance derived in accordance with IFRS or as alternatives to cash flow from operating
activities or as measures of NCC Group’s liquidity. In particular, the Supplemental Non-IFRS Measures should not be considered as measures of discretionary cash available to NCC Group to invest in the growth of its business. Other companies in the port containers
terminal sector may calculate these Supplemental Non-IFRS Measures differently or may use each of them for different purposes than
NCC Group, limiting their usefulness as comparative measures. 14 Gross profit margin is calculated as gross profit divided by revenue, expressed as a percentage. 15
Adjusted EBITDA is calculated as profit for the period before income tax expense, foreign exchange gain/(loss), net, finance costs,
finance income and depreciation and amortization expenses adjusted further for the one-off nonrecurring VAT tax refund for previous
periods as described in Note 8 of the NCC Group financial statements and certain other non-cash or one-off nonrecurring gains and losses included within other income/(expenses), net in Note 8 of the NCC Group financial statements. For a reconciliation of
Adjusted EBITDA to profit before income tax expense, see “—Non-IFRS measures: Adjusted EBITDA and Adjusted EBITDA
Margin”. 16 Adjusted EBITDA Margin is calculated as Adjusted EBITDA divided by revenue, expressed as a percentage.

Page 21
Year ended 31 December
2010 2011 2012
(USD millions)
Cargo handling and storage services .................................... 254.4 304.5 242.2
Rental income ...................................................................... 3.8 5.4 5.3
Other .................................................................................... 2.0 7.6 5.8
Total revenue ...................................................................... 260.2 317.5 253.3
NCC Group’s revenue increased by 22% from USD 260.2 million in 2010 to USD 317.5 million in 2011.
The increase was mainly driven by a 20%, or USD 50.1 million, increase in revenue from cargo handling
and storage services. Revenue from cargo handling and storage services increased mainly due to a 1.2%
increase in marine throughput and an 18% increase in revenue per TEU in 2011, compared with the
previous year. See “—Key Factors Affecting NCC Group’s Financial Condition and Results of Operations
– Throughput volumes” and “—Key Factors Affecting NCC Group’s Financial Condition and Results of
Operations—Pricing”.
In 2012, revenue decreased by 20% from USD 317.5 million in 2011 to USD 253.3 million in 2012. The
decrease was mainly driven by a 20%, or USD 62.3 million, decrease in revenue from cargo handling and
storage services due to a 9% decrease in container throughput and a 13% decrease in revenue per TEU in
2012, compared with the previous year. See “—Key Factors Affecting NCC Group’s Financial Condition
and Results of Operations – Throughput volumes” and “—Key Factors Affecting NCC Group’s Financial
Condition and Results of Operations—Pricing”.
Cost of sales
The following table sets out NCC Group’s cost of sales for the years ended 31 December 2010, 2011 and
2012.
Year ended 31 December
2010 2011 2012
(USD millions)
Staff costs and related taxes ...................................................... 23.3 28.5 30.2
Services ..................................................................................... 10.7 12.0 10.3
Property insurance .................................................................... 8.5 9.0 9.8
Inventory costs .......................................................................... 6.2 8.9 9.2
Rent........................................................................................... 1.9 2.9 4.6
Repair and maintenance ............................................................ 6.7 1.4 2.0
Other expenses net .................................................................... 0.5 1.7 1.7
Total costs of sales ................................................................... 57.6 64.3 67.8
In 2011, cost of sales increased by 12%, or USD 6.7 million, from USD 57.6 million in 2010 to USD 64.3
million in 2011 mainly due to general cost inflation in Russia (Russian CPI increased by 6.1%), increased
throughput and the appreciation of the Rouble against the US dollar (with the average US dollar / Rouble
exchange rate appreciating by 3.2% in 2011 as compared to 2010). Adjusted for exchange rate changes
(assuming that all costs were in Roubles), NCC Group’s cost of sales in 2011 increased by 8% in 2011 as
compared to 2010.
Staff cost and related taxes is the largest component of costs of sales representing 40%, 44% and 45% of
total cost of sales in 2010, 2011 and 2012, respectively.
Staff costs and related taxes in 2011 increased by 22% or USD 5.2 million as compared to 2010 mainly due
to a 24%, or USD 4.8 million, increase of both fixed and variable staff costs and related taxes at FCT
following an increase in social taxes and general wages inflation, and the 1.2% increase in marine
throughput.

Page 22
The services line item in 2011 increased by USD 1.3 million or by 12% as compared to 2010 mainly due to
the increase in throughput and increases in electricity prices and an increase in electricity consumption.
Inventory costs in 2011 increased by USD 2.7 million or by 43% as compared to 2010 mainly due to
increases in fuel prices and fuel consumption related to new equipment at FCT, as well as the ramp-up of
operations at LT. Repair and maintenance costs in 2011 decreased by USD 5.3 million or by 78% as
compared to 2010 mainly due to non-recurring repairs of pavements and quays at FCT in 2010.
In 2012, cost of sales increased by USD 3.5 million or 5% from USD 64.3 million in 2011 to USD 67.8
million in 2012 mainly due to effect of cost inflation in Russia (Russian CPI increased by 6.5%), partially
offset by decreased throughput and the effect of depreciation of the Rouble against the US dollar (with the
average US dollar / Rouble exchange rate depreciating by [5.8]% in 2012 as compared to 2011).
Furthermore, the cost of sales was affected by the full-year effect of the commencement of operations at
ULCT, resulting in an increase in costs. Adjusted for exchange rate changes (assuming all costs were in
Roubles), cost of sales in 2012 increased by 12.2% as compared to 2011.
Staff costs and related taxes in 2012 increased by USD 1.7 million or 6% mainly due to the launch of
ULCT in December 2011 which contributed USD 2.4 million in staff cost in 2012 and the effect of wage
and salary indexation, partially offset by a USD 1.4 million or 6% decrease in staff costs at FCT caused by
a decrease in throughput and by the effect of the depreciation of the Rouble against the US dollar.
The services line item in 2012 decreased by USD 1.6 million or 14% predominantly due to a decrease in
the consumption of electricity and a decrease in third-party transportation expenses arising from the use of
more cost-effective service providers. Rent costs increased by USD 1.8 million or by 61% in 2012 mainly
due to the launch of ULCT in December 2011, the rent for which was capitalised as part of the construction
cost prior to its launch.
Gross profit
Gross profit increased by USD 50.6 million or 25% from USD 202.6 million in 2010 to USD 253.2 million
in 2011 due to the factors discussed above. Gross profit margin increased from 77.9% in 2010 to 79.7% in
2011 as revenue increased more quickly than costs of sales primarily due to the 18% increase in revenue
per TEU in 2011.
Gross profit decreased by USD 67.7 million or 27% from USD 253.2 million in 2011 to USD 185.5 million
in 2012 due to the factors discussed above. Gross profit margin decreased from 79.7% in 2011 to 73.2% in
2012 as marine throughput decreased 9% and cost of sales increased due to the launch of ULCT.
Selling, general and administrative expenses
The following table sets out NCC Group’s selling, general and administrative expenses for the years ended
31 December 2010, 2011 and 2012.
Year ended 31 December
2010 2011 2012
(USD millions)
Staff costs and related taxes ...................................................... 8.5 8.6 9.4
Other third parties services ....................................................... 2.9 1.2 1.1
Audit and consulting services ................................................... 0.5 1.0 1.0
Bank charges ............................................................................. - 0.4 0.3
Rent........................................................................................... 1.4 1.2 1.0
Repair and maintenance ............................................................ - 0.3 0.2
Communication expenses ......................................................... - 0.2 0.1
Other expenses .......................................................................... 1.6 2.2 1.4
Total selling, general and administrative expenses .............. 14.9 15.1 14.4
Page 23
In 2011, selling, general and administrative expenses increased by USD 0.2 million or 2% as compared to
2010 mainly due to the effect that the appreciation of the Rouble against the US dollar had on the US dollar
value of the Rouble-denominated costs. The average exchange rate of US dollar decreased by 3.2% in 2011
compared to the average exchange rate in 2010.
In 2012, selling, general and administrative expenses decreased by USD 0.7 million or 5% as compared to
2011 mainly due to effect that the depreciation of the Rouble against the US dollar had on the US dollar
value of the Rouble-denominated expenses. The average exchange rate of the US dollar increased by 5.8%
in 2012 compared to the average exchange rate in 2011. Staff costs and related taxes increased by USD 0.8
million or 9% due to increased number on staff related to the launch of the new ULCT terminal and the
effect of wage and salary indexation which was partially offset by a decrease in other expenses by USD
0.8 million or 35% mainly due to a decrease in marketing expenses.
Depreciation and amortization expenses
In 2011, depreciation and amortization expenses increased by USD 2.1 million or 12% from USD 18.0
million in 2010 to USD 20.1 million in 2011 primarily due to the launch of ULCT in December 2011 (and
the related commissioning of property, plant and equipment leading up to the operational launch) and the
effect of the appreciation of the Rouble against the US dollar. In 2012, depreciation and amortization
expenses increased by USD 13.3 million or 66% from USD 20.1 million in 2011 to USD 33.4 million in
2012 primarily due to the full-year effect of the launch of ULCT, partially offset by the effect of the
depreciation of the Rouble against the US dollar.
Other income/(expenses), net
The following table sets out NCC Group’s other income/(expenses), net for the years ended 31 December
2010, 2011 and 2012.
Year ended 31 December
2010 2011 2012
(USD millions)
Prior period value added tax for refund ........................................... - 17.4 -
Taxes other than income tax ............................................................ (5.0) (6.0) (6.3)
Loss on disposal of property, plant and equipment .......................... (0.1) - (0.1)
Other expenses, net .......................................................................... (1.7) (1.7) 0.2
Other income/(expenses), net total ................................................ (6.8) 9.7 (6.2)
In 2011, NCC Group’s other income, net was USD 9.7 million compared to other expenses, net of USD 6.8
million in 2010. This change was primary due to a value added tax refund of USD 17.4 million recognised
in 2011 arising from a clarification of the treatment of certain stevedoring services for Russian tax
purposes, resulting in NCC Group claiming a refund of certain amounts paid in respect of 2009 and 2010.
Excluding the effect of the value added tax refund, in 2011, this line item would have been other expenses,
net of USD 7.7 million, or an increase of USD 0.9 million or 13% compared to 2010.
In 2012, NCC Group’s other expenses, net were USD 6.2 million compared to other income, net of USD
9.7 million in 2011. This change was primarily due to the non-recurring Russian value added tax refund
referred to above recognised in 2011, an increase in 2012 of USD 0.3 million in taxes other than income
and a change in other expenses, net from USD 1.7 million in 2011 to other income, net of USD 0.2 million
in 2012.
Operating profit
Operating profit increased by USD 48.2 million or 28% from USD 169.7 million in 2010 to USD 217.9
million in 2011 due to the factors discussed above.

Page 24
Operating profit decreased by USD 80.3 million or 37% from USD 217.9 million in 2011 to USD 137.6
million in 2012 due to the factors discussed above.
Finance income
The following table sets out NCC Group’s finance income for the years ended 31 December 2010, 2011
and 2012.
Year ended 31 December
2010 2011 2012
(USD millions)
Interest income on loans due from related parties ..................... 4.1 54.6 39.0
Interest income on bank deposits .............................................. 1.7 0.3 1.0
Other interest income ................................................................ 0.2 - -
Finance income total ............................................................... 6.0 54.9 40.0
Finance income increased from USD 6.0 million in 2010 to USD 54.9 million in 2011 or by USD 48.9
million due to the interest income on loans due from related parties (shareholders of NCC Group) in the
amount of USD 54.6 million recognised in 2011. The total amount of loans outstanding to related parties as
at 31 December 2011 was USD 715.7 million. See also “—Key Factors Affecting NCC Group’s Financial
Condition and Results of Operations—Loans to shareholders and related borrowings”.
Finance income decreased by USD 14.9 million from USD 54.9 million in 2011 to USD 40.0 million in
2012 due to the decrease of interest income recognised on loans to related parties (shareholders of NCC
Group) from USD 54.6 million in 2011 to USD 39.0 million in 2012 primarily due to a decrease in the
interest rates charged on those loans. The total amount of loans outstanding to related parties as at 31
December 2012 was USD 723.3 million. See also “—Key Factors Affecting NCC Group’s Financial
Condition and Results of Operations—Loans to shareholders and related borrowings”.
Finance costs
The following table sets out NCC Group’s finance costs for the years ended 31 December 2010, 2011 and
2012.
Year ended 31 December
2010 2011 2012
(USD millions)
Interest expenses on third parties loans ............................................ 6.5 57.3 72.0
Interest expenses on loan due to related parties ............................... 1.8 - -
Finance costs total .......................................................................... 8.3 57.3 72.0
Finance costs increased by USD 49.0 million from USD 8.3 million in 2010 to USD 57.3 million in 2011
due to the interest expenses on loans from third parties (which were mainly borrowed in December 2010;
see also “—Key Factors Affecting NCC Group’s Financial Condition and Results of Operations—Loans to
shareholders and related borrowings”), partially offset by the effect of the capitalisation of interest
expenses associated with the construction of ULCT. Loans from third parties as at 31 December 2011 were
USD 1,040.8 million compared to USD 1,012.8 million as at 31 December 2010.
Finance costs increased by USD 14.7 million from USD 57.3 million in 2011 to USD 72.0 million or by
26% in 2012 mainly due to the capitalisation in 2011 of some of the interest expense associated with the
construction of ULCT, which did not occur in 2012 as ULCT was launched in December 2011.

Page 25
Foreign exchange gain/(loss), net
Foreign exchange gain/(loss), net changed from a net gain of USD 3.6 million in 2010 to a net loss of USD
10.1 million in 2011. Foreign exchange gain/(loss), net changed from a net loss of USD 10.1 million in
2011 to a net gain of USD 7.8 million in 2012. See also “—Key Factors Affecting NCC Group’s Financial
Condition and Results of Operations—Exchange rates”.
Profit before income tax expense
Profit before income tax expense increased by USD 51.1 million or 31% from USD 164.1 million in 2010
to USD 215.2 million in 2011 due to the factors discussed above.
Profit before income tax expense decreased by USD 107.8 million or 50% from USD 215.2 million in 2011
to USD 107.4 million in 2012 due to the factors discussed above.
Income tax expense
Income tax expense was USD 22.8 million, USD 30.7 million and USD 27.7 million in 2010, 2011 and
2012, respectively.
NCC Group’s effective tax rate in 2010, 2011 and 2012, calculated as income tax expense divided by profit
before income tax, was 14%, 14% and 26%, respectively.
The increase of effective tax rate in 2012 was primarily due to an increase of USD 7.0 million related to the
effect of an unrecognised deferred tax asset related to tax losses generated at ULCT and a one-off USD 5.7
million increase in deferred tax expenses arising from the change in tax rate at FCT from 15.5% to 20%
from 2013, partially offset by a USD 5.6 million decrease in current tax expenses in respect of the current
year due to the decrease in profit before income tax expenses in 2012 compared to 2011 and the effect of
deferred tax expense related to the origination and reversal of temporary differences.
Profit for the year
Profit for the year increased by USD 43.1 million or 31% from USD 141.3 million in the 2010 to USD
184.4 million in 2011 due to the factors discussed above.
Profit for the year decreased by USD 104.7 million or 57% from USD 184.4 million in 2011 to USD 79.7
million in 2012 due to the factors discussed above.
NON-IFRS MEASURES: ADJUSTED EBITDA AND ADJUSTED EBITDA MARGIN
The following table sets out the adjustments made to NCC Group’s profit for the period to calculate NCC
Group’s Adjusted EBITDA for the years ended 31 December 2010, 2011 and 2012.

Page 26
Year ended 31 December
2010 2011 2012
(USD millions)
Profit for the year ................................................................... 141.3 184.4 79.7
Plus (Minus) .............................................................................
Income tax expense ................................................................... 22.8 30.7 27.7
Finance income ......................................................................... (6.0) (54.9) (40.0)
Finance costs ............................................................................. 8.3 57.3 72.0
Foreign exchange (gain)/loss, net ............................................. (3.6) 10.1 (7.8)
Depreciation and amortization expenses ................................... 18.0 20.1 33.4
Adjustments included for items under other
income/(expenses) - net
Prior year value added tax for refund(1) .............................. - (17.4) -
Other gains/(losses) – net(2) ................................................ 0.6 0.5 (1.0)
Adjusted EBITDA................................................................... 181.4 230.8 164.0
(1) Included within other income/(expenses), net is a one-off nonrecurring VAT tax refund for previous periods as described in
Note 8 of the NCC Group financial statements.
(2) There are certain differences in the format and the presentation layout of the Global Ports financial statements and the NCC
Group financial statements, which are relevant to the calculation of Adjusted EBITDA. In particular, included within other
income/(expenses), net in Note 8 of the NCC Group financial statements are certain non-cash or one-off and nonrecurring items which would be excluded from EBITDA calculation had the NCC Group financial statements be prepared in
accordance with the format and layout of the Global Ports financial statements. These items are summarised under other
gains/(losses) - net in the table above.
NCC Group’s Adjusted EBITDA increased by USD 49.4 million or 27% from USD 181.4 million in 2010
to USD 230.8 million in 2011 due to the factors discussed above.
NCC Group’s Adjusted EBITDA decreased by USD 66.8 million or 29% from USD 230.8 million in 2011
to USD 164.0 million in 2012. This decrease was due to the factors described above including a negative
contribution of USD 10 million to NCC Group’s Adjusted EBITDA from the Adjusted EBITDA of the
ULCT container terminal, which began operations in December 2011.
NCC Group’s Adjusted EBITDA margin, calculated as Adjusted EBITDA divided by revenue, expressed
as a percentage, was 69.7%, 72.7% and 64.7% in 2010, 2011, and 2012, respectively.
For certain limitations relating to Adjusted EBITDA and Adjusted EBITDA margin, see footnote (13)
above.
LIQUIDITY AND CAPITAL RESOURCES
General
NCC Group’s liquidity needs arise primarily in connection with operating costs, capital maintenance and
investment activities at its terminals and debt servicing. In the periods under review, NCC Group’s liquidity
needs were met by revenues generated from operating activities and from loans and borrowings. NCC
Group expects to fund its liquidity requirements in both the short- and medium-term with cash generated
from operating activities and loans and borrowings.
Cash flows
The following table sets out key selected items of NCC Group’s cash flow statement for the years ended
31 December 2010, 2011 and 2012.

Page 27
Year ended 31 December
2010 2011 2012
(USD millions)
Receipts from customers .................................................................. 286.3 329.1 265.2
Other receipts ................................................................................... 15.9 25.4 36.8
Payments to suppliers and employees .............................................. (96.9) (76.1) (74.8)
Other payments ................................................................................ (21.3) (48.7) (27.4)
Cash generated from operations ................................................... 184.0 229.8 199.8
Income tax paid ................................................................................ (22.1) (30.4) (26.8)
Interest paid ..................................................................................... (10.8) (77.2) (66.9)
Net cash from operating activities ................................................ 151.1 122.2 106.1
Purchase of property, plant and equipment ...................................... (45.2) (84.0) (18.5)
Cash received on settlement of loans receivable and time
deposits ............................................................................................ 8.1 221.8 20.0
Payments of loans given and time deposits ...................................... (713.6) (182.5) (33.0)
Acquisition of subsidiary under common control ............................ - - (0.2)
Interest received ............................................................................... 1.7 0.4 1.0
Proceeds from disposal of property, plant and equipment ............... 0.8 - -
Net cash used in investing activities .............................................. (748.3) (44.4) (30.7)
Net cash outflows from borrowings and financial leases ................. 801.4 10.4 (54.6)
Dividends paid ................................................................................. (218.0) (49.4) (44.0)
Distributions to shareholders paid .................................................... (7.1) - -
Net cash (used in)/from financing activities ................................. 576.4 (39.0) (98.6)
Net cash from operating activities
Net cash from operating activities was USD 151.1 million in 2010 comprising USD 286.3 million in
receipts from customers and USD 15.9 million in other receipts (primarily consisting of refunds of VAT)
offset by USD 96.9 million in payments to suppliers and employees, USD 21.3 million in other payments
(consisting primarily of property taxes, VAT paid and other administrative expenses), USD 22.1 million in
income tax paid and USD 10.8 million in interest paid.
Net cash from operating activities was USD 122.2 million in 2011 comprising USD 329.1 million in
receipts from customers and USD 25.4 million in other receipts (primarily consisting of refunds of VAT)
offset by USD 76.1 million in payments to suppliers and employees, USD 48.7 million in other payments
(consisting primarily of property taxes, VAT paid and other administrative expenses). Interest paid
increased in 2011 to USD 77.2 million due to payment of accrued interest on the loans obtained from third
parties obtained towards the end of 2010, as well as the prepayment of these loans and payment of fees and
commissions arising from the refinancing of indebtedness from third party banks.
Net cash from operating activities was USD 106.1 million in 2012 comprising USD 265.2 million in
receipts from customers and USD 36.8 million in other receipts (primarily consisting of refunds of VAT,
including receipt of some of the VAT refund discussed at “—Other income/(expenses), net” above) offset
by USD 74.8 million in payments to suppliers and employees, USD 27.4 million in other payments
(consisting primarily of property taxes, VAT paid and other administrative expenses. Interest paid in 2012
was USD 66.9 million.
Net cash used in investing activities
Net cash used in investing activities in 2010 was USD 748.3 million and was largely driven by the loan
provided to the related parties (shareholders of NCC Group). See “—Key Factors Affecting NCC Group’s
Financial Condition and Results of Operations—Loans to shareholders and related borrowings”. As at the

Page 28
31 December 2010, the total loans receivable from related parties amounted to USD 755.4 million.
Purchases of property, plant and equipment (capital expenditures on a cash basis) amounted to USD 45.2
million during the same period, primarily relating to the development of ULCT as well as some expenditure
at FCT.
Net cash used in investing activities in 2011 was USD 44.4 million. In 2011, purchases of property, plant
and equipment (capital expenditures on a cash basis) of USD 84.0 million, primarily relating to the
development of ULCT as well as some expenditure at FCT, were partially offset by a net cash inflow of
USD 39.3 million of payments of loans given and time deposits and proceeds from loans receivable.
Net cash used in investing activities during 2012 was USD 30.7 million driven mainly by purchases of
property, plant and equipment (capital expenditures on a cash basis) of USD 18.5 million mainly relating to
the development of ULCT as well as expenditure at FCT, and net cash outflow of USD 13.0 million of
payments of loans given and time deposits and cash received on settlement of loans and time deposits.
Net cash (used in)/from financing activities
Net cash from financing activities in 2010 was USD 576.4 million driven mainly by a net cash inflow of
USD 801.4 million from borrowings and financial leases partially offset by a cash outflow in the form of
dividends paid of USD 218.0 million.
Net cash used in financing activities during 2011 was USD 39.0 million, driven mainly by a net cash inflow
of USD 10.4 million from borrowings and financial leases and a cash outflow in the form of dividends paid
of USD 49.4 million.
Net cash used in financing activities during 2012 amounted to USD 98.6 million driven mainly by a net
cash outflow of USD 54.6 million from borrowings and financial leases and a cash outflow in the form of
dividends paid of USD 44.0 million.
CAPITAL EXPENDITURES (ON A CASH BASIS)
Capital expenditures on a cash basis in 2010, 2011 and 2012 amounted to USD 45.2 million, USD 84.0
million and USD 18.5 million, respectively. These expenditures were primary related to the completion of
ULCT which began operations in December 2011. Currently, budgeted capital expenditures (on a cash
basis) in 2013 amount to approximately USD 10 million (including VAT), and relate to the purchase of
equipment at FCT, further completion works at ULCT and maintenance capital expenditure at FCT.
LOANS AND BORROWINGS
The following table sets out NCC Group’s loans and borrowings as at 31 December 2010, 2011 and 2012.

Page 29
2010 2011 2012
Currency
Weighted
average or
effective
interest rate
USD
millions
Weighted
average
interest rate
USD
millions
Weighted
average
interest rate
USD
millions
Short-term borrowings
Secured
Short-term borrowings -third parties ..... RUB 9.20% 0.9 10.60% 0.6 10.87% 0.6
Short-term borrowings -third parties ..... EUR 4.0% 13.4 4.43% 13.5 3.44% 13.3
Short-term borrowings -third parties ..... USD 4. 0%-5.5% 74.6 4.98% 31.5 5.46% 259.7
Total secured short-term
borrowings ........................................... 88.9 45.6 273.6
Unsecured
Short-term borrowings -related
parties .................................................... RUB 8% 0.7 0% 0.2 - -
Short-term borrowings -related parties .................................................... USD 7.20% 38.5 7.20% 0.7 7.21% 0.1
Short-term borrowings -third parties ..... EUR 5% 0.8 - - - -
Short-term borrowings -third parties ..... USD 3.3%-6% 46.0 4.50% 25.1 6.03% 29.3
Total unsecured short-term
borrowings ........................................... 86.0 26.0 29.4
Total short-term borrowings .............. 174.9 71.6 303.0
Long--term borrowings
Secured
Long-term borrowings -third parties ...... RUB 9% 210.5 10.82% 199.2 10.87% 211.2
Long-term borrowings -third parties ...... EUR 4% 33.6 4.38% 20.9 3.42% 8.2
Long-term borrowings -third parties ...... USD 4.2%-8.7% 612.5 6.03% 717.1 5.67% 437.4
Total secured long-term
borrowings ........................................... 856.6 937.2 656.8
Unsecured
Long-term borrowings -related parties .................................................... RUB 8% 0.4 - - - -
Long-term borrowings -related
parties .................................................... USD 7.20% 9.0 - - - -
Long-term borrowings -third parties ...... USD 4-10% 20.2 4.63% 32.9 8.77% 43.9
Long-term borrowings -third parties ...... EUR 5% 0.3 - - - -
Total unsecured long-term
borrowings ........................................... 29.9 32.9 43.9
Total long-term borrowings ................ 886.5 970.1 700.7
Total borrowings ................................. 1,061.4 1,041.7 1,003.7
The following table sets out NCC Group’s secured and unsecured loans and borrowings as at 31 December
2010, 2011 and 2012.
As at 31 December
2010 2011 2012
(USD millions)
Secured ............................................................................................ 945.5 982.8 930.4
Unsecured ........................................................................................ 115.9 58.9 73.3
Total borrowings ............................................................................ 1,061.4 1,041.7 1,003.7

Page 30
As at 31 December 2012, 93% of NCC Group’s loans and borrowing were secured. NCC Group’s loans
and borrowings were secured by:
property, plant and equipment of FCT, ULCT and LT with a carrying value of USD 246.7 million
(2011: USD 182.5 million, 2010: USD 173.2 million);
100% of the shares in LT (2011and 2010: 100% of the shares in LT);
90% (plus 1 share) of the shares in FCT (2011: 100% of the shares in FCT, 2010: 75% (minus 1
share) of the shares in FCT);
60% of the shares in ULCT (2011 and 2010: 60% of the shares in ULCT).
As at 31 December 2012, all borrowings provided by related parties with off-market interest rates were
stated at amortized cost using effective interest rate of 7.21% (2011: 7.2%, 2010: from 7.21% to 10.68%),
based on estimates of market rates on initial recognition.
In the periods under review, the majority of NCC Group’s borrowings contain covenants imposed on
NCCGL and certain subsidiaries of NCC Group. The borrowing agreements require the relevant borrower
to comply with certain general and financial covenants and reporting requirements. The general covenants
include maintaining a certain level of borrowings, revenue turnover, and cash outflows, and the financial
covenants include maintaining certain levels of liquidity, profitability, efficiency, debt coverage, and net
assets ratios. In case of a covenant breach, the relevant lender may request acceleration of its loan
repayment. As at 31 December 2012, NCC Group did not comply with certain financial covenants
stipulated in a loan agreement with one of its banks, which had the right to claim immediate settlement of
the loan (although this right was not exercised). Accordingly, as at 31 December 2012, this loan was
presented as a current liability in the amount of USD 226.1 million. In April 2013, NCC Group received a
waiver from that bank, and subsequently, the loan was repaid. Except for the matter described above, NCC
Group was in compliance with all restrictive covenants of the existing borrowings at 31 December 2012.
For changes to NCC Group’s borrowings since 31 December 2012, see “—Recent Developments—
Indebtedness”.
The following table sets out NCC Group’s loans and borrowings as at 31 December 2010, 2011 and 2012
by currency.
As at 31 December
2010 2011 2012
(USD millions)
RUB ................................................................................................. 212.5 200.0 211.8
EUR ................................................................................................. 48.1 34.4 21.5
USD ................................................................................................. 800.8 807.3 770.4
Total borrowings ............................................................................ 1,061.4 1,041.7 1,003.7
For information concerning a swap arrangement entered into in 2013 in respect of certain Rouble-
denominated borrowings, see “—Recent Developments—Indebtedness”.
The following table sets out NCC Group’s loans and borrowings for the years ended 31 December 2010,
2011 and 2012 by maturity (including interest and principal). For further information on the maturity
profile of NCC Group’s debt, see “—Recent Developments—Indebtedness”.

Page 31
As at 31 December
2010 2011 2012
(USD millions)
At call ....................................................................................... - - 226.1(1)
Due within one month ............................................................... 5.7 6.6 1.4
Due from one to three months................................................... 33.6 18.6 15.7
Due from three to twelve months .............................................. 221.7 98.8 108.4
Total current portion repayable in one year......................... 261.0 124.0 351.6(1)
Due from two to five years ....................................................... 877.3 950.7 816.0
Due thereafter ........................................................................... 231.2 197.8 4.8
Total loans and borrowings .................................................... 1,369.5 1,272.6 1,172.4
(1) As discussed above, a loan in the amount of USD 226.1 million was presented in current liabilities as at 31 December 2012
as NCC Group did not comply with certain financial covenants stipulated in the relevant loan agreement, which entitled the relevant lender to claim immediate settlement of the loan (although this right was not exercised). In April 2013, NCC
Group received a waiver from that bank, and subsequently, the loan was repaid.
CAPITAL COMMITMENTS
Construction of container terminals
NCC Group has entered into a number of contracts in connection with the construction of facilities at
ULCT and the expansion of existing facilities during the periods under review. Outstanding commitments
in respect of these contracts as at 31 December 2012 amounted to approximately USD 16 million (31
December 2011: USD 31 million).
Operating leases – NCC Group as a lessee
NCC Group leases certain equipment and office premises. Future minimum rental payments under non-
cancellable operating leases at the reporting date are as follows:
As at 31 December
2010 2011 2012
(USD millions)
Not later than one year ............................................................................. 3.2 4.0 3.8
Later than one year and not later than five years...................................... 12.0 14.9 12.6
Later than five years................................................................................. 83.7 104.1 76.5
Total ........................................................................................................ 98.9 123.0 92.9
Operating leases – NCC Group as a lessor
NCC Group leases certain non-residential premises and land plots at some of its terminals.
The relevant operating lease arrangements are mostly cancellable and have an average life of about one
year. Non-cancellable arrangements have terms from 1 to 5 years.
Future minimum lease receivables under non-cancellable operating leases at the dates specified are as
follows:
As at 31 December
2010 2011 2012
(USD millions)
Not later than one year ............................................................................. 2.3 3.0 3.1
Later than one year and not later than five years...................................... 7.4 6.7 3.3
Total ........................................................................................................ 9.7 9.7 6.4

Page 32
APPENDIX 3: UNAUDITED SELECTED ILLUSTRATIVE COMBINED FINANCIAL METRICS
Basis of preparation
The following unaudited selected illustrative combined financial performance and financial position
indicators (“Illustrative Combined Financial Metrics”) are presented to show the effects on those selected
indicators of the acquisition of NCC Group by the Company.
The Illustrative Combined Financial Metrics represent selected information prepared based on estimates
and assumptions deemed appropriate by the Group, which are preliminary and will be different to the pro
forma financial information included in the prospectus for the issue of GDRs to be approved by the UK’s
Listing Authority prior to the completion of the Transaction. The information is limited to certain selected
indicators, and in particular does not include all income statement or balance sheet line items that will form
part of the pro forma financial information.
The acquisition of NCC Group will be accounted for using the purchase method of accounting. According
to this method, the Group will recognise in its consolidated financial statements the assets acquired and
liabilities assumed at their acquisition-date fair values. Consideration paid shall be allocated between
identifiable tangible and intangible assets, identifiable liabilities and goodwill. Prospectively, the Group’s
net profit will be affected by additional depreciation of revalued items of property plant, and equipment and
amortization of identified intangible assets adjusted by the related deferred tax effect. The purchase price
allocation has not yet been completed, and accordingly no estimates or disclosures are included together
with the Illustrative Combined Financial Metrics.
The information presented remains preliminary, is unaudited, and provided for illustrative purposes only. It
does not purport to represent what the actual results of operations or financial position of the Group would
have been had NCC Group acquisition occurred on the dates specified below, nor is it necessarily
indicative of the results or financial position of the Group for any future periods. Because of their nature,
the Illustrative Combined Financial Metrics are based on a hypothetical situation and, therefore, do not
represent the actual financial position or results of operations of the Group. The actual financial position
and results of operations of the Group may differ significantly from the illustrative combined amounts
reflected herein.
The Illustrative Combined Financial Metrics relating to borrowings, net debt, trade and other receivables
are presented as if (i) the NCC Group acquisition had occurred on 31 December 2012, (ii) the Company
issued the new shares on 31 December 2012, (iii) the associated borrowings related to NCC Group
acquisition were received on 31 December 2012, and (iv) the loans provided by NCC Group to its
shareholders were settled on 31 December 2012.
The Illustrative Combined Financial Metrics relating to revenue, Adjusted EBITDA, adjustments to finance
income/costs and cash flows are presented as if (i) the NCC Group acquisition had occurred on 1 January
2012, and (ii) the associated borrowings related to the NCC Group acquisition were received on 1 January
2012.
In order that the presentation of the NCC Group financial information conforms to the presentation of the
Group’s consolidated financial statements, certain reclassifications have been made to the NCC Group
historical financial information included in Appendix 1. These adjustments are shown under
“Reclassification of NCC Group’s historical financial information as of and for the year ended 31
December 2012” below.
The Transaction will involve the following assumptions that have been adjusted for in the Illustrative
Combined Financial Metrics:

Page 33
At closing of the Transaction:
Bank borrowings to be obtained by the Group of USD 300 million, including to finance the cash
consideration to the Sellers of USD 291.0 million (Cash Component);
The Sellers will receive 17,195,122 GDRs representing 51,585,366 ordinary voting shares credited
as fully paid of the Company constituting approximately 9% of its entire issued share capital and
51,585,364 ordinary non-voting shares credited as fully paid, constituting approximately 9% of the
entire issued share capital of the Company following completion of the Transaction, on a fully
diluted basis;
Assignment of the long-term loan receivable by NCC Group from the immediate parent company
of one of the Sellers to the Group. As of 31 December 2012, the amount of this loan was USD
568.3 million. As such, the amount will subsequently be fully eliminated on consolidation of the
enlarged group and will not affect the amount of the total consolidated debt.
Pre-closing, condition precedents:
Conversion of shareholder loans of USD 53.4 million payable by ULCT to Eurogate International
GmbH (“Eurogate”), the minority shareholder of ULCT, into equity of ULCT;
Non-cash settlement of the short-term loans receivable by NCC Group from the immediate parent
companies of the Sellers, to be offset with a dividend to be declared by NCC Group. As of 31
December 2012, the amount of these loans was USD 155 million.
Selected illustrative financial performance and financial position indicators
(I) Revenue and Adjusted Earnings Before Interest, Tax, Depreciation and Amortization (“Adjusted
EBITDA”)
The following table sets out the Illustrative Combined revenues and adjusted earnings before interest,
tax, depreciation and amortization for the year ended 31 December 2012.
For the year ended 31 December 2012
Group
Reclassified
NCC Group17
Illustrative
Combined
(USD millions)
Revenue .................................................................................... 502 253 755
Cost of sales excluding depreciation, amortization and
impairment ...............................................................................
(172) (74) (246)
Administrative, selling and marketing expenses
excluding depreciation, amortization and impairment .............
(42) (15) (57)18
Adjusted EBITDA19 ................................................................ 288 164 452
In addition, had the transaction occurred on 1 January 2012, the Revenue of the Russian Ports segment on a
100% ownership basis would have grown to USD 631 million, consisting of USD 378 million for the
Group and USD 253 million for NCC Group. The Russian Ports Adjusted EBITDA on a 100% ownership
basis would have grown to USD 406 million, consisting of USD 242 million for the Group and USD 164
million for NCC Group.
17
See section (VI). 18
Acquisition-related transaction costs are not included. 19
See Appendix 5.
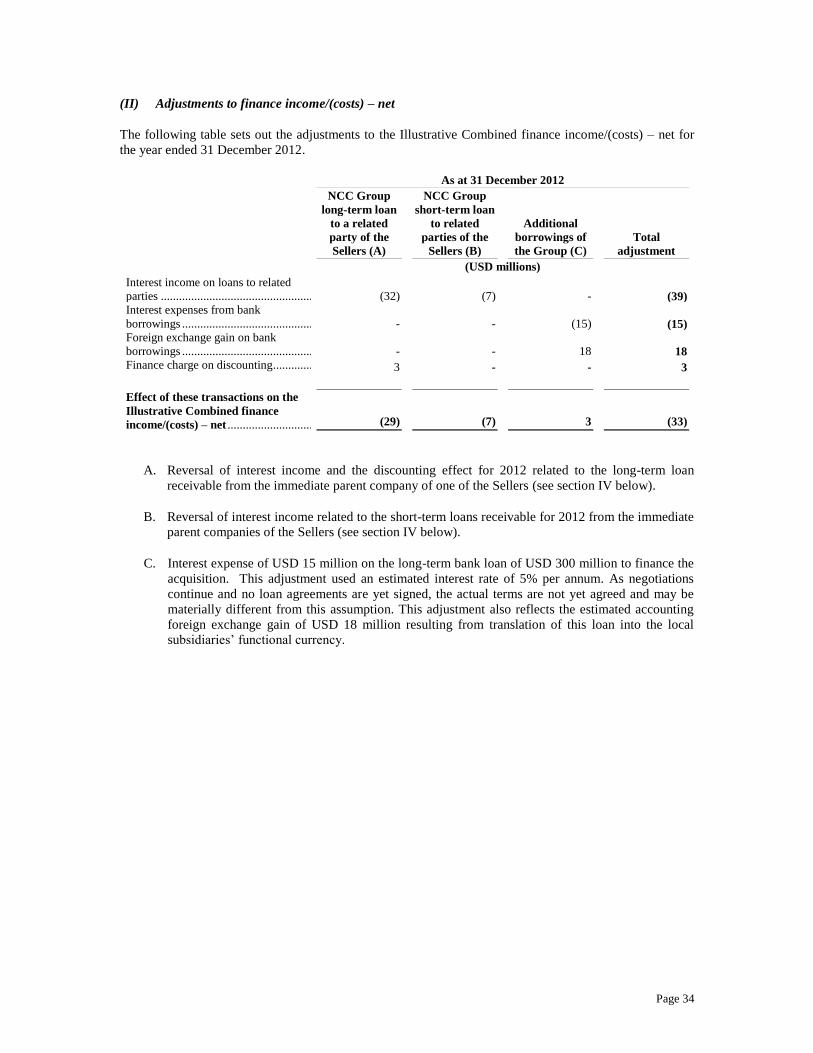
Page 34
(II) Adjustments to finance income/(costs) – net
The following table sets out the adjustments to the Illustrative Combined finance income/(costs) – net for
the year ended 31 December 2012.
As at 31 December 2012
NCC Group
long-term loan
to a related
party of the
Sellers (A)
NCC Group
short-term loan
to related
parties of the
Sellers (B)
Additional
borrowings of
the Group (C)
Total
adjustment
(USD millions)
Interest income on loans to related
parties ....................................................................................... (32) (7) - (39)
Interest expenses from bank
borrowings ................................................................................ - - (15) (15)
Foreign exchange gain on bank
borrowings ................................................................................ - - 18 18
Finance charge on discounting .................................................. 3 - - 3
Effect of these transactions on the
Illustrative Combined finance
income/(costs) – net ................................................................. (29) (7) 3 (33)
A. Reversal of interest income and the discounting effect for 2012 related to the long-term loan
receivable from the immediate parent company of one of the Sellers (see section IV below).
B. Reversal of interest income related to the short-term loans receivable for 2012 from the immediate
parent companies of the Sellers (see section IV below).
C. Interest expense of USD 15 million on the long-term bank loan of USD 300 million to finance the
acquisition. This adjustment used an estimated interest rate of 5% per annum. As negotiations
continue and no loan agreements are yet signed, the actual terms are not yet agreed and may be
materially different from this assumption. This adjustment also reflects the estimated accounting
foreign exchange gain of USD 18 million resulting from translation of this loan into the local
subsidiaries’ functional currency.

Page 35
(III) Borrowings and Net Debt
The following table sets out the Illustrative Combined borrowings and Net Debt as of 31 December 2012:
Group
Reclassified
NCC Group
Illustrative
adjustments Notes
Illustrative
Combined
(USD millions)
Borrowings
Current portion .......................................................................... 70 30320 (9) A 364
Non-current portion .................................................................. 263 70321 256 A, B 1,222
Total borrowings ..................................................................... 333 1,006 247 1,586
Bank deposits (over 90 days) .................................................... 14 - - 14
Cash and cash equivalents......................................................... 90 37 9 B 136
Total cash, cash equivalents
and deposits over 90 days .......................................................
104 37 9 150
Net Debt ................................................................................... 229 969 238 1,436
A. Relates to the conversion of loans payable by ULCT to Eurogate into the equity of ULCT. As of
31 December 2012, the amount of these loans was USD 53.4 million, of which USD 9.3 million
was the current portion. The total interest expense accrued on these loans in 2012 was USD 3.4
million, of which USD 3.2 million was capitalised on NCC Group’s balance sheet as part of
construction in progress.
B. Includes the additional long-term bank loan of USD 300 million, of which the Group will pay to
the Sellers USD 291.0 million in cash. The excess is recorded as part of “Cash and cash
equivalents”.
(IV) Adjustments to trade and other receivables (settlement of loans receivable by NCC Group from
related parties)
The following table sets out the adjustments to trade and other receivables as of 31 December 2012.
Group
Reclassified
NCC Group
Illustrative
adjustments
Illustrative
Combined
(USD millions)
Trade and other receivables
Non-current portion ...................... 13 57222 (568) 17
incl. loans to related parties ......... 11 568 (568) 11
Current portion .............................. 57 18223 (155) 84
incl. loans to related parties ......... 1 155 (155) 1
Total trade and other
receivables ................................... 70 754 (723) 101
incl. loans to related parties ......... 12 723 (723) 12
20
Consists of current loans and borrowings and obligations under finance lease balance sheet line items of NCC Group’s financial
statements. 21
Consists of non-current loans and borrowings and long-term obligations under finance lease balance sheet line items of NCC
Group’s financial statements. 22
Consists of non-current loans receivable, non-current finance lease receivables and other non-current assets balance sheet line items
of NCC Group’s financial statements. 23
Consists of current trade and other receivables, advances paid and prepaid expenses, finance lease receivables, taxes reimbursable
and prepaid and loans receivable balance sheet line items of NCC Group’s financial statements.

Page 36
Upon closing of the Transaction, the long-term loan receivable by NCC Group from the immediate parent
company of one of the Sellers will be assigned to the Group. As of 31 December 2012, the amount of this
loan was USD 568.3 million. As such, the amount will subsequently be fully eliminated on consolidation of
the enlarged group and will not affect the amount of the total consolidated debt.
The dividend to be declared by NCC Group will offset the short-term loans receivable by NCC Group from
the immediate parent companies of the Sellers, as a non-cash transaction. As of 31 December 2012, the
amount of these loans was USD 155 million.
(V) Cash flows
The following table illustrates the impact of the transactions described in the notes below on cash and cash
equivalents of the enlarged group. The Group expects that negotiations with banks on USD 300 million
loan facility to finance the acquisition will include a grace period in repayments of principal on the long
term loan and accordingly no principal repayments are anticipated in the short-term. Both non-cash
transactions and acquisition-related transaction costs are not shown:
Year ended 31 December 2012
Group
Reclassified
NCC
Group24
Illustrative
adjustments Notes
Illustrative
Combined
(USD millions)
Cash flows from operating
activities .................................................................................... 252 173 (1) A 424
Cash flows from investing
activities .................................................................................... (304) (31) (291) B (626)
incl. purchases of property,
plant and equipment ................................................................. (80) (19) - (99)
Cash flows from financing
activities .................................................................................... 1 (166) 285 C 120
Net decrease in cash and cash
equivalents ................................................................................ (51) (24) (7) (82)
A. Adjustment to reflect income tax effect of the accrued interest on USD 300 million long-term loan,
less the tax deductible foreign exchange impact on revaluation of the loan payable, assuming an
applicable tax rate of 20%.
B. Represents the cash consideration paid by the Group to the Sellers as part of the purchase price.
C. Net impact of the long-term loan of USD 300 million, less the related estimated interest cost of
USD 15 million.
24
See section (VI).

Page 37
(VI) Reclassification of NCC Group’s historical financial information as of and for the year ended
31 December 2012
In respect of the selected financial information included within this appendix, the following reclassification
adjustments have been made to the NCC Group historical financial information as of and for the year ended
31 December 2012, presented in Appendix 1, in order to align the presentation with the Group’s
consolidated financial statements, prepared in accordance with International Financial Reporting Standards
as adopted by the European Union and the requirements of the Cyprus Companies Law, Cap 113, as of and
for the year ended 31 December 2012:
Historical NCC
Group
Reclassification
adjustment
Reclassified
NCC Group
(USD millions)
Revenue .................................................... 253 - 253
Cost of sales less depreciation,
amortization and impairment .................... (68) (6) (74)
Selling, general and administrative
expenses ................................................... (14) 14 -
Other (expenses)/income, net ................... (6) 6 -
Administrative, selling and marketing
expenses less depreciation, amortization
and impairment ......................................... - (15) (15)
Other gains/(losses) – net ......................... - 1 1
Net impact of reclassification
adjustments ............................................. -
In order to align the presentation with the Group’s consolidated financial statements interest paid of USD
66.9 million in the Statement of Cash Flows (see section (V) above) has been reclassified from “Cash flows
from operating activities” to “Cash flows from financing activities” which resulted in an increase in “Cash
flows from operating activities” from USD 106 million to USD 173 million.

Page 38
APPENDIX 4: DECLARATIONS WITH REGARD TO INFORMATION
The directors of the Company consider that this announcement contains sufficient information about NCC
Group to provide a properly informed basis for assessing Global Port's financial position. The Company
confirms that, until such time as a prospectus, if required, is published in relation to an enlarged Global
Ports, the NCC Group acquisition arrangements are terminated or such other date as required by the
Financial Conduct Authority, the Company will make any announcement that would be required in order to
be compliant with its obligations under the Financial Conduct Authority Disclosure and Transparency
Rules on developments in relation to NCC Group as if NCC Group were already part of an enlarged Global
Ports.

Page 39
APPENDIX 5: PRESENTATION OF INFORMATION AND DEFINITIONS
This announcement contains certain operational and financial information concerning NCC Group,
obtained by the Group in connection with a limited due diligence process carried out prior to the acquisition
of NCC Group. Accordingly, the Group has had only a limited opportunity to collect and review this
information, and has not been able to confirm its completeness, accuracy or fairness. The financial
information in this release concerning NCC Group is based on the consolidated financial statements of
NCC Group prepared in accordance with IFRS as adopted by the EU.
The Group has obtained certain statistical, market and pricing information that is presented in this
announcement on such topics as the Russian container shipping market and related subjects from the
following third-party sources: ASOP and Drewry. The Group has accurately reproduced such information
and, as far as it is aware and is able to ascertain from information published by such third party sources, no
facts have been omitted that would render the reproduced information inaccurate or misleading. The Group
has not independently verified this third-party information. In addition, the official data published by
Russian governmental agencies may be substantially less complete or researched than that of more
developed countries.
Terms that require definitions are marked with capital letters in this announcement and definitions of which
are provided below in alphabetical order:
Adjusted EBITDA (a non-IFRS financial measure), in respect of Global Ports, is defined as profit for the
period before income tax expense, finance income/(costs) – net, depreciation of property, plant and
equipment, amortization of intangible assets, other gains/(losses) – net, impairment charge of property,
plant and equipment and impairment charge of goodwill, and in respect of NCC Group, is defined as profit
for the period before income tax expense, foreign exchange gains/(loss), net, finance costs, finance income
and depreciation and amortization expenses adjusted further for the one-off nonrecurring VAT tax refund
for previous periods as described in Note 8 of the NCC Group financial statements and certain other non-
cash or one-off nonrecurring gains and losses included within other income/(expenses), net in Note 8 of the
NCC Group financial statements. For a reconciliation of NCC Group’s Adjusted EBITDA to profit before
income tax expense, see “Non-IFRS measures: Adjusted EBITDA and Adjusted EBITDA Margin” in
Appendix 2.
Adjusted EBITDA Margin (a non-IFRS financial measure) is calculated as Adjusted EBITDA divided by
revenue, expressed as a percentage.
Far East Basin means the geographic region of South-East Russia, surrounding the Peter the Great Gulf,
including Vladivostok and the Nakhodka Gulf, including Nakhodka on the Sea of Japan.
Finnish Ports segment of Global Ports consists of two terminals in Finland, MLT Kotka and MLT Helsinki
(in port of Vuosaari), and three container depots (in each of which Container Finance currently has a 25%
effective ownership interest).
Gross Container Throughput represents total container throughput of a Group’s terminal or a Group’s
operating segment shown on a 100% basis. For the Russian Ports segment of Global Ports, it excludes the
container throughput of the Group’s inland container terminal, Yanino, and for NCC Group, it excludes the
container throughput of NCC Group’s inland container terminal, LT. Gross Throughput is throughput
shown on a 100% basis for each terminal, including terminals held through joint ventures and
proportionally consolidated.
Net Debt (a non-IFRS financial measure) for Global Ports is defined as the sum of current borrowings and
non-current borrowings, less cash and cash equivalents and bank deposits with maturity over 90 days and
for NCC Group is defined as the sum of current loans and borrowings, current obligations under finance

Page 40
lease, non-current loans and borrowings, non-current obligations under finance lease, less cash and cash
equivalents.
PLP includes Petrolesport OAO, OOO Farwater and various other entities (including some intermediate
holdings) that own and manage a container terminal in the St. Petersburg port, North-West Russia. The
Group owns a 100% effective ownership interest in PLP.
Russian Ports segment of Global Ports consists of the Group’s 100% interest in PLP, 100% interest in VSC
(with DP World having the remaining 25% interest until October 2012), and 75% interest in Moby Dik and
Yanino (in each of which Container Finance currently has the remaining 25% effective ownership interest).
TEU is defined as twenty-foot equivalent unit, which is the standard container used worldwide as the
uniform measure of container capacity; a TEU is 20 feet (6.06 metres) long and eight feet (2.44 metres)
wide and tall.
VSC includes Vostochnaya Stevedoring Company OOO and various other entities (including some
intermediate holdings) that own and manage a container terminal in Vostochny port near Nakhodka, Far-
East Russia. The Group owns a 100% effective ownership interest in VSC.

Page 41
APPENDIX 6: INVESTOR PRESENTATION
An investor presentation is also available at the link below:
www.globalports.com