Global petrochemical industry outlook shifting trade · PDF fileGlobal petrochemical industry...
42
Page 1 Macquarie Research is a division of Macquarie Group Limited, an affiliate and parent company of Macquarie Capital (USA) Inc., a registered broker - dealer and member of The Financial Industry Regulatory Authority (“FINRA”). All transactions by U.S. investors involving securities discussed in this report must be effected through Macquarie Capital (USA) Inc., which assumes responsibility in the U.S. for the contents of this report. Please read Disclaimer on Page 38-42 Global petrochemical industry outlook – shifting trade flows
Transcript of Global petrochemical industry outlook shifting trade · PDF fileGlobal petrochemical industry...

Page 1
Macquarie Research is a division of Macquarie Group Limited, an affiliate and parent company of Macquarie Capital (USA) Inc., a registered broker - dealer and
member of The Financial Industry Regulatory Authority (“FINRA”). All transactions by U.S. investors involving securities discussed in this report must be effected
through Macquarie Capital (USA) Inc., which assumes responsibility in the U.S. for the contents of this report.
Please read Disclaimer on Page 38-42
Global petrochemical industry outlook
– shifting trade flows

Page 2
Macquarie offers commodities expertise – a bit of background on us
30+ years in metals
markets, one of the
longest track records
globally
Over $US1 billion of
working capital
financing for
commodity companies
Trader and physical
supplier of natural gas,
LNG, power, oil, coal,
ethanol, grains and
freight
Unique ability to price
energy physical
products based on oil
indexation, volume
swing, tolling and load
shapes
Winner of the
Commodity Business
Awards 2011 & 2012 –
Excellency in Softs and
Agricultural Markets
Macquarie enters into
a supply & offtake
agreement with NARL
Refinery, a KNOC
company
Leading provider of
agricultural hedging
products
#4 physical gas
marketer in North
America, the highest-
ranked non-producer 1

Page 3
A macro outlook on the petrochemical industry –
gauging demand

Page 4 Source: Macquarie Capital (USA), September 2013
We forecast rising global economic health
-1%
0%
1%
2%
3%
4%
5%
6%
7%
8%
World Real GDP (y/y)
US Real GDP (y/y)
OECD Real GDP (y/y)
Euro zone Real GDP
(y/y)
Total Asia (ex JPN) Real
GDP (y/y)
SE Asia Real GDP (y/y)
NE Asia Real GDP (y/y)
China Real GDP (y/y)
Brazil Real GDP (y/y)
Global GDP Growth Estimates
2012 2013E 2014E

Page 5 Source: Macquarie Capital (USA), September 2013
We forecast rising global economic health
-2%
-1%
0%
1%
2%
3%
4%
5%
6%
7%
8%
World Real GDP US Real GDP OECD Real GDP Euro zone Real GDP Total Asia (ex JPN) Real GDP
China Real GDP
2013 GDP Estimates
2013 LTM 2013 YTD 2013E 4Q13E

Page 6
A macro outlook on the petrochemical industry – a
look at the cost landscape

Page 7 Source: IHS, Macquarie Capital (USA), September 2013
Oil-to-gas ratio likely to remain elevated
0x
10x
20x
30x
40x
50x
19992000
20012002
20032004
20052006
20072008
20092010
20112012
2013E
2014E
2015E
Macquarie - Predicted Oil/Gas Ratio

Page 8 Source: IHS, Macquarie Capital (USA), September 2013
Global Cost Setting – Advantage USA
-
200
400
600
800
1,000
1,200
0 20 40 60 80 100 120 140 160 180
20122007
North East Asia
Middle East Ethane
Middle East Avg
Alberta Ethane
US Ethane
US Avg
South East AsiaWestern Europe Avg
North East Asia
Middle East Avg
South East Asia
US AvgWestern Europe Avg
Ethylene Production Costs,
US$/MT
Cumulative Ethylene Capacity, million MT
2016E
US Ethane
US Avg

Page 9
Ethylene cash costs – North America remains highly favorable
Source: IHS, Macquarie Capital (USA), September 2013
0
200
400
600
800
1000
1200
1400
2000 2001 2002 2003 2004 2005 2006 2007 2008 2009 2010 2011 2012 2013E 2014E
Regional Cash Costs (US$/MT)
North America Northeast Asia Southeast Asia West Europe
North American cash costs have dropped 65% since 2008

Page 10 Source: Bloomberg, Macquarie Capital (USA), September 2013
North American ethane prices have de-coupled from oil
$0
$2
$4
$6
$8
$10
$12
$14
0
20
40
60
80
100
120
140
1Q
02
3Q
02
1Q
03
3Q
03
1Q
04
3Q
04
1Q
05
3Q
05
1Q
06
3Q
06
1Q
07
3Q
07
1Q
08
3Q
08
1Q
09
3Q
09
1Q
10
3Q
10
1Q
11
3Q
11
1Q
12
3Q
12
1Q
13
Brent ($/bl) - LHS Ethane (c/gal) - LHS Natural Gas ($/mmbtu) - RHS
Ethane has decoupled from crude
$0
$2
$4
$6
$8
$10
$12
$14
0
20
40
60
80
100
120
140
160
180
1Q
02
3Q
02
1Q
03
3Q
03
1Q
04
3Q
04
1Q
05
3Q
05
1Q
06
3Q
06
1Q
07
3Q
07
1Q
08
3Q
08
1Q
09
3Q
09
1Q
10
3Q
10
1Q
11
3Q
11
1Q
12
3Q
12
1Q
13
Brent ($/bl) - LHS Propane (c/gal) - LHS Natural Gas ($/mmbtu) - RHS
Propane has also fallen sharply, towards nat. gas

Page 11 Source: Macquarie Capital (USA), September 2013
US ethane production poised to rise further, sharply…

Page 12
Ethylene margins – a regional outlook
Source: IHS, Macquarie Capital (USA), September 2013
0
200
400
600
800
1000
2000 2001 2002 2003 2004 2005 2006 2007 2008 2009 2010 2011 2012 2013 2014
Regional Ethylene Margins (US$/MT)
North America NorthEast Asia SouthEast Asia Western Europe
0
100
200
300
400
500
600
North America NorthEast Asia SouthEast Asia Western Europe
Regional Ethylene Margins (US$/MT)
2000-2009 Avg 2010-2014E Avg

Page 13
A macro outlook on the petrochemical industry
– what do these shifts mean for co-products
and aromatics?
Page 14
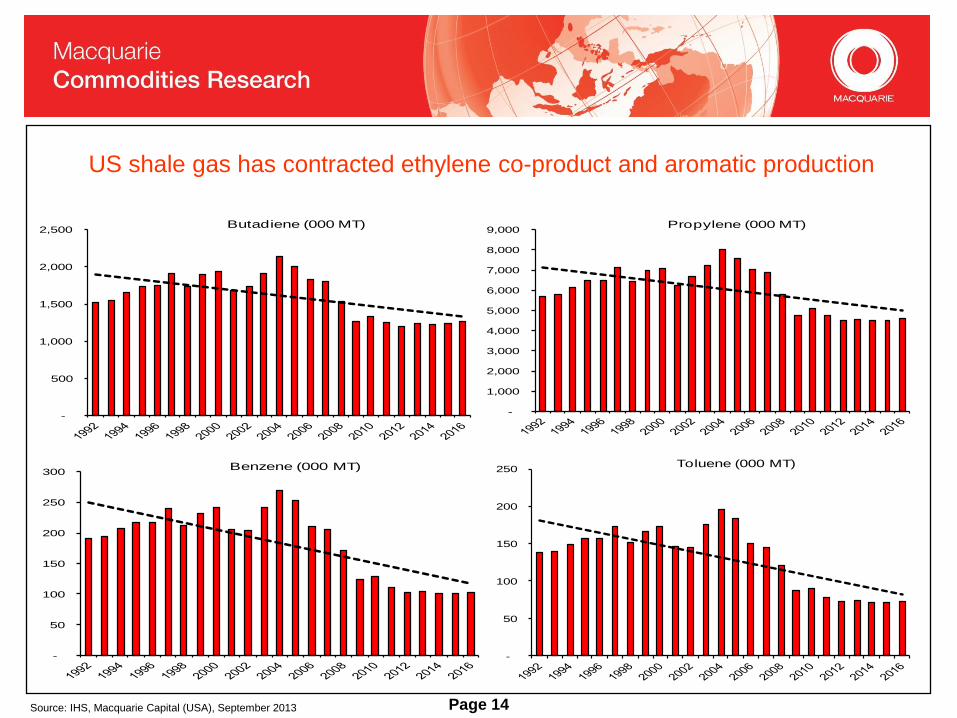
US shale gas has contracted ethylene co-product and aromatic production
-
500
1,000
1,500
2,000
2,500 Butadiene (000 MT)
-
1,000
2,000
3,000
4,000
5,000
6,000
7,000
8,000
9,000 Propylene (000 MT)
-
50
100
150
200
250
300 Benzene (000 MT)
-
50
100
150
200
250 Toluene (000 MT)
Source: IHS, Macquarie Capital (USA), September 2013

Page 15 Source: Bloomberg, IHS, Macquarie Capital (USA), September 2013
Benzene values have lifted amid tightening supply
-500
-400
-300
-200
-100
0
100
200
0
50
100
150
200
250
300
350
May-11Aug-11Nov-11Feb-12May-12Aug-12Nov-12 Feb-13May-13
OtherW. EuropeAsiaDelta: Asia Spot - U.S. Contract
Thousand Metric Tons Dollars Per Metric Ton
U.S. Benzene Imports
0
100
200
300
400
500
600
700
Jan-08
Jul-08
Jan-09
Jul-09
Jan-10
Jul-10
Jan-11
Jul-11
Jan-12
Jul-12
Jan-13
Jul-13
Benzene Contract SM
Spot SM Cumene, Formula
Cents Per Gallon
U.S. Benzene Netback Values

Page 16 Source: Bloomberg, IHS, Macquarie Capital (USA), September 2013
Margin and Spread Forecasts - Asia
2010 2011 2012 2013E 2014E 2015E Avg (2003-2012)
Dubai Crude (US$/bbl) 78 106 109 105 113 115 69
NCC benchmark margin (US$) 282 285 250 260 275 302 259
Ethylene-Naphtha spread 386 260 276 350 380 430 371
Propylene-Naphtha margin 474 510 411 400 380 400 421
Benzene-Naphtha spread 200 175 276 400 450 450 256
Butadiene-Naphtha spread 1,085 1,895 1,155 700 860 1,000 736
PX-Naphtha spread 328 616 570 570 500 480 438
HDPE-Naphtha 457 387 373 452 482 583 509
PP-Naphtha 501 500 378 421 434 507 494
HDPE-Ethylene 70 125 94 100 100 150 135
PP-Propylene 25 -10 -31 20 50 100 69
PVC-Ethylene 391 418 320 350 370 400 358
MEG-Ethylene 211 465 291 370 430 470 300
PTA-PX 256 228 80 50 40 50 177
Polyester cash margin 397 336 200 160 200 250 305

Page 17
A macro outlook on the petrochemical industry – a
quick look at technology and supply growth

Page 18
LPG
• BP/UOP, Cyclar
• Mobil, M-2 Forming
• IFP/Salutec, Aroforming
• Research Association of Japan, Z F
orming
• Asahi Chemical, Alpha Process
Methanol
• In research
Other Advantaged Feedstocks (Paraff
inic, etc)
• ChevronPhillips, Aromax
• UOP, RZ Platforming
New Technologies for Benzene – not
yet commercialized
Source: IHS, CEH, Macquarie Capital (USA), September 2013
Example: Benzene. Most new technologies will unlikely be meaningful near term

Page 19 Source: IHS, Macquarie Capital (USA), September 2013
Regional capacity growth
Additional
Capacity
% of
Additional
Additional
Capacity
% of
Additional
Additional
Capacity
% of
Additional
Middle East 3,127 10% 14,192 40% 13,281 26%North America 8,863 29% 791 2% 11,090 21%Northeast Asia 7,994 26% 11,587 32% 16,894 33%Southeast Asia 3,177 10% 2,541 7% 4,538 9%Western Europe 5,045 17% 2,850 8% (2,264) -4%Others 2,122 7% 3,874 11% 8,052 16%
30,328 35,835 51,591
Additional
Capacity
% of
Additional
Additional
Capacity
% of
Additional
Additional
Capacity
% of
Additional
Middle East 154 1% 1,653 15% 3,454 16%North America 1,899 18% (1,071) -10% 900 4%Northeast Asia 6,188 60% 7,399 68% 9,410 42%Southeast Asia 1,530 15% 2,191 20% 2,985 13%Western Europe 478 5% 25 0% 120 1%Others 55 1% 679 6% 5,296 24%
10,304 10,876 22,165
Additional
Capacity
% of
Additional
Additional
Capacity
% of
Additional
Additional
Capacity
% of
Additional
Middle East 1,049 6% 5,369 28% 6,293 33%North America 6,104 36% 1,916 10% 4,868 25%Northeast Asia 793 5% 1,262 7% 772 4%Southeast Asia 2,233 13% 2,080 11% 3,701 19%Western Europe 5,268 31% 3,071 16% (1,333) -7%Others 1,497 9% 5,679 29% 4,967 26%
16,944 19,377 19,268
Regional Propylene Capacity Growth (000 MT)
1990-1999 2000-2009 2010-2019E
Regional Ethylene Capacity Growth (000 MT)
1990-1999 2000-2009 2010-2019E
Regional Paraxylene Capacity Growth (000 MT)
1990-1999 2000-2009 2010-2019E
Page 20 Source: Macquarie Capital (USA), September 2013
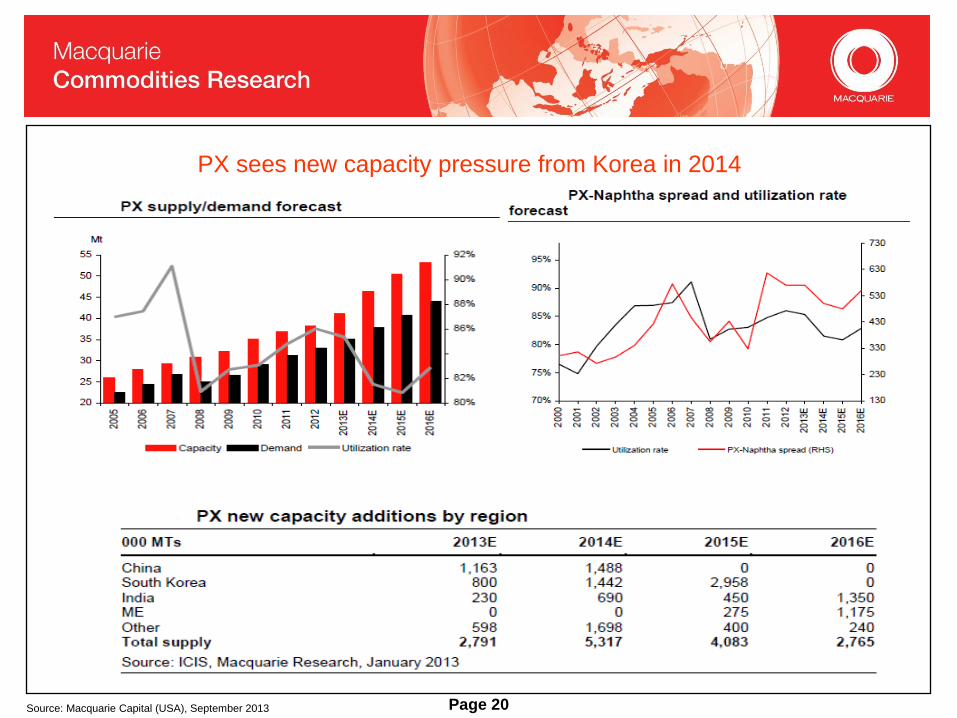
PX sees new capacity pressure from Korea in 2014

Page 21 Source: Company data, Macquarie Capital (USA), September 2013
On-Purpose Propylene and Butadiene Production Company Project Capacity (t/yr) Location Cost Start-up Likelihood
Dow Chemical PDH 750,000 tonnes Texas 2015 Likely
Enterprise Products PDH 750,000 tonnes Texas 2015 Committed
Enterprise Products PDH 750,000 tonnes Texas 2015 Speculative
Formosa Plastics PDH 600,000 tonnes Texas 2016 Likely
Dow Chemical PDH TBD US Gulf 2018 Speculative
Williams PDH 1,000,000 tonnes Alberta TBD Speculative
LyondellBasell Metathesis TBD Texas TBD
PetroLogistics PDH Expansion Texas TBD Likely
TPC Group Dehydro unit Texas $300m 2014
TPC Group OXO-D unit 272,000 tonnes Texas $300m 2015
Company name Location Capacity ('000 t/yr) Start-up date Progress
Tianjin Bohai Chemical Industry (Group) Tianjin 600 Late August 2013 Under construction
Ningbo Haiyue New Materials Co Ningbo, Zhejiang 600 Early 2014 Under construction
Zhejiang Satellite Energy Co Pinghu, Zhejiang 450 Early 2014 Under construction
Sanyuan Petrochemical Shaoxing, Zhejiang 450 End 2013 Under construction
Yantai Wanhua Group Yantai, Shandong 750 End 2014 Under construction
Zhangjiagang Yangzijiang Petrochemical Zhangjiagang, Jiangsu 600 Early 2014 Under construction
600 2016 Planning
Haiwei Group Hengshui, Hebei 500 2015 Under construction
500 2017 Planning
Huanghua, Hebei 500 N/A Planning
500 N/A Planning
Fujian Meide Petrochemical Fuqing, Fujian 660 End 2015 Under construction
660 N/A Planning
Shandong Haili Chemical Industry Co Dafeng, Jiangsu 750 N/A Construction to start in H1 2013
ZOUEC Ningbo, Zhejiang 660 N/A Waiting for approval
660 N/A Waiting for approval
Changjiang Gas Chemical Nantong, Jiangsu 650 N/A Suspended
Total 10,090
China's PDH Projects under Construction or in Planning Stage
Announced On-Purpose Propylene Projects
Announced On-Purpose Butadiene Projects
Page 22 Source: Company data, Macquarie Capital (USA), September 2013
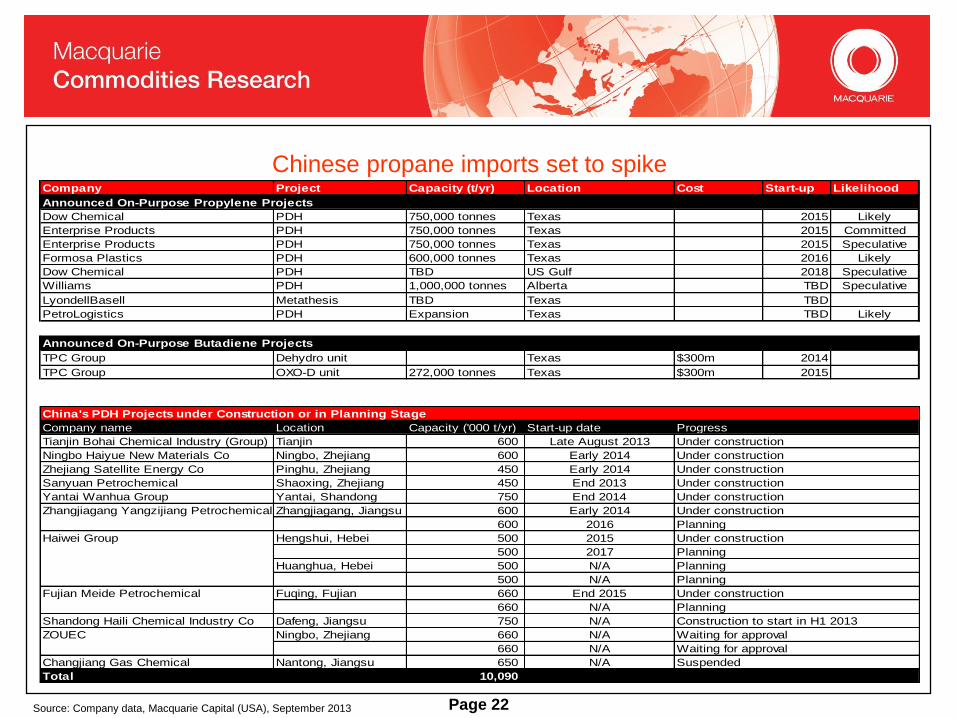
Company Project Capacity (t/yr) Location Cost Start-up Likelihood
Dow Chemical PDH 750,000 tonnes Texas 2015 Likely
Enterprise Products PDH 750,000 tonnes Texas 2015 Committed
Enterprise Products PDH 750,000 tonnes Texas 2015 Speculative
Formosa Plastics PDH 600,000 tonnes Texas 2016 Likely
Dow Chemical PDH TBD US Gulf 2018 Speculative
Williams PDH 1,000,000 tonnes Alberta TBD Speculative
LyondellBasell Metathesis TBD Texas TBD
PetroLogistics PDH Expansion Texas TBD Likely
TPC Group Dehydro unit Texas $300m 2014
TPC Group OXO-D unit 272,000 tonnes Texas $300m 2015
Company name Location Capacity ('000 t/yr) Start-up date Progress
Tianjin Bohai Chemical Industry (Group) Tianjin 600 Late August 2013 Under construction
Ningbo Haiyue New Materials Co Ningbo, Zhejiang 600 Early 2014 Under construction
Zhejiang Satellite Energy Co Pinghu, Zhejiang 450 Early 2014 Under construction
Sanyuan Petrochemical Shaoxing, Zhejiang 450 End 2013 Under construction
Yantai Wanhua Group Yantai, Shandong 750 End 2014 Under construction
Zhangjiagang Yangzijiang Petrochemical Zhangjiagang, Jiangsu 600 Early 2014 Under construction
600 2016 Planning
Haiwei Group Hengshui, Hebei 500 2015 Under construction
500 2017 Planning
Huanghua, Hebei 500 N/A Planning
500 N/A Planning
Fujian Meide Petrochemical Fuqing, Fujian 660 End 2015 Under construction
660 N/A Planning
Shandong Haili Chemical Industry Co Dafeng, Jiangsu 750 N/A Construction to start in H1 2013
ZOUEC Ningbo, Zhejiang 660 N/A Waiting for approval
660 N/A Waiting for approval
Changjiang Gas Chemical Nantong, Jiangsu 650 N/A Suspended
Total 10,090
China's PDH Projects under Construction or in Planning Stage
Announced On-Purpose Propylene Projects
Announced On-Purpose Butadiene Projects
Chinese propane imports set to spike

Page 23
Challenges relating to feedstock availability

Page 24
China shale: Vast resource base, ambitious targets
Source: EIA, Macquarie Capital (USA), September 2013

Page 25
China shale: Vast dry gas and oil potential, wet gas
(NGL) opportunity appears less well defined
Source: EIA, Macquarie Capital (USA), September 2013

Page 26 Source: IEA, Macquarie Capital (USA), September 2013
NGL Supply Trends

Page 27
U.S. NGL Production Grows Lighter
Source: EIA, Macquarie Capital (USA), September 2013

Source: IEA, Macquarie Capital, Naphtha and NGLs analysis, September 2013
New crudes more paraffinic but N+2A ratings comparable to old crudes
Page 28

Page 29
Will China stabilize and recharge growth

Page 30
Regional indicators denote improving conditions
40
45
50
55
60
Ma
r-1
2
Ap
r-1
2
Ma
y-1
2
Ju
n-1
2
Ju
l-1
2
Au
g-1
2
Se
p-1
2
Oc
t-1
2
No
v-1
2
De
c-1
2
Ja
n-1
3
Fe
b-1
3
Ma
r-1
3
Ap
r-1
3
Ma
y-1
3
Ju
n-1
3
Ju
l-1
3
Au
g-1
3
Regional PMI
US PMI Germany PMI China PMI
45
50
55
Ma
r-1
2
Ap
r-1
2
Ma
y-1
2
Ju
n-1
2
Ju
l-1
2
Au
g-1
2
Se
p-1
2
Oc
t-1
2
No
v-1
2
De
c-1
2
Ja
n-1
3
Fe
b-1
3
Ma
r-1
3
Ap
r-1
3
Ma
y-1
3
Ju
n-1
3
Ju
l-1
3
Au
g-1
3
China PMI by subindex
China New Orders PMIChina New Export Orders PMIChina Manufacturing PMI
Source: Bloomberg, Macquarie Capital (USA), September 2013
Page 31
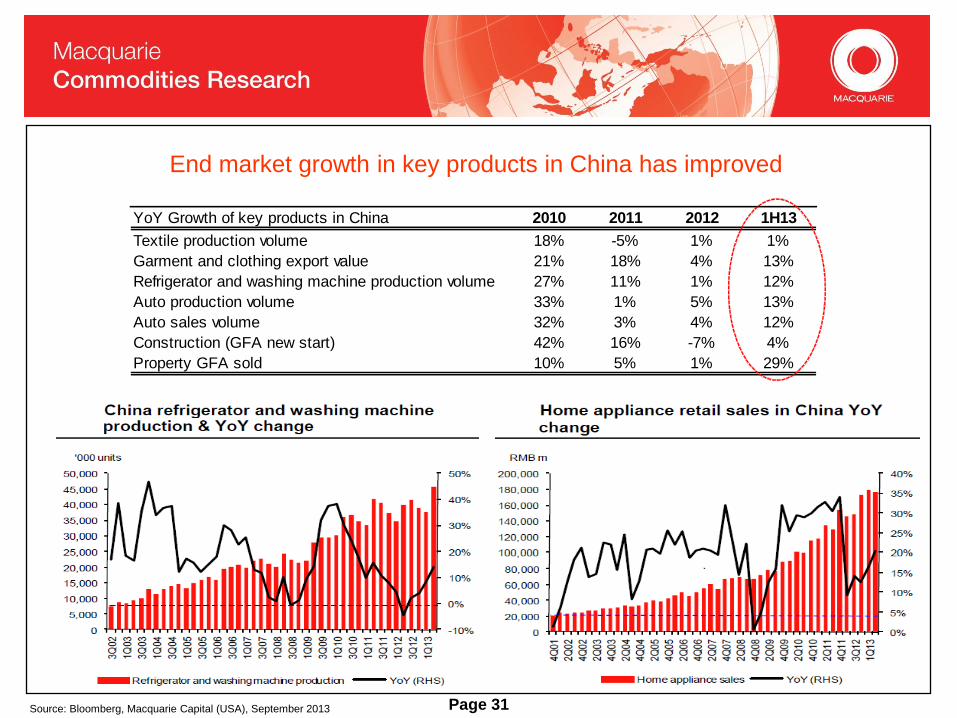
End market growth in key products in China has improved
YoY Growth of key products in China 2010 2011 2012 1H13
Textile production volume 18% -5% 1% 1%
Garment and clothing export value 21% 18% 4% 13%
Refrigerator and washing machine production volume 27% 11% 1% 12%
Auto production volume 33% 1% 5% 13%
Auto sales volume 32% 3% 4% 12%
Construction (GFA new start) 42% 16% -7% 4%
Property GFA sold 10% 5% 1% 29%
Source: Bloomberg, Macquarie Capital (USA), September 2013
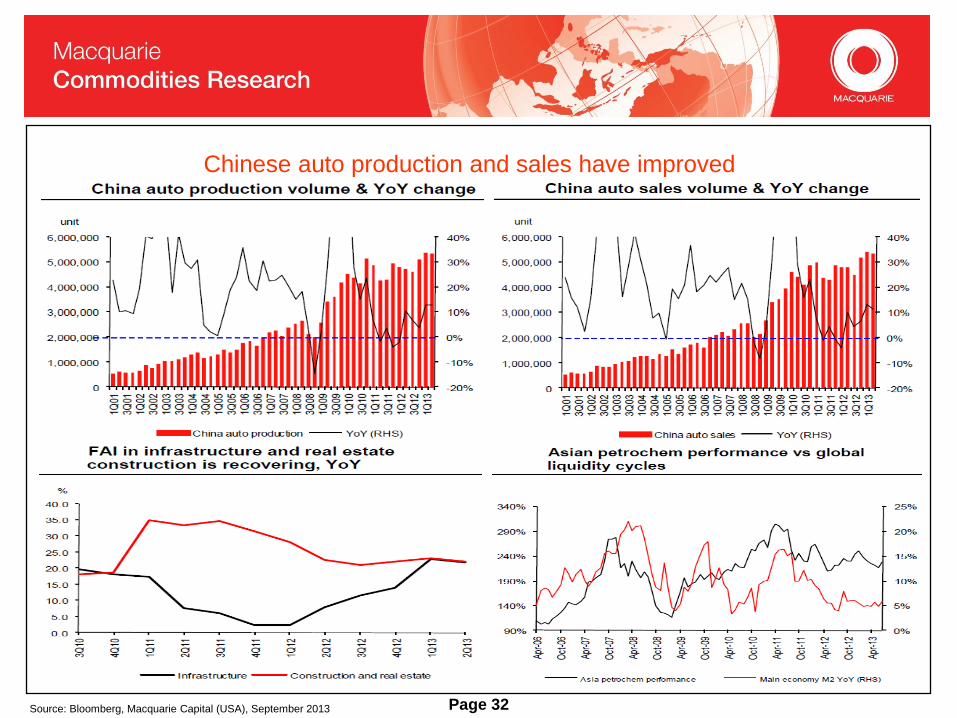
Page 32
Chinese auto production and sales have improved
Source: Bloomberg, Macquarie Capital (USA), September 2013

Page 33
China residential property sold vs. new starts (6m lag)
Source: Bloomberg, Macquarie Capital (USA), September 2013
-60%
-40%
-20%
0%
20%
40%
60%
80%
100%
120%
Jan
-10
Ap
r-10
Jul-1
0
Oct-
10
Jan
-11
Ap
r-11
Jul-1
1
Oct-
11
Jan
-12
Ap
r-12
Jul-1
2
Oct-
12
Jan
-13
Ap
r-13
Jul-1
3
GFA new starts (6m lag, YoY,%) GFA sold (YoY,%)

Page 34
Conclusions
•Demand is moving in the right direction – we anticipate a YoY pickup globally in 2014
•A wide oil/gas ratio will persist – this showcases a significant difference in regional base chemical production
costs.
•Ethylene cracker co-product production will remain under pressure – this due to light feeds
•NGL and ethylene –chain export opportunities out of North America are set to rise., but many co-products (i.e.
benzene) will need to be imported
•Companies from around the world are studying investment opportunities in the US.
•Capex targeting on purpose co-product production has picked up in China.
•China’s forecast growth rates will not be what they were, and we remain cautious medium term.
.
Source: IHS, Macquarie Capital (USA), September 2013

Page 35 Source: Bloomberg, IHS, Macquarie Capital (USA), September 2013
Additional tables

Page 36 Source: Bloomberg, IHS, Macquarie Capital (USA), September 2013
Additional tables

Page 37 Source: Bloomberg, IHS, Macquarie Capital (USA), September 2013
Additional tables

Page 38 Page 38
Important disclosures:
Recommendation definitions
Macquarie - Australia/New Zealand
Outperform – return > 3% in excess of benchmark return
Neutral – return within 3% of benchmark return
Underperform – return > 3% below benchmark return
Benchmark return is determined by long term nominal GDP growth
plus 12 month forward market dividend yield
Macquarie – Asia/Europe
Outperform – expected return >+10%
Neutral – expected return from -10% to +10%
Underperform – expected <-10%
Macquarie First South - South Africa
Outperform – return > 10% in excess of benchmark return
Neutral – return within 10% of benchmark return
Underperform – return > 10% below benchmark return
Macquarie - Canada
Outperform – return > 5% in excess of benchmark return
Neutral – return within 5% of benchmark return
Underperform – return > 5% below benchmark return
Macquarie - USA
Outperform – return > 5% in excess of benchmark return
Neutral – return within 5% of benchmark return
Underperform – return > 5% below benchmark return
Volatility index definition* This is calculated from the volatility of historic
price movements.
Very high–highest risk – Stock should be
expected to move up or down 60-100% in a year
– investors should be aware this stock is highly
speculative.
High – stock should be expected to move up or
down at least 40-60% in a year – investors should
be aware this stock could be speculative.
Medium – stock should be expected to move up
or down at least 30-40% in a year.
Low–medium – stock should be expected to
move up or down at least 25-30% in a year.
Low – stock should be expected to move up or
down at least 15-25% in a year.
* Applicable to Australian/NZ stocks only
Recommendation – 12 months
Note: Quant recommendations may differ from
Fundamental Analyst recommendations
Financial definitions
All "Adjusted" data items have had the following
adjustments made:
Added back: goodwill amortisation, provision for
catastrophe reserves, IFRS derivatives & hedging, IFRS
impairments & IFRS interest expense
Excluded: non recurring items, asset revals, property
revals, appraisal value uplift, preference dividends &
minority interests
EPS = adjusted net profit /efpowa*
ROA = adjusted ebit / average total assets
ROA Banks/Insurance = adjusted net profit /average
total assets
ROE = adjusted net profit / average shareholders funds
Gross cashflow = adjusted net profit + depreciation
*equivalent fully paid ordinary weighted average number
of shares
All Reported numbers for Australian/NZ listed stocks
are modelled under IFRS (International Financial
Reporting Standards).
Recommendation proportions – For quarter ending 30 June 2013
AU/NZ Asia RSA USA CA EUR
Outperform 49.80% 57.68% 48.05% 41.13% 61.75% 47.10% (for US coverage by MCUSA, 8.12% of stocks covered are investment banking clients)
Neutral 39.85% 24.45% 42.86% 54.70% 34.42% 30.89% (for US coverage by MCUSA, 6.60% of stocks covered are investment banking clients)
Underperform 10.35% 17.87% 9.09% 4.17% 3.83% 22.01% (for US coverage by MCUSA, 0.00% of stocks covered are investment banking clients)

Page 39 Page 39
Company Specific Disclosures:
Important disclosure information regarding the subject companies covered in this report is available at www.macquarie.com/research/disclosures.
Analyst Certification:
The views expressed in this research accurately reflect the personal views of the analyst(s) about the subject securities or issuers and no part of the compensation of the analyst(s) was,
is, or will be directly or indirectly related to the inclusion of specific recommendations or views in this research. The analyst principally responsible for the preparation of this research
receives compensation based on overall revenues of Macquarie Group Ltd ABN 94 122 169 279 (AFSL No. 318062) (MGL) and its related entities (the Macquarie Group) and has taken
reasonable care to achieve and maintain independence and objectivity in making any recommendations.
General Disclaimers:
Macquarie Securities (Australia) Ltd; Macquarie Capital (Europe) Ltd; Macquarie Capital Markets Canada Ltd; Macquarie Capital Markets North America Ltd; Macquarie Capital (USA)
Inc; Macquarie Capital Securities Ltd and its Taiwan branch; Macquarie Capital Securities (Singapore) Pte Ltd; Macquarie Securities (NZ) Ltd; and Macquarie First South Securities (Pty)
Limited; Macquarie Capital Securities (India) Pvt Ltd; Macquarie Capital Securities (Malaysia) Sdn Bhd; Macquarie Securities Korea Limited and Macquarie Securities (Thailand) Ltd are
not authorized deposit-taking institutions for the purposes of the Banking Act 1959 (Commonwealth of Australia), and their obligations do not represent deposits or other liabilities of
Macquarie Bank Limited ABN 46 008 583 542 (MBL) or MGL. MBL does not guarantee or otherwise provide assurance in respect of the obligations of any of the above mentioned
entities. MGL provides a guarantee to the Monetary Authority of Singapore in respect of the obligations and liabilities of Macquarie Capital Securities (Singapore) Pte Ltd for up to SGD 35
million. This research has been prepared for the general use of the wholesale clients of the Macquarie Group and must not be copied, either in whole or in part, or distributed to any other
person. If you are not the intended recipient you must not use or disclose the information in this research in any way. If you received it in error, please tell us immediately by return e-mail
and delete the document. We do not guarantee the integrity of any e-mails or attached files and are not responsible for any changes made to them by any other person. MGL has
established and implemented a conflicts policy at group level (which may be revised and updated from time to time) (the "Conflicts Policy") pursuant to regulatory requirements (including
the FSA Rules) which sets out how we must seek to identify and manage all material conflicts of interest. Nothing in this research shall be construed as a solicitation to buy or sell any
security or product, or to engage in or refrain from engaging in any transaction. In preparing this research, we did not take into account your investment objectives, financial situation or
particular needs. Before making an investment decision on the basis of this research, you need to consider, with or without the assistance of an adviser, whether the advice is appropriate
in light of your particular investment needs, objectives and financial circumstances. There are risks involved in securities trading. The price of securities can and does fluctuate, and an
individual security may even become valueless. International investors are reminded of the additional risks inherent in international investments, such as currency fluctuations and
international stock market or economic conditions, which may adversely affect the value of the investment. This research is based on information obtained from sources believed to be
reliable but we do not make any representation or warranty that it is accurate, complete or up to date. We accept no obligation to correct or update the information or opinions in it.
Opinions expressed are subject to change without notice. No member of the Macquarie Group accepts any liability whatsoever for any direct, indirect, consequential or other loss arising
from any use of this research and/or further communication in relation to this research. Clients should contact analysts at, and execute transactions through, a Macquarie Group entity in
their home jurisdiction unless governing law permits otherwise.
Disclaimer: The information contained in this e-mail is confidential and has been furnished to you solely for your use. You may not disclose, reproduce or distribute the information in any
way. Macquarie does not guarantee the integrity of this e-mail or attached files.
Macquarie Capital (USA) Inc. affiliate research reports and affiliate employees are not subject to the disclosure requirements of FINRA rules. Any persons receiving this report directly from
Macquarie Capital (USA) Inc. and wishing to effect a transaction in any security described herein should do so with Macquarie Capital (USA) Inc. In Germany, this research is issued
and/or distributed by Macquarie Capital (Europe) Limited, Niederlassung Deutschland, which is authorised and regulated by the UK Financial Services Authority and in Germany by BaFin.
Macquarie salespeople, traders and other professionals may provide oral or written market commentary or trading strategies to our clients that reflect opinions which are contrary to the
opinions expressed in this research. Macquarie Research produces a variety of research products including, but not limited to, fundamental analysis, macro-economic analysis,
quantitative analysis, and trade ideas. Recommendations contained in one type of research product may differ from recommendations contained in other types of research, whether as a
result of differing time horizons, methodologies, or otherwise.

Page 40 Page 40
Country-Specific Disclaimers:
Australia: In Australia, research is issued and distributed by Macquarie Securities (Australia) Ltd (AFSL No. 238947), a participating organisation of the Australian Securities Exchange.
New Zealand: In New Zealand, research is issued and distributed by Macquarie Securities (NZ) Ltd, a NZX Firm. Canada: In Canada, research is prepared, approved and distributed by
Macquarie Capital Markets Canada Ltd, a participating organisation of the Toronto Stock Exchange, TSX Venture Exchange & Montréal Exchange. Macquarie Capital Markets North
America Ltd., which is a registered broker-dealer and member of FINRA, accepts responsibility for the contents of reports issued by Macquarie Capital Markets Canada Ltd in the United
States and sent to US persons. Any person wishing to effect transactions in the securities described in the reports issued by Macquarie Capital Markets Canada Ltd should do so with
Macquarie Capital Markets North America Ltd. The Research Distribution Policy of Macquarie Capital Markets Canada Ltd is to allow all clients that are entitled to have equal access to our
research. United Kingdom: In the United Kingdom, research is issued and distributed by Macquarie Capital (Europe) Ltd, which is authorised and regulated by the Financial Services
Authority (No. 193905). Germany: In Germany, research is issued and distributed by Macquarie Capital (Europe) Ltd, Niederlassung Deutschland, which is authorised and regulated in the
United Kingdom by the Financial Services Authority (No. 193905). France: In France, research is issued and distributed by Macquarie Capital (Europe) Ltd, which is authorised and
regulated in the United Kingdom by the Financial Services Authority (No. 193905). Hong Kong & Mainland China: In Hong Kong, research is issued and distributed by Macquarie Capital
Securities Ltd, which is licensed and regulated by the Securities and Futures Commission. In Mainland China, Macquarie Securities (Australia) Limited Shanghai Representative Office only
engages in non-business operational activities excluding issuing and distributing research. Only non-A share research is distributed into Mainland China by Macquarie Capital Securities Ltd.
Japan: In Japan, research is Issued and distributed by Macquarie Capital Securities (Japan) Limited, a member of the Tokyo Stock Exchange, Inc., Osaka Securities Exchange Co. Ltd.
(Financial Instruments Firm, Kanto Financial Bureau (kin-sho) No. 231, a member of Japan Securities Dealers Association and The Financial Futures Association of Japan and Japan
Investment Advisers Association). India: In India, research is issued and distributed by Macquarie Capital Securities (India) Pty Ltd., 92, Level 9, 2 North Avenue, Maker Maxity, Bandra
Kurla Complex, Bandra (East), Mumbai – 400 051, India, which is a SEBI registered Stock Broker having membership with National Stock Exchange of India Limited (INB231246738) and
Bombay Stock Exchange Limited (INB011246734). Malaysia: In Malaysia, research is issued and distributed by Macquarie Capital Securities (Malaysia) Sdn. Bhd. (Company registration
number: 463469-W) which is a Participating Organisation of Bursa Malaysia Berhad and a holder of Capital Markets Services License issued by the Securities Commission. Taiwan: In
Taiwan, research is issued and distributed by Macquarie Capital Securities Ltd, Taiwan Branch, which is licensed and regulated by the Financial Supervisory Commission. No portion of the
report may be reproduced or quoted by the press or any other person without authorisation from Macquarie. Nothing in this research shall be construed as a solicitation to buy or sell any
security or product. Research Associate(s) in this report who are registered as Clerks only assist in the preparation of research and are not engaged in writing the research. Thailand: In
Thailand, research is produced with the contribution of Kasikorn Securities Public Company Limited, issued and distributed by Macquarie Securities (Thailand) Ltd. Macquarie Securities
(Thailand) Ltd. is a licensed securities company that is authorized by the Ministry of Finance, regulated by the Securities and Exchange Commission of Thailand and is an exchange
member of the Stock Exchange of Thailand. Macquarie Securities (Thailand) Limited and Kasikorn Securities Public Company Limited have entered into an exclusive strategic alliance
agreement to broaden and deepen the scope of services provided to each parties respective clients. The strategic alliance does not constitute a joint venture. The Thai Institute of Directors
Association has disclosed the Corporate Governance Report of Thai Listed Companies made pursuant to the policy of the Securities and Exchange Commission of Thailand. Macquarie
Securities (Thailand) Ltd does not endorse the result of the Corporate Governance Report of Thai Listed Companies but this Report can be accessed at: http://www.thai-
iod.com/en/publications.asp?type=4. South Korea: In South Korea, unless otherwise stated, research is prepared, issued and distributed by Macquarie Securities Korea Limited , which is
regulated by the Financial Supervisory Services. Information on analysts in MSKL is disclosed at
http://dis.kofia.or.kr/fs/dis2/fundMgr/DISFundMgrAnalystPop.jsp?companyCd2=A03053&pageDiv=02. South Africa: In South Africa, research is issued and distributed by Macquarie First
South Securities (Pty) Limited, a member of the JSE Limited. Singapore: In Singapore, research is issued and distributed by Macquarie Capital Securities (Singapore) Pte Ltd (Company
Registration Number: 198702912C), a Capital Markets Services license holder under the Securities and Futures Act to deal in securities and provide custodial services in Singapore.
Pursuant to the Financial Advisers (Amendment) Regulations 2005, Macquarie Capital Securities (Singapore) Pte Ltd is exempt from complying with sections 25, 27 and 36 of the Financial
Advisers Act. All Singapore-based recipients of research produced by Macquarie Capital (Europe) Limited, Macquarie Capital Markets Canada Ltd, Macquarie First South Securities (Pty)
Limited and Macquarie Capital (USA) Inc. represent and warrant that they are institutional investors as defined in the Securities and Futures Act. United States: In the United States,
research is issued and distributed by Macquarie Capital (USA) Inc., which is a registered broker-dealer and member of FINRA. Macquarie Capital (USA) Inc, accepts responsibility for the
content of each research report prepared by one of its non-US affiliates when the research report is distributed in the United States by Macquarie Capital (USA) Inc. Macquarie Capital
(USA) Inc.’s affiliate’s analysts are not registered as research analysts with FINRA, may not be associated persons of Macquarie Capital (USA) Inc., and therefore may not be subject to
FINRA rule restrictions on communications with a subject company, public appearances, and trading securities held by a research analyst account. Information regarding futures is provided
for reference purposes only and is not a solicitation for purchases or sales of futures. Any persons receiving this report directly from Macquarie Capital (USA) Inc. and wishing to effect a
transaction in any security described herein should do so with Macquarie Capital (USA) Inc. Important disclosure information regarding the subject companies covered in this report is
available at www.macquarie.com/research/disclosures, or contact your registered representative at 1-888-MAC-STOCK, or write to the Supervisory Analysts, Research Department,
Macquarie Securities, 125 W.55th Street, New York, NY 10019.
© Macquarie Group

Page 41
• This presentation has been prepared by Macquarie Bank Limited Seoul Branch('MBLSB') for
information purpose only and intended for professional investors as described under article
10 of the Presidential Decree to the Financial Investment Services and Capital market Act(the
Act). No part of this presentation material is to be construed as a solicitation to buy or sell an
y product, or to engage in any transaction and may not be distributed, either directly or
indirectly , to the public or any member of the public in Korea, other than to professional
investors as described above. To the extent permitted by law, the MBLSB does not accept a
ny responsibility for errors or misstatements, negligent or otherwise, nor for any direct, indir
ect, consequential or other loss arising from any use of the information in this presentation
material and/or further communication in relation to this information. The information may b
e based on assumptions or market conditions, and if those assumptions or market condition
s change, the information may change. No independent verification of the information has be
en made. This presentation material may not be copied or distributed in whole or in part to a
ny third party without the prior written consent of MBLSB.
Disclaimer

Page 42
Contact Macquarie Capital (USA) Inc.
Macquarie Capital (USA) Inc.
125 W. 55th Street, Level 22
New York, NY 10019
(212) 231 1000
Macquarie Capital (USA) Inc.
2 Embarcadero Center, Suite 200
San Francisco, CA 94111
(415) 762 5000
Macquarie Capital (USA) Inc.
225 Franklin Street, 17th Floor
Boston, MA 02110
(617) 598 2500
Macquarie Capital (USA) Inc.
1 North Wacker Drive, Suite 900
Chicago, IL 60606
(312) 660 9215
Macquarie Capital (USA) Inc
1225 17th Street, Suite 1600
Denver, CO, 80202
(303) 952 2800
24 Hour Toll-Free
1-888 MAC STOCK
1-888 622 7862
SALES TRADING US Robert DeRosa (212) 231 2594 Nicholas Struk (212) 231 2487 Greg Calvino (212) 231 0902 Pat Caufield (212) 231 2581 Mark Corcoran (212) 231 0951 John Curley (617) 598 2506 Bill Durand (212) 231 2413 Tom Durand (212) 231 8024 Brad Hoenig (212) 231 8089 Michael Ingrassia (212) 231 8064 Jon Jensen (617) 598 2517 Carlos Jimenez (212) 231 0883 Allen Jordan (212) 231 0947 Marty Livingston (212) 231 2523 Ross Peet (212) 231 0953 John Pennington (212) 231 2488 Stephen Sibilia (212) 231 8030 John Strack (212) 231 8067 Tarik Turner (212) 231 6365 Jess Wilson (617) 598 2509 Lance Wood (415) 762 5009 International Chris Reale (212) 231 2555 Ryan Bakker (212) 231 8083 Guy Devereux (212) 231 0900 Kai Keller (212) 231 2555 Marc Rosa (212) 231 2555
Australia/NZ Daniel Pittorino (212) 231 2552 Charlotte Edelman (212) 231 2571 Rowland Hirst (212) 231 2553 Asia Eric Roles (212) 231 2559 Darrin Blumenthal (212) 231 2562 Paul Colaco (212) 231 2496 Jeff Evans (617) 598 2508 Mark Lawrence (212) 231 2516 Mehvish Mirza (212) 231 2519 Todd Narter (415) 762 5005 Sheila Schroeder (415) 762 5003 Peter Slater (617) 598 2502 Navin Vallabhaneni (212) 231 2483 Jean Zhang (212) 231 6397 Europe Martin Pommier (212) 231 8054 Chris Carr (212) 231 6398 Jan Halaska (617) 598 2503 Jessica London (212) 231 0977 Matthew Schibanoff (212) 231 0989 Doug Stone (212) 231 2606 South Africa Mario Casis (212) 231 0937
SALES US Austin Graham (212) 231 0902 Juliana Biolsi (212) 231 2505 Michael Burguieres (212) 231 2506 Michael Cagney (312) 660 9144 Brian Cohen (212) 231 8002 Michael D’Arcangelo (212) 231 2573 Peter Doerr (312) 660 9052 Roni Gudell (617) 598 2504 Jim Isentol (212) 231 2567 Greg Jannetta (617) 598 2507 Alex Martin (212) 231 0376 Khristina McLaughlin (212) 231 8012 Rob Moderelli (212) 231 2495 Heidi Muccifori (212) 231 2466 Bruce Murdock (212) 231 8025 Tad Nacheff (212) 231 2615 Brad Neill (312) 660 9051 Todd Pigott (212) 231 8007 Jack Rose (415) 762 5002 Mark Swank (212) 231 2415 Ben Taylor (415) 762 5025 Liz Whiteley (617) 598 2501 Email Addresses [email protected] eg [email protected]
TRADING Michael Cornette (212) 231 0882 Matt Coleman (212) 231 2534 Michael Nevitt (212) 231 2408 Sam Panageas (212) 231 2459 Chris Richards (212) 231 0902 Peter Schwartz (212) 231 6381 EXECUTION SERVICES (PT/EE) James Henry (212) 231 0900 Steve Bloom (212) 231 0934 Ed Eng (212) 231 0900 Matt McNamara (212) 231 0900 Victor Morange (212) 231 2538 George Nikitiadis (212) 231 0884 Robert Redfield (415) 762 5027 CORPORATE ACCESS Katie Gray (212) 231 1318 Maria Martin (212) 231 2557 Erica Miolla (212) 231 6542 Katie Nahnybida (212) 231 6364