Global perspectives on Renewable Energy Markets and … · Global perspectives on Renewable Energy...
22
© OECD/IEA 2012 Global perspectives on Renewable Energy Markets and IEA’s activities Yoshiki Endo Programme Manager Renewable Energy Division International Energy Agency NEF Workshop, 4 February 2013, Tokyo
Transcript of Global perspectives on Renewable Energy Markets and … · Global perspectives on Renewable Energy...
© OECD/IEA 2012
Global perspectives on Renewable Energy Markets
and IEA’s activities
Yoshiki Endo
Programme Manager
Renewable Energy Division
International Energy Agency
NEF Workshop, 4 February 2013, Tokyo
© OECD/IEA 2012
Today’s Contents
Overview of global energy market
Projection of renewables market
IEA’s work for deploying renewables
Conclusions
© OECD/IEA 2012
Today’s Contents
Overview of global energy market
Projection of renewables market
IEA’s work for deploying renewables
Conclusions
© OECD/IEA 2012
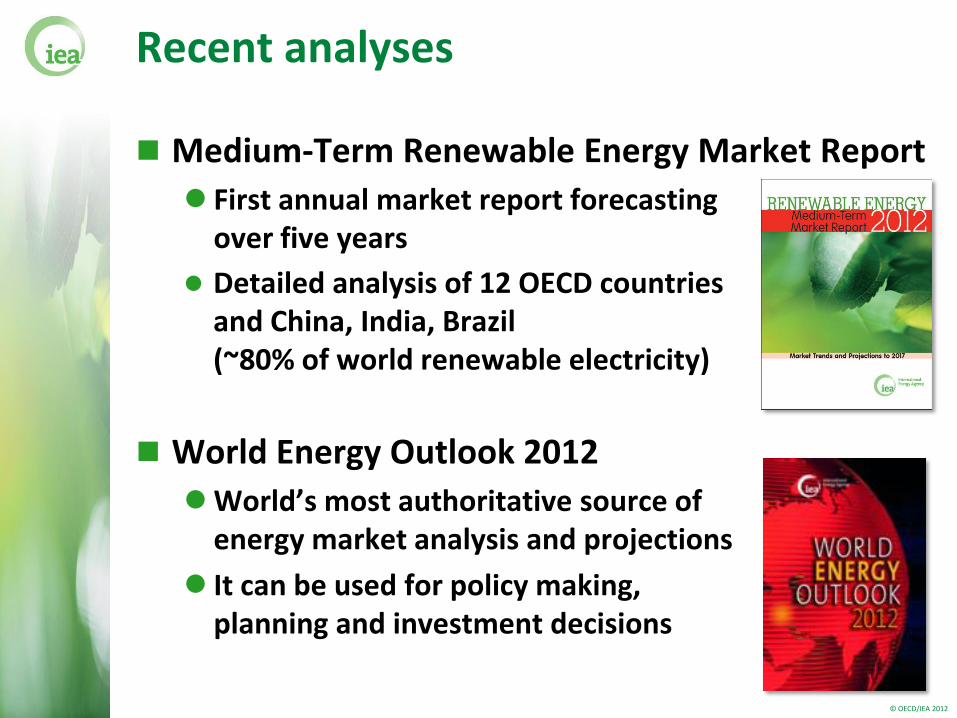
Recent analyses
Medium-Term Renewable Energy Market Report
First annual market report forecasting over five years
Detailed analysis of 12 OECD countries and China, India, Brazil (~80% of world renewable electricity)
World Energy Outlook 2012
World’s most authoritative source of energy market analysis and projections
It can be used for policy making, planning and investment decisions
© OECD/IEA 2012
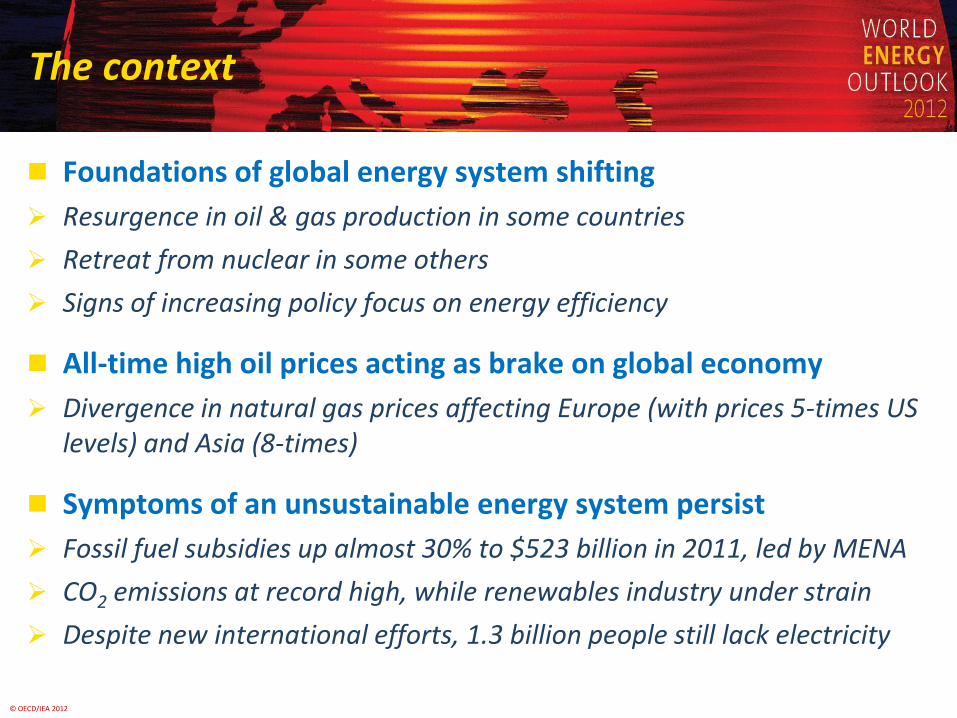
The context
Foundations of global energy system shifting
Resurgence in oil & gas production in some countries
Retreat from nuclear in some others
Signs of increasing policy focus on energy efficiency
All-time high oil prices acting as brake on global economy
Divergence in natural gas prices affecting Europe (with prices 5-times US levels) and Asia (8-times)
Symptoms of an unsustainable energy system persist
Fossil fuel subsidies up almost 30% to $523 billion in 2011, led by MENA
CO2 emissions at record high, while renewables industry under strain
Despite new international efforts, 1.3 billion people still lack electricity
© OECD/IEA 2012
3 000 4 000 5 000 6 000
TWh
2 000
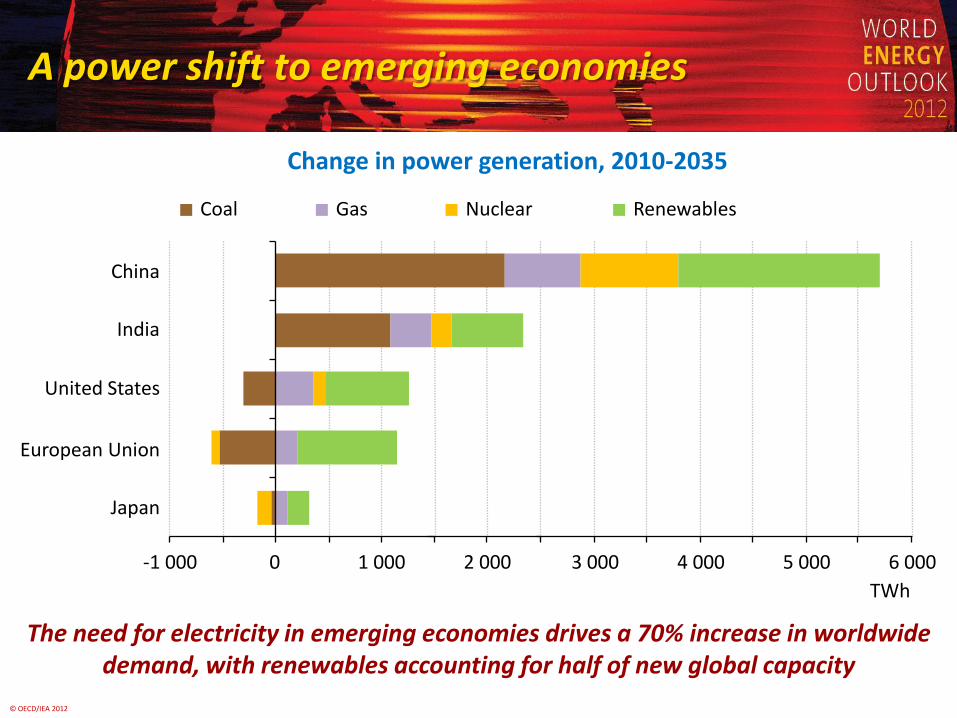
A power shift to emerging economies
The need for electricity in emerging economies drives a 70% increase in worldwide demand, with renewables accounting for half of new global capacity
Change in power generation, 2010-2035
-1 000 0 1 000
Japan
European Union
United States
China
TWh
Coal Gas Nuclear Renewables
India
© OECD/IEA 2012
Today’s Contents
Overview of global energy market
Projection of renewables market
IEA’s work for deploying renewables
Conclusions

© OECD/IEA 2012
Key trends As a portfolio of renewable technologies matures, global
renewable power generation is forecast to rise 40% Supported by policy/market frameworks and economic
attractiveness in increasing range of countries and circumstances
Technology cost developments, grid/system integration, cost/availability of financing also weigh as key variables
High level of economic/policy uncertainty in some countries
This projected growth is an acceleration vs previous period Growth is 60% higher over 2011-17 versus 2005-11
Renewable deployment is projected to spread out geographically, with increased activity in emerging markets Deployment spurring economies of scale in some technologies -
virtuous cycle of improved competition and cost reductions
© OECD/IEA 2012
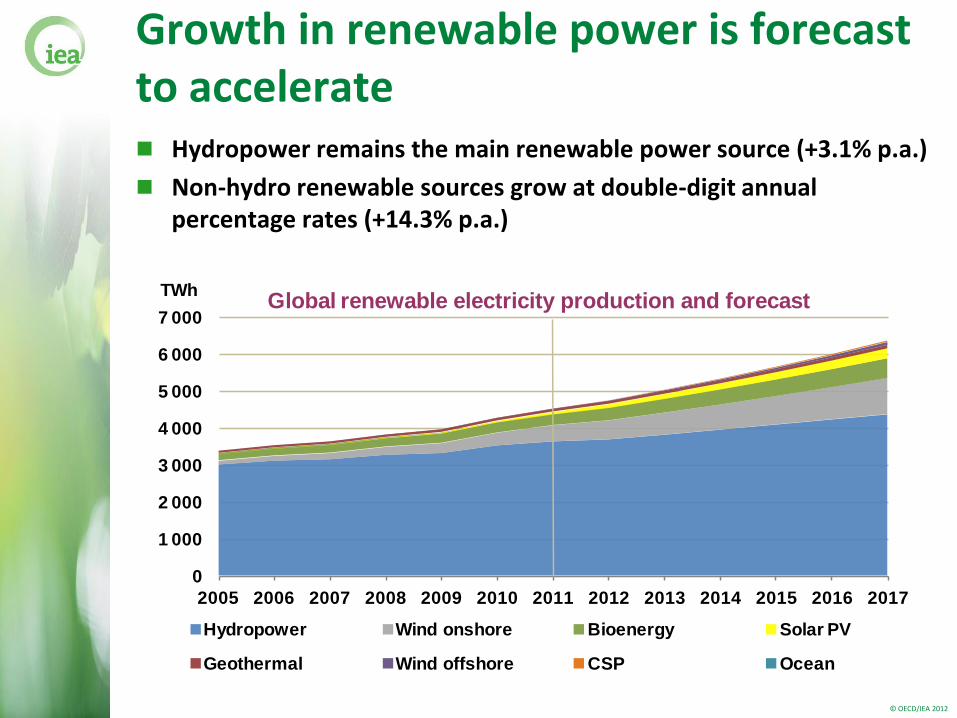
Growth in renewable power is forecast to accelerate Hydropower remains the main renewable power source (+3.1% p.a.)
Non-hydro renewable sources grow at double-digit annual percentage rates (+14.3% p.a.)
0
1 000
2 000
3 000
4 000
5 000
6 000
7 000
2005 2006 2007 2008 2009 2010 2011 2012 2013 2014 2015 2016 2017
Global renewable electricity production and forecast
Hydropower Wind onshore Bioenergy Solar PV
Geothermal Wind offshore CSP Ocean
TWh
© OECD/IEA 2012
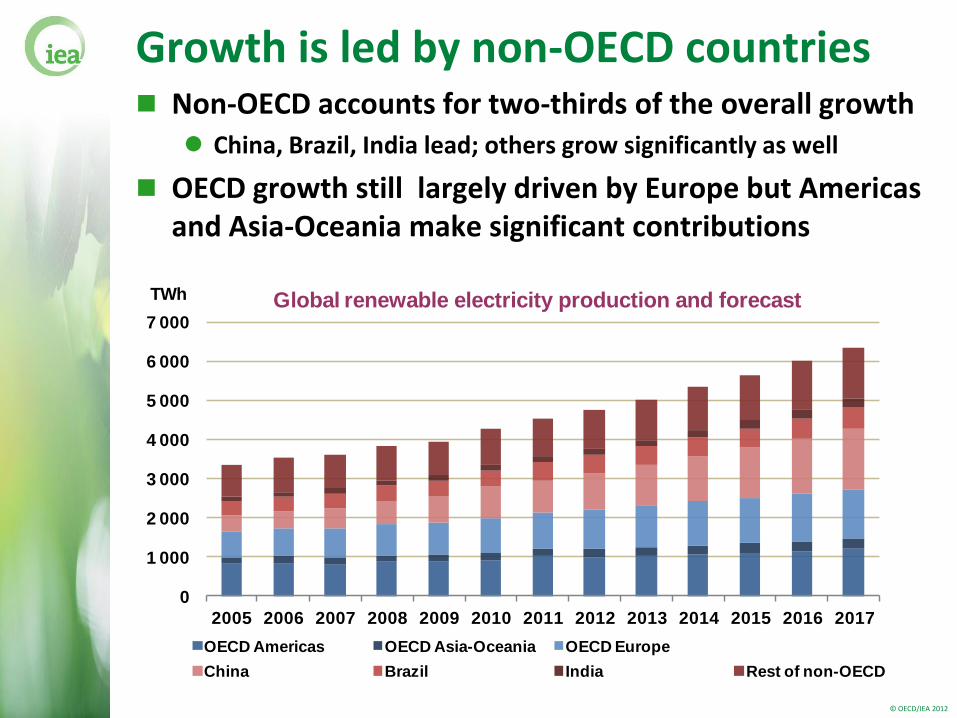
Growth is led by non-OECD countries Non-OECD accounts for two-thirds of the overall growth
China, Brazil, India lead; others grow significantly as well
OECD growth still largely driven by Europe but Americas and Asia-Oceania make significant contributions
0
1 000
2 000
3 000
4 000
5 000
6 000
7 000
2005 2006 2007 2008 2009 2010 2011 2012 2013 2014 2015 2016 2017
TWh Global renewable electricity production and forecast
OECD Americas OECD Asia-Oceania OECD Europe
China Brazil India Rest of non-OECD
© OECD/IEA 2012
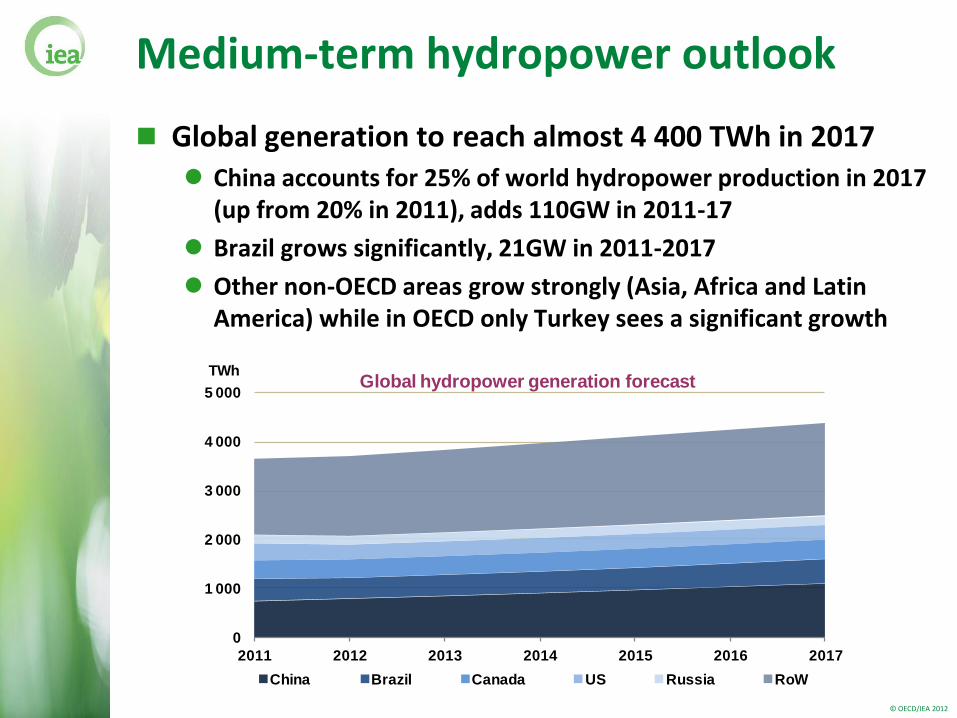
Medium-term hydropower outlook
Global generation to reach almost 4 400 TWh in 2017
China accounts for 25% of world hydropower production in 2017 (up from 20% in 2011), adds 110GW in 2011-17
Brazil grows significantly, 21GW in 2011-2017
Other non-OECD areas grow strongly (Asia, Africa and Latin America) while in OECD only Turkey sees a significant growth
0
1 000
2 000
3 000
4 000
5 000
2011 2012 2013 2014 2015 2016 2017
TWhGlobal hydropower generation forecast
China Brazil Canada US Russia RoW
© OECD/IEA 2012
Today’s Contents
Overview of global energy market
Projection of renewables market
IEA’s work for deploying renewables
Conclusions

© OECD/IEA 2012
Publications
Analytical books
Technology Roadmaps
Based on collaboration with IAs
© 2012
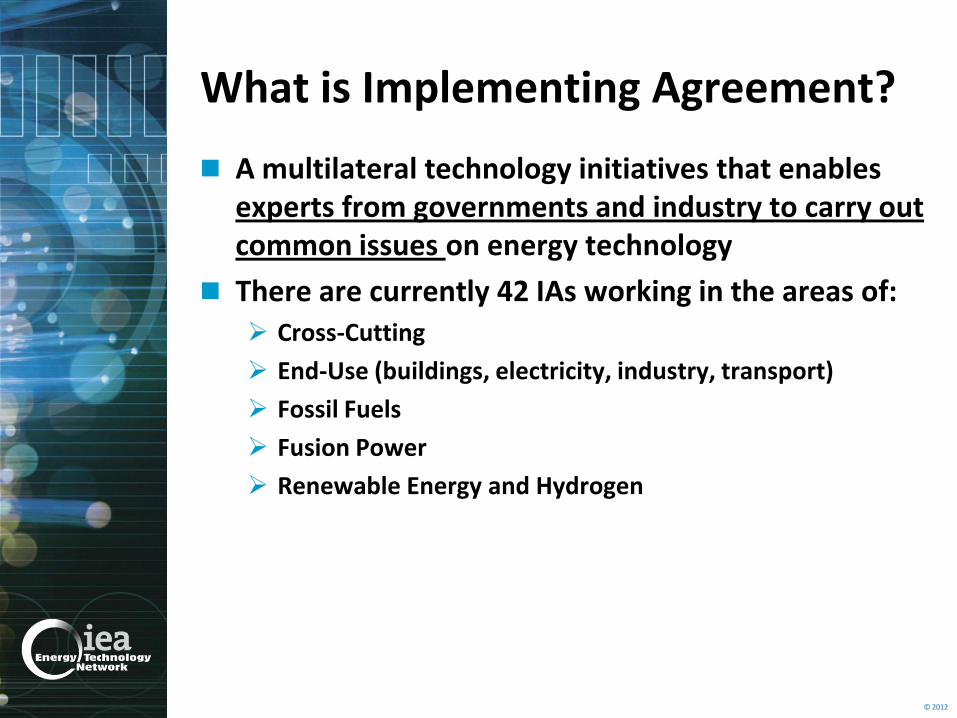
What is Implementing Agreement?
A multilateral technology initiatives that enables experts from governments and industry to carry out common issues on energy technology
There are currently 42 IAs working in the areas of: Cross-Cutting
End-Use (buildings, electricity, industry, transport)
Fossil Fuels
Fusion Power
Renewable Energy and Hydrogen
© 2012
What are the IAs working?
Typically, the work includes:
Basic research, information exchange
Technology assessment, feasibility studies, environmental impact studies, market analysis, policy implications
Databases, modeling and system analysis
Expert networks (Meetings, Workshops)
© 2012
The benefits of participation
There are numerous advantages to international energy technology research collaboration. For example:
Reducing cost and duplication of work
Greater project scale
Sharing information and networking
Accelerating development and deployment
Harmonizing technical standards
Strengthening national RD&D capabilities
© 2012
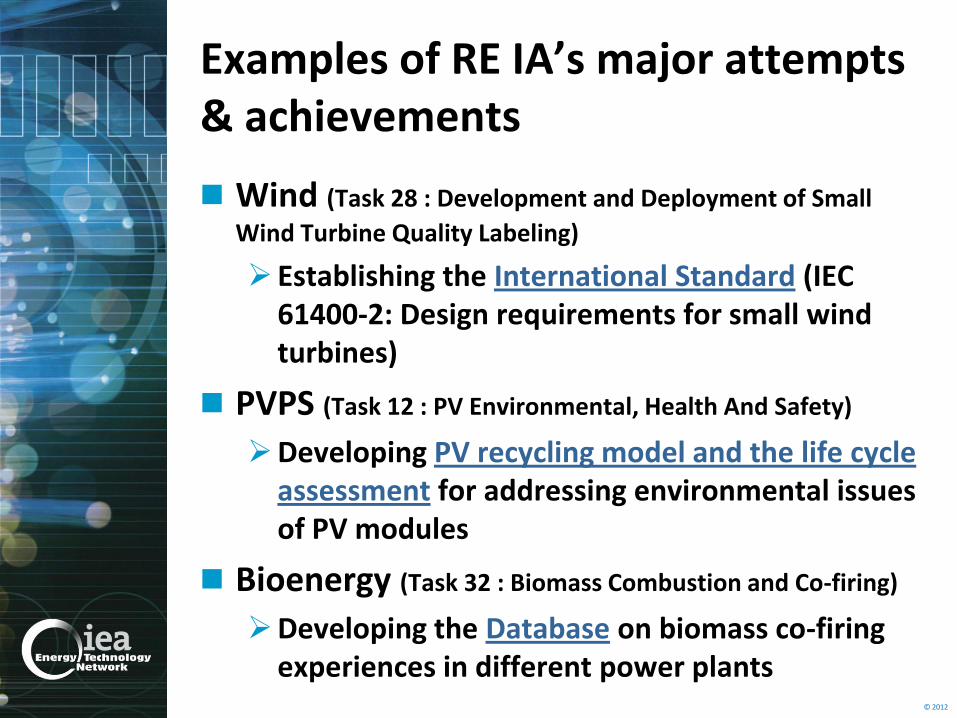
Examples of RE IA’s major attempts & achievements
Wind (Task 28 : Development and Deployment of Small
Wind Turbine Quality Labeling)
Establishing the International Standard (IEC 61400-2: Design requirements for small wind turbines)
PVPS (Task 12 : PV Environmental, Health And Safety)
Developing PV recycling model and the life cycle assessment for addressing environmental issues of PV modules
Bioenergy (Task 32 : Biomass Combustion and Co-firing)
Developing the Database on biomass co-firing experiences in different power plants

© 2012
Examples of RE IA’s major attempts & achievements (Continued)
Solar Heating and Cooling (Task 40 : Net Zero Energy
Solar Buildings)
Joint working with the other IA such as Energy Conservation in Buildings and Community Systems (ECBCS IA)
Geothermal (Annex 7 : Advanced Geothermal Drilling and
Logging Techniques)
Introducing the Best Practice for well construction of geothermal plants
RETD (RE-COST)
Investigating “True” costs for benefit between RE technology and non-RE technology, and providing the Recommendation to policy makers
© OECD/IEA 2012
Today’s Contents
Overview of global energy market
Projection of renewables market
IEA’s work for deploying renewables
Conclusions
© OECD/IEA 2012
Policy messages
Clarity, predictability and a long-term orientation of RE policy frameworks are keys to maintaining investment Policymakers should avoid stop-and-go decision making, which can
cause investment to stall
These frameworks should focus on the whole portfolio of renewables (incl. hydropower, bioenergy, RE heat, etc.)
Meanwhile, there needs to be increased focus on market designs that integrate higher levels of renewables in power systems (both variable and dispatchable)
A radical turn away from renewables now would be more costly in the long run in terms of climate costs and energy import bills

© OECD/IEA 2012
Role of IEA’s work
The IEA continuously sends out signals as significant messages and recommendations to all stakeholders, providing authoritative and unbiased research and statistics through our publications, projects, activities with Implementing Agreements.
In terms of RE issues, particularly the industry including manufacturers, utilities, financial sector and investors should unite to design the RE market for its sustainability. The IEA should invite their attention over time.

© OECD/IEA 2012
For further insights and analyses… www.iea.org
Thank you for your attention! [email protected]