Global Overview of Peanut Markets - peanutsusa.com€¢ Record yields in US and China along with...
20
Global Overview of Peanut Markets IPF Rome April 2014 Anupam Jindel Olam International Ltd
-
Upload
nguyenkhue -
Category
Documents
-
view
213 -
download
0
Transcript of Global Overview of Peanut Markets - peanutsusa.com€¢ Record yields in US and China along with...

Global Overview of Peanut Markets
IPF Rome April 2014
Anupam Jindel
Olam International Ltd
Structure
• Weather Forecast
• Global Overview-
Peanuts

Global Weather Update
• We are in a period of high frequency of La Nina and Neutral phases
• 2007, 2008, 2010 & 2011 – La Nina Years
• 2012 & 2013 Post La Nina Neutral Phase
• These negatively impact South America, Central & West North America while
providing a more positive impact on India & China
• Similar pattern to Mid-1950’s and the 1970’s in the US which were very dry
• 2010-mid 2013 was also very dry in Mid Central and Western US.
• Current Prediction
• 52% for El Nino starting Q4 2014, 41% Neutral, 7% La Nina
• 52% probability for El Nino is not a strong possibility

Global Weather Update
• IF El Nino Develops in Oct-Dec 2014:
• China:
Neutral for China
• US
SE US will likely remain moist though not as wet as 2012
& 2013
• India
Could experience considerably lower Rainfall
• Argentina
Positive for the Yields

Key Trends : Production
• 12-13 plantings were up significantly across all major origins except India
• Record yields in US and China along with acreage increases lead to large carry over
• 13-14 saw decline in acreages in US, China and Argentina & marginal increase in
India. However, prices continued to decline due to large carry over
Origin 2009/2010 2010/2011 2011/2012 2012/2013 2013/2014
Argentina 836 1,051 980 970 1,000
Brazil 235 227 295 313 300
China 14,708 15,644 16,046 16,692 17,000
India 4,900 5,850 5,500 5,000 5,500
United States 1,675 1,886 1,660 3,068 1,893
Sub-Total 22,354 24,658 24,481 26,043 25,693
World 36,177 39,853 38,269 40,110 39,834
Production kMT Farmer Stock (USDA)

Key Trends : Price
• Price fall led by US due to its Cost Leadership Position- 1000$ fall
• Argentina followed suit with a lag but maintained a small premium
• Drop in Chinese prices were more gradual. China regained competitiveness in the export
markets in IV Qrtr of 2013
• Argentina Prices have been below cost of Production since Sep 2012
$750
$1,250
$1,750
$2,250
$2,750
$3,250
Jan-
11
Mar
-11
May
-11
Jul-1
1
Sep-
11
Nov-
11
Jan-
12
Mar
-12
May
-12
Jul-1
2
Sep-
12
Nov-
12
Jan-
13
Mar
-13
May
-13
Jul-1
3
Sep-
13
Nov-
13
Jan-
14
Mar
-14
US 40/50
CH 40/50
Arg 40/50

Key Trends : India
• India had a poor crop in 2012/13, down 10% from 2011/12
• Production recovered in 2013/14, an increase of 25% over previous year
• Overall poor economic outlook dampened the structural growth in the
domestic edible segment.
• Government declared a MSP of 800rs / 20 kgs
• Export volumes did not pick up as expected due to:
Government’s decision to declare a high minimum support price
Lack of Import parities in China in 13/14
Exports to China fell to 30k mt
Regulation regarding packaging etc hampered exports

Key Trends : India
• 2013/14 Winter Crop plantings were down by 9%
• 2014/15 Crop plantings are expected to drop by 10-20%
• If El Nino turns out to be strong, it could have a significant impact on
yields in India of the 2015 Rabi and Summer Crop

• Since 2011, Argentina has had low yields (<3 mt) due to adverse weather
conditions
• Significant investments made in New Capacity in last five years, reflected by
Expanding Acreage
3.3 3.3
3.9
3.4
2.82.7
+ 2.9
07/08 08/09 09/10 10/11 11/12 12/13 13/14 E
Yield (Mt per Ha)
Area (K Ha)
288310 314
366 388
339
08/09 09/10 10/11 11/12 12/13 13/14 E
Key Trends : Argentina
Source: CAM/BCC, own estimates

• Cost Competitiveness continues to be an issue, further exacerbated by low
prices
• Substantial devaluation of the currency has not been of much help
4.5
5.0
5.5
6.0
6.5
7.0
7.5
8.0
8.5
4.5
5.0
5.5
6.0
6.5
7.0
7.5
8.0
8.5
Dec-12 Mar-13 Jun-13 Sep-13 Dec-13 Mar-14
USD Hourly Wage x-rate
x-rate (AR$/USD)
Wages: UATRE Union – Category C worker
Wages (USD/hour)
Key Trends : Argentina
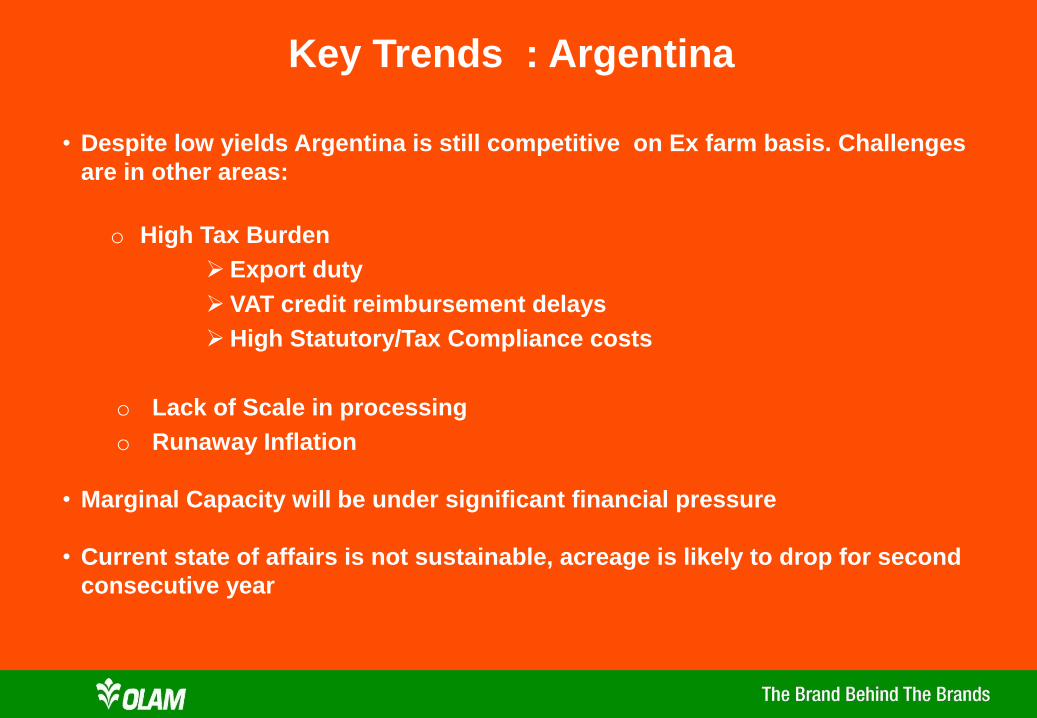
• Despite low yields Argentina is still competitive on Ex farm basis. Challenges
are in other areas:
o High Tax Burden
Export duty
VAT credit reimbursement delays
High Statutory/Tax Compliance costs
o Lack of Scale in processing
o Runaway Inflation
• Marginal Capacity will be under significant financial pressure
• Current state of affairs is not sustainable, acreage is likely to drop for second
consecutive year
Key Trends : Argentina

Key Trends : China
Crop 2012/13
• Peanuts were the most remunerative crop hence plantings
increased by 7-8 %. Favorable weather led to record yields
• 6 months of relatively high prices led to imports from the US during
Dec 12 – Mar 13
• Rapid decline in prices from March 2013, after a lag of 6 months.
This was triggered by slow demand and high stock levels
Crop 2013/14
• Plantings further increased by 2-3%
• Yields were lower than previous year but higher than the Five Year
Average
• However, the large 2012 Crop carry-over and lackluster Edible
Demand led to sharp decline in prices in Jan- March 2014

Key Trends : China
• From 1982 to 2012, Rural population in China dropped from 79% to 48%
• From 1996 to 2008, arable land was lost at the rate of 729 thousand Ha each
year
• Govt announced a new policy declaring sufficiency in Grains as the Goal
• For the first time Land Title rules are being changed to allow land
consolidation with a view to mechanize farming
• Govt will provide significant incentives to the farmers of Corn and Wheat in
the future.
• At present Corn/Wheat have a Minimum support price of 2200-2400RMB
pmt, which is very attractive
• Furthermore, various subsidies to the tune of 18-20$ per Mt are available
on Corn and Wheat, but not available to Peanuts.

Key Trends: China
• Peanut planting expected to drop by 8-10% on account of inferior returns
• Peanuts- 1400$/Ha
• Corn / Wheat- 4000$/Ha
• Reduced acreage could eventually drive up the prices
• Imports could become viable again in FH of 2015

Key Trends : USA
• 2 consecutive good crops in the US have been the key driver of prices:
Good growing conditions and the new high yielding variety of GA
06G
Year End Stock/usage ratios up from 23% in Crop Year 11/12 to
close to 50% in Crop Years 12/13 and 13/14
• 20-30% increase in planting intentions for Crop 14/15 as returns on
Peanuts were better than the competing crops in February
• Full impact of the New Farm Bill yet to be understood but the
perception is that it will be Positive for Peanut production

Key Trends : USA
• Increase in acreage in 14/15 is already priced in to a large degree
• Sustained downside is limited except by eating into farming or shelling
margins
• Important piece of the jig saw puzzle - will there be a significant
increase in the US acreage beyond 2014, on account of the new farm
bill?

Key Trends : Competing Crops
Soy
• US balance sheet is extremely tight as a result of robust meal demand in
China
Corn
• 2014 Crop is no more in backwardation indicating continued tightness in
Corn through next year as well
• Corn demand has been driven by Robust Ethanol demand and switch from
feed wheat to Corn
• US will require excellent yields in 2014, for Soy and Corn balance sheets to
improve
Cotton
• Is looking competitive again

Key Trends : Competing Crops
• Long positions of the Funds have increased significantly in the last two
months
• We have seen Coffee Prices increase from $1.20 to 2$ per pound, driven by
weather concerns in Brazil
• Cocoa has seen a similar steep increase
• In 2015/16, peanuts could have significant competition from other crops for
acreage

Key Trends : What to expect in 14/16
• With the exception of US, we expect significant decline in acreages across
all major origins in 2014
• Production in China, India, Argentina and Brazil is expected to decline by
1.5-2m mt IS
• US will see an increase of close to 400-600k mt IS Global
• Global Peanuts balance sheet will tighten considerably in 14/15.
• Prices are likely to be flat to bearish for the next six months barring weather
events
• Beyond that the fundamentals indicate firmer market, however, much
depends on:
• China 2014/15 acreage decline – Price or Policy?
• Is the projected US acreage increase Structural or Cyclical?

Thank You