Global Off-Grid Solar Market Report Semi-Annual Sales and ... · Fosera Off-Grid: Electric Smarter...
52
Global Off-Grid Solar Market Report Semi-Annual Sales and Impact Data JULY-DECEMBER 2016, PUBLIC REPORT
Transcript of Global Off-Grid Solar Market Report Semi-Annual Sales and ... · Fosera Off-Grid: Electric Smarter...

Global Off-Grid Solar Market ReportSemi-Annual Sales and Impact Data JULY-DECEMBER 2016, PUBLIC REPORT

Authors’ Note
Our latest Global Off-Grid Solar Market Report presents semi-annual sales and impact data covering July 1, 2016 to December 31, 2016, reflecting the performance of 55 companies working in this vibrant sector. With the needs of investors, manufacturers, distributors, entrepreneurs, donors and policymakers in mind, the GOGLA and IFC Lighting Global sales data offers a uniquely detailed and robust snapshot of the development of the sector every six months. The off-grid industry landscape is constantly shifting. This semi-annual report is built on a continuously growing data set to draw observations of key trends, insights and changes which underpin the market’s development. As such, we seek to provide dynamic market intelligence that sector players will find essential in making more informed decisions in the operation of their businesses. With around 1.2 billion people living without access to the grid, spending about US$ 27 billion annually on
lighting and mobile phone charging, the sector still has a lot of work to do. As industry insiders, we know that solar-powered portable lights and solar home systems offer a far better alternative by providing a cleaner, modern and more affordable service to traditional light and energy sources. To this end, our report will shine a light on the developmental impact the industry is making. IFC and GOGLA will continue to push for high-quality, nuanced data to accurately tell the story of the industry’s evolution to those outside our arena. This public report features an aggregate of sales data shared with us by the companies that drive the sector. All companies which have contributed their sales data will receive their own individual, tailored report, indicating their share of all relevant markets, and will also gain access to a comprehensive online reporting platform that visualizes key market insights. If you would like to participate in our next data collection round, please get in touch with us. Sincerely,
Koen Peters, Executive Director, GOGLA
Content TeamLaura Sundblad, Johanna Diecker and Petros Theodorou (GOGLA) Leo Blyth (Lighting Global, IFC)Hedde Rijkes and Marly te Selle (Berenschot)
Front cover ©Mobisol
Russell Sturm, Global Head, Energy Access, International Finance Corporation

3
Table Of Contents
About this Report About the Authors Participants Methodology
Data Processing Product Categories
Report Highlights Global Highlights
Key Figures Global and Regional Sales Volumes and Revenues
Market Insights Market Dynamics
Historical Product SalesHighlights by Product Category
Detailed Sales Data Sales Volumes and Cash Sales Revenues by Country Sales Volumes and Revenues by Product Category Sales Volumes and Revenues by Quality Verification Status
Impact Metrics Methodology List of Impact Metrics Analysis Total Impact Created Impact Created by Product CategorySummary
References and Credits Contact Information
445667
888910121316
18183239
40404142434449
5051

4
About the Authors
This report is produced by GOGLA and Lighting Global with the assistance of Berenschot.
Global Off-Grid Lighting AssociationGOGLA is a neutral, independent, not-for-profit industry association which acts as a sector enabler and advocate. GOGLA supports the growth and strengthens the market for clean, quality off-grid lighting and electrical systems for households, SMEs and communities in developing countries. GOGLA’s objective is to help the industry grow quickly but sustainably by focusing efforts on access to finance, creating an enabling environment and quality assurance and consumer protection.
Formed in 2012 as a public-private initiative, GOGLA was conceived out of a joint World Bank / IFC Lighting Africa and private sector effort to accelerate market development for energy access. Today, GOGLA comprises over 85 members from across the globe. Its main objective is to support industry in scaling the sector based on principles of the triple bottom line, thus contributing to the objectives of Sustainable Energy for All (SE4All) and the Sustainable Development Goals (SDGs).
Lighting GlobalLighting Global is the World Bank Group’s platform to support sustainable growth of the international off-grid solar market as a means of rapidly increasing energy access to the 1.2 billion people without grid electricity. Through Lighting Global, the International Finance Corporation (IFC) and the World Bank work with the Global Off-Grid Lighting Association (GOGLA), manufacturers, distributors, and other development partners to develop the modern off-grid energy market. The Lighting Global program supports market development by working with private companies to lower first-mover risk and mobilize private sector investment through market intelligence, quality assurance, business support services and consumer education.
BerenschotBerenschot is a leading Dutch management consultancy firm with an extensive track record in supporting industry associations, including on market data collection. Berenschot has recently been elected by clients as the best management consultancy firm of the Netherlands. As a member of the Dutch Council for Management Consultants (ROA), Berenschot is committed to the ROA terms and conditions, which require them to maintain a high standard of confidentiality.
About this Report
5
List of respondents
AEG International Greenlight Planet Orb Energy Solarkiosk
All Weather Solar Jua Energy OvSolar SolarNow
Azuri Jua Solar Pamoja Life SolarWay
Barefoot Power Lagazel Panasonic SolarWorks!
BBOXX Little Sun Pawame Sunna Design
Bright Life by Finca M-KOPA Philips Lighting Sunny Money (Solar Aid)
Bright Products AS Mobisol RAL Consumer Products Limited Total
BrighterLite Nadji-Bi Renewit True Solar
d.light NewLight Africa (Heya!) Shamba Technologies Village Boom
EcoZoom Limited Niwa Shanghai Easy Village Power
Fenix International Nizam Energy Simpa Networks Waka-Waka (Off-Grid Solutions)
Flexiway Solar Solutions Nova-Lumos Simusolar Zhejaing Holley
Fosera Off-Grid: Electric Smarter Grid International Zimpertec
Futura Sun OmniVoltaic Energy Solutions Solar Sister
Table 1: List of Participants
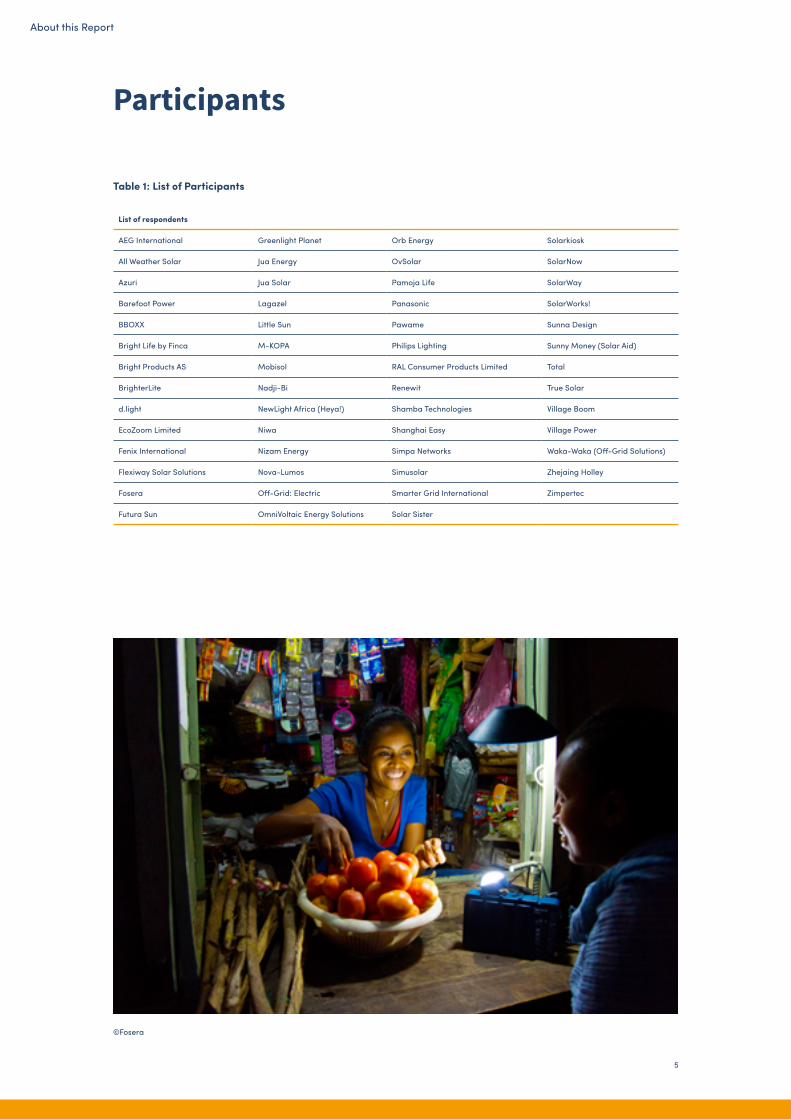
Participants
©Fosera
About this Report

6
Methodology
The data in this report is limited to that provided by GOGLA member companies and companies with Lighting Global quality verified products.
Companies are classified either as distributors of other companies’ branded products or as manufacturers of their own branded products. Only aggregate data from companies categorized as manufacturers is presented here to avoid double-counting, and it is only included when it has satisfied the three data point rule, meaning that at least three separate product manufacturers have reported data for any single data point. When we have less than three responses, no results are shown. This protects the proprietary interests of the companies who have supplied data in support of this industry report.
All data is self-reported by the companies, and while it is cross-checked for consistency, the companies are responsible for accurate reporting of product specifications, pricing information, sales volumes and locations of sales. Companies may also choose to report sales volumes but not revenues. If not all information needed to calculate the impact of a product was provided, the product was not included in the impact data calculation.
As in the previous four collection rounds, this data collection and reporting process was overseen by Dutch management consultancy firm Berenschot while Lighting Global and GOGLA provided specialized industry knowledge within the research team. The online questionnaire and results platform were programmed by Getting Social, a Dutch web development company.
Data ProcessingQuality Verified and Non-Quality Verified Products In this report the terms ‘Quality verified’ and ‘Non-quality verified’ are used. Quality verified means that the product or kit has met the IFC Lighting Global Quality Standards (using the IEC Technical Specification 62257-9-5) during the current reporting period. These quality standards have been widely adopted as the third party verifiable measure of quality for off-grid lighting products and SHS kits across the world. For example, nineteen national governments, three of them in Asia (Bangladesh, Cambodia, Nepal) and sixteen in Africa (Ethiopia and Kenya, as well as the ECOWAS group of countries – Benin, Burkina Faso, Cape Verde, Côte d’Ivoire, Gambia, Guinea, Guinea Bissau, Liberia, Mali, Niger, Nigeria, Senegal, Sierra Leone and Togo) have adopted favorable policies to benefit quality verified off-grid lighting products that have passed IEC Technical Specification 62257-9-5. Donor programs targeting support to products in the sector routinely use the quality standards as eligibility criteria for receipt of support.
Non-quality verified means that the technical performance and quality of the product is not verified as meeting the quality standards during the reporting period. It is important to note that the absence of quality verification does not imply that products are of lower quality and there are a variety of legitimate reasons for products not to have quality verification.
Data Checks The research team checked the submitted data for consistency and logic with respect to previously collected data by Berenschot or IFC. Based on these checks, some small adjustments have been made concerning product performance specifications and the ‘quality verified’ status of products where necessary.
Missing Data Where meaningful data was missing, we tried to address this by consulting our existing data sets, or by contacting respondents. Unfortunately, even after these actions, some data was still missing.
Market Share Represented Based on previous analysis by Bloomberg New Energy Finance for the Off-Grid Solar Market Trends Report 2016, we estimate that the data reported here represents approximately 50% of all sales of off-grid solar products in the markets relevant to this report, when also considering non-branded generic products on offer.
©Village Power
About this Report
7
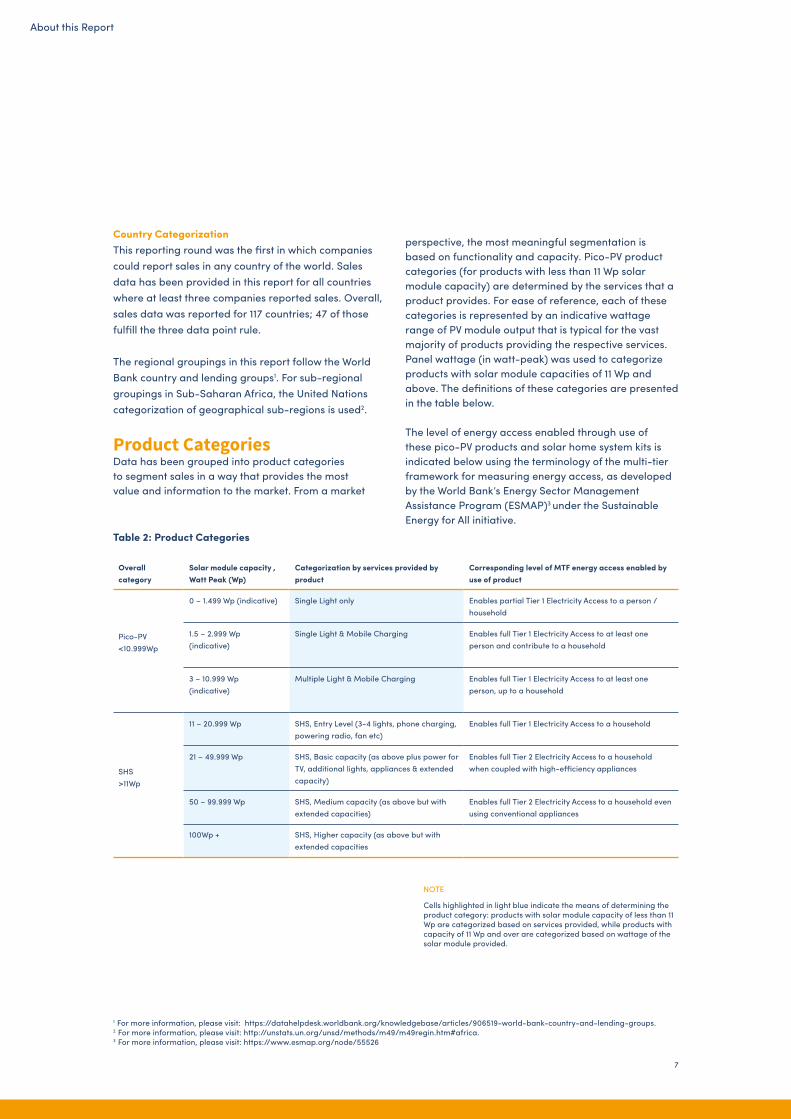
Country CategorizationThis reporting round was the first in which companies could report sales in any country of the world. Sales data has been provided in this report for all countries where at least three companies reported sales. Overall, sales data was reported for 117 countries; 47 of those fulfill the three data point rule.
The regional groupings in this report follow the World Bank country and lending groups1. For sub-regional groupings in Sub-Saharan Africa, the United Nations categorization of geographical sub-regions is used2.
Product Categories Data has been grouped into product categories to segment sales in a way that provides the most value and information to the market. From a market
Overall category
Solar module capacity , Watt Peak (Wp)
Categorization by services provided by product
Corresponding level of MTF energy access enabled by use of product
Pico-PV<10.999Wp
0 – 1.499 Wp (indicative) Single Light only Enables partial Tier 1 Electricity Access to a person / household
1.5 – 2.999 Wp(indicative)
Single Light & Mobile Charging Enables full Tier 1 Electricity Access to at least one person and contribute to a household
3 – 10.999 Wp(indicative)
Multiple Light & Mobile Charging Enables full Tier 1 Electricity Access to at least one person, up to a household
SHS >11Wp
11 – 20.999 Wp SHS, Entry Level (3-4 lights, phone charging, powering radio, fan etc)
Enables full Tier 1 Electricity Access to a household
21 – 49.999 Wp SHS, Basic capacity (as above plus power for TV, additional lights, appliances & extended capacity)
Enables full Tier 2 Electricity Access to a household when coupled with high-efficiency appliances
50 – 99.999 Wp SHS, Medium capacity (as above but with extended capacities)
Enables full Tier 2 Electricity Access to a household even using conventional appliances
100Wp + SHS, Higher capacity (as above but with extended capacities
perspective, the most meaningful segmentation is based on functionality and capacity. Pico-PV product categories (for products with less than 11 Wp solar module capacity) are determined by the services that a product provides. For ease of reference, each of these categories is represented by an indicative wattage range of PV module output that is typical for the vast majority of products providing the respective services. Panel wattage (in watt-peak) was used to categorize products with solar module capacities of 11 Wp and above. The definitions of these categories are presented in the table below.
The level of energy access enabled through use of these pico-PV products and solar home system kits is indicated below using the terminology of the multi-tier framework for measuring energy access, as developed by the World Bank’s Energy Sector Management Assistance Program (ESMAP)3 under the Sustainable Energy for All initiative.
NOTE
Cells highlighted in light blue indicate the means of determining the product category: products with solar module capacity of less than 11 Wp are categorized based on services provided, while products with capacity of 11 Wp and over are categorized based on wattage of the solar module provided.
Table 2: Product Categories
1 For more information, please visit: https://datahelpdesk.worldbank.org/knowledgebase/articles/906519-world-bank-country-and-lending-groups.2 For more information, please visit: http://unstats.un.org/unsd/methods/m49/m49regin.htm#africa.3 For more information, please visit: https://www.esmap.org/node/55526
©Village Power
About this Report

8
110.9 millionpeople with improved energy access, historically
85.5 millionpeople with improved energy access, currently
38 millionpeople with tier 1 energy needs met, currently
1.9 millionlivelihoods supported, currently
8.07 millionproducts sold in 2016
164%increase in available hours of light, per household
19 millionstatus quo lighting sources no longer in use
$ 200savings on energy-related spending, per household
$ 4.9 billion savings on energy-related spending, total over product-lifetime
Key figures
NOTE For more details on the impact metrics presented above, please refer to the Impact section of this report (see page 55). Further information on the multi-tier framework and the measurement of off-grid electrification can be found in Beyond Connections: Energy Access Redefined 1
1 https://www.esmap.org/node/55526
Global Highlights
3.77 millionproducts sold globally in H2 2016 Quality verified products represent about 86% of all sales and 92% of all cash sales revenues in H2 2016
27.20 millioncumulative product sales since July 201023.72 million of these being quality verified
$ 113.9 million cash sales revenues in H2 2016
26.9 million tonsof greenhouse gas emissions offset
141%increase in available light output, per household
1.87 million products sold in Sub-Saharan Africa
1.75 million
people with tier 2 energy needs met, currently
Report Highlights
9
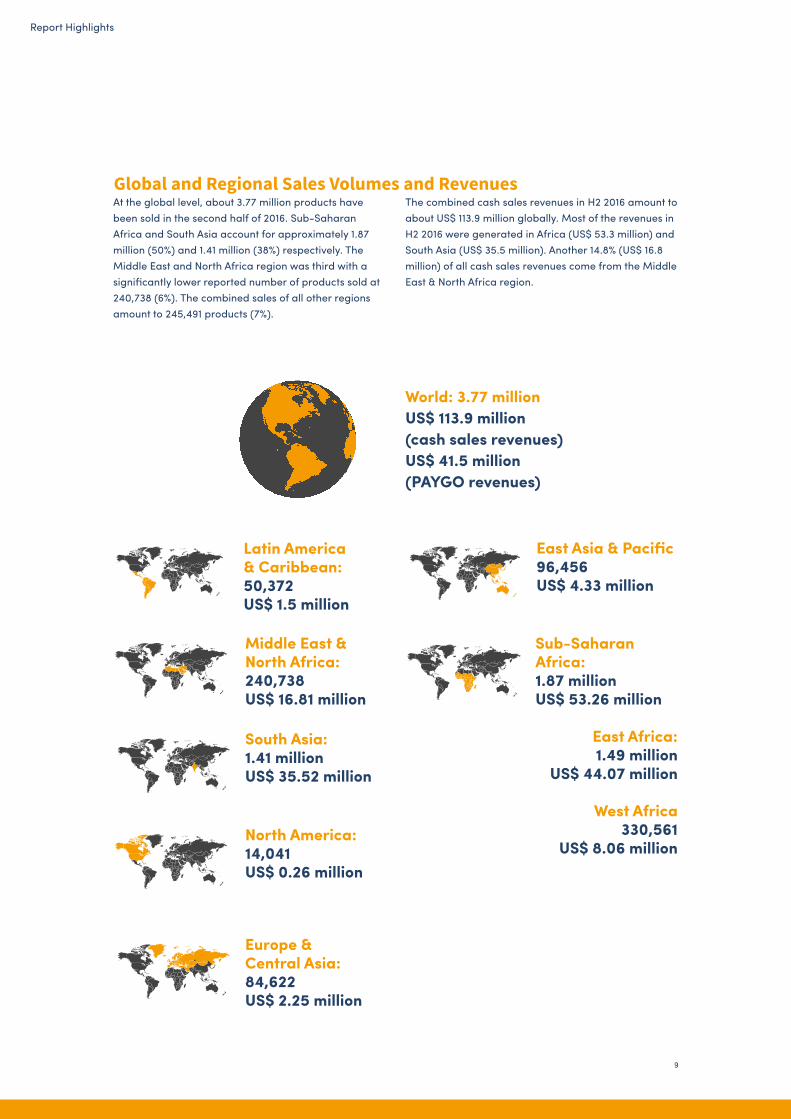
At the global level, about 3.77 million products have been sold in the second half of 2016. Sub-Saharan Africa and South Asia account for approximately 1.87 million (50%) and 1.41 million (38%) respectively. The Middle East and North Africa region was third with a significantly lower reported number of products sold at 240,738 (6%). The combined sales of all other regions amount to 245,491 products (7%).
World: 3.77 million US$ 113.9 million (cash sales revenues) US$ 41.5 million (PAYGO revenues)
Middle East & North Africa: 240,738 US$ 16.81 million
Latin America & Caribbean: 50,372US$ 1.5 million
South Asia: 1.41 millionUS$ 35.52 million
East Asia & Pacific96,456US$ 4.33 million
Sub-Saharan Africa: 1.87 millionUS$ 53.26 million
East Africa: 1.49 million
US$ 44.07 million
West Africa330,561
US$ 8.06 millionNorth America: 14,041US$ 0.26 million
Europe &Central Asia: 84,622US$ 2.25 million
The combined cash sales revenues in H2 2016 amount to about US$ 113.9 million globally. Most of the revenues in H2 2016 were generated in Africa (US$ 53.3 million) and South Asia (US$ 35.5 million). Another 14.8% (US$ 16.8 million) of all cash sales revenues come from the Middle East & North Africa region.
Global and Regional Sales Volumes and Revenues
Report Highlights
10
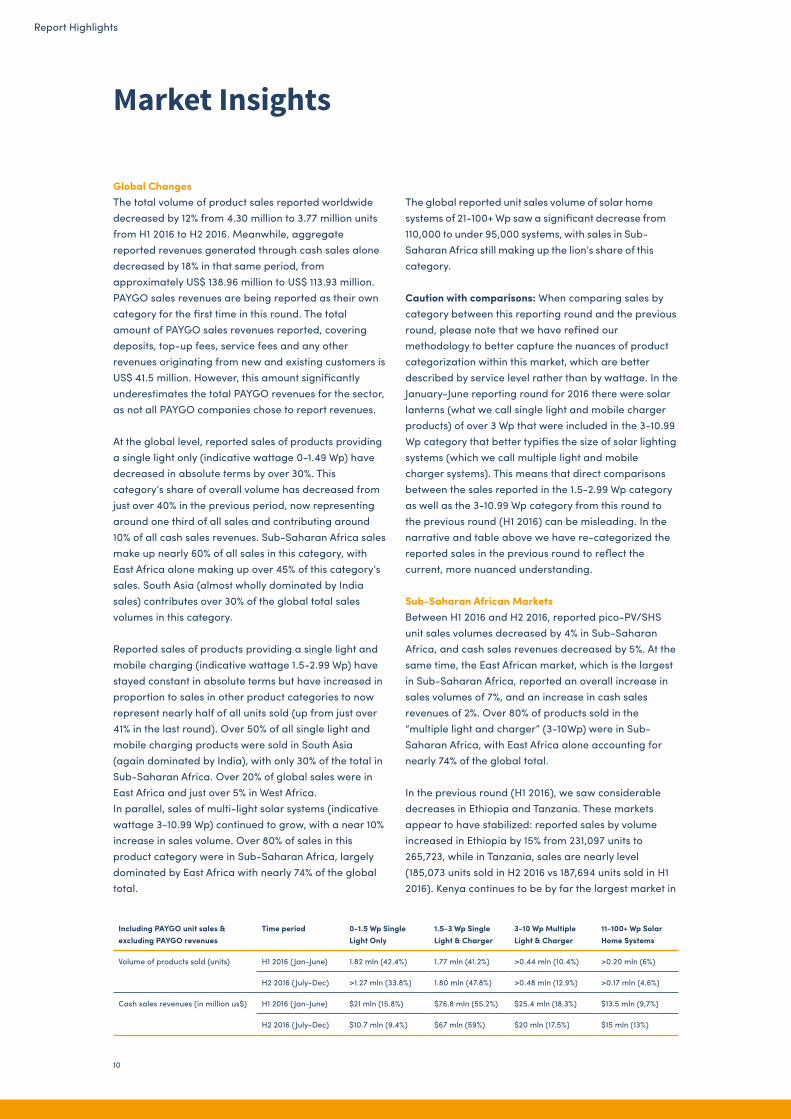
The global reported unit sales volume of solar home systems of 21-100+ Wp saw a significant decrease from 110,000 to under 95,000 systems, with sales in Sub-Saharan Africa still making up the lion’s share of this category.
Caution with comparisons: When comparing sales by category between this reporting round and the previous round, please note that we have refined our methodology to better capture the nuances of product categorization within this market, which are better described by service level rather than by wattage. In the January-June reporting round for 2016 there were solar lanterns (what we call single light and mobile charger products) of over 3 Wp that were included in the 3-10.99 Wp category that better typifies the size of solar lighting systems (which we call multiple light and mobile charger systems). This means that direct comparisons between the sales reported in the 1.5-2.99 Wp category as well as the 3-10.99 Wp category from this round to the previous round (H1 2016) can be misleading. In the narrative and table above we have re-categorized the reported sales in the previous round to reflect the current, more nuanced understanding.
Sub-Saharan African Markets Between H1 2016 and H2 2016, reported pico-PV/SHS unit sales volumes decreased by 4% in Sub-Saharan Africa, and cash sales revenues decreased by 5%. At the same time, the East African market, which is the largest in Sub-Saharan Africa, reported an overall increase in sales volumes of 7%, and an increase in cash sales revenues of 2%. Over 80% of products sold in the “multiple light and charger” (3-10Wp) were in Sub-Saharan Africa, with East Africa alone accounting for nearly 74% of the global total.
In the previous round (H1 2016), we saw considerable decreases in Ethiopia and Tanzania. These markets appear to have stabilized: reported sales by volume increased in Ethiopia by 15% from 231,097 units to 265,723, while in Tanzania, sales are nearly level (185,073 units sold in H2 2016 vs 187,694 units sold in H1 2016). Kenya continues to be by far the largest market in
Global ChangesThe total volume of product sales reported worldwide decreased by 12% from 4.30 million to 3.77 million units from H1 2016 to H2 2016. Meanwhile, aggregate reported revenues generated through cash sales alone decreased by 18% in that same period, from approximately US$ 138.96 million to US$ 113.93 million. PAYGO sales revenues are being reported as their own category for the first time in this round. The total amount of PAYGO sales revenues reported, covering deposits, top-up fees, service fees and any other revenues originating from new and existing customers is US$ 41.5 million. However, this amount significantly underestimates the total PAYGO revenues for the sector, as not all PAYGO companies chose to report revenues.
At the global level, reported sales of products providing a single light only (indicative wattage 0-1.49 Wp) have decreased in absolute terms by over 30%. This category’s share of overall volume has decreased from just over 40% in the previous period, now representing around one third of all sales and contributing around 10% of all cash sales revenues. Sub-Saharan Africa sales make up nearly 60% of all sales in this category, with East Africa alone making up over 45% of this category’s sales. South Asia (almost wholly dominated by India sales) contributes over 30% of the global total sales volumes in this category.
Reported sales of products providing a single light and mobile charging (indicative wattage 1.5-2.99 Wp) have stayed constant in absolute terms but have increased in proportion to sales in other product categories to now represent nearly half of all units sold (up from just over 41% in the last round). Over 50% of all single light and mobile charging products were sold in South Asia (again dominated by India), with only 30% of the total in Sub-Saharan Africa. Over 20% of global sales were in East Africa and just over 5% in West Africa.In parallel, sales of multi-light solar systems (indicative wattage 3-10.99 Wp) continued to grow, with a near 10% increase in sales volume. Over 80% of sales in this product category were in Sub-Saharan Africa, largely dominated by East Africa with nearly 74% of the global total.
Market Insights
Including PAYGO unit sales & excluding PAYGO revenues
Time period 0-1.5 Wp Single Light Only
1.5-3 Wp Single Light & Charger
3-10 Wp Multiple Light & Charger
11-100+ Wp Solar Home Systems
Volume of products sold (units) H1 2016 (Jan-June) 1.82 mln (42.4%) 1.77 mln (41.2%) >0.44 mln (10.4%) >0.20 mln (6%)
H2 2016 (July-Dec) >1.27 mln (33.8%) 1.80 mln (47.8%) >0.48 mln (12.9%) >0.17 mln (4.6%)
Cash sales revenues (in million us$) H1 2016 (Jan-June) $21 mln (15.8%) $76.8 mln (55.2%) $25.4 mln (18.3%) $13.5 mln (9,7%)
H2 2016 (July-Dec) $10.7 mln (9.4%) $67 mln (59%) $20 mln (17.5%) $15 mln (13%)
Report Highlights

Sub-Saharan Africa, with an 18% increase in reported sales volumes from 561,604 to 666,881 units in H2 2016. Significant increases are to be seen in reported sales volumes in the smaller West African markets of Ghana (+208%), Burkina Faso (+80%), Senegal (+145%), Mali (+199%) and Sierra Leone (+750%). Still, the overall West African market had a decrease in reported sales volumes of 14.5%. Much of this is explained by the decrease in the reported sales from Benin. In H1 2016, Benin’s sales accounted for 45% of total West African sales with 172,634 sales reported, while in H2 2016, Benin accounted for less than 1% of West African sales with 2,800 sales reported.
South Asian Markets Reported sales volumes decreased by 20%, and sales revenues by 26%, in South Asia from H1 2016 to H2 2016. India accounts for nearly all reported sales in this market, representing 97% of reported sales volumes (1.38 million units) and 99% of reported cash sales revenues ($34.88 million). In this round, we were unfortunately not able to report on sales in Bangladesh as we had fewer than three companies reporting on the country. Over 50% of all single light and mobile charging products were sold in South Asia, with India accounting for nearly all of these.
Pay-As-You-Go Reporting This report includes, for the first time, PAYGO revenues as a separate category; in previous rounds, only cash sales revenues have been reported. This is the first step to building a more complete understanding of the PAYGO sector. However, caution is to be used when interpreting the data, as not all PAYGO companies chose to report sales revenues, and subsequently the total reported here significantly underestimates the actual revenue generated by the sector. Companies who sell products on a PAYGO basis directly to consumers were asked to report revenues per product on a global basis. In this context, revenues are defined as all cash collected per product, including deposits, top-up fees, service fees, and any other fees paid by customers. This includes payments made by customers who were added in the reporting period, as well as customers who were added prior to the reporting period. From this basis, the total PAYGO revenues reported are US$ 41.50 million.
Impact Metrics When translating sales into impacts, the lives of 110.9 million people have been impacted to date. Currently, more than 85 million people are actively using off-grid solar lighting and electrification products. Despite a
methodological change in the calculation of active products (see text box) we observe an increase of people reaching Tier 1 Energy Access as defined by the SE4All Global Tracking Framework, now growing to 38 million people. This development is driven by the increase in sales of multi-light and phone charging products, which provide a minimum of Tier 1 access to a whole household. Over and above providing energy access, the sector also enables households to save money on energy related spending. On a global aggregate level, more than US$ 4.9 billion has been saved to date, translating to an average of US$200 per household. With this round of data collection, we see a slight decrease in the change of available hours of light metric (now 164% change compared to status quo lighting sources) and a slight increase in the change of available light output metric (now 141% change compared to status quo lighting sources) compared to the last reporting period. This reflects that overall, products are providing brighter light, but for a slightly shorter time. For the first time, this report also presents the aggregate greenhouse gas emissions offset, which constitutes more than 26.9 million metric tons and illustrates the important contribution that the sector is making to the environment.
A drop in the number of products being used?The data presented here shows a dip in the number of people currently reached, livelihoods supported, and the number of status quo lighting sources no longer in place. In the first half of 2016, the number of people reached is reported as 93.6 million, while in the second half of 2016, that figure drops to 85.5 million. Why is this? Berenschot explains: ‘The reason for the variance is a shift in our reporting methodology. All figures reported are estimates. This is largely owing to the relative youth and fast-growth of the sector. We are in our second year of collecting and reporting on impact data, and as such we are refining and improving our methodology and database each time. This round we have improved the granularity. In doing so, we found that there had previously been some overestimation of the number of products in use in the first half of 2016, compared to the second half of 2015 and the second half of 2016. The drop in these impact metrics is therefore owed to restructuring our database and not to a decreasing number of products being actively used by households. Ultimately, we are working towards being able to draw clear comparisons between historic product sales figures and current sales figures on a half-yearly basis, and we hope each report will be an improvement on the last in terms of accuracy and quality of data’.
11
Report Highlights

12
Market Dynamics
The reported sales volumes and revenues presented in this report are influenced by a range of market drivers, including:
• Policy change affecting duties, taxes, and the regulation of the off-grid sector;
• Action by development finance institutions, donor agencies and government market interventions;
• Technology development;• Availability of finance, in particular working capital
and local currency financing;• Macro-economic factors, including general economic
conditions, currency fluctuations, and other factors affecting the purchasing power of customers;
• Seasonal trends and other environmental factors;• Competitive dynamics, especially in relation to
competition from generic, counterfeit and look-a-like products.
For the H2 2016 period, significant points of influence included: Currency devaluation: Exchange rate fluctuations make it difficult for companies to plan ahead and price products appropriately. This is a particularly significant challenge for companies that offer any type of consumer financing, as receivables are in local currency, while invoices are largely in hard currency. It also impacts companies working in single markets more strongly than companies with sales across multiple markets. In Nigeria, the naira was unpegged from the US dollar in June 2016, resulting in a dramatic fall in the value of the naira. Later in the year, the black market rate for the naira continued to fall, while inflation increased and the economy contracted. The resiliency of the Nigerian market is shown by the continued growth in sales volumes despite these challenges, but that growth is slower than it would have been without the currency crisis.
Demonetization: In India, the demonetization that took place on November 8, where the vast majority of the country’s cash was made invalid, had a major effect on the largely cash-based Indian economy. Distributors of solar energy products had to focus efforts on making sales and collecting payments in an environment where consumers were suddenly cash-strapped. This has played a role in the decline of sales reported in the Indian market.
Drought: There is a severe drought impacting countries across eastern Africa, with devastating consequences for rural populations. With simultaneous sharp increases in the price of food, coupled with declining agricultural output, the disposable income of many rural customers is severely constrained.
Import tariffs: In the East African Community (EAC), companies faced a policy change resulting in increased import tariffs on solar products and appliances. While overall sales in EAC still grew, the rate of growth was significantly slower than in previous rounds. Moreover, a decline in the sales of solar home systems was recorded for the first time in East Africa.
Concentration in the market: Concentration both on the side of manufacturers and on the demand side in the form of institutional and other large customers means that the figures reported here are subject to the volatility or “lumpiness” of individual orders. Significant shifts in Benin, Rwanda, and Myanmar from the previous round to this one all point to a few large customers placing orders during the previous round.
©Lagazel
Report Highlights

13
Figure 1: Volume of Products Sold by Quality Verification Status in Millions (Historical)source - lighting global, gogla, berenschot
0 000.000 00 0 000.000 000 000.000 00
0.00
0.00
0.32
0.88
0.790.97
0.52
0.12 0.16 0.35 0.46
0.97
2.16 2.21 2.36
3.01
2.04
3.29 3.33 3.25
Quality verified Non-quality verified
H2 2010 H1 2011 H2 2011 H1 2012 H2 2012 H1 2013 H2 2013 H1 2014 H2 2014 H1 2015 H2 2015 H1 2016 H2 20160
1
2
3
4
5
NOTES1. The data presented in this chart has been compiled from various
sources: The data from H2 2010 to H1 2014 originates from Lighting Global’s own data collection, while the data from H2 2014 to H2 2016 comes from the joint Lighting Global / GOGLA / Berenschot data collection process. The methodology and the questions used have evolved over time and the number of respondents has changed with each round of data collection. Therefore, the data presented above does not constitute the basis for an in-depth statistically correct analysis. However, it does indicate general market trends and reflects the evolution of the market as it encompasses data from most of the industry leaders. As the data collection process is improved with every round and with companies submitting their data on a consistent basis, we will be able to paint an ever more accurate picture of the market.
2. Based on previous analysis by Bloomberg New Energy Finance for the Off-Grid Solar Market Trends Report 2016, we estimate that the data reported here represents about 50% of all sales of off-grid solar products in the markets relevant to this report, when also considering non-branded generic products on offer.
Historical Product Sales The following graphs compare the current sales count with previous counts, indicating a slight decrease in sales recorded in this period. Globally, reported sales volumes decreased by 12% between H1 2016 (4.3 million units) and H2 2016 (3.8 million units).
When looking at cumulative data since sales reporting began in July 2010 (see Figure 3), 23.72 million quality verified and 3.48 million non-quality verified product sales have been reported by the end of H2 2016.
©Lagazel
Report Highlights

14
Figure 2: Regional Sales: Volume of Products Sold in Millions
Sub-Saharan Africa India Total
H1 2014 H2 2014 H1 2015 H2 2015 H1 2016 H2 20160
1
2
3
4
5
NOTEThe data presented in this chart has been compiled from various sources: The data from H2 2010 to H1 2014 originates from Lighting Global’s own data collection, while the data from H2 2014 to H2 2016 comes from the joint Lighting Global / GOGLA / Berenschot data collection process. The methodology and the questions used have evolved over time and the number of respondents has changed with each round of data collection. Therefore, the data presented above does not constitute the basis for an in-depth statistically correct analysis. However, it does indicate general market trends and reflects the evolution of the market as it encompasses data from most of the industry leaders. As the data collection process is improved with every round and with companies submitting their data on a consistent basis, we will be able to paint an ever more accurate picture of the market.
In Sub-Saharan Africa 1.87 million units were sold and the cash sales revenues amounted to US$ 53.26 million.The number of units sold in South Asia was 1.41 million and the cash sales revenues were US$ 35.52 million.Reported sales remain highly concentrated in East Africa and India. East Africa represents about 80% of total sales volumes in Sub-Saharan Africa, with 1.49
million products sold, and 83% of revenues with US$ 44.07 million cash sales revenues reported. The vast majority of the sales in South Asia are concentrated in India, which represents 98% of sales volumes and cash sales revenues with 1.38 million units sold, and US$ 34.88 million in cash sales revenues.
Report Highlights

15
Figure 3: Cumulative Global Sales: Volume of Products Sold
NOTES1. The data presented in this chart has been compiled from various
sources: The data from H2 2010 to H1 2014 originates from Lighting Global’s own data collection, while the data from H2 2014 to H2 2016 comes from the joint Lighting Global / GOGLA / Berenschot data collection process. The methodology and the questions used have evolved over time and the number of respondents has changed with each round of data collection. Therefore, the data presented above does not constitute the basis for an in-depth statistically correct analysis. However, it does indicate general market trends and reflects the evolution of the market as it encompasses data from most of the industry leaders. As the data collection process is improved with every round and with companies submitting their data on a consistent basis, we will be able to paint an ever more accurate picture of the market.
2. Based on previous analysis by Bloomberg New Energy Finance for the Off-Grid Solar Market Trends Report 2016, we estimate that the data reported here represents about 50% of all sales of off-grid solar products in the markets relevant to this report, when also considering non-branded generic products on offer.
0.000 000 00 0.000.000 00 0 000.000 00 0 000.000 000 000.000 00
0.32
1.20
1.99
2.96
3.48
0.12 0.28 0.63 1.09 2.064.22
6.438.79
11.8013.84
17.13
20.47
23.72
Quality verified Non-quality verified
H2 2010 H1 2011 H2 2011 H1 2012 H2 2012 H1 2013 H2 2013 H1 2014 H2 2014 H1 2015 H2 2015 H1 2016 H2 20160
5
10
15
20
25
30
Report Highlights

16
Highlights by Product CategoryAs shown in Figure 4, just under 34% of total reported products sold worldwide (nearly 1.28 million) were single light products in the range of 0-1.5 Wp. However, revenues from cash sales of products in the 0-1.5 Wp range represent under 10% of the total cash sales revenues or just over US$ 10 million (Figure 5). This is due to the lower retail price of such products.The next category, products with a single light and mobile phone charging capability in the 1.5-3 Wp range, account for nearly 48% of all reported sales, or 1.80 million units. These products generate the lion’s share of overall revenue at over US$ 67 million, or nearly 59% of the global total reported cash sales revenues.As observed in previous reporting cycles, the number of products sold is lower in the more expensive product categories, with 3-10Wp products selling nearly 500,000 units (just under 13% of the unit volume and generating
18% (about US$ 20 million) of total global cash sales revenues. Going further up in size, products in the 11-100+Wp ranges generate over 13% of cash sales revenues, nearly US$ 15 million.
While PAYG revenues reported here underestimate total PAYG revenues, as not all PAYG companies disclosed revenues, they give an indication of how PAYG revenues are distributed across product categories. PAYG revenues from products sold in the 3-10 Wp category amount to 68% of the total reported PAYG revenues, at just over US$ 28 million. PAYG revenues from products in the 11-20 Wp range represent 12% of the total revenues from PAYG sales, or just under US$ 5 million.
Collectively, products in the 50-100+Wp range amount to 20% of total revenue, generating over US$ 8.2 million.
Figure 4: Volume of Products Sold Globally by Product Category
3,770,855
1,276,827
1,802,771
487,854
60,756
28,633
61,957
20,800
0
Volume of Products Sold Globally by Product Category
Total
0-1.5 Wp
1.5-3 Wp
3-10 Wp
11-20 Wp
21-49 Wp
50-100 Wp
100+ Wp
Not specified
Report Highlights

17
Figure 5: Global Cash Sales Revenues by Product Category
NOTEWhere cash sales revenues are $0, there is either no data available or there are not enough data points available to report.
Figure 6: Global PAYGO Revenues by Product Category
$113,926,299
$10,702,381
$67,056,607
$19,970,592
$3,343,437
$10,568,251
$1,022,328
$0
$0
Global Cash Sales Revenues by Product Category
Total
0-1.5 Wp
1.5-3 Wp
3-10 Wp
11-20 Wp
21-49 Wp
50-100 Wp
100+ Wp
Not specified
$41,501,224
$0
$0
$28,097,022
$4,987,904
$0
$2,667,134
$5,576,532
$0
Global PAYGO Revenues by Product Category
Total
0-1.5 Wp
1.5-3 Wp
3-10 Wp
11-20 Wp
21-49 Wp
50-100 Wp
100+ Wp
Not specified
NOTEWhere reported PAYGO sales revenues are $0, there is either no data available or there are not enough data points available to report.
Report Highlights

18
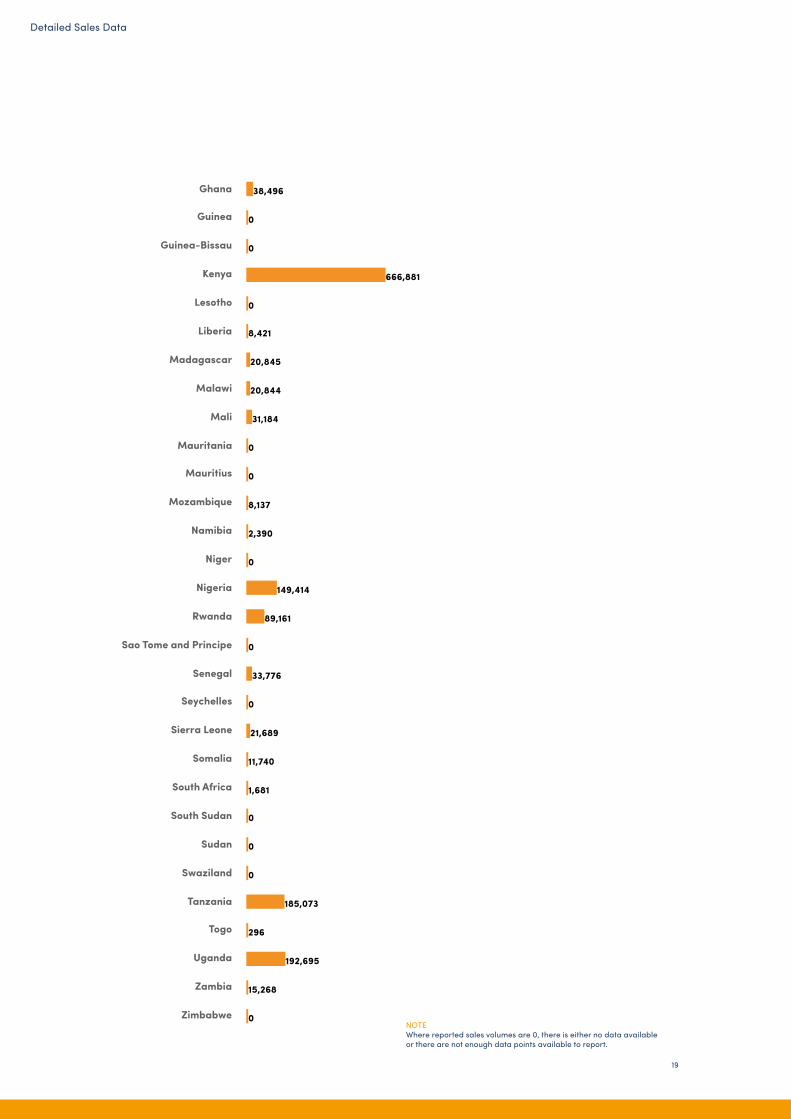
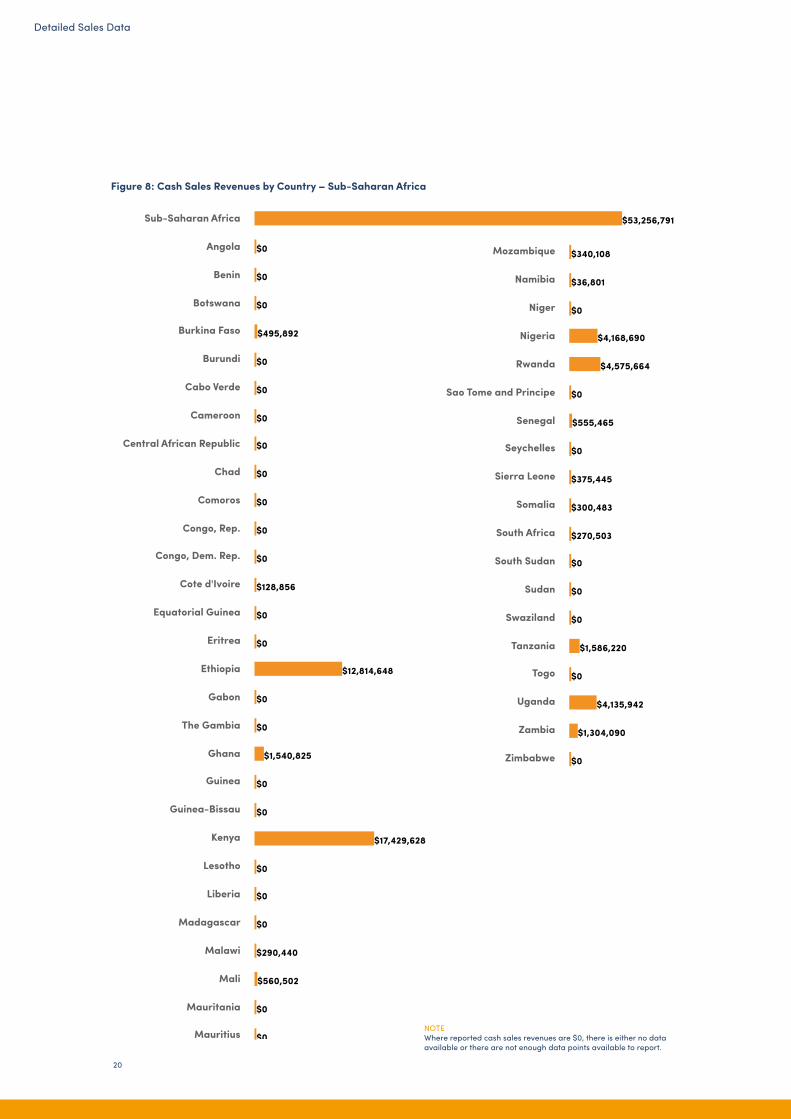
In Sub-Saharan Africa (Figure 7), most of the sales have been recorded in East African countries with Kenya, Ethiopia, Uganda and Tanzania representing 70% of all sales in the region. Most cash sales revenues (Figure 8) also came from East Africa, with US$ 17.43 million in Kenya and US$ 12.81 million in Ethiopia alone.
In South Asia, most sales were reported in India, with about 1.38 million products sold, or 97% of sales in the region (Figure 9). Unfortunately, we are not able to report on sales in Bangladesh in this round. Worldwide, India is by far the country with the most recorded sales.
Cash sales revenues in India alone amounted to approximately US$ 34.9 million in H2 2016. This translates to 98% of all cash sales revenues in South Asia or nearly one third (31%) of global cash sales revenues.
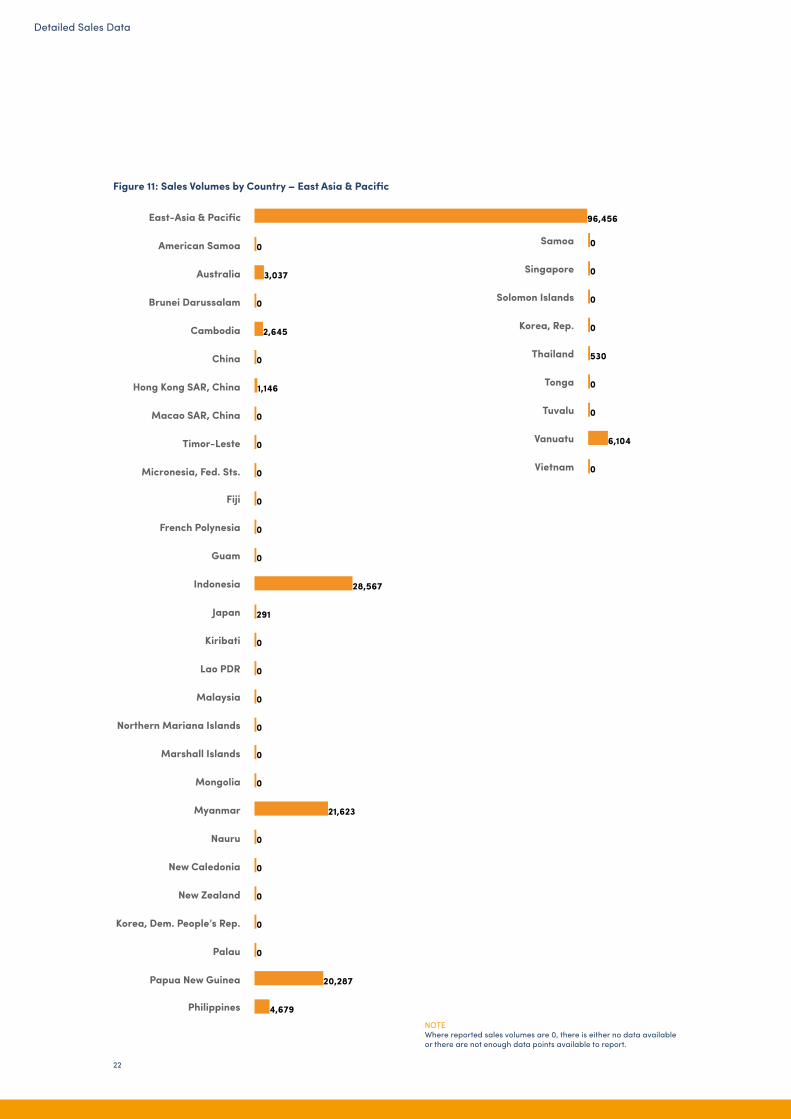
In East Asia & Pacific (EAP), the highest sales volumes were reported in Indonesia with 28,567 products sold (30% of EAP sales), followed by Myanmar with 21,623 (22% of EAP sales) and Papua New Guinea with 20,287 (21% of EAP sales).
Figure 7: Sales Volumes by Country – Sub-Saharan Africa
1,870,821
0
2,800
0
34,733
0
0
45,444
0
0
0
0
729
8,776
0
0
265,723
0
576
38,496
0
0
666,881
0
8,421
20,845
20,844
31,184
0
0
8,137
2,390
0
149,414
89,161
0
33,776
0
21,689
11,740
1,681
0
0
0
185,073
296
192,695
15,268
0
Total Market
Sub-Saharan Africa
Angola
Benin
Botswana
Burkina Faso
Burundi
Cabo Verde
Cameroon
Central African Republic
Chad
Comoros
Congo, Rep.
Congo, Dem. Rep.
Cote d'Ivoire
Equatorial Guinea
Eritrea
Ethiopia
Gabon
The Gambia
Ghana
Guinea
Guinea-Bissau
Kenya
Lesotho
Liberia
Madagascar
Malawi
Mali
Mauritania
Mauritius
Mozambique
Namibia
Niger
Nigeria
Rwanda
Sao Tome and Principe
Senegal
Seychelles
Sierra Leone
Somalia
South Africa
South Sudan
Sudan
Swaziland
Tanzania
Togo
Uganda
Zambia
Zimbabwe
Sales Volumes and Cash Sales Revenues by Country
Detailed Sales Data
Detailed Sales Data
19
1,870,821
0
2,800
0
34,733
0
0
45,444
0
0
0
0
729
8,776
0
0
265,723
0
576
38,496
0
0
666,881
0
8,421
20,845
20,844
31,184
0
0
8,137
2,390
0
149,414
89,161
0
33,776
0
21,689
11,740
1,681
0
0
0
185,073
296
192,695
15,268
0
Total Market
Sub-Saharan Africa
Angola
Benin
Botswana
Burkina Faso
Burundi
Cabo Verde
Cameroon
Central African Republic
Chad
Comoros
Congo, Rep.
Congo, Dem. Rep.
Cote d'Ivoire
Equatorial Guinea
Eritrea
Ethiopia
Gabon
The Gambia
Ghana
Guinea
Guinea-Bissau
Kenya
Lesotho
Liberia
Madagascar
Malawi
Mali
Mauritania
Mauritius
Mozambique
Namibia
Niger
Nigeria
Rwanda
Sao Tome and Principe
Senegal
Seychelles
Sierra Leone
Somalia
South Africa
South Sudan
Sudan
Swaziland
Tanzania
Togo
Uganda
Zambia
ZimbabweNOTEWhere reported sales volumes are 0, there is either no data available or there are not enough data points available to report.
Detailed Sales Data
20
Figure 8: Cash Sales Revenues by Country – Sub-Saharan Africa
$53,256,791
$0
$0
$0
$495,892
$0
$0
$0
$0
$0
$0
$0
$0
$128,856
$0
$0
$12,814,648
$0
$0
$1,540,825
$0
$0
$17,429,628
$0
$0
$0
$290,440
$560,502
$0
$0
$340,108
$36,801
$0
$4,168,690
$4,575,664
$0
$555,465
$0
$375,445
$300,483
$270,503
$0
$0
$0
$1,586,220
$0
$4,135,942
$1,304,090
$0
Total Market
Sub-Saharan Africa
Angola
Benin
Botswana
Burkina Faso
Burundi
Cabo Verde
Cameroon
Central African Republic
Chad
Comoros
Congo, Rep.
Congo, Dem. Rep.
Cote d'Ivoire
Equatorial Guinea
Eritrea
Ethiopia
Gabon
The Gambia
Ghana
Guinea
Guinea-Bissau
Kenya
Lesotho
Liberia
Madagascar
Malawi
Mali
Mauritania
Mauritius
Mozambique
Namibia
Niger
Nigeria
Rwanda
Sao Tome and Principe
Senegal
Seychelles
Sierra Leone
Somalia
South Africa
South Sudan
Sudan
Swaziland
Tanzania
Togo
Uganda
Zambia
Zimbabwe
NOTEWhere reported cash sales revenues are $0, there is either no data available or there are not enough data points available to report.
Detailed Sales Data

21
Figure 9: Sales Volumes by Country – South Asia
1,413,805
0
0
0
1,378,130
0
26,413
4,937
0
Total Market
South Asia
Afghanistan
Bangladesh
Bhutan
India
Maldives
Nepal
Pakistan
Sri Lanka
Figure 10: Cash Sales Revenues by Country – South Asia
$35,517,189
$0
$0
$0
$34,881,452
$0
$541,011
$0
$0
Total Market
South Asia
Afghanistan
Bangladesh
Bhutan
India
Maldives
Nepal
Pakistan
Sri Lanka
Detailed Sales Data
NOTEWhere reported sales volumes are 0, there is either no data available or there are not enough data points available to report.
NOTEWhere reported cash sales revenues are $0, there is either no data available or there are not enough data points available to report.
22
Figure 11: Sales Volumes by Country – East Asia & Pacific
96,456
0
3,037
0
2,645
0
1,146
0
0
0
0
0
0
28,567
291
0
0
0
0
0
0
21,623
0
0
0
0
0
20,287
4,679
0
0
0
0
530
0
0
6,104
0
Total Market
East-Asia & Pacific
American Samoa
Australia
Brunei Darussalam
Cambodia
China
Hong Kong SAR, China
Macao SAR, China
Timor-Leste
Micronesia, Fed. Sts.
Fiji
French Polynesia
Guam
Indonesia
Japan
Kiribati
Lao PDR
Malaysia
Northern Mariana Islands
Marshall Islands
Mongolia
Myanmar
Nauru
New Caledonia
New Zealand
Korea, Dem. People’s Rep.
Palau
Papua New Guinea
Philippines
Samoa
Singapore
Solomon Islands
Korea, Rep.
Thailand
Tonga
Tuvalu
Vanuatu
Vietnam
Detailed Sales Data
NOTEWhere reported sales volumes are 0, there is either no data available or there are not enough data points available to report.
23
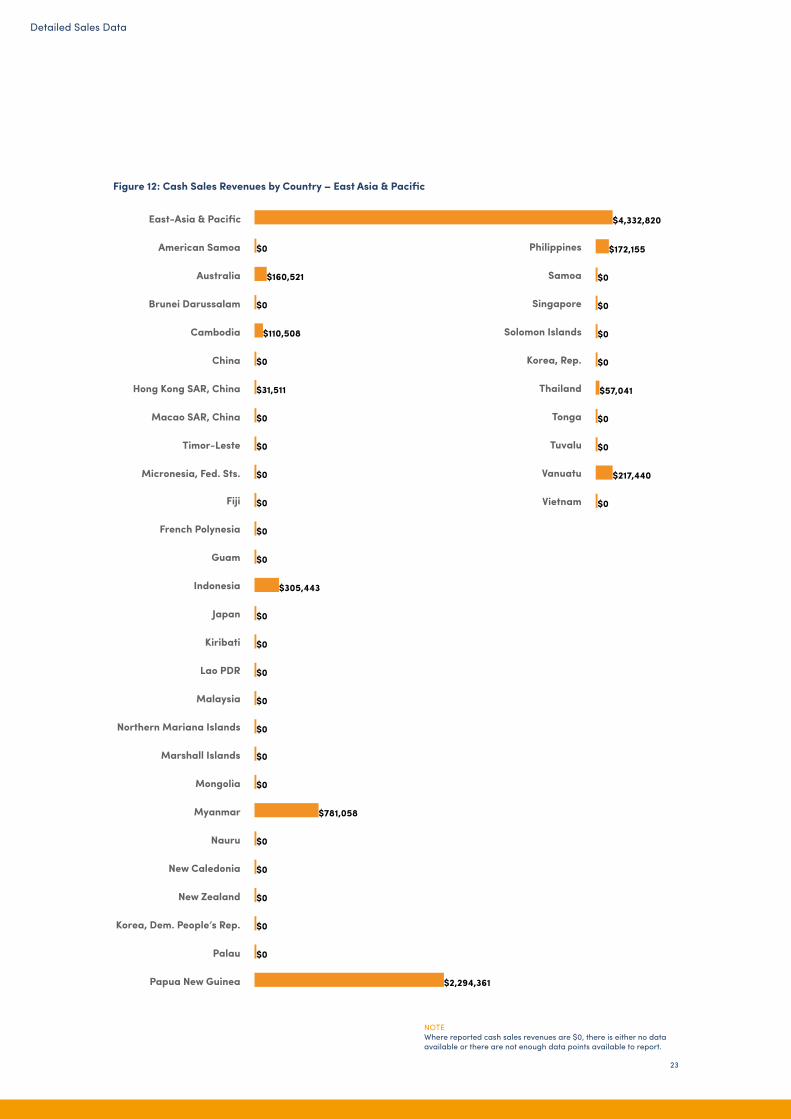
Figure 12: Cash Sales Revenues by Country – East Asia & Pacific
$4,332,820
$0
$160,521
$0
$110,508
$0
$31,511
$0
$0
$0
$0
$0
$0
$305,443
$0
$0
$0
$0
$0
$0
$0
$781,058
$0
$0
$0
$0
$0
$2,294,361
$172,155
$0
$0
$0
$0
$57,041
$0
$0
$217,440
$0
Total Market
East-Asia & Pacific
American Samoa
Australia
Brunei Darussalam
Cambodia
China
Hong Kong SAR, China
Macao SAR, China
Timor-Leste
Micronesia, Fed. Sts.
Fiji
French Polynesia
Guam
Indonesia
Japan
Kiribati
Lao PDR
Malaysia
Northern Mariana Islands
Marshall Islands
Mongolia
Myanmar
Nauru
New Caledonia
New Zealand
Korea, Dem. People’s Rep.
Palau
Papua New Guinea
Philippines
Samoa
Singapore
Solomon Islands
Korea, Rep.
Thailand
Tonga
Tuvalu
Vanuatu
Vietnam
Detailed Sales Data
NOTEWhere reported cash sales revenues are $0, there is either no data available or there are not enough data points available to report.
24
240,738
0
0
0
0
0
0
0
0
0
0
0
0
0
0
0
0
0
0
46,897
0
0
Total Market
Middle East & North Africa
Algeria
Bahrain
Djibouti
Egypt, Arab Rep.
Iran
Iraq
Israel
Jordan
Kuwait
Lebanon
Libya
Malta
Morocco
Oman
Qatar
Saudi Arabia
Syrian Arab Republic
Tunisia
United Arab Emirates
West Bank and Gaza
Yemen, Rep.
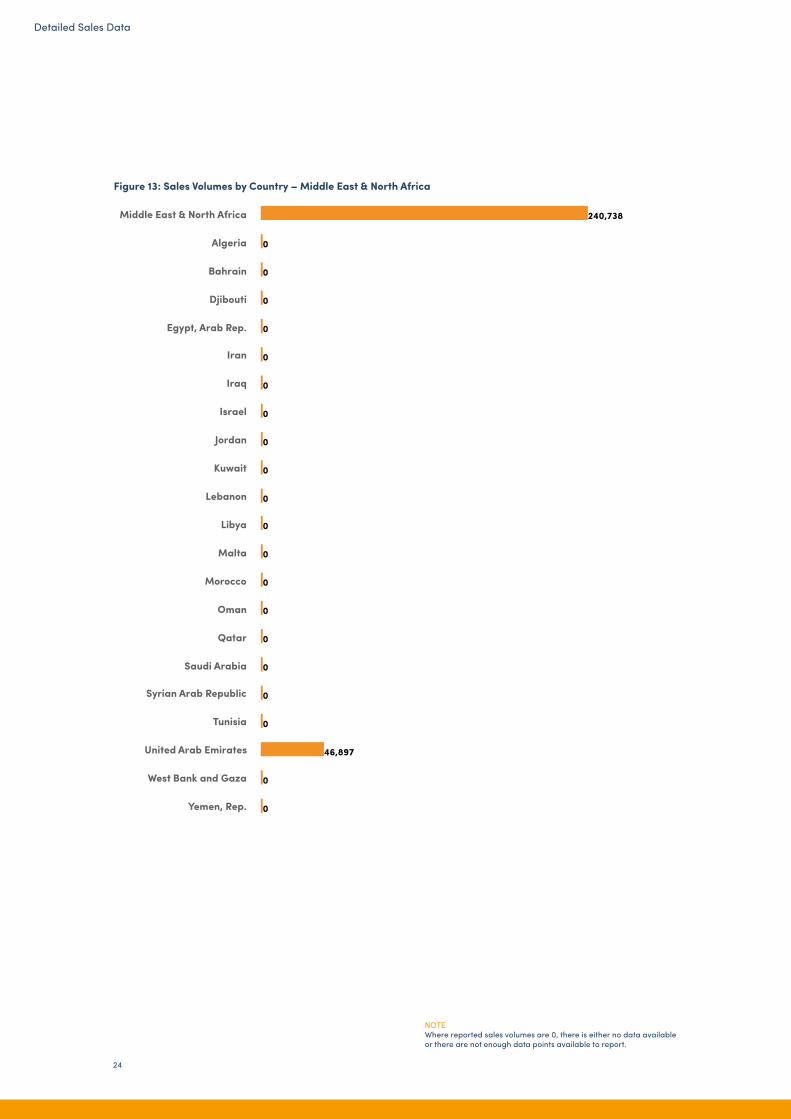
Figure 13: Sales Volumes by Country – Middle East & North Africa
Detailed Sales Data
NOTEWhere reported sales volumes are 0, there is either no data available or there are not enough data points available to report.

25
Figure 14: Cash Sales Revenues by Country – Middle East & North Africa
$16,811,235
$0
$0
$0
$0
$0
$0
$0
$0
$0
$0
$0
$0
$0
$0
$0
$0
$0
$0
$2,868,110
$0
$0
Total Market
Middle East & North Africa
Algeria
Bahrain
Djibouti
Egypt, Arab Rep.
Iran
Iraq
Israel
Jordan
Kuwait
Lebanon
Libya
Malta
Morocco
Oman
Qatar
Saudi Arabia
Syrian Arab Republic
Tunisia
United Arab Emirates
West Bank and Gaza
Yemen, Rep.
Detailed Sales Data
NOTEWhere reported cash sales revenues are $0, there is either no data available or there are not enough data points available to report.

26
Figure 15: Sales Volumes by Country – Latin America
50,372
0
0
0
0
0
0
0
0
0
0
0
1,403
0
0
0
0
0
0
0
0
0
0
9,189
0
0
7,423
0
1,042
0
2,742
0
0
0
0
0
0
0
0
0
0
0
0
Total Market
Latin America & Caribbean
Antigua and Barbuda
Argentina
Aruba
Bahamas, The
Barbados
Belize
Bolivia
Brazil
British Virgin Islands
Cayman Island
Chile
Colombia
Costa Rica
Cuba
Curacao
Dominica
Dominican Republic
Ecuador
El Salvador
Grenada
Guatemala
Guyana
Haiti
Honduras
Jamaica
Mexico
Nicaragua
Panama
Paraguay
Peru
Puerto Rico
St.Kitts and Nevis
St. Lucia
Sint Maarten (Dutch part)
St. Martin (French part)
St. Vincent and the Grenadines
Suriname
Trinidad and Tobago
Turks and Caicos Islands
Uruguay
Venezuela, RB
Virgin Islands (U.S.)
Detailed Sales Data
NOTEWhere reported sales volumes are 0, there is either no data available or there are not enough data points available to report.

27
Figure 16: Cash Sales Revenues by Country – Latin America
$1,499,418
$0
$0
$0
$0
$0
$0
$0
$0
$0
$0
$0
$49,371
$0
$0
$0
$0
$0
$0
$0
$0
$0
$0
$0
$0
$0
$140,295
$0
$0
$0
$131,134
$0
$0
$0
$0
$0
$0
$0
$0
$0
$0
$0
$0
Total Market
Latin America & Caribbean
Antigua and Barbuda
Argentina
Aruba
Bahamas, The
Barbados
Belize
Bolivia
Brazil
British Virgin Island
Cayman Island
Chile
Colombia
Costa Rica
Cuba
Curacao
Dominica
Dominican Republic
Ecuador
El Salvador
Grenada
Guatemala
Guyana
Haiti
Honduras
Jamaica
Mexico
Nicaragua
Panama
Paraguay
Peru
Puerto Rico
St.Kitts and Nevis
St. Lucia
Sint Maarten (Dutch part)
St. Martin (French part)
St. Vincent and the Grenadines
Suriname
Trinidad and Tobago
Turks and Caicos Islands
Uruguay
Venezuela, RB
Virgin Islands (U.S.)
Detailed Sales Data
NOTEWhere reported cash sales revenues are $0, there is either no data available or there are not enough data points available to report.

28
Figure 17: Sales Volumes by Country – North America
Figure 18: Cash Sales Revenues by Country – North America
14,041
0
0
13,827
Total Market
North America
Bermuda
Canada
United States
$256,532
$0
$0
$245,078
Total Market
North America
Bermuda
Canada
United States
Detailed Sales Data
NOTEWhere reported sales volumes are 0, there is either no data available or there are not enough data points available to report.
NOTEWhere reported cash sales revenues are $0, there is either no data available or there are not enough data points available to report.

29
Figure 19: Sales Volumes by Country – Europe & Central Asia
84,622
0
0
0
0
0
0
0
0
0
0
0
0
0
0
0
0
8,928
0
31,577
0
6,023
0
0
0
0
0
3,670
0
0
0
0
0
0
0
0
0
0
0
0
0
0
0
0
0
0
0
0
0
0
0
0
0
0
0
0
6,692
0
Total Market
Europe & Central Asia
Albania
Andorra
Armenia
Austria
Azerbaijan
Belarus
Belgium
Bosnia and Herzegovina
Bulgaria
Croatia
Cyprus
Czech Republic
Denmark
Estonia
Faroe Islands
Finland
France
Georgia
Germany
Gibraltar
Greece
Greenland
Hungary
Iceland
Ireland
Isle of Man
Italy
Kazakhstan
Kosovo
Kyrgyz Republic
Latvia
Liechtenstein
Lithuania
Luxembourg
Macedonia, FYR
Moldova
Monaco
Montenegro
Netherlands
Norway
Poland
Portugal
Romania
Russian Federation
San Marino
Serbia
Slovak Republic
Slovenia
Spain
Sweden
Switzerland
Tajikistan
Turkey
Turkmenistan
Ukraine
United Kingdom
Uzbekistan
Detailed Sales Data
NOTEWhere reported sales volumes are 0, there is either no data available or there are not enough data points available to report.

30
Figure 20: Cash Sales Revenues by Country – Europe & Central Asia
$2,252,312
$0
$0
$0
$0
$0
$0
$0
$0
$0
$0
$0
$0
$0
$0
$0
$0
$143,950
$0
$381,795
$0
$371,538
$0
$0
$0
$0
$0
$227,194
$0
$0
$0
$0
$0
$0
$0
$0
$0
$0
$0
$0
$0
$0
$0
$0
$0
$0
$0
$0
$0
$0
$0
$0
$0
$0
$0
$0
$113,714
$0
Total Market
Europe & Central Asia
Albania
Andorra
Armenia
Austria
Azerbaijan
Belarus
Belgium
Bosnia and Herzegovina
Bulgaria
Croatia
Cyprus
Czech Republic
Denmark
Estonia
Faroe Islands
Finland
France
Georgia
Germany
Gibraltar
Greece
Greenland
Hungary
Iceland
Ireland
Isle of Man
Italy
Kazakhstan
Kosovo
Kyrgyz Republic
Latvia
Liechtenstein
Lithuania
Luxembourg
Macedonia, FYR
Moldova
Monaco
Montenegro
Netherlands
Norway
Poland
Portugal
Romania
Russian Federation
San Marino
Serbia
Slovak Republic
Slovenia
Spain
Sweden
Switzerland
Tajikistan
Turkey
Turkmenistan
Ukraine
United Kingdom
Uzbekistan
Detailed Sales Data
NOTEWhere reported cash sales revenues are $0, there is either no data available or there are not enough data points available to report.

31
Detailed Sales Data
©Renewit Solar

32
In Sub-Saharan Africa, entry-level products (0-1.5 Wp) represent 39% of products sold with 737,884 units out of 1,870,821. Another 545,480 (29%) and 411,969 (22%) products with a capacity of 1.5-3 Wp and 3-10 Wp respectively were sold (see Figure 21). In addition, 95,121 (5%) products in the 21 Wp to 100+ Wp categories were sold in the second half of 2016. Still, 41% (US$ 22 million) of all reported cash sales revenues in the region stem from 1.5-3 Wp products, making it the single largest category in cash sales revenues in Sub-Saharan Africa. In South Asia, 970,600 products with a capacity of 1.5-3 Wp were sold, representing the great majority of all sales in the region (69%). The reported cash sales revenues from this product accounted for nearly US$ 27.5 million, or 77.4% of cash sales revenues in South Asia.
Most products sold in the East Asia & Pacific region are in the 0-1.5 Wp range (40,794 out of 96,456). However, these products represent only about 8% of reported cash sales revenues (around US$ 0.3 million out of US$ 4.3 million) in the region.
In the Middle East & North Africa (MENA) region, products sold in the range of 0-1.5 Wp represent 56% of products sold with 28,421 units. However, this category accounts only for 17% of all reported cash sales revenues in the region (around US$ 0.25 million). Another 13,572 (27%) products with a capacity of 1.5-3 Wp were sold, representing the single largest category in cash sales revenues in the MENA region (US$ 0.4 million, or 26% of all cash sales revenues).
Figure 21a: Sales Volumes & Cash Sales Revenues by Product Category – Sub-Saharan Africa
1,870,821
737,884
545,480
411,969
49,877
18,592
60,934
15,595
0
Total Market
Total
0-1.5 Wp
1.5-3 Wp
3-10 Wp
11-20 Wp
21-49 Wp
50-100 Wp
100+ Wp
Not specified
$53,256,791
$5,946,897
$21,998,968
$14,284,598
$1,292,536
$7,563,535
$907,555
$0
$0
Total Market
Total
0-1.5 Wp
1.5-3 Wp
3-10 Wp
11-20 Wp
21-49 Wp
50-100 Wp
100+ Wp
Not specified
Sales Volumes and Revenues by Product Category
Detailed Sales Data
NOTEWhere reported sales volumes are 0 or cash sales revenues are $0, there is either no data available or there are not enough data points available to report.

33
Figure 21b: Sales Volumes & Cash Sales Revenues by Product Category - East Africa
1,487,758
583,536
410,201
359,853
41,194
17,089
30,103
15,492
0
Total Market
Total
0-1.5 Wp
1.5-3 Wp
3-10 Wp
11-20 Wp
21-49 Wp
50-100 Wp
100+ Wp
Not specified
330,561
135,851
104,300
49,486
8,679
1,415
30,730
0
0
Total Market
Total
0-1.5 Wp
1.5-3 Wp
3-10 Wp
11-20 Wp
21-49 Wp
50-100 Wp
100+ Wp
Not specified
$44,066,849
$4,578,689
$17,345,044
$13,109,874
$141,561
$6,976,319
$787,659
$0
$0
Total Market
Total
0-1.5 Wp
1.5-3 Wp
3-10 Wp
11-20 Wp
21-49 Wp
50-100 Wp
100+ Wp
Not specified
$8,055,171
$1,236,307
$3,905,731
$1,143,244
$1,150,975
$580,015
$0
$0
$0
Total Market
Total
0-1.5 Wp
1.5-3 Wp
3-10 Wp
11-20 Wp
21-49 Wp
50-100 Wp
100+ Wp
Not specified
Figure 21c: Sales Volumes & Cash Sales Revenues by Product Category - West Africa
Detailed Sales Data
NOTEWhere reported sales volumes are 0 or cash sales revenues are $0, there is either no data available or there are not enough data points available to report.
NOTEWhere reported sales volumes are 0 or cash sales revenues are $0, there is either no data available or there are not enough data points available to report.

34
4,094
653
2,197
1,001
0
0
0
0
0
Total Market
Total
0-1.5 Wp
1.5-3 Wp
3-10 Wp
11-20 Wp
21-49 Wp
50-100 Wp
100+ Wp
Not specified
47,688
0
28,062
1,629
0
0
0
0
0
Total Market
Total
0-1.5 Wp
1.5-3 Wp
3-10 Wp
11-20 Wp
21-49 Wp
50-100 Wp
100+ Wp
Not specified
$771,018
$0
$633,191
$0
$0
$0
$0
$0
$0
Total Market
Total
0-1.5 Wp
1.5-3 Wp
3-10 Wp
11-20 Wp
21-49 Wp
50-100 Wp
100+ Wp
Not specified
$314,504
$0
$65,753
$0
$0
$0
$0
$0
$0
Total Market
Total
0-1.5 Wp
1.5-3 Wp
3-10 Wp
11-20 Wp
21-49 Wp
50-100 Wp
100+ Wp
Not specified
Figure 21d: Sales Volumes & Cash Sales Revenues by Product Category – Central Africa
Figure 21e: Sales Volumes & Cash Sales Revenues by Product Category – Southern Africa
Detailed Sales Data
NOTEWhere reported sales volumes are 0 or cash sales revenues are $0, there is either no data available or there are not enough data points available to report.
NOTEWhere reported sales volumes are 0 or cash sales revenues are $0, there is either no data available or there are not enough data points available to report.

35
Figure 22: Sales Volumes & Cash Sales Revenues by Product Category – South Asia
Figure 23: Sales Volumes & Cash Sales Revenues by Product Category – East Asia & Pacific
1,413,805
403,383
970,600
22,002
8,865
2,832
0
0
0
Total Market
Total
0-1.5 Wp
1.5-3 Wp
3-10 Wp
11-20 Wp
21-49 Wp
50-100 Wp
100+ Wp
Not specified
$35,517,189
$3,435,901
$27,479,530
$2,286,896
$0
$0
$0
$0
$0
Total Market
Total
0-1.5 Wp
1.5-3 Wp
3-10 Wp
11-20 Wp
21-49 Wp
50-100 Wp
100+ Wp
Not specified
96,456
40,794
35,514
15,547
1,227
3,374
0
0
0
Total Market
Total
0-1.5 Wp
1.5-3 Wp
3-10 Wp
11-20 Wp
21-49 Wp
50-100 Wp
100+ Wp
Not specified
$4,332,820
$328,465
$1,277,003
$1,531,072
$201,967
$0
$0
$0
$0
Total Market
Total
0-1.5 Wp
1.5-3 Wp
3-10 Wp
11-20 Wp
21-49 Wp
50-100 Wp
100+ Wp
Not specified
Detailed Sales Data
NOTEWhere reported sales volumes are 0 or cash sales revenues are $0, there is either no data available or there are not enough data points available to report.
NOTEWhere reported sales volumes are 0 or cash sales revenues are $0, there is either no data available or there are not enough data points available to report.

36
Figure 24: Sales Volumes & Cash Sales Revenues by Product Category – Middle East & North Africa
Figure 25: Sales Volumes & Cash Sales Revenues by Product Category – Latin America
50,372
28,421
13,572
5,100
0
0
0
0
0
Total Market
Total
0-1.5 Wp
1.5-3 Wp
3-10 Wp
11-20 Wp
21-49 Wp
50-100 Wp
100+ Wp
Not specified
240,738
0
0
0
0
0
0
0
0
Total Market
Total
0-1.5 Wp
1.5-3 Wp
3-10 Wp
11-20 Wp
21-49 Wp
50-100 Wp
100+ Wp
Not specified
$16,811,235
$0
$0
$0
$0
$0
$0
$0
$0
Total Market
Total
0-1.5 Wp
1.5-3 Wp
3-10 Wp
11-20 Wp
21-49 Wp
50-100 Wp
100+ Wp
Not specified
$1,499,418
$256,841
$383,046
$183,666
$0
$0
$0
$0
$0
Total Market
Total
0-1.5 Wp
1.5-3 Wp
3-10 Wp
11-20 Wp
21-49 Wp
50-100 Wp
100+ Wp
Not specified
Detailed Sales Data
NOTEWhere reported sales volumes are 0 or cash sales revenues are $0, there is either no data available or there are not enough data points available to report.
NOTEWhere reported sales volumes are 0 or cash sales revenues are $0, there is either no data available or there are not enough data points available to report.

37
Figure 26: Sales Volumes & Cash Sales Revenues by Product Category – North America
Figure 27: Sales Volumes & Cash Sales Revenues by Product Category – Europe & Central Asia
14,041
9,803
1,903
0
0
0
0
0
0
Total Market
Total
0-1.5 Wp
1.5-3 Wp
3-10 Wp
11-20 Wp
21-49 Wp
50-100 Wp
100+ Wp
Not specified
$256,532
$63,875
$62,388
$0
$0
$0
$0
$0
$0
Total Market
Total
0-1.5 Wp
1.5-3 Wp
3-10 Wp
11-20 Wp
21-49 Wp
50-100 Wp
100+ Wp
Not specified
84,622
53,782
13,097
17,409
0
0
0
0
0
Total Market
Total
0-1.5 Wp
1.5-3 Wp
3-10 Wp
11-20 Wp
21-49 Wp
50-100 Wp
100+ Wp
Not specified
$2,252,312
$614,037
$640,703
$927,333
$0
$0
$0
$0
$0
Total Market
Total
0-1.5 Wp
1.5-3 Wp
3-10 Wp
11-20 Wp
21-49 Wp
50-100 Wp
100+ Wp
Not specified
Detailed Sales Data
NOTEWhere reported sales volumes are 0 or cash sales revenues are $0, there is either no data available or there are not enough data points available to report.
NOTEWhere reported sales volumes are 0 or cash sales revenues are $0, there is either no data available or there are not enough data points available to report.

38
Figure 28: Global PAYGO Revenues by Product Category
NOTES1. Please note that it is not possible to divide PAYGO sales revenues
with PAYGO sales volumes to derive payments per customer. This is because PAYGO sales revenues are reported per product for all customers of that product, both those added in H2 2016 and those that were added prior to this reporting period, while PAYGO sales volumes only reflect new customers added in the reporting period of H2 2016. Moreover, not all companies provided PAYG revenue data.
2. Companies were asked to report all sources of revenue, including but not limited to deposits, down payments, top-up fees, service fees, and other revenues collected from all PAYGO customers.
3. Not all companies provided revenue data for their PAYGO products. Therefore, the data shown here considerably underestimates the total PAYGO revenues for the sector.
4. This only includes revenues reported by companies which are the direct provider of the pay-as-you-go service; it does not include PAYGO-enabled products sold by manufacturers to other distributors. Those revenues are included under cash sales revenues.
5. Where reported PAYGO revenues are $0, either no data was available or not enough data points were available to report.
$41,501,224
$0
$0
$28,097,022
$4,987,904
$0
$2,667,134
$5,576,532
$0
Total Market
Total
0-1.5 Wp
1.5-3 Wp
3-10 Wp
11-20 Wp
21-49 Wp
50-100 Wp
100+ Wp
Not specified
Detailed Sales Data

39
Quality verified product sales total over 3.25 million units sold, representing over 86% of all reported sales worldwide in H2 2016 (Figure 29) as measured by volume. In Sub-Saharan Africa, quality verified product sales of over 1.57 million units constitute 84% of all reported sales. In some regions, quality verified products dominate reported sales: in East Asia & Pacific and South Asia, the sales of quality verified products account for over 98% (almost 95,000) and almost 88% (over 1.24 million) respectively of all reported sales.
Reported cash sales revenues follow a similar but slightly more pronounced breakdown in terms of quality verified vs. non-quality verified products. Globally, revenues from the sale of quality verified products (of nearly US$ 104.5 million) represent over 91% of all revenues from cash sales. In Sub-Saharan Africa, South Asia and East Asia & Pacific, the revenues of quality verified products account for almost 92% (nearly US$ 49 million), over 91% (nearly US$ 32.5 million) and nearly 98% (over US$ 4.2 million) of all regional revenues, respectively.
Figure 29: Global Sales by Quality Verification Status: Volume of Products Sold, Cash Sales Revenues
516,2803,254,575
Quality verified Non-quality verified
World
NOTES1. Quality verified means that the product or kit has met the IFC
Lighting Global Quality Standards (according to the IEC Technical Specification 62257-9-5) during the current reporting period.
2. Only cash sales revenues are presented – this excludes PAYGO revenues.
3. Dividing the presented sales revenues by the volume of products sold does not equate to the average product retail price.
$9,444,942$104,481,357
Quality verified Non-quality verified
World
Sales Volumes and Revenues by Quality Verification Status
Detailed Sales Data

40
Impact Metrics
Since 2013, GOGLA has had an Impact Working Group focused on examining the social impact of the sector. Together with external experts, this working group has developed a set of six metrics that help the sector to collectively report its social impact in a consistent way.
Having a clear set of metrics enables the sector to measure and describe the social and environmental impact it is having, in a harmonized and easily comparable way. The goal is to help attract investment, working capital and regulatory support for the off-grid solar lighting industry, and thus facilitating further sector growth.
The following pages present the aggregated data of the participating companies that are categorized as manufacturers. This is the third time GOGLA has reported these key social impact numbers. If companies have not provided all necessary product specifications needed for a particular impact metric, the sales data for that product has not been included for that metric. This means that the impact metrics may underestimate total impact. For the people reached historically and currently, all sales reported from all participating companies have been included.
The underlying metrics will continue to be refined and expanded as GOGLA develops and improves the way it collects data and learns from that data. Therefore, the impact data collection is very much a work in progress and the numbers presented are estimates.
MethodologyThe six metrics reported in this paper were developed by the GOGLA Impact Working Group. Each of them is a combination of company data (such as sales, product characteristics, and other company information) and coefficients with default values. The default values of the coefficients were determined based on data publicly available or made available by participating GOGLA members, as well as some assumptions and calculations.
All metrics have been reviewed by external experts and are aligned with the IRIS impact metrics5. The following table gives an overview of all the metrics for which the estimated aggregate results are presented in this report.
All metrics as well as the default values, their definitions and rationale (including the methodology and sources) can be found in the GOGLA Standardized Impact Metrics6 for the Off-Grid Energy Sector document.
The data presented here shows a dip in the number of people currently reached, livelihoods supported, and the number of status quo lighting sources no longer in place. In the first half of 2016, the number of people reached is reported as 93.6m, while in the second half of 2016, that figure drops to 85.5 million. Why is this?
Berenschot explains: ‘The reason for the variance is a shift in our reporting methodology. All figures are estimates. This is largely owing to the relative youth and fast-growth of the sector. We are in our second year of collecting and reporting on impact data, and as such we are refining and improving our methodology and database each time. This round we have improved the granularity. In doing so, we found
that there had previously been some overestimation of the number of products in use in the first half of 2016, compared to the second half of 2015 and the second half of 2016. The drop in these impact metrics is therefore owed to restructuring our database and not to a decreasing number of products being used actively by households. Ultimately, we are working towards being able to draw clear comparisons between historic product sales figures and current sales figures on a half-yearly basis, and we hope each report will be an improvement on the last in terms of accuracy and quality of data’.
5 https://iris.thegiin.org/off-grid-energy-metrics6 http://www.gogla.org/sites/www.gogla.org/files/
recource_docs/gogla-standardised-impact-metrics-for-the-off-grid-energy-sector1_1.pdf
A drop in the number of products being used?
Impact Metrics

41
List of Impact Metrics
1ai. Improved energy access, historically Cumulative number of people who have ever lived in a household with an improved energy source (i.e. solar)
1aii. Improved energy access, currently Number of people living in households currently using an improved source of energy (i.e. solar)
1b. Energy needs met (based on SE4All methodology) Number of people with Tier 1 and Tier 2 energy access currently, based on the Sustainable Energy for All Tracking Framework.
2. Livelihoods supported Number of people whose livelihoods are supported by the solar off-grid market, including a) customers using products for their business, and b) distribution chain employees.
3. Status quo lighting sources no longer in use Number of status quo lighting sources, such as kerosene lanterns, candles, battery torches, no longer in use because customers have replaced them with solar lighting.
4a. Household change in available hours of light (%) Change in available hours of light per day from solar product, as compared to typical usage time for status quo lighting, for an average household.
4b. Household change in available light output (%) Change in available light output (lumens) from solar product, as compared to typical output for status quo lighting, for an average household.
5a. Savings on energy-related expenditure, per household Amount of money a household saves on lighting and phone charging after the purchase of a solar product.
5b. Savings on energy-related expenditure, in aggregate Amount of money all households save on lighting and phone charging after the purchase of a solar product.
6. Greenhouse gas emissions offset through reduced use of status quo lighting The volume of greenhouse gas emissions, including black carbon, offset by reduced use of status quo lighting source.
Impact Metrics
© d.light

42
AnalysisAll in all, more than 110.9 million people around the world have to date been reached by off-grid solar lighting and electrification technologies. Currently, there are more than 85.5 million active users, globally. Close to 90% of those 85.5 million people are using products in the 0-3Wp category. The remaining 10% mainly fall into the 3-10Wp category. In terms of the Global Tracking Framework as defined by SE4All, we can count 38 million people with Tier 1 Energy Services met, an increase of 1.5 million people compared to last time, despite the overall active user number having decreased due to changes in the methodology (see text box). This increase is attributed to a shift in sales from entry level (0-1.5Wp) to higher categories, especially 1.5 – 10 Wp that also offer phone charging. The increased service level these products are offering translates into more people meeting Tier 1 energy access needs. With an increasing number of products that can provide services beyond lighting and phone charging sold, the number of people reaching Tier 2 energy service levels also increased, now standing at 1.7 million people. We estimate that the livelihoods of 1.9 million people are currently supported by off-grid solar lighting and electrification technologies by using products for their business or business related activities.
While lighting services and quality is lower in the categories with smaller products compared to higher Wp categories, household level savings on energy related expenditure are most significant in the entry-level light categories due to the lower product price. However, a trend towards longer warranty periods in the higher categories also leads to great savings potential on the household level.
In terms of greenhouse gas emissions, 26.9 million tons were offset, including black carbon. It should be noted, however, that this figure is not discounted by the embodied emissions of the solar product itself.
The GOGLA Impact Working Group continues to fine-tune the metrics by integrating the latest research and data harvested from the field. The metrics, as of now, mainly reflect the impact of portable solar lighting products as well as solar kits based on cash sales. The working group builds metrics to ensure they better represent the impact of larger solar home systems as well as considering ways to allow for and calculate impact depending on payment mechanism i.e. pay as you go business models.
©Lagazel
Impact Metrics

43
Total Impact Created
110.9 million Improved energy access, historically How many people, cumulatively, have ever lived in a household with an improved energy source? (i.e. solar)
85.5 million Improved energy access, currently How many people, currently, live in a household with an improved energy source? (i.e. solar)
38 million Tier 1 energy needs met, currently How many people have access to basic energy on Tier 1 (or the “first rung on the energy ladder”) of the SE4ALL Global Tracking Framework1?
1.75 million Tier 2 energy needs met, currently How many people have access to Tier 2 energy in their homes (or the “second rung on the energy ladder”) of the SE4All Global Tracking Framework1?
19 million Number of status quo lighting sources no longer in use How many traditional lighting sources (kerosene lanterns, candles and battery-powered torches, etc.) are no longer used since the customer replaced them with solar lighting?
26.9 million tons Greenhouse gas emissions offset, total How much greenhouse gas, including black carbon, is cumulatively offset through reduced use of traditional lighting sources?3
141% Increase in available light output, per household What is the difference in available light output (in lumens) from solar products, compared to the output of previous light sources (such as kerosene or candles), on average*?
164% Increase in available hours of light, per household What is the difference in available hours of light, per day, available to a household, owing to solar products, compared to available time from previous light sources (such as kerosene or candles), on average2?
US$ 200 Savings on energy-related spending, per household After buying a solar product, how much money does a household save on lighting and phone charging, on average2?
1.9 million Livelihoods supported How many people see their livelihoods benefit from the use of off-grid solar products? This includes people who use their products for their business (or business-related activities) as well as direct employees within the distribution chain of such products.
US$ 4.9 billion Savings on energy-related spending, total After buying a solar product, how much money is saved on lighting and phone charging, in aggregate?
NOTES1. The Global Tracking Framework was introduced by the UN’s SE4ALL
program and comprises five tiers which address a previous shortfall in energy access categorization. Before the framework was introduced, a household either had a grid connection or it did not i.e. electricity access was seen as binary.
2. The averages are built on products not households, i.e. we assume one product per household. The average is based on a weighted average of product sales, i.e. products with higher sales volumes are weighted higher than those where fewer have been sold.
3. This number is an aggregate of greenhouse gas emissions offset over the product life time of off-grid solar products. The embodied greenhouse gas emissions of off-grid solar lighting products is not accounted for.
Impact Metrics

44
Impact Created by Product Category
Figure 30: Improved Energy Access, Historically (number of people)
Figure 31: Improved Energy Access, Currently (number of people)
110,952,101
61,323,950
39,294,026
7,563,776
763,643
539,771
732,486
334,751
0
Improved Energy Access, Historically
Total
0-1.5 Wp
1.5-3 Wp
3-10 Wp
11-20 Wp
21-49 Wp
50-100 Wp
100+ Wp
Not specified
85,500,891
43,759,015
32,979,024
6,117,534
751,299
539,771
732,329
331,347
0
Improved Energy Access, Currently
Total
0-1.5 Wp
1.5-3 Wp
3-10 Wp
11-20 Wp
21-49 Wp
50-100 Wp
100+ Wp
Not specified
Impact Metrics

45
Figure 32: Energy Needs Met, Currently (According to SE4All Methodology) – Tier 1 and Tier 2 (number of people)
Figure 33: Savings on Energy-Related Spending (US$)
$4,958,365,324
$3,043,381,835
$1,605,250,791
$197,419,850
$39,519,263
$11,427,402
$53,695,834
$721,139
$0
Savings on Energy-Related Spending, Total
Total
0-1.5 Wp
1.5-3 Wp
3-10 Wp
11-20 Wp
21-49 Wp
50-100 Wp
100+ Wp
Not specified
Total Market - Tier 1 Total Market - Tier 2
1,752,83938,097,019Total
00Not specified
330,8530100+ Wp
731,674050-100 Wp
537,754021-49 Wp
152,556593,21211-20 Wp
05,897,0913-10 Wp
022,556,2791.5-3 Wp
08,820,5740-1.5 Wp
Impact Metrics

46
Figure 34: Savings on Energy-Related Spending, per Household (US$)
Figure 35: Livelihoods Supported (number of people)
1,900,019
972,422
732,867
135,945
16,695
11,994
16,273
7,363
0
Livelihoods Supported
Total
0-1.5 Wp
1.5-3 Wp
3-10 Wp
11-20 Wp
21-49 Wp
50-100 Wp
100+ Wp
Not specified
$200
$222
$186
$126
$236
$95
$330
$9
$0
Savings on energy-related expenditure, per household
Total
0-1.5 Wp
1.5-3 Wp
3-10 Wp
11-20 Wp
21-49 Wp
50-100 Wp
100+ Wp
Not specified
Impact Metrics

47
Figure 36: Household Increase in Available Hours of Light (%)
164%
71%
248%
252%
366%
610%
511%
701%
0%
Change in Available Hours of Light, per household (%)
Total
0-1.5 Wp
1.5-3 Wp
3-10 Wp
11-20 Wp
21-49 Wp
50-100 Wp
100+ Wp
Not specified
Figure 37: Household Increase in Available Light Output (%)
141%
24%
143%
491%
808%
2,087%
1,216%
1,910%
0%
Change in Available Light Output, per household (%)
Total
0-1.5 Wp
1.5-3 Wp
3-10 Wp
11-20 Wp
21-49 Wp
50-100 Wp
100+ Wp
Not specified
Impact Metrics
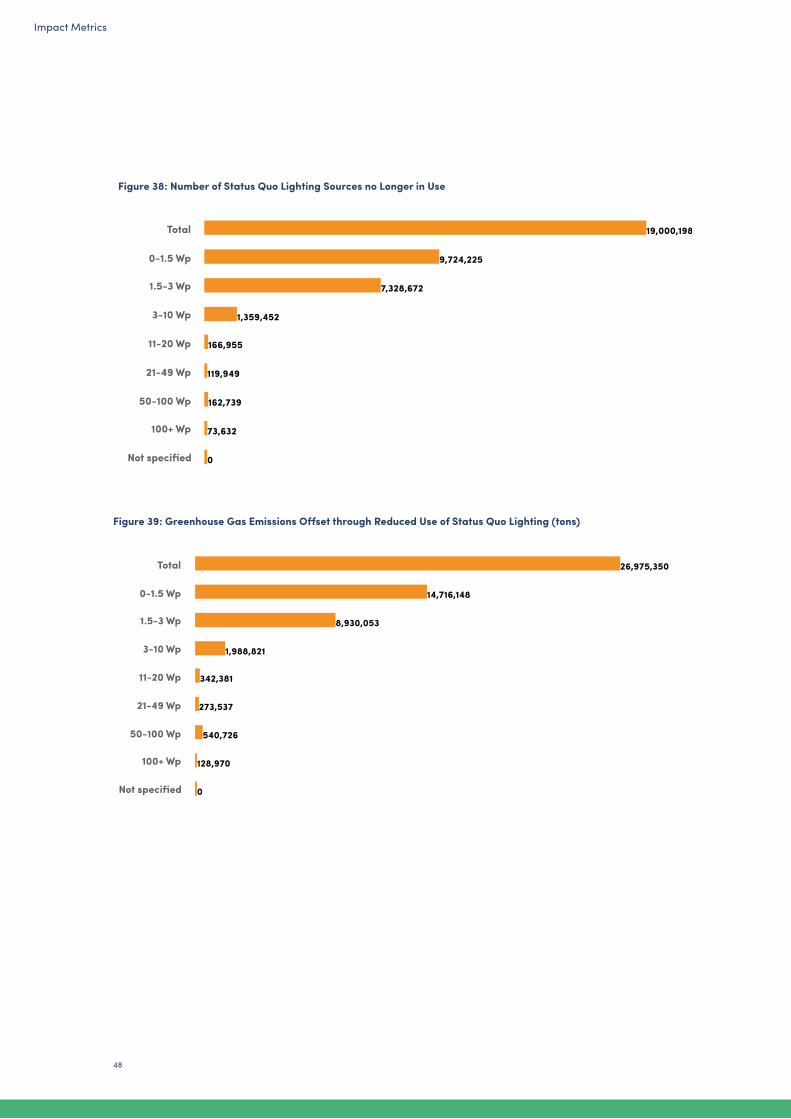
48
Figure 38: Number of Status Quo Lighting Sources no Longer in Use
Figure 39: Greenhouse Gas Emissions Offset through Reduced Use of Status Quo Lighting (tons)
26,975,350
14,716,148
8,930,053
1,988,821
342,381
273,537
540,726
128,970
0
Greenhouse Gas Emissions O�set through Reduced Use of Status Quo Lighting
Total
0-1.5 Wp
1.5-3 Wp
3-10 Wp
11-20 Wp
21-49 Wp
50-100 Wp
100+ Wp
Not specified
19,000,198
9,724,225
7,328,672
1,359,452
166,955
119,949
162,739
73,632
0
Number of Status Quo Lighting Sources no Longer in Use
Total
0-1.5 Wp
1.5-3 Wp
3-10 Wp
11-20 Wp
21-49 Wp
50-100 Wp
100+ Wp
Not specified
Impact Metrics

49
Savings on Energy-Related Spending, Total (US$)
Savings on Energy-Related Spending, per Household (US$)
Number of Status Quo Lighting Sources no Longer in Use (number of products replaced)
Change in Available Hours of Light, per household (%)
Change in Available Light Output, per household (%)
Greenhouse Gas Emissions Offset (in tons)
World $4,958,365,324 $200 19,000,198 164% 141% 26,975,350
0-1.5 Wp $3,043,381,835 $222 9,724,225 71% 24% 14,716,148
1.5-3 Wp $1,605,250,791 $186 7,328,672 248% 143% 8,930,053
3-10 Wp $197,419,850 $126 1,359,452 252% 491% 1,988,821
11-20 Wp $39,519,263 $236 166,955 366% 808% 342,381
21-49 Wp $11,427,402 $95 119,949 610% 2087% 273,537
50-100 Wp $53,695,834 $330 162,739 511% 1216% 540,726
100+ Wp $721,139 $9 73,632 701% 1910% 128,97
Not specified - - - - - -
Improved Energy Access, Historically (number of people)
Improved Energy Access, Currently (number of people)
Livelihoods Supported, Currently (number of people)
Tier 1 Energy Needs Met, according to SE4All methodology (number of people)
Tier 2 Energy Needs Met, according to SE4All methodology (number of people)
World 110,952,101 85,500,891 1,900,019 38,097,019 1,752,839
0-1.5 Wp 61,323,950 43,759,015 972,422 8,820,574 -
1.5-3 Wp 39,294,026 32,979,024 732,867 22,556,279 -
3-10 Wp 7,563,776 6,117,534 135,945 5,897,091 -
11-20 Wp 763,643 751,299 16,695 593,212 152,556
21-49 Wp 539,771 539,771 11,994 - 537,754
50-100 Wp 732,486 732,329 16,273 - 731,674
100+ Wp 334,751 331,347 7,363 - 330,853
Not specified - - - - -
Table 3: Global Impact by Product Category
Summary
Impact Metrics

50
References• The contents of this report present market data based
on the reported sales of Lighting Global quality verified products and products from 55 companies which are GOGLA members or IFC Lighting Global clients. https://www.lightingglobal.org/products/
• Off-Grid Solar Market Trends Report 2016, Published by Bloomberg New Energy Finance and Lighting Global, an innovation of the World Bank Group, in cooperation with GOGLA https://www.lightingglobal.org/launch-of-off-grid-solar-market-trends-report-2016/
• Beyond Connections: Energy Access Redefined, Published by the Energy Sector Management Assistance program of the World Bank group (ESMAP Technical Report 008/15), 2015 https://www.esmap.org/node/55526
• Standardized impact metrics for the off-grid energy sector, Version 2.0, January 2016, GOGLA http://gogla.org/sites/www.gogla.org/files/recource_docs/gogla-standardised-impactmetrics-for-the-off-grid-energy-sector1_1.pdf
• Lighting Global Quality Standards (Lighting Global / International Electrical Commission Technical Specification 96652) https://www.lightingglobal.org/qa/
Photo Credits©d.light ©Fosera ©Lagazel ©Mobisol©Renewit Solar ©Solarkiosk©Village Power
References and Credits
51
© Solarkiosk
Contact information
Global Off-Grid Lighting Association Arthur van Schendelstraat 500 3511 MH Utrecht The Netherlands
[email protected] Facebook – Twitter – LinkedIn - YouTube
Lighting Global Energy & Resource Efficiency Unit Cross-Industry Advisory Solutions International Finance Corporation (IFC) – World Bank Group 2121 Pennsylvania Ave. NW, Washington D.C. 20433 USA

Global Off-Grid Lighting Associationwww.gogla.org [email protected]
Lighting Globalwww.lightingglobal.org [email protected] May 2017