Global Market Update
46
GLOBAL MARKET UPDATE Major world indices, currencies & commodities Copyright © 2015,
-
Upload
agrud-advisors -
Category
Economy & Finance
-
view
134 -
download
0
Transcript of Global Market Update
GLOBAL MARKET UPDATE
Major world indices, currencies & commodities
Copyright © 2015,
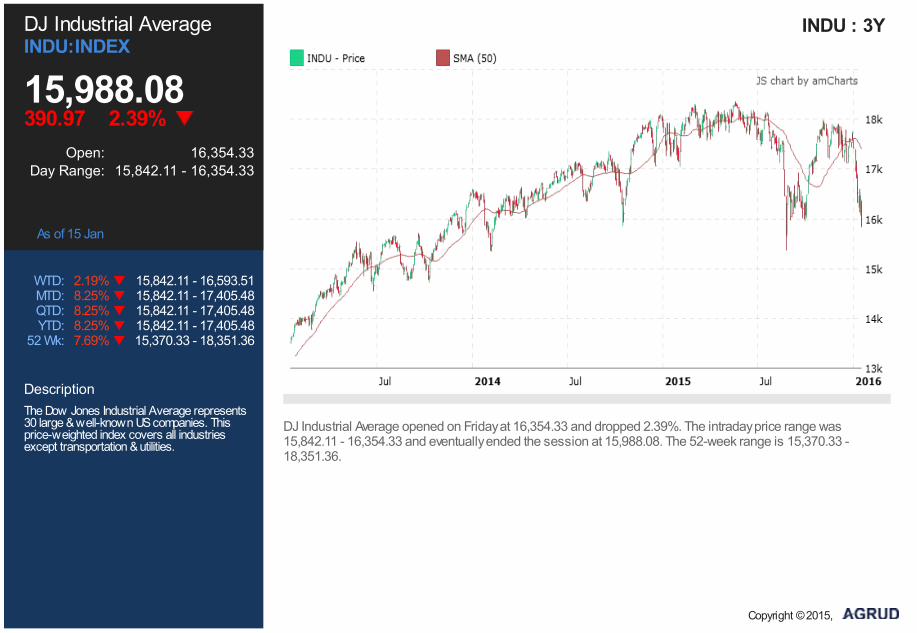
DJ Industrial AverageINDU:INDEX
15,988.08 390.97 2.39%
Open: 16,354.33Day Range: 15,842.11 - 16,354.33
As of 15 Jan
WTD: 2.19% 15,842.11 - 16,593.51MTD: 8.25% 15,842.11 - 17,405.48QTD: 8.25% 15,842.11 - 17,405.48YTD: 8.25% 15,842.11 - 17,405.48
52 Wk: 7.69% 15,370.33 - 18,351.36
DescriptionThe Dow Jones Industrial Average represents30 large & well-known US companies. Thisprice-weighted index covers all industriesexcept transportation & utilities.
INDU : 3Y
DJ Industrial Average opened on Friday at 16,354.33 and dropped 2.39%. The intraday price range was15,842.11 - 16,354.33 and eventually ended the session at 15,988.08. The 52-week range is 15,370.33 -18,351.36.
Copyright © 2015,

S&P 500SP500:INDEX
1,880.33 41.51 2.16%
Open: 1,916.68Day Range: 1,857.83 - 1,916.68
As of 15 Jan
WTD: 2.17% 1,857.83 - 1,950.33MTD: 8.00% 1,857.83 - 2,038.20QTD: 8.00% 1,857.83 - 2,038.20YTD: 8.00% 1,857.83 - 2,038.20
52 Wk: 5.64% 1,857.83 - 2,134.72
DescriptionThe S&P 500, or the Standard & Poor's 500, isan American stock market index based on themarket capitalization of 500 large companiescomprising common stocks listed on the NYSEor NASDAQ.
SP500 : 3Y
S&P 500 opened on Friday at 1,916.68 and dropped 2.16%. The intraday price range was 1,857.83 - 1,916.68and eventually ended the session at 1,880.33. The 52-week range is 1,857.83 - 2,134.72.
Copyright © 2015,

NASDAQ CompositeCCMP:INDEX
4,488.42 126.58 2.74%
Open: 4,464.37Day Range: 4,419.41 - 4,520.45
As of 15 Jan
WTD: 3.34% 4,419.41 - 4,714.80MTD: 10.36% 4,419.41 - 4,926.73QTD: 10.36% 4,419.41 - 4,926.73YTD: 10.36% 4,419.41 - 4,926.73
52 Wk: 1.80% 4,292.14 - 5,231.94
DescriptionThe NASDAQ Composite is a stock marketindex which tracks the companies listed onthe NASDAQ stock market. This tech-heavyindex is one of the most-followed indices inUS stock markets.
CCMP : 3Y
NASDAQ Composite opened on Friday at 4,464.37 and plunged 2.74%. The intraday price range was 4,419.41 -4,520.45 and eventually ended the session at 4,488.42. The 52-week range is 4,292.14 - 5,231.94.
Copyright © 2015,

Russell 2000 IndexRTY:INDEX
1,007.74 17.93 1.75%
Open: 1,023.92Day Range: 983.98 - 1,023.92
As of 15 Jan
WTD: 3.68% 983.98 - 1,056.92MTD: 11.28% 983.98 - 1,134.08QTD: 11.28% 983.98 - 1,134.08YTD: 11.28% 983.98 - 1,134.08
52 Wk: 12.73% 983.98 - 1,296.00
DescriptionThe Russell 2000 Index, a subset of Russell3000 Index which measures the performanceof the small-cap segment of the U.S. equityuniverse. It represents approximately 10% ofthe total market capitalization of Russell 3000Index.
RTY : 3Y
Russell 2000 Index opened on Friday at 1,023.92 and decreased 1.75%. The intraday price range was 983.98 -1,023.92 and eventually ended the session at 1,007.74. The 52-week range is 983.98 - 1,296.00.
Copyright © 2015,
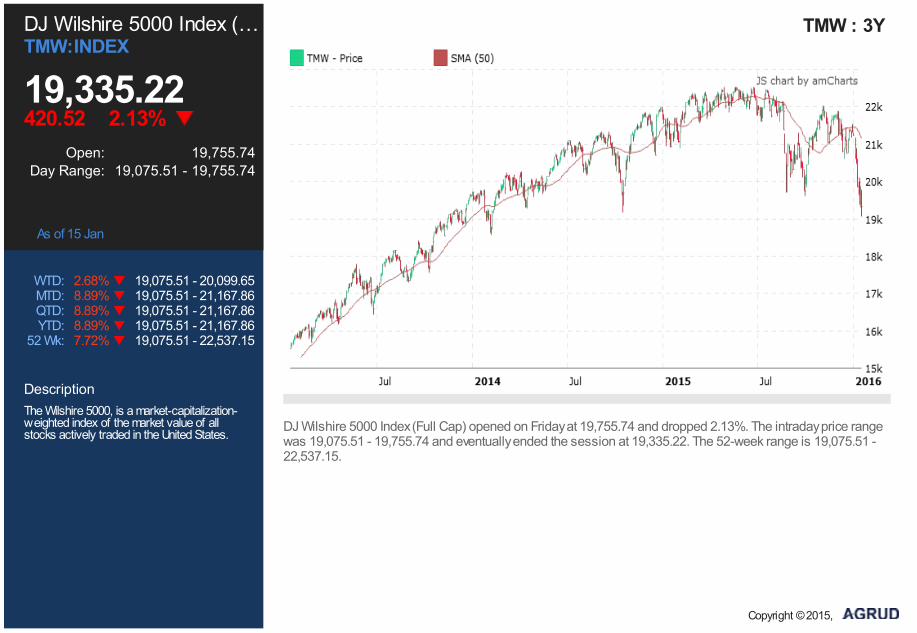
DJ Wilshire 5000 Index (…TMW:INDEX
19,335.22 420.52 2.13%
Open: 19,755.74Day Range: 19,075.51 - 19,755.74
As of 15 Jan
WTD: 2.68% 19,075.51 - 20,099.65MTD: 8.89% 19,075.51 - 21,167.86QTD: 8.89% 19,075.51 - 21,167.86YTD: 8.89% 19,075.51 - 21,167.86
52 Wk: 7.72% 19,075.51 - 22,537.15
DescriptionThe Wilshire 5000, is a market-capitalization-weighted index of the market value of allstocks actively traded in the United States.
TMW : 3Y
DJ Wilshire 5000 Index (Full Cap) opened on Friday at 19,755.74 and dropped 2.13%. The intraday price rangewas 19,075.51 - 19,755.74 and eventually ended the session at 19,335.22. The 52-week range is 19,075.51 -22,537.15.
Copyright © 2015,
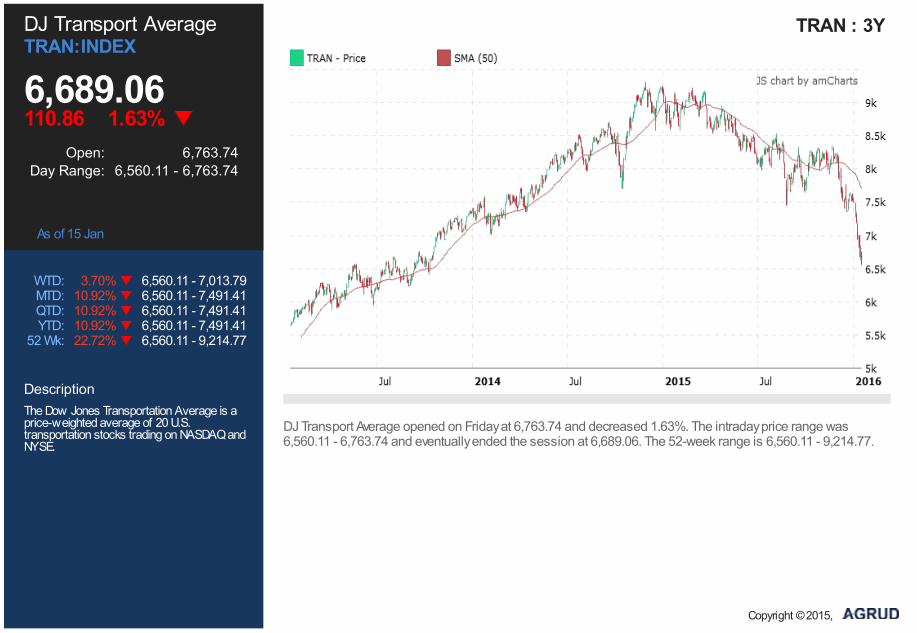
DJ Transport AverageTRAN:INDEX
6,689.06 110.86 1.63%
Open: 6,763.74Day Range: 6,560.11 - 6,763.74
As of 15 Jan
WTD: 3.70% 6,560.11 - 7,013.79MTD: 10.92% 6,560.11 - 7,491.41QTD: 10.92% 6,560.11 - 7,491.41YTD: 10.92% 6,560.11 - 7,491.41
52 Wk: 22.72% 6,560.11 - 9,214.77
DescriptionThe Dow Jones Transportation Average is aprice-weighted average of 20 U.S.transportation stocks trading on NASDAQ andNYSE.
TRAN : 3Y
DJ Transport Average opened on Friday at 6,763.74 and decreased 1.63%. The intraday price range was6,560.11 - 6,763.74 and eventually ended the session at 6,689.06. The 52-week range is 6,560.11 - 9,214.77.
Copyright © 2015,
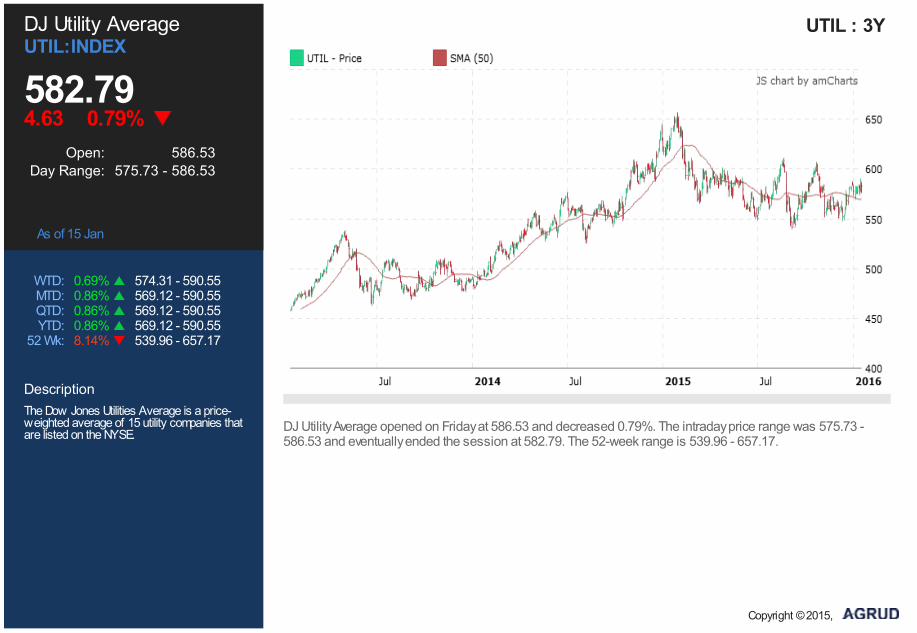
DJ Utility AverageUTIL:INDEX
582.79 4.63 0.79%
Open: 586.53Day Range: 575.73 - 586.53
As of 15 Jan
WTD: 0.69% 574.31 - 590.55MTD: 0.86% 569.12 - 590.55QTD: 0.86% 569.12 - 590.55YTD: 0.86% 569.12 - 590.55
52 Wk: 8.14% 539.96 - 657.17
DescriptionThe Dow Jones Utilities Average is a price-weighted average of 15 utility companies thatare listed on the NYSE.
UTIL : 3Y
DJ Utility Average opened on Friday at 586.53 and decreased 0.79%. The intraday price range was 575.73 -586.53 and eventually ended the session at 582.79. The 52-week range is 539.96 - 657.17.
Copyright © 2015,
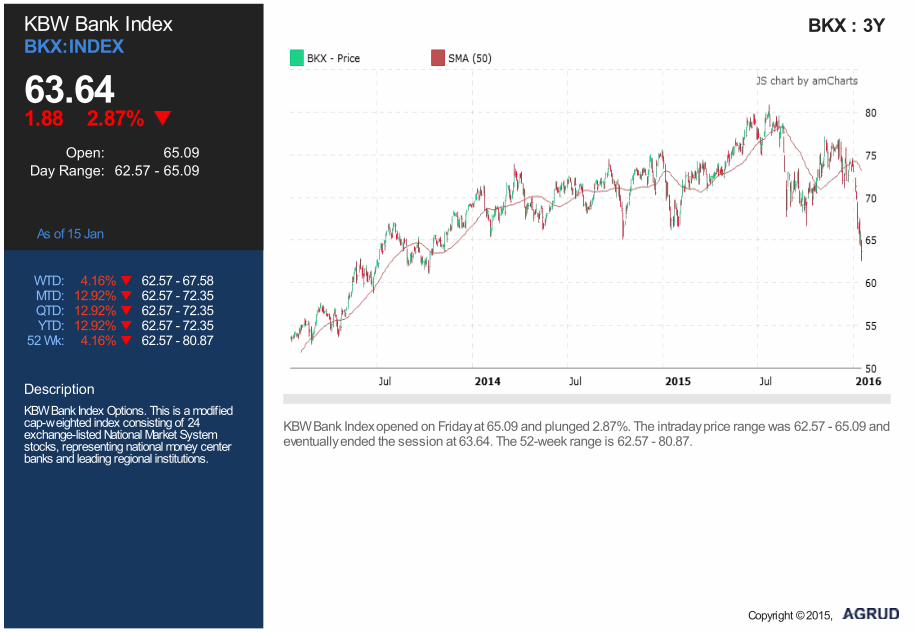
KBW Bank IndexBKX:INDEX
63.64 1.88 2.87%
Open: 65.09Day Range: 62.57 - 65.09
As of 15 Jan
WTD: 4.16% 62.57 - 67.58MTD: 12.92% 62.57 - 72.35QTD: 12.92% 62.57 - 72.35YTD: 12.92% 62.57 - 72.35
52 Wk: 4.16% 62.57 - 80.87
DescriptionKBW Bank Index Options. This is a modifiedcap-weighted index consisting of 24exchange-listed National Market Systemstocks, representing national money centerbanks and leading regional institutions.
BKX : 3Y
KBW Bank Index opened on Friday at 65.09 and plunged 2.87%. The intraday price range was 62.57 - 65.09 andeventually ended the session at 63.64. The 52-week range is 62.57 - 80.87.
Copyright © 2015,

PHLX Semiconductor Se…SOX:INDEX
574.05 16.28 2.76%
Open: 575.03Day Range: 573.37 - 581.61
As of 15 Jan
WTD: 5.13% 573.37 - 613.99MTD: 13.97% 573.37 - 658.75QTD: 13.97% 573.37 - 658.75YTD: 13.97% 573.37 - 658.75
52 Wk: 12.56% 543.03 - 751.21
DescriptionThe PHLX Semiconductor Sector Index is amodified market capitalization-weighted indexcomposed of companies primarily involved inthe design, distribution, manufacture, and saleof semiconductors.
SOX : 3Y
PHLX Semiconductor Sector Index opened on Friday at 575.03 and plunged 2.76%. The intraday price rangewas 573.37 - 581.61 and eventually ended the session at 574.05. The 52-week range is 543.03 - 751.21.
Copyright © 2015,
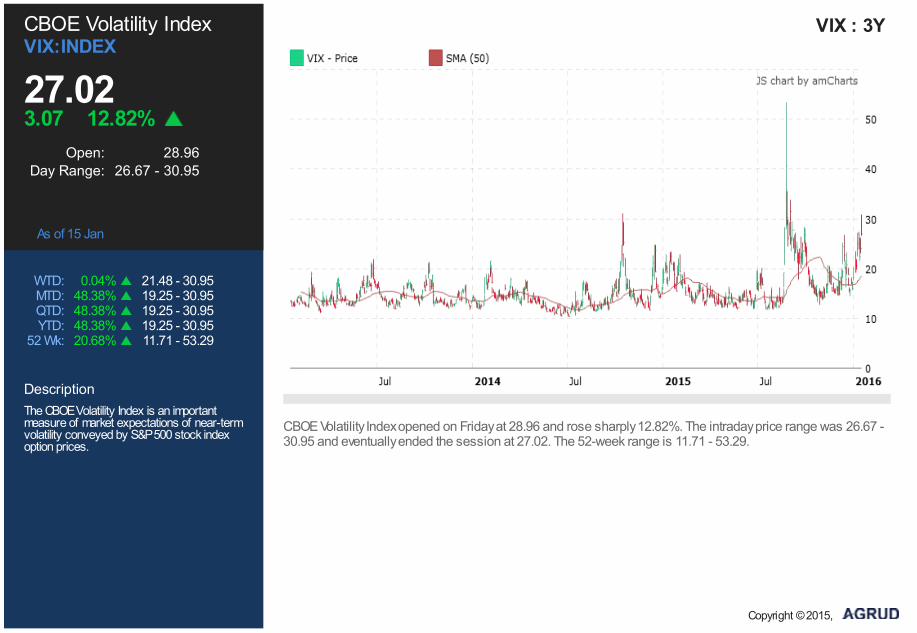
CBOE Volatility IndexVIX:INDEX
27.02 3.07 12.82%
Open: 28.96Day Range: 26.67 - 30.95
As of 15 Jan
WTD: 0.04% 21.48 - 30.95MTD: 48.38% 19.25 - 30.95QTD: 48.38% 19.25 - 30.95YTD: 48.38% 19.25 - 30.95
52 Wk: 20.68% 11.71 - 53.29
DescriptionThe CBOE Volatility Index is an importantmeasure of market expectations of near-termvolatility conveyed by S&P 500 stock indexoption prices.
VIX : 3Y
CBOE Volatility Index opened on Friday at 28.96 and rose sharply 12.82%. The intraday price range was 26.67 -30.95 and eventually ended the session at 27.02. The 52-week range is 11.71 - 53.29.
Copyright © 2015,
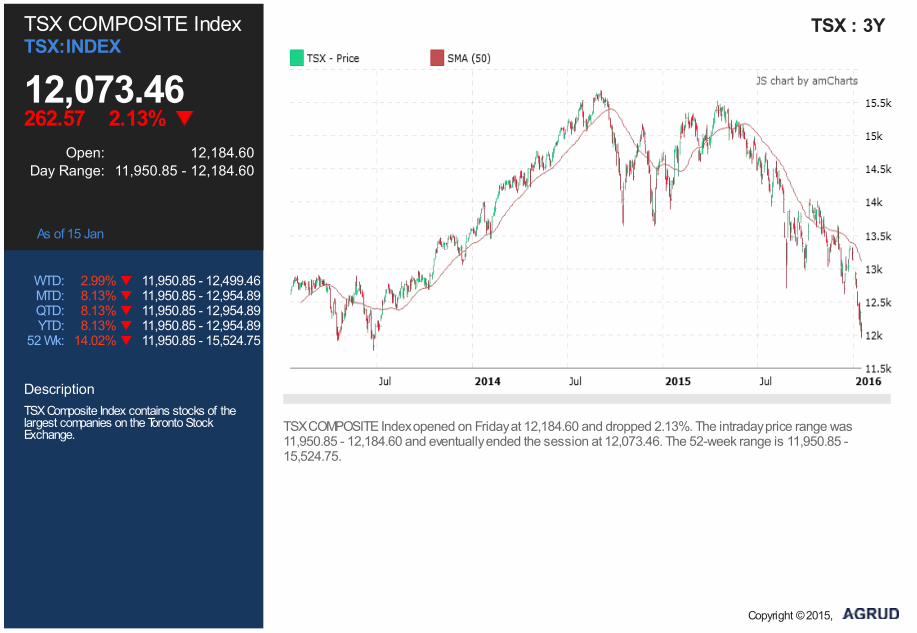
TSX COMPOSITE IndexTSX:INDEX
12,073.46 262.57 2.13%
Open: 12,184.60Day Range: 11,950.85 - 12,184.60
As of 15 Jan
WTD: 2.99% 11,950.85 - 12,499.46MTD: 8.13% 11,950.85 - 12,954.89QTD: 8.13% 11,950.85 - 12,954.89YTD: 8.13% 11,950.85 - 12,954.89
52 Wk: 14.02% 11,950.85 - 15,524.75
DescriptionTSX Composite Index contains stocks of thelargest companies on the Toronto StockExchange.
TSX : 3Y
TSX COMPOSITE Index opened on Friday at 12,184.60 and dropped 2.13%. The intraday price range was11,950.85 - 12,184.60 and eventually ended the session at 12,073.46. The 52-week range is 11,950.85 -15,524.75.
Copyright © 2015,
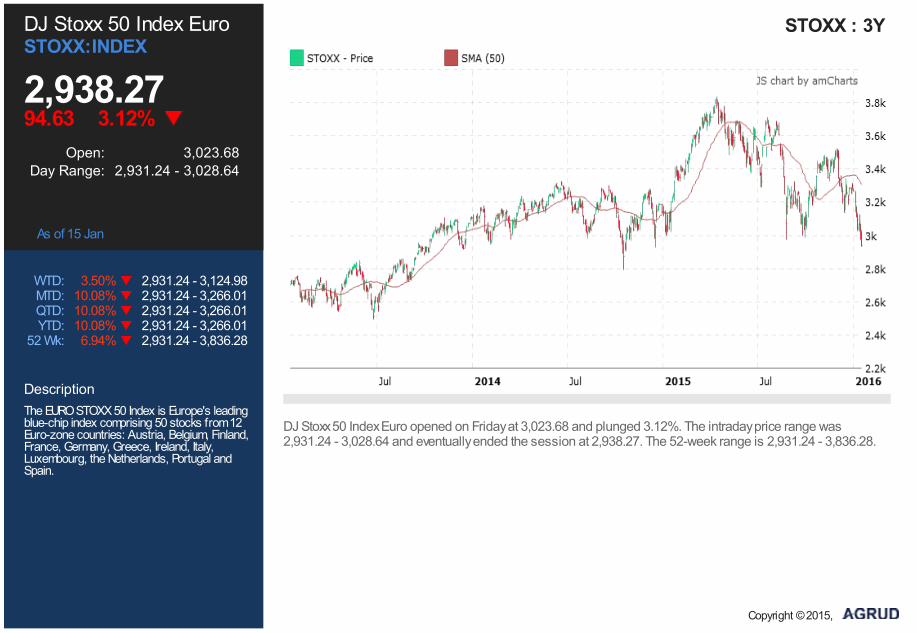
DJ Stoxx 50 Index EuroSTOXX:INDEX
2,938.27 94.63 3.12%
Open: 3,023.68Day Range: 2,931.24 - 3,028.64
As of 15 Jan
WTD: 3.50% 2,931.24 - 3,124.98MTD: 10.08% 2,931.24 - 3,266.01QTD: 10.08% 2,931.24 - 3,266.01YTD: 10.08% 2,931.24 - 3,266.01
52 Wk: 6.94% 2,931.24 - 3,836.28
DescriptionThe EURO STOXX 50 Index is Europe's leadingblue-chip index comprising 50 stocks from 12Euro-zone countries: Austria, Belgium, Finland,France, Germany, Greece, Ireland, Italy,Luxembourg, the Netherlands, Portugal andSpain.
STOXX : 3Y
DJ Stoxx 50 Index Euro opened on Friday at 3,023.68 and plunged 3.12%. The intraday price range was2,931.24 - 3,028.64 and eventually ended the session at 2,938.27. The 52-week range is 2,931.24 - 3,836.28.
Copyright © 2015,
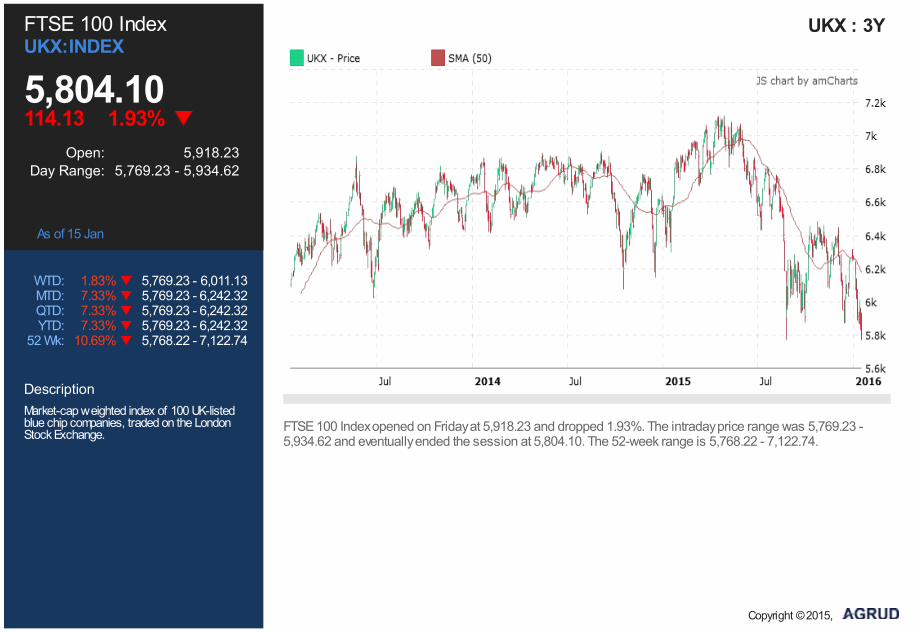
FTSE 100 IndexUKX:INDEX
5,804.10 114.13 1.93%
Open: 5,918.23Day Range: 5,769.23 - 5,934.62
As of 15 Jan
WTD: 1.83% 5,769.23 - 6,011.13MTD: 7.33% 5,769.23 - 6,242.32QTD: 7.33% 5,769.23 - 6,242.32YTD: 7.33% 5,769.23 - 6,242.32
52 Wk: 10.69% 5,768.22 - 7,122.74
DescriptionMarket-cap weighted index of 100 UK-listedblue chip companies, traded on the LondonStock Exchange.
UKX : 3Y
FTSE 100 Index opened on Friday at 5,918.23 and dropped 1.93%. The intraday price range was 5,769.23 -5,934.62 and eventually ended the session at 5,804.10. The 52-week range is 5,768.22 - 7,122.74.
Copyright © 2015,
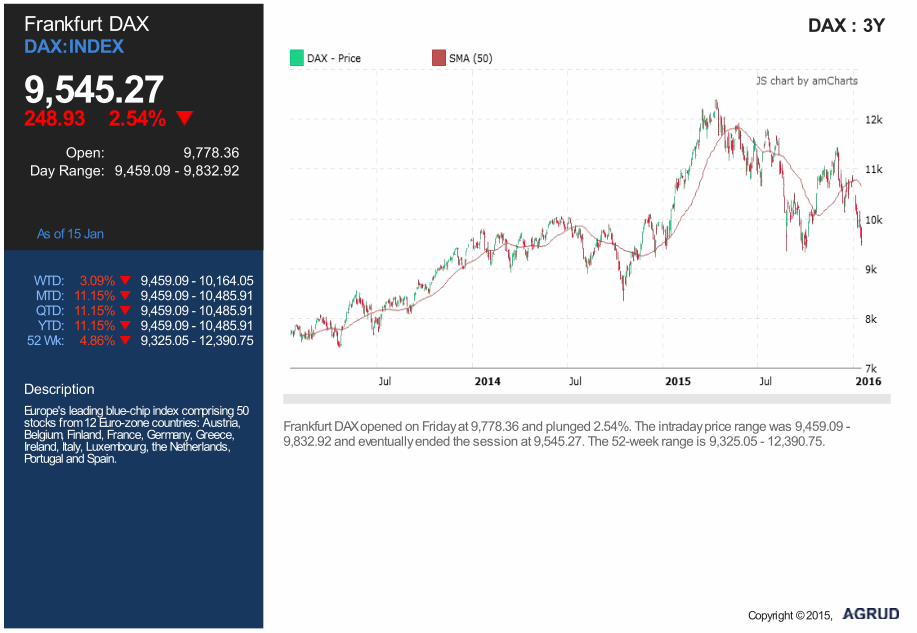
Frankfurt DAXDAX:INDEX
9,545.27 248.93 2.54%
Open: 9,778.36Day Range: 9,459.09 - 9,832.92
As of 15 Jan
WTD: 3.09% 9,459.09 - 10,164.05MTD: 11.15% 9,459.09 - 10,485.91QTD: 11.15% 9,459.09 - 10,485.91YTD: 11.15% 9,459.09 - 10,485.91
52 Wk: 4.86% 9,325.05 - 12,390.75
DescriptionEurope's leading blue-chip index comprising 50stocks from 12 Euro-zone countries: Austria,Belgium, Finland, France, Germany, Greece,Ireland, Italy, Luxembourg, the Netherlands,Portugal and Spain.
DAX : 3Y
Frankfurt DAX opened on Friday at 9,778.36 and plunged 2.54%. The intraday price range was 9,459.09 -9,832.92 and eventually ended the session at 9,545.27. The 52-week range is 9,325.05 - 12,390.75.
Copyright © 2015,
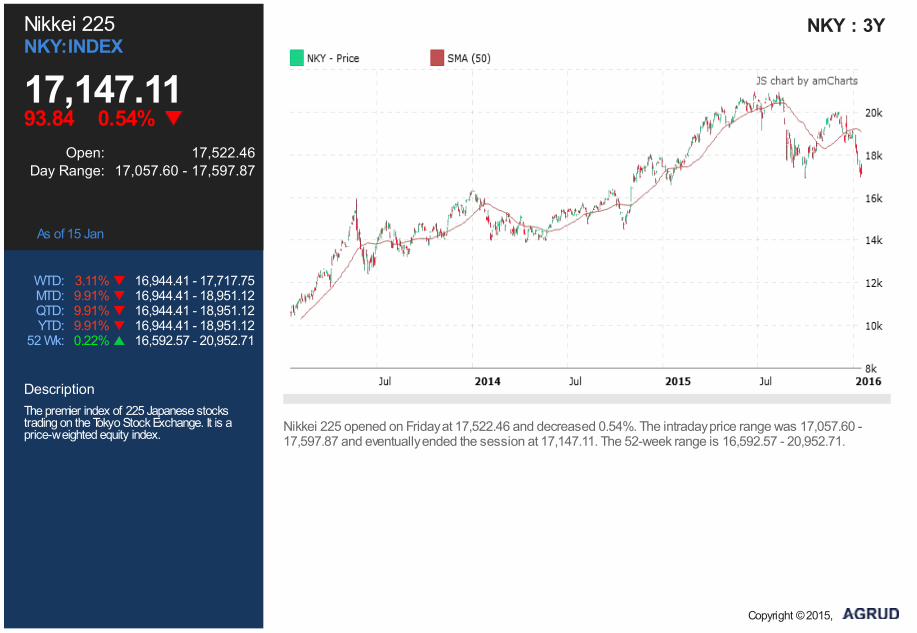
Nikkei 225NKY:INDEX
17,147.11 93.84 0.54%
Open: 17,522.46Day Range: 17,057.60 - 17,597.87
As of 15 Jan
WTD: 3.11% 16,944.41 - 17,717.75MTD: 9.91% 16,944.41 - 18,951.12QTD: 9.91% 16,944.41 - 18,951.12YTD: 9.91% 16,944.41 - 18,951.12
52 Wk: 0.22% 16,592.57 - 20,952.71
DescriptionThe premier index of 225 Japanese stockstrading on the Tokyo Stock Exchange. It is aprice-weighted equity index.
NKY : 3Y
Nikkei 225 opened on Friday at 17,522.46 and decreased 0.54%. The intraday price range was 17,057.60 -17,597.87 and eventually ended the session at 17,147.11. The 52-week range is 16,592.57 - 20,952.71.
Copyright © 2015,
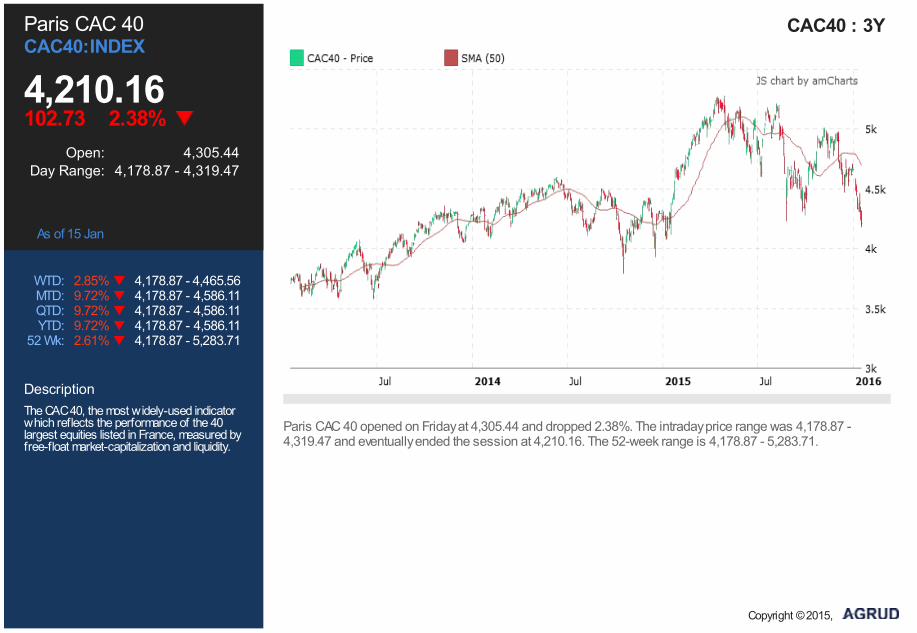
Paris CAC 40CAC40:INDEX
4,210.16 102.73 2.38%
Open: 4,305.44Day Range: 4,178.87 - 4,319.47
As of 15 Jan
WTD: 2.85% 4,178.87 - 4,465.56MTD: 9.72% 4,178.87 - 4,586.11QTD: 9.72% 4,178.87 - 4,586.11YTD: 9.72% 4,178.87 - 4,586.11
52 Wk: 2.61% 4,178.87 - 5,283.71
DescriptionThe CAC 40, the most widely-used indicatorwhich reflects the performance of the 40largest equities listed in France, measured byfree-float market-capitalization and liquidity.
CAC40 : 3Y
Paris CAC 40 opened on Friday at 4,305.44 and dropped 2.38%. The intraday price range was 4,178.87 -4,319.47 and eventually ended the session at 4,210.16. The 52-week range is 4,178.87 - 5,283.71.
Copyright © 2015,
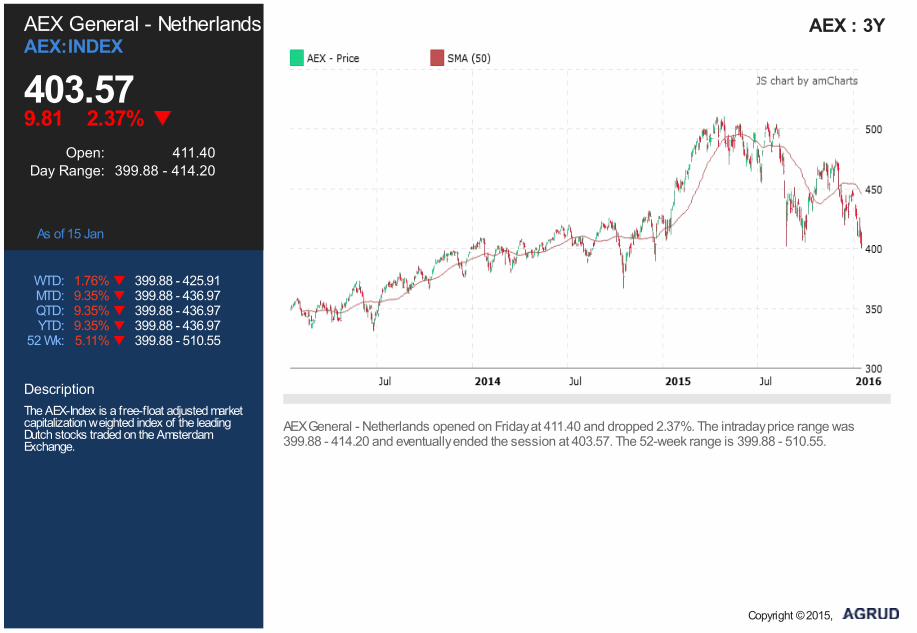
AEX General - NetherlandsAEX:INDEX
403.57 9.81 2.37%
Open: 411.40Day Range: 399.88 - 414.20
As of 15 Jan
WTD: 1.76% 399.88 - 425.91MTD: 9.35% 399.88 - 436.97QTD: 9.35% 399.88 - 436.97YTD: 9.35% 399.88 - 436.97
52 Wk: 5.11% 399.88 - 510.55
DescriptionThe AEX-Index is a free-float adjusted marketcapitalization weighted index of the leadingDutch stocks traded on the AmsterdamExchange.
AEX : 3Y
AEX General - Netherlands opened on Friday at 411.40 and dropped 2.37%. The intraday price range was399.88 - 414.20 and eventually ended the session at 403.57. The 52-week range is 399.88 - 510.55.
Copyright © 2015,
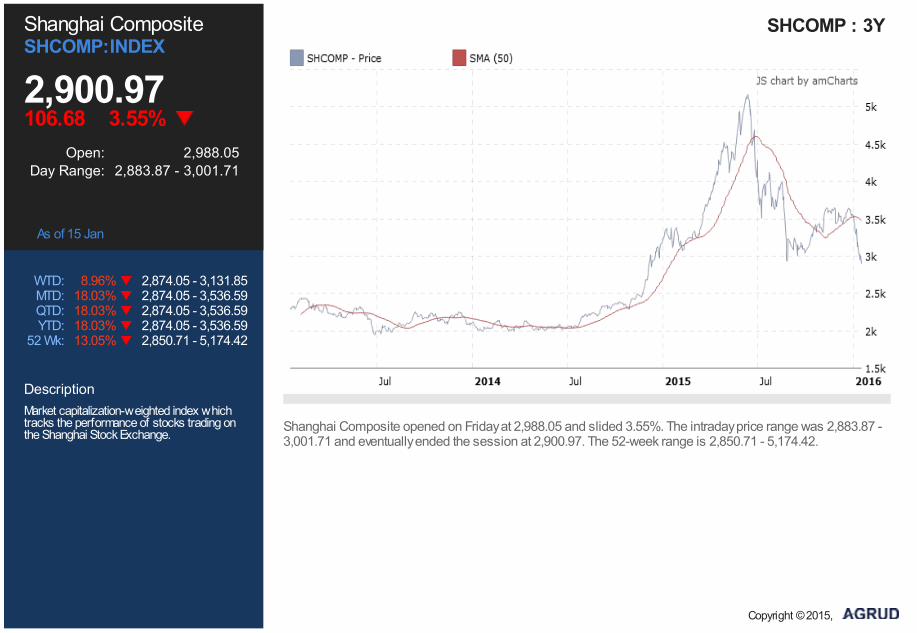
Shanghai CompositeSHCOMP:INDEX
2,900.97 106.68 3.55%
Open: 2,988.05Day Range: 2,883.87 - 3,001.71
As of 15 Jan
WTD: 8.96% 2,874.05 - 3,131.85MTD: 18.03% 2,874.05 - 3,536.59QTD: 18.03% 2,874.05 - 3,536.59YTD: 18.03% 2,874.05 - 3,536.59
52 Wk: 13.05% 2,850.71 - 5,174.42
DescriptionMarket capitalization-weighted index whichtracks the performance of stocks trading onthe Shanghai Stock Exchange.
SHCOMP : 3Y
Shanghai Composite opened on Friday at 2,988.05 and slided 3.55%. The intraday price range was 2,883.87 -3,001.71 and eventually ended the session at 2,900.97. The 52-week range is 2,850.71 - 5,174.42.
Copyright © 2015,
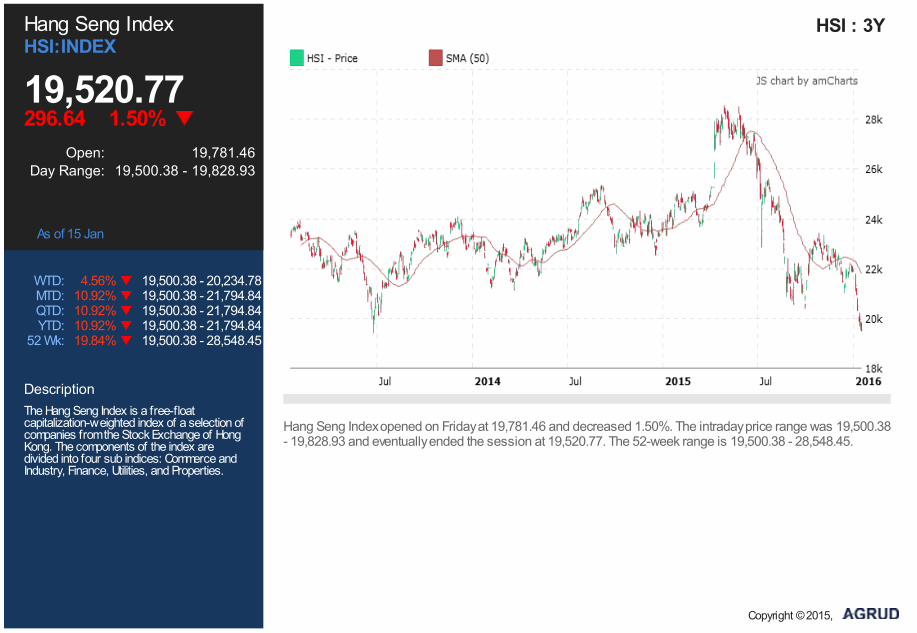
Hang Seng IndexHSI:INDEX
19,520.77 296.64 1.50%
Open: 19,781.46Day Range: 19,500.38 - 19,828.93
As of 15 Jan
WTD: 4.56% 19,500.38 - 20,234.78MTD: 10.92% 19,500.38 - 21,794.84QTD: 10.92% 19,500.38 - 21,794.84YTD: 10.92% 19,500.38 - 21,794.84
52 Wk: 19.84% 19,500.38 - 28,548.45
DescriptionThe Hang Seng Index is a free-floatcapitalization-weighted index of a selection ofcompanies from the Stock Exchange of HongKong. The components of the index aredivided into four sub indices: Commerce andIndustry, Finance, Utilities, and Properties.
HSI : 3Y
Hang Seng Index opened on Friday at 19,781.46 and decreased 1.50%. The intraday price range was 19,500.38- 19,828.93 and eventually ended the session at 19,520.77. The 52-week range is 19,500.38 - 28,548.45.
Copyright © 2015,
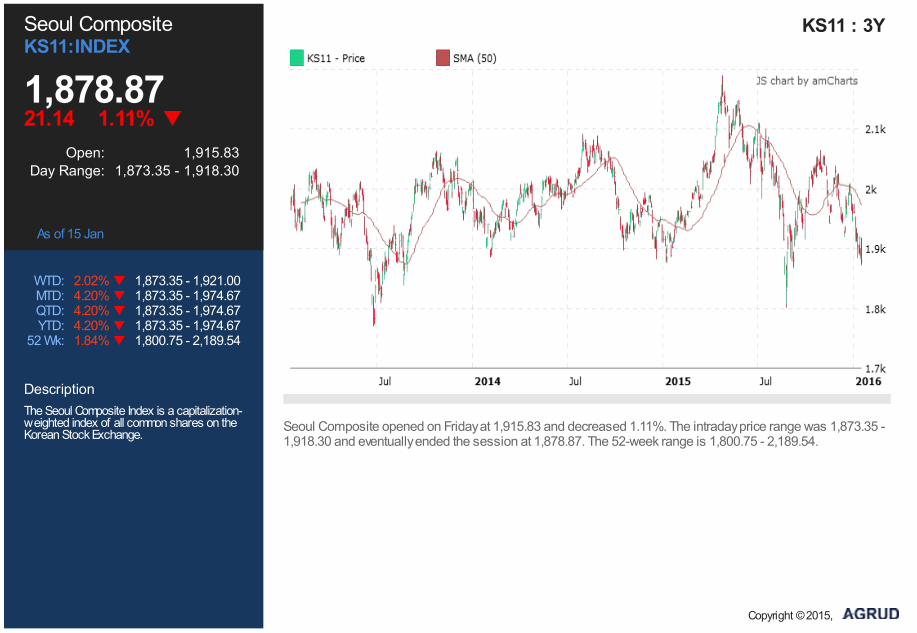
Seoul CompositeKS11:INDEX
1,878.87 21.14 1.11%
Open: 1,915.83Day Range: 1,873.35 - 1,918.30
As of 15 Jan
WTD: 2.02% 1,873.35 - 1,921.00MTD: 4.20% 1,873.35 - 1,974.67QTD: 4.20% 1,873.35 - 1,974.67YTD: 4.20% 1,873.35 - 1,974.67
52 Wk: 1.84% 1,800.75 - 2,189.54
DescriptionThe Seoul Composite Index is a capitalization-weighted index of all common shares on theKorean Stock Exchange.
KS11 : 3Y
Seoul Composite opened on Friday at 1,915.83 and decreased 1.11%. The intraday price range was 1,873.35 -1,918.30 and eventually ended the session at 1,878.87. The 52-week range is 1,800.75 - 2,189.54.
Copyright © 2015,
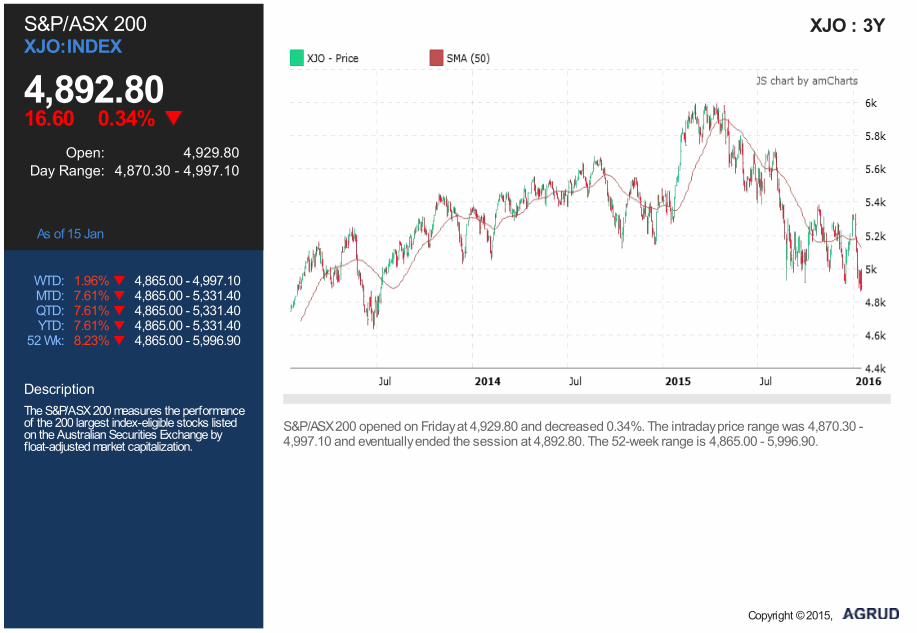
S&P/ASX 200XJO:INDEX
4,892.80 16.60 0.34%
Open: 4,929.80Day Range: 4,870.30 - 4,997.10
As of 15 Jan
WTD: 1.96% 4,865.00 - 4,997.10MTD: 7.61% 4,865.00 - 5,331.40QTD: 7.61% 4,865.00 - 5,331.40YTD: 7.61% 4,865.00 - 5,331.40
52 Wk: 8.23% 4,865.00 - 5,996.90
DescriptionThe S&P/ASX 200 measures the performanceof the 200 largest index-eligible stocks listedon the Australian Securities Exchange byfloat-adjusted market capitalization.
XJO : 3Y
S&P/ASX 200 opened on Friday at 4,929.80 and decreased 0.34%. The intraday price range was 4,870.30 -4,997.10 and eventually ended the session at 4,892.80. The 52-week range is 4,865.00 - 5,996.90.
Copyright © 2015,
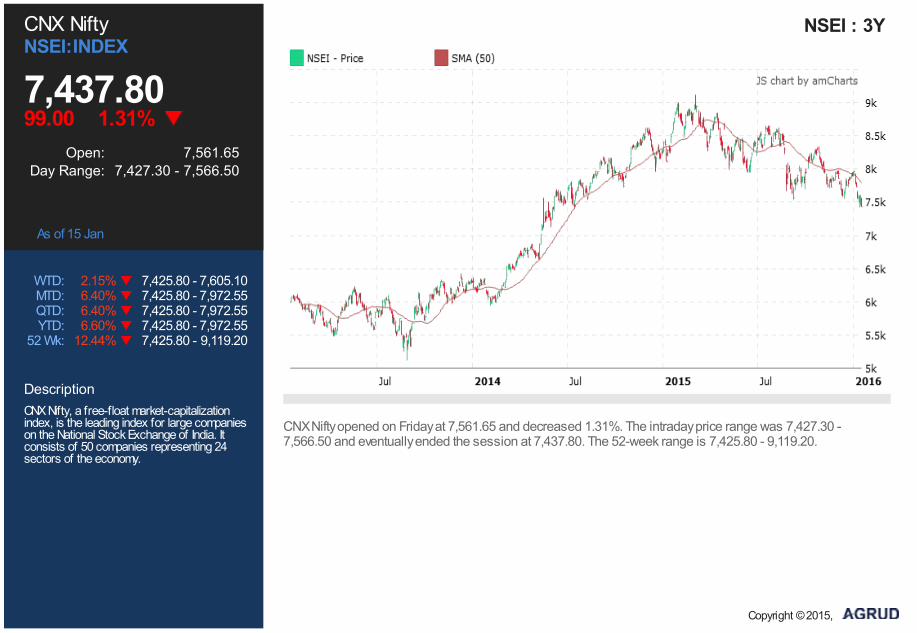
CNX NiftyNSEI:INDEX
7,437.80 99.00 1.31%
Open: 7,561.65Day Range: 7,427.30 - 7,566.50
As of 15 Jan
WTD: 2.15% 7,425.80 - 7,605.10MTD: 6.40% 7,425.80 - 7,972.55QTD: 6.40% 7,425.80 - 7,972.55YTD: 6.60% 7,425.80 - 7,972.55
52 Wk: 12.44% 7,425.80 - 9,119.20
DescriptionCNX Nifty, a free-float market-capitalizationindex, is the leading index for large companieson the National Stock Exchange of India. Itconsists of 50 companies representing 24sectors of the economy.
NSEI : 3Y
CNX Nifty opened on Friday at 7,561.65 and decreased 1.31%. The intraday price range was 7,427.30 -7,566.50 and eventually ended the session at 7,437.80. The 52-week range is 7,425.80 - 9,119.20.
Copyright © 2015,

BSE SENSEXSENSEX:INDEX
24,455.04 317.93 1.28%
Open: 24,881.76Day Range: 24,421.53 - 24,912.64
As of 15 Jan
WTD: 1.92% 24,387.69 - 25,018.46MTD: 6.37% 24,387.69 - 26,197.27QTD: 6.37% 24,387.69 - 26,197.27YTD: 6.52% 24,387.69 - 26,197.27
52 Wk: 12.90% 24,387.69 - 30,024.74
DescriptionIndia's most tracked bellwether index,designed to measure the performance of the30 most liquid companies across key sectorsof the Indian economy that are listed on theBombay Stock Exchange.
SENSEX : 3Y
BSE SENSEX opened on Friday at 24,881.76 and decreased 1.28%. The intraday price range was 24,421.53 -24,912.64 and eventually ended the session at 24,455.04. The 52-week range is 24,387.69 - 30,024.74.
Copyright © 2015,
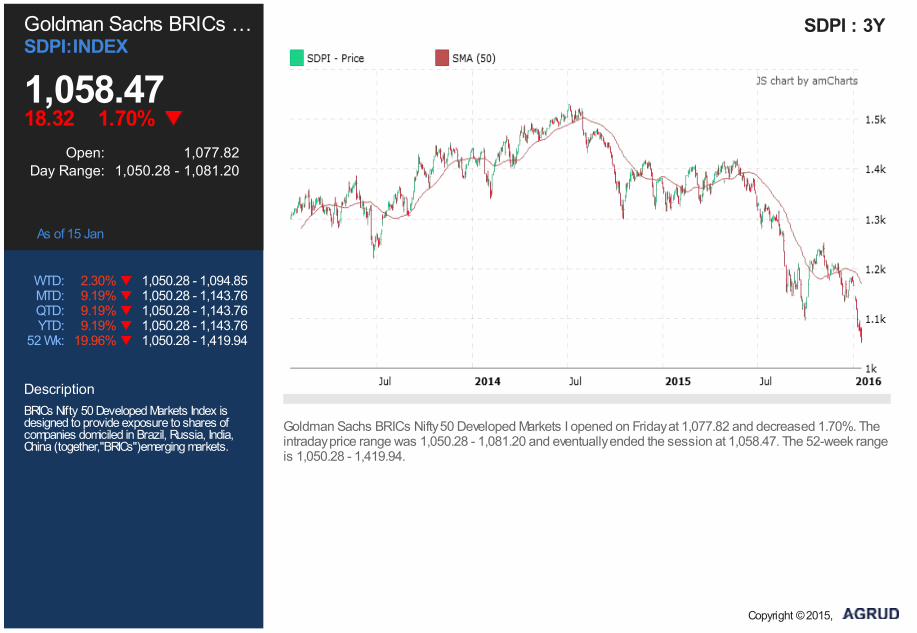
Goldman Sachs BRICs …SDPI:INDEX
1,058.47 18.32 1.70%
Open: 1,077.82Day Range: 1,050.28 - 1,081.20
As of 15 Jan
WTD: 2.30% 1,050.28 - 1,094.85MTD: 9.19% 1,050.28 - 1,143.76QTD: 9.19% 1,050.28 - 1,143.76YTD: 9.19% 1,050.28 - 1,143.76
52 Wk: 19.96% 1,050.28 - 1,419.94
DescriptionBRICs Nifty 50 Developed Markets Index isdesigned to provide exposure to shares ofcompanies domiciled in Brazil, Russia, India,China (together,"BRICs")emerging markets.
SDPI : 3Y
Goldman Sachs BRICs Nifty 50 Developed Markets I opened on Friday at 1,077.82 and decreased 1.70%. Theintraday price range was 1,050.28 - 1,081.20 and eventually ended the session at 1,058.47. The 52-week rangeis 1,050.28 - 1,419.94.
Copyright © 2015,
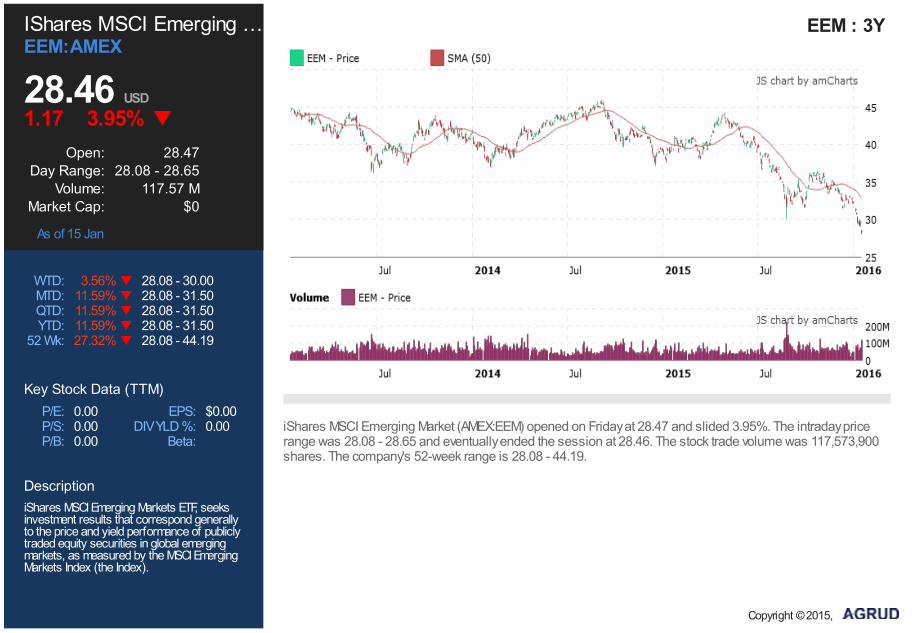
P/E: 0.00 EPS: $0.00P/S: 0.00 DIV YLD %: 0.00P/B: 0.00 Beta:
IShares MSCI Emerging …EEM:AMEX
28.46 USD1.17 3.95%
Open: 28.47Day Range: 28.08 - 28.65
Volume: 117.57 MMarket Cap: $0
As of 15 Jan
WTD: 3.56% 28.08 - 30.00MTD: 11.59% 28.08 - 31.50QTD: 11.59% 28.08 - 31.50YTD: 11.59% 28.08 - 31.50
52 Wk: 27.32% 28.08 - 44.19
Key Stock Data (TTM)
DescriptioniShares MSCI Emerging Markets ETF, seeksinvestment results that correspond generallyto the price and yield performance of publiclytraded equity securities in global emergingmarkets, as measured by the MSCI EmergingMarkets Index (the Index).
EEM : 3Y
iShares MSCI Emerging Market (AMEX:EEM) opened on Friday at 28.47 and slided 3.95%. The intraday pricerange was 28.08 - 28.65 and eventually ended the session at 28.46. The stock trade volume was 117,573,900shares. The company's 52-week range is 28.08 - 44.19.
Copyright © 2015,
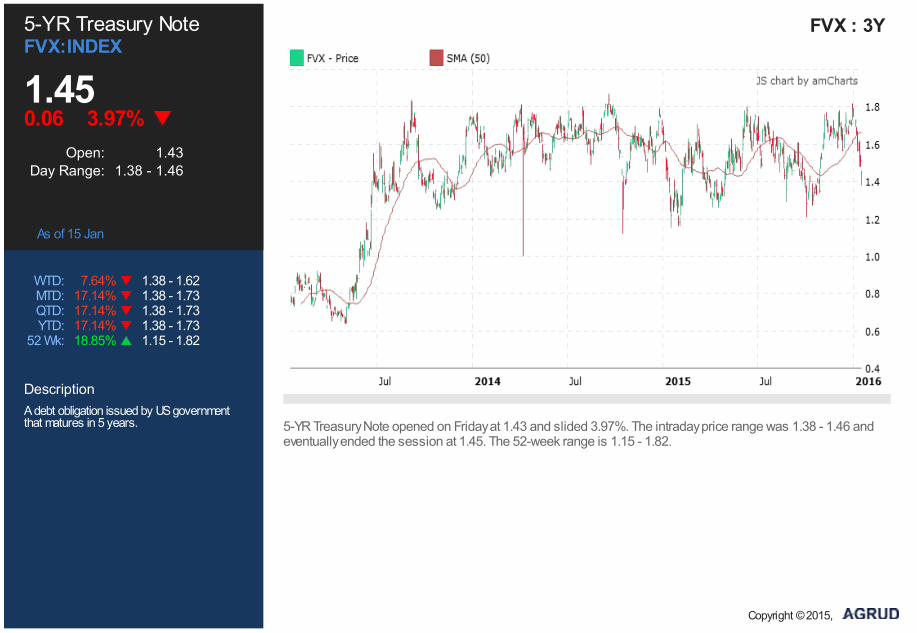
5-YR Treasury NoteFVX:INDEX
1.45 0.06 3.97%
Open: 1.43Day Range: 1.38 - 1.46
As of 15 Jan
WTD: 7.64% 1.38 - 1.62MTD: 17.14% 1.38 - 1.73QTD: 17.14% 1.38 - 1.73YTD: 17.14% 1.38 - 1.73
52 Wk: 18.85% 1.15 - 1.82
DescriptionA debt obligation issued by US governmentthat matures in 5 years.
FVX : 3Y
5-YR Treasury Note opened on Friday at 1.43 and slided 3.97%. The intraday price range was 1.38 - 1.46 andeventually ended the session at 1.45. The 52-week range is 1.15 - 1.82.
Copyright © 2015,

10-YR Treasury NoteTNX:INDEX
2.03 0.06 2.87%
Open: 2.02Day Range: 1.98 - 2.04
As of 15 Jan
WTD: 4.69% 1.98 - 2.19MTD: 10.18% 1.98 - 2.26QTD: 10.18% 1.98 - 2.26YTD: 10.18% 1.98 - 2.26
52 Wk: 14.69% 1.65 - 2.48
DescriptionA debt obligation issued by US governmentthat matures in 10 years.
TNX : 3Y
10-YR Treasury Note opened on Friday at 2.02 and plunged 2.87%. The intraday price range was 1.98 - 2.04and eventually ended the session at 2.03. The 52-week range is 1.65 - 2.48.
Copyright © 2015,
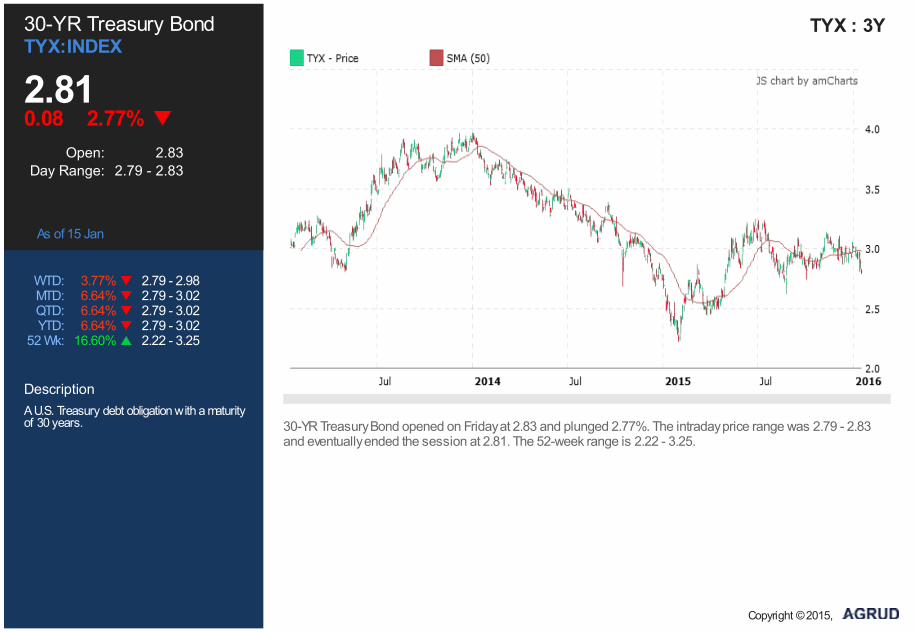
30-YR Treasury BondTYX:INDEX
2.81 0.08 2.77%
Open: 2.83Day Range: 2.79 - 2.83
As of 15 Jan
WTD: 3.77% 2.79 - 2.98MTD: 6.64% 2.79 - 3.02QTD: 6.64% 2.79 - 3.02YTD: 6.64% 2.79 - 3.02
52 Wk: 16.60% 2.22 - 3.25
DescriptionA U.S. Treasury debt obligation with a maturityof 30 years.
TYX : 3Y
30-YR Treasury Bond opened on Friday at 2.83 and plunged 2.77%. The intraday price range was 2.79 - 2.83and eventually ended the session at 2.81. The 52-week range is 2.22 - 3.25.
Copyright © 2015,

P/E: 0.00 EPS: $0.00P/S: 0.00 DIV YLD %: 0.00P/B: 0.00 Beta:
IShares IBoxx $ High Yie…HYG:AMEX
77.91 USD1.04 1.32%
Open: 77.67Day Range: 77.42 - 78.68
Volume: 27.31 MMarket Cap: $0
As of 15 Jan
WTD: 2.02% 77.42 - 79.95MTD: 3.31% 77.42 - 80.53QTD: 3.31% 77.42 - 80.53YTD: 3.31% 77.42 - 80.53
52 Wk: 12.69% 77.42 - 91.97
Key Stock Data (TTM)
Description
HYG : 3Y
iShares iBoxx $ High Yield Corporate Bd (AMEX:HYG) opened on Friday at 77.67 and decreased 1.32%. Theintraday price range was 77.42 - 78.68 and eventually ended the session at 77.91. The stock trade volume was27,309,800 shares. The company's 52-week range is 77.42 - 91.97.
Copyright © 2015,
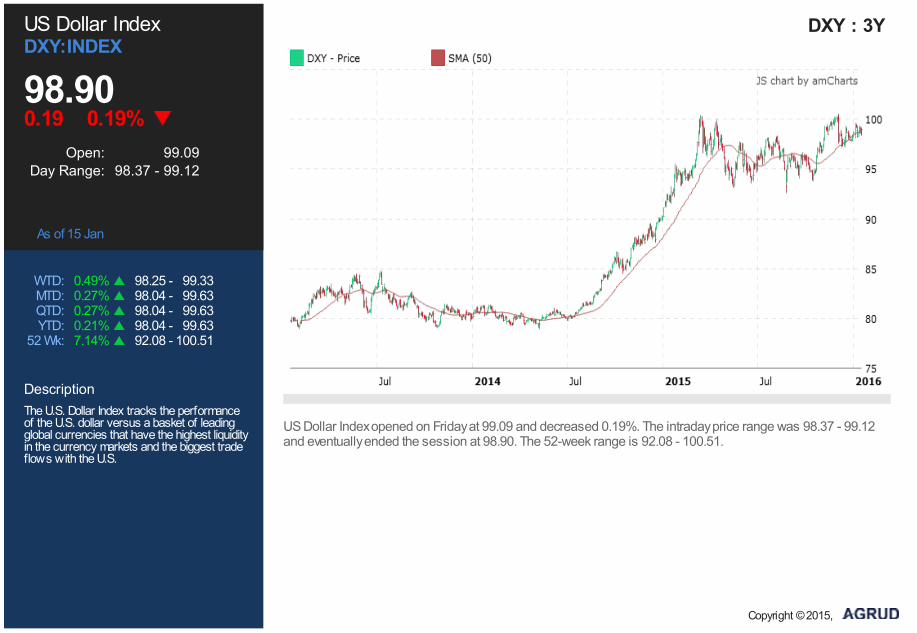
US Dollar IndexDXY:INDEX
98.90 0.19 0.19%
Open: 99.09Day Range: 98.37 - 99.12
As of 15 Jan
WTD: 0.49% 98.25 - 99.33MTD: 0.27% 98.04 - 99.63QTD: 0.27% 98.04 - 99.63YTD: 0.21% 98.04 - 99.63
52 Wk: 7.14% 92.08 - 100.51
DescriptionThe U.S. Dollar Index tracks the performanceof the U.S. dollar versus a basket of leadingglobal currencies that have the highest liquidityin the currency markets and the biggest tradeflows with the U.S.
DXY : 3Y
US Dollar Index opened on Friday at 99.09 and decreased 0.19%. The intraday price range was 98.37 - 99.12and eventually ended the session at 98.90. The 52-week range is 92.08 - 100.51.
Copyright © 2015,
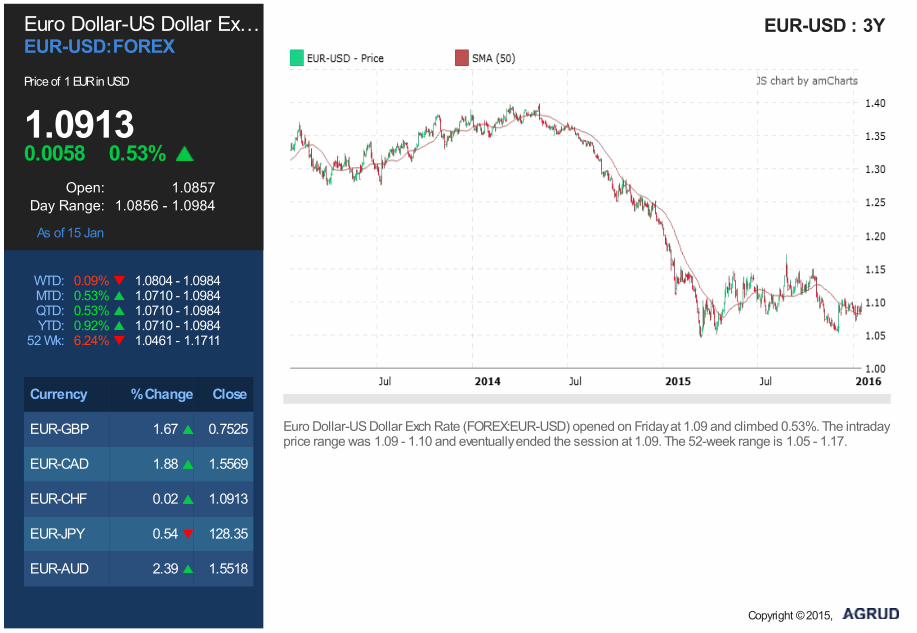
Euro Dollar-US Dollar Ex…EUR-USD:FOREXPrice of 1 EUR in USD
1.0913 0.0058 0.53%
Open: 1.0857Day Range: 1.0856 - 1.0984
As of 15 Jan
WTD: 0.09% 1.0804 - 1.0984MTD: 0.53% 1.0710 - 1.0984QTD: 0.53% 1.0710 - 1.0984YTD: 0.92% 1.0710 - 1.0984
52 Wk: 6.24% 1.0461 - 1.1711
Currency % Change Close
EUR-GBP 1.67 0.7525
EUR-CAD 1.88 1.5569
EUR-CHF 0.02 1.0913
EUR-JPY 0.54 128.35
EUR-AUD 2.39 1.5518
EUR-USD : 3Y
Euro Dollar-US Dollar Exch Rate (FOREX:EUR-USD) opened on Friday at 1.09 and climbed 0.53%. The intradayprice range was 1.09 - 1.10 and eventually ended the session at 1.09. The 52-week range is 1.05 - 1.17.
Copyright © 2015,

British Pound-US Dollar …GBP-USD:FOREXPrice of 1 GBP in USD
1.4251 0.0171 1.19%
Open: 1.4422Day Range: 1.4251 - 1.4423
As of 15 Jan
WTD: 1.80% 1.4251 - 1.4603MTD: 3.29% 1.4251 - 1.4844QTD: 3.29% 1.4251 - 1.4844YTD: 3.21% 1.4251 - 1.4844
52 Wk: 6.10% 1.4251 - 1.5929
Currency % Change Close
GBP-EUR 1.68 1.3284
GBP-JPY 2.32 170.56
GBP-CAD 0.20 2.0679
GBP-AUD 0.62 2.0616
GBP-CHF 1.64 1.4501
GBP-USD : 3Y
British Pound-US Dollar Exch Rate (FOREX:GBP-USD) opened on Friday at 1.44 and decreased 1.19%. Theintraday price range was 1.43 - 1.44 and eventually ended the session at 1.43. The 52-week range is 1.43 -1.59.
Copyright © 2015,
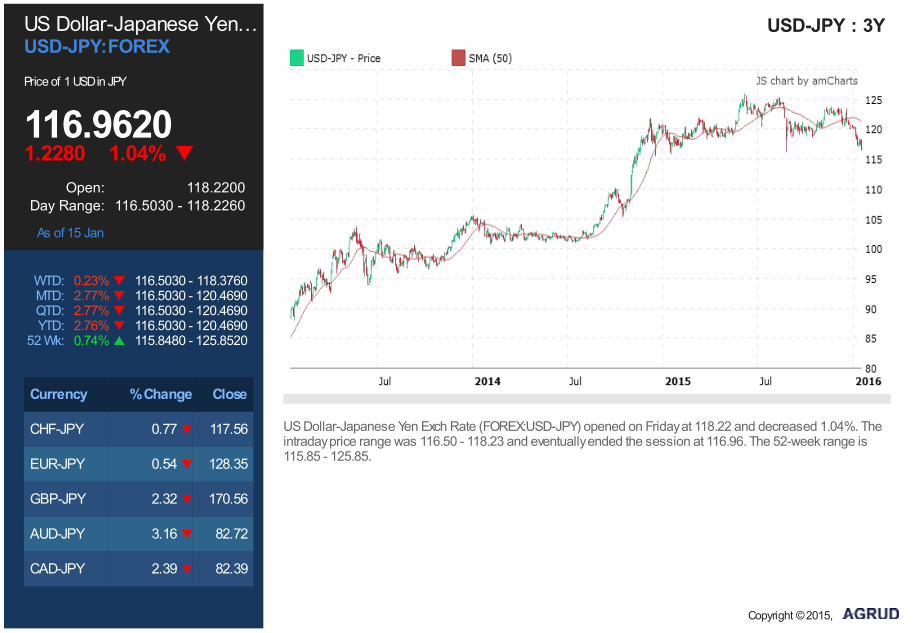
US Dollar-Japanese Yen…USD-JPY:FOREXPrice of 1 USD in JPY
116.9620 1.2280 1.04%
Open: 118.2200Day Range: 116.5030 - 118.2260
As of 15 Jan
WTD: 0.23% 116.5030 - 118.3760MTD: 2.77% 116.5030 - 120.4690QTD: 2.77% 116.5030 - 120.4690YTD: 2.76% 116.5030 - 120.4690
52 Wk: 0.74% 115.8480 - 125.8520
Currency % Change Close
CHF-JPY 0.77 117.56
EUR-JPY 0.54 128.35
GBP-JPY 2.32 170.56
AUD-JPY 3.16 82.72
CAD-JPY 2.39 82.39
USD-JPY : 3Y
US Dollar-Japanese Yen Exch Rate (FOREX:USD-JPY) opened on Friday at 118.22 and decreased 1.04%. Theintraday price range was 116.50 - 118.23 and eventually ended the session at 116.96. The 52-week range is115.85 - 125.85.
Copyright © 2015,

US Dollar-Swiss Franc E…USD-CHF:FOREXPrice of 1 USD in CHF
1.0010 0.0043 0.43%
Open: 1.0053Day Range: 0.9958 - 1.0060
As of 15 Jan
WTD: 0.67% 0.9924 - 1.0106MTD: 0.07% 0.9857 - 1.0124QTD: 0.07% 0.9857 - 1.0124YTD: 1.51% 0.9857 - 1.0124
52 Wk: 17.21% 0.8385 - 1.0328
Currency % Change Close
CAD-CHF 2.05 0.7009
JPY-CHF 0.71 0.8491
EUR-CHF 0.02 1.0913
GBP-CHF 1.64 1.4501
AUD-CHF 2.47 0.7037
USD-CHF : 3Y
US Dollar-Swiss Franc Exch Rate (FOREX:USD-CHF) opened on Friday at 1.01 and decreased 0.43%. Theintraday price range was 1.00 - 1.01 and eventually ended the session at 1.00. The 52-week range is 0.84 -1.03.
Copyright © 2015,

AUS Dollar-US Dollar Ex…AUD-USD:FOREXPrice of 1 AUD in USD
0.6857 0.0139 1.99%
Open: 0.6995Day Range: 0.6827 - 0.6995
As of 15 Jan
WTD: 1.34% 0.6827 - 0.7048MTD: 5.69% 0.6827 - 0.7327QTD: 5.69% 0.6827 - 0.7327YTD: 5.90% 0.6827 - 0.7327
52 Wk: 16.59% 0.6827 - 0.8255
Currency % Change Close
AUD-EUR 2.50 0.6445
AUD-CAD 0.67 1.0037
AUD-GBP 0.85 0.4851
AUD-JPY 3.16 82.72
AUD-CHF 2.47 0.7037
AUD-USD : 3Y
AUS Dollar-US Dollar Exch Rate (FOREX:AUD-USD) opened on Friday at 0.70 and dropped 1.99%. The intradayprice range was 0.68 - 0.70 and eventually ended the session at 0.69. The 52-week range is 0.68 - 0.83.
Copyright © 2015,
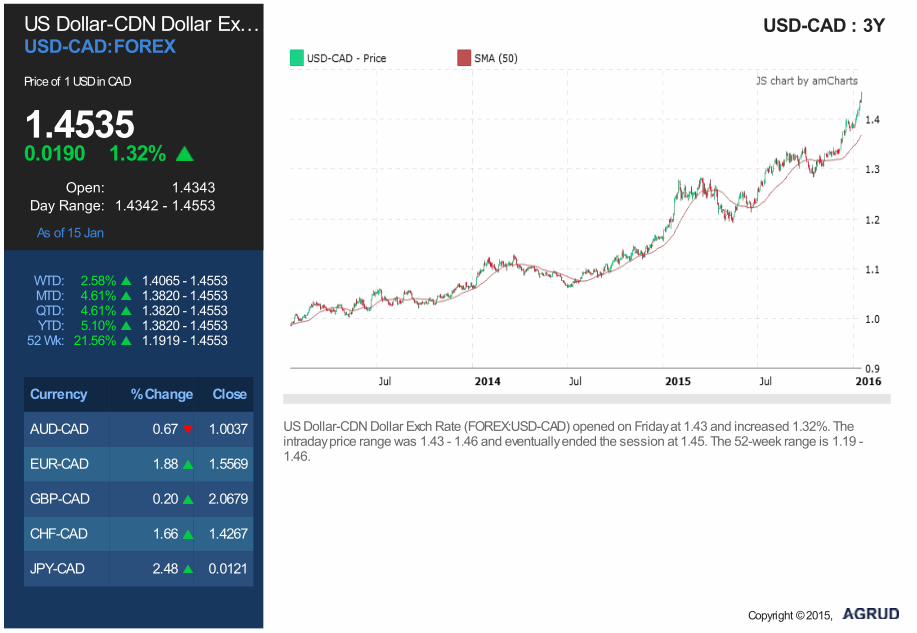
US Dollar-CDN Dollar Ex…USD-CAD:FOREXPrice of 1 USD in CAD
1.4535 0.0190 1.32%
Open: 1.4343Day Range: 1.4342 - 1.4553
As of 15 Jan
WTD: 2.58% 1.4065 - 1.4553MTD: 4.61% 1.3820 - 1.4553QTD: 4.61% 1.3820 - 1.4553YTD: 5.10% 1.3820 - 1.4553
52 Wk: 21.56% 1.1919 - 1.4553
Currency % Change Close
AUD-CAD 0.67 1.0037
EUR-CAD 1.88 1.5569
GBP-CAD 0.20 2.0679
CHF-CAD 1.66 1.4267
JPY-CAD 2.48 0.0121
USD-CAD : 3Y
US Dollar-CDN Dollar Exch Rate (FOREX:USD-CAD) opened on Friday at 1.43 and increased 1.32%. Theintraday price range was 1.43 - 1.46 and eventually ended the session at 1.45. The 52-week range is 1.19 -1.46.
Copyright © 2015,

S&P GSCI Total ReturnSGT:INDEX
1,911.00 53.75 2.74%
Open: 1,961.59Day Range: 1,904.07 - 1,962.56
As of 15 Jan
WTD: 6.84% 1,904.07 - 2,047.63MTD: 11.96% 1,904.07 - 2,211.55QTD: 11.96% 1,904.07 - 2,211.55YTD: 11.96% 1,904.07 - 2,211.55
52 Wk: 34.93% 1,904.07 - 3,392.48
DescriptionA benchmark commodity market index that isreadily available to market participants of theChicago Mercantile Exchange.
SGT : 3Y
S&P GSCI Total Return opened on Friday at 1,961.59 and plunged 2.74%. The intraday price range was1,904.07 - 1,962.56 and eventually ended the session at 1,911.00. The 52-week range is 1,904.07 - 3,392.48.
Copyright © 2015,

Gold ContinuationGC.C:COMEX
1,090.70 17.10 1.59%
Open: 1,079.20Day Range: 1,076.00 - 1,097.50
As of 15 Jan
WTD: 0.66% 1,071.10 - 1,108.30MTD: 2.88% 1,061.00 - 1,113.10QTD: 2.88% 1,061.00 - 1,113.10YTD: 2.88% 1,061.00 - 1,113.10
52 Wk: 13.77% 1,045.40 - 1,307.80
DescriptionGold futures are hedging tools for commercialproducers and users of gold. They serve asan alternative to investing in gold bullion, coins,and mining stocks. Gold Continuation is listedwith the New York Commodity Exchange.
GC.C : 3Y
Gold Continuation (COMEX:GC.C) opened on Friday at 1,079.20 and increased 1.59%. The intraday price rangewas 1,076.00 - 1,097.50 and eventually ended the session at 1,090.70. The 52-week range is 1,045.40 -1,307.80.
Copyright © 2015,
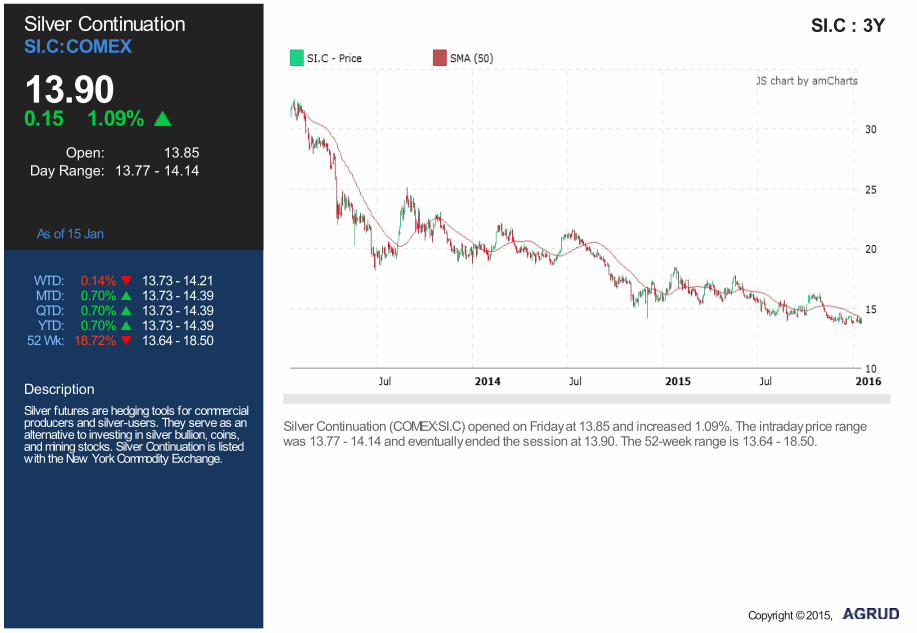
Silver ContinuationSI.C:COMEX
13.90 0.15 1.09%
Open: 13.85Day Range: 13.77 - 14.14
As of 15 Jan
WTD: 0.14% 13.73 - 14.21MTD: 0.70% 13.73 - 14.39QTD: 0.70% 13.73 - 14.39YTD: 0.70% 13.73 - 14.39
52 Wk: 18.72% 13.64 - 18.50
DescriptionSilver futures are hedging tools for commercialproducers and silver-users. They serve as analternative to investing in silver bullion, coins,and mining stocks. Silver Continuation is listedwith the New York Commodity Exchange.
SI.C : 3Y
Silver Continuation (COMEX:SI.C) opened on Friday at 13.85 and increased 1.09%. The intraday price rangewas 13.77 - 14.14 and eventually ended the session at 13.90. The 52-week range is 13.64 - 18.50.
Copyright © 2015,
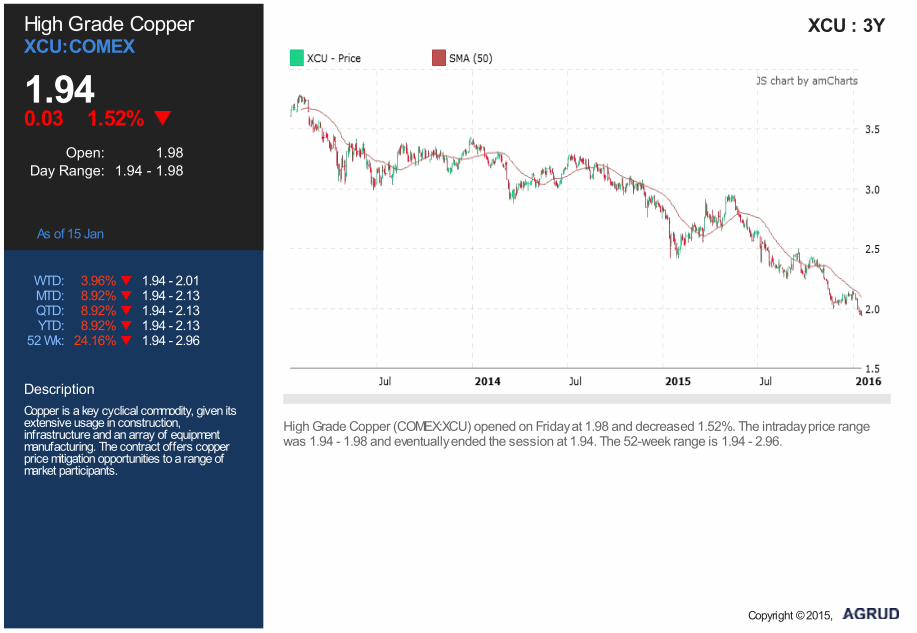
High Grade CopperXCU:COMEX
1.94 0.03 1.52%
Open: 1.98Day Range: 1.94 - 1.98
As of 15 Jan
WTD: 3.96% 1.94 - 2.01MTD: 8.92% 1.94 - 2.13QTD: 8.92% 1.94 - 2.13YTD: 8.92% 1.94 - 2.13
52 Wk: 24.16% 1.94 - 2.96
DescriptionCopper is a key cyclical commodity, given itsextensive usage in construction,infrastructure and an array of equipmentmanufacturing. The contract offers copperprice mitigation opportunities to a range ofmarket participants.
XCU : 3Y
High Grade Copper (COMEX:XCU) opened on Friday at 1.98 and decreased 1.52%. The intraday price rangewas 1.94 - 1.98 and eventually ended the session at 1.94. The 52-week range is 1.94 - 2.96.
Copyright © 2015,

Crude Oil WTICL:NYMEX
30.39 0.83 2.66%
Open: 32.11Day Range: 30.06 - 32.13
As of 15 Jan
WTD: 11.45% 30.06 - 34.31MTD: 18.15% 30.06 - 39.53QTD: 18.15% 30.06 - 39.53YTD: 18.15% 30.06 - 39.53
52 Wk: 34.45% 30.06 - 61.37
DescriptionLight Sweet Crude Oil (WTI) is the world'smost actively traded energy product. It is usedas a benchmark in oil-pricing and is theunderlying commodity of New YorkMerchantile Exchange's oil futures contracts.
CL : 3Y
Crude Oil WTI (NYMEX:CL) opened on Friday at 32.11 and plunged 2.66%. The intraday price range was 30.06 -32.13 and eventually ended the session at 30.39. The 52-week range is 30.06 - 61.37.
Copyright © 2015,
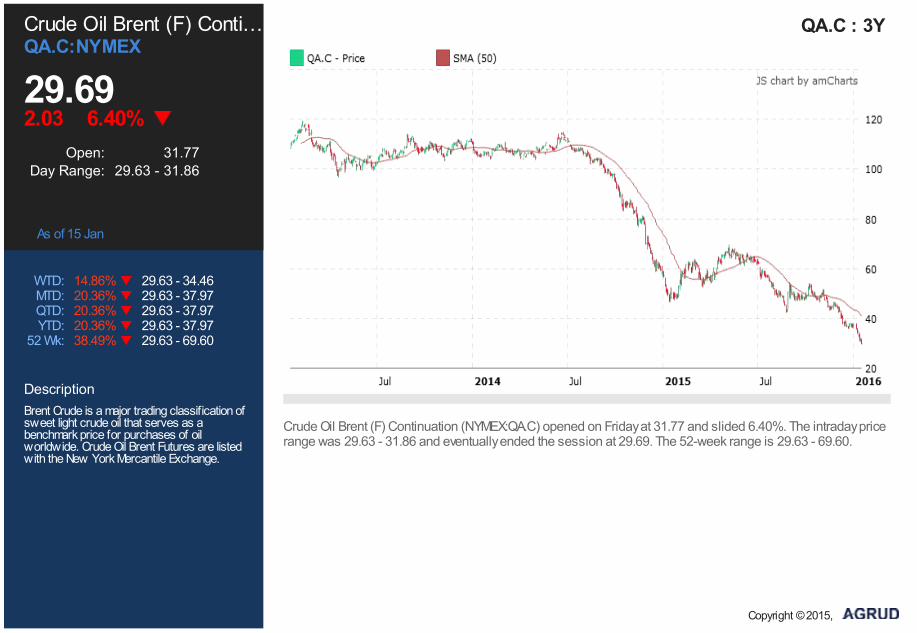
Crude Oil Brent (F) Conti…QA.C:NYMEX
29.69 2.03 6.40%
Open: 31.77Day Range: 29.63 - 31.86
As of 15 Jan
WTD: 14.86% 29.63 - 34.46MTD: 20.36% 29.63 - 37.97QTD: 20.36% 29.63 - 37.97YTD: 20.36% 29.63 - 37.97
52 Wk: 38.49% 29.63 - 69.60
DescriptionBrent Crude is a major trading classification ofsweet light crude oil that serves as abenchmark price for purchases of oilworldwide. Crude Oil Brent Futures are listedwith the New York Mercantile Exchange.
QA.C : 3Y
Crude Oil Brent (F) Continuation (NYMEX:QA.C) opened on Friday at 31.77 and slided 6.40%. The intraday pricerange was 29.63 - 31.86 and eventually ended the session at 29.69. The 52-week range is 29.63 - 69.60.
Copyright © 2015,
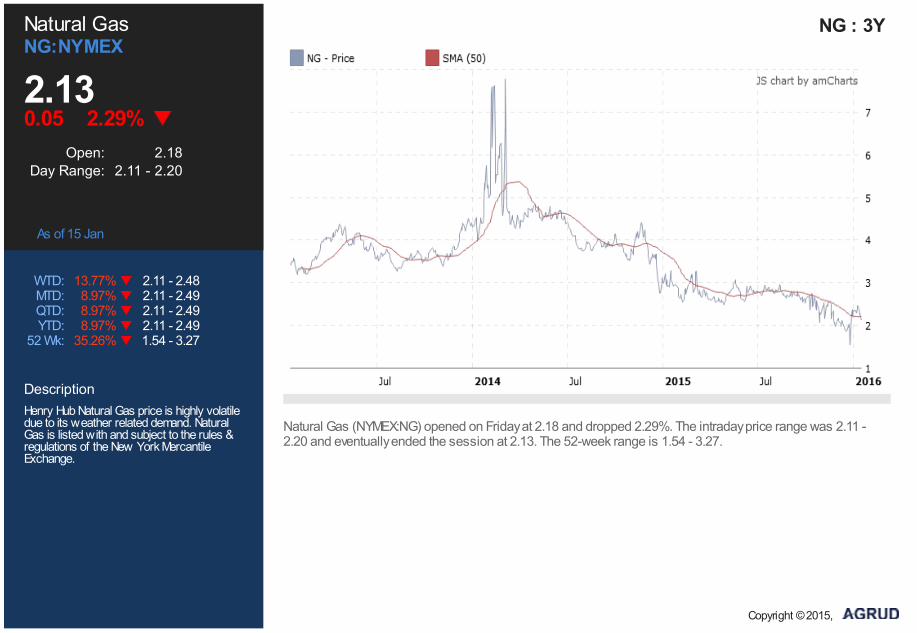
Natural GasNG:NYMEX
2.13 0.05 2.29%
Open: 2.18Day Range: 2.11 - 2.20
As of 15 Jan
WTD: 13.77% 2.11 - 2.48MTD: 8.97% 2.11 - 2.49QTD: 8.97% 2.11 - 2.49YTD: 8.97% 2.11 - 2.49
52 Wk: 35.26% 1.54 - 3.27
DescriptionHenry Hub Natural Gas price is highly volatiledue to its weather related demand. NaturalGas is listed with and subject to the rules ®ulations of the New York MercantileExchange.
NG : 3Y
Natural Gas (NYMEX:NG) opened on Friday at 2.18 and dropped 2.29%. The intraday price range was 2.11 -2.20 and eventually ended the session at 2.13. The 52-week range is 1.54 - 3.27.
Copyright © 2015,
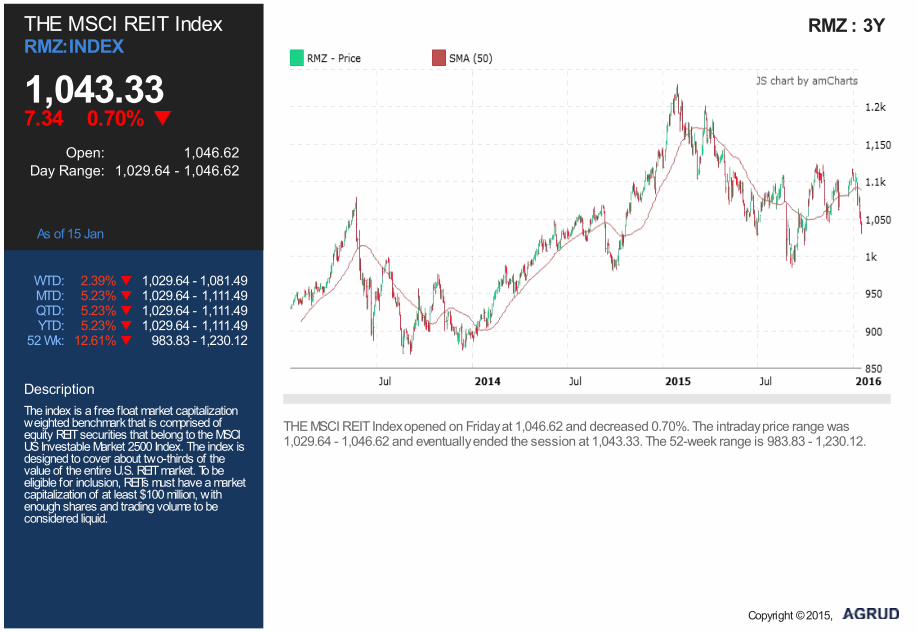
THE MSCI REIT IndexRMZ:INDEX
1,043.33 7.34 0.70%
Open: 1,046.62Day Range: 1,029.64 - 1,046.62
As of 15 Jan
WTD: 2.39% 1,029.64 - 1,081.49MTD: 5.23% 1,029.64 - 1,111.49QTD: 5.23% 1,029.64 - 1,111.49YTD: 5.23% 1,029.64 - 1,111.49
52 Wk: 12.61% 983.83 - 1,230.12
DescriptionThe index is a free float market capitalizationweighted benchmark that is comprised ofequity REIT securities that belong to the MSCIUS Investable Market 2500 Index. The index isdesigned to cover about two-thirds of thevalue of the entire U.S. REIT market. To beeligible for inclusion, REITs must have a marketcapitalization of at least $100 million, withenough shares and trading volume to beconsidered liquid.
RMZ : 3Y
THE MSCI REIT Index opened on Friday at 1,046.62 and decreased 0.70%. The intraday price range was1,029.64 - 1,046.62 and eventually ended the session at 1,043.33. The 52-week range is 983.83 - 1,230.12.
Copyright © 2015,

DisclaimerThe information contained in this website is for general information purposes only. Whilst Agrud.com monitors the quality of the information available onthis website and updates the information regularly, we make no representations or warranties of any kind, express or implied, about the completeness,accuracy, reliability, suitability for a particular purpose or availability with respect to the website or the information, products, services, or related graphicscontained on the website for any purpose.
Before relying on any material contained on this site, users should independently verify its accuracy, currency, completeness and relevance for theirpurposes.
The material contained on this site is not made available for the purpose of rendering professional advice. Users should seek independent professionaladvice in relation to their particular circumstances.
By making any use of this website you agree that in no event will we be liable for any loss or damage including without limitation, indirect orconsequential loss or damage, or any loss or damage whatsoever arising from loss of data or profits arising out of, or in connection with, the use of thiswebsite. Any reliance you place on such information is therefore strictly at your own risk.
Through this website you are able to link to other websites which are not under the control of Agrud.com. We have no control over the nature, contentand availability of those sites. The inclusion of any links does not imply a recommendation or endorse the views expressed within them. Agrud shall notaccept any responsibility for the content of those websites or your use of those websites.
Every effort is made to keep this website up and running smoothly. However, Agrud.com takes no responsibility for, and will not be liable for, this websitebeing unavailable for any period of time due to technical issues.
Acknowledgement information.
Copyright © 2015,