Global Market Forecast - AirInsightGLOBAL MARKET FORECAST 2004-2023 I 3 Frequencies will double The...
76
Global Market Forecast 2004-2023
Transcript of Global Market Forecast - AirInsightGLOBAL MARKET FORECAST 2004-2023 I 3 Frequencies will double The...

Global Market Forecast2004-2023

Contents
Page .6
Current marketenvironment
Page .16
Demand for air travel

I 1
Page .30
Traffic forecast Page .34
Demand for passengeraircraft
Page .56
Air cargo forecast

2 I GLOBAL MARKET FORECAST 2004-2023
Forecast highlights
The economic recovery, the return of business confidence and corporate
investment, the sustained trade in commodities and a pent-up demand in world-
wide leisure travel, have all resulted in a much stronger rebound of air traffic in 2004
than previously anticipated.
Over the 2004-2023 period, world passenger traffic is forecast to increase
by 5.3% per annum. This traffic growth, combined with fleet renewal, will require
delivery of 16,601 new passenger aircraft.
17,328 new passenger and freighter aircraft deliveries
The number of passenger aircraft in service will double from a fleet of 10,838 at year
end 2003 to 21,759 in 2023.
Passenger airlines will replace 9,200 aircraft, of which 3,520 will be recycled back
into passenger service, 2,412 will be converted to freighters, with the remaining
3,268 aircraft permanently withdrawn from service over the forecast period.
Freight traffic is expected to grow at 5.9% per annum over the 2004-2023 period.
Traffic growth and fleet renewal will create a demand for 3,139 freighter deliveries,
of which 727, or 23%, will be factory-built freighters.
The world’s airlines are forecast to take delivery of 17,328 new passenger and freighter
aircraft over the next 20 years, equating to average annual deliveries of 866 aircraft.

GLOBAL MARKET FORECAST 2004-2023 I 3
Frequencies will double
The number of frequencies offered on passenger routes will more than double,
whilst the average seats per aircraft will increase 20% from 181 to 215.
Despite current levels of congestion and delays, this will represent a more rapid rise
than that seen in previous years, and will present a challenge to the world’s airports
and air traffic management systems.
The Airbus GMF assumes that all planned and required infrastructure improvements
will be undertaken over the forecast period. Given the substantial investments
and time required to carry out such developments, there is the possibility that not
all the changes necessary may be achieved. Should this be the case, average
aircraft size could go higher than the anticipated level of 215 seats per aircraft
by 2023 shown in the GMF. Airlines could consequently be forced to acquire larger
aircraft in order to meet demand.
17,328new passenger
and freighter deliveries overthe 2004-2023
period
16,601
Delivered17,328
Retired4,297
Recycled3,520
Converted2,412
PassengerFleet
FreighterFleet
��
3,268 1,029
��
�
727

4 I GLOBAL MARKET FORECAST 2004-2023
The emergence of the successful low cost airlines in recent years will add more
single-aisle aircraft on domestic and intra-regional flows than in previous forecasts.
Two thirds of new deliveries will be single-aisle types in nominal size categories from
100 to 210 seats.
By 2023, the world’s airlines will be operating 1,262 very large passenger aircraft
and 996 large freighter aircraft. 62% of the world fleet of very large passenger
aircraft will be operated by the airlines of the Asia-Pacific region alone.
Passenger and freighter deliveries worth $1.9 trillion
These 17,328 new passenger aircraft and freighters represent a business volume
of approximately $1.9 trillion at current list prices.
The largest volume of business will be generated from deliveries of single-aisle
aircraft, with the demand for 1,648 large passenger and freighter aircraft,
accounting for 22% of total aircraft delivery value.
The greatest demand for passenger aircraft will come from airlines in the United
States, the People’s Republic of China and the United Kingdom.
Almost half of all the passenger aircraft delivered, accounting for 41% of the total
dollar value, will be needed by airlines in these three nations alone.
Including recycled aircraft, deliveries to Europe will represent 32% of total deliveries
during the forecast period, with the US and Asia-Pacific taking 28% and 27%
respectively.
Forecast highlights

GLOBAL MARKET FORECAST 2004-2023 I 5
New passengerand freighter
aircraft deliverieswill average
866per year
Passenger and freighter
business worth
$1.9 trillion
Business volume 2004-2023
World-wide demand will be more even betweenmajor regions
Aircraft deliveries 2004-2023
Latin America
810 413 6%
2004-2013 2014-2023 % of worlddeliveries
Middle East
396 299 4%
2004-2013 2014-2023 % of worlddeliveries
Africa
411 230 3%
2004-2013 2014-2023 % of worlddeliveries
Asia-Pacific
2,928 2,587 27%
2004-2013 2014-2023 % of worlddeliveries
Europe
3,290 3,113 32%
2004-2013 2014-2023 % of worlddeliveries
North America
3,048 2,596 28%
2004-2013 2014-2023 % of worlddeliveries
Top Ten end-user nations
Passenger aircraft delivered By $ value (2004 $ billion)
1. United States 5,210 United States 412.7
2. People’s Republic of China 1,790 People’s Republic of China 241.7
3. United Kingdom 1,150 United Kingdom 119.2
4. Germany 989 Japan 106.4
5. Japan 640 Germany 96.6
6. Italy 543 France 57.5
7. France 482 Republic of Korea 52.5
8. Spain 446 Italy 52.1
9. Canada 434 Spain 47.5
10. Malaysia 380 Singapore 44.4
12,000
10,000
8,000
6,000
4,000
2,000
0
Number of new aircraft
1,9862,792
10,902
1,648
Single-aisle & Small jet freighters
63%
Small twin aisle & regional
freighters11%
Large aircraft & large
freighters10%
Intermediate twin aisle &
long-range freighters16%
250
476416
Single-aisle & Small jet freighters
40%
Small twin aisle & regional
freighters13%
Large aircraft & large
freighters22%
Intermediate twin aisle &
long-range freighters25%
761
1,000
800
600
400
200
0
$ (billion)

6 I

Current marketenvironment
+11%Strong traffic recoveryin 2004.
Global Market Forecast 2004-2023
I 7

CURRENT MARKET ENVIRONMENT
8 I GLOBAL MARKET FORECAST 2004-2023
Traffic Recovery
Traffic rebounded strongly in 2004
After three years of recovery, worldwide air traffic rebounded
strongly in 2004, increasing at a much faster pace than
anticipated. Traffic for the first nine months of 2004 for European,
Asia-Pacific and US airlines moved to 3% above 2000 levels.
All regions and most traffic flows regained their end-2000 traffic
levels by the middle of the year.
Load factors were back to all-time highs, being in excess of 75%
on the transpacific market, a level rarely attained in the 1980s
and 1990s.
Domestic US traffic, which represents 20% of world traffic, was
stimulated by intense competition, especially on the transcontinental
market, over the important summer period. As a result, unlike
most other traffic flows, US domestic yields remained 15% lower
than their 2000 levels. Fare pressure on domestic markets is
expected to continue. In response, US network airlines have
embarked on radical cost cutting efforts, which today are starting
to bear fruit. However, elevated fuel prices, hurricanes in the
Mexican Gulf and competition have all served to hinder the return
to profitability of the network airlines in 2004.
Conversely US airlines’ international routes have fared much
better, with yields and passenger demand well above their 2000
levels in most of 2004.
Like the European airlines, whose traffic was 6% above 2000
levels, Asian and Pacific airline’s international traffic rose to a bullish
9% above 2000 levels. Transpacific traffic was particularly dynamic,
whilst tight capacity control pushed load factors to historical
highs. All this enabled yields to increase for the first time in three
years and even to surpass their pre-downturn levels.
Strong rebound
for Asianairlines traffic
50
Billion RPKs
45
40
35
30
25
Jan. Feb. Mar. Apr. May Jun. Jul. Aug. Sep. Oct. Nov. Dec.20
2004 2003 2002 2001 2000 Airbus estimate
220
Billion RPKs
200
180
160
140
Jan. Feb. Mar. Apr. May Jun. Jul. Aug. Sep. Oct. Nov. Dec.120
2004 Airbus estimate2003 2002 2001 2000
2004 passenger traffic well above 2000 level Asian airlines traffic recovery
Source: AEA, ATA, AAPA (covers 61% of total world passenger traffic in 2003). Source: AAPA.

2004 worldpassenger
traffic growth anticipated
at 11.4%over 2003
Recovery strongest in Asia
Regional Asian traffic reported the best growth rates, boosted
by Chinese routes, swollen with the pent-up demand resulting
from the SARS driven dip in demand in early 2003.
Meanwhile, traffic demand in the Middle East, particularly
in the Gulf, continued to grow at a high rate, helping to consolidate
Dubai as a major worldwide hub.
Freight traffic led the recovery
Worldwide cargo traffic, fuelled by the surge in manufacturing
activity in China and by a steady US and South East Asian
economic recovery, had already surpassed its 2000 level as early
as mid 2002. Historically, cargo traffic growth has been viewed as
an early indicator of air transport recovery.
International Asian airlines’ freight traffic was particularly healthy
with a growth of 4.3% in 2003 and 14.6% for the first nine
months of 2004. Latin American traffic surpassed all other
regions, with nearly 20% growth for the first half of 2004.
Fully-integrated freight carriers, as well as the major airlines’
dedicated freight operations reported healthy results in 2003,
which continued into 2004. The profitability of airlines with strong
dedicated freighter fleets clearly benefited from this robust cargo
demand.
GLOBAL MARKET FORECAST 2004-2023 I 9
12
4
6
8
10
2
0
-2
-4
90 91 92 93 94 95 96 97 98 99 00 01 02 03 04E-6
% year over year change
ASK RPK
12
Billions FTKs
11
10
9
8
7
Jan. Feb. Mar. Apr. May Jun. Jul. Aug. Sep. Oct. Nov. Dec.6
2004 2003 2002 2001 2000 Airbus estimate
Cargo traffic recovery Passenger traffic growth
Source: AEA, ATA, AAPA (covers 86% of total world cargo traffic in 2003). Source: ICAO, 2004 Airbus estimates.
2004 cargotraffic already
at +15%vs 2000

CURRENT MARKET ENVIRONMENT
10 I GLOBAL MARKET FORECAST 2004-2023
The crisis will shift long-term demandby one year
For the full year of 2004 Airbus forecasters anticipate that RPKs
will grow at a rate of 11.4%, helped by a year on year comparison
with a SARS affected 2003, followed by a 6.3% growth in 2005.
Given the strong 2004-2005 recovery the 2004 traffic level
anticipated in the pre-2001 forecast will be regained by the third
quarter of 2005. Airbus anticipates that over the long term, the
3.3 year difference between our current and pre-downturn 2000
forecast seen today, will reduce significantly over the coming
years and will show just a one year lag by 2023.
Passenger traffic to grow 5.3%
After this strong rebound, global passenger traffic will follow
a more normal long-term growth trend, with growth averaging
5.3% per year, over the twenty-year period 2004-2023.
Considering the magnitude of the successive events that severely
interrupted the development of air travel over the last three years,
anticipated healthy growth in 2004 confirms that the
fundamentals driving air travel remain strong. Traffic demand
has proven to be resilient to 9/11, the Iraq war, SARS, and the
uncertainty over oil supply seen in the second half of 2004.
Following 9/11, governments, aviation authorities, airlines
and aircraft manufacturers were prompt in working together
to maximise security. Later, with the onset of SARS, there
was again prompt action by stakeholders, and traffic recovered
as quickly as it was affected, resulting in a perfect V-shaped
recovery.
10
Trillions RPKs
8
6
4
2
1990 2000 2010 20200
GMF 2004 GMF 2000 ICAO total traffic
3.3 years1.9 years
1 year
World annual traffic
Fundamentalsdriving air travel
are strong

GLOBAL MARKET FORECAST 2004-2023 I 11
A dynamic industry
The air transport industry has evolved
The air transport industry has evolved during the slow down and
recovery process. The major events that have unfolded to shape
these changes include:
– large airline operating losses in North America for the last three years
– chapter 11 leading to restructuring
– 1,800 old and mid generation aircraft parked
– revenue premium from business traffic greatly reduced
– a new breed of profitable LCCs in the US and Europe
and emergence of the model in Asia
– increased pricing transparency through the Internet
– two major mergers in Europe (cross border) and in Asia
– major cost-cutting initiatives at network airlines
– renewed dynamism in Asia-Pacific region
– burgeoning Chinese economy, economic recovery in the US
– renewed strength of the top three European airlines
– a higher fuel price.
The airlines have responded
Challenging times have forced airlines to restructure, transform,
and even attempt to re-invent themselves. Most airlines in
Europe, Asia and the Middle East have done a remarkable job of
undertaking such changes. Although high fuel prices are affecting
their bottom line, airlines are in a much stronger position than
in 2000 and will fully benefit from the unfolding upturn. Others
in North America are still faced with major cost-cutting exercises
in order to reach new levels of efficiency. There is no doubt that
air transport has once again overcome its most recent challenges,
as indeed it has at difficult times in the last 30 years, a period
when air travel actually grew eight-fold. Air travel has become
a basic human need.

CURRENT MARKET ENVIRONMENT
12 I GLOBAL MARKET FORECAST 2004-2023
Focus on costs
Impact of higher fuel price
The return of traffic, the drastic cost-cutting efforts and restructuring
have been challenged by the rise in fuel price. In September 2004
a barrel of crude oil passed the historic level of $50 in New York.
Although higher than had been experienced for some time,
this was still well below (about half) its inflation-adjusted height
of the late 1970s and early 1980s.
The oil price surge in mid 2004 was due to three main concurrent
factors: (1) a rising demand, (2) a small global surplus of production
capacity and availability, and (3) the fear of a possible disruption
of supply. Current world oil prices do not entirely reflect the pure
economic fundamentals of market supply and demand.
It is estimated that the fear of supply disruption has resulted
in a risk premium of up to $15 per barrel. Burgeoning Chinese
manufacturing activities and the US recovery account for more
than 70% of the growth in worldwide demand. Energy economists
from Global Insight forecast that oil prices could stay above
$40/barrel until mid 2005 and will decrease thereafter as stock
increases and Chinese and US economic growth moderates,
to reach $35/barrel by year-end 2005.
Most developed countries have become less dependent on oil,
and it will take a much larger oil price increase to overwhelm their
economies. According to the US Energy Department, it required
about half of the energy to produce a dollar of GDP in 2004 that it
did 30 years earlier, and even less in Europe.
Unlikely to severely affect world traffic
Given the oil price outlook and the sustained world economic
growth anticipated in 2005 and 2006, macroeconomists believe
that the surge in fuel price does not represent a threat to the
unfolding world recovery. In the unlikely event that oil price stays
above $45 a barrel throughout 2005, it would not affect world
GDP growth by more than 0.4% compared with the most likely
scenario of a return to $35-$39.
The elasticity of traffic to GDP and the current oil price scenario
do not suggest a significant reduction of air travel demand in
2004 and 2005. In the US, some of the RPK decrease could be
partly mitigated by the return of the short haul air travel that has
migrated to the roads in recent years.
The airline sensitivity to any oil price surge mainly depends on
(1) the revenue loss from lower demand, (2) the ability to impose
a fuel surcharge on tickets, (3) the importance of fuel cost relative
to other costs, (4) the fuel hedging in place, and (5) the fuel
efficiency of the fleet.
At $1.20/gallon of jet fuel, a $6 short-haul and $19 long-haul per
flight surcharge is enough to cover the fuel price increase from
the 85 cents per gallon of 2003. With the exception of some
LCCs and the network US airlines on their domestic operations,
airlines have responded promptly to the oil price hike by adding
a fuel surcharge on tickets. Fuel hedging also varies widely from
airline to airline, from a 75% hedging at $27/barrel for 2004
and 2005 for some, to no hedged positions for others.
Fuel pricesare currently
well below thoseof the 70s-80s,when inflation-
adjusted
90
50
60
70
80
40
30
20
10
70 72 74 76 78 80 82 84 86 88 90 92 94 96 98 00 02 04E
in constant 2004 $
0
in current $
$US per barrel of crude oil (Brent)
Crude oil price
Source: International Energy Agency, 2004: full year average estimate.

GLOBAL MARKET FORECAST 2004-2023 I 13
Designedto deliver benefits
New aircraft will help
Fuel costs represented 14% of total airline expenses in 2003 for
worldwide airlines. Assuming an average of $42 per barrel oil
price for the full year of 2004, the current hedging level and the
same fleet mix, fuel cost could reach 18% of total expenses
in 2004.
For a fleet with a large new-generation aircraft type, fuel costs can
represent as little as 10% of their total operation cost, compared
with as much as 30% for the least efficient fleet in fuel price
controlled countries.
A fuel efficient new-generation aircraft, such as the A319,
consumes typically 20% less fuel per seat than a mid-generation
aircraft mostly delivered in the 1980s, and 40% less than an old-
generation aircraft. A new wide-body aircraft, such as the A330,
consumes typically 55% less fuel than an older-generation aircraft
such as the DC10. On a present value basis over 15 years,
the difference in fuel consumption between a new and mid-
generation single-aisle aircraft translates into a $5 million saving,
$9.5 million when compared with an old-generation aircraft.
+ 21%
datum
+ 42%
New-generationA320 Family
Mid-generation Old-generation
45
25
30
35
40
20
15
10
5
0
% difference
30
10
15
20
25
5
66 68 70 72 74 76 78 80 82 84 86 88 90 92 94 96 98 00 02 04E0
Fuel cost as a % of total airline expenses
Block fuel consumption per seatFuel cost in total airline expenses
Source: ICAO + Airbus estimate for 2004.500 nm sector, 2 class seating
New-generationsingle-aisle
40% morefuel efficient

CURRENT MARKET ENVIRONMENT
14 I GLOBAL MARKET FORECAST 2004-2023
Opportunity to improve fuel efficiency
The potential for airlines to reduce their fuel cost is significant.
Of the 13,612 aircraft in service in 2004, 2,712 are old-generation
and 5,529 mid-generation types, like 737-300, MD80 and 757-200.
Historically, rapid oil price increases, such as the two oil shocks
and the Gulf War, have triggered the acceleration of aircraft
retirement. Although more modest, the current oil price increase
should also stimulate aircraft retirements and keep older, less
efficient parked aircraft on the ground. Current fleet in service by aircraft generation
Source: Airclaims.Includes: Western-built jets passenger (>100 seats) & freighters.
300
250
200
150
100
50
30 Fuel price (cents/USg) Today’s price 150
Old-generation
0
Mid-generation New-generation (A320)
PV per seat in k$
PV 15 years at 10% discount rate
Present value of fuel bill
30
10
15
20
25
5
66 68 70 72 74 76 78 80 82 84 86 88 90 92 94 96 98 00 02 04E0
2,5
1,5
2,0
1,0
0,5
0,0
Fuel cost as a % of total airline expenses
Aircraft withdrawn from permanent use as a % permanently of fleet in service
1st oil shock
2nd oil shock
Gulf war Sept. 11
% %
High oil prices trigger retirements
New Mid Old Total
North America 1,654 2,581 1,301 5,536
Europe 1,768 1,363 237 3,368
Asia 1,154 969 295 2,418
Latin America and Caribbean 238 259 393 890
Africa 162 111 316 589
Middle East 240 144 155 539
Pacific 155 102 15 272
World 5,371 5,529 2,712 13,612
Potential for
$10 millionfuel cost savingsper aircraft over
15 years

GLOBAL MARKET FORECAST 2004-2023 I 15
Candidatesfor returnto service
not to exceed
250units
90%return to service
after lessthan 2 yearsof storage
Future of parked aircraft
Parked or retired
The number of parked aircraft reached an all-time high in 2003;
although subsequently decreasing by 20% in 2004, parked
aircraft were still 50% above pre-2001 levels. New-generation
parked aircraft returned to revenue service, as well as 40% of the
560 mid-generation parked aircraft. Meanwhile less than 10% of
the 1,300 parked old-generation aircraft, which include the 727,
DC9 and 737-200, have temporarily returned to service, with the
remaining aircraft virtually retired. Historically 90% of aircraft
returning to service have been stored for less than two years and
75% are aged less than 20.
The number of aircraft remaining parked for less than two years
and aged less than 20 is 400, 280 of these being aged less than 15.
Given the small market appetite for some types and the lack
of building specification homogeneity that exists between many
stored aircraft, the maximum number of candidates for return
to passenger service should not exceed 250 units.
100
95
80
85
90
<1 <2 <3 <4 <5 <6 <7 <8 <9 <10 <11 <12 <1375
Cumulative % of de-storage events
Years spent in storage
140
40
60
80
120
100
20
02 4 6 8 10 12 14 16 18 20 22 24 26 28 30 32 34 36 4038
Number of aircraft parked
0 to 1 year spent in storage1 to 2 years2 to 3 years
Age
over 3 years
Worldwide aircraft storage Aircraft return into service
Source: Airclaims.Includes: Western built aircraft >100 seats.
Source: Airclaims.

16 I

I 17
Demand for air travel
Concentration of population, personal wealth and industrywill drive air traffic growth.
Global Market Forecast 2004-2023

DEMAND FOR AIR TRAVEL
18 I GLOBAL MARKET FORECAST 2004-2023
Emerging economieslead growth
Increasing propensity to travel in emerging nations
Comments made by IATA, during a recent “state of the industry”
address, highlight the potential for emerging markets: “China and
India have the potential to reshape the travel industry.” Indeed,
the two Asian giants have been in the midst of an economic
transformation that is anticipated to turn them into the world’s
largest consumer markets within 25 years. Their combined
purchasing power could be five times greater than that of the
United States of America today.
Today, every US citizen makes on average 2.2 air trips each year.
The corresponding figures are just 0.02 trips per year for India
and 0.06 for China. There is therefore huge potential for air travel
growth by these and other emerging and developing countries,
as wealth grows and air travel becomes affordable by more
and more people.
22 millionadditional Chinese
middle-classconsumers
per year
The Chinese route network
HLD
CGQ
DDG
PEK
TNA
CGOLYA
HZG
ZGC
XIY
ZAT
KMG
KWEKWL
NNG
HAK
SYX
ZHABHY
HKGMFMSZX
CANSWAMXZ
XIN
KOWCSX
KHNWUSJNZ
TXN YIW
HGH NGBWNZ
HSNHYN
FOC
XMN
JJN
WUH
SHSENHCKG
WXN
XFN
YIH
BSD
SYMLNJ
DLULJG
DIG
JHG
LUM
LZH
LLFCGDDYG
CTUMIG
LZO
AKANNY
FUG XUZLYGLYI
NKGCZX
HFE
CIH
TAOWEF
YNT
WEHTYN
TSNSJW DOY
DLC
SHE
SHAPVG
NTGYNZ
LHW
URC
INCUYN
BAVHET
LXA
BPX
YIN
KHGXNN
HRB
JMU
MDG
YNJJIL
JNZ
NDG
KRL
IQM
AKU KCA
AAT
TCG
DNHCHW
XIL
HLD
HLH
CGQTGO
PEK
TNA
CGO
SIAHZG
XICZAT
KMG
KWE
KWL
NNG
HAK
ZHA
HKGCAN
SWAXIN
KOWCSX
KHNJDZ
TXNHGH
FOC
JJN
WUH
SHSENHCKG
YIH
BSD
SYM
CTU
AKA
NNY
FUGNKG
HFE
CIH
TAOTYN
ENYIQN
TSNDLC
CIFSHE
SHALHW
URC
GOQ
INC
UYNBAV
HET
LXA
YINKRY
KHGXNN
HRB
KRL
IQMHTM
AKU
FYN
AAT
DNH CHW
XIL
Large potential for future growth in air travel
10
1
0,1
0,01
0,001
0,0001
Trips* per capita
Real GDP per Capita (US$)* Passengers carried by airlines domiciled in the country
0 5,000 10,000 15,000 20,000 25,000 30,000 35,000 40,000
World average
Nigeria
Slovakia
Brazil
Cambodia
IndiaUkraine
ChinaIndonesia
Egypt Poland
Mexico
PakistanCuba
Vietnam
Sri LankaColombia
ThailandCzech Rep. Oman
Malaysia
Malta
Portugal
Kuwait
Brunei
Spain
Israel
UAE Singapore Iceland
UK
AustraliaFrance Germany
Austria Sweden
Japan
Denmark
SwitzerlandNorway
USANetherlands
Korea
Peru
Zimbabwe
1985 2004

GLOBAL MARKET FORECAST 2004-2023 I 19
More wealth leading to more air travel
In China, the two primary drivers of traffic growth are income,
measured by GDP per capita, and exports. These two variables
alone explain 99% of the traffic variations of the last 20 years.
Other economic factors, more linked to social developments
such as the very high Chinese personal saving rate, have limited
the discretionary spending that would otherwise have been
allocated to travel. However, private consumption has increased
steadily over the last 5 years. Spending on cars and residential
housing, for example, has grown threefold, and is continuing to
grow at even higher rates. Transport and communications have
become the fastest growing items in the Chinese household budget,
representing 10% of their total consumption expenditure today.
According to the Chinese Academy of Social Science, middle-
income consumers, defined as households with US$18,000-
36,000 of assets, represent 250 million people, or 19% of the
2004 population, and are forecast to reach the 40% level by
2020. Already, 49% of the urban population are middle-income
consumers. These emerging middle-class consumers are
concentrated in the coastal provinces of the Beijing-Tianjin
corridor, Yangtze River Delta and the Pearl River Delta.
In many emerging nations there is often a disparity between regions
and urban/rural populations in terms of wealth. For example,
in China the top 5 regions, in terms of GDP, are responsible for
about 40% of total Chinese GDP, in France this number is 22%.
Growing Chinese expenditure on transport Wealth concentration
Chinese middle-class consumers per year
50
40
30
20
10
0
% of total population
20202004
600 million people
250 million people
450
250
300
350
400
200
150
100
50
Wealthiest region (Ile-de-France, Shanghai) Poorest region0
Regional GDP per capita as a % of the national average
(National average = 100)
France China
100
80
90
70
60
50
40
30
20
10
0
% of total household expense
1985 1990 1995 1999 2000 2001
Food, clothing, medicine, others Housing
Recreation and education Transportation and communication
Source: Chinese Academy of Social Science.
Source: INSEE & China Statistical Year Book 2003.

DEMAND FOR AIR TRAVEL
20 I GLOBAL MARKET FORECAST 2004-2023
China takes off
First domestic, now international
Income is directly related to urbanisation, due to the higher
concentration of employment opportunities and the higher salary
levels in large cities. Industrial production in volume and especially
in value is concentrated in the coastal areas and around the 3 major
Chinese cities. Therefore, not only is the population concentrated,
but their own wealth, as well as the wealth they generate through
the country’s industrial production, is concentrated in urban areas.
The propensity to travel in emerging economy countries typically
starts with domestic trips, when income reaches a certain
threshold, and then develops into international trips when another,
higher, threshold is reached. Chinese disposable income has
grown tenfold in two decades and reached the first domestic
travel threshold in 1990. The Chinese government’s emphasis
on raising personal income and consumption, and its focus on
foreign trade as a major vehicle for economic growth, have served
to increase demand for air transport dramatically. Between 1980
and 1998 demand for travel on China’s domestic air routes, fed
by a sharp increase in disposable income, multiplied nearly twenty
times, growing at an average 16.5% per year.
China to followthe more efficient
hub and spokesystem
Concentration of population, wealth and manufacturing activities
China steady traffic growth driven by domestic routes
100
80
60
40
20
0
Average 16.5% per year
Total Regional International Domestic
84 85 87 88 89 90 91 92 93 94 95 96 97 98 99 00 01 02 0386
Passengers transported (millions)
GDP/capita ($US)
> 2,000
1,500-2,000
1,000-1,500
750-1,000
<750
Source: China Statistical Year Book 2003.

GLOBAL MARKET FORECAST 2004-2023 I 21
Planes, trains and …more planes
Hubs will be key
Faced with this booming growth, the Chinese transport
authorities recognized that it was necessary to restructure the
domestic route network on the more efficient hub and spoke
system, with Beijing, Shanghai and Guangzhou as the three major
mainland hubs. Today, some of the high density Chinese routes
have already become air shuttle type operations, with a departure
every hour. Anticipated international and domestic growth will be
challenging for the Chinese hub airports. Aircraft movements at
Beijing airport will grow from 250,000 today to about 700,000 by
2023, making it one of the world’s busiest airports.
It is anticipated that, within the next 10 years, the Chinese network
could resemble the Japanese system, with its busy hubs and high
density routes. Today in Japan, as many as 100 domestic flights
per day are operated by aircraft with more than 470 seats.
It is thought unlikely that high-speed trains will divert a significant
portion of air traffic, as in Japan or Europe, due to the much
greater distances between China’s main cities. The rail/air
competition experience in Japan and Europe suggests that rail
trip time in excess of 3 hours does not significantly divert traffic
from air to high-speed train. At best, the high-speed train from
Beijing to Shanghai will take 5 hours to cover the 1,100 km, whilst
Beijing to Guangzhou will take more than 9 hours.
More than
700,000aircraft
movementsat Beijing Airport
by 2023
High Speed train competition decreasing with trip time
100
40
60
80
20
1 1,25 1,5 1,75 2 2,25 2,5 3,5 3,75 4 4,25 4,5 4,752,75 3 3,25 50
Rail market share (%)
Paris-BrusselsParis-Lyon
Madrid-Seville
Tokyo-Osaka
Paris-London Stockholm-Gothenburg
Tokyo-Akita
Tokyo-Aomori
Rome-Milan
Paris-Amsterdam
Rail travel time (hours)

DEMAND FOR AIR TRAVEL
22 I GLOBAL MARKET FORECAST 2004-2023
From the US to China 90%of final destinations areconcentrated on 3 major cities
International tourism will grow
Although the income threshold that should have accelerated the
propensity to travel internationally was reached in the late 1990s,
the level of such travel has been constrained by the limited
number of countries in the Approved Destination Status (ADS) at
that time.
Today, with the rapid increase in countries on the ADS list,
together with the growing number of air service agreements, such
as those with the US and UK in 2004, a large pent-up demand
for international travel exists. In September 2004, an additional
27 European countries were added to the list of approved destinations,
ringing the total number of countries to 55. According to the
Worldwide Tourism Organization, as many as 100 million Chinese
tourists will travel internationally by 2020. China will become
the 4th largest country in terms of outbound tourists.
France, for example, anticipates as many as one million Chinese
tourists by 2008, a threefold increase over 2003. The Paris
Tourism Office expects China to become either the first or second
nation in terms of tourists, ahead of the UK, the US and Japan.
The economic benefit is expected to be significant as Chinese
tourists spend an average of $430 compared with $350 for
a visitor from the US, although a Japanese tourist spends $650.
Chinese long-haul international tourists are less interested in visiting
Manchester, Denver or Houston, than Paris, London, Rome,
San Francisco or New York.
Today Chinese travel agencies are concentrating their European
travel packages on France and Italy because of the high interest
in these destinations.
Similarly, the final destination of 90% of passengers travelling from
the US to mainland China is concentrated on the three largest
cities, with as many as 50 cities making up the remaining 10%.
Very few of these 50 cities will have a demand large enough
to justify a non-stop service to North America or Europe. Similarly
the origin of US passengers is concentrated on major cities,
70% of travellers’ true origins being either Los Angeles, San
Francisco or New York.
China’s Approved Destination Status (ADS)
1980 1990 2000 2003 2004
Pace of international travel to accelerate
MacauHong KongThailand
PhilippinesSingapore Malaysia
LaosVietnam AustraliaNew Zealand
Korea Cambodia MyanmarBruneiJapanIndonesia
TurkeyNepalIndiaMaldivesMaltaEgyptMorocco
CubaColombiaSri LankaSouth AfricaCroatiaHungaryPakistanSeychelles
KenyaEthiopiaTanzania TunisiaZambiaZimbabweMauritiusAustriaBelgiumFinlandFrance
GermanyGreeceIcelandItalyLuxembourgLichtensteinNetherlandsNorwayPortugalRomaniaSpainSwedenSwitzerland

GLOBAL MARKET FORECAST 2004-2023 I 23
Demand is simply where people want to go
Air travel in China is no longer the preserve of elite or business
travellers. It is attracting an increasing number of international
price-sensitive leisure travellers, from fast-growing urban areas, who
want to visit large tourism centres in Europe and North America.
These factors are driving the major airlines serving China to
introduce the A380. Two years before the A380’s entry into service,
current A380 customers have already announced flight plans that
will result in 130 weekly A380 frequencies to China by 2010.
The geographical concentration of population, consumers, wealth
and industry, including high-value manufacturing, in major urban
centres is driving demand for air transportation in this dynamic
Asian market.
130 weekly A380frequencies
to China by 2010
Bulk of passenger first origin and final destinationconcentrated on major cities
SeattleWashington
Boston
Chicago
Honolulu
Origin/destination passengers to mainland China from USA
Shanghai
Beijing
Guangzhou
USAFirst origin cities
Mainland ChinaFinal destination cities
Los Angeles
New YorkSan
Francisco
Source: MIDT.

DEMAND FOR AIR TRAVEL
24 I GLOBAL MARKET FORECAST 2004-2023
Expansion through bothfragmentation andconsolidation…
Profitable new routes to open
We anticipate intercontinental traffic to continue growing, partly
through the development of new services between major cities
(fragmentation), and through the further development of traffic
on existing hub to hub routes (consolidation). The future pace
and share of fragmentation and consolidation varies from region
to region, largely depending on the evolving equilibrium of a wide
range of factors. These factors not only include the passengers
penchant for non-stop flights but also, and most importantly,
factors such as passenger route selection based on ticket price
and convenient schedule, demographics, location of trade
centres, real origin and destination demand, aircraft, airline
and hub economics, liberalisation, airline alliances, congestion
and the environment. Opportunities will continue to emerge
for profitable new routes to develop, with aircraft like the A330
and A340. These new long-haul routes are largely centered
on the Trans-Pacific, with some on the more developed Europe
to Asia markets, helped by the growth of Asian economies
and the strong expansion of the international traffic to and from
emerging economies.
This development also coincided with the availability of aircraft
with better range and economics, such as the A330 and A340,
which offer airlines new market opportunities.
Indeed, over the last 10 years, the A340 alone has been used to
open 32 new routes on the Europe to Asia flow. On July 1st,
2004, for example, a new Trans-Pacific polar route was opened
between Hong Kong and New York with the A340-600, whilst
at the same time maintaining existing 747 and A340-300 service
to Vancouver with same airline. More ground breaking A340
Family flights to be inaugurated in 2004, included non-stop flights
using the A340-500 from Singapore to New York and Los
Angeles.
Over the next 10 years, Airbus forecast that up to 60 long-haul
routes could be opened profitably on the transpacific market
and between Europe and Asia, these in addition to the 250 routes
in operation today. Almost all of these potential new routes
will involve a major hub airport at either one end or the other.
International air traffic will grow throughfragmentation and consolidation
• Hub by-passing
• Market development
• Frequency on thin routes
• The business traveller’s preference
• More cost-effective
• Hub dominance
• Global network
• Linking major hubs
• The logic behind alliances
FRAGMENTATION CONSOLIDATION

GLOBAL MARKET FORECAST 2004-2023 I 25
Hubs key to new routes success
We anticipate that overall new route development will also continue
to follow its historical pattern, which is characterised by a substantial
amount of “churning”, or the addition and removal of routes.
From the 39 new city-pairs across the Pacific opened by North
American airlines since 1990, 29 have been from their hubs.
Of the remaining 10 non-hub routes, only one has survived.
Over time, many such new routes opened on the transpacific
market have subsequently been dropped, leading to a relatively
stable total number of routes in recent years.
This has also been the case on the Europe-Asia market, where
almost 80% of traffic is carried to and from a total of 17 primary
cities. These are major centres of population and business,
whose relative importance, from an air travel perspective, has
hardly changed over time.
Routes linking smaller cities have a higher failure rate. From the
75 routes opened during the past twenty years between a
primary city in Asia and a primary city in Europe, almost 90% have
proved successful and are still in operation today. Conversely,
of the 47 routes opened between secondary or tertiary cities,
only 40% have been lucrative enough to survive.
80%of Europe-Asiatraffic carriedto and from
17 primary cities
Number of city pairs served maturing on the Trans-Pacific
12
10
8
6
4
2
0
-2
-4
-6
-8
-10
90
80
70
60
50
40
30
20
10
0
New city pairs Dropped city pairs Total city pairs
Number of routes Total city pairs
1985 1987 1989 1991 1993 1995 1997 1999 2001 2003
High failure rate on routes linking smaller cities
50
40
30
20
10
0
Number of routes
(%) represent share of transpacific seats
% share of transpacific seatsRoutes tried in the last 20 years Routes operated in 2003
Primary Primary (70%)
Primary Secondary
(21%)
Primary Tertiary (9%)
Not linked to a primary city
(0%)
Source: OAG.

DEMAND FOR AIR TRAVEL
26 I GLOBAL MARKET FORECAST 2004-2023
… but bulk of traffic growthfrom consolidation
The largest routes will grow
According to the US Department of Transportation, the Trans-
Atlantic deregulation of the 1990s promoted airline alliances,
stimulated new, rather than diverted existing traffic, reduced fares
and encouraged traffic through hubs to a greater extent than
point to point. Indeed, large routes between “primary” cities,
such as New York – London or Paris – Chicago, have easily
maintained a stable share of capacity over 40%. Once established,
new routes not linking primary to primary cities have grown at
a much slower pace (+21% over 1994 to 2004) than those linking
primary to primary cities (+87%).
North Atlantic network evolution
100
70
80
90
60
50
40
10
20
30
0
% of seats growth 1994-2004
32%of lost seats
47% of additional seats
21% of additional seats
(+2,700 monthly seats per route)
87% of additional seats(+14,500 monthly seats per route)
10-year growthstructure of Primary-Primary routes
10-year growthstructure of other routes
Seats added after the route is opened
Seats offered at the opening of a new route
Seats lost when routes are dropped
Consolidation of the Atlantic market
100
80
60
40
20
0
Cumulative share of seats
Number of airlines1993 2003
1 5 9 13 17 21 25 29 33 37 41 45 49
Europe USA
Consolidation &Alliance effect
Deregulationand alliances
resulted inconsolidation
on transatlanticmarket
Airline alliances have also influenced consolidation over
the Trans-Atlantic, as the top 10 carriers have increased their
share of capacity by 5 points since the first US-European bilateral
agreement.
Although new routes will open, network development has been
largely driven by growing O&D markets between major population
centres, with future growth making these flows even more
important.

GLOBAL MARKET FORECAST 2004-2023 I 27
Growing urbanisation
Bulk of air travel generated by concentration of populations
Today, only five cities worldwide have more than 20 million
inhabitants. Based on current projections, by 2020 this number
will have grown to sixteen – including ten in the dynamic Asia-
Pacific region. GDP in the countries where these mega-cities are
located is expected to double by 2020.
The bulk of air travel will continue to be generated by these
concentrations of population and the associated business and
industry in and around them. This is where most of the people
with a high propensity to travel are and where they want to go.
The concentration of the demand on large O&D markets will even
accelerate as Asian urbanisation continues. For example, the
urban share of the Chinese population evolved from 20% in 1990
to 30% in 2000. By 2010, more than 40% of the anticipated
1.4 billion people will be concentrated in urban areas. By 2030,
the Chinese urbanisation rate could be approaching Japan’s.
GDP per capita in the 3 major Chinese cities is 3 to 4 times
greater than that of the country as a whole.
By 2020,
50%of Chinese
population will beconcentratedin urban areas
Bulk of air travel generated by concentration of population
2002 2020
34.9
44.0
TOKYO
2002 2020
21.15
31.85
SEOUL
2002 2020
20.25
27.4
SAO PAULO
2002 2020
21.624.9
NEW YORK
2002 2020
20.75
29.6
MEXICO
2020
20.8
LOS ANGELES
2020
20.4
ISTANBUL
2020
30.6
CAIRO2020
29.1
KARACHI
2020
21.0
DACCA
2020
28.8
MUMBAI
2020
20.8
KOLKATA
2020
36.0
DELHI
2020
23.7
MANILA
2020
23.9
JAKARTA
2020
20.8
OSAKA
Cities with population > 20 million
Origin-destination traffic between Asia and London
O&D73%
O&D76%
Connecting 27%
Connecting 24%
TokyoHong Kong
Acceleration in Chinese urbanisation
60
50
10
20
30
40
0
Urban population as % of total
1950 1970 1990 2010 2030
Source: CAA survey.
Source: United Nations.

DEMAND FOR AIR TRAVEL
28 I GLOBAL MARKET FORECAST 2004-2023
Concentrated trade and commercedrive freight
As well as the concentration of passenger demand, large centres
of population are often a focus for wealth, trade and commerce.
This in turn drives the need for international freight, which is also
concentrated around the major population and industrial centres,
particularly in Asia. In China for example, exports to North
America have more than tripled in value since 1995, mostly driven
by a sharp increase in high-technology goods. As much as three
quarters of the high-value final assembly of computers and other
electronics manufacturing is concentrated around the three main
Chinese cities of Beijing, Shanghai and Guangzhou.
China to North America exports: threefold increase in value, high-tech goods number one
35
20
25
30
15
10
5
0
US$ BN
20031995
OtherPrimaryIntermediateHigh techFoodConsumerCapital
+430%
Fivefoldincrease of
high-tech goodstransported
by air
Source: MGI.

GLOBAL MARKET FORECAST 2004-2023 I 29
When less is better than more
Passengers prefer lower fares
In mature markets, although economic growth remains the key
driver, demand for air travel is increasingly driven by ticket price
and consumer confidence. As markets have progressively
matured and become more leisure-orientated, the GDP elasticity
of air travel demand has declined. In the US for example,
a 1% growth in GDP will typically result in a 1.2% growth
in domestic air travel, compared with a growth of almost 2%
in air travel some 20 years ago. In emerging markets, ticket price
is obviously a key element, as the ratio of income to international
ticket price is lower in developed countries.
Independent surveys consistently show that what really matters
to passengers is not necessarily whether the flight is direct
or from a hub, but rather the ticket price. A factor which is
becoming ever more apparent with the advent of the Internet,
low-cost carriers and the increasing numbers of business travellers
who either have their travel booked for them or are guided
by corporate travel policy.
A recent US Commerce Department survey shows that ticket
price is the number one criterion for passengers when selecting
a flight, well ahead of the availability of a non-stop service.
The survey showed, for example, that for the Japanese market,
six other factors were more important to passengers, with ticket
price first. Another recent survey conducted by IATA showed that
41% of respondents identified lower fares as the factor that now
motivates them to fly more often.
Passengers motivated by lower fares
45
35
40
30
25
20
15
10
5
0
in %
Upgrades Schedules Safety on ground
Lower fares FFP’s Safety on board
Other
17
68
41
811 11
What would motivate you to fly more frequently?
Airline criteria of choice on transpacific flights
40
30
20
10
0
% of respondents
What is your main reason for flying on this airline?
Price Frequent flier Convenient schedule Non-Stop flights Previous good experience
30%
17%14%
9%7%
Source: US Commerce Department survey (ITA). Source: IATA online survey 2003.
Ticket pricenumber one
criterion whenselecting flights

30 I

I 31
Traffic forecast
Global Market Forecast 2004-2023
Three fold increaseof air traffic by 2023
Two fold increasein frequencies

TRAFFIC FORECAST
32 I GLOBAL MARKET FORECAST 2004-2023
Traffic growth
Airbus models each major traffic flow
Airbus analyses and forecasts a total of 140 distinct domestic,
regional and intercontinental passenger sub-markets, and a total
of 145 directional air cargo sub-markets.
This is achieved using the latest projections of economic
growth and other indices (including oil prices) from the Global
Insight Forecasting Group. The cargo forecast also incorporates
analysis of historical multidirectional exports and imports by
country and commodity.
Each traffic forecast model differs for each individual flow,
depending on the best fit of the different sets of economic and
air transport variables. These models, although based on
econometric modelling techniques, also integrate various
analyses of the regional and structural changes that are expected
to influence the dynamics and development of the current
and future air transport system. The growing importance
of the low-cost carriers (LCC) in the US and Europe, as well as
the Asia-Pacific region, is an example of a development that must
be taken into account when forecasting traffic.
In order to reflect these new market developments as accurately
as possible in the forecast, analysis must be carried out to
measure LCC traffic stimulation or diversion from network
carriers, the new route potential for LCCs and the subsequent
growth potential of these airlines through the development of
either new or existing routes.
Other structural changes that must also be considered include
the pace of liberalisation of markets to and from developing
countries, the growing importance of regional airlines, increasing
environmental and congestion constraints, and the subsequent
impact on airports or regions.
The results of careful analysis in these areas allows Airbus
forecasters to develop every traffic flow forecast, taking into
account the precise circumstances prevailing on every flow
and region studied.
The combination of these individual “bottom-up” traffic forecasts
is then compared to a “top-down” global forecast in order to
confirm the initial findings.
Average annualtraffic growth
5.3%to 2023
Top 20 passenger markets in 2023 Growth by domiciled airline
Domestic USAWest. Europe – USA
Intra West. EuropeDomestic PRC
Asia – USADomestic West. Europe
Asia – West. EuropeAsia – PRC
West. Europe – Middle EastIntra Asia
West. Europe – South AmericaJapan – USA
West. Europe – JapanCanada – West. Europe
West. Europe – PRCPRC – USA
Domestic JapanAsia – Japan
Asia – Australia/NZWest. Europe – Caribbean
2003 traffic 2004-2023 growth
2000 400 600 800 1,000 1,200
2004-2023RPKs (billions)
3.2% 4.9% 5.0% 8.7% 6.3% 5.0% 5.9% 9.1% 7.6% 6.9% 5.8% 5.8% 5.6% 6.1% 6.9% 7.9% 3.0% 5.9% 6.6% 6.9%
% of 2023 World RPKs
13.5% 8.6% 7.8% 5.9% 4.1% 3.0% 2.9% 2.2% 2.1% 2.0% 1.9% 1.7% 1.6% 1.5% 1,5% 1.4% 1.4% 1.4% 1.4% 1.3%
Latin America
5.3% 4.5% 4.9%
2004-2013 2014-2023 20-yeargrowth
Middle East
10.7% 3.6% 7.1%
2004-2013 2014-2023 20-yeargrowth
Africa
5.3% 3.8% 4.5%
2004-2013 2014-2023 20-yeargrowth
Asia-Pacific
6.7% 5.3% 6.0%
2004-2013 2014-2023 20-yeargrowth
China
9.1% 7.4% 8.2%
2004-2013 2014-2023 20-yeargrowth
Europe
5.8% 4.6% 5.2%
2004-2013 2014-2023 20-yeargrowth
World
6.0% 4.6% 5.3%
2004-2013 2014-2023 20-yeargrowthNorth America
4.8% 3.5% 4.2%
2004-2013 2014-2023 20-yeargrowth

GLOBAL MARKET FORECAST 2004-2023 I 33
In the absence of any major exogenous disruption, outside the
normal business or economic cycles, traffic for the next 20 years
is anticipated to grow at an average pace of 5.3% per annum.
Emerging markets grow in importance
The widely varying growth rates seen in different air passenger
markets largely reflect their degree of maturity. Airbus foresees
a twenty-year average annual growth of 3.2% for the mature
domestic US market and 8.7% for the domestic Chinese market.
The airlines domiciled in Asia will experience the fastest growth
rates, to the extent that by 2023 the North American domestic
market will have lost its historical dominance, having been
overtaken by both Europe and the dynamic Asia-Pacific region
as the world’s largest air travel markets.
The Middle East is also expected to grow rapidly, with 7.1%
average annual growth forecast over the next 20 years. This
growth is driven by the region’s unique geographical advantages,
combined with today’s new aircraft capabilities in terms of range
and size, for example the A380. The region growing importance
as a tourist destination from within the Middle East and India
and the airlines and airports strategy to position the major airports
as international hubs are also contributing to the strong growth.
Emerging markets will become increasingly important. Routes to
China, for example, represent five of the top 10 fastest growing
traffic flows. Airlines domiciled in China will grow 9.1% per year in
the first 10 years, whilst airlines in North America and Europe will
grow 4.8% and 5.8% respectively, over the same period.
Chinese traffic growth Shares of world traffic
Europe 32%
Asia-Pacific 31%
World trafficat end 2023
9.0 trillion RPKs
World trafficat end 2003
3.2 trillion RPKs
Europe 32%
Asia-Pacific 25%
North America26%
North America 33%
Middle East 5%
Middle East 3%
Africa 2%
Africa 3%
Latin America & Caribbean
4%
Latin America & Caribbean
4%
China – Asia9.1%
Domestic China 8.7%China – Europe
6.9%
China – North America 7.9%
World
6.0% 4.6% 5.3%
2004-2013 2014-2023 20-yeargrowth
China
9.1% 7.4% 8.2%
2004-2013 2014-2023 20-yeargrowth

34 I

I 35
Demand for passenger aircraft
830New passenger aircraftdemand per year.
Global Market Forecast 2004-2023

DEMAND FOR PASSENGER AIRCRAFT
36 I GLOBAL MARKET FORECAST 2004-2023
Frequency and capacity growthwill vary with market
Forecast frequencies grow 4%per year, capacity 0.9%
The combined productivity parameters will deliver 0.8%
of the yearly growth in RPKs. Consequently, to accommodate
the forecast average annual growth of 5.3% in traffic, the world’s
airlines will have to increase the number of mainline seats they
operate at an average annual rate of 4.5%.
These additional seats will be provided partly by an increase
in the number of aircraft operated, and partly by an increase
in the number of seats per aircraft.
Frequency and capacity needed
Frequency or capacity is distributed depending on the specific
characteristics of every single city pair within each of the 140
traffic flows forecast, with the observed development of all
worldwide city pairs in different stages of maturation and
liberalisation.
In reality, as service starts on a particular route, airlines will typically
offer one frequency per day as soon as possible and then
increase frequencies to capture market share and stimulate
demand. The benefits of convenient schedules, however, reach
a point of diminishing return, as a satisfactory level of passenger
service is attained, and the additional cost associated with more
frequencies grows faster than the additional revenues. There
is a “maximum” level of frequency beyond which any further
increase will not in itself generate any more travel demand.
Today, there are a handful of examples of domestic city pairs with
60 daily flights, equivalent to one every 12.5 minutes, in mature
markets. A fact that can be demonstrated when flights from such
markets are plotted, showing actual frequency and range for each
city pair.
+4.5%seats per year
Seat productivity & capacity growth will varybetween regions
2 1 0 1 2 3 4 5 6
Average annual growth (%)
RPK per seat Capacity (seats in service)
4.5
3.8
5.6
3.7
3.0
5.6
4.8
1.1
0.8
1.2
0.8
1.0
1.5
0.4
World traffic (RPK) 5.3%
Latin america & Caribbean 4.9%
Asia-Pacific 6.6%
Africa 4.5%
North America 4.2%
Middle East 7.1%
Europe 5.2%
The GMF assumes liberal frequency development
60
40
20
108
6
4
2
1
Total daily flights (all airlines combined)
200 400 600 800 1,000 2,000 4,000 6,000 8,000 10,000 Distance (km)
Capacity growth only
Maximumservice levels
Cap
acity
shar
eFr
eque
ncy
shar
e
Satisfactoryregionalservice levels(Europe-Asia shown)
Capacity/frequency split
Frequencygrowth only

GLOBAL MARKET FORECAST 2004-2023 I 37
The GMF models real behaviour
As traffic grows on any particular route, the extent to which it will
be accommodated by an increase in aircraft seat capacity, as
opposed to an increase in frequency, will depend upon where
it is situated between the two thresholds.
This analysis for each airport-pair leads Airbus to predict that
overall, assuming that the infrastructure is able to cope with the
increased volume of flights, airlines worldwide during the next
twenty years will increase the number of departures they offer
at an average annual rate of 4.0%, with 0.5% of that growth
generated by an increase in departures per aircraft. This is
significantly higher than the 2.5% per annum increase achieved
since 1980, and will present a major challenge to the world’s
airports and ATC systems.
Meanwhile the number of seats per aircraft will increase by 0.9%
per year, from an average of 181 in 2004 to 215 in 2023. This
compares with a 0.5% yearly increase since 1980.
A limit to frequency growth
10
1
60
987654
3
2
100
0,1
Daily flights
100 1,000 10,000
Intra-EuropeUS Domestic Domestic Japan
Maximum service level
Distance (km)
Traffic component development
600
500
400
300
200
100
700
800
900
0
Index 100 in 1980
202020152010200520001995199019851980
Frequency growthAir travel growth Average aircraft size
History Forecast
History Forecast Seat growth: 0.5% per year 0.9% per yearFrequency growth: 2.5% per year 4.0% per year
Frequencyto double over
20 years

DEMAND FOR PASSENGER AIRCRAFT
38 I GLOBAL MARKET FORECAST 2004-2023
Aircraft replacement
Aircraft replacement is accelerating
Airlines will need to acquire aircraft not only to accommodate
traffic growth, but also to replace their older, noisier and less
efficient aircraft, as their age increases, utilisation falls and
maintenance costs rise.
The replaced aircraft will be either recycled into the active fleet
with another airline or retired from passenger service, to be either
definitively withdrawn from use or converted to freighters.
The Airbus forecast is based on each individual airlines actual
fleet replacement plans. If an airline plan is not available, a default
replacement age is used based on a thorough analysis of
the aircraft replacement behaviour of the airline and the region
in which it is based. This varies from 20 years for airlines
in Asia-Pacific or the People’s Republic of China, to 27 years for
airlines in Eastern Europe.
Aircraft replacement is largely driven by historical patterns of
aircraft delivery, and tends to take place in a series of “waves”,
which can also be influenced by economic cycles and product
developments. Fuel prices have historically triggered or
accelerated aircraft retirements. The capacity shortfall of the late
90s prevented normal attrition, resulting in a wave of retirements
starting in 2002, further exacerbated by the 2001/2002 slowdown
in traffic.
Airlines willcontinue
to replacepassenger aircraft
before the endof their
economic life
Aircraft replacement
REPLACEMENT(Passenger & combi aircraft released by an airline)
RETIRED(leaving passenger or combi services)
RECYCLED(resuming passenger service within another airline)
Converted into freighter
Withdrawn from use
Default replacement ages by region
30
25
20
15
10
5
0
Default replacement age (years)
EasternEurope
WesternEurope
NorthAmerica
Asia-Pacific
IndianSubcontinent
P.R.China
Africa MiddleEast
Latin America& Caribbean

GLOBAL MARKET FORECAST 2004-2023 I 39
In recent years, market conditions, including depressed traffic
and yields, the effects of aircraft noise legislation, combined with
increased competition, have driven the need for ever more efficient
operations and aircraft. Retirements have not only come from old-
generation aircraft, but now include numbers of mid-generation,
single-aisle aircraft such as MD80s and 737-300/400s. A trend
further stimulated as airlines seek additional efficiencies, through
the rationalisation of fleet types, with some of these out of
production “orphan” types, obvious candidates for replacement.
As a result of these retirements, combined with the growing
importance of the low cost airlines, whose business model today
is largely based on operating efficient new aircraft, the single-aisle
fleet has become younger. However there are still some 5,500
mid-generation aircraft in service worldwide that will need to be
replaced, many over the forecast period.
Over the next 20 years, 9,200 of today’s aircraft will be replaced.
Of these, 3,520 will be “recycled” back into passenger service
through sale, lease or lease extension. The remaining 5,680 will
be replaced by new aircraft and will leave passenger service,
either to be scrapped, converted into freighters or to other non-
airline roles.
Converted & withdrawn passenger aircraft
2,000
4,000
6,000
0
2004-20231984-2003
2,179
1,176
3,268
2,412
Definitively withdrawn from useConverted to freighters
Number of aircraft
Higher fuelprices triggerretirements

DEMAND FOR PASSENGER AIRCRAFT
40 I GLOBAL MARKET FORECAST 2004-2023
The return of stored aircraft, the high traffic growth of 2004 and
2005, combined with the lack of available new single-aisle aircraft
slots from manufacturers and leasing companies, will contribute
to relatively low aircraft replacement in 2004 and 2005. However,
high fuel prices, the effective withdrawal from use of many stored
aircraft, a desire by airlines to further reduce costs through
operation of new-generation aircraft and a pent-up need to retire
aircraft from the US network airlines, will all contribute to an
acceleration of aircraft retirement thereafter.
Based on the announced fleet replacement plans of airlines
throughout the world, we expect the next wave of single-aisles
replacement to start in 2006 with its peak in 2007/2009. This will
coincide with the replacement of the last delivered old-generation
aircraft, largely driven by North American aircraft, and the less
efficient mid-generation aircraft delivered during the early years
of the mid 1980s delivery upswing.
The GMF’s annual replacement forecast for European airlines, has
clearly-defined “peaks” in 2007, 2013 and 2021/22, exhibiting a
classic “wave” pattern, which implies that the region’s airlines will
behave in a more or less homogeneous manner.
In contrast, the forecast for the North American airlines suggests
more heterogeneous behaviour, and will be largely driven by the
replacement decisions and network strategies of the major US
network carriers, involving mostly single-aisle types.
In Asia-Pacific, the mix will be more even between single-aisle
and twin-aisle aircraft, with 43% over the period being wide-body
replacements. As in Europe, more distinct peaks in replacement
activity are expected.
Airbus forecasters predict that by 2023 only 15% of the current
active fleet will still be in service with their current operators.
Only
15%of aircraft willremain with
currentoperators
Jet aircraft delivery cycles influence retirements
1,000
800
900
700
600
500
400
300
200
100
0
New aircraft deliveries
04E030201009998979695949392919089888786858483828180797877767574

GLOBAL MARKET FORECAST 2004-2023 I 41
Europe and Asia-Pacific aheadof North America by 2023
The fleets in Asia and the Middle Eastwill grow more
At the end of 2003, the airlines in the GMF were operating some
10,838 passenger jets with 100 seats or more. With an average
of 181 seats per aircraft, this provided a little more than 1.9 million
installed seats. By 2023, the number of aircraft will double, while
the number of installed seats will reach 4.7 million.
These numbers represent global average rates of growth of 3.5%
per year in numbers of aircraft and 4.4% per year in installed
seats. The airlines domiciled in the different regions show
considerable variation around these world averages. High traffic
growth on routes to, from and within the region will drive the
dynamic Asia-Pacific airlines to achieve the most rapid increase
in both average seat capacity and installed seats. The most rapid
increase in fleet size will be achieved by airlines in the Middle
East. In contrast the airlines of North America, with their high
exposure to the mature US domestic market, will have the
slowest growth in installed seats.
Consequently the North American airlines will progressively lose
their dominance. By 2023, they will be operating fewer seats than
the airlines of Europe or Asia-Pacific.
High aircraft size and fleet growth in Asia-Pacificand the Middle East
2 1 0 1 2 3 4 5
Average annual growth (%)
Avg. a/c size Number of aircraft in service
3.5
3.5
4.5
3.0
2.4
4.5
4.3
0.9
0.7
0.6
0.9
1.1
1.0
0.5
World capacity 4.4%
Latin america & Caribbean 4.4%
Asia-Pacific 5.6%
Africa 3.7%
North America 3.0%
Middle East 5.5%
Europe 4.8%
Airlines in Europe & Asia-Pacificwill operate more seats than in North America
Europe 29%
Asia-Pacific 33%
World total at end 2023
4.69 million seats
World total at end 2003
1.96 million seats
Europe 27%
Asia-Pacific 26%
North America26%
North America 34%
Rest of world 12%
Rest of world 13%

DEMAND FOR PASSENGER AIRCRAFT
42 I GLOBAL MARKET FORECAST 2004-2023
Twin-aisle and large aircraft takea bigger role
As an inevitable response to intensifying cost pressures,
infrastructure capacity constraints and fast growing international
markets, the composition of the world fleet will shift towards
larger aircraft. By 2023 mainline single-aisles will make up 69%
of the fleet, compared with 77% in 2003. At the same time very
large aircraft will account for 6% of the world passenger fleet;
approximately the same percentage as represented by 747s today.
The role played by very large aircraft is more clearly seen in terms
of capacity. By 2023, these aircraft will provide 15% of all seats
in service.
By 2023,
15%of seats will be
provided by largeaircraft
More twin-aisles
World total at end 2023
21,759 aircraft
World total at end 2003
10,838 aircraft
Small twin-aisle
9%
Small twin-aisle
10%
Mainline single-aisle69%
Mainline single-aisle 77%
Intermediate twin-aisle
15%
Large 6%
Large < 1%
Intermediate twin-aisle
14%
Very large aircraft will provide a significant shareof world airline capacity
World total at end 2023
4.69 million seats
World total at end 2003
1.96 million seats
Small twin-aisle
12%
Small twin-aisle
12%
Mainline single-aisle50%
Mainline single-aisle 62% Intermediate
twin-aisle 23%
Large 15%
Large 1%
Intermediate twin-aisle
25%

GLOBAL MARKET FORECAST 2004-2023 I 43
Europe, more aircraftdelivered – Asia, more seats
16,600 new aircraft will be delivered
During 2004-2023, to accommodate traffic growth and renew
their fleets, the world’s major airlines will require delivery of a total
of 20,121 passenger jets with 100 seats or more.
Of these deliveries, 3,520 represent demand that will be satisfied
by aircraft replaced by their current operator and recycled back
into the fleet of another airline. The remaining 16,601 will be new
aircraft, an average of 830 deliveries per year.
Two thirds of the new aircraft delivered will be for growth and one
third for fleet renewal.
Of the 5,680 aircraft replaced, 2,412 will be converted to
freighters (see freighter section) and 3,268 will be definitively
withdrawn from airline service.
The new aircraft will include:
• 10,900 mainline single-aisle aircraft, like the Airbus A320 Family;
• 1,800 small twin-aisle aircraft, like the A300, A310 and A330-200;
• 2,650 intermediate twin-aisle aircraft, including the A330/A340 Family;
• 1,250 very large aircraft, today the A380.
Total demand will be met by 16,601 newand 3,520 recycled aircraft
5,000
10,000
15,000
20,000
25,000
0
Fleet size
20232003
10,838
+3.5% per annum 21,759
3,520
1,638
10,92116,601 new aircraft
5,680
Recycled GrowthReplacedStay
}
More than 16,600 new passenger aircraft deliveries
4,000
6,000
8,000
12,000
10,000
2,000
0
Mainline single-aisle
Small twin-aisle
Intermediate twin-aisle
Large aircraft
10,902
1,250
2,650
398
1,799
Total demandwill be met by
16,600 newand 3,520
recycled aircraft

DEMAND FOR PASSENGER AIRCRAFT
44 I GLOBAL MARKET FORECAST 2004-2023
Large aircraft demand will driveAsia-Pacific seat growth
European airlines will constitute the largest single regional market
in terms of numbers of aircraft delivered during the next twenty
years, but the Asia-Pacific airlines greater appetite for very large
A380-type aircraft means that they will account for the largest
share of seats delivered.
With the already well developed demand for short to medium
range operations in the US and Europe, the need for a greater
proportion of single-aisle deliveries is evident. In the Asia-Pacific
region, with its relatively few, and regionally dispersed centres of
population, a greater proportion of larger, longer range aircraft will
be delivered to meet the regions needs. Although the emerging
low cost airlines of Asia will drive the expansion of the single-aisle
fleet in the region.
Meanwhile, in the Middle East, the domiciled airlines geographical
advantage and new competitive strategies will largely drive
demand for an even greater proportion of these aircraft.
Most deliveries to Europe, most seats to Asia-Pacific A greater proportion of twin-aisles will be neededin Asia-Pacific and the Middle East
100
80
90
70
60
50
40
30
20
10
0
Aircraft delivered (%)
Europe North America Asia-Pacific Latin America Middle East Africa
Single-aisle Intermediate twin-aisleSmall twin-aisle Large aircraft
3.8 million new seats delivered
2004-2023
16,601 new passenger aircraft deliveries
2004-2023
Asia-Pacific 27%
Asia-Pacific 35%
North America23%
Europe 30%
Europe 32%
North America 28%
Latin America & Carribbean
5%
Middle East 4%
Africa 3%
Middle East 4%
Africa 3%
Latin America & Carribbean
6%
Includes recycled aircraft.

GLOBAL MARKET FORECAST 2004-2023 I 45
Single-aisles
A fleet of 15,100 aircraft will beneeded
By 2023, the world’s major airlines will need 13,800 single-aisle
passenger aircraft to accommodate traffic growth and renew their
fleets. Of these, some 2,900 will be provided by aircraft recycled
back into the fleet after being replaced by their current operator.
The demand for mainline single-aisle aircraft will be largely
focused in North America and Europe, although deliveries
to the Asia-Pacific region with its growing low cost presence will
total 2,650 deliveries, or 19% of total worldwide single-aisle
deliveries. Latin America, the Middle East and Africa will between
them take a significant 12% of deliveries.
10,902new single-aisles
needed
The fleet will grow to more than 15,000 aircraft
2,000
6,000
4,000
10,000
8,000
14,000
12,000
16,000
0
Fleet size
20232003
8,347
+3.0% per annum15,111
2,897
1,312
6,764
10,902 new aircraft
4,138
Recycled GrowthReplacedStay
}Mainline single-aisle passenger demandconcentrated in North America and Europe
Single-aisles demand
1,000
1,500
2,000
2,500
3,000
3,500
500
0
210175150125100
834
2,463
2,023
3,123
2,459
Number of new aircraft
Seat size
Latin America
743 252 7%
2004-2013 2014-2023 % of worlddeliveries
Middle East
121 128 2%
2004-2013 2014-2023 % of worlddeliveries
Africa
303 138 3%
2004-2013 2014-2023 % of worlddeliveries
Asia-Pacific
1,787 863 19%
2004-2013 2014-2023 % of worlddeliveries
Europe
2,630 2,051 34%
2004-2013 2014-2023 % of worlddeliveries
North America
2,678 2,105 35%
2004-2013 2014-2023 % of worlddeliveries

DEMAND FOR PASSENGER AIRCRAFT
46 I GLOBAL MARKET FORECAST 2004-2023
Single-Aisles, the industry workhorse
By 2023, the active fleet of 15,111 mainline single-aisles will be
operating at 1,502 airports, linking 8,290 airport-pairs.
Unsurprisingly operations will be largely focused on domestic US
routes; all of the Top 10 airports served by these aircraft
(measured in terms of aircraft utilisation), except Roissy-Charles-
de-Gaulle in France, will be in the US. 12% of the world’s single-
aisle fleet will be operated at these Top 10 airports by 2023.
Compared with the total world fleet, the use of single-aisles will be
relatively dispersed. Flights from the Top 25 airports, led by Atlanta
and Chicago O’Hare, will absorb the productive capacity of just
24% of the aircraft, and 50% of the single-aisle fleet will be used
on flights from the Top 88 airports.
9 out of the Top 10single-aisleairports are
in the US
Mainline single-aisle operations will be concentratedon US domestic routes
6 LAS (171)
3 PHX (215)
5 LAX (184)
4 DFW (200)
7 DEN (158)
8 IAH (149)
1 ATL (236) Rank
(n° of a/c)
2 ORD (230)
10 MSP (144)
9 CDG (146)
In 2023, 12% of the world mainline single-aisle fleet will be used on flights from just the Top 10 airports.
In 2023, mainline single-aisles will be largely flownon short routes…
25%
20%
15%
10%
5%
0%
Percent of aircraft operated at range
Range band (200 nm steps)
2023
200 2,200 4,200

GLOBAL MARKET FORECAST 2004-2023 I 47
Single-aisle aircraft will be flown overwhelmingly on short flights;
by 2023, 47% of the aircraft will be used on flights of less than
600 nm, equivalent to Paris to Rome.
By 2023, 32 North American airlines will each be operating
an average of 178 mainline single-aisles, compared with 110
European airlines operating an average of 45 aircraft each.
Asian low costairlines to drive
single-aislesdemand in Asia
… with 38% flown by airlines in North America
15,111 aircraft291 airlines
Asia-Pacific 21%
Asia-Pacific 18%
North America38%
Europe 32%
Europe 38%
North America 11%
Latin America & Caribbean
7%
Middle East 2%
Africa 3%
Middle East 5%
Africa 12%
Latin America & Caribbean
13%
GMF mainline single-aisle fleet in 2023.
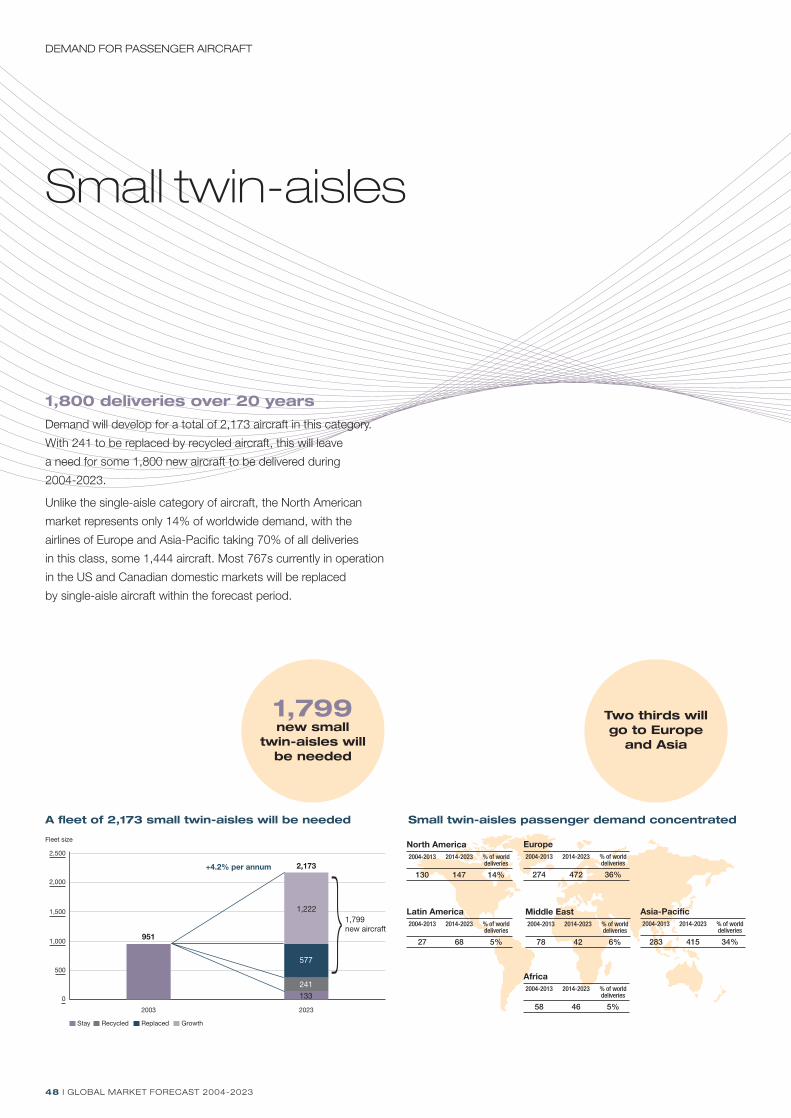
DEMAND FOR PASSENGER AIRCRAFT
48 I GLOBAL MARKET FORECAST 2004-2023
Small twin-aisles
1,800 deliveries over 20 years
Demand will develop for a total of 2,173 aircraft in this category.
With 241 to be replaced by recycled aircraft, this will leave
a need for some 1,800 new aircraft to be delivered during
2004-2023.
Unlike the single-aisle category of aircraft, the North American
market represents only 14% of worldwide demand, with the
airlines of Europe and Asia-Pacific taking 70% of all deliveries
in this class, some 1,444 aircraft. Most 767s currently in operation
in the US and Canadian domestic markets will be replaced
by single-aisle aircraft within the forecast period.
Two thirds willgo to Europe
and Asia
1,799new small
twin-aisles willbe needed
A fleet of 2,173 small twin-aisles will be needed
1,000
500
1,500
2,000
2,500
0
Fleet size
20232003
951
+4.2% per annum 2,173
241133
1,2221,799 new aircraft
577
Recycled GrowthReplacedStay
}Small twin-aisles passenger demand concentrated
Latin America
27 68 5%
2004-2013 2014-2023 % of worlddeliveries
Middle East
78 42 6%
2004-2013 2014-2023 % of worlddeliveries
Africa
58 46 5%
2004-2013 2014-2023 % of worlddeliveries
Asia-Pacific
283 415 34%
2004-2013 2014-2023 % of worlddeliveries
Europe
274 472 36%
2004-2013 2014-2023 % of worlddeliveries
North America
130 147 14%
2004-2013 2014-2023 % of worlddeliveries

GLOBAL MARKET FORECAST 2004-2023 I 49
Europe will be an important market
By 2023, the active fleet of 2,173 small twin-aisle aircraft will be
operating at 592 airports, linking a total of 2,497 airport-pairs.
Small twin-aisles operating today in the US domestic market will
to a great extent be replaced by large single-aisle types over
the next decade. The Top 10 airports include five in Europe, three
in the US as well as Kuala Lumpur and Beijing in Asia featuring
prominently.
As a measure of concentration, flights from the Top 25 airports
will use the productive capacity of 35% of the fleet, and 50%
of the fleet will be used on flights from the Top 47 airports, led
by Paris Roissy-Charles-de-Gaulle and Frankfurt
European airlines will constitute the largest single regional
market for these aircraft, with 46 airlines operating an average
of 16 aircraft each. Fifteen North American operators, however,
will have a larger average fleet of 24 aircraft each.
NorthAmerica
to replace mostsmall domestictwin-aisles with
single-aisles
Operations of small twin-aisle aircraft will mainly bein the US & Europe…
6 KUL (33)
9 PEK (28)
7 LAX (30)
10 ATL (28)
8 JFK (30)
3 LHR (45)
1 CDG (59)
5 MAD (34)
2 FRA (49)
Rank (n° of a/c)
4 FCO (35)
… with European airlines the main users
2,173 aircraft142 airlines
Asia-Pacific 26%
North America 17%
Asia-Pacific 32%
Europe 32%
Europe35%
North America 11%
Latin America & Caribbean
4%
Middle East 7%
Africa 5%
Middle East 6%
Africa 15%
Latin America & Caribbean
10%
GMF small twin-aisle fleet in 2023.

DEMAND FOR PASSENGER AIRCRAFT
50 I GLOBAL MARKET FORECAST 2004-2023
Intermediate twin-aisles
300-seater deliveries are 50%of twin-aisle demand
The world’s major airlines will need a total of 3,020 aircraft in this
category; a market segment covered by the A330-300 and the
A340 Family. 2,650 of these aircraft will be new, leaving 370 to be
satisfied by recycled aircraft. Almost half of the new aircraft will be
300-seaters, with the remainder split between 350-seaters and
400-seaters.
With the distances and type of operations involved in the region,
Asia-Pacific will need the bulk of the aircraft to be delivered in this
category, 1,393 aircraft representing 46% of all deliveries. Europe
will take 723 aircraft or 24% and the growing Middle Eastern
market 8%.
2,650new
intermediatetwin-aisles
needed
2,650 new intermediate twin-aisles needed
1,500
1,000
500
2,500
2,000
3,000
3,500
0
Fleet size
20232003
1,510
+3.8% per annum3,213
370193
1,7032,650 new aircraft
947
Recycled GrowthReplacedStay
}300-seaters, the most significant demand
400
600
800
1,000
1,200
1,400
200
0
400350300
533
797
1,320
Number of new aircraft
Seat category

GLOBAL MARKET FORECAST 2004-2023 I 51
Operations concentrated in Europeand Asia-Pacific
By 2023, the active fleet of 3,213 intermediate twin-aisles will be
operating at 498 airports, linking a total of 2,087 airport-pairs.
Operations will be spread globally, with only a small proportion
of flights on US domestic routes. Of the Top 10 airports served, six
will be in the Asia-Pacific region, and the remaining four in Europe.
3,213aircraft operated
by 132 airlinesby 2023
Intermediate twin-aisle operations will beconcentrated largely in Asia-Pacific & Europe
9 AMS (57)
3 CDG (84)
1 LHR (105)
5 FRA (79)
6 SIN (72)
8 BKK (65)
2 PEK (87)
4 NRT (81)
7 HKG (65)
Rank (n° of a/c)
10 SYD (55)
Intermediate twin-aisle demand by region
Latin America
40 90 4%
2004-2013 2014-2023 % of worlddeliveries
Middle East
140 98 8%
2004-2013 2014-2023 % of worlddeliveries
Africa
43 36 3%
2004-2013 2014-2023 % of worlddeliveries
Asia-Pacific
629 764 46%
2004-2013 2014-2023 % of worlddeliveries
Europe
271 452 24%
2004-2013 2014-2023 % of worlddeliveries
North America
228 229 15%
2004-2013 2014-2023 % of worlddeliveries

DEMAND FOR PASSENGER AIRCRAFT
52 I GLOBAL MARKET FORECAST 2004-2023
Compared with the world fleet as a whole, operation of
intermediate twin-aisles will be relatively concentrated – led by
London Heathrow and Beijing airports. Half the aircraft will be
used on flights from the Top 28 airports.
The deployment of the intermediate twin-aisle fleet shows a similar
pattern to that of the smaller twin-aisle aircraft, but with
a substantially greater use on long-range routes. Half the fleet will
be used on flights of no more than 2,200 nm (roughly equivalent
to Perth to Singapore), but more than a quarter will be used on
flights over 4,000 nm (roughly equivalent to Hong Kong to Sydney).
The 37 Asia-Pacific operators will constitute the largest single
regional market, with an average of 38 aircraft each.
Asia-Pacific will be the largest market
3,213 aircraft 132 airlines
Asia-Pacific 28%
North America 18%
Asia-Pacific 43%
Europe 34%
Europe24%
North America 11%
Latin America & Caribbean
4%
Middle East 8%
Africa 3%
Middle East 8%
Africa 9%
Latin America & Caribbean
10%
GMF intermediate twin-aisle fleet in 2023.
67%of intermediate
twin-aisle demandwill be in Asiaand Europe

GLOBAL MARKET FORECAST 2004-2023 I 53
Large aircraft
Demand for 1,250 large passengeraircraft
By 2023, in order to maximise the profit potential of operations
in an environment characterised by continuing severe price
competition and increasingly stringent infrastructure and
environmental constraints, major airlines will need 1,250 very large
and economical aircraft like the A380.
64% of the new large aircraft delivered will be in the 500- and
600-seater categories. The remaining 36% of demand will be
satisfied by some 240 450-seaters. The average capacity of all
deliveries will be 575 seats.
Regional demand for very large passenger aircraft, including
the existing backlog of 112 passenger A380s, will be centred
in the Asia-Pacific region, with 774 aircraft or 62% of world’s
demand. Europe’s airlines will need 20% of these aircraft to meet
growing demand to the Asia-Pacific region, with North America
and the Middle East taking 17% or 215 aircraft between them.
1,250 new large passenger aircraft will be needed
800
600
400
200
1,000
1,200
1,400
0
Fleet size
20232003
30
1,262
120
1,232
1,250 new aircraft
18
Recycled GrowthReplacedStay
}80% of demand will be 500 seats or above
200
300
400
500
600
100
0
1,000800600500450
239
45
166
283
517
Number of new aircraft
Seat category
Large aircraft passenger demand concentrated
Latin America
0 3 <1%
2004-2013 2014-2023 % of worlddeliveries
Middle East
57 31 7%
2004-2013 2014-2023 % of worlddeliveries
Africa
7 10 1%
2004-2013 2014-2023 % of worlddeliveries
Asia-Pacific
229 545 62%
2004-2013 2014-2023 % of worlddeliveries
Europe
115 138 20%
2004-2013 2014-2023 % of worlddeliveries
North America
12 115 10%
2004-2013 2014-2023 % of worlddeliveries

DEMAND FOR PASSENGER AIRCRAFT
54 I GLOBAL MARKET FORECAST 2004-2023
52% of the aircraft to be centredon ten airports
By 2023, these large aircraft will be serving 213 airports, linking
513 airport-pairs.
As well as operating on a diverse set of markets, large aircraft
such as the A380 are expected to operate to many of the airports
which operate the 747. Today, 69% of 747s are operated to the
Top 20 airports. Similarly, we anticipate that flights from just these
Top 20 airports will use the productive capacity of 945 aircraft,
or 75% of the 2023 fleet of large aircraft. London, Tokyo and
Hong Kong will require 308 large aircraft. Although Los Angeles is
the only North American city within the Top 10, San Francisco
New York and Chicago will use the productive capacity of 120
large aircraft. This is already confirmed by the announced routes
of the current A380 customers.
In 2023,
75%of the world’s fleetof 1,262 very largeaircraft will be usedon flights from just
the Top 20airports
12 of the Top 20 large aircraft airportswill be in Asia-Pacific
1 LHR (117)
10 FRA (37)
14 CDG (34)
20 KUL (15)
4 SIN (64)
6 DXB (51)
5 BKK (51)
7 PEK (50)
2 NRT (109)
10 PVG (41)
3 HKG (82)
12 TPE (35)
13 HND (34)
8 ICN (49)
18 KIX (18)
15 SYD (34)
17 SFO (28)
9 LAX (47)
Rank (n° of a/c)
19 ORD (16)
16 JFK (30)
In 2023, 75% of the world’s fleet of 1,262 very large aircraft will be used on flights from just the Top 20 airports.
Announced routes by current A380 customers in 2008

GLOBAL MARKET FORECAST 2004-2023 I 55
The very large aircraft will be used on the complete range of domestic,
local, regional and intercontinental routes. Nearly one third of the
fleet will be used on routes of up to 1,200 nm, equivalent to Sapporo
to Okinawa. At the top end, one third of the fleet will be used on
flights over 4,800 nm (roughly equivalent to Paris to Los Angeles).
With many of the top routes being centred in the region, it is
therefore understandable that most of the airlines and aircraft
deliveries in this category will be made to the Asia-Pacific region.
However with the strength of traffic between Europe and Asia,
and demand on some Trans-Pacific routes for example, other
regions’ airlines will take a significant share of large aircraft
deliveries over the next 20 years.
Asia-Pacific will dominate demand
1,262 aircraft44 airlines
Asia-Pacific 53%
North America 10%
Asia-Pacific 62%
Europe 20%
Europe20%
North America 9%
Latin America & Caribbean
<1%
Middle East 7%
Africa 1%
Middle East 11%
Africa 5%
Latin America & Caribbean
2%
GMF very large aircraft fleet in 2023.
Eight of the Top 10 large aircraft routes will serve Asia
19 (495)
25 (683)
21 (571) 20 (891)
16 (814)
18 (601)
18 (631)16 (699)
15 (779)
16 (711)
HNL
LAX
TPEHKG
SIN
HND
NRTCTS
LHR
ORD
JFK
Number of aircraft (avg. seats)
In 2023,the Top 10 airport-pairs alone will use
184 out of
1,262 verylarge aircraft

56 I

I 57
Air cargo forecast
More than 3,100freighters needed.
Large demand for new large freighters.
Global Market Forecast 2004-2023

AIR CARGO FORECAST
58 I GLOBAL MARKET FORECAST 2004-2023
Freight goes fromstrength to strength
Hi-tech exports drive growth
Cargo traffic has fully recovered from the 2001 and 2003
disruptions without any lingering effects. The underlying positive
fundamentals, such as the development of traffic from Asia, have
quickly reasserted themselves, with full year 2004 traffic forecast
to be 12% above 2000 levels.
Strong demand has kept cargo yields up and has translated into
solid operating profits for most integrators and the dedicated
freight divisions of major airlines.
Airbus forecasts freight traffic for 145 individual domestic and
international flows on the basis of historical traffic, economic data
and bi-directional country-to-country trade statistics.
The analysis of the type of goods exchanged (sub-segments
of high-tech, consumer goods, food, perishable goods, etc.)
is critical to traffic development, as the time sensitivity and the
value of goods influence the shippers’ selection of the appropriate
transport mode: road, rail, sea or air.
The export of more time sensitive, high-value and high-tech
goods, has grown fastest among globally traded commodities,
largely contributing to the growth of air freight and explaining
the fact that it has grown faster than global trade. For example,
although high-tech goods from Asia to North America and Europe
represent 40% of total exports in tonnage, they also account for
nearly 75% in value. High-tech exports from China to Europe and
North America transported by air have grown steadily from a 25%
share in value in 1995, to 60% of today’s total.
High-tech goodsaccount for
75%of Asian air freight
by value
500,000
400,000
300,000
200,000
100,000
0
Tonnes
20031995
+ 4.4% per annum
OtherPrimaryIntermediateHigh TechFoodConsumerCapital
500
100
150
200
300
350
400
450
250
50
0
FTKs (billions)
2322212019181716151413121110090807060504030201009998979695
International Domestic
5.9%
History Forecast
4.4%
Cargo traffic development Air freight intra-Asia by commodity/volume
Source: MGI.

GLOBAL MARKET FORECAST 2004-2023 I 59
Due to the often bulky, but necessarily secure packaging
employed on high-tech goods, and the growth in the exports
of these articles, the average density of freight being carried
by air has been reduced. This makes cargo aircraft with good
volumetric payload particularly attractive.
Large freighters, such as the A380F, can not only provide the
volumetric payload necessary, but also stimulate traffic by lowering
the cost per tonne threshold below which other modes are more
economical.
On long-haul routes, the extended range capability of large
freighters, such as the A380F, provides the ability to fly over
previously necessary technical stops, thereby saving time
and allowing next-day delivery of high yield express packages
to a wider market base or territory, thus increasing revenues.
Air freight intra-Asia by commodity/value Top 20 freight markets in 2023
80,000,000
70,000,000
50,000,000
60,000,000
30,000,000
40,000,000
20,000,000
10,000,000
0
1,000 US$
20031995
+ 7% per annum
OtherPrimaryIntermediateHigh TechFoodConsumerCapital
Domestic USPRC – North AmericaAsia – North America
Europe – North AmericaNorth America – Europe
Asia – EuropeDomestic PRC
North America – AsiaPRC – EuropeEurope – AsiaEurope – PRC
Japan – North AmericaNorth America – Japan
North America – PRCEurope – JapanJapan – Europe
South America – North AmericaAfrica – Europe
Europe – South AmericaSouth America – Europe
2003 traffic 2004-2023 growth
100 20 30 40 50
2004-2023FTKs (billions)
4.2% 7.7% 6.2% 4.8% 5.0% 6.4%
10.1% 5.9% 7.1% 6.2% 7.8% 6.1% 5.9% 7.4% 5.2% 5.9% 5.3% 6.2% 6.1% 4.7%
% of 2023 World FTKs
11.3% 7.9% 7.0% 5.5% 4.2% 4.2% 4.2% 3.5% 3.5% 3.4% 3.1% 2.4% 2.4% 2.2% 2.2% 2.0% 1.7% 1.7% 1.4% 1.3%
Source: MGI.
Domestic PRCfreight traffic
to grow at
10.1%per annum
Share of 2023 freight traffic
11.5% (+4.3%)
10.2% (+7.3%)
0.5% (+5.0%)
(FTKs growth: average per annum 2003-2023)
Other flows: 9.9%
9.8% (+4.9%)
26.2% (+6.5%)2.8%(+5.5%
)
2.7%(+5.7%
)3.6%
(+5.
3%)
3.0%(+5.6%
)
19.8% (+6.3%)

AIR CARGO FORECAST
60 I GLOBAL MARKET FORECAST 2004-2023
20-year freight growth
Higher growth than the passengermarket
Airbus forecasts that air freight expressed in terms of freight-
tonne kilometres (FTK) will grow at a 5.9% average annual rate
over the 2004-2023 period.
The US domestic market, still the largest with a 15.4% share
of world FTKs, is also the most mature. It will nevertheless grow
at a sustained 4.3% rate per year, remaining the largest market
in 2023, with an 11.5% share of world’s FTKs.
Traffic flows from Asia are expected to continue to grow
the quickest, with traffic from China to USA and Europe leading
average annual growth in excess of 7% over the next 20 years.
By 2023, traffic from China to North America and from Asia to
North America will have surpassed today’s second largest freight
market of Europe to North America. Domestic Chinese traffic will
increase eightfold over the next 20 years, from 2.7 billion FTKs,
to 16 billion FTKs.
The North American domestic market is currently served by a fleet
of 770 freighters, compared with less than 7 dedicated freighters
utilised in the Chinese domestic market, with the majority of air
freight carried below deck on scheduled passenger services.
China’s export and import of goods and services account for 75%
of their GDP. The growth of the domestic consumer market in
emerging countries such as China, India, Brazil and Russia
is boosting trade, not only in Europe and North America but
worldwide. For example, all of the Australian 2003 increase
in exports went to China, as did 45% of South Korean exports.
5.9%growth inair freight
traffic
Airbus freighter segmentation
Payload Aircraft Future deliveriestypes payload
Small jet < 30 tonnes BAe 146s, DC-9s, 22 tonnesfreighters 737s, 727s, Tu-204
Regional 30-60 tonnes 707s, DC-8s, 757s, 45 tonnesfreighters 767-200s, A300s,
A310s, DC-10-10s,L-1011s
Long-range 30-80 tonnes DC-10-30/40s, 60 tonnesfreighters 767-300s, 747 Combis,
MD-11 Combis
Large > 80 tonnes MD-11s, 747s, 120 tonnesfreighters A380s

GLOBAL MARKET FORECAST 2004-2023 I 61
Stimulated demandfor dedicated freighters
Dedicated freighter shareto increase
Usage of available under-floor volume in passenger aircraft will
remain an economic way of serving new or low-demand traffic
flows. However, due to the different growth rates of passenger
and freight traffic, the volume available for freight on a given route
is bound to become insufficient. This adds to the fundamental
appeal of dedicated freighters in terms of routes, schedule,
seasonality and service, which cannot be matched by passenger
aircraft under-floor areas.
Thus, the share of belly traffic is expected to reduce by 7% during
the forecast period.
1,500 active freighters worldwide
Today’s active world freight aircraft fleet consists of 1,415
dedicated freight aircraft and 91 Quick-Change or Combi aircraft.
As much as 65% of the installed fleet is operated by North
American carriers.
Of the 1,506 aircraft in service, 808 were converted from
passenger service and 698 are factory-built freighters.
Conversion rates have varied in the past, showing the adaptability
of conversion centres in meeting this fluctuating demand; we
expect that this flexibility will remain in future, in order to satisfy
operator and owner needs.
Passenger aircraft role in air freight to decrease
500
400
300
200
100
0
FTKs (billion)
20232003
442.7
141.1
59%
41%
66%
34%
Belly holds +4.8% p.a. Dedicaded freighters 6.5% p.a.
Total Cargo +5.9% p.a.
65% of current fleet in North America
Small Regional Long- Large TotalRange
North America 377 393 66 144 980
Europe 62 80 18 70 230
Asia-Pacific 25 2 27 119 173
Middle East/Indian Sub. 4 3 4 7 18
Latin America 38 16 13 0 67
Africa 9 16 9 4 38
Total 515 510 137 344 1,506

AIR CARGO FORECAST
62 I GLOBAL MARKET FORECAST 2004-2023
Two thirds retired by 2023
Freight carriers will not only need to expand their fleet in order
to accommodate the sustained demand for air cargo, but also
to replace an increasingly aged fleet.
In the absence of announced retirement plans, the GMF assumes
that freighters are kept in service to the limit of their economic life,
taken as 37 years for small jets and 35 years for other types.
This retirement takes no account of possible more stringent noise
regulations beyond those in place today. The imposition of such
environmental regulations would be likely to hasten retirements,
thus increasing demand for freighters over and above our estimates.
Over the next 20 years, a total of 1,029 freighter aircraft are
expected to be withdrawn from active service. Attrition will be
highest in the small freighter category, of which 73% are operating
in North America. At an average of 27 years, the small freighters,
notably the 727F, are the oldest of all types, and are each
operated less than 2h30mn per day. In comparison, the large
freighters have an average age of 14 years and are operated
10h30mn per day.
Over the next20 years, a total
of 1,029freighter aircraft
are expected to bewithdrawn fromactive service
40
60
80
120
100
20
01984 1987 1990 1993 1996 1999 2002
Number of jets converted
LargeLong-rangeRegionalSmall jets
Passenger to freighter conversions
120
100
80
60
40
20
0
Aircraft retired
2322212019181716151413121110090807060504
Large freightersLong-range freightersRegional freightersSmall jet freighters
New replacement cycle starting
1,600
1,000
1,200
1,400
800
600
400
200
0
Aircraft in service
20232003
1,506
510
515
344
137
477
17254
20744
Regional Long-range LargeSmall jets
Two thirds of the current fleet will retire

GLOBAL MARKET FORECAST 2004-2023 I 63
Significant future demand
Freighter fleet to grow 2.4 times
The 253% increase in traffic carried by dedicated freighters over
20 years will be achieved through a combination of more large
aircraft, higher utilisation and higher load factors.
The freighter fleet is estimated to grow by 140%, with average
aircraft payload going up 18%, from 50.7 tonnes to 60 tonnes.
This average payload increase is due in part to the size of types
used, including the A380F, but also to the faster growth
of the networks on which they are used.
Beyond the aircraft themselves, we expect that operators will
manage to fly their aircraft more hours each year and will also be
able to modestly increase load factors. These two elements are
expected to contribute another 24% to the FTK increase.
The current active cargo fleet of 1,506 jet aircraft is expected
to grow to 3,616 by 2023. Of the 3,139 deliveries, 727 units,
or 23%, will be new factory-built freighters, while 2,412 will be
converted freighters. New-built deliveries are valued at 129 billion
US dollars (2004).
The North American fleet will still be the largest in terms of aircraft
and FTKs generated. The Asian dedicated freighter fleet will
increase by 419 units, or 3.4 times, over the next 20 years.
4,000
2,500
3,000
3,500
2,000
1,500
1,000
500
0
Number of aircraft
20232003
1,506
3,616
2,412
477
727
Conversions New freightersRetained in service
+4.3% p.a.
The world freighter fleet will more than double

AIR CARGO FORECAST
64 I GLOBAL MARKET FORECAST 2004-2023
Large demandfor new large freighters
Small jet freighters
As these aircraft are largely deployed on the mature US domestic
market, we expect the small jet freighter fleet to exhibit the
smallest growth of all segments. Most of the replacements will be
needed in the North American market, while of the 458 aircraft
required for growth, almost 20% will be needed in the Asia-Pacific
region.
The mix of converted and new aircraft has been analysed on the
basis of their known or expected economics, for each operator
and each operation. Given the low utilisation of small freighters,
and the expected large supply of suitable single-aisle aircraft
in the future, including a possible A320 passenger-to-freighter
conversion, the GMF does not anticipate a need for new-built
freighters in this segment. This is a very different situation to that
seen in the 70s and 80s, when operators had no choice but
acquire new freighters.
Mixed passenger/cargo operations with Quick Change or Combi
aircraft have sometimes justified the purchase of new airframes,
and this may happen again in the future. However, we expect
that these operations will remain very limited in number.
Regional freighters
By 2023, the active fleet of regional freighters will have grown
to 1,272 aircraft from the 510 currently in service. Traffic growth and
replacement will create the need for the delivery of 1,100 aircraft.
The higher utilisation in the fast growing Asian market will largely
contribute to the requirement for 187 efficient and economical
new regional freighters over the 2004-2023 period.
In this segment, widebodies such as the new or converted A300-
600F, are replacing the long-serving 707F and DC-8Fs.
727new factory and
2,412convertedfreightersneeded
Regional freighter fleet
800
1,000
1,200
1,400
600
400
200
0
Fleet size
20232003
510
+4.7% p.a.
1,272
913
172
187
Conversions New freightersRetained in service
Small jet freighter fleet
400
600
800
1,000
200
0
Fleet size
20232003
515
+3.2% p.a.
973
919
54
ConversionsRetained in service

GLOBAL MARKET FORECAST 2004-2023 I 65
Long-range freighters
This segment includes the 747 Combi aircraft, which Airbus
believes will be converted into full-freighters long before the end
of their economic life. Meanwhile airlines fleet rationalisation
of passenger aircraft and the replacement of ageing types, are all
contributing to the conversion of a number of DC-10s.
Alternative new factory-built freighters in this class will become
available in the medium term. These new-built freighters will offer
good economics, greater flexibility and longer economic life.
This, combined with their high utilisation, will enable them
to compete effectively with converted types.
The increase in fleet size of 238 aircraft, together with the need
to replace 93 aircraft, will call for the delivery of 331 long-range
freighters over the next 20 years. Analysis of the high utilisation,
medium-volume markets and long-haul freight routes shows that
142 new factory-built freighters will be needed in that segment.
Large freighters
The large freighter segment is anticipated to see the highest
growth, with a yearly average increase of 5.5% over the forecast
period.
Large freighters are the aircraft of choice on the large and fast-
growing flows originating in Asia. Today, 62% of scheduled
747 freighter flights link Asia, PRC or Japan to the rest
of the world. This segment has the highest utilisations, averaging
over 3,600 flight hours per annum. These utilisations, combined
with the need for reliable service and high volumetric payload
will continue to drive the need for new aircraft in this class.
By 2023, an additional 652 large freighters will be needed
to replace 137 long-range 747s in service and carry the high
demand for air cargo. Airbus estimates that as many as 50%
of deliveries will be new freighters.
As in the passenger market, the appearance of the freighter
version of the A380F will set new standards in economics.
Long-range freighter fleet
100
200
300
400
0
Fleet size
20232003
137
+5.2% p.a.
375
189
44
142
Conversions New freightersRetained in service
Large freighter fleet
20232003
344
+5.5% p.a.
996
391
207
398
Conversions New freightersRetained in service
200
400
600
800
1,000
0
Fleet size

AIR CARGO FORECAST
66 I GLOBAL MARKET FORECAST 2004-2023
Fleet size will more than double
Asian freighter fleet to growthe quickest
By 2023, the North American freighter fleet will still be the largest
with 2,250 aircraft in service, but the Asian freighter fleet will have
grown to produce an equivalent number of available tonne-
kilometres.
Asia, in particular China, is seeing the introduction of small and
regional freighter fleets, with very high initial growth. Equally
as dynamic is the growth of the large freighters fleet which, from
a respectable existing base, will more than triple during the
forecast period.
More than
3,100freighters willbe delivered
2004-2023 freighter deliveries by region
Total
North America 1,995
Europe 352
Asia-Pacific 500
Middle East 27
Latin America 178
Africa 87
Total 3,139
New/Converted 727/2,412
2003-2023 freighter fleet by region
Latin America
67 183
2003 fleet 2023 fleet
Middle East
18 37
2003 fleet 2023 fleet
Africa
38 88
2003 fleet 2023 fleet
Asia-Pacific
173 592
2003 fleet 2023 fleet
Europe
230 466
2003 fleet 2023 fleet
World
1,506 3,616
2003 fleet 2023 fleetNorth America
980 2,250
2003 fleet 2023 fleet

GLOBAL MARKET FORECAST 2004-2023 I 67
727 factory-built freighters will beneeded
Over the next 20 years, cargo operators will require a total
of 3,139 freighter deliveries, of which 727 will be factory built
and 2,412 will be passenger-to-freighter conversions.
Large freighter deliveries worth$85.5bn
The large freighter segment will dominate new deliveries, with
more than half of the airframes and two-thirds of the value.
Almost
$130 billionworth of new
freighters will bedelivered
Freighter demand – units Freighter demand – value
400
600
800
1,200
1,000
200
0
Number of aircraft
Small jet freighters
Regional freighters
Long-range freighters
Large freighters
919
789
331
398
391142
189
1,100
187
913919
Total new a/c 727Total converted 2,412Total 3,139
30
20
40
50
90
70
80
60
10
0
2004 $ (billion)
Small jet freighters
Regional freighters
Long-range freighters
Large freighters
0
85.5
2122.6
187
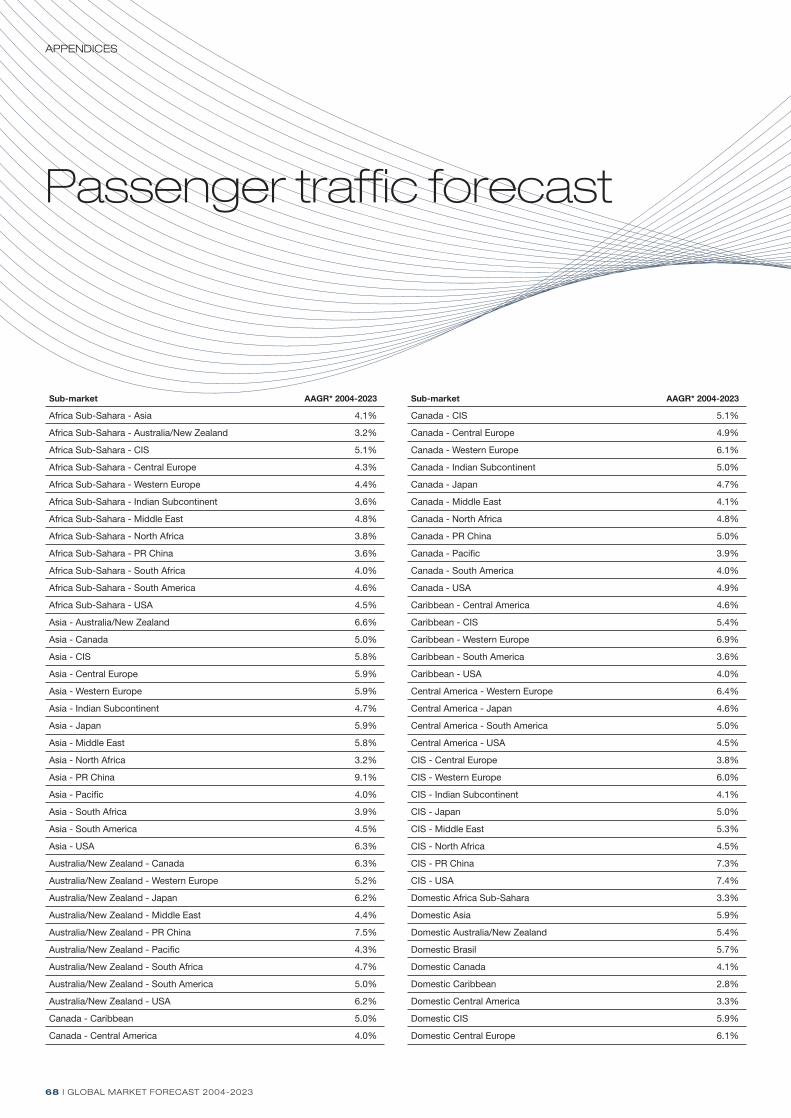
APPENDICES
68 I GLOBAL MARKET FORECAST 2004-2023
Passenger traffic forecast
Sub-market AAGR* 2004-2023
Africa Sub-Sahara - Asia 4.1%
Africa Sub-Sahara - Australia/New Zealand 3.2%
Africa Sub-Sahara - CIS 5.1%
Africa Sub-Sahara - Central Europe 4.3%
Africa Sub-Sahara - Western Europe 4.4%
Africa Sub-Sahara - Indian Subcontinent 3.6%
Africa Sub-Sahara - Middle East 4.8%
Africa Sub-Sahara - North Africa 3.8%
Africa Sub-Sahara - PR China 3.6%
Africa Sub-Sahara - South Africa 4.0%
Africa Sub-Sahara - South America 4.6%
Africa Sub-Sahara - USA 4.5%
Asia - Australia/New Zealand 6.6%
Asia - Canada 5.0%
Asia - CIS 5.8%
Asia - Central Europe 5.9%
Asia - Western Europe 5.9%
Asia - Indian Subcontinent 4.7%
Asia - Japan 5.9%
Asia - Middle East 5.8%
Asia - North Africa 3.2%
Asia - PR China 9.1%
Asia - Pacific 4.0%
Asia - South Africa 3.9%
Asia - South America 4.5%
Asia - USA 6.3%
Australia/New Zealand - Canada 6.3%
Australia/New Zealand - Western Europe 5.2%
Australia/New Zealand - Japan 6.2%
Australia/New Zealand - Middle East 4.4%
Australia/New Zealand - PR China 7.5%
Australia/New Zealand - Pacific 4.3%
Australia/New Zealand - South Africa 4.7%
Australia/New Zealand - South America 5.0%
Australia/New Zealand - USA 6.2%
Canada - Caribbean 5.0%
Canada - Central America 4.0%
Sub-market AAGR* 2004-2023
Canada - CIS 5.1%
Canada - Central Europe 4.9%
Canada - Western Europe 6.1%
Canada - Indian Subcontinent 5.0%
Canada - Japan 4.7%
Canada - Middle East 4.1%
Canada - North Africa 4.8%
Canada - PR China 5.0%
Canada - Pacific 3.9%
Canada - South America 4.0%
Canada - USA 4.9%
Caribbean - Central America 4.6%
Caribbean - CIS 5.4%
Caribbean - Western Europe 6.9%
Caribbean - South America 3.6%
Caribbean - USA 4.0%
Central America - Western Europe 6.4%
Central America - Japan 4.6%
Central America - South America 5.0%
Central America - USA 4.5%
CIS - Central Europe 3.8%
CIS - Western Europe 6.0%
CIS - Indian Subcontinent 4.1%
CIS - Japan 5.0%
CIS - Middle East 5.3%
CIS - North Africa 4.5%
CIS - PR China 7.3%
CIS - USA 7.4%
Domestic Africa Sub-Sahara 3.3%
Domestic Asia 5.9%
Domestic Australia/New Zealand 5.4%
Domestic Brasil 5.7%
Domestic Canada 4.1%
Domestic Caribbean 2.8%
Domestic Central America 3.3%
Domestic CIS 5.9%
Domestic Central Europe 6.1%

GLOBAL MARKET FORECAST 2004-2023 I 69
Sub-market AAGR* 2004-2023
Domestic Western Europe 5.0%
Domestic Indian Sub-continent 4.0%
Domestic Japan 3.0%
Domestic Middle East 3.8%
Domestic North Africa 5.8%
Domestic P.R. China 8.7%
Domestic Pacific 3.5%
Domestic South Africa 3.4%
Domestic South America 3.5%
Domestic USA 3.2%
Central Europe - Western Europe 6.9%
Central Europe - Indian Sub-continent 7.3%
Central Europe - Japan 6.4%
Central Europe - Middle East 5.2%
Central Europe - North Africa 4.4%
Central Europe - P.R. China 4.8%
Central Europe - USA 6.4%
Western Europe - Indian Sub-continent 6.5%
Western Europe - Japan 5.6%
Western Europe - Middle East 7.6%
Western Europe - North Africa 4.9%
Western Europe - P.R. China 6.9%
Western Europe - Pacific 4.9%
Western Europe - South Africa 5.5%
Western Europe - South America 5.8%
Western Europe - USA 4.9%
Indian Sub-continent - Japan 4.1%
Indian Sub-continent - Middle East 6.2%
Indian Sub-continent - North Africa 3.4%
Indian Sub-continent - P.R. China 4.1%
Indian Sub-continent - South Africa 4.7%
Indian Sub-continent - USA 7.2%
Intra Africa Sub-Sahara 3.4%
Intra Asia 6.9%
Intra Australia/New Zealand 5.1%
Intra Caribbean 4.8%
Intra Central America 3.9%
Sub-market AAGR* 2004-2023
Intra CIS 7.7%
Intra Central Europe 5.4%
Intra Western Europe 5.0%
Intra Indian Sub-continent 3.0%
Intra Middle East 3.2%
Intra North Africa 5.9%
Intra Pacific 3.7%
Intra South America 3.5%
Japan - Middle East 5.2%
Japan - North Africa 4.7%
Japan - P.R. China 7.5%
Japan - Pacific 4.1%
Japan - South America 4.6%
Japan - USA 5.8%
Middle East - North Africa 5.1%
Middle East - P.R. China 3.8%
Middle East - South Africa 4.4%
Middle East - USA 4.3%
North Africa - P.R. China 3.5%
North Africa - South Africa 4.9%
North Africa - USA 4.4%
P.R. China - South Africa 5.9%
P.R. China - USA 7.9%
Pacific - South America 3.1%
Pacific - USA 4.5%
South Africa - South America 4.5%
South Africa - USA 5.1%
South America - USA 5.6%
Others & Charter 5.1%
World 5.3%
* Average annual growth rate
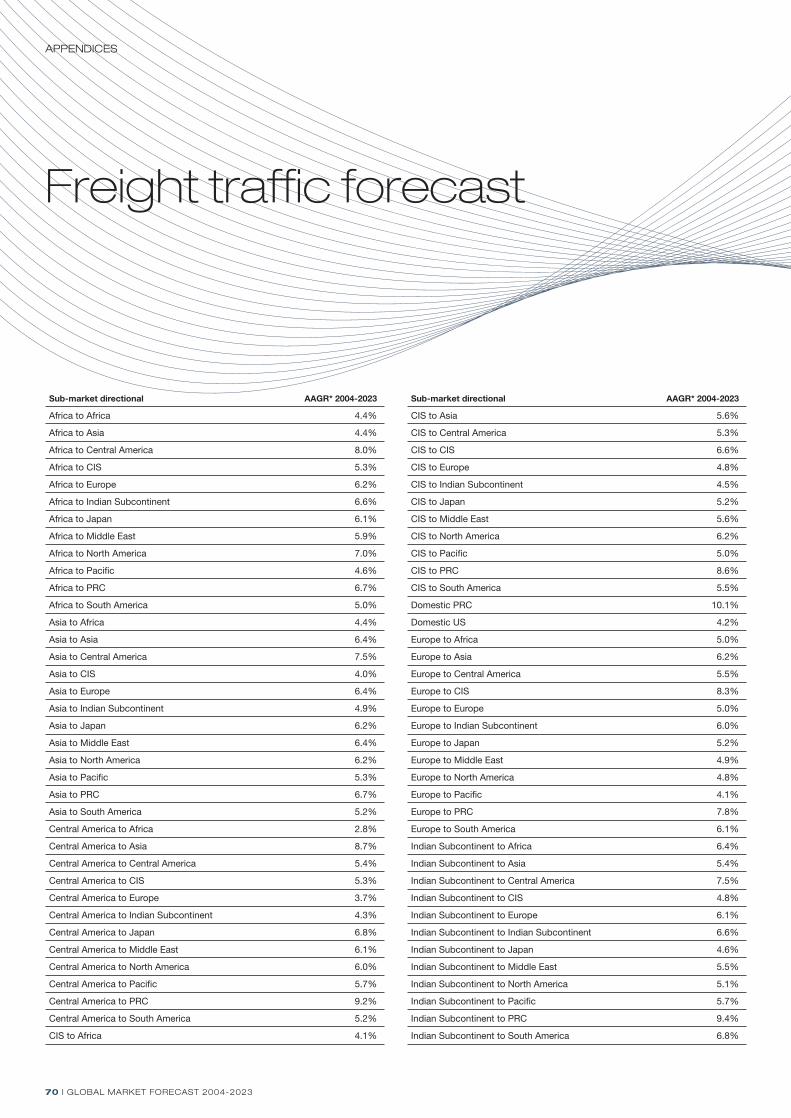
APPENDICES
70 I GLOBAL MARKET FORECAST 2004-2023
Freight traffic forecast
Sub-market directional AAGR* 2004-2023
Africa to Africa 4.4%
Africa to Asia 4.4%
Africa to Central America 8.0%
Africa to CIS 5.3%
Africa to Europe 6.2%
Africa to Indian Subcontinent 6.6%
Africa to Japan 6.1%
Africa to Middle East 5.9%
Africa to North America 7.0%
Africa to Pacific 4.6%
Africa to PRC 6.7%
Africa to South America 5.0%
Asia to Africa 4.4%
Asia to Asia 6.4%
Asia to Central America 7.5%
Asia to CIS 4.0%
Asia to Europe 6.4%
Asia to Indian Subcontinent 4.9%
Asia to Japan 6.2%
Asia to Middle East 6.4%
Asia to North America 6.2%
Asia to Pacific 5.3%
Asia to PRC 6.7%
Asia to South America 5.2%
Central America to Africa 2.8%
Central America to Asia 8.7%
Central America to Central America 5.4%
Central America to CIS 5.3%
Central America to Europe 3.7%
Central America to Indian Subcontinent 4.3%
Central America to Japan 6.8%
Central America to Middle East 6.1%
Central America to North America 6.0%
Central America to Pacific 5.7%
Central America to PRC 9.2%
Central America to South America 5.2%
CIS to Africa 4.1%
Sub-market directional AAGR* 2004-2023
CIS to Asia 5.6%
CIS to Central America 5.3%
CIS to CIS 6.6%
CIS to Europe 4.8%
CIS to Indian Subcontinent 4.5%
CIS to Japan 5.2%
CIS to Middle East 5.6%
CIS to North America 6.2%
CIS to Pacific 5.0%
CIS to PRC 8.6%
CIS to South America 5.5%
Domestic PRC 10.1%
Domestic US 4.2%
Europe to Africa 5.0%
Europe to Asia 6.2%
Europe to Central America 5.5%
Europe to CIS 8.3%
Europe to Europe 5.0%
Europe to Indian Subcontinent 6.0%
Europe to Japan 5.2%
Europe to Middle East 4.9%
Europe to North America 4.8%
Europe to Pacific 4.1%
Europe to PRC 7.8%
Europe to South America 6.1%
Indian Subcontinent to Africa 6.4%
Indian Subcontinent to Asia 5.4%
Indian Subcontinent to Central America 7.5%
Indian Subcontinent to CIS 4.8%
Indian Subcontinent to Europe 6.1%
Indian Subcontinent to Indian Subcontinent 6.6%
Indian Subcontinent to Japan 4.6%
Indian Subcontinent to Middle East 5.5%
Indian Subcontinent to North America 5.1%
Indian Subcontinent to Pacific 5.7%
Indian Subcontinent to PRC 9.4%
Indian Subcontinent to South America 6.8%

GLOBAL MARKET FORECAST 2004-2023 I 71
Sub-market directional AAGR* 2004-2023
Japan to Africa 5.9%
Japan to Asia 4.9%
Japan to Central America 6.3%
Japan to CIS 3.9%
Japan to Europe 5.9%
Japan to Indian Subcontinent 5.5%
Japan to Middle East 5.5%
Japan to North America 6.1%
Japan to Pacific 5.9%
Japan to PRC 6.0%
Japan to South America 4.3%
Middle East to Africa 7.1%
Middle East to Asia 5.6%
Middle East to Central America 4.7%
Middle East to CIS 3.5%
Middle East to Europe 4.5%
Middle East to Indian Subcontinent 7.3%
Middle East to Japan 3.0%
Middle East to Middle East 4.7%
Middle East to North America 6.2%
Middle East to Pacific 4.6%
Middle East to PRC 8.2%
Middle East to South America 6.5%
North America to Africa 5.6%
North America to Asia 5.9%
North America to Central America 6.0%
North America to CIS 6.0%
North America to Europe 5.0%
North America to Indian Subcontinent 6.8%
North America to Japan 5.9%
North America to Middle East 3.9%
North America to North America 4.9%
North America to Pacific 4.3%
North America to PRC 7.4%
North America to South America 6.0%
Pacific to Africa 5.9%
Pacific to Asia 4.5%
Sub-market directional AAGR* 2004-2023
Pacific to Central America 5.8%
Pacific to CIS 5.4%
Pacific to Europe 4.6%
Pacific to Indian Subcontinent 5.9%
Pacific to Japan 4.1%
Pacific to Middle East 5.0%
Pacific to North America 4.9%
Pacific to Pacific 4.8%
Pacific to PRC 6.5%
Pacific to South America 6.5%
PRC to Africa 8.5%
PRC to Asia 8.2%
PRC to Central America 6.3%
PRC to CIS 5.1%
PRC to Europe 7.1%
PRC to Indian Subcontinent 10.8%
PRC to Japan 6.8%
PRC to Middle East 7.2%
PRC to North America 7.7%
PRC to Pacific 8.3%
PRC to PRC 5.3%
PRC to South America 8.4%
South America to Africa 4.5%
South America to Asia 5.7%
South America to Central America 7.1%
South America to CIS 6.1%
South America to Europe 4.7%
South America to Indian Subcontinent 5.9%
South America to Japan 4.4%
South America to Middle East 5.5%
South America to North America 5.3%
South America to Pacific 6.0%
South America to PRC 7.0%
South America to South America 7.1%
World 5.9%
* Average annual growth rate

APPENDICES
72 I GLOBAL MARKET FORECAST 2004-2023
Passenger fleet forecast
Aircraft type 2004 2023 Replacements Deliveries/fleet in service backlog
767-300 103 5 98
767-300ER 430 71 378 19
767-400ER 37 37
7E7-8 0 20 20
A300 41 41
A300-600 24 24
A300-600I 153 153
A330-200 145 164 106 125
A340-200 18 18
300 0 1,213 1,213
747SP 3 3
777-200ER 318 166 225 73
777-300ER 0 80 80
7E7-3 0 30 30
A330-300 128 98 111 81
A340-300 192 48 157 13
A340-500 6 21 3 18
DC-10 49 49
L1011 10 10
MD-11 48 48
MD-11ER 4 4
350 0 730 730
777-200 80 16 74 10
A340-600 24 94 10 80
400 0 663 663
747-100 8 8
747-200 67 67
747-300 54 54
747-400 456 37 437 18
747-400ER 6 6
777-300 53 17 47 11
MD-11C 4 4
450 0 239 239
500 0 417 417
747HD 27 27
747SR 3 3
A380-800 0 112 112
600 0 283 283
800 0 166 166
1000 0 45 45
Open Market 17,415
Backlog 2,706
Total 10,838 21,759 9,200 20,121
Open market neutral categoryAircraft in production (deliveries = backlog)Aircraft out of production or no orders
Aircraft type 2004 2023 Replacements Deliveries/fleet in service backlog
100 0 918 918
717 115 127 25 37
737-200 479 479
737-500 359 359
737-600 52 30 35 13
A318-100 9 82 73
Avro 100 51 1 50
DC-9-30 174 174
DC-9-40 12 12
DC-9-50 48 48
ERJ-190 0 100 100
ERJ-195 0 15 15
F100 168 168
MD-80-87 70 70
Yak-42 10 10
125 0 2,358 2,358
737-300 948 1 947
737-700 481 650 243 412
A319-100 518 545 357 384
150 0 3,537 3,537
707 3 3
727 73 73
737-400 432 4 428
737-800 730 683 418 371
A320-100 18 18
A320-200 1,141 728 921 508
IL-62 4 4
MD-80 564 564
MD-80-83 217 19 198
MD-80-88 154 154
MD-90 100 11 89
Tu-154 32 32
175 0 2,751 2,751
737-900 40 44 11 15
757-200 791 109 689 7
A321-100 85 2 85 2
A321-200 187 173 128 114
210 0 2,169 2,169
757-300 49 33 21 5
767-200 40 40
767-200ER 85 10 75
A310-200 20 20
A310-300 86 86
Tu-204 2 11 1 10
250 0 1,876 1,876

AIRBUS S.A.S.1, ROND-POINT MAURICE BELLONTE
31707 BLAGNAC CEDEX – FRANCEDESIGN AND CONCEPTION BY EURO RSCG C&O
PHOTOS BY: BOUDJELAL/SIPA, MARTIN BARRAUD, BRITT ERLANSON,SANNA LINDBERG, KAREN BEARD, GETTY IMAGES,
HEIN VAN DEN HEUVEL, ZEFA VISUAL MEDIA CORBIS,COMPUTER GRAPHICS BY I3M, IMAGE EXM, HERVÉ GOUSSÉ,SÉBASTIEN OGNIER, COMPUTER RENDERING FIXION – HCSM
PRINTED IN FRANCE© AIRBUS S.A.S. DECEMBER 2004
ALL RIGHTS RESERVEDCONFIDENTIAL PROPRIETARY DOCUMENTS
AN EADS JOINT COMPANYWITH BAE SYSTEMS

AN EADS JOINT COMPANY WITH BAE SYSTEMS