global Marine Insurance Casualty Trends - Iumi · CONTENTS –CASUALTY TRENDS SHIPOWNERS’...
60
ASTRID SELTMANN Vice chairman, IUMI Facts & Figures Committee Analyst/Actuary, The Nordic Association of Marine Insurers (Cefor) Global Marine Insurance Casualty trends
Transcript of global Marine Insurance Casualty Trends - Iumi · CONTENTS –CASUALTY TRENDS SHIPOWNERS’...
ASTRID SELTMANN
Vice chairman, IUMI Facts & Figures CommitteeAnalyst/Actuary, The Nordic Association of Marine Insurers (Cefor)
Global Marine Insurance
Casualty trends
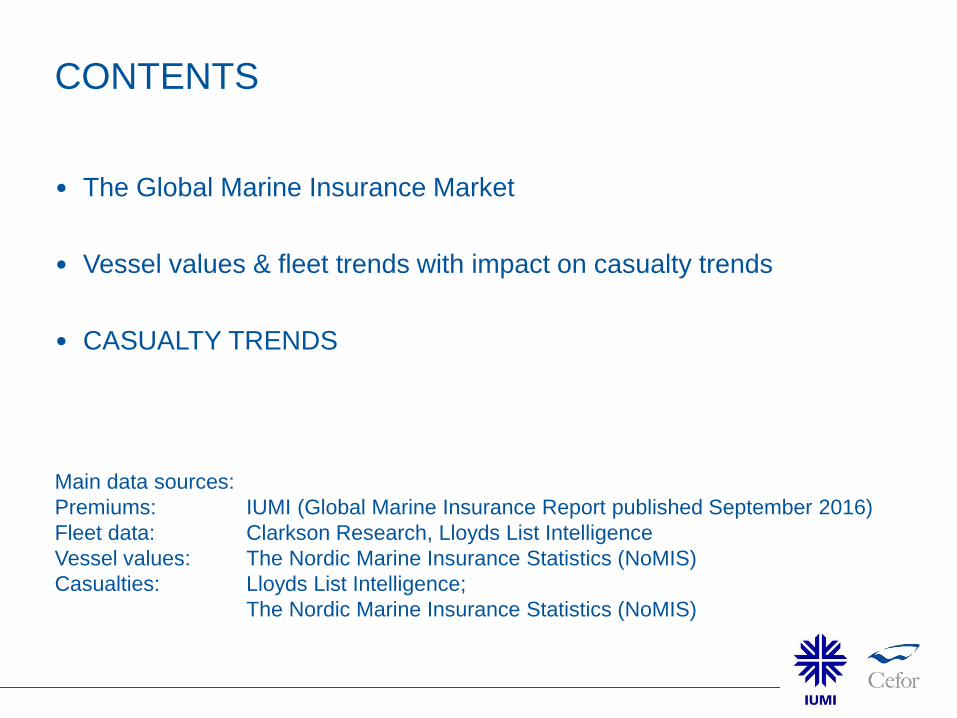
CONTENTS
• The Global Marine Insurance Market
• Vessel values & fleet trends with impact on casualty trends
• CASUALTY TRENDS
Main data sources:
Premiums: IUMI (Global Marine Insurance Report published September 2016)
Fleet data: Clarkson Research, Lloyds List Intelligence
Vessel values: The Nordic Marine Insurance Statistics (NoMIS)
Casualties: Lloyds List Intelligence;
The Nordic Marine Insurance Statistics (NoMIS)

CONTENTS – CASUALTY TRENDS
SHIPOWNERS’ LIABILITY (Crew, Environment, collision etc.)
• Pool claims International Group of P&I Clubs
OFFSHORE ENERGY
• Casualties on mobile offshore units
HULL CASUALTY TRENDS
• Total and major losses and their impact
• ‘Serious’ (LLI / IMO etc.) versus ‘Major’ (Insurance) casualties – beware of the terminology!
• Trends by type of casualty
• Trends by vessel type / age group
• Special:
‐ Cost driving factors
‐ Effect of Lay-ups on the claims frequency
THE GLOBAL MARINE INSURANCE MARKET
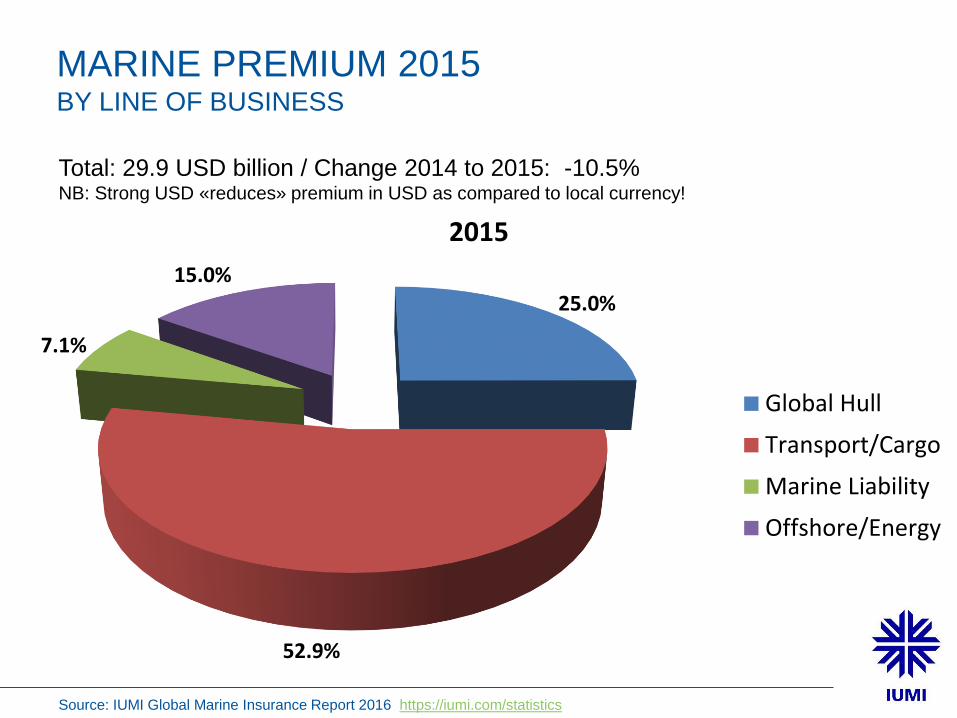
25.0%
52.9%
7.1%
15.0%
2015
Global Hull
Transport/Cargo
Marine Liability
Offshore/Energy
MARINE PREMIUM 2015BY LINE OF BUSINESS
Source: IUMI Global Marine Insurance Report 2016 https://iumi.com/statistics
Total: 29.9 USD billion / Change 2014 to 2015: -10.5%NB: Strong USD «reduces» premium in USD as compared to local currency!
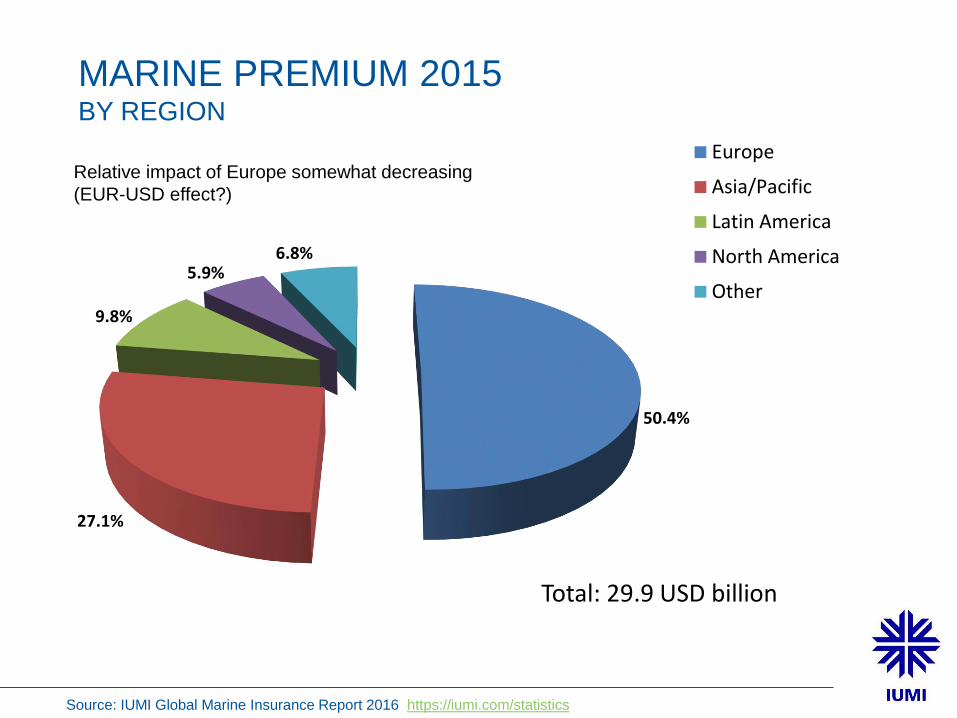
50.4%
27.1%
9.8%
5.9%6.8%
2015Europe
Asia/Pacific
Latin America
North America
Other
MARINE PREMIUM 2015BY REGION
Relative impact of Europe somewhat decreasing
(EUR-USD effect?)
Total: 29.9 USD billion
Source: IUMI Global Marine Insurance Report 2016 https://iumi.com/statistics
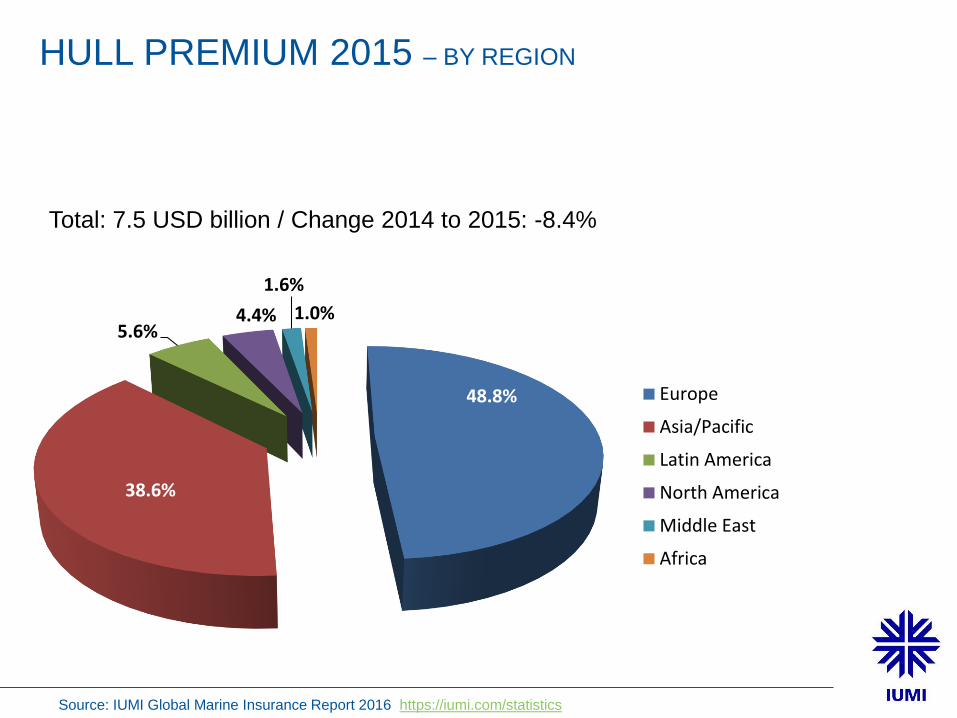
48.8%
38.6%
5.6%4.4%
1.6%
1.0%2015
Europe
Asia/Pacific
Latin America
North America
Middle East
Africa
HULL PREMIUM 2015 – BY REGION
Total: 7.5 USD billion / Change 2014 to 2015: -8.4%
Source: IUMI Global Marine Insurance Report 2016 https://iumi.com/statistics
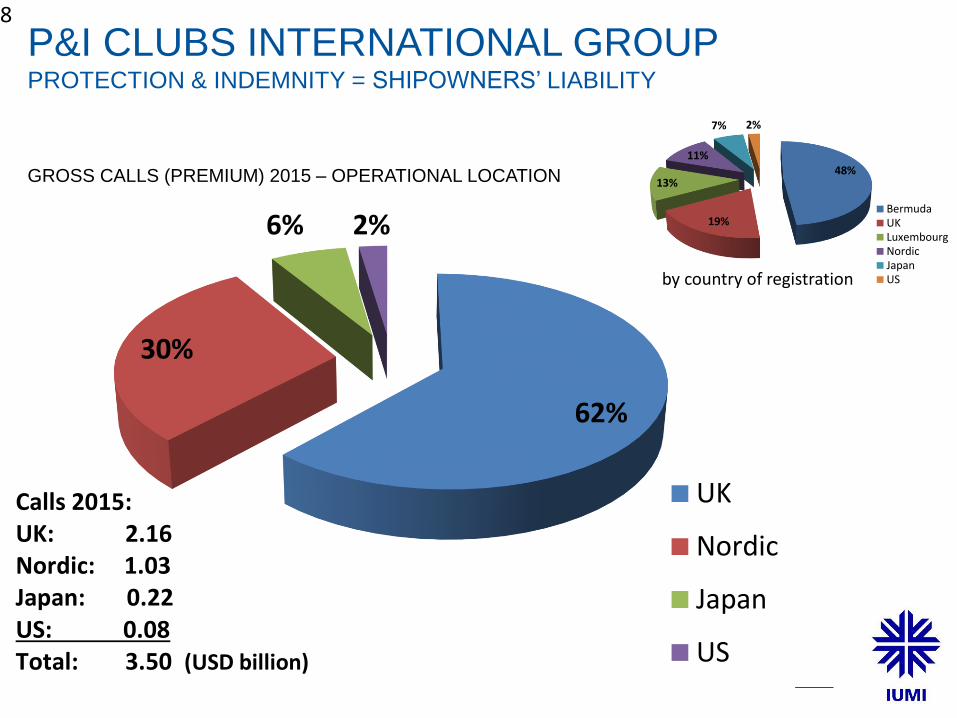
62%
30%
6% 2%
UK
Nordic
Japan
US
Calls 2015:UK: 2.16 Nordic: 1.03Japan: 0.22US: 0.08Total: 3.50 (USD billion)
P&I CLUBS INTERNATIONAL GROUPPROTECTION & INDEMNITY = SHIPOWNERS’ LIABILITY
GROSS CALLS (PREMIUM) 2015 – OPERATIONAL LOCATION 48%
19%
13%
11%
7% 2%
BermudaUKLuxembourgNordicJapanUSby country of registration
8
VESSEL VALUES
© Astrid Seltmann
0
5,000
10,000
15,000
20,000
25,000
30,000
35,000
40,000
0
5,000,000
10,000,000
15,000,000
20,000,000
25,000,000
30,000,000
35,000,000
40,000,000
45,000,00020
00
2001
2002
2003
2004
2005
2006
2007
2008
2009
2010
2011
2012
2013
2014
2015
2016
Average insured vessel value Average gross ton
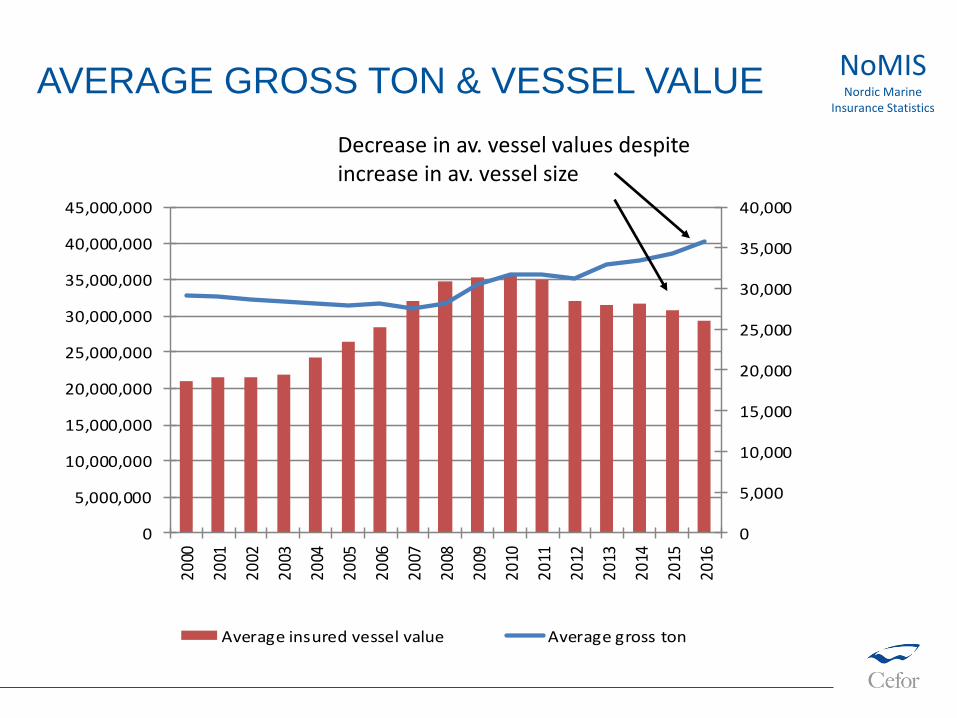
AVERAGE GROSS TON & VESSEL VALUENoMISNordic Marine
Insurance Statistics
Decrease in av. vessel values despiteincrease in av. vessel size
5.9% 5.9%
2.3%
8.7%
2.3%
-14.8%
-7.9%
-4.2%
-6.5%-6.2%-6.0%
-9.2%
-6.9%
-20.0%
-15.0%
-10.0%
-5.0%
0.0%
5.0%
10.0%
15.0%
2004
2005
2006
2007
2008
2009
2010
2011
2012
2013
2014
2015
2016
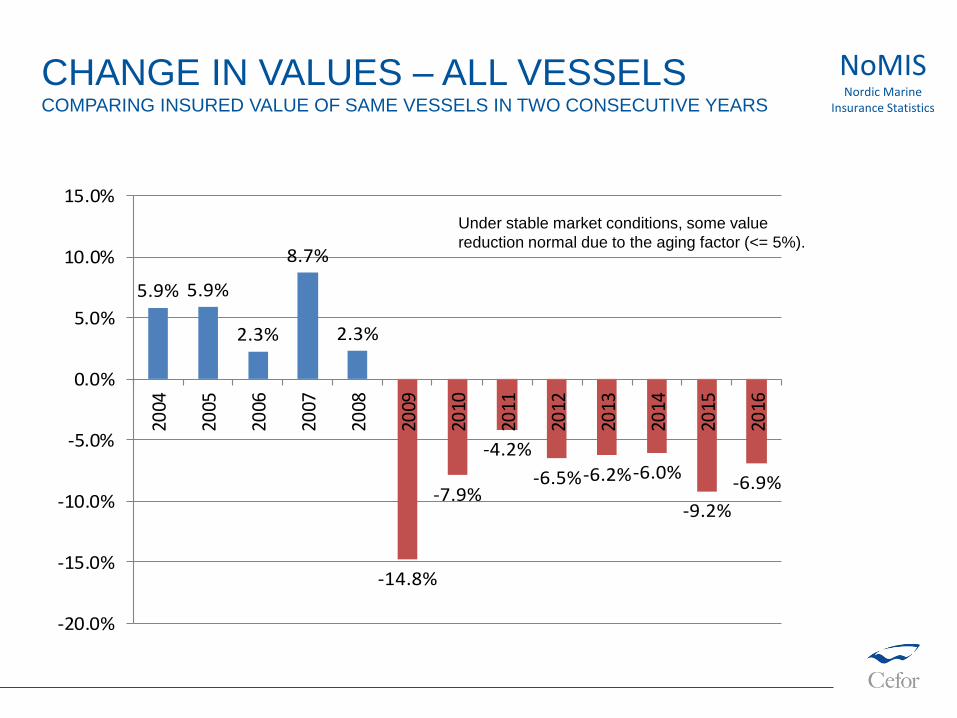
Under stable market conditions, some value
reduction normal due to the aging factor (<= 5%).
CHANGE IN VALUES – ALL VESSELSCOMPARING INSURED VALUE OF SAME VESSELS IN TWO CONSECUTIVE YEARS
NoMISNordic Marine
Insurance Statistics
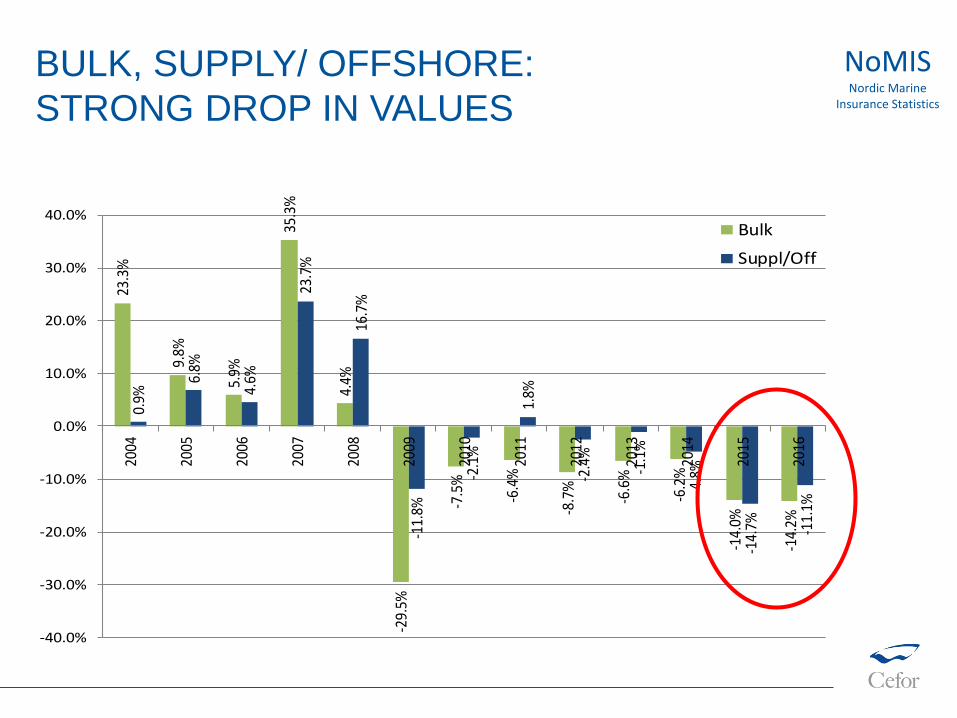
BULK, SUPPLY/ OFFSHORE:
STRONG DROP IN VALUES23
.3%
9.8%
5.9%
35.3
%
4.4%
-29.
5%
-7.5
%
-6.4
%
-8.7
%
-6.6
%
-6.2
%
-14.
0%
-14.
2%
0.9%
6.8%
4.6%
23.7
%
16.7
%
-11.
8%
-2.1
%
1.8%
-2.4
%
-1.1
%
-4.8
%
-14.
7% -11.
1%
-40.0%
-30.0%
-20.0%
-10.0%
0.0%
10.0%
20.0%
30.0%
40.0%
2004
2005
2006
2007
2008
2009
2010
2011
2012
2013
2014
2015
2016
Bulk
Suppl/Off
NoMISNordic Marine
Insurance Statistics
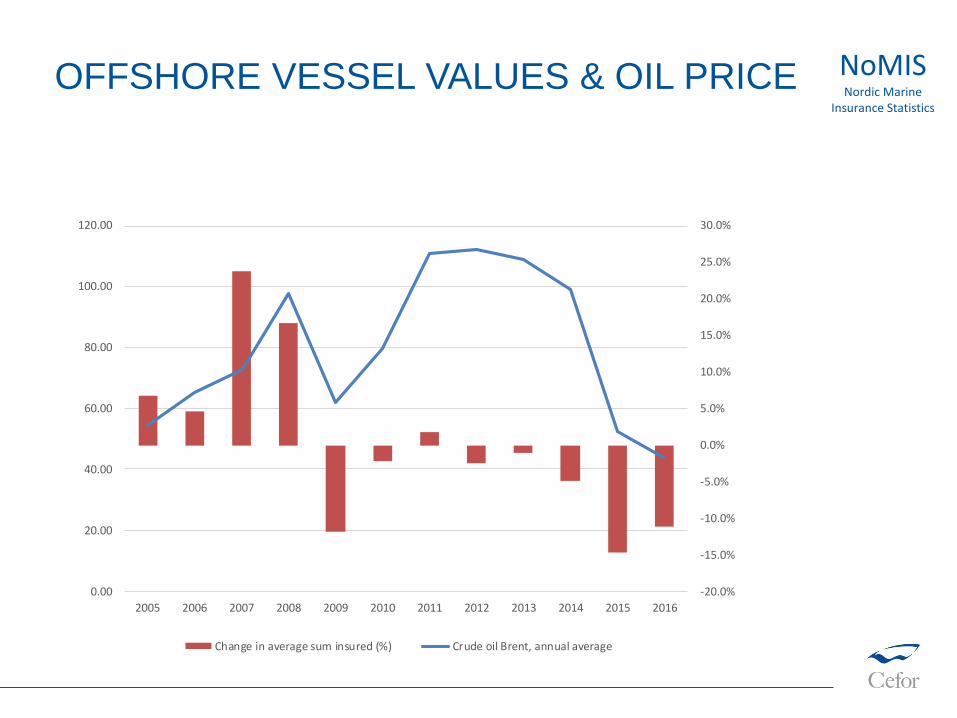
OFFSHORE VESSEL VALUES & OIL PRICE
-20.0%
-15.0%
-10.0%
-5.0%
0.0%
5.0%
10.0%
15.0%
20.0%
25.0%
30.0%
0.00
20.00
40.00
60.00
80.00
100.00
120.00
2005 2006 2007 2008 2009 2010 2011 2012 2013 2014 2015 2016
Change in average sum insured (%) Crude oil Brent, annual average
NoMISNordic Marine
Insurance Statistics
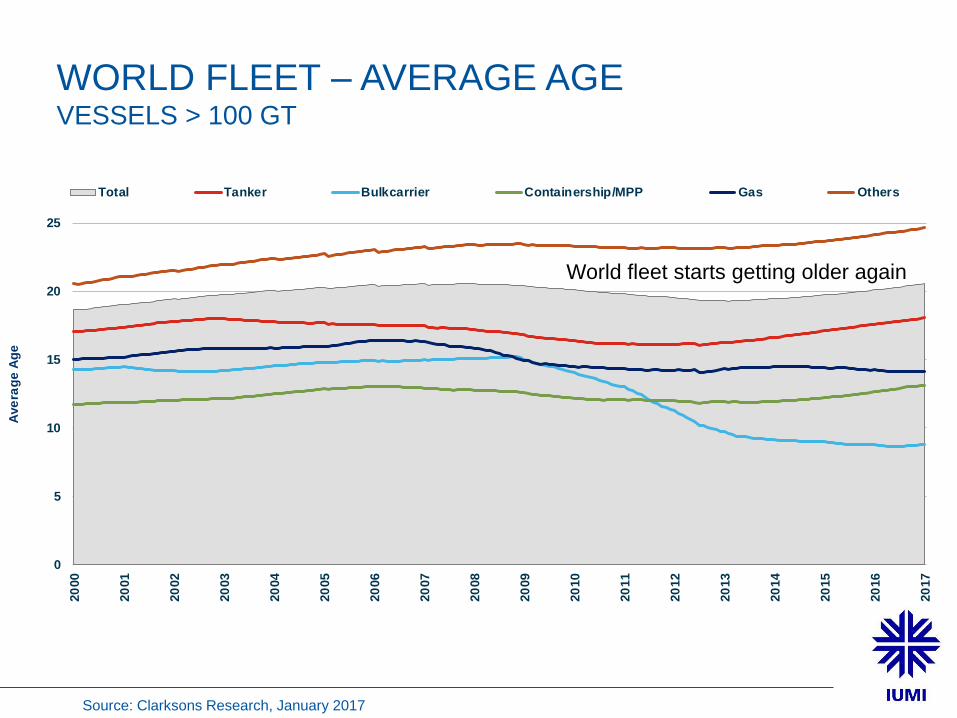
WORLD FLEET – AVERAGE AGEVESSELS > 100 GT
Source: Clarksons Research, January 2017
0
5
10
15
20
25
20
00
20
01
20
02
20
03
20
04
20
05
20
06
20
07
20
08
20
09
20
10
20
11
20
12
20
13
20
14
20
15
20
16
20
17
Ave
rag
e A
ge
Total Tanker Bulkcarrier Containership/MPP Gas Others
World fleet starts getting older again
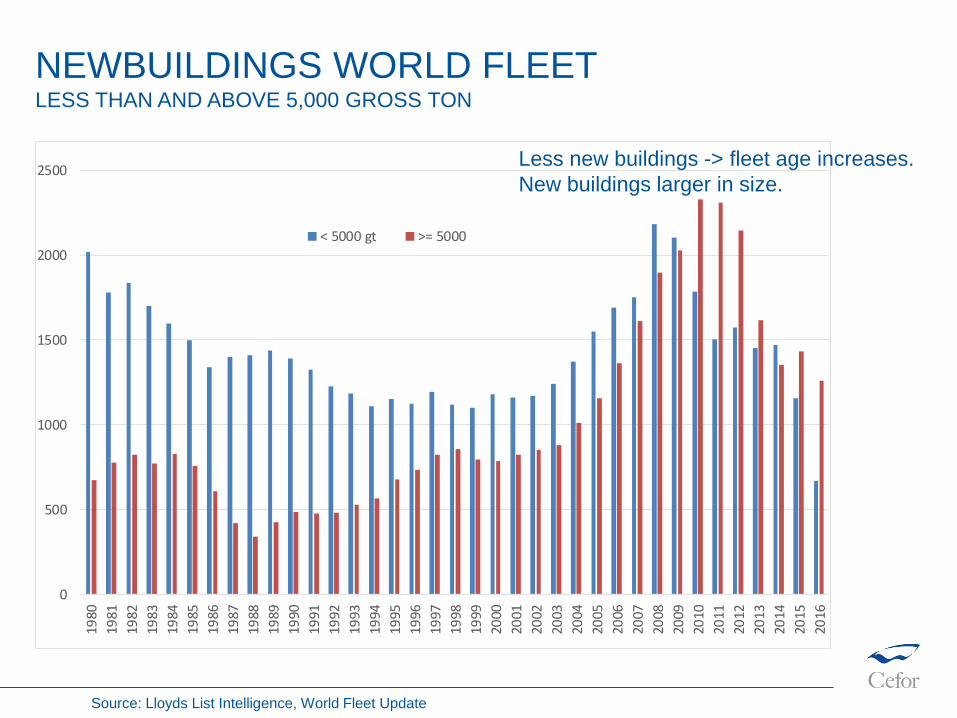
NEWBUILDINGS WORLD FLEETLESS THAN AND ABOVE 5,000 GROSS TON
0
500
1000
1500
2000
2500
1980
1981
1982
1983
1984
1985
1986
1987
1988
1989
1990
1991
1992
1993
1994
1995
1996
1997
1998
1999
2000
2001
2002
2003
2004
2005
2006
2007
2008
2009
2010
2011
2012
2013
2014
2015
2016
< 5000 gt >= 5000
Source: Lloyds List Intelligence, World Fleet Update
Less new buildings -> fleet age increases.
New buildings larger in size.
CASUALTY TRENDS
© Astrid Seltmann
No claim – just a matter of perspective!
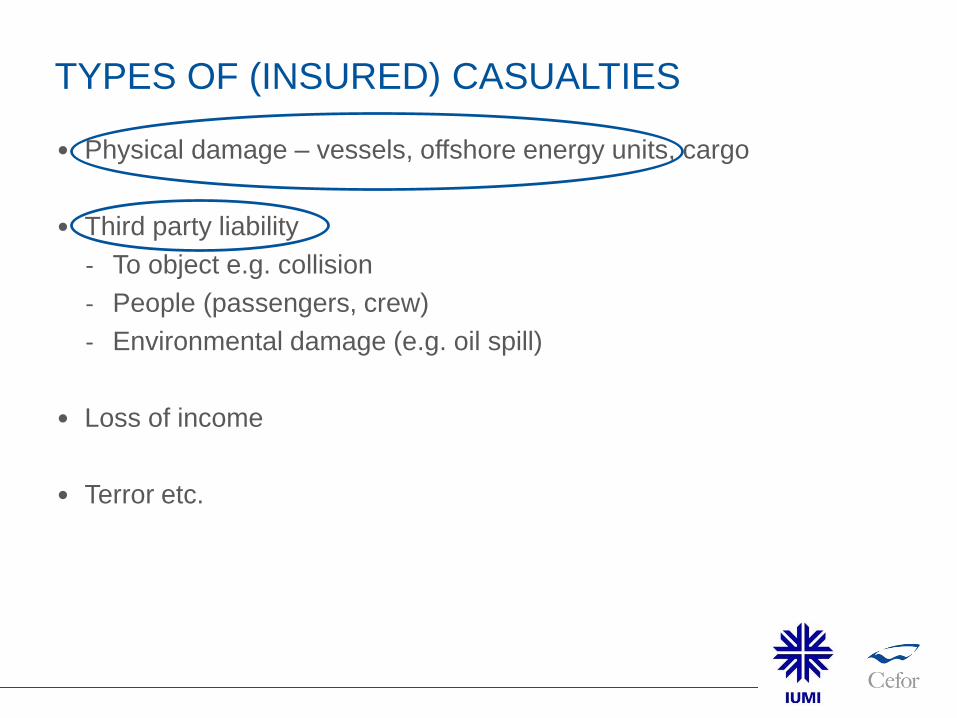
TYPES OF (INSURED) CASUALTIES
• Physical damage – vessels, offshore energy units, cargo
• Third party liability
‐ To object e.g. collision
‐ People (passengers, crew)
‐ Environmental damage (e.g. oil spill)
• Loss of income
• Terror etc.
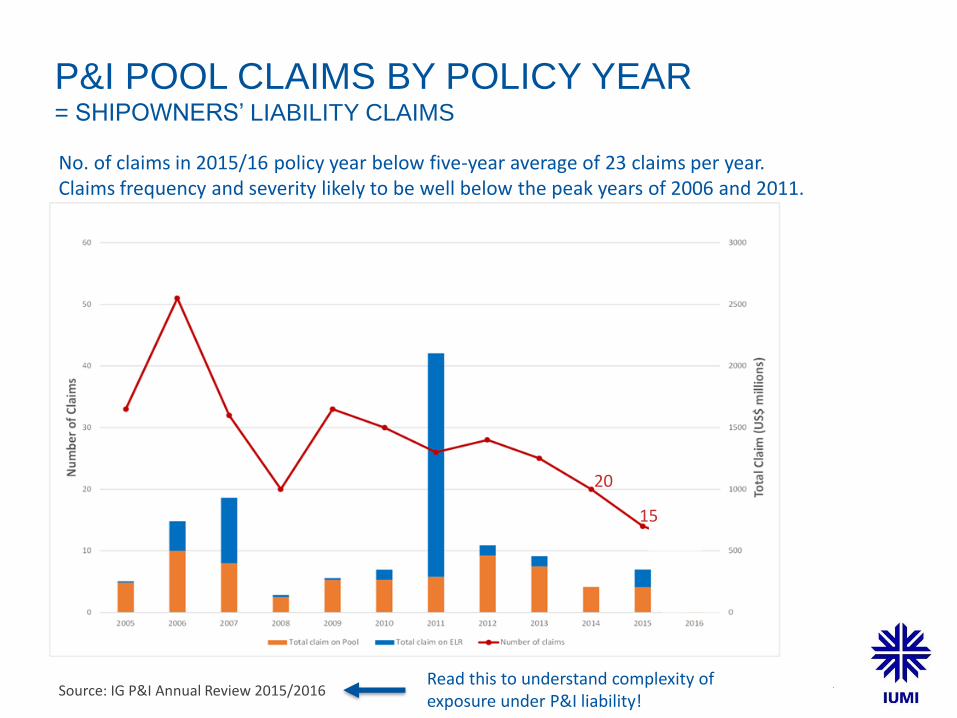
P&I POOL CLAIMS BY POLICY YEAR= SHIPOWNERS’ LIABILITY CLAIMS
No. of claims in 2015/16 policy year below five-year average of 23 claims per year. Claims frequency and severity likely to be well below the peak years of 2006 and 2011.
Source: IG P&I Annual Review 2015/2016Read this to understand complexity of exposure under P&I liability!
15
20
OFFSHORE ENERGY CLAIMS TRENDS –
MOBILES
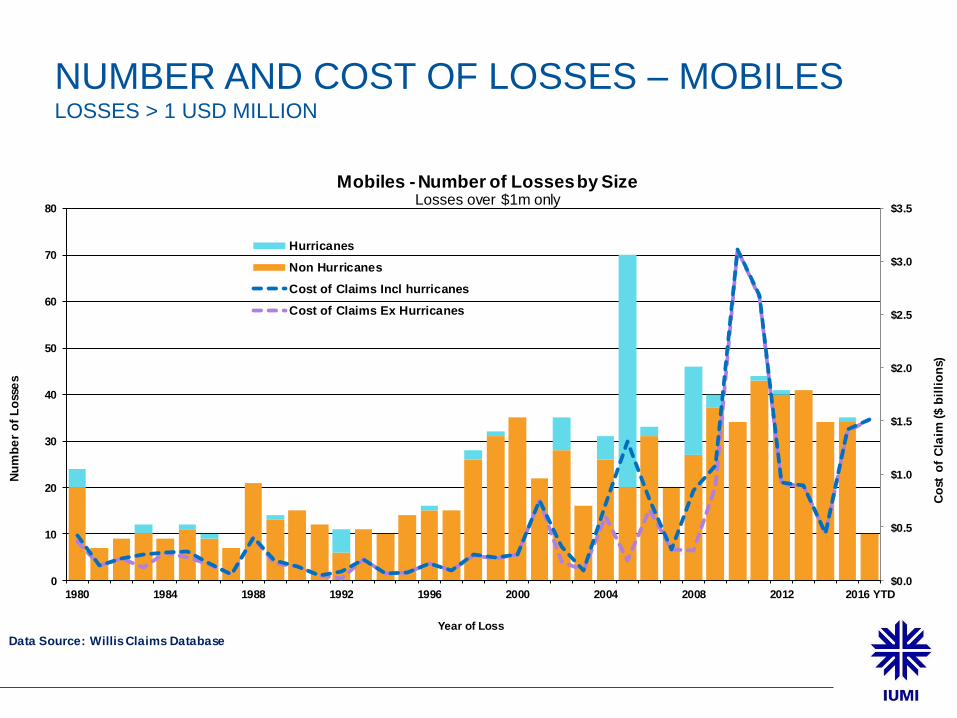
NUMBER AND COST OF LOSSES – MOBILESLOSSES > 1 USD MILLION
$0.0
$0.5
$1.0
$1.5
$2.0
$2.5
$3.0
$3.5
0
10
20
30
40
50
60
70
80
1980 1984 1988 1992 1996 2000 2004 2008 2012 2016 YTD
Co
st o
f C
laim
($ b
illi
on
s)
Nu
mb
er
of
Lo
sse
s
Year of Loss
Mobiles - Number of Losses by SizeLosses over $1m only
Hurricanes
Non Hurricanes
Cost of Claims Incl hurricanes
Cost of Claims Ex Hurricanes
Data Source: Willis Claims Database
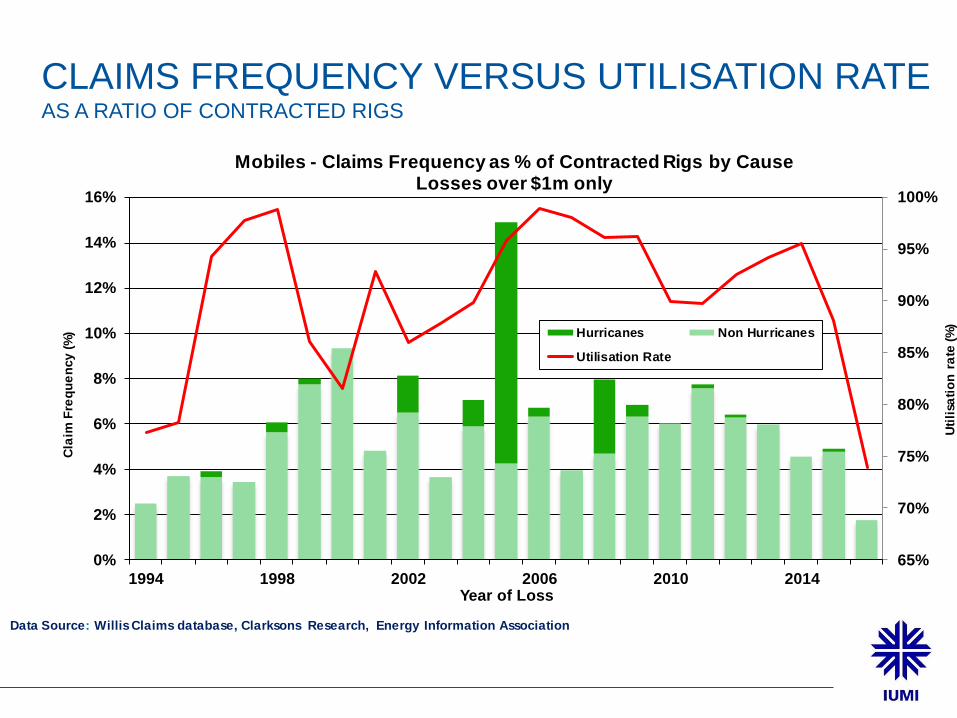
CLAIMS FREQUENCY VERSUS UTILISATION RATEAS A RATIO OF CONTRACTED RIGS
65%
70%
75%
80%
85%
90%
95%
100%
0%
2%
4%
6%
8%
10%
12%
14%
16%
1994 1998 2002 2006 2010 2014
Uti
lisa
tio
n r
ate
(%
)
Cla
im F
req
ue
ncy (
%)
Year of Loss
Mobiles - Claims Frequency as % of Contracted Rigs by CauseLosses over $1m only
Hurricanes Non Hurricanes
Utilisation Rate
Data Source: Willis Claims database, Clarksons Research, Energy Information Association
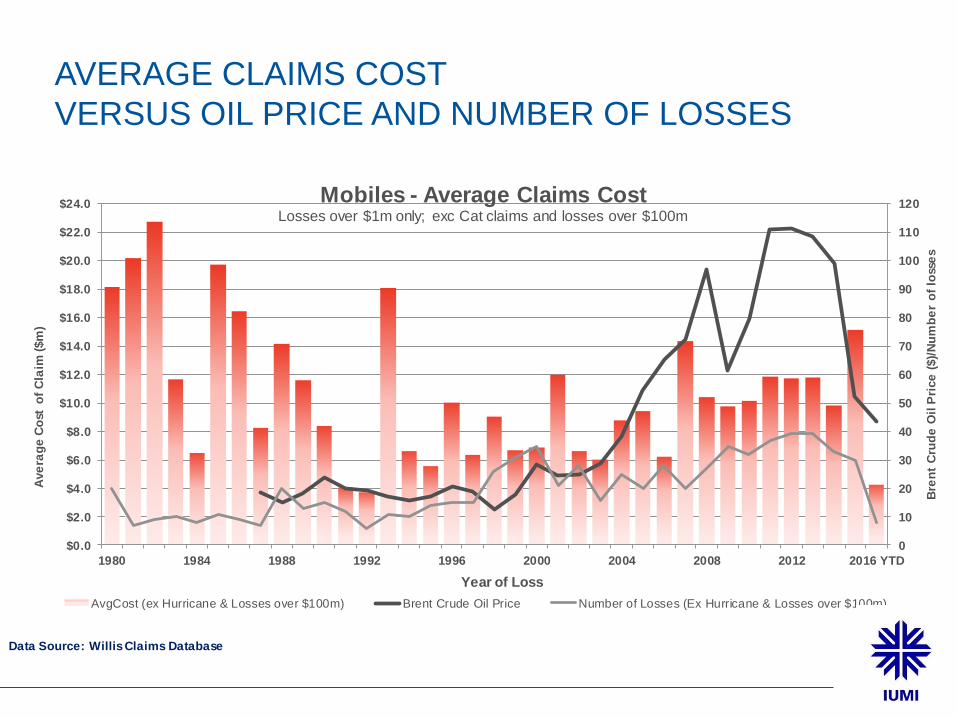
AVERAGE CLAIMS COST
VERSUS OIL PRICE AND NUMBER OF LOSSES
0
10
20
30
40
50
60
70
80
90
100
110
120
$0.0
$2.0
$4.0
$6.0
$8.0
$10.0
$12.0
$14.0
$16.0
$18.0
$20.0
$22.0
$24.0
1980 1984 1988 1992 1996 2000 2004 2008 2012 2016 YTD
Bre
nt
Cru
de
Oil
Pri
ce
($)/
Nu
mb
er
of
loss
es
Ave
rag
e C
ost
o
f C
laim
($m
)
Year of Loss
Mobiles - Average Claims CostLosses over $1m only; exc Cat claims and losses over $100m
AvgCost (ex Hurricane & Losses over $100m) Brent Crude Oil Price Number of Losses (Ex Hurricane & Losses over $100m)
Data Source: Willis Claims Database

HULL CASUALTY TRENDS – FREQUENCY
0.0%
0.1%
0.2%
0.3%
0.4%
in % of Vessels in % of GT
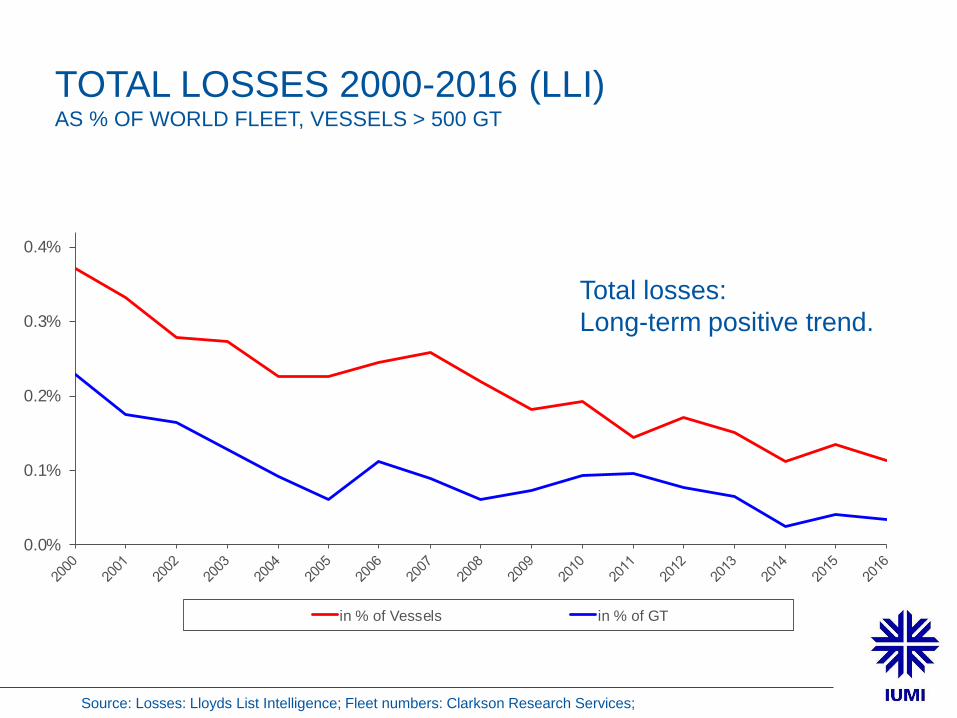
TOTAL LOSSES 2000-2016 (LLI) AS % OF WORLD FLEET, VESSELS > 500 GT
Total losses:
Long-term positive trend.
Source: Losses: Lloyds List Intelligence; Fleet numbers: Clarkson Research Services;
0.0%
0.1%
0.2%
0.3%
in % of Vessels in % of GT
Source: Losses: Lloyds List Intelligence; Fleet numbers: Clarkson Research Services;
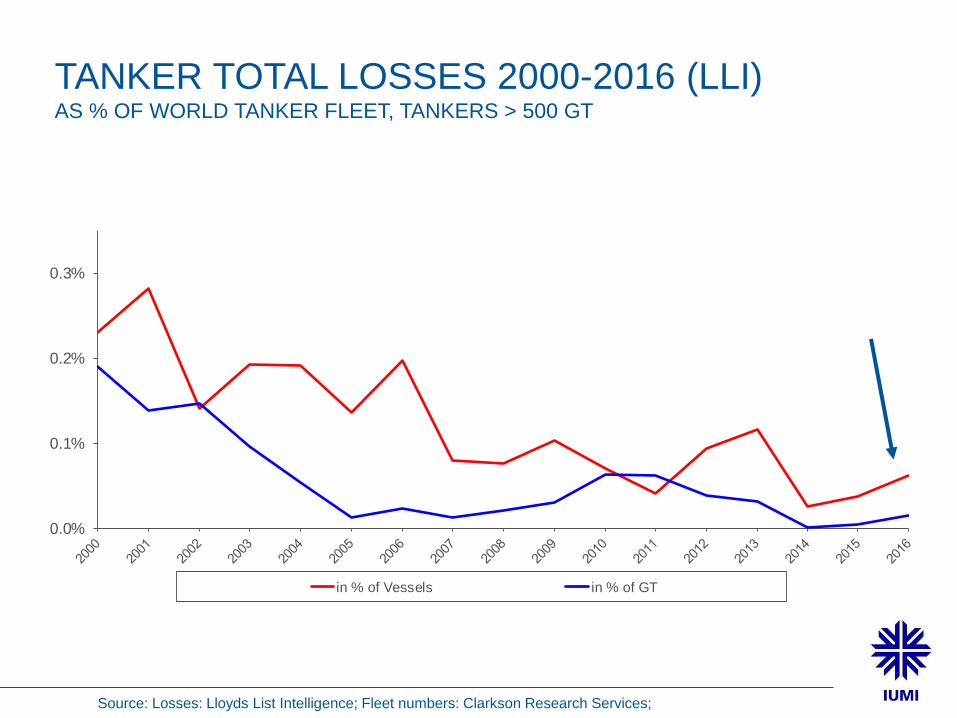
TANKER TOTAL LOSSES 2000-2016 (LLI)AS % OF WORLD TANKER FLEET, TANKERS > 500 GT
0.0%
0.1%
0.2%
0.3%
in % of Vessels in % of GT
Source: Losses: Lloyds List Intelligence; Fleet numbers: Clarkson Research Services;
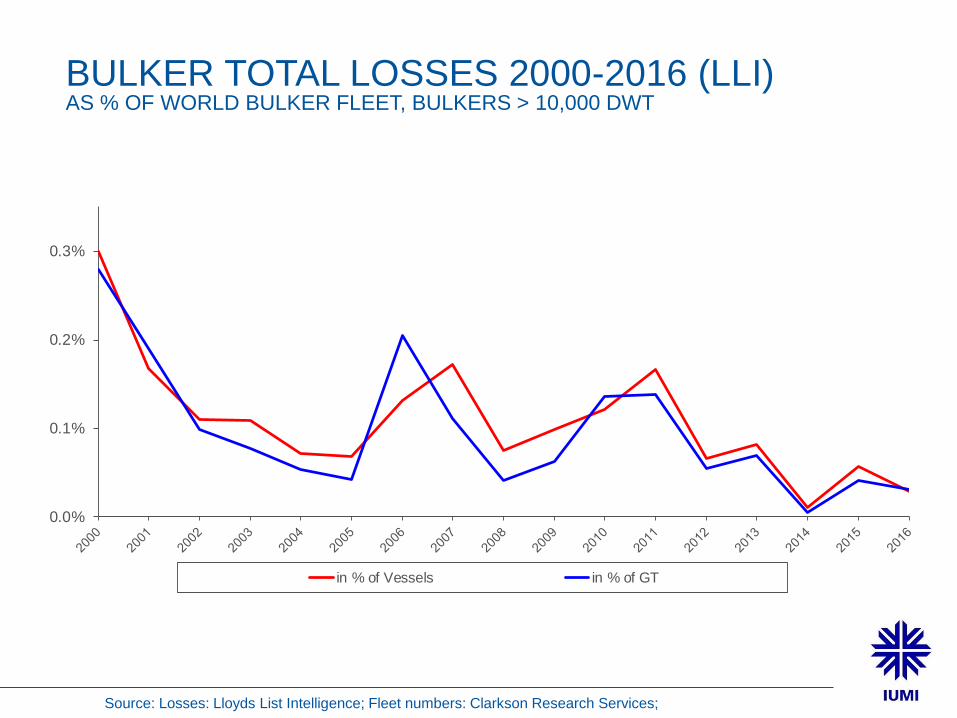
BULKER TOTAL LOSSES 2000-2016 (LLI)AS % OF WORLD BULKER FLEET, BULKERS > 10,000 DWT
0.0%
0.1%
0.2%
0.3%
in % of Vessels in % of GT
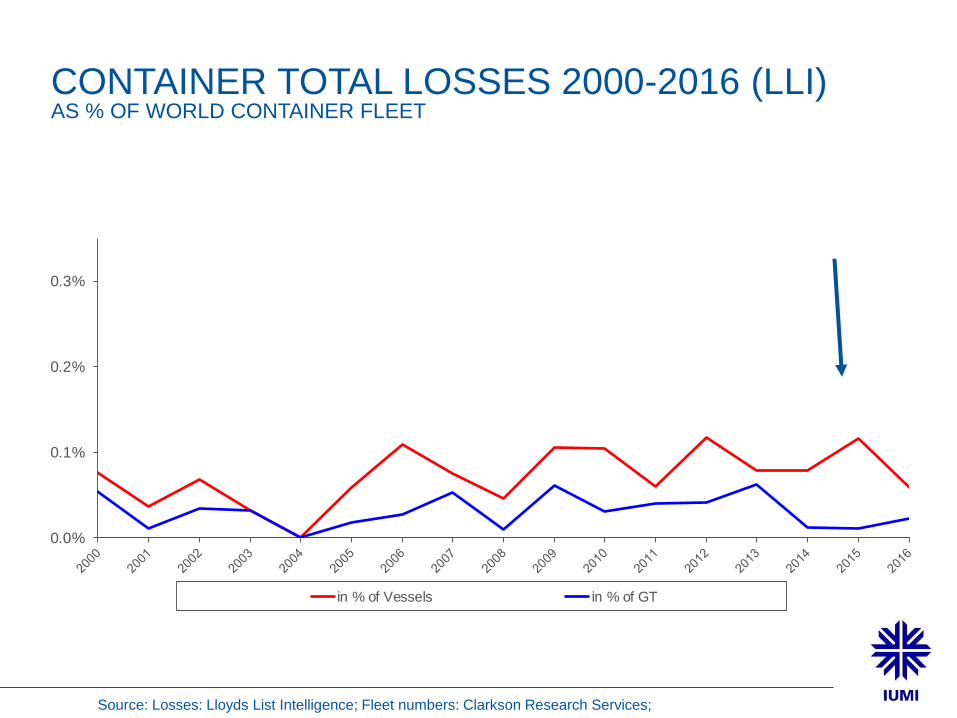
Source: Losses: Lloyds List Intelligence; Fleet numbers: Clarkson Research Services;
CONTAINER TOTAL LOSSES 2000-2016 (LLI)AS % OF WORLD CONTAINER FLEET

NoMISNordic Marine
Insurance Statistics
CLAIMS FREQUENCY* (NOMIS):
LONG-TERM POSITIVE TREND
0.00%
0.05%
0.10%
0.15%
0.20%
0.25%
0.30%
0.0%
5.0%
10.0%
15.0%
20.0%
25.0%
30.0%
35.0%
40.0%
1996
1997
19
98
19
99
2000
2001
20
02
20
03
20
04
2005
2006
20
07
20
08
2009
2010
20
11
20
12
20
13
2014
2015
20
16
partial claims (left axis) TLO claims (right axis)
Total loss frequency
Partial loss frequency
Pre-financial crisis peak
* = No. of claims divided by no. of insured vessels
0.00%
1.00%
2.00%
3.00%
4.00%
5.00%
6.00%
0%
5%
10%
15%
20%
25%
19
96
19
97
19
98
19
99
20
00
20
01
20
02
20
03
20
04
20
05
20
06
20
07
20
08
20
09
20
10
20
11
20
12
20
13
20
14
20
15
20
16
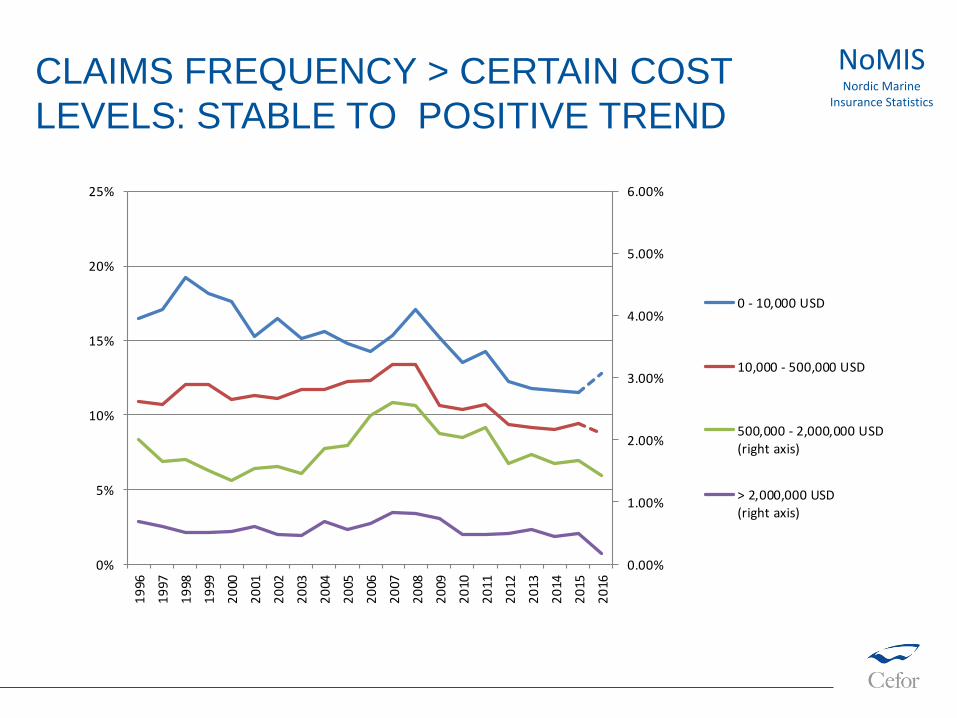
0 - 10,000 USD
10,000 - 500,000 USD
500,000 - 2,000,000 USD
(right axis)
> 2,000,000 USD
(right axis)
CLAIMS FREQUENCY > CERTAIN COST
LEVELS: STABLE TO POSITIVE TREND
NoMISNordic Marine
Insurance Statistics
HULL CASUALTY TRENDS – COST
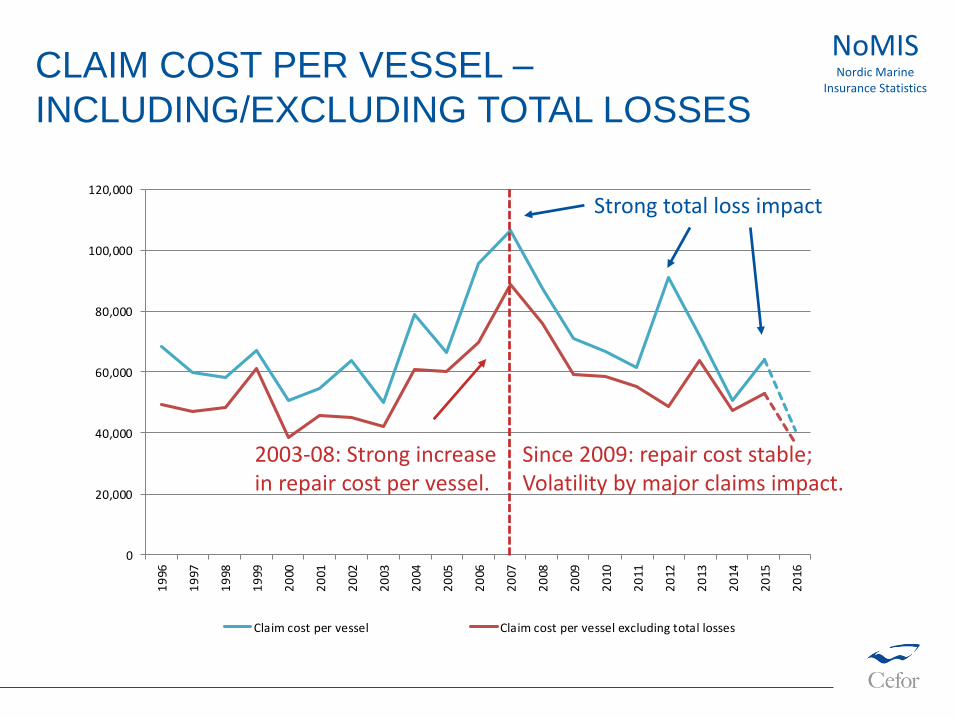
CLAIM COST PER VESSEL –
INCLUDING/EXCLUDING TOTAL LOSSES
0
20,000
40,000
60,000
80,000
100,000
120,000
19
96
19
97
19
98
19
99
20
00
20
01
20
02
20
03
20
04
20
05
20
06
20
07
20
08
20
09
20
10
20
11
20
12
20
13
20
14
20
15
20
16
Claim cost per vessel Claim cost per vessel excluding total losses
Strong total loss impact
2003-08: Strong increasein repair cost per vessel.
Since 2009: repair cost stable;Volatility by major claims impact.
NoMISNordic Marine
Insurance Statistics
0
20,000
40,000
60,000
80,000
100,000
120,000
1996
19
97
1998
19
99
2000
20
01
2002
20
03
2004
20
05
2006
20
07
2008
20
09
2010
20
11
2012
20
13
2014
20
15
2016
> 50 MUSD
30-50 MUSD
10-30 MUSD
5-10 MUSD
1-5 MUSD
<= 1 MUSD
IBNR
Claim bands:
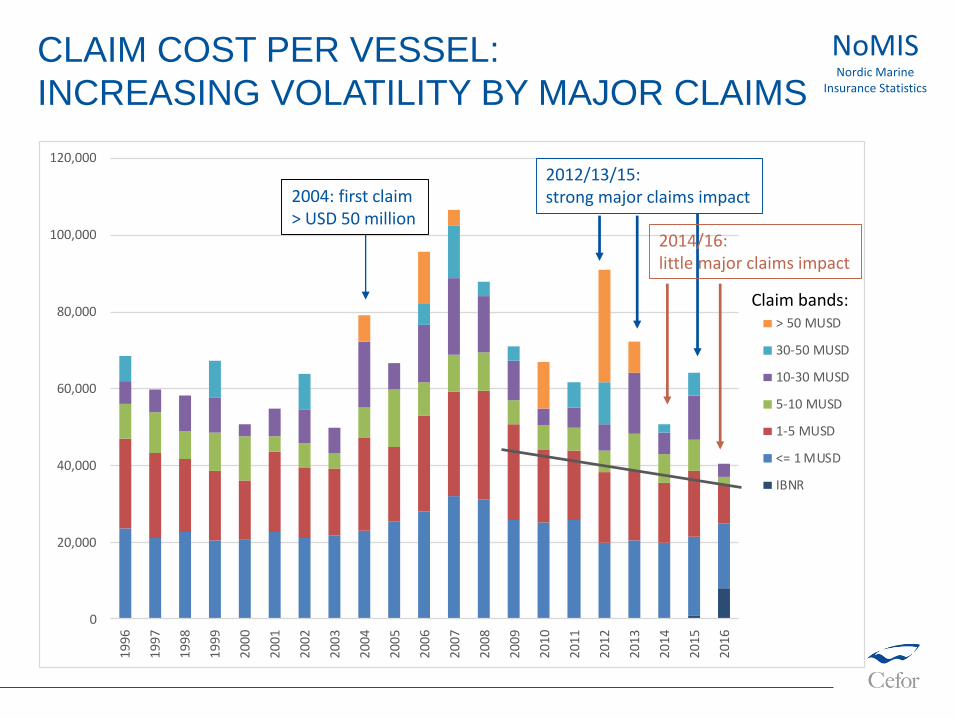
CLAIM COST PER VESSEL:
INCREASING VOLATILITY BY MAJOR CLAIMS
NoMISNordic Marine
Insurance Statistics
2012/13/15:strong major claims impact
2014/16:little major claims impact
2004: first claim > USD 50 million
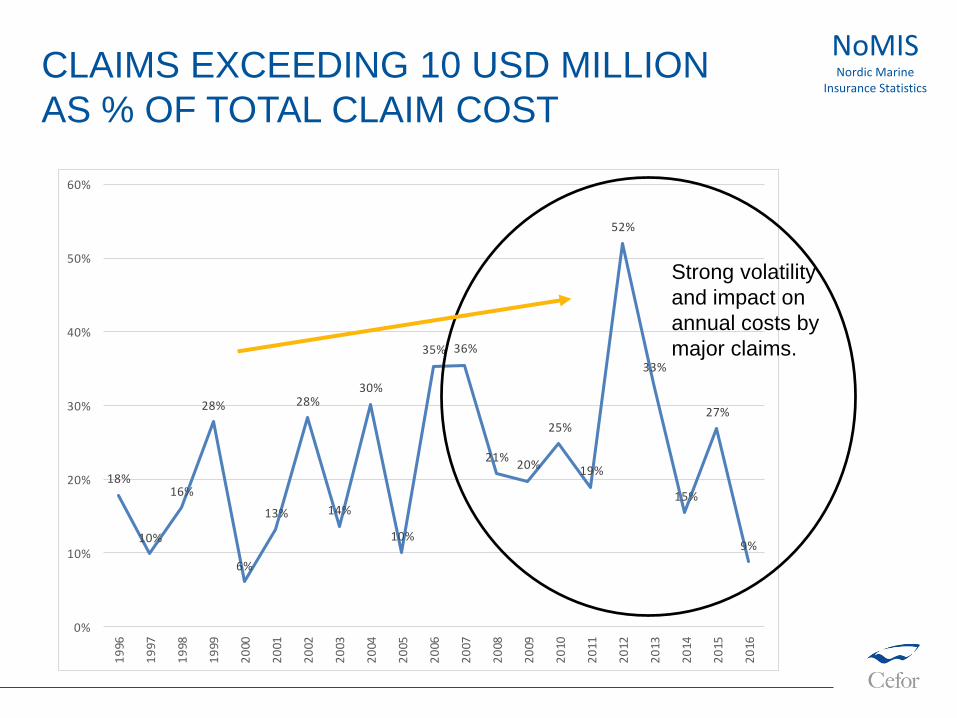
CLAIMS EXCEEDING 10 USD MILLION
AS % OF TOTAL CLAIM COST
18%
10%
16%
28%
6%
13%
28%
14%
30%
10%
35% 36%
21%20%
25%
19%
52%
33%
15%
27%
9%
0%
10%
20%
30%
40%
50%
60%
19
96
19
97
19
98
19
99
20
00
20
01
20
02
20
03
20
04
20
05
20
06
20
07
20
08
20
09
20
10
20
11
20
12
20
13
20
14
20
15
20
16
Strong volatility
and impact on
annual costs by
major claims.
NoMISNordic Marine
Insurance Statistics

CLAIMS FREQUENCY – ALTERNATIVE FACTS (?)
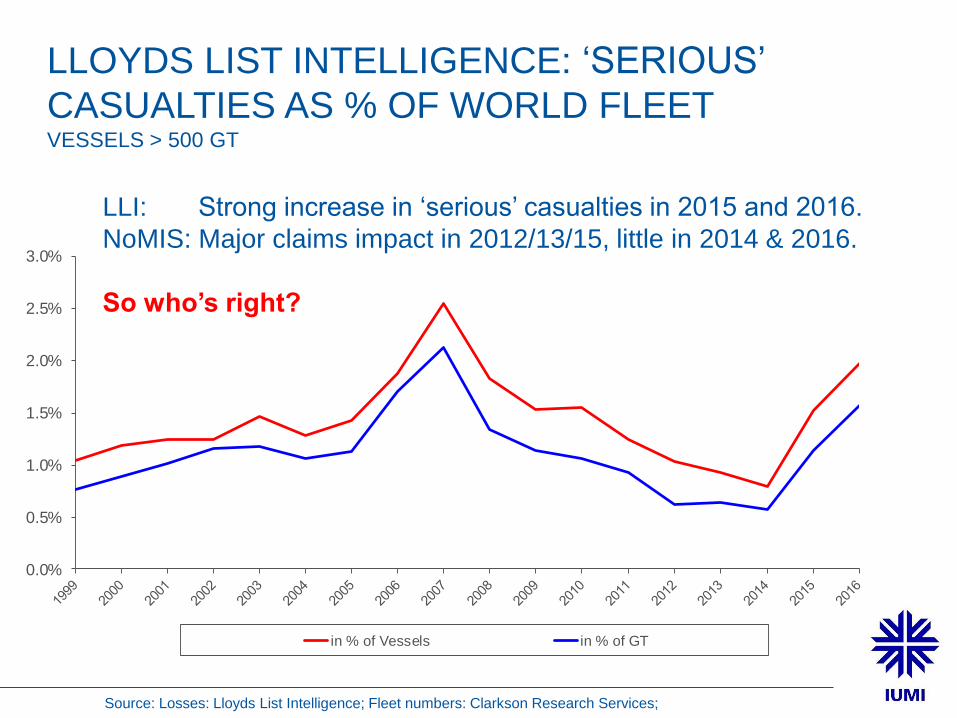
LLOYDS LIST INTELLIGENCE: ‘SERIOUS’
CASUALTIES AS % OF WORLD FLEETVESSELS > 500 GT
0.0%
0.5%
1.0%
1.5%
2.0%
2.5%
3.0%
in % of Vessels in % of GT
LLI: Strong increase in ‘serious’ casualties in 2015 and 2016.
NoMIS: Major claims impact in 2012/13/15, little in 2014 & 2016.
So who’s right?
Source: Losses: Lloyds List Intelligence; Fleet numbers: Clarkson Research Services;

ANSWER: BOTH!
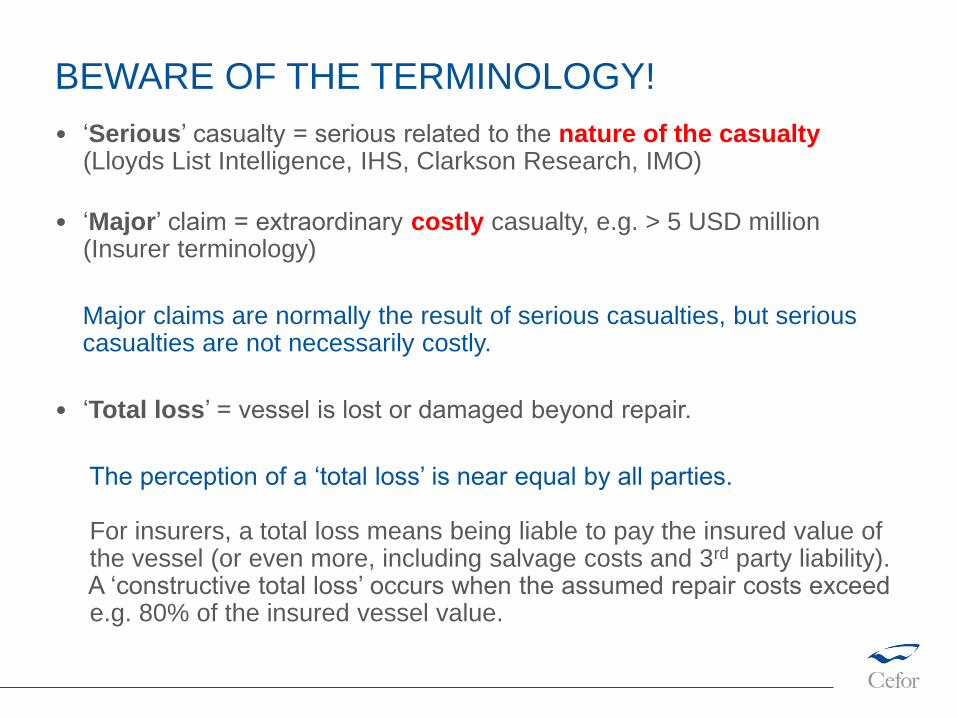
BEWARE OF THE TERMINOLOGY!
• ‘Serious’ casualty = serious related to the nature of the casualty(Lloyds List Intelligence, IHS, Clarkson Research, IMO)
• ‘Major’ claim = extraordinary costly casualty, e.g. > 5 USD million (Insurer terminology)
Major claims are normally the result of serious casualties, but seriouscasualties are not necessarily costly.
• ‘Total loss’ = vessel is lost or damaged beyond repair.
The perception of a ‘total loss’ is near equal by all parties.
For insurers, a total loss means being liable to pay the insured value ofthe vessel (or even more, including salvage costs and 3rd party liability). A ‘constructive total loss’ occurs when the assumed repair costs exceede.g. 80% of the insured vessel value.
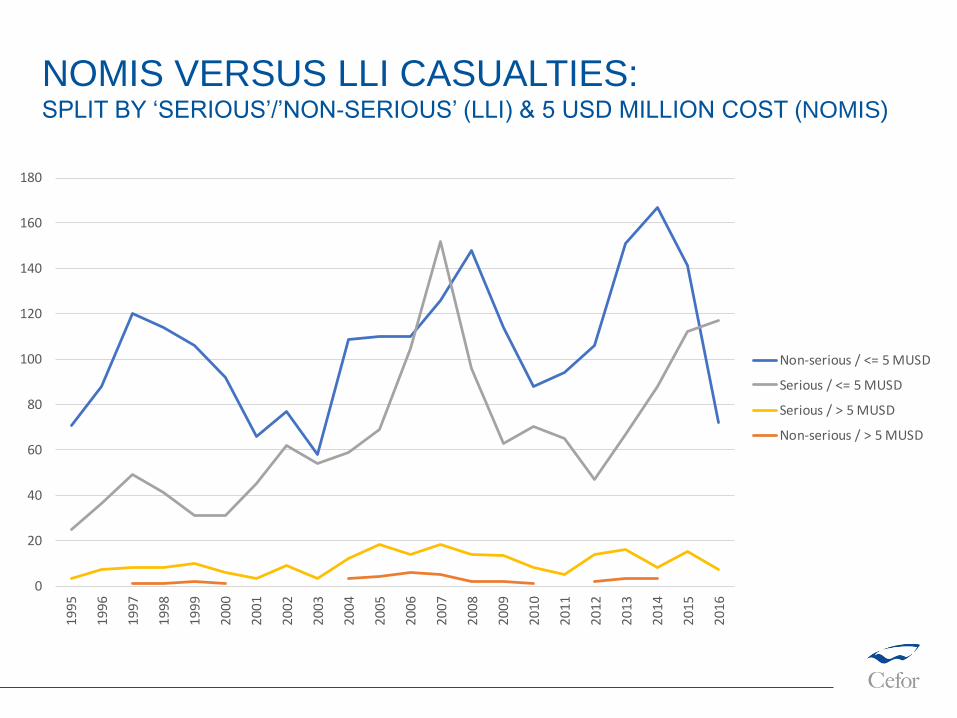
NOMIS VERSUS LLI CASUALTIES:SPLIT BY ‘SERIOUS’/’NON-SERIOUS’ (LLI) & 5 USD MILLION COST (NOMIS)
0
20
40
60
80
100
120
140
160
180
19
95
19
96
19
97
19
98
19
99
20
00
20
01
20
02
20
03
20
04
20
05
20
06
20
07
20
08
20
09
20
10
20
11
20
12
20
13
20
14
20
15
20
16
Non-serious / <= 5 MUSD
Serious / <= 5 MUSD
Serious / > 5 MUSD
Non-serious / > 5 MUSD
HULL CASUALTIES – BY TYPE OF CASUALTY
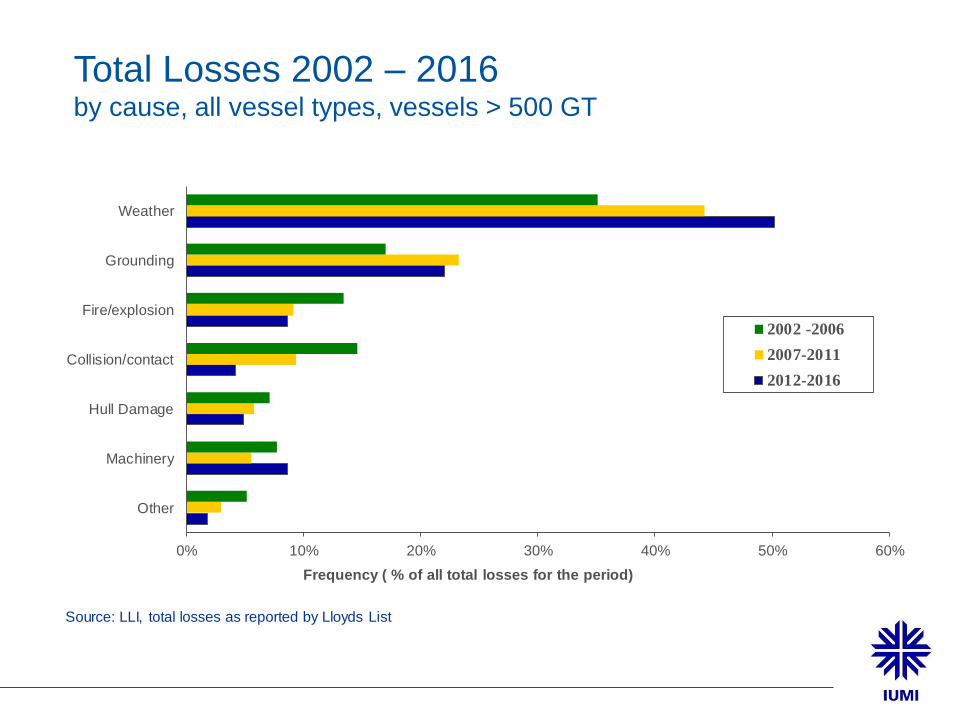
0% 10% 20% 30% 40% 50% 60%
Other
Machinery
Hull Damage
Collision/contact
Fire/explosion
Grounding
Weather
Frequency ( % of all total losses for the period)
2002 -2006
2007-2011
2012-2016
Source: LLI, total losses as reported by Lloyds List
Total Losses 2002 – 2016by cause, all vessel types, vessels > 500 GT
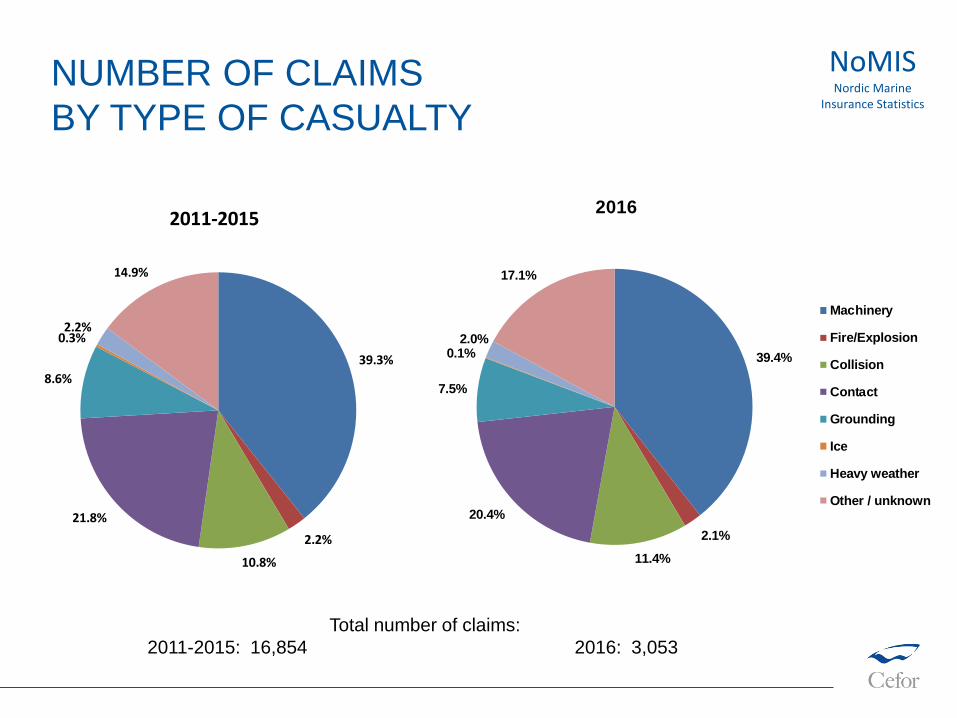
Total number of claims:
2011-2015: 16,854 2016: 3,053
39.3%
2.2%
10.8%
21.8%
8.6%
0.3%2.2%
14.9%
2011-2015
Machinery
Fire/Explosion
Collision
Contact
Grounding
Ice
Heavy weather
Other / unknown
39.4%
2.1%
11.4%
20.4%
7.5%
0.1%2.0%
17.1%
2016
Machinery
Fire/Explosion
Collision
Contact
Grounding
Ice
Heavy weather
Other / unknown
NoMISNordic Marine
Insurance Statistics
NUMBER OF CLAIMS
BY TYPE OF CASUALTY
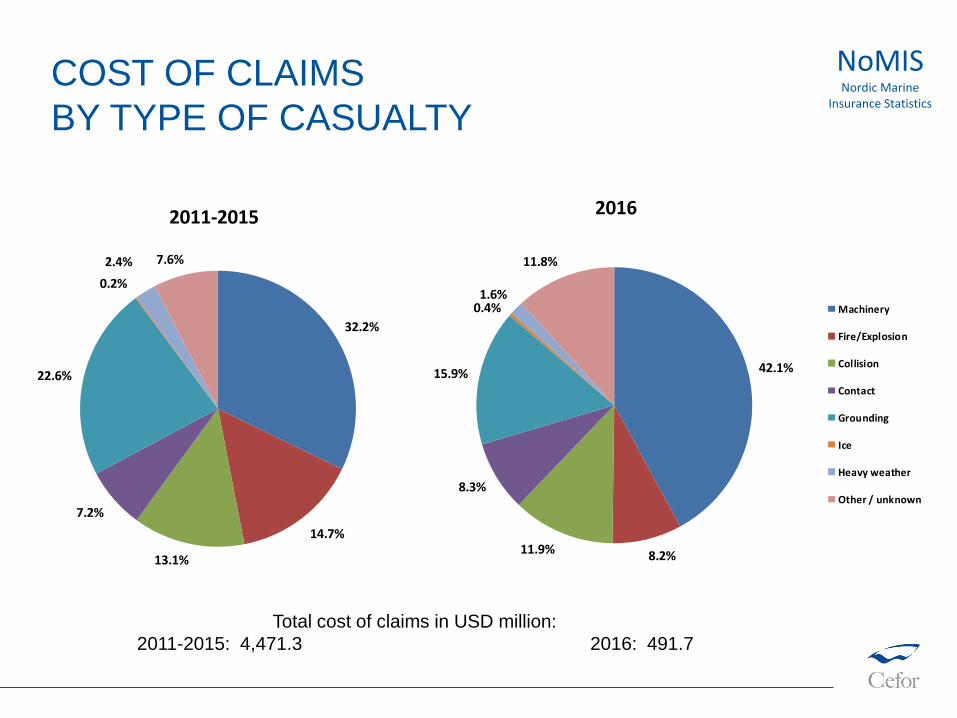
Total cost of claims in USD million:
2011-2015: 4,471.3 2016: 491.7
32.2%
14.7%
13.1%
7.2%
22.6%
0.2%
2.4% 7.6%
2011-2015
Machinery
Fire/Explosion
Collision
Contact
Grounding
Ice
Heavy weather
Other / unknown
42.1%
8.2%11.9%
8.3%
15.9%
0.4%1.6%
11.8%
2016
Machinery
Fire/Explosion
Collision
Contact
Grounding
Ice
Heavy weather
Other / unknown
NoMISNordic Marine
Insurance Statistics
COST OF CLAIMS
BY TYPE OF CASUALTY
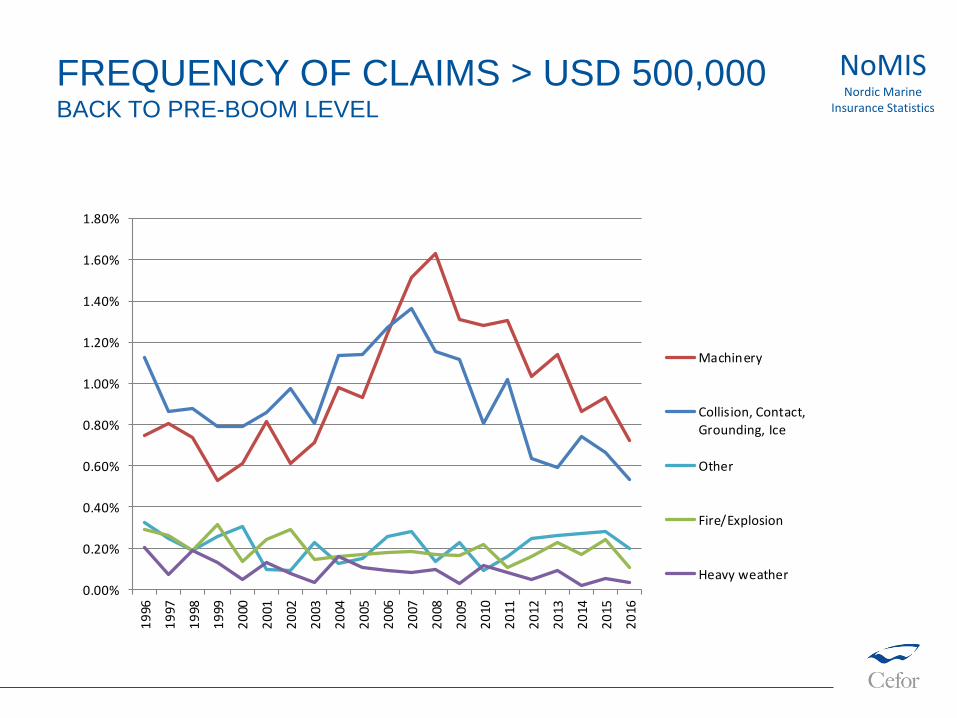
FREQUENCY OF CLAIMS > USD 500,000BACK TO PRE-BOOM LEVEL
NoMISNordic Marine
Insurance Statistics
0.00%
0.20%
0.40%
0.60%
0.80%
1.00%
1.20%
1.40%
1.60%
1.80%
19
96
19
97
19
98
19
99
20
00
20
01
20
02
20
03
20
04
20
05
20
06
20
07
20
08
20
09
20
10
20
11
20
12
20
13
20
14
20
15
20
16
Machinery
Collision, Contact,
Grounding, Ice
Other
Fire/Explosion
Heavy weather
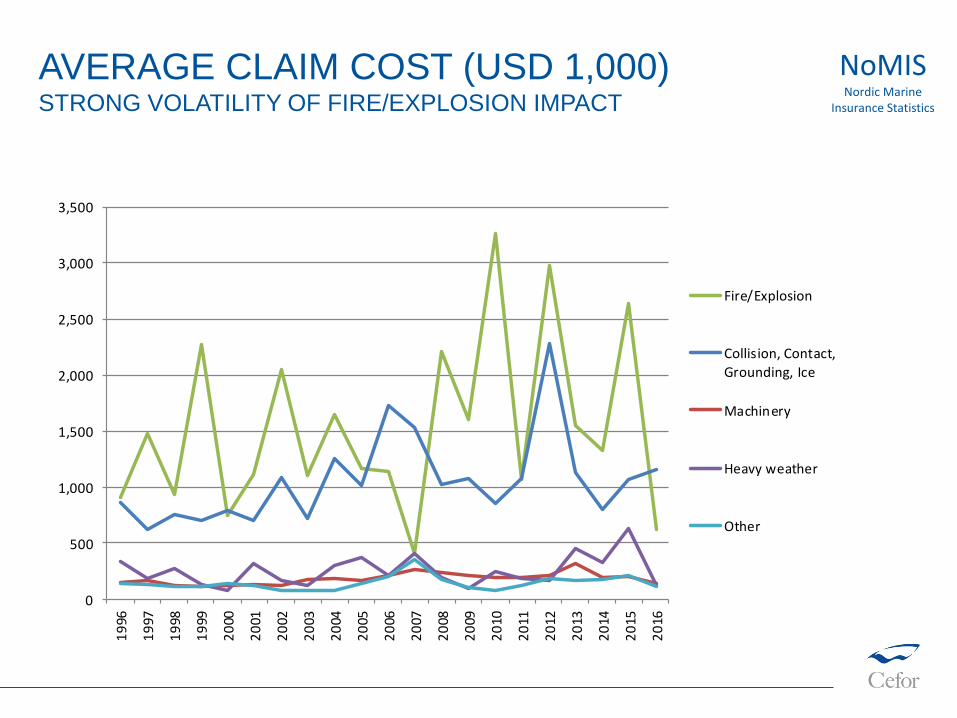
AVERAGE CLAIM COST (USD 1,000)STRONG VOLATILITY OF FIRE/EXPLOSION IMPACT
NoMISNordic Marine
Insurance Statistics
0
500
1,000
1,500
2,000
2,500
3,000
3,500
19
96
19
97
19
98
19
99
20
00
20
01
20
02
20
03
20
04
20
05
20
06
20
07
20
08
20
09
20
10
20
11
20
12
20
13
20
14
20
15
20
16
Fire/Explosion
Collision, Contact,
Grounding, Ice
Machinery
Heavy weather
Other
CLAIMS TRENDS
BY AGE GROUP AND VESSEL TYPE
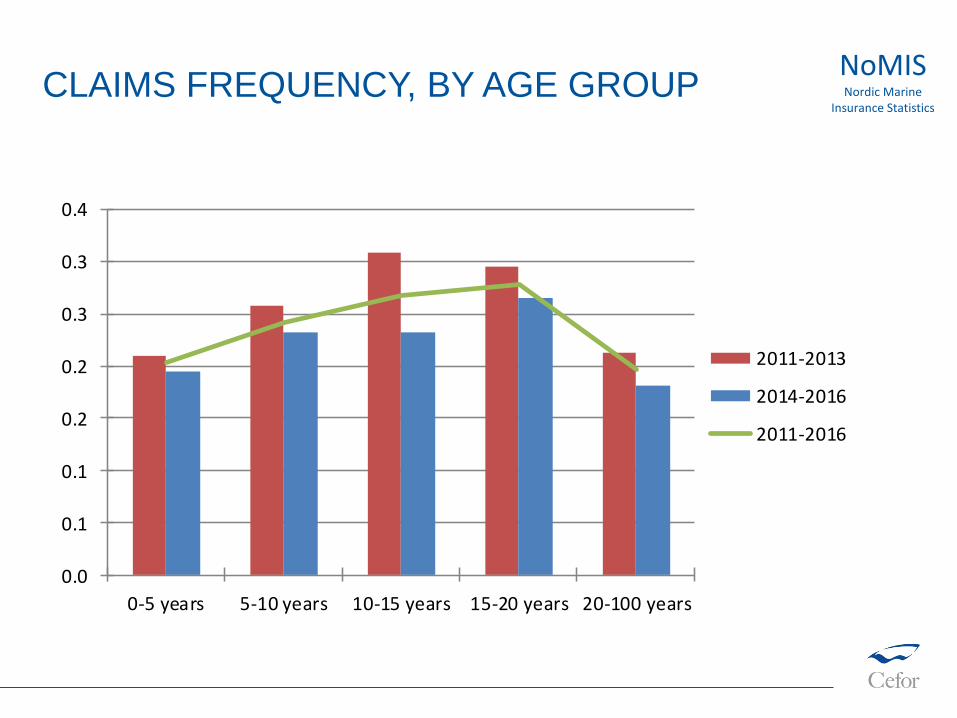
CLAIMS FREQUENCY, BY AGE GROUPNoMISNordic Marine
Insurance Statistics
0.0
0.1
0.1
0.2
0.2
0.3
0.3
0.4
0-5 years 5-10 years 10-15 years 15-20 years 20-100 years
2011-2013
2014-2016
2011-2016
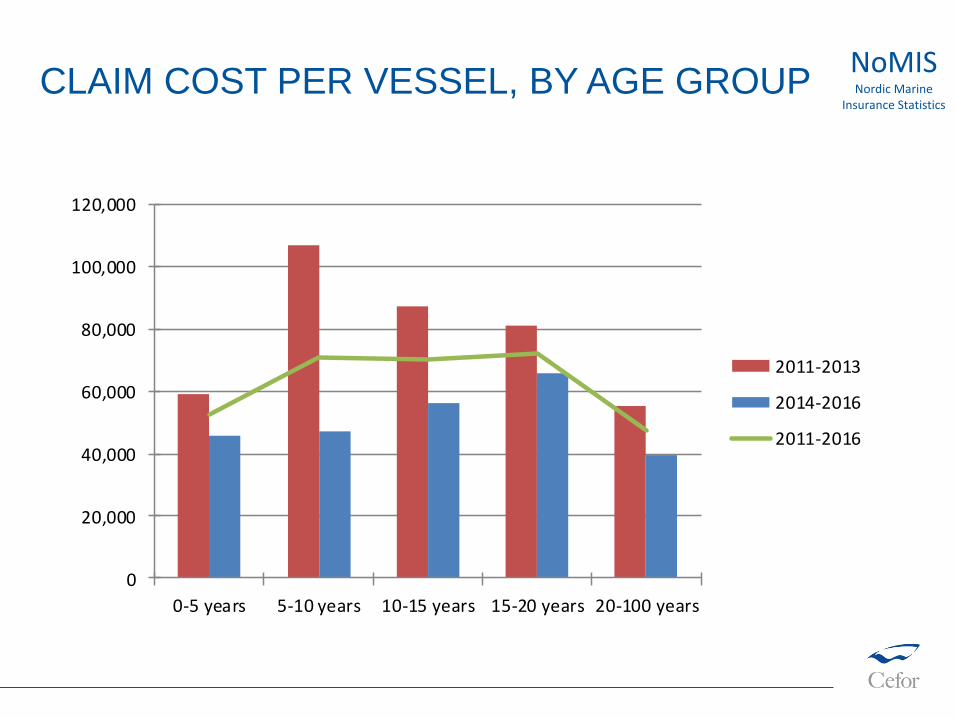
CLAIM COST PER VESSEL, BY AGE GROUPNoMISNordic Marine
Insurance Statistics
0
20,000
40,000
60,000
80,000
100,000
120,000
0-5 years 5-10 years 10-15 years 15-20 years 20-100 years
2011-2013
2014-2016
2011-2016
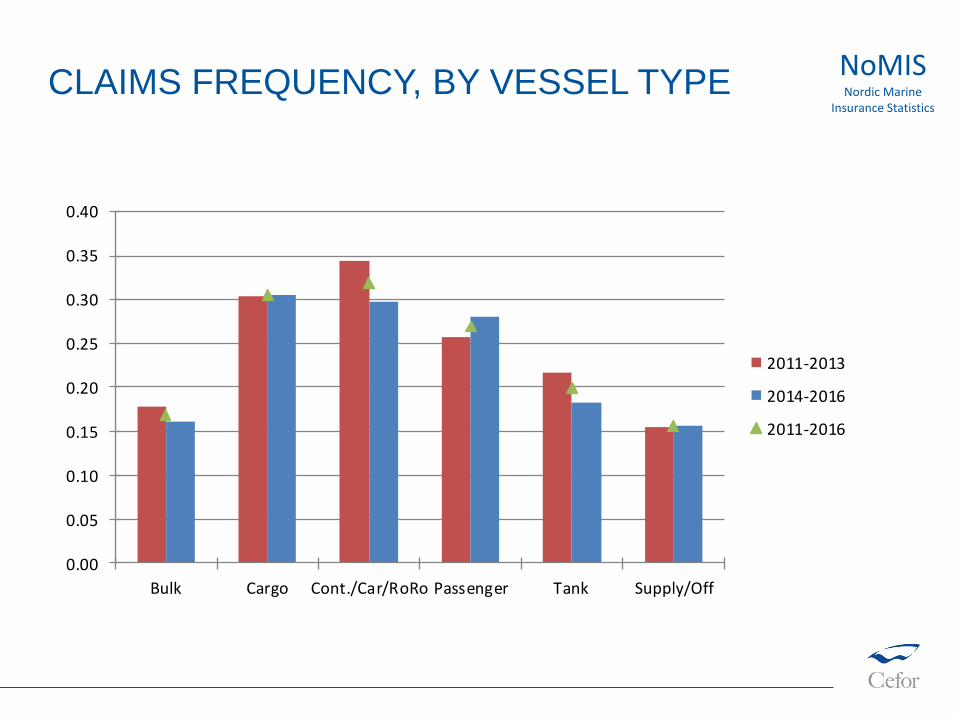
CLAIMS FREQUENCY, BY VESSEL TYPE NoMISNordic Marine
Insurance Statistics
0.00
0.05
0.10
0.15
0.20
0.25
0.30
0.35
0.40
Bulk Cargo Cont./Car/RoRo Passenger Tank Supply/Off
2011-2013
2014-2016
2011-2016

CLAIM COST PER VESSEL, BY VESSEL TYPE NoMISNordic Marine
Insurance Statistics
0
50,000
100,000
150,000
200,000
250,000
300,000
Bulk Cargo Cont./Car/RoRoPassenger Tank Supply/Off
2011-2013
2014-2016
2011-2016
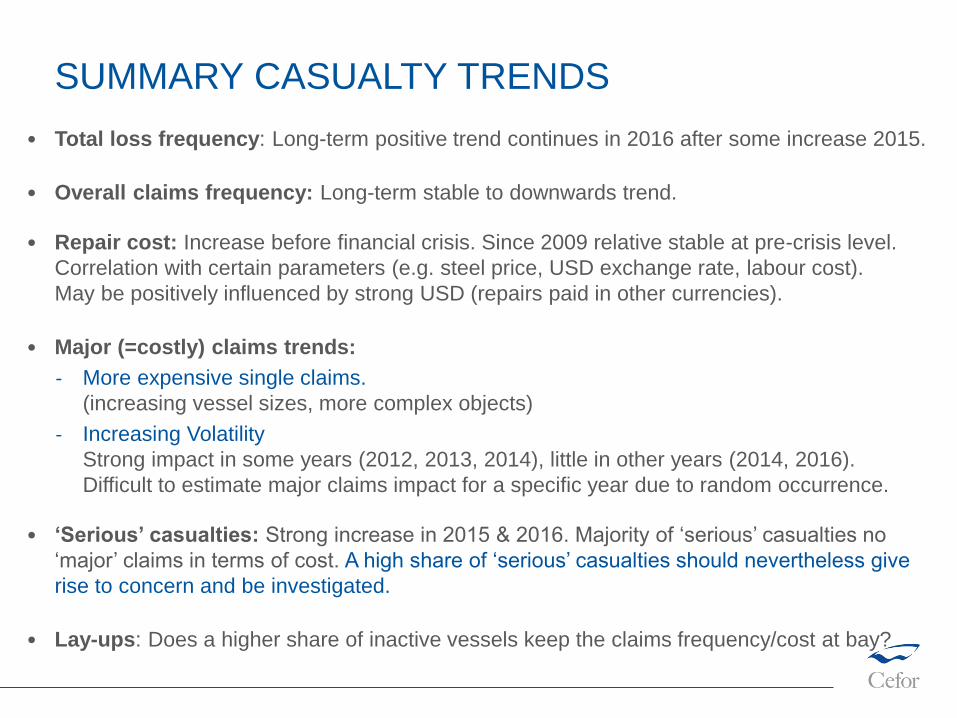
SUMMARY CASUALTY TRENDS
• Total loss frequency: Long-term positive trend continues in 2016 after some increase 2015.
• Overall claims frequency: Long-term stable to downwards trend.
• Repair cost: Increase before financial crisis. Since 2009 relative stable at pre-crisis level.
Correlation with certain parameters (e.g. steel price, USD exchange rate, labour cost).
May be positively influenced by strong USD (repairs paid in other currencies).
• Major (=costly) claims trends:
‐ More expensive single claims.
(increasing vessel sizes, more complex objects)
‐ Increasing Volatility
Strong impact in some years (2012, 2013, 2014), little in other years (2014, 2016).
Difficult to estimate major claims impact for a specific year due to random occurrence.
• ‘Serious’ casualties: Strong increase in 2015 & 2016. Majority of ‘serious’ casualties no
‘major’ claims in terms of cost. A high share of ‘serious’ casualties should nevertheless give
rise to concern and be investigated.
• Lay-ups: Does a higher share of inactive vessels keep the claims frequency/cost at bay?
SPECIAL FOCUS:
- COST DRIVING FACTORS
- EFFECT OF LAY-UP ON CLAIMS FREQUENCY & COST
50.0%
75.0%
100.0%
125.0%
150.0%
175.0%
200.0%
225.0%
250.0%
275.0%
2000 2001 2002 2003 2004 2005 2006 2007 2008 2009 2010 2011 2012 2013 2014 2015 2016 2017
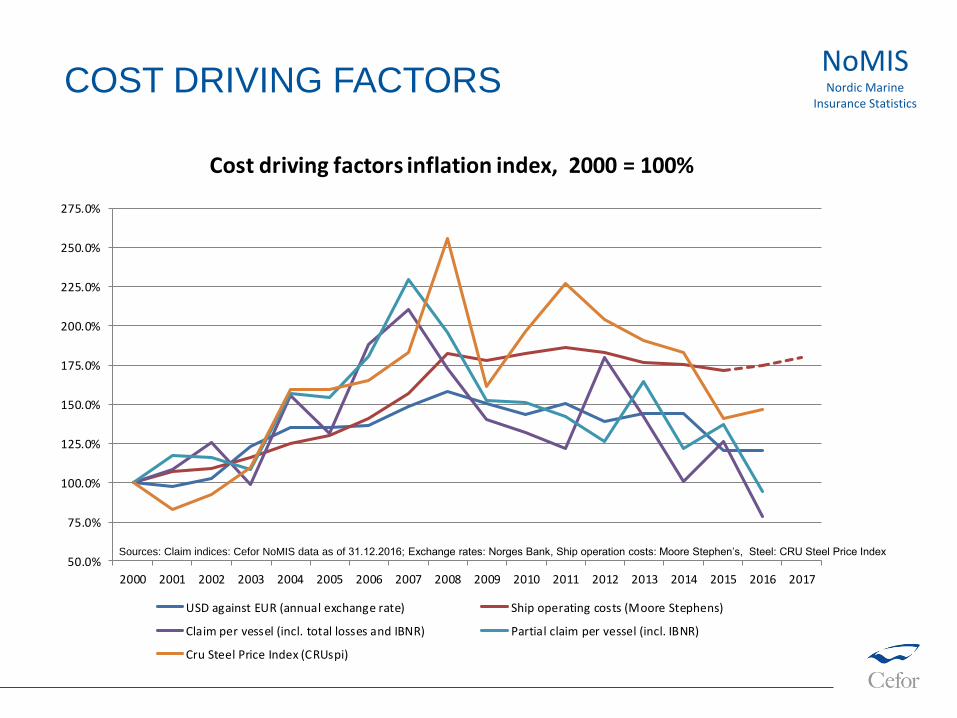
Cost driving factors inflation index, 2000 = 100%
USD against EUR (annual exchange rate) Ship operating costs (Moore Stephens)
Claim per vessel (incl. total losses and IBNR) Partial claim per vessel (incl. IBNR)
Cru Steel Price Index (CRUspi)
Sources: Claim indices: Cefor NoMIS data as of 31.12.2016; Exchange rates: Norges Bank, Ship operation costs: Moore Stephen’s, Steel: CRU Steel Price Index
COST DRIVING FACTORSNoMISNordic Marine
Insurance Statistics
LAY-UP EFFECT – EXAMPLE:
CONTAINER VESSELS LAID UP IN 2009
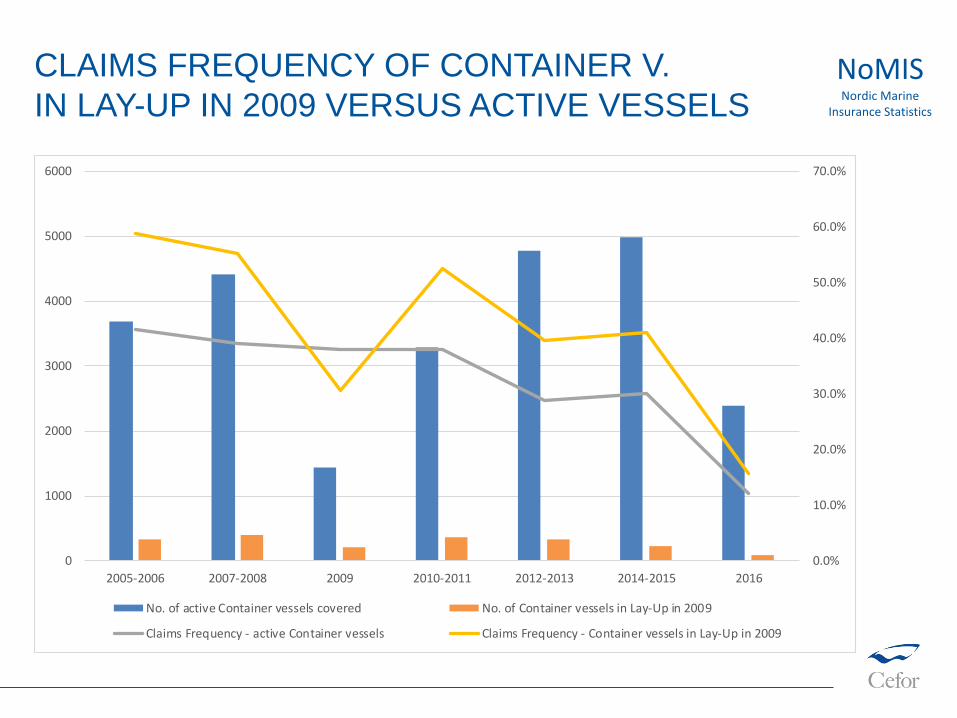
CLAIMS FREQUENCY OF CONTAINER V.
IN LAY-UP IN 2009 VERSUS ACTIVE VESSELS
0.0%
10.0%
20.0%
30.0%
40.0%
50.0%
60.0%
70.0%
0
1000
2000
3000
4000
5000
6000
2005-2006 2007-2008 2009 2010-2011 2012-2013 2014-2015 2016
No. of active Container vessels covered No. of Container vessels in Lay-Up in 2009
Claims Frequency - active Container vessels Claims Frequency - Container vessels in Lay-Up in 2009
NoMISNordic Marine
Insurance Statistics
0.00
50000.00
100000.00
150000.00
200000.00
250000.00
0
1000
2000
3000
4000
5000
6000
2005-2006 2007-2008 2009 2010-2011 2012-2013 2014-2015 2016
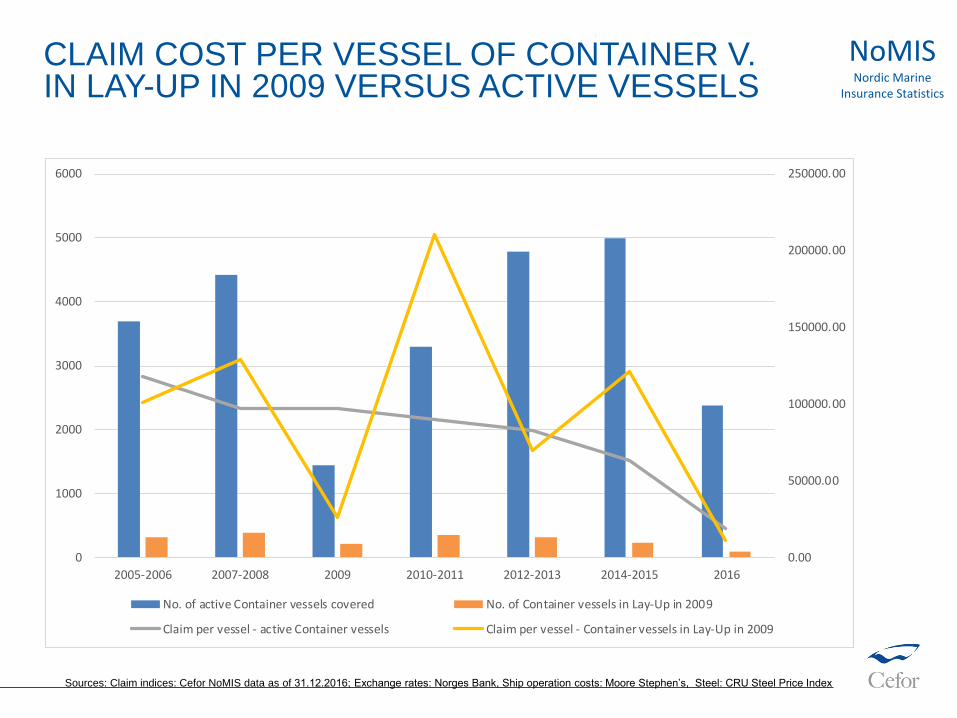
No. of active Container vessels covered No. of Container vessels in Lay-Up in 2009
Claim per vessel - active Container vessels Claim per vessel - Container vessels in Lay-Up in 2009
Sources: Claim indices: Cefor NoMIS data as of 31.12.2016; Exchange rates: Norges Bank, Ship operation costs: Moore Stephen’s, Steel: CRU Steel Price Index
CLAIM COST PER VESSEL OF CONTAINER V.IN LAY-UP IN 2009 VERSUS ACTIVE VESSELS
NoMISNordic Marine
Insurance Statistics
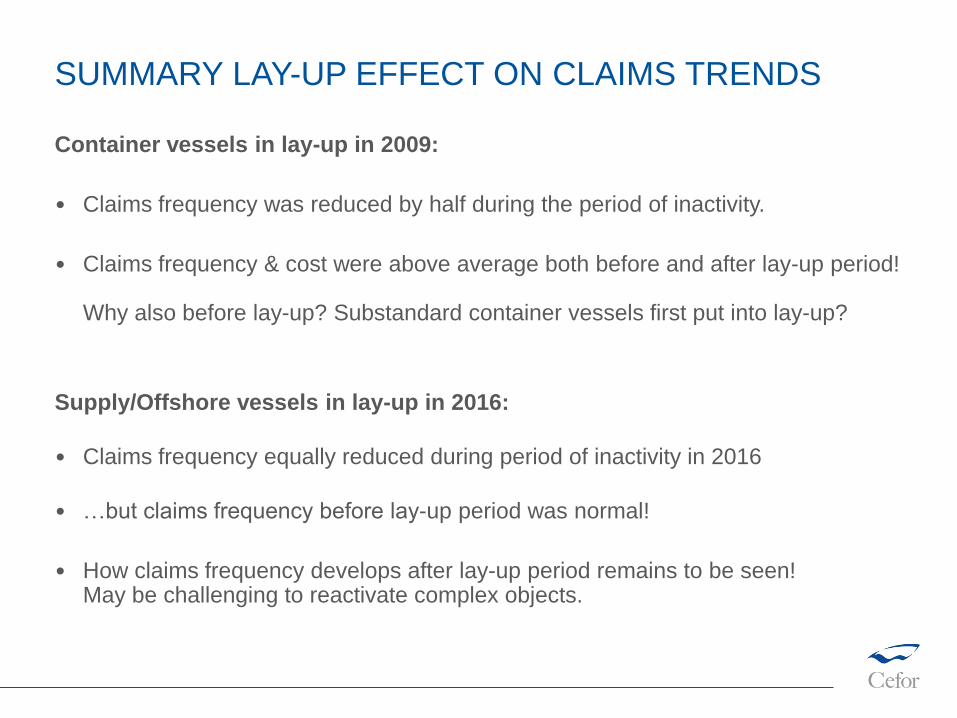
SUMMARY LAY-UP EFFECT ON CLAIMS TRENDS
Container vessels in lay-up in 2009:
• Claims frequency was reduced by half during the period of inactivity.
• Claims frequency & cost were above average both before and after lay-up period!
Why also before lay-up? Substandard container vessels first put into lay-up?
Supply/Offshore vessels in lay-up in 2016:
• Claims frequency equally reduced during period of inactivity in 2016
• …but claims frequency before lay-up period was normal!
• How claims frequency develops after lay-up period remains to be seen!May be challenging to reactivate complex objects.
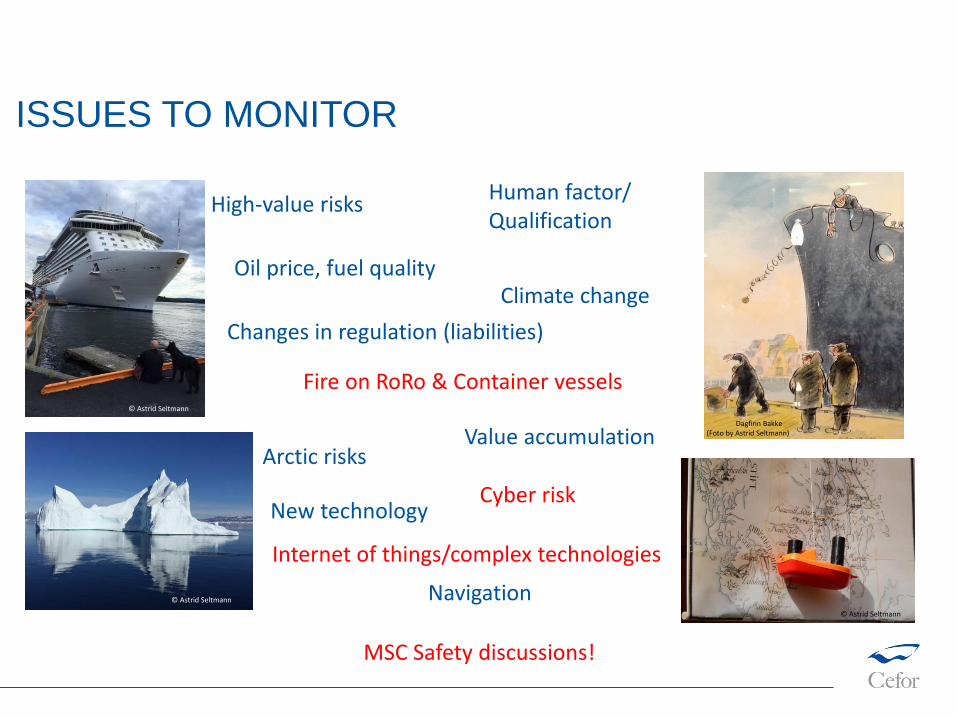
ISSUES TO MONITOR
High-value risks
Arctic risks
© Astrid Seltmann
© Astrid Seltmann
© Astrid Seltmann
Navigation
Oil price, fuel quality
New technology
Climate change
Changes in regulation (liabilities)
Human factor/Qualification
Dagfinn Bakke(Foto by Astrid Seltmann)Value accumulation
MSC Safety discussions!
Cyber risk
Fire on RoRo & Container vessels
Internet of things/complex technologies
IUMI REPORTS 2016/17:
IUMI Statistics: https://iumi.com/statistics
Conference publications: Spring statistics on Cargo, Hull, Offshore energy:
Cefor NoMIS Statistics at http://cefor.no/Statistics/NOMIS/
CEFOR PUBLICATIONS 2017 – HULL TRENDSNORDIC MARINE INSURANCE STATISTICS (NOMIS)
Publishing date 6 April 2017: