Global IT-BPO Outsourcing Deals Analysis1Q15 1Q14-14% No. of deals 1Q14 1Q15-26% •1Q15 witnessed a...
24
Global IT-BPO Outsourcing Deals Analysis 1Q15 Analysis: January to March April 2015
Transcript of Global IT-BPO Outsourcing Deals Analysis1Q15 1Q14-14% No. of deals 1Q14 1Q15-26% •1Q15 witnessed a...

Global IT-BPO Outsourcing Deals Analysis
1Q15 Analysis:January to March
April 2015

1© 2015 KPMG International Cooperative (“KPMG International”), a Swiss entity. Member firms of the KPMG network of independent firms are affiliated with KPMG International. KPMG International provides no client services. No member firm has any authority to obligate or bind KPMG International or any other member firm vis-à-vis third parties, nor does KPMG International have any such authority to obligate or bind any member firm. All rights reserved.
About global IT-BPO outsourcing deals analysis
KPMG in India’s Shared Services and Outsourcing Advisory (SSOA) practice publishes a quarterly analysis on IT-BPO outsourcing contracts signed across industries and geographies, with a total contract value (TCV) of USD5 million and above per deal.
Methodology and limitations of the study:
Our analysis and findings presented in this report are based on select third party deals database including, publicly available outsourcing data as identified throughout this presentation. It does not include contract information gathered from KPMG Sourcing Advisory business engagements.
The count and value of the deals may vary notably in reality and is only indicative of market movements and trends in the IT-BPO space. Readers are requested to use their discretion while assessing the global IT-BPO market accordingly.
For more information on this market research, please get in touch with Shailesh Narwaiye ([email protected]).

Contents
Section 1: Global deals: An overview
Section 3: IT-BPO outsourcing outlook
Section 2: 1Q15 deal analysis

Section 1
Global deals: An overview

4© 2015 KPMG International Cooperative (“KPMG International”), a Swiss entity. Member firms of the KPMG network of independent firms are affiliated with KPMG International. KPMG International provides no client services. No member firm has any authority to obligate or bind KPMG International or any other member firm vis-à-vis third parties, nor does KPMG International have any such authority to obligate or bind any member firm. All rights reserved.
A summary
Source: IDC (www.idc.com), Contract Database, Apr 2015,KPMG in India Research & Analysis based on the IDC contract database
In 1Q15 (January to March), 148 ITO contracts worth USD17.7 billion and nine BPO contracts worth USD1.8 billion were signed, worldwide
IT Infrastructure and Transactional Services contributed USD6.5 billion and USD770 millionrespectively and were the largest procured services globally within ITO and BPO outsourced services, respectively
Globally 35 IT-BPO bundled deals were signed in 1Q15 with contract value worthUSD2.2 billion
In terms of value, approximately 26 per cent of deals by value originated from the United States, followed by Germany at 23 per cent. India and The Netherlands were two other key outsourcing markets
Defence continues to be the top consumer of IT-BPO services contributing to 32 per cent in terms of value of outsourcing deals signed in 1Q15. Government sector witnessed a sharp drop of 82 per cent in terms of total contract value in 1Q15 against 4Q14
Average annualised contract value in 1Q15 was USD38.5 million as compared to USD27 million in 1Q14 showing an increase of 43 per cent between the two quarters
The average deal tenure has consistently been decreasing since 3Q14, with a sharp decrease of twelve months as compared to 4Q14, to 3 years 2 months in 1Q15

5© 2015 KPMG International Cooperative (“KPMG International”), a Swiss entity. Member firms of the KPMG network of independent firms are affiliated with KPMG International. KPMG International provides no client services. No member firm has any authority to obligate or bind KPMG International or any other member firm vis-à-vis third parties, nor does KPMG International have any such authority to obligate or bind any member firm. All rights reserved.
22.7
36.5 35.3
55.9
20.3
43.9
53.3
28.0 25.229.1 39.8
26.4 21.8
292
354
428
516
299
426 422
326
259
316324
245192
Q1 Q2 Q3 Q4 Q1 Q2 Q3 Q4 Q1 Q2 Q3 Q4 Q1
2012 2013 2014 2015
Value (USD billion) No. of deals
Total Deal ValueUSD145.5 billion
Total Deal ValueUSD150.4 billion
Quarterly deal movementsSnapshot
Quarterly movements of global IT-BPO deals*Number of Deals
1,590
-3%
Number of Deals1,473
-7%
*The term deals is interchangeably used with contracts throughout the analysis unless otherwise specified. Deals analysed are global sourcing contracts of size USD5.0 million and above only.
Source: IDC (www.idc.com), Contract Database, Apr 2015,KPMG in India Research & Analysis based on the IDC contract database
Total Deal ValueUSD120.4 billion
-17%
Number of Deals1,144
-22%
Deal Value
1Q15
1Q14-14%
No. of deals
1Q14
1Q15-26%
• 1Q15 witnessed a decrease of 14 per cent in total contract value and total number of deals reduced by 26 per cent as compared to 1Q14, indicating growth in the average deal value.
• The average contract value continued to increase in 1Q15 with an increase of 5 per cent as compared to 4Q14 and 17 per cent as compared to 1Q14 showing a trend of larger size deals being signed in this quarter.

6© 2015 KPMG International Cooperative (“KPMG International”), a Swiss entity. Member firms of the KPMG network of independent firms are affiliated with KPMG International. KPMG International provides no client services. No member firm has any authority to obligate or bind KPMG International or any other member firm vis-à-vis third parties, nor does KPMG International have any such authority to obligate or bind any member firm. All rights reserved.
Annualised contract value (ACV)Q-o-Q comparison
Annualised* contract value comparison per quarter
* Annualised contract value = ( total value of a contract / tenure in months ) x 12
Contract value for contracts having tenure less than 1 year is considered as annualised value for the analysis. Graph is not to scale and only represents the division across different parameters
Source: IDC (www.idc.com), Contract Database, Apr 2015,KPMG in India Research & Analysis based on the IDC contract database
Average annualised contract value (USD million)
Average tenure per contract
Note: All values in USD million unless otherwise specified
63% increase
6% increase
Minimum annualised contract value
Maximum annualised contract value
43% increase
1211.4
179.3
1.06
0.88
3 years 10 months
27.01
14.31
1Q14
1Q13
770.01.04
1Q15
38.49
3 years 2 months
4 years 9 months
• There was an increase of 6 per cent in total annualised contract value in 1Q15 as compared to 1Q14.• The average annualised contract value increased by 43 per cent in 1Q15 as against 1Q14, while the average contract tenure decreased to 3 years 2 months from 3 years 10 months.
4,279
6,995
7,390
3,500 4,500 5,500 6,500 7,500 8,500
1Q13
1Q14
1Q15
Total Annualized Contract Value (USD million)

7© 2015 KPMG International Cooperative (“KPMG International”), a Swiss entity. Member firms of the KPMG network of independent firms are affiliated with KPMG International. KPMG International provides no client services. No member firm has any authority to obligate or bind KPMG International or any other member firm vis-à-vis third parties, nor does KPMG International have any such authority to obligate or bind any member firm. All rights reserved.
*Others: Construction, Consumer and Recreational Services, Education, Professional services, Securities and investment services, Social services, Trade unions, Technology, Wholesale
Source: IDC (www.idc.com), Contract Database, Apr 2015,KPMG in India Research & Analysis based on the IDC contract database
Sector analysisQ-o-Q comparison
Trends in deal movement from 1Q14 to 1Q15
Decrease >=25% Decrease <25% Increase <25% Increase >=25%No change
• Automotive and Aerospace, Defence, Energy and Utilities, Insurance, Pharma and Healthcare and Publishing, Media and Entertainment sectors have exhibited growth greater than 25 per cent in terms of value over 4Q14, while Government, Retail, Telecom, and Others sectors had a decline greater than 25 per cent in total contract value (TCV).
• Continuous growth in average contract value was observed in Banking and Financial Services since 1Q14• Energy and Utilities, Government, Manufacturing, Retail, and telecom sectors have shown a decrease greater than 25 per cent in number of contracts signed in 1Q15 over 4Q14.
Sector
1Q14->2Q14 2Q14 -> 3Q14 3Q14->4Q14 4Q14 -> 1Q15 1Q14->2Q14 2Q14 -> 3Q14 3Q14->4Q14 4Q14 -> 1Q15 1Q14->2Q14 2Q14 -> 3Q14 3Q14->4Q14 4Q14 -> 1Q15
Automotive & Aerospace 2153% ‐92% ‐41% 403% 50% ‐67% 0% 150% 1402% ‐76% ‐41% 101%
Banking & Financial Services ‐5% 141% 77% ‐7% ‐7% ‐24% ‐37% ‐8% 3% 218% 181% 2%
Defence 195% 219% ‐72% 45% 213% 132% ‐56% 27% ‐6% 37% ‐36% 14%
Energy & Utilities 39% 51% ‐75% 64% 0% 111% ‐32% ‐31% 39% ‐28% ‐63% 137%
Government 277% 28% ‐54% ‐82% 75% ‐18% ‐14% ‐61% 116% 57% ‐46% ‐53%
Insurance 54% ‐50% 331% 36% ‐56% ‐25% 100% 17% 246% ‐33% 115% 16%
Manufacturing 24% ‐81% 91% ‐2% 8% ‐50% 15% ‐53% 15% ‐63% 66% 110%
Pharma & Healthcare ‐30% ‐90% ‐93% 2242% ‐53% ‐43% ‐75% 200% 50% ‐82% ‐72% 681%
Publishing, Media & Entertainment 4222% ‐73% ‐96% 786% 350% ‐67% ‐67% 100% 860% ‐18% ‐88% 343%
Retail ‐53% 35% ‐25% ‐48% 67% ‐50% 40% ‐71% ‐72% 170% ‐47% 82%
Telecom ‐81% 24% 47% ‐59% ‐30% ‐23% 17% ‐39% ‐72% 60% 26% ‐33%
Travel & Logistics ‐79% 18% 263% 4% ‐56% 25% 40% ‐14% ‐53% ‐5% 160% 22%
Others* ‐58% ‐70% 956% ‐43% ‐5% ‐24% 13% 22% ‐56% ‐61% 838% ‐53%
Total Contract Value Total Number of Contracts Average Contract Value

8© 2015 KPMG International Cooperative (“KPMG International”), a Swiss entity. Member firms of the KPMG network of independent firms are affiliated with KPMG International. KPMG International provides no client services. No member firm has any authority to obligate or bind KPMG International or any other member firm vis-à-vis third parties, nor does KPMG International have any such authority to obligate or bind any member firm. All rights reserved.
Deal analysis Q-o-Q comparison
Trends in deal movement from 1Q14 to 1Q15
Source: IDC (www.idc.com), Contract Database, Apr 2015,KPMG in India Research & Analysis based on the IDC contract database
Decrease >=25% Decrease <25% Increase <25% Increase >=25%No change
• Total contract value for long tenure deals (more than 5 years) decreased by more than 25 per cent while short tenure deals (less than 1 year) grew by more than 25 per cent in 1Q15 over 4Q14.
• While the other deal categories witnessed a decrease in number of contracts, Bundled deals increased by more than 25 per cent in 1Q15 as compared to 4Q14.
• Continuous growth in average contract value was observed for long tenure deals (more than 5 years) since 2Q14.
• Almost all of the deal value categories have displayed a decrease in both TCV and number of contracts for the past two quarters.
Deal Type
1Q14->2Q14 2Q14 -> 3Q14 3Q14->4Q14 4Q14 -> 1Q15 1Q14->2Q14 2Q14 -> 3Q14 3Q14->4Q14 4Q14 -> 1Q15 1Q14->2Q14 2Q14 -> 3Q14 3Q14->4Q14 4Q14 -> 1Q15
ITO 15% ‐33% 26% ‐18% 12% ‐25% 0% ‐25% 2% ‐11% 26% 9%
BPO 24% 693% ‐90% 1% 141% 151% ‐73% ‐68% ‐48% 216% ‐63% 213%
Bundled 21% 285% ‐39% ‐24% 44% 85% ‐17% 75% ‐16% 109% ‐27% ‐56%
Less than USD 100 MN 27% 1% ‐27% ‐18% 1% 13% ‐20% ‐20% 25% ‐11% ‐9% 2%
Betw een USD 100- 500 MN 100% ‐5% ‐51% ‐10% 134% ‐36% ‐32% ‐29% ‐14% 49% ‐28% 27%
More than USD 500 MN ‐58% 247% ‐19% ‐22% ‐63% 567% ‐55% ‐22% 13% ‐48% 80% 1%
Less than 1-year ‐40% 108% ‐54% 61% ‐24% 35% ‐37% ‐5% ‐21% 54% ‐27% 68%
Betw een 1 to 5-years ‐27% 39% ‐46% 6% ‐5% 15% ‐15% ‐16% ‐24% 21% ‐36% 26%
More than 5-years 270% 32% ‐19% ‐38% 285% ‐29% ‐46% ‐58% ‐4% 86% 52% 48%
Total Contract Value Total Number of Contracts Average Contract Value
9© 2015 KPMG International Cooperative (“KPMG International”), a Swiss entity. Member firms of the KPMG network of independent firms are affiliated with KPMG International. KPMG International provides no client services. No member firm has any authority to obligate or bind KPMG International or any other member firm vis-à-vis third parties, nor does KPMG International have any such authority to obligate or bind any member firm. All rights reserved.
12.1
97.6
5.4
64.9
7.1
175
887
101
649
99
1Q13 2013 1Q14 2014 1Q15
2.7
8.8
2.3
8.0 4.1 25
134
26
97
15
1Q13 2013 1Q14 2014 1Q15
5.4
39.1
17.5
47.5
10.6
99
452
132
398
78
1Q13 2013 1Q14 2014 1Q15
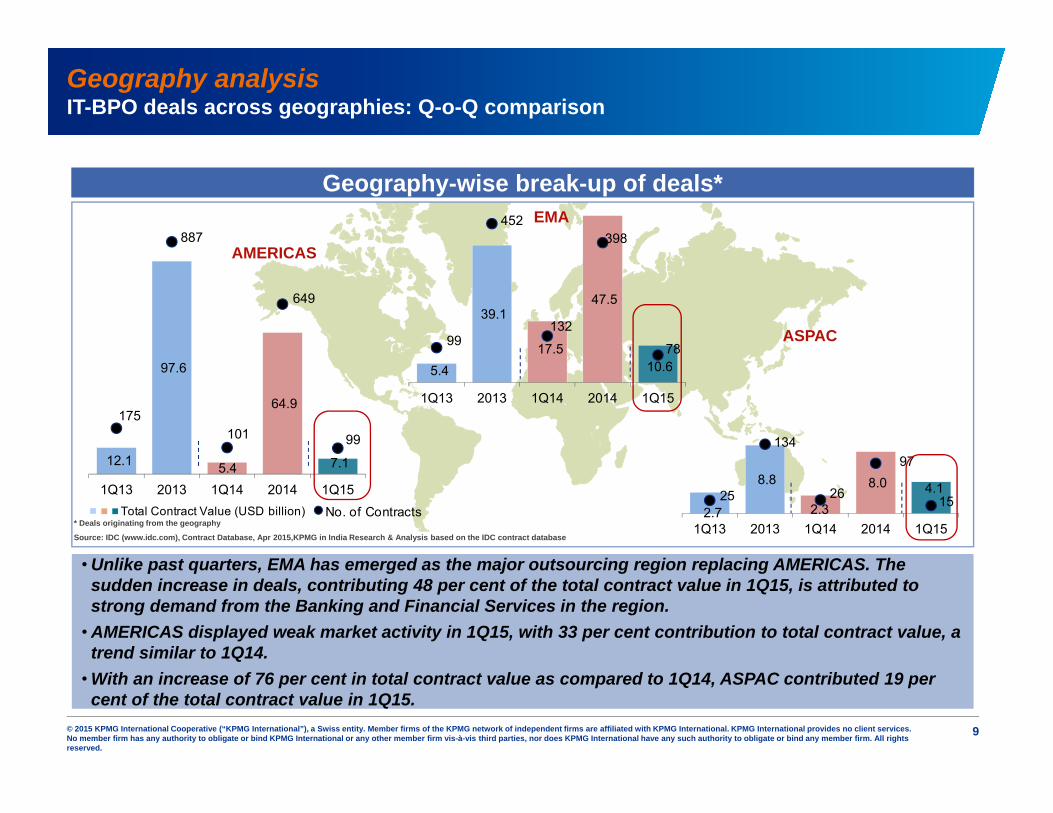
Geography analysisIT-BPO deals across geographies: Q-o-Q comparison
Geography-wise break-up of deals*
* Deals originating from the geography
Source: IDC (www.idc.com), Contract Database, Apr 2015,KPMG in India Research & Analysis based on the IDC contract database
EMA
AMERICAS
ASPAC
No. of ContractsTotal Contract Value (USD billion)
• Unlike past quarters, EMA has emerged as the major outsourcing region replacing AMERICAS. The sudden increase in deals, contributing 48 per cent of the total contract value in 1Q15, is attributed to strong demand from the Banking and Financial Services in the region.
• AMERICAS displayed weak market activity in 1Q15, with 33 per cent contribution to total contract value, a trend similar to 1Q14.
• With an increase of 76 per cent in total contract value as compared to 1Q14, ASPAC contributed 19 per cent of the total contract value in 1Q15.

10© 2015 KPMG International Cooperative (“KPMG International”), a Swiss entity. Member firms of the KPMG network of independent firms are affiliated with KPMG International. KPMG International provides no client services. No member firm has any authority to obligate or bind KPMG International or any other member firm vis-à-vis third parties, nor does KPMG International have any such authority to obligate or bind any member firm. All rights reserved.
1.3
0.4
3.6
0.4
2.4
1.6
1.0 0.5
0.1
11.1
0.6
5.3 9.8
3.2
0.2 0.3 0.4 0.4
2.4
0.1 0.1 0.1
2.7
0.2
16.9 12.65.7
0.8 0.2
1.5
0.9 0.6 0.01 0.01 0.1
3.9
2.0
4.85.8
5.3
1.2 0.9
1.6
0.8 1.0
0.2 0.05 0.1
1.6 1.1
7.0
1.1
Sector analysisIT-BPO deals across sectors by value and numbers
Sector-wise break-up of deals (2Q14 to 1Q15)
Dea
l Val
ue (U
SD b
illio
n)
Banking and
Financial Services
Insurance Automotive and
Aerospace
Travel and Logistics
Manufacturing Energy and Utilities
Pharma and
Healthcare
Publishing, Media and
Entertainment
Retail Telecom Others * Defence Government
No. of contracts* Others: Consumer and recreational services, Construction, Education, Professional services, Securities and investment services, Technology, Wholesale
Graph is not to scale and only represents the division across different parameters. Figures may not add up to 100 per cent due to rounding off
Source: IDC (www.idc.com), Contract Database, Apr 2015, KPMG in India Research & Analysis based on the IDC contract database
Q2-2014 Q3-2014 Q4-2014
TCV : USD21.8 billionNo. of contracts: 192
Q1-2015
12
25
19
6
11
43
7
26
2
14 1513
1 1
7
28
57
9
3 2
17
8
26
97
9 10
31
21
1013
19
4 35
24
1612
18
51
22
6550
116
9077
110
• Defence and Banking and Financial Services lead the deal activity, together contributing to 56 per cent of the total contract value signed in 1Q15.
• Unlike past quarters, the Government sector witnessed a weak market activity with a sharp drop of 82 per cent in terms of total contract value in 1Q15 against 4Q14.
• Total contract value for Telecom witnessed a decrease of 59 per cent in 1Q15 as compared to 4Q14.
30
2

11© 2015 KPMG International Cooperative (“KPMG International”), a Swiss entity. Member firms of the KPMG network of independent firms are affiliated with KPMG International. KPMG International provides no client services. No member firm has any authority to obligate or bind KPMG International or any other member firm vis-à-vis third parties, nor does KPMG International have any such authority to obligate or bind any member firm. All rights reserved.
New and renewal* deal analysisQ-o-Q comparison
Analysis of new and renewal* deals
* Renewal deals include contracts which have been extended, expanded, extended & expanded and renegotiated
Source: IDC (www.idc.com), Contract Database, Apr 2015,KPMG in India Research & Analysis based on the IDC contract database
• Overall since 2012, there has been a consistent increase in percentage of contribution of new deals in the first quarter of each year.
• In BPO, there has been a significant decrease in contract renewals, it contributed to 14 per cent of total deals in 1Q12 and increased to more than 40 per cent over the following years.
17.6 17.1
21.8 19.6
5.1 3.2 3.4
2.2
Q1 Q1 Q1 Q1
2012 2013 2014 2015
12.9
10.1
19.8
17.0
4.4
0.52.6
0.7
Q1 Q1 Q1 Q1
2012 2013 2014 2015
3.7
1.9
1.1 1.0
0.6
1.9
0.8 0.8
Q1 Q1 Q1 Q1
2012 2013 2014 2015
All deals ITO BPO
New RenewalTotal contract value (in USD Bn)

Section 2
1Q15 deal analysis

13© 2015 KPMG International Cooperative (“KPMG International”), a Swiss entity. Member firms of the KPMG network of independent firms are affiliated with KPMG International. KPMG International provides no client services. No member firm has any authority to obligate or bind KPMG International or any other member firm vis-à-vis third parties, nor does KPMG International have any such authority to obligate or bind any member firm. All rights reserved.
ITO17.7
BPO1.8
Bundled2.2
Americas7.1
EMA10.6
ASPAC4.1
Less than USD 100 MN4.2
Between USD 100- 500 MN7.4
More than USD 500 MN10.2
Less than 1-year0.7
Between 1 to 5-years12.1
More than 5-years9.0
Fixed Price11.9
Hybrid9.5
0.4 0.04
Services Region Contract Value Tenure Pricing* Deals analysed are USD5.0 million and above only, throughout the analysis. Graph is not to scale and only represents the division across different parameters. Figures may not add up to 100 per cent due to rounding off
# Hybrid pricing includes a combination of various pricing mechanisms
Source: IDC (www.idc.com), Contract Database, Apr 2015, KPMG in India Research & Analysis based on the IDC contract database
IT-BPO deals* signed in 1Q15 (Total contract value: USD21.8 billion)
Total contract
value
USD21.8 billion
• ITO deals continue to dominate the outsourcing space, though the total ITO deal value decreased by 18 per cent in 1Q145 over 4Q14, ITO deals form more than 80 per cent of the total deal value.
• Over the last two quarters, EMA has emerged as the largest outsourcing region, contributing 48 per cent of the total deal value in 1Q15. The AMERICAS have seen a further decrease in outsourcing while ASPAC has experienced multi-fold growth over 4Q14.
• 1Q15 saw the continued dominance of Fixed Price contracting model, contributing 54 per cent of the deal value, followed by Hybrid model, contributing 44 per cent.
0%
10%
20%
30%
40%
50%
60%
70%
80%
90%
100%
Deal valueGlobal sourcing snapshot: January to March 2015
OthersTime & Material
#

14© 2015 KPMG International Cooperative (“KPMG International”), a Swiss entity. Member firms of the KPMG network of independent firms are affiliated with KPMG International. KPMG International provides no client services. No member firm has any authority to obligate or bind KPMG International or any other member firm vis-à-vis third parties, nor does KPMG International have any such authority to obligate or bind any member firm. All rights reserved.
ITO148
BPO9
Bundled35
Americas99
EMA78
ASPAC15
Less than USD 100 MN153
Between USD 100- 500 MN32
More than USD 500 MN7
Less than 1-year21
Between 1 to 5-years155
More than 5-years16
Fixed Price147
Hybrid32
112
Services Region Contract Value Tenure Pricing
IT-BPO deals* signed in 1Q15 (Total number of contracts: 192)
Total contracts
192
• The overall number of contracts has decreased by 22 per cent in 1Q15 over 4Q14, with a similar trend being seen across regions as well as service type. Bundled deals have shown a 75 per cent growth in terms of numbers in 1Q15 as compared in 4Q14.
• There has been a significant (~ 68 per cent) reduction in the number of BPO deals in 1Q15 over 4Q14 and overall BPO deals contribute to only 5 per cent of the total number of deals. This is very similar to 1Q14 when BPO deals contributed to 7 per cent of total deals by numbers.
0%
10%
20%
30%
40%
50%
60%
70%
80%
90%
100%
* Deals analysed are USD5.0 million and above only, throughout the analysis. Graph is not to scale and only represents the division across different parameters. Figures may not add up to 100 per cent due to rounding off
# Hybrid pricing includes a combination of various pricing mechanisms
Source: IDC (www.idc.com), Contract Database, Apr 2015, KPMG in India Research & Analysis based on the IDC contract database
Number of dealsGlobal sourcing snapshot: January to March 2015
#
OthersTime & Material

15© 2015 KPMG International Cooperative (“KPMG International”), a Swiss entity. Member firms of the KPMG network of independent firms are affiliated with KPMG International. KPMG International provides no client services. No member firm has any authority to obligate or bind KPMG International or any other member firm vis-à-vis third parties, nor does KPMG International have any such authority to obligate or bind any member firm. All rights reserved.
1.10.3
2.5
4.0
0.01
6.5
0.2
3.1
0.1
ADM11%
ERP5%
ICT Services15%
IT Bundled services39%
IT Consulting1%
IT Infrastructure9%
IT Products6%Other IT Services,
3%
SI12%
0
1
2
3
4
5
6
7
8
0 10 20 30 40 50 60 70
Analysis of ITO deals 1Q15
Tota
l Val
ue o
f con
trac
ts (U
SD B
illio
n)
Number of DealsNote: Size of bubble indicates percentage share of the total number of ITO deals
SI – System Integration, Other IT services – Software testing, IT Education and Training, SaaS
Source: IDC (www.idc.com), Contract Database, Apr 2015, KPMG in India Research & Analysis based on the IDC contract database
• IT Infrastructure, IT Bundled Services, and System Integration together contributed 77 per cent of ITO deals in terms of value during 1Q15.
• While System Integration and IT Infrastructure have exhibited multifold growth in 1Q15 as compared to 1Q14, ICT services and ADM have exhibited more than 75 per cent reduction in growth during the same period.
Value of contracts (USD Billion)Note: All values in USD billion. Scale of graph is just representative to illustrate the division across different parameters. Figures may not add up to 100 per cent due to rounding off. Refer L.H.S. figure for legend
Source: IDC (www.idc.com), Contract Database, Apr 2015, KPMG in India Research & Analysis based on the IDC contract database
17.7
ADM ERP TotalITO
ICT IT Bundled
ITInfra.
ITProducts
Other ITServices
SIIT Conslt.
Services segmentationITO services

16© 2015 KPMG International Cooperative (“KPMG International”), a Swiss entity. Member firms of the KPMG network of independent firms are affiliated with KPMG International. KPMG International provides no client services. No member firm has any authority to obligate or bind KPMG International or any other member firm vis-à-vis third parties, nor does KPMG International have any such authority to obligate or bind any member firm. All rights reserved.
94 88
37
308
462
17 30
770
BPO Bundled services
11% Content Management
22%CRM11%
F&A11%
HRO11%
KPO11%
Transactional Services
11%
Other BPO Services
11%
0
100
200
300
400
500
600
700
800
900
0 4
1,806
BPOBundledServices
Content Mgmt.
CRM TotalBPO
HRO KPO Transac-tional
Services
OtherBPO
Services
F&A
Analysis of BPO deals 1Q15
Tota
l Val
ue o
f con
trac
ts (U
SD M
illio
n)
Number of Deals Value of contracts (USD Million)Note: Size of bubble indicates percentage share of the total number of BPO deals
Other BPO services – Data management, logistics etc.
Source: IDC (www.idc.com), Contract Database, Apr 2015, KPMG in India Research & Analysis based on the IDC contract database
Note: All values in USD million. Scale of graph is just representative to illustrate the division across different parameters. Figures may not add up to 100 per cent due to rounding off. Refer L.H.S. figure for legend
Source: IDC (www.idc.com), Contract Database, Apr 2015, KPMG in India Research & Analysis based on the IDC contract database
• Pure play BPO deals have significantly reduced in market share over the last few quarters, though there was a nominal increase of 1 per cent in 1Q15 as compared to 4Q14 in terms of deal value.
• After few quarters of weak activity, F&A services rose back with multifold growth in 1Q15 as compared to 4Q14. HRO and Transactional Services have also exhibited multifold growth in the same period.
Services segmentationBPO services

Section 3IT-BPO outsourcing outlook
18© 2015 KPMG International Cooperative (“KPMG International”), a Swiss entity. Member firms of the KPMG network of independent firms are affiliated with KPMG International. KPMG International provides no client services. No member firm has any authority to obligate or bind KPMG International or any other member firm vis-à-vis third parties, nor does KPMG International have any such authority to obligate or bind any member firm. All rights reserved.
OutlookGlobal outsourcing industry
■ 1Q15 has opened up the year on lines similar to previous first quarters of the last few years with lesser deal activity. But this is portent of an increased number of deals in the coming months as with the previous years.
■ Many organisations are continuing to expand the scale and scope of their outsourcing efforts geographically, cross-functionally, from a more wide-ranging process standpoint, and with the inclusion of more bundled deals.
■ Though there has been a significant drop in outsourcing by the Government, Government and Defence sectors continue to be the largest outsourcers in 1Q15 compared to other industries. Banking and financial services companies have driven many outsourcing deals this quarter.
■ The hybrid and fixed pricing models are strong favorites while there has been a decrease in the share of hybrid pricing deals over the quarters. This may indicate a reduction in the risk appetite of the vendors
■ We are seeing a reducing dominance of AMERICAS in the global buyer market for outsourcing services although it continues to be the major outsourcing region, EMA is continuing to gain outsourcing momentum.
■ In terms of outsourcing relationships, the recent 1Q15 Pulse survey1 indicates that traditional generic and transactional outsourcing continues to commoditise. Cloud, client maturity and going forward process automation are major drivers for this, especially in IT. Buyers are seeking more platform solutions tailored to specific industry, geographic, and regulatory needs and that can drive business value beyond cost savings.
1 KPMG SSOA Pulse survey 1Q15
Source: IDC (www.idc.com), Contract Database, Apr 2015, KPMG in India Research & Analysis based on the IDC contract database

19© 2015 KPMG International Cooperative (“KPMG International”), a Swiss entity. Member firms of the KPMG network of independent firms are affiliated with KPMG International. KPMG International provides no client services. No member firm has any authority to obligate or bind KPMG International or any other member firm vis-à-vis third parties, nor does KPMG International have any such authority to obligate or bind any member firm. All rights reserved.
To learn more, log on to http://www.kpmginstitutes.com/shared-services-outsourcing-institute/Advice Worth Keeping Blog: http://blog.equaterra.com/Advice Worth Keeping podcast series: http://www.kpmginstitutes.com/shared-services-outsourcing-institute/events/podcast_series/advice-worth-keeping-podcast-series.aspxGlobal IT-BPO Outsourcing Deals Analysis: http://www.kpmg.com/IN/en/IssuesAndInsights/ArticlesPublications/KPMG-Deal-Tracker/Pages/Default.aspx
Latest from the KPMG Shared Services and Outsourcing Institute•Global Business Services Goes Digital•Taking Your Global Business Services Brand to the Next Level: From CRM to CEM•KPMG IT Outsourcing Service Provider Performance & Satisfaction Study 2014/15
About KPMG InstitutesKPMG Institutes is dedicated to helping organisations and their stakeholders identify and understand emerging trends, risks and opportunities. We do this by creating an open forum where peers can exchange insights, share leading practices, and access the latest thought leadership publications.
As a result, corporate executives, business managers, industry leaders, government officials, academics, and others have access to the thought leadership documents and knowledge which they can use to take better informed decisions and meet their marketplace challenges.
KPMG Shared Services and Outsourcing Advisory (SSOA) research

20© 2015 KPMG International Cooperative (“KPMG International”), a Swiss entity. Member firms of the KPMG network of independent firms are affiliated with KPMG International. KPMG International provides no client services. No member firm has any authority to obligate or bind KPMG International or any other member firm vis-à-vis third parties, nor does KPMG International have any such authority to obligate or bind any member firm. All rights reserved.
Glossary (1/2)
Terms Definition
ITO Information Technology Outsourcing
BPO Business Process Outsourcing
ACV Annualised contract value = ( total value of a contract/tenure in months ) x 12
TCV Total contract value
AMERICAS North America and South America
ASPAC Asia and Oceania
EMA Europe, Middle East and Africa

21© 2015 KPMG International Cooperative (“KPMG International”), a Swiss entity. Member firms of the KPMG network of independent firms are affiliated with KPMG International. KPMG International provides no client services. No member firm has any authority to obligate or bind KPMG International or any other member firm vis-à-vis third parties, nor does KPMG International have any such authority to obligate or bind any member firm. All rights reserved.
Glossary (2/2)
Terms DefinitionITO ServicesADM Application development and maintenanceERP Enterprise resource planning implementation and support services
ICT Services Information and communication technology services (e.g. contact centre technology, telecommunication, and related services)
IT Bundled Services Any combination of two or more IT services mentioned aboveIT Consulting Information technology consulting services
IT Infrastructure IT hardware deployment (e.g. data centre outsourcing, network management, hardware deploy and support, hosting services, etc.)
IT Products Software products typically developed and branded by IT companies and sold as own Intellectual Property
Other IT Services Typically services that do not fall in other buckets (e.g. Software testing, IT helpdesk support services, Cyber security)
System Integration IT system integration services (application or enterprise system integration services)BPO ServicesBPO Bundled Services Any combination of two or more BPO services mentioned aboveContent Management Data management services (e.g. document management, print management, etc.)CRM Customer Relationship Management solutions and servicesF&A Finance and Accounting servicesHRO Human Resource outsourcing servicesKPO Knowledge process outsourcing services
Other BPO Services Typically services that do not fall in other buckets (e.g. Procurement, logistics, desktop support, other skills training, etc.)
Transactional Services Services like billing services, payment processing, claims processing, mortgage processing, etc.

22© 2015 KPMG International Cooperative (“KPMG International”), a Swiss entity. Member firms of the KPMG network of independent firms are affiliated with KPMG International. KPMG International provides no client services. No member firm has any authority to obligate or bind KPMG International or any other member firm vis-à-vis third parties, nor does KPMG International have any such authority to obligate or bind any member firm. All rights reserved.
Jehil ThakkarPartner – Advisory Services
KPMG in India+91 22 3090 1670
Viral ThakkerPartner – Advisory Services
KPMG in India+91 22 3090 1730
Stan Lepeak Director – Global Research,
Management ConsultingKPMG in the US+1 203 458 0677
KPMG contacts:

Thank you
Analyst Team Contact:
Shailesh Narwaiye KPMG in India+91 20 3050 [email protected]
Analysts: Harish BaligaEsther JaydeviSwati Kumari
The information contained herein is of a general nature and is not intended to address the circumstances of any particular individual or entity. Although we endeavour to provide accurate and timely information, there can be no guarantee that such information is accurate as of the date it is received or that it will continue to be accurate in the future. No one should act on such information without appropriate professional advice after a thorough examination of the particular situation.
© 2015 KPMG, an Indian Registered Partnership and a member firm of the KPMG network of independent member firms affiliated with KPMG International Cooperative (“KPMG International”), a Swiss entity. All rights reserved.
The KPMG name, logo and “cutting through complexity are registered trademarks of KPMG International Cooperative (“KPMG International”), a Swiss entity.