Global IPO Watch Q1 2020 - PwC › ... › assets › global-ipo-watch-q1-2020.pdfPwC | Global IPO...
23
Global IPO Watch Q1 2020 A PwC Global IPO Centre publication
Transcript of Global IPO Watch Q1 2020 - PwC › ... › assets › global-ipo-watch-q1-2020.pdfPwC | Global IPO...
Global IPO Watch Q1 2020A PwC Global IPO Centre publication
Change picture
PwC | Global IPO Watch Q1 2020
PwC IPO Centre - helping you choose the right market for your business and navigate every phase of the IPO journey, irrespective of where you are in the world
Global IPO Watch Q1 2020
2
Ross Hunter David Ethridge
[email protected] [email protected]
Mark Hughes Kennedy Liu
[email protected] [email protected]
Nadja Picard Geoffrey Tang
[email protected] [email protected]
Carsten Stäcker
In light of the ongoing COVID-19 situation, this edition of Global IPO Watch has been reduced to exclude some of the advanced metrics, sector and exchange analysis.
PwC | Global IPO Watch Q1 2020
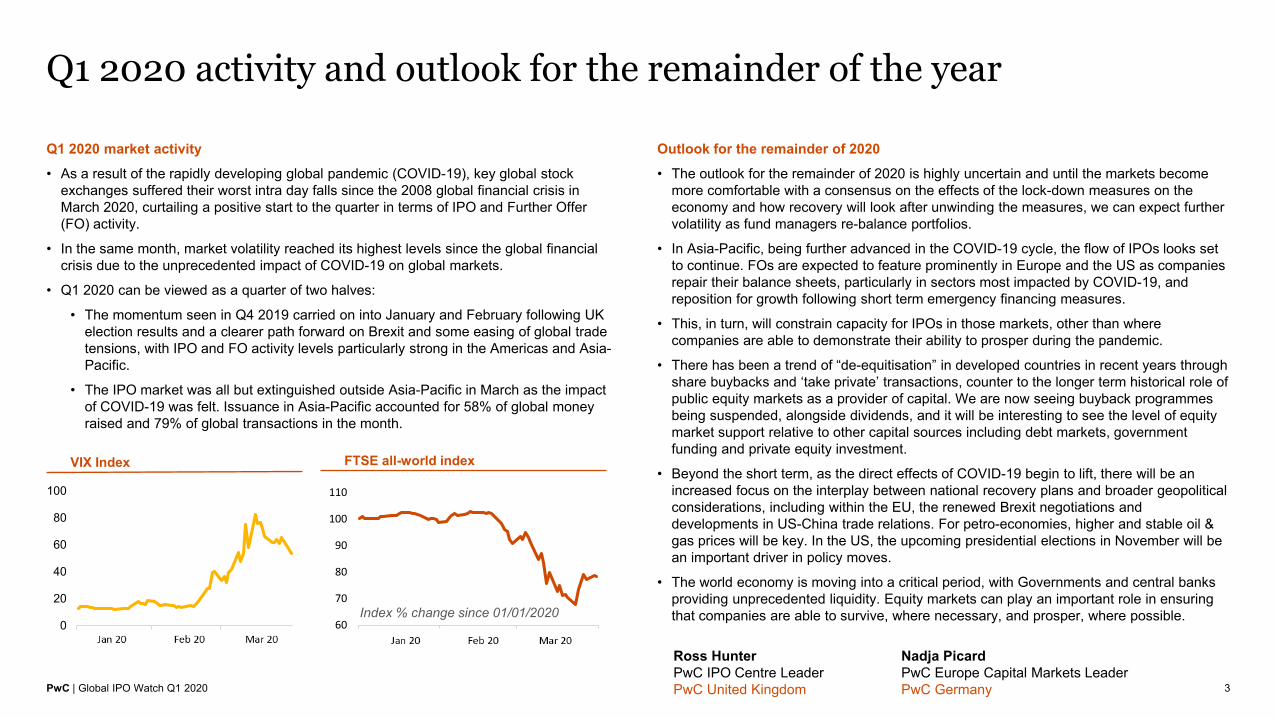
Q1 2020 market activity• As a result of the rapidly developing global pandemic (COVID-19), key global stock
exchanges suffered their worst intra day falls since the 2008 global financial crisis in March 2020, curtailing a positive start to the quarter in terms of IPO and Further Offer (FO) activity.
• In the same month, market volatility reached its highest levels since the global financial crisis due to the unprecedented impact of COVID-19 on global markets.
• Q1 2020 can be viewed as a quarter of two halves:
• The momentum seen in Q4 2019 carried on into January and February following UK election results and a clearer path forward on Brexit and some easing of global trade tensions, with IPO and FO activity levels particularly strong in the Americas and Asia-Pacific.
• The IPO market was all but extinguished outside Asia-Pacific in March as the impact of COVID-19 was felt. Issuance in Asia-Pacific accounted for 58% of global money raised and 79% of global transactions in the month.
Q1 2020 activity and outlook for the remainder of the year
3
Outlook for the remainder of 2020• The outlook for the remainder of 2020 is highly uncertain and until the markets become
more comfortable with a consensus on the effects of the lock-down measures on the economy and how recovery will look after unwinding the measures, we can expect further volatility as fund managers re-balance portfolios.
• In Asia-Pacific, being further advanced in the COVID-19 cycle, the flow of IPOs looks set to continue. FOs are expected to feature prominently in Europe and the US as companies repair their balance sheets, particularly in sectors most impacted by COVID-19, and reposition for growth following short term emergency financing measures.
• This, in turn, will constrain capacity for IPOs in those markets, other than where companies are able to demonstrate their ability to prosper during the pandemic.
• There has been a trend of “de-equitisation” in developed countries in recent years through share buybacks and ‘take private’ transactions, counter to the longer term historical role of public equity markets as a provider of capital. We are now seeing buyback programmes being suspended, alongside dividends, and it will be interesting to see the level of equity market support relative to other capital sources including debt markets, government funding and private equity investment.
• Beyond the short term, as the direct effects of COVID-19 begin to lift, there will be an increased focus on the interplay between national recovery plans and broader geopolitical considerations, including within the EU, the renewed Brexit negotiations and developments in US-China trade relations. For petro-economies, higher and stable oil & gas prices will be key. In the US, the upcoming presidential elections in November will be an important driver in policy moves.
• The world economy is moving into a critical period, with Governments and central banks providing unprecedented liquidity. Equity markets can play an important role in ensuring that companies are able to survive, where necessary, and prosper, where possible.
Ross HunterPwC IPO Centre LeaderPwC United Kingdom
Nadja PicardPwC Europe Capital Markets LeaderPwC Germany
VIX Index FTSE all-world index
0
20
40
60
80
100
Jan 20 Feb 20 Mar 20
Index % change since 01/01/202060
70
80
90
100
110
Jan 20 Feb 20 Mar 20
PwC | Global IPO Watch Q1 2020
IPO and Further Offer (FO) Q1 2020 highlights
4
Q1 2020 highlights
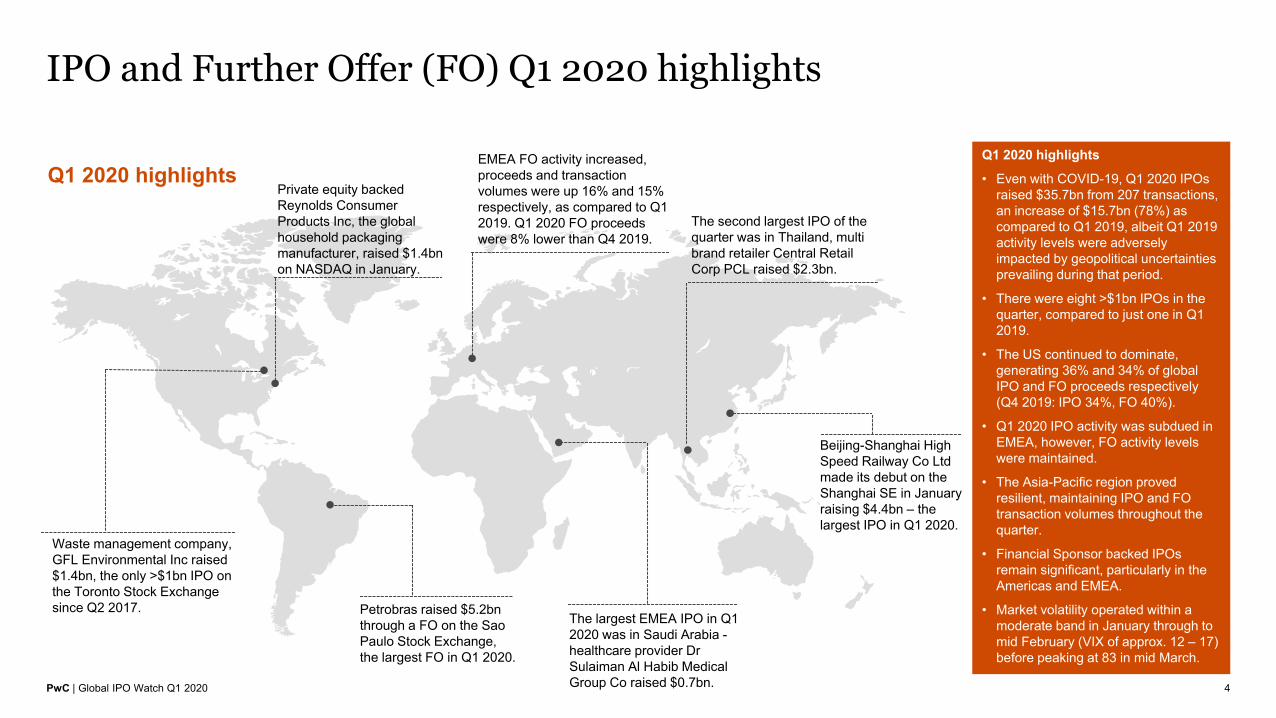
Petrobras raised $5.2bn through a FO on the Sao Paulo Stock Exchange, the largest FO in Q1 2020.
EMEA FO activity increased, proceeds and transaction volumes were up 16% and 15% respectively, as compared to Q1 2019. Q1 2020 FO proceeds were 8% lower than Q4 2019.
Waste management company, GFL Environmental Inc raised $1.4bn, the only >$1bn IPO on the Toronto Stock Exchange since Q2 2017.
The largest EMEA IPO in Q1 2020 was in Saudi Arabia -healthcare provider Dr Sulaiman Al Habib Medical Group Co raised $0.7bn.
The second largest IPO of the quarter was in Thailand, multi brand retailer Central Retail Corp PCL raised $2.3bn.
Beijing-Shanghai High Speed Railway Co Ltd made its debut on the Shanghai SE in January raising $4.4bn – the largest IPO in Q1 2020.
Q1 2020 highlights
• Even with COVID-19, Q1 2020 IPOs raised $35.7bn from 207 transactions, an increase of $15.7bn (78%) as compared to Q1 2019, albeit Q1 2019 activity levels were adversely impacted by geopolitical uncertainties prevailing during that period.
• There were eight >$1bn IPOs in the quarter, compared to just one in Q1 2019.
• The US continued to dominate, generating 36% and 34% of global IPO and FO proceeds respectively (Q4 2019: IPO 34%, FO 40%).
• Q1 2020 IPO activity was subdued in EMEA, however, FO activity levels were maintained.
• The Asia-Pacific region proved resilient, maintaining IPO and FO transaction volumes throughout the quarter.
• Financial Sponsor backed IPOs remain significant, particularly in the Americas and EMEA.
• Market volatility operated within a moderate band in January through to mid February (VIX of approx. 12 – 17) before peaking at 83 in mid March.
Private equity backed Reynolds Consumer Products Inc, the global household packaging manufacturer, raised $1.4bn on NASDAQ in January.
PwC | Global IPO Watch Q1 2020
Global money raised via IPOs and FOs
5
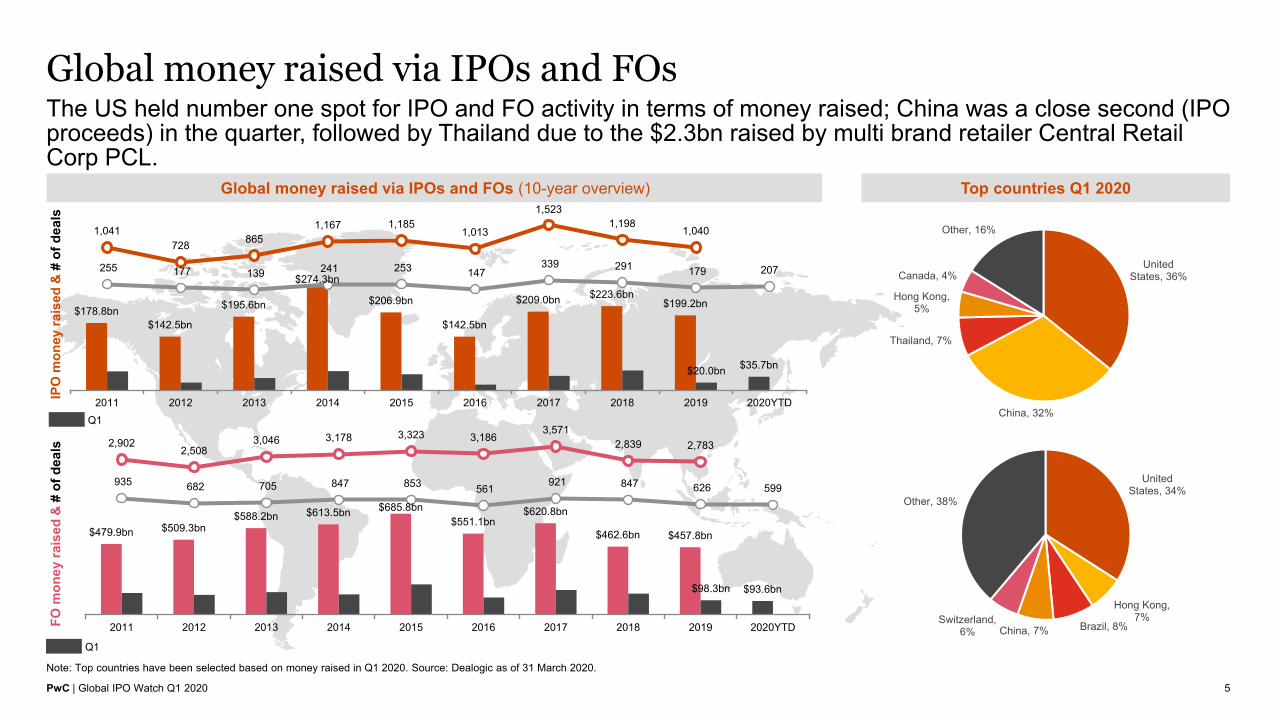
The US held number one spot for IPO and FO activity in terms of money raised; China was a close second (IPO proceeds) in the quarter, followed by Thailand due to the $2.3bn raised by multi brand retailer Central Retail Corp PCL.
Global money raised via IPOs and FOs (10-year overview)
FO m
oney
rais
ed &
# of
dea
lsIP
O m
oney
rais
ed &
# of
dea
ls
Note: Top countries have been selected based on money raised in Q1 2020. Source: Dealogic as of 31 March 2020.
Top countries Q1 2020
$178.8bn$142.5bn
$195.6bn
$274.3bn
$206.9bn
$142.5bn
$209.0bn $223.6bn$199.2bn
$35.7bn$20.0bn
1,041728 865
1,167 1,1851,013
1,5231,198
1,040
207255 177 139 241 253 147 339 291 179
2011 2012 2013 2014 2015 2016 2017 2018 2019 2020YTD
$479.9bn $509.3bn$588.2bn $613.5bn $685.8bn
$551.1bn$620.8bn
$462.6bn $457.8bn
$93.6bn$98.3bn
2,9022,508
3,046 3,178 3,323 3,1863,571
2,839 2,783
599935 682 705 847 853 561 921 847 626
2011 2012 2013 2014 2015 2016 2017 2018 2019 2020YTD
United States, 36%
China, 32%
Thailand, 7%
Hong Kong, 5%
Canada, 4%
Other, 16%
United States, 34%
Hong Kong, 7%
Brazil, 8%China, 7%Switzerland,
6%
Other, 38%
Q1
Q1
PwC | Global IPO Watch Q1 2020
Overview of global IPO and FO activity
6
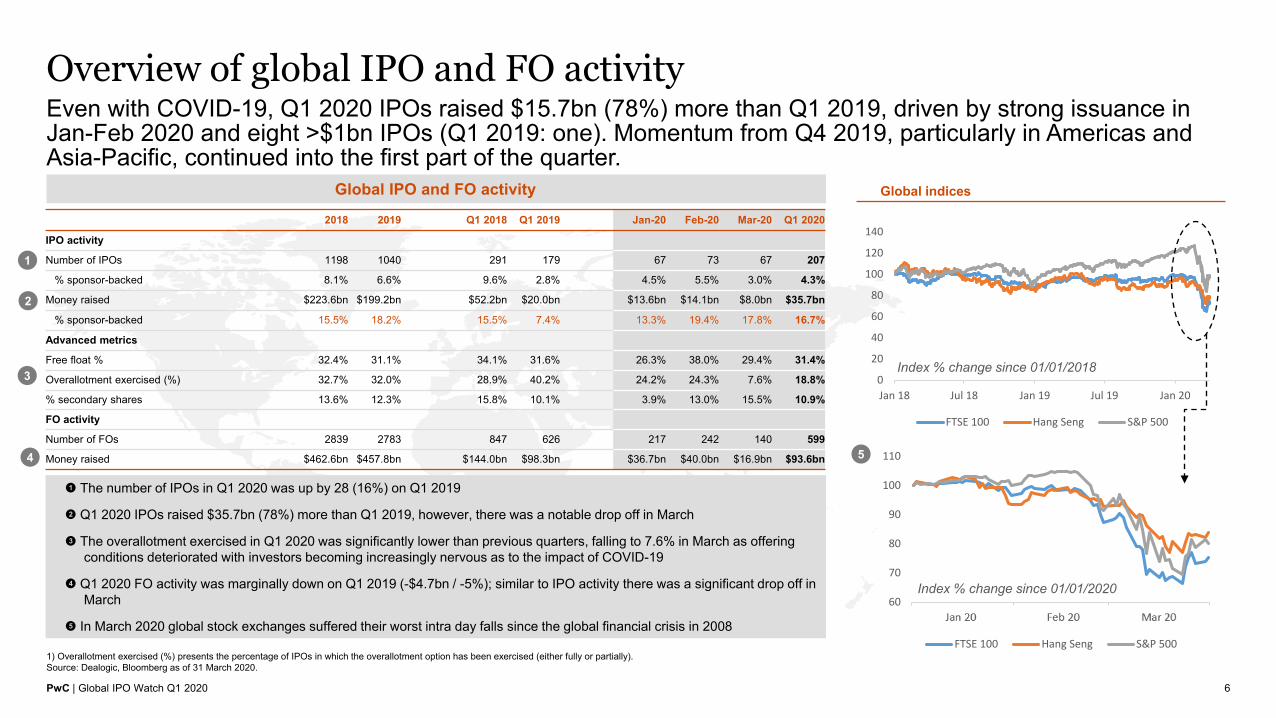
Even with COVID-19, Q1 2020 IPOs raised $15.7bn (78%) more than Q1 2019, driven by strong issuance in Jan-Feb 2020 and eight >$1bn IPOs (Q1 2019: one). Momentum from Q4 2019, particularly in Americas and Asia-Pacific, continued into the first part of the quarter.
Global IPO and FO activity
1) Overallotment exercised (%) presents the percentage of IPOs in which the overallotment option has been exercised (either fully or partially). Source: Dealogic, Bloomberg as of 31 March 2020.
! The number of IPOs in Q1 2020 was up by 28 (16%) on Q1 2019
@ Q1 2020 IPOs raised $35.7bn (78%) more than Q1 2019, however, there was a notable drop off in March
# The overallotment exercised in Q1 2020 was significantly lower than previous quarters, falling to 7.6% in March as offering conditions deteriorated with investors becoming increasingly nervous as to the impact of COVID-19
$ Q1 2020 FO activity was marginally down on Q1 2019 (-$4.7bn / -5%); similar to IPO activity there was a significant drop off in March
% In March 2020 global stock exchanges suffered their worst intra day falls since the global financial crisis in 2008
Global indices
1
2018 2019 Q1 2018 Q1 2019 Jan-20 Feb-20 Mar-20 Q1 2020
IPO activity
Number of IPOs 1198 1040 291 179 67 73 67 207
% sponsor-backed 8.1% 6.6% 9.6% 2.8% 4.5% 5.5% 3.0% 4.3%
Money raised $223.6bn $199.2bn $52.2bn $20.0bn $13.6bn $14.1bn $8.0bn $35.7bn
% sponsor-backed 15.5% 18.2% 15.5% 7.4% 13.3% 19.4% 17.8% 16.7%
Advanced metrics
Free float % 32.4% 31.1% 34.1% 31.6% 26.3% 38.0% 29.4% 31.4%
Overallotment exercised (%) 32.7% 32.0% 28.9% 40.2% 24.2% 24.3% 7.6% 18.8%
% secondary shares 13.6% 12.3% 15.8% 10.1% 3.9% 13.0% 15.5% 10.9%
FO activity
Number of FOs 2839 2783 847 626 217 242 140 599
Money raised $462.6bn $457.8bn $144.0bn $98.3bn $36.7bn $40.0bn $16.9bn $93.6bn
2
3
4
0
20
40
60
80
100
120
140
Jan 18 Jul 18 Jan 19 Jul 19 Jan 20
FTSE 100 Hang Seng S&P 500
60
70
80
90
100
110
Jan 20 Feb 20 Mar 20
FTSE 100 Hang Seng S&P 500
Index % change since 01/01/2020
Index % change since 01/01/2018
5
PwC | Global IPO Watch Q1 2020
Leading transactions Q1 2020
7
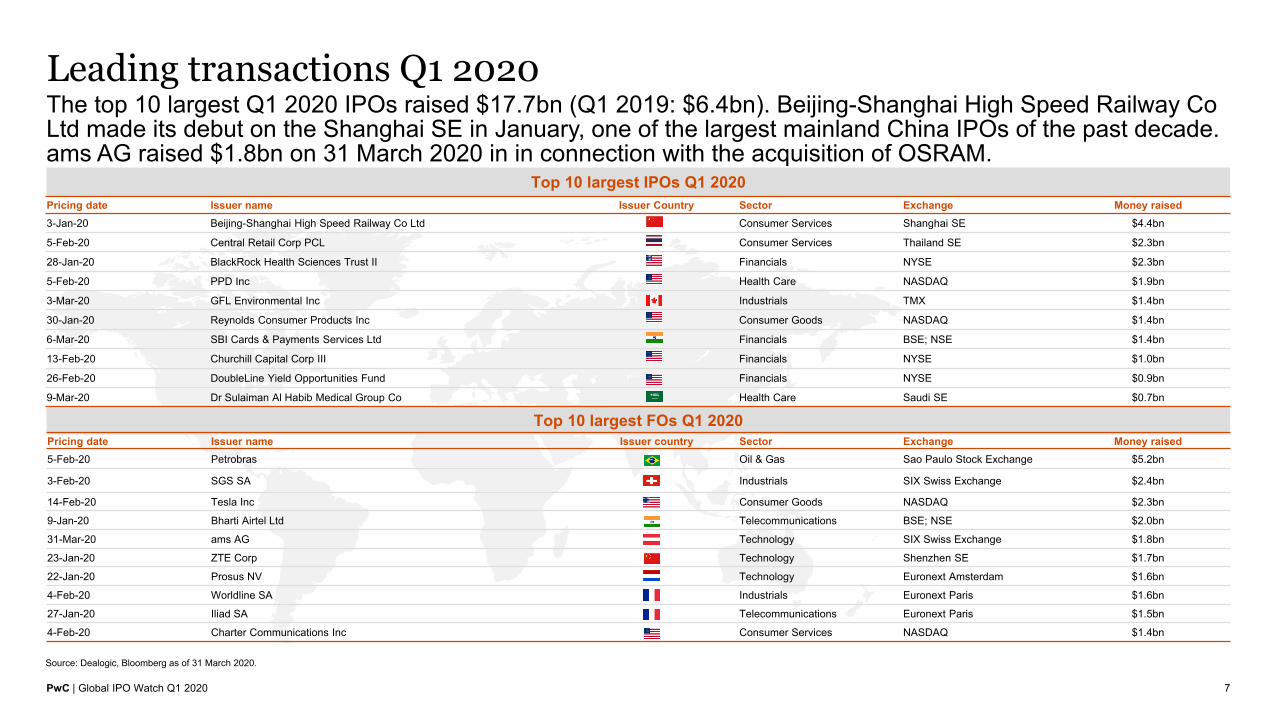
The top 10 largest Q1 2020 IPOs raised $17.7bn (Q1 2019: $6.4bn). Beijing-Shanghai High Speed Railway Co Ltd made its debut on the Shanghai SE in January, one of the largest mainland China IPOs of the past decade. ams AG raised $1.8bn on 31 March 2020 in in connection with the acquisition of OSRAM.
Top 10 largest IPOs Q1 2020
Source: Dealogic, Bloomberg as of 31 March 2020.
Top 10 largest FOs Q1 2020
Pricing date Issuer name Issuer Country Sector Exchange Money raised3-Jan-20 Beijing-Shanghai High Speed Railway Co Ltd Consumer Services Shanghai SE $4.4bn
5-Feb-20 Central Retail Corp PCL Consumer Services Thailand SE $2.3bn
28-Jan-20 BlackRock Health Sciences Trust II Financials NYSE $2.3bn
5-Feb-20 PPD Inc Health Care NASDAQ $1.9bn
3-Mar-20 GFL Environmental Inc Industrials TMX $1.4bn
30-Jan-20 Reynolds Consumer Products Inc Consumer Goods NASDAQ $1.4bn
6-Mar-20 SBI Cards & Payments Services Ltd Financials BSE; NSE $1.4bn
13-Feb-20 Churchill Capital Corp III Financials NYSE $1.0bn
26-Feb-20 DoubleLine Yield Opportunities Fund Financials NYSE $0.9bn
9-Mar-20 Dr Sulaiman Al Habib Medical Group Co Health Care Saudi SE $0.7bn
Pricing date Issuer name Issuer country Sector Exchange Money raised5-Feb-20 Petrobras Oil & Gas Sao Paulo Stock Exchange $5.2bn
3-Feb-20 SGS SA Industrials SIX Swiss Exchange $2.4bn
14-Feb-20 Tesla Inc Consumer Goods NASDAQ $2.3bn
9-Jan-20 Bharti Airtel Ltd Telecommunications BSE; NSE $2.0bn
31-Mar-20 ams AG Technology SIX Swiss Exchange $1.8bn
23-Jan-20 ZTE Corp Technology Shenzhen SE $1.7bn
22-Jan-20 Prosus NV Technology Euronext Amsterdam $1.6bn
4-Feb-20 Worldline SA Industrials Euronext Paris $1.6bn
27-Jan-20 Iliad SA Telecommunications Euronext Paris $1.5bn
4-Feb-20 Charter Communications Inc Consumer Services NASDAQ $1.4bn
PwC | Global IPO Watch Q1 2020
IPO and FO activity per region
8
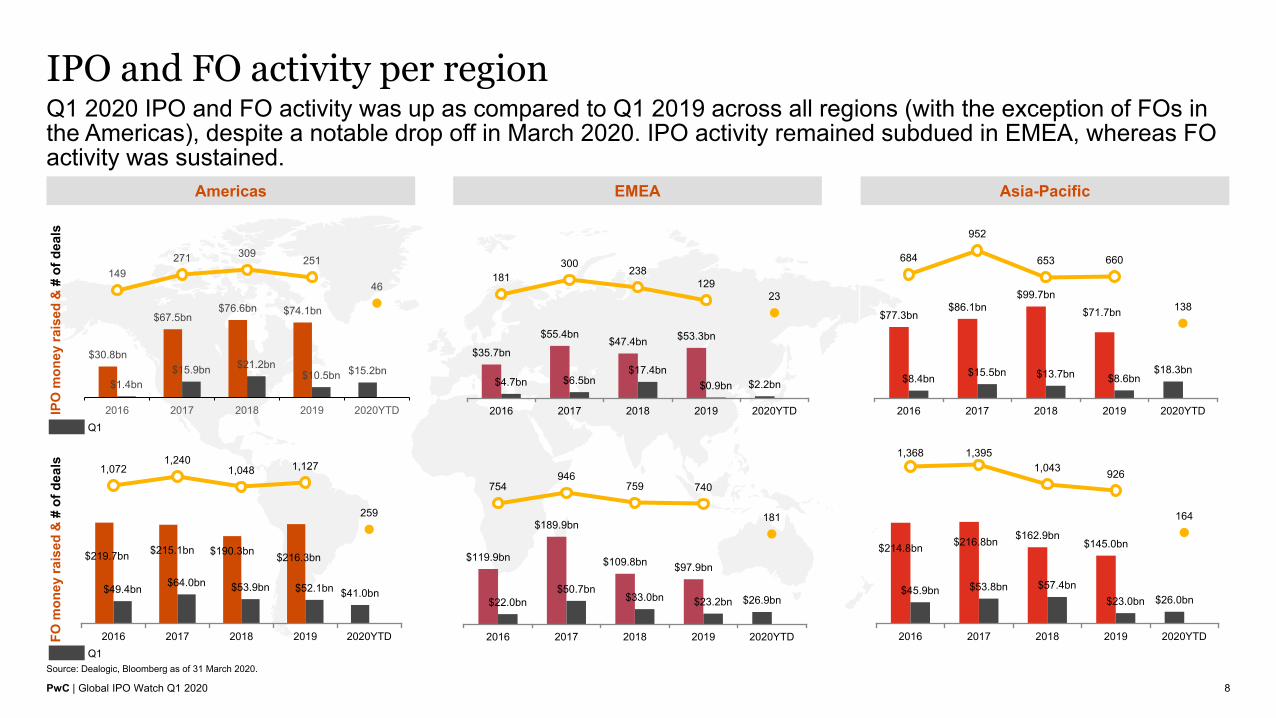
Q1 2020 IPO and FO activity was up as compared to Q1 2019 across all regions (with the exception of FOs in the Americas), despite a notable drop off in March 2020. IPO activity remained subdued in EMEA, whereas FO activity was sustained.
Americas EMEA Asia-Pacific
FO m
oney
rais
ed &
# o
f dea
lsIP
O m
oney
rais
ed &
# o
f dea
ls
Source: Dealogic, Bloomberg as of 31 March 2020.
$30.8bn
$67.5bn$76.6bn $74.1bn
$15.2bn$1.4bn
$15.9bn $21.2bn$10.5bn
149271 309
251
46
2016 2017 2018 2019 2020YTD
$219.7bn $215.1bn $190.3bn $216.3bn
$41.0bn$49.4bn $64.0bn $53.9bn $52.1bn
1,0721,240
1,048 1,127
259
2016 2017 2018 2019 2020YTD
$35.7bn
$55.4bn$47.4bn $53.3bn
$2.2bn$4.7bn $6.5bn$17.4bn
$0.9bn
181300
238129
23
2016 2017 2018 2019 2020YTD
$119.9bn
$189.9bn
$109.8bn $97.9bn
$26.9bn$22.0bn$50.7bn
$33.0bn $23.2bn
754946
759 740
181
2016 2017 2018 2019 2020YTD
$77.3bn$86.1bn
$99.7bn$71.7bn
$18.3bn$8.4bn $15.5bn $13.7bn $8.6bn
684
952
653 660
138
2016 2017 2018 2019 2020YTD
$214.8bn $216.8bn $162.9bn$145.0bn
$26.0bn$45.9bn $53.8bn $57.4bn
$23.0bn
1,368 1,3951,043 926
164
2016 2017 2018 2019 2020YTD
Q1
Q1
PwC | Global IPO Watch Q1 2020
Volatility versus IPO activity
9
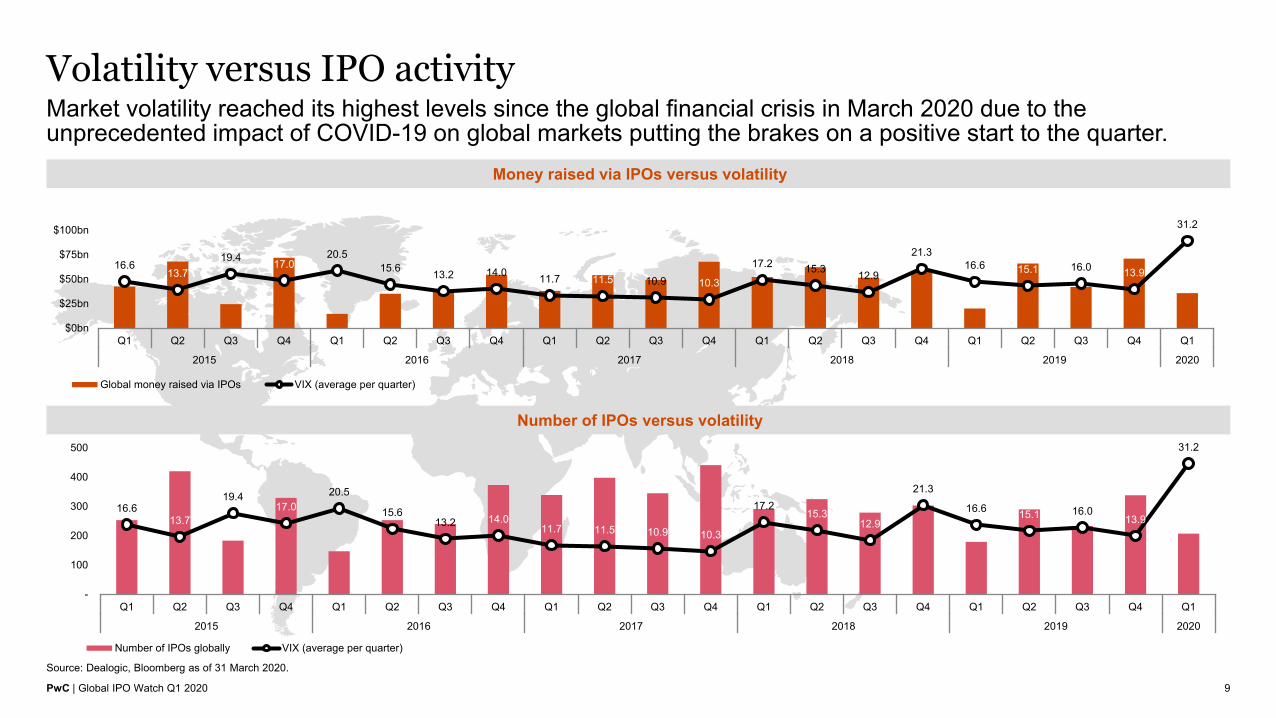
Market volatility reached its highest levels since the global financial crisis in March 2020 due to the unprecedented impact of COVID-19 on global markets putting the brakes on a positive start to the quarter.
Money raised via IPOs versus volatility
Source: Dealogic, Bloomberg as of 31 March 2020.
Number of IPOs versus volatility
16.613.7
19.4 17.020.5
15.6 13.2 14.0 11.7 11.5 10.9 10.3
17.2 15.3 12.9
21.316.6 15.1 16.0 13.9
31.2
$0bn
$25bn
$50bn
$75bn
$100bn
Q1 Q2 Q3 Q4 Q1 Q2 Q3 Q4 Q1 Q2 Q3 Q4 Q1 Q2 Q3 Q4 Q1 Q2 Q3 Q4 Q1
2015 2016 2017 2018 2019 2020
Global money raised via IPOs VIX (average per quarter)
16.613.7
19.417.0
20.5
15.613.2 14.0
11.7 11.5 10.9 10.3
17.215.3
12.9
21.3
16.6 15.1 16.013.9
31.2
-
100
200
300
400
500
Q1 Q2 Q3 Q4 Q1 Q2 Q3 Q4 Q1 Q2 Q3 Q4 Q1 Q2 Q3 Q4 Q1 Q2 Q3 Q4 Q1
2015 2016 2017 2018 2019 2020
Number of IPOs globally VIX (average per quarter)
PwC | Global IPO Watch Q1 2020
AmericasUnprecedented volatility associated with the uncertainty of COVID-19 and now the likely recession put a virtual halt to IPOs in the US in late Q1 2020.
It is possible the market could turn as early as May 2020 when investors assess the recession's progression, the impact on Q1 and 2020 full year earnings are clearer, and the potential for a strong 2021 becomes the focus. When the pandemic subsides the US will be in a zero interest rate environment once more with vast amounts of US Government stimulus capital pulsing through the economy.
10
David Ethridge US IPO Services LeaderPwC US
PwC | Global IPO Watch Q1 2020
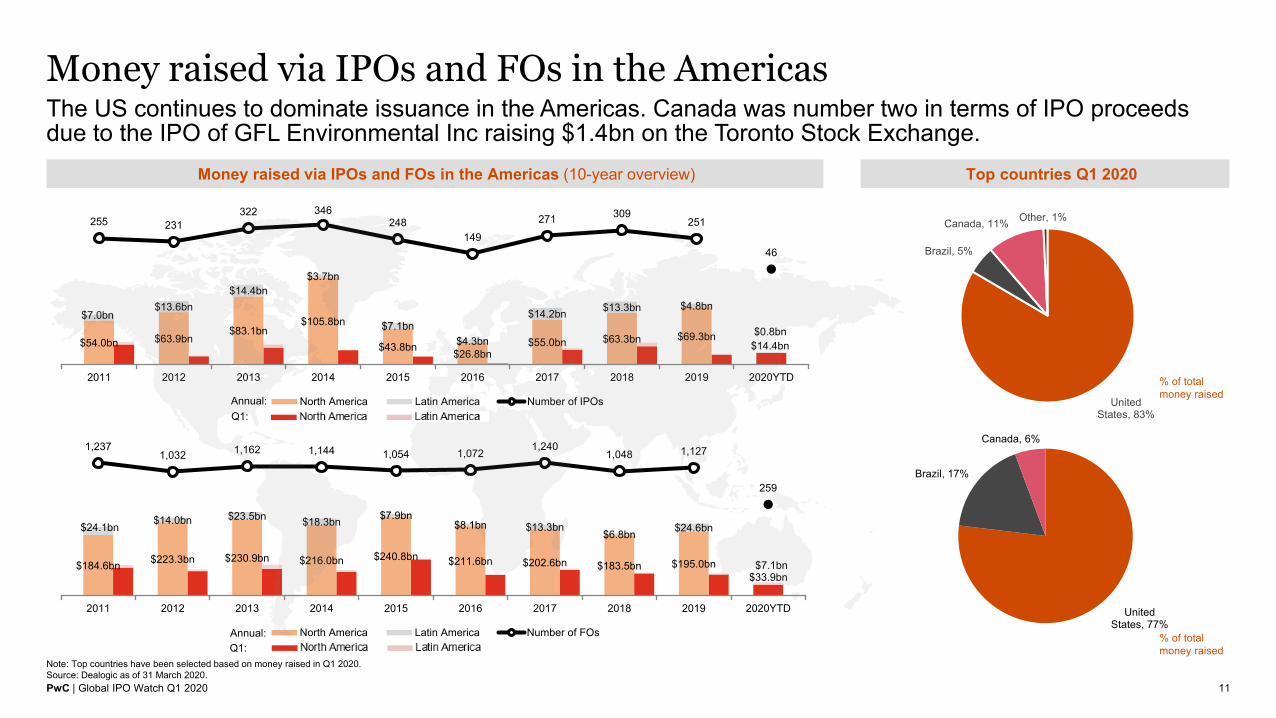
$184.6bn $223.3bn $230.9bn $216.0bn $240.8bn $211.6bn $202.6bn $183.5bn $195.0bn$33.9bn
$24.1bn $14.0bn $23.5bn $18.3bn $7.9bn$8.1bn $13.3bn
$6.8bn $24.6bn
$7.1bn
1,2371,032 1,162 1,144 1,054 1,072 1,240
1,048 1,127
259
2011 2012 2013 2014 2015 2016 2017 2018 2019 2020YTD
North America Latin America Number of FOs
$54.0bn $63.9bn$83.1bn
$105.8bn
$43.8bn $26.8bn$55.0bn $63.3bn $69.3bn
$14.4bn
$7.0bn$13.6bn
$14.4bn$3.7bn
$7.1bn$4.3bn
$14.2bn $13.3bn $4.8bn
$0.8bn
255 231322 346
248149
271 309251
46
2011 2012 2013 2014 2015 2016 2017 2018 2019 2020YTD
North America Latin America Number of IPOs
Money raised via IPOs and FOs in the Americas
11
The US continues to dominate issuance in the Americas. Canada was number two in terms of IPO proceeds due to the IPO of GFL Environmental Inc raising $1.4bn on the Toronto Stock Exchange.
Money raised via IPOs and FOs in the Americas (10-year overview) Top countries Q1 2020
Note: Top countries have been selected based on money raised in Q1 2020. Source: Dealogic as of 31 March 2020.
% of total money raised
% of total money raised
United States, 83%
Brazil, 5%
Canada, 11% Other, 1%
United States, 77%
Brazil, 17%
Canada, 6%
Q1:Annual:
Q1:Annual:
PwC | Global IPO Watch Q1 2020
Overview of IPO and FO activity in the Americas
12
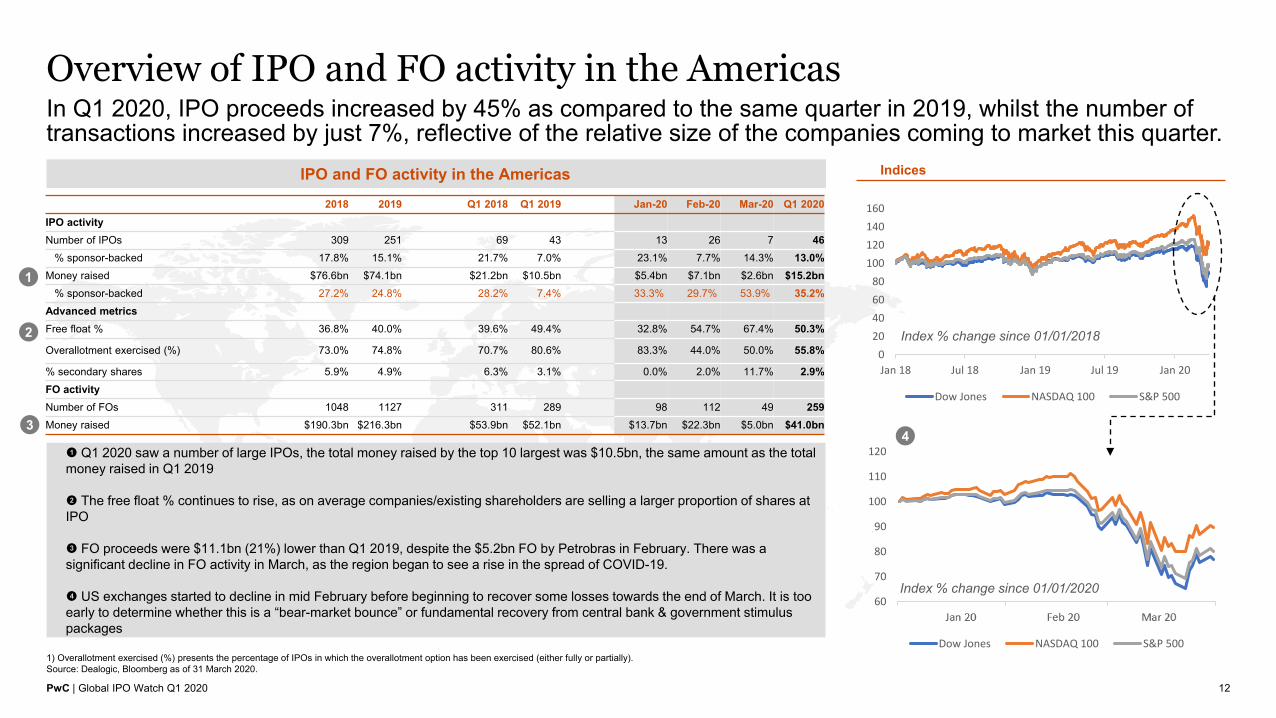
In Q1 2020, IPO proceeds increased by 45% as compared to the same quarter in 2019, whilst the number of transactions increased by just 7%, reflective of the relative size of the companies coming to market this quarter.
IPO and FO activity in the Americas
1) Overallotment exercised (%) presents the percentage of IPOs in which the overallotment option has been exercised (either fully or partially). Source: Dealogic, Bloomberg as of 31 March 2020.
1
2
3
2018 2019 Q1 2018 Q1 2019 Jan-20 Feb-20 Mar-20 Q1 2020IPO activity Number of IPOs 309 251 69 43 13 26 7 46
% sponsor-backed 17.8% 15.1% 21.7% 7.0% 23.1% 7.7% 14.3% 13.0%Money raised $76.6bn $74.1bn $21.2bn $10.5bn $5.4bn $7.1bn $2.6bn $15.2bn
% sponsor-backed 27.2% 24.8% 28.2% 7.4% 33.3% 29.7% 53.9% 35.2%Advanced metrics Free float % 36.8% 40.0% 39.6% 49.4% 32.8% 54.7% 67.4% 50.3%
Overallotment exercised (%) 73.0% 74.8% 70.7% 80.6% 83.3% 44.0% 50.0% 55.8%
% secondary shares 5.9% 4.9% 6.3% 3.1% 0.0% 2.0% 11.7% 2.9%FO activityNumber of FOs 1048 1127 311 289 98 112 49 259Money raised $190.3bn $216.3bn $53.9bn $52.1bn $13.7bn $22.3bn $5.0bn $41.0bn
! Q1 2020 saw a number of large IPOs, the total money raised by the top 10 largest was $10.5bn, the same amount as the total money raised in Q1 2019
@ The free float % continues to rise, as on average companies/existing shareholders are selling a larger proportion of shares at IPO
# FO proceeds were $11.1bn (21%) lower than Q1 2019, despite the $5.2bn FO by Petrobras in February. There was a significant decline in FO activity in March, as the region began to see a rise in the spread of COVID-19.
$ US exchanges started to decline in mid February before beginning to recover some losses towards the end of March. It is too early to determine whether this is a “bear-market bounce” or fundamental recovery from central bank & government stimulus packages
Indices
020406080
100120140160
Jan 18 Jul 18 Jan 19 Jul 19 Jan 20
Dow Jones NASDAQ 100 S&P 500
60
70
80
90
100
110
120
Jan 20 Feb 20 Mar 20
Dow Jones NASDAQ 100 S&P 500
4
Index % change since 01/01/2020
Index % change since 01/01/2018
PwC | Global IPO Watch Q1 2020
Leading transactions Q1 2020 in the Americas
13
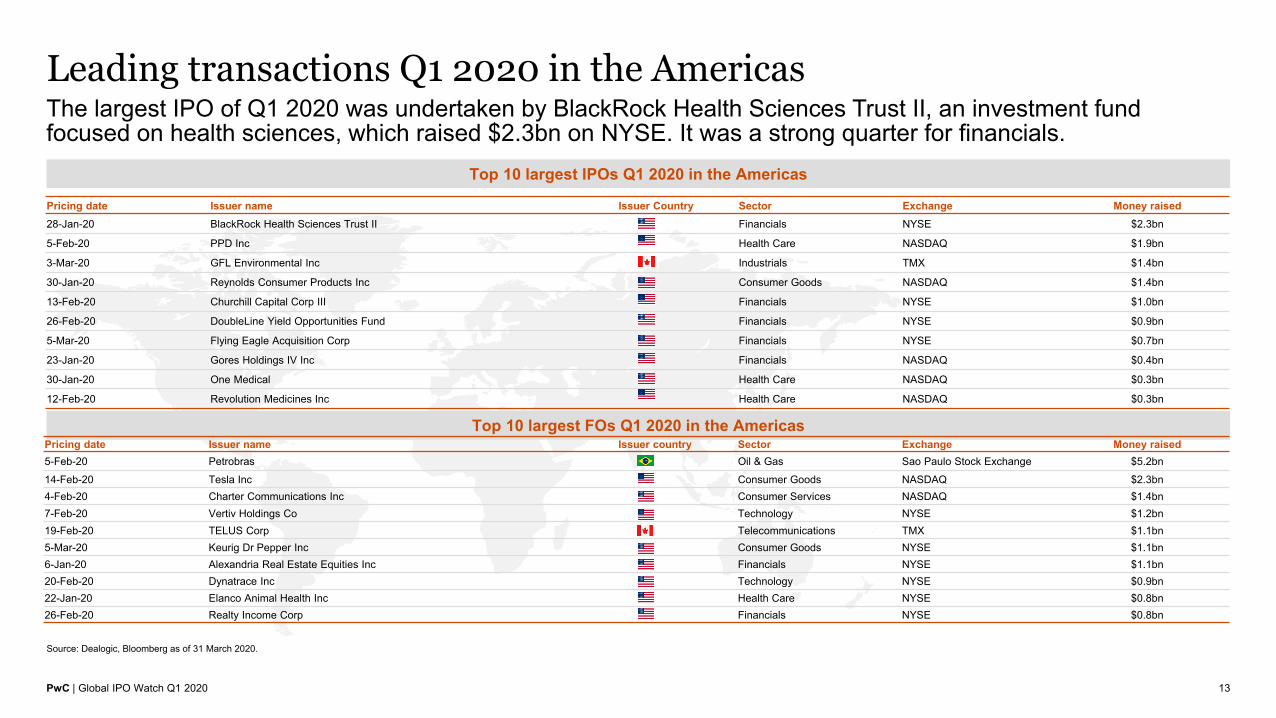
The largest IPO of Q1 2020 was undertaken by BlackRock Health Sciences Trust II, an investment fund focused on health sciences, which raised $2.3bn on NYSE. It was a strong quarter for financials.
Top 10 largest IPOs Q1 2020 in the Americas
Source: Dealogic, Bloomberg as of 31 March 2020.
Top 10 largest FOs Q1 2020 in the Americas
Pricing date Issuer name Issuer Country Sector Exchange Money raised28-Jan-20 BlackRock Health Sciences Trust II Financials NYSE $2.3bn
5-Feb-20 PPD Inc Health Care NASDAQ $1.9bn
3-Mar-20 GFL Environmental Inc Industrials TMX $1.4bn
30-Jan-20 Reynolds Consumer Products Inc Consumer Goods NASDAQ $1.4bn
13-Feb-20 Churchill Capital Corp III Financials NYSE $1.0bn
26-Feb-20 DoubleLine Yield Opportunities Fund Financials NYSE $0.9bn
5-Mar-20 Flying Eagle Acquisition Corp Financials NYSE $0.7bn
23-Jan-20 Gores Holdings IV Inc Financials NASDAQ $0.4bn
30-Jan-20 One Medical Health Care NASDAQ $0.3bn
12-Feb-20 Revolution Medicines Inc Health Care NASDAQ $0.3bn
Pricing date Issuer name Issuer country Sector Exchange Money raised5-Feb-20 Petrobras Oil & Gas Sao Paulo Stock Exchange $5.2bn
14-Feb-20 Tesla Inc Consumer Goods NASDAQ $2.3bn4-Feb-20 Charter Communications Inc Consumer Services NASDAQ $1.4bn7-Feb-20 Vertiv Holdings Co Technology NYSE $1.2bn19-Feb-20 TELUS Corp Telecommunications TMX $1.1bn5-Mar-20 Keurig Dr Pepper Inc Consumer Goods NYSE $1.1bn6-Jan-20 Alexandria Real Estate Equities Inc Financials NYSE $1.1bn20-Feb-20 Dynatrace Inc Technology NYSE $0.9bn22-Jan-20 Elanco Animal Health Inc Health Care NYSE $0.8bn26-Feb-20 Realty Income Corp Financials NYSE $0.8bn
PwC | Global IPO Watch Q1 2020
EMEAEquity issuance activity in Q1 was completely stifled by two black swans. The COVID-19 pandemic and the concurrent collapse of the oil price which triggered unprecedented swings in volatility, valuation levels, investor positioning and sentiment in both the equity and the credit markets. With the enormous scope of monetary and fiscal intervention by Governments and Central banks the worst in terms of market risk may already be behind us. Yet the question of the recession’s depth and length and its impact on the macro environment still remains open.Consequently, companies and Private Equity Firms have been forced to shelf their IPO intentions and it seems rather unlikely that either form of ECM transaction will return to meaningful volumes in the coming quarter.However, with the start of Q2 we are witnessing a pick-up of primary issuance activity across EMEA markets from industries which have been hit most directly by the economic standstill since mid-March. While market conditions are likely to remain challenging and issuance windows could be short-lived, we would expect this wave of recapitalizations to quickly intensify and to dominate EMEA issuance activity over the next couple of quarters.
14
Mark HughesPartner, Capital MarketsPwC United Kingdom
Carsten StäckerPartner, Equity AdvisoryPwC Germany
PwC | Global IPO Watch Q1 2020
Money raised via IPOs and FOs in EMEA
15
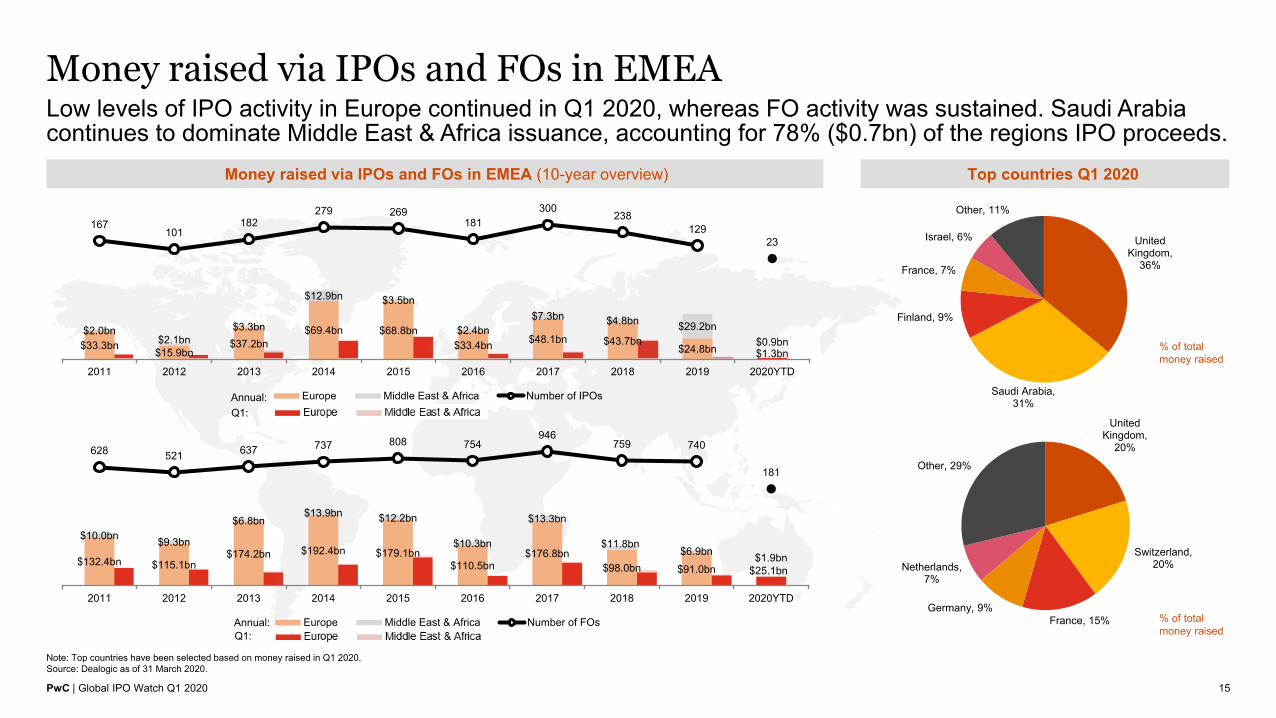
Low levels of IPO activity in Europe continued in Q1 2020, whereas FO activity was sustained. Saudi Arabia continues to dominate Middle East & Africa issuance, accounting for 78% ($0.7bn) of the regions IPO proceeds.
Money raised via IPOs and FOs in EMEA (10-year overview) Top countries Q1 2020
Note: Top countries have been selected based on money raised in Q1 2020. Source: Dealogic as of 31 March 2020.
% of total money raised
% of total money raised
United Kingdom,
36%
Saudi Arabia, 31%
Finland, 9%
France, 7%
Israel, 6%
Other, 11%
United Kingdom,
20%
Switzerland, 20%
France, 15%Germany, 9%
Netherlands, 7%
Other, 29%
$33.3bn$15.9bn
$37.2bn$69.4bn $68.8bn
$33.4bn $48.1bn $43.7bn$24.8bn $1.3bn
$2.0bn$2.1bn
$3.3bn
$12.9bn $3.5bn
$2.4bn$7.3bn $4.8bn $29.2bn
$0.9bn
167101
182279 269
181300
238129
23
2011 2012 2013 2014 2015 2016 2017 2018 2019 2020YTD
Europe Middle East & Africa Number of IPOsQ1:Annual:
$132.4bn $115.1bn$174.2bn $192.4bn $179.1bn
$110.5bn$176.8bn
$98.0bn $91.0bn $25.1bn
$10.0bn $9.3bn
$6.8bn$13.9bn $12.2bn
$10.3bn
$13.3bn
$11.8bn$6.9bn $1.9bn
628 521 637 737 808 754946
759 740
181
2011 2012 2013 2014 2015 2016 2017 2018 2019 2020YTD
Europe Middle East & Africa Number of FOsQ1:Annual:
PwC | Global IPO Watch Q1 2020
Overview of IPO and FO activity in EMEA
16
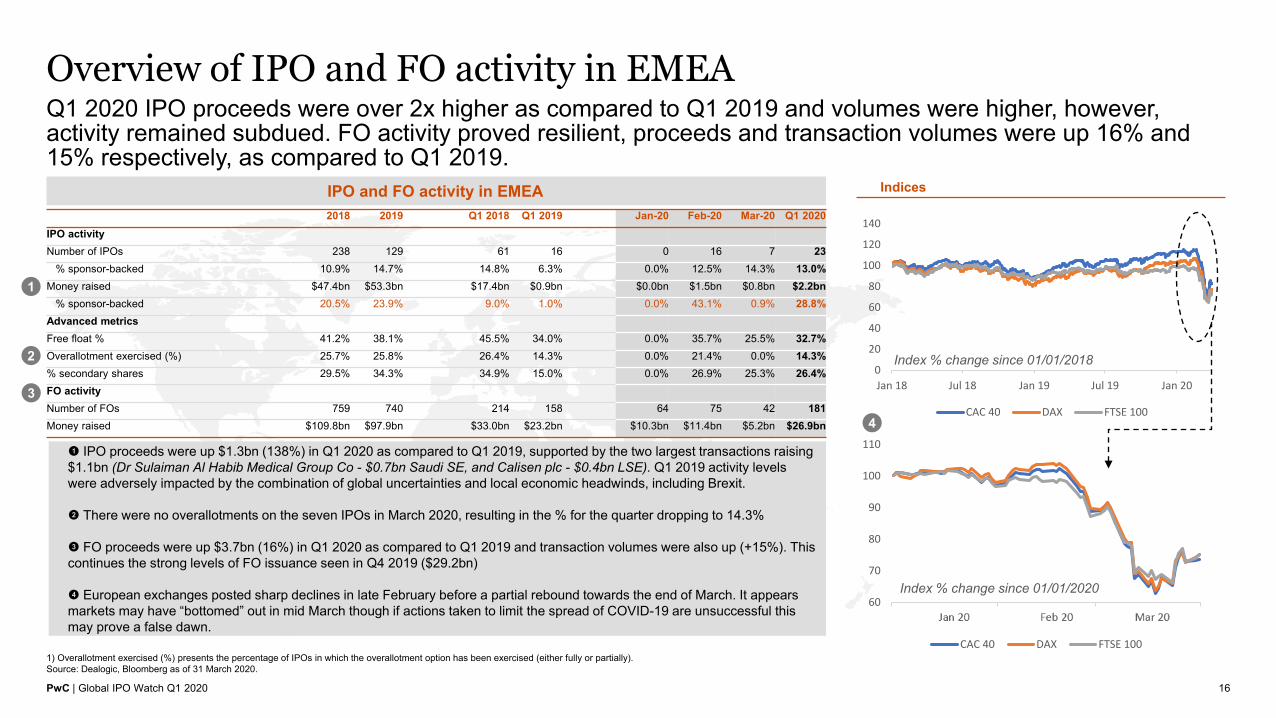
Q1 2020 IPO proceeds were over 2x higher as compared to Q1 2019 and volumes were higher, however, activity remained subdued. FO activity proved resilient, proceeds and transaction volumes were up 16% and 15% respectively, as compared to Q1 2019.
IPO and FO activity in EMEA
1) Overallotment exercised (%) presents the percentage of IPOs in which the overallotment option has been exercised (either fully or partially). Source: Dealogic, Bloomberg as of 31 March 2020.
1
2
3
2018 2019 Q1 2018 Q1 2019 Jan-20 Feb-20 Mar-20 Q1 2020IPO activity Number of IPOs 238 129 61 16 0 16 7 23
% sponsor-backed 10.9% 14.7% 14.8% 6.3% 0.0% 12.5% 14.3% 13.0%Money raised $47.4bn $53.3bn $17.4bn $0.9bn $0.0bn $1.5bn $0.8bn $2.2bn
% sponsor-backed 20.5% 23.9% 9.0% 1.0% 0.0% 43.1% 0.9% 28.8%Advanced metricsFree float % 41.2% 38.1% 45.5% 34.0% 0.0% 35.7% 25.5% 32.7%Overallotment exercised (%) 25.7% 25.8% 26.4% 14.3% 0.0% 21.4% 0.0% 14.3%% secondary shares 29.5% 34.3% 34.9% 15.0% 0.0% 26.9% 25.3% 26.4%FO activityNumber of FOs 759 740 214 158 64 75 42 181Money raised $109.8bn $97.9bn $33.0bn $23.2bn $10.3bn $11.4bn $5.2bn $26.9bn
Indices
! IPO proceeds were up $1.3bn (138%) in Q1 2020 as compared to Q1 2019, supported by the two largest transactions raising $1.1bn (Dr Sulaiman Al Habib Medical Group Co - $0.7bn Saudi SE, and Calisen plc - $0.4bn LSE). Q1 2019 activity levels were adversely impacted by the combination of global uncertainties and local economic headwinds, including Brexit.
@ There were no overallotments on the seven IPOs in March 2020, resulting in the % for the quarter dropping to 14.3%
# FO proceeds were up $3.7bn (16%) in Q1 2020 as compared to Q1 2019 and transaction volumes were also up (+15%). This continues the strong levels of FO issuance seen in Q4 2019 ($29.2bn)
$ European exchanges posted sharp declines in late February before a partial rebound towards the end of March. It appears markets may have “bottomed” out in mid March though if actions taken to limit the spread of COVID-19 are unsuccessful this may prove a false dawn.
0
20
40
60
80
100
120
140
Jan 18 Jul 18 Jan 19 Jul 19 Jan 20
CAC 40 DAX FTSE 100
60
70
80
90
100
110
Jan 20 Feb 20 Mar 20
CAC 40 DAX FTSE 100
4
Index % change since 01/01/2020
Index % change since 01/01/2018
PwC | Global IPO Watch Q1 2020
Leading transactions Q1 2020 in EMEA
17
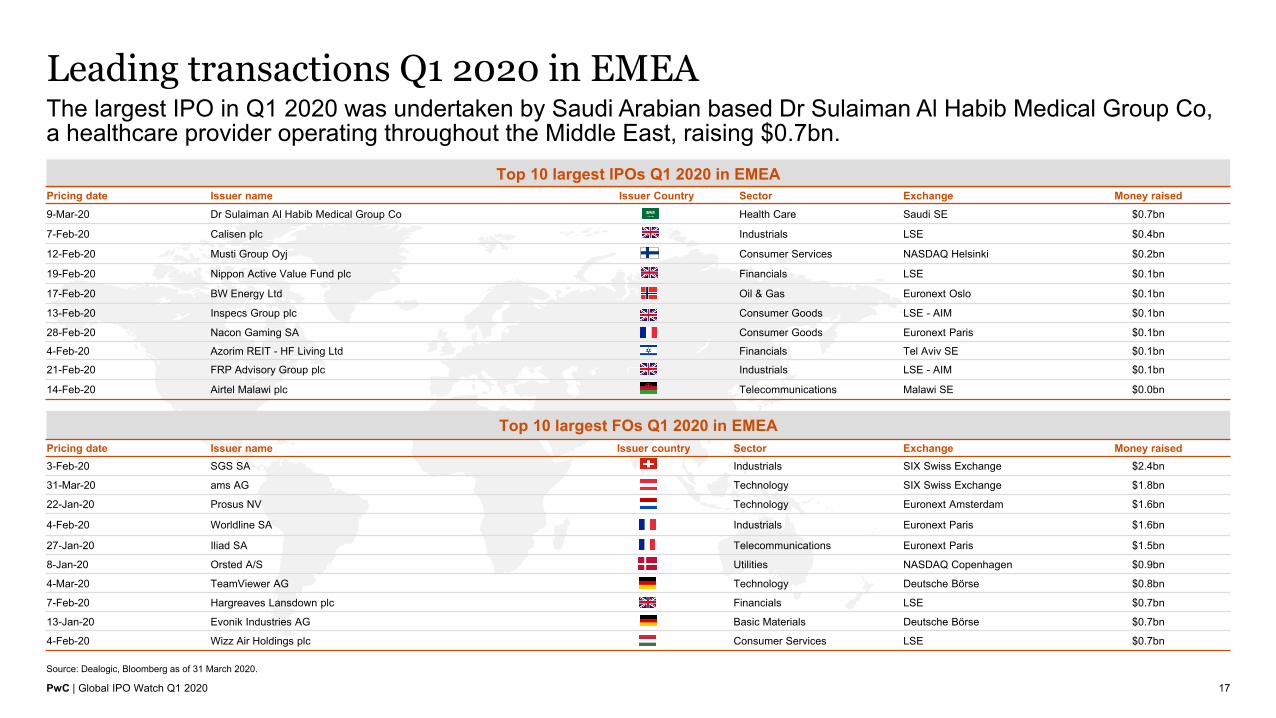
The largest IPO in Q1 2020 was undertaken by Saudi Arabian based Dr Sulaiman Al Habib Medical Group Co, a healthcare provider operating throughout the Middle East, raising $0.7bn.
Top 10 largest IPOs Q1 2020 in EMEA
Source: Dealogic, Bloomberg as of 31 March 2020.
Top 10 largest FOs Q1 2020 in EMEA
Pricing date Issuer name Issuer Country Sector Exchange Money raised9-Mar-20 Dr Sulaiman Al Habib Medical Group Co Health Care Saudi SE $0.7bn
7-Feb-20 Calisen plc Industrials LSE $0.4bn
12-Feb-20 Musti Group Oyj Consumer Services NASDAQ Helsinki $0.2bn
19-Feb-20 Nippon Active Value Fund plc Financials LSE $0.1bn
17-Feb-20 BW Energy Ltd Oil & Gas Euronext Oslo $0.1bn
13-Feb-20 Inspecs Group plc Consumer Goods LSE - AIM $0.1bn
28-Feb-20 Nacon Gaming SA Consumer Goods Euronext Paris $0.1bn
4-Feb-20 Azorim REIT - HF Living Ltd Financials Tel Aviv SE $0.1bn
21-Feb-20 FRP Advisory Group plc Industrials LSE - AIM $0.1bn
14-Feb-20 Airtel Malawi plc Telecommunications Malawi SE $0.0bn
Pricing date Issuer name Issuer country Sector Exchange Money raised3-Feb-20 SGS SA Industrials SIX Swiss Exchange $2.4bn
31-Mar-20 ams AG Technology SIX Swiss Exchange $1.8bn
22-Jan-20 Prosus NV Technology Euronext Amsterdam $1.6bn
4-Feb-20 Worldline SA Industrials Euronext Paris $1.6bn
27-Jan-20 Iliad SA Telecommunications Euronext Paris $1.5bn
8-Jan-20 Orsted A/S Utilities NASDAQ Copenhagen $0.9bn
4-Mar-20 TeamViewer AG Technology Deutsche Börse $0.8bn
7-Feb-20 Hargreaves Lansdown plc Financials LSE $0.7bn
13-Jan-20 Evonik Industries AG Basic Materials Deutsche Börse $0.7bn
4-Feb-20 Wizz Air Holdings plc Consumer Services LSE $0.7bn
PwC | Global IPO Watch Q1 2020
Asia-PacificIPO activity was moderately lower on the back of the COVID-19 outbreak but still relatively robust. Shanghai and Thailand hosted two of the largest IPOs globally in the quarter.
Domestic Mainland China market new listing activities were particularly active in Q1 2020, accounting for 63% of the AsiaPac region's total IPO funds raised.
Whether this momentum can continue will depend on the timing of resumption of business activities and overall economic recovery from the pandemic.
18
Kennedy LiuHead of Capital MarketsPwC Mainland China and Hong Kong
Geoffrey TangDirector, Capital MarketsPwC Hong Kong
PwC | Global IPO Watch Q1 2020
$91.0bn$51.3bn $48.2bn $66.2bn $77.8bn $71.5bn $81.3bn $93.5bn
$66.9bn $18.3bn
$1.5bn
$1.5bn $10.2bn$17.0bn $6.5bn $5.8bn $4.8bn
$6.1bn
$4.8bn$0.0bn
620397 363
542668 684
952
653 660
138
2011 2012 2013 2014 2015 2016 2017 2018 2019 2020YTD
Asia Australasia Number of IPOs
$115.1bn $135.1bn $140.5bn $160.1bn$218.2bn $197.5bn $194.7bn
$140.5bn $118.5bn$20.7bn
$23.5bn $17.6bn $20.7bn$22.3bn
$41.5bn$17.8bn $22.1bn
$22.4bn$26.5bn
$5.3bn
1,077 9781,265 1,325 1,478 1,368 1,395
1,043 926
164
2011 2012 2013 2014 2015 2016 2017 2018 2019 2020YTD
Asia Australasia Number of FOs
Money raised via IPOs and FOs in Asia-Pacific
19
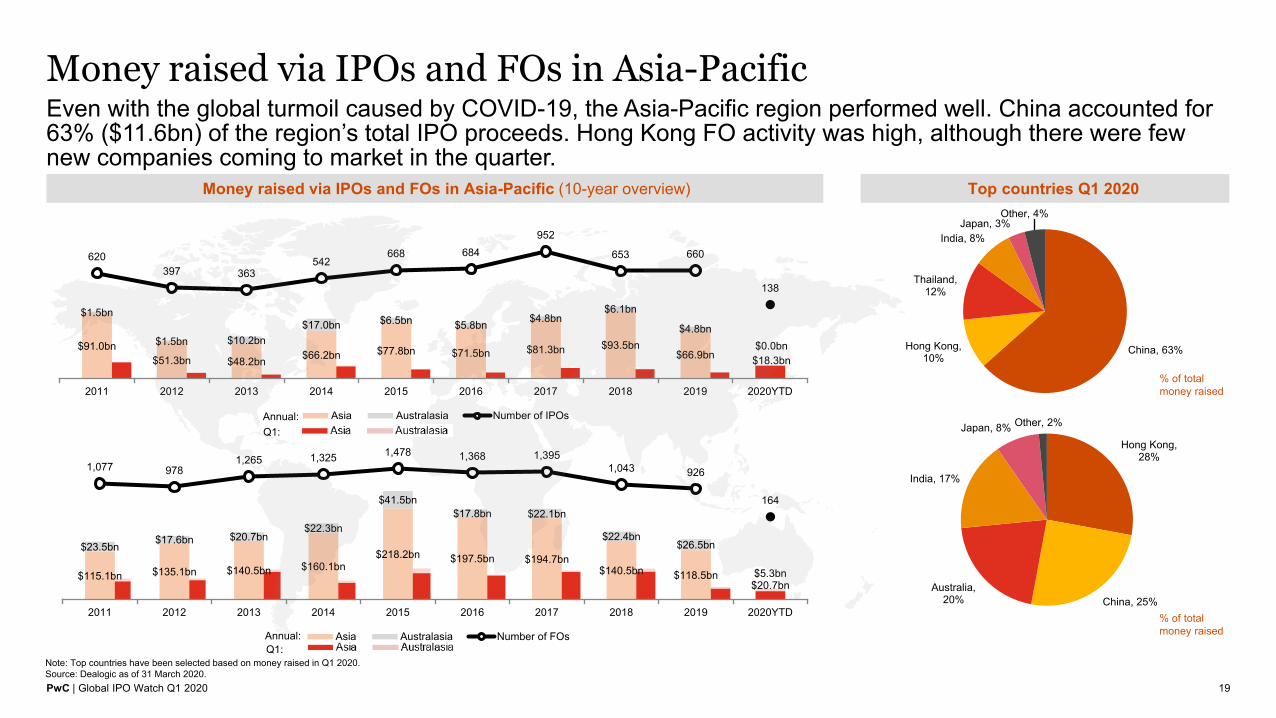
Even with the global turmoil caused by COVID-19, the Asia-Pacific region performed well. China accounted for 63% ($11.6bn) of the region’s total IPO proceeds. Hong Kong FO activity was high, although there were few new companies coming to market in the quarter.
Money raised via IPOs and FOs in Asia-Pacific (10-year overview) Top countries Q1 2020
Note: Top countries have been selected based on money raised in Q1 2020. Source: Dealogic as of 31 March 2020.
% of total money raised
% of total money raised
China, 63%Hong Kong, 10%
Thailand, 12%
India, 8%Japan, 3%
Other, 4%
Hong Kong, 28%
China, 25%Australia,
20%
India, 17%
Japan, 8% Other, 2%Q1:Annual:
Q1:Annual:
PwC | Global IPO Watch Q1 2020
60
70
80
90
100
110
Jan 20 Feb 20 Mar 20
Hang Seng Shanghai SENSEX
Overview of IPO and FO activity in Asia-Pacific
20
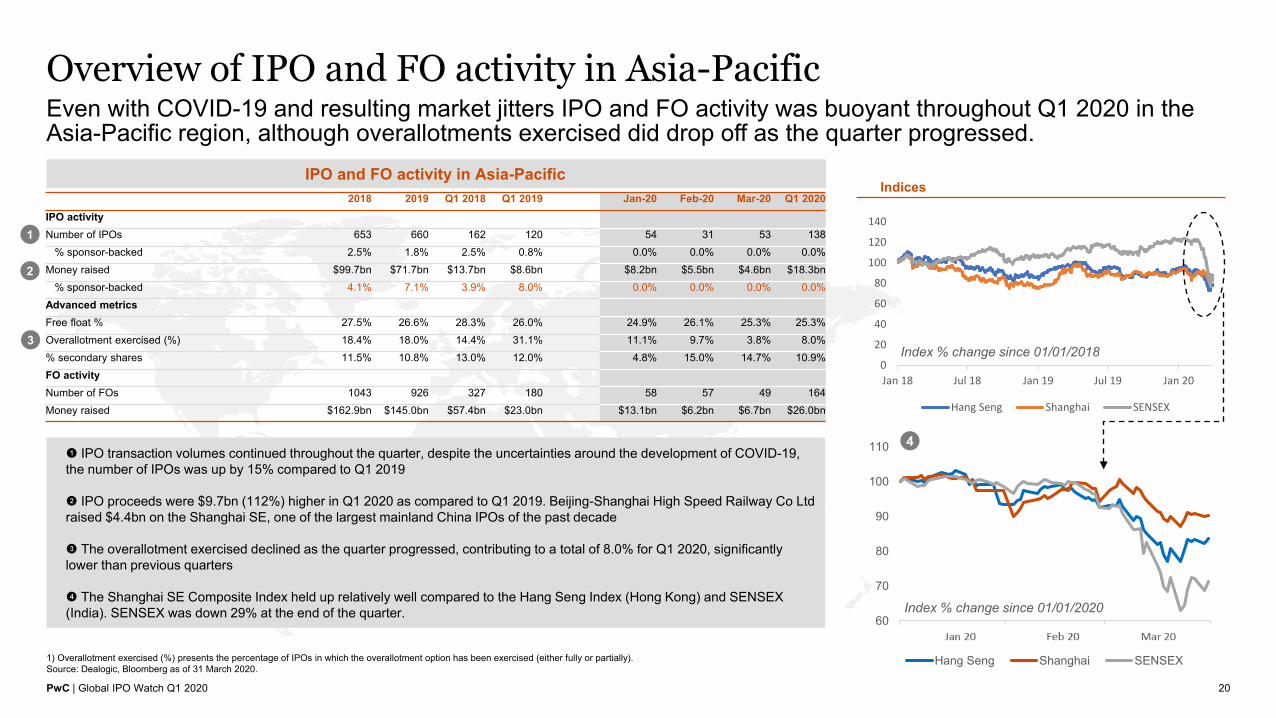
Even with COVID-19 and resulting market jitters IPO and FO activity was buoyant throughout Q1 2020 in the Asia-Pacific region, although overallotments exercised did drop off as the quarter progressed.
IPO and FO activity in Asia-Pacific
1) Overallotment exercised (%) presents the percentage of IPOs in which the overallotment option has been exercised (either fully or partially). Source: Dealogic, Bloomberg as of 31 March 2020.
1
2018 2019 Q1 2018 Q1 2019 Jan-20 Feb-20 Mar-20 Q1 2020IPO activityNumber of IPOs 653 660 162 120 54 31 53 138
% sponsor-backed 2.5% 1.8% 2.5% 0.8% 0.0% 0.0% 0.0% 0.0%Money raised $99.7bn $71.7bn $13.7bn $8.6bn $8.2bn $5.5bn $4.6bn $18.3bn
% sponsor-backed 4.1% 7.1% 3.9% 8.0% 0.0% 0.0% 0.0% 0.0%Advanced metricsFree float % 27.5% 26.6% 28.3% 26.0% 24.9% 26.1% 25.3% 25.3%Overallotment exercised (%) 18.4% 18.0% 14.4% 31.1% 11.1% 9.7% 3.8% 8.0%% secondary shares 11.5% 10.8% 13.0% 12.0% 4.8% 15.0% 14.7% 10.9%FO activityNumber of FOs 1043 926 327 180 58 57 49 164Money raised $162.9bn $145.0bn $57.4bn $23.0bn $13.1bn $6.2bn $6.7bn $26.0bn
Indices
! IPO transaction volumes continued throughout the quarter, despite the uncertainties around the development of COVID-19, the number of IPOs was up by 15% compared to Q1 2019
@ IPO proceeds were $9.7bn (112%) higher in Q1 2020 as compared to Q1 2019. Beijing-Shanghai High Speed Railway Co Ltd raised $4.4bn on the Shanghai SE, one of the largest mainland China IPOs of the past decade
# The overallotment exercised declined as the quarter progressed, contributing to a total of 8.0% for Q1 2020, significantly lower than previous quarters
$ The Shanghai SE Composite Index held up relatively well compared to the Hang Seng Index (Hong Kong) and SENSEX (India). SENSEX was down 29% at the end of the quarter.
2
3
0
20
40
60
80
100
120
140
Jan 18 Jul 18 Jan 19 Jul 19 Jan 20
Hang Seng Shanghai SENSEX
4
Index % change since 01/01/2020
Index % change since 01/01/2018
PwC | Global IPO Watch Q1 2020
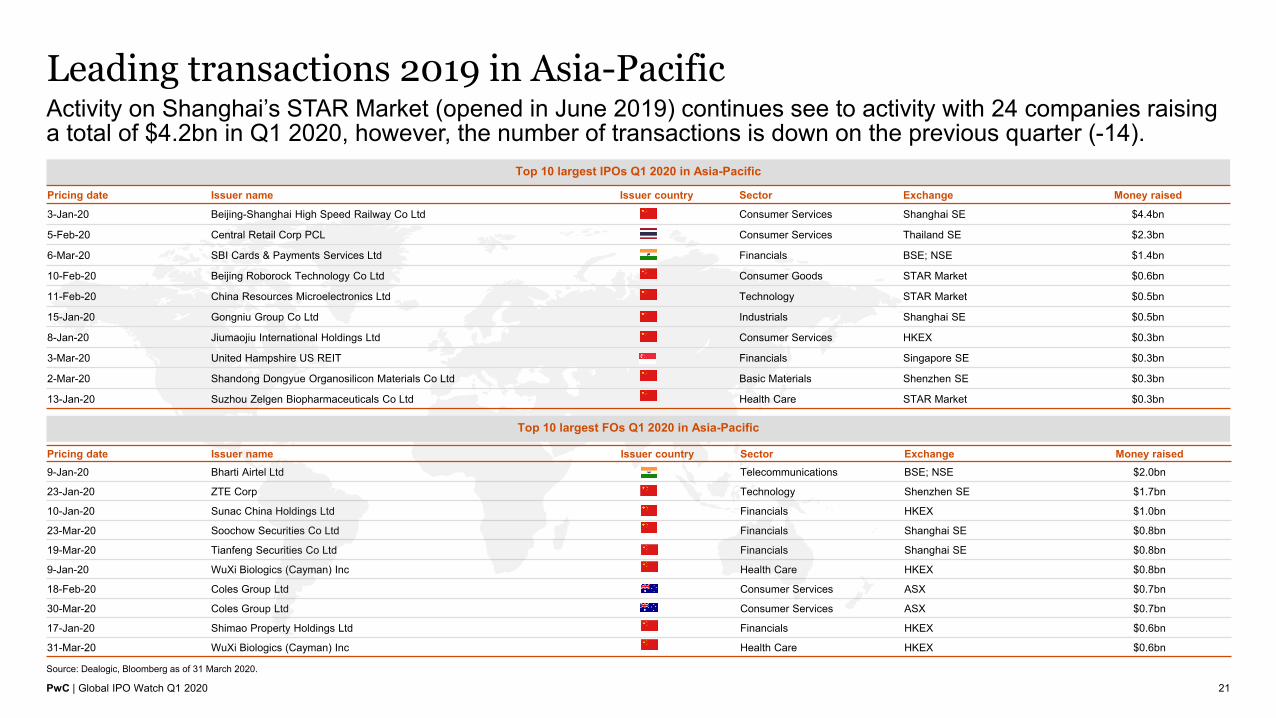
Pricing date Issuer name Issuer country Sector Exchange Money raised9-Jan-20 Bharti Airtel Ltd Telecommunications BSE; NSE $2.0bn
23-Jan-20 ZTE Corp Technology Shenzhen SE $1.7bn
10-Jan-20 Sunac China Holdings Ltd Financials HKEX $1.0bn
23-Mar-20 Soochow Securities Co Ltd Financials Shanghai SE $0.8bn
19-Mar-20 Tianfeng Securities Co Ltd Financials Shanghai SE $0.8bn
9-Jan-20 WuXi Biologics (Cayman) Inc Health Care HKEX $0.8bn
18-Feb-20 Coles Group Ltd Consumer Services ASX $0.7bn
30-Mar-20 Coles Group Ltd Consumer Services ASX $0.7bn
17-Jan-20 Shimao Property Holdings Ltd Financials HKEX $0.6bn
31-Mar-20 WuXi Biologics (Cayman) Inc Health Care HKEX $0.6bn
Leading transactions 2019 in Asia-Pacific
21
Activity on Shanghai’s STAR Market (opened in June 2019) continues see to activity with 24 companies raising a total of $4.2bn in Q1 2020, however, the number of transactions is down on the previous quarter (-14).
Top 10 largest IPOs Q1 2020 in Asia-Pacific
Source: Dealogic, Bloomberg as of 31 March 2020.
Top 10 largest FOs Q1 2020 in Asia-Pacific
Pricing date Issuer name Issuer country Sector Exchange Money raised
3-Jan-20 Beijing-Shanghai High Speed Railway Co Ltd Consumer Services Shanghai SE $4.4bn
5-Feb-20 Central Retail Corp PCL Consumer Services Thailand SE $2.3bn
6-Mar-20 SBI Cards & Payments Services Ltd Financials BSE; NSE $1.4bn
10-Feb-20 Beijing Roborock Technology Co Ltd Consumer Goods STAR Market $0.6bn
11-Feb-20 China Resources Microelectronics Ltd Technology STAR Market $0.5bn
15-Jan-20 Gongniu Group Co Ltd Industrials Shanghai SE $0.5bn
8-Jan-20 Jiumaojiu International Holdings Ltd Consumer Services HKEX $0.3bn
3-Mar-20 United Hampshire US REIT Financials Singapore SE $0.3bn
2-Mar-20 Shandong Dongyue Organosilicon Materials Co Ltd Basic Materials Shenzhen SE $0.3bn
13-Jan-20 Suzhou Zelgen Biopharmaceuticals Co Ltd Health Care STAR Market $0.3bn
PwC | Global IPO Watch Q1 2020
The Global IPO Watch analyses IPO and FO trends on a quarterly basis, both at a global and regional level. It is based on data extracted from Dealogic, whereby only transactions with a minimum of $5 million money raised have been included. Transaction proceeds include the overallotment option (if exercised). The data excludes PIPOs and transactions on Over-The-Counter exchanges. In case IPOs or FOs take place on two or more exchanges, the full amount of money raised is attributed to all exchanges. The same applies to countries and regions. This does not apply to two exchanges within the same country or two countries within the same region. Country indicates the company’s country of domicile. Industry classification is based on the FTSE Russell Industry Classification Benchmark. Index performance is based on pricing data extracted from Bloomberg.
Basis of preparation
22

pwc.com
Thank you
©2020 PwC. All rights reserved. PwC refers to the US member firm or one of its subsidiaries or affiliates, and may sometimes refer to the PwC network. Each member firm is a separate legal entity. Please see www.pwc.com/structure for further details.