
Alternative Risk Measures for Alternative Investments - Jean-Paul
Global Investments & Risk Management Best Practices, Innovations and Strategies
Panelist
Devin Parker Vice President & Assistant Treasurer Capital Markets, Investments, Risk & Insurance Western Union
Moderator
Scott Fox SVP, Business Development ICD
Panelist
Jeff Knapp Senior Treasury Analyst Coca-Cola

Moderator
Scott Fox SVP, Business Development ICD
Panelist
Jeff Knapp Senior Treasury Analyst Coca-Cola
Panelist
Devin Parker Vice President & Assistant Treasurer Capital Markets, Investments, Risk & Insurance Western Union
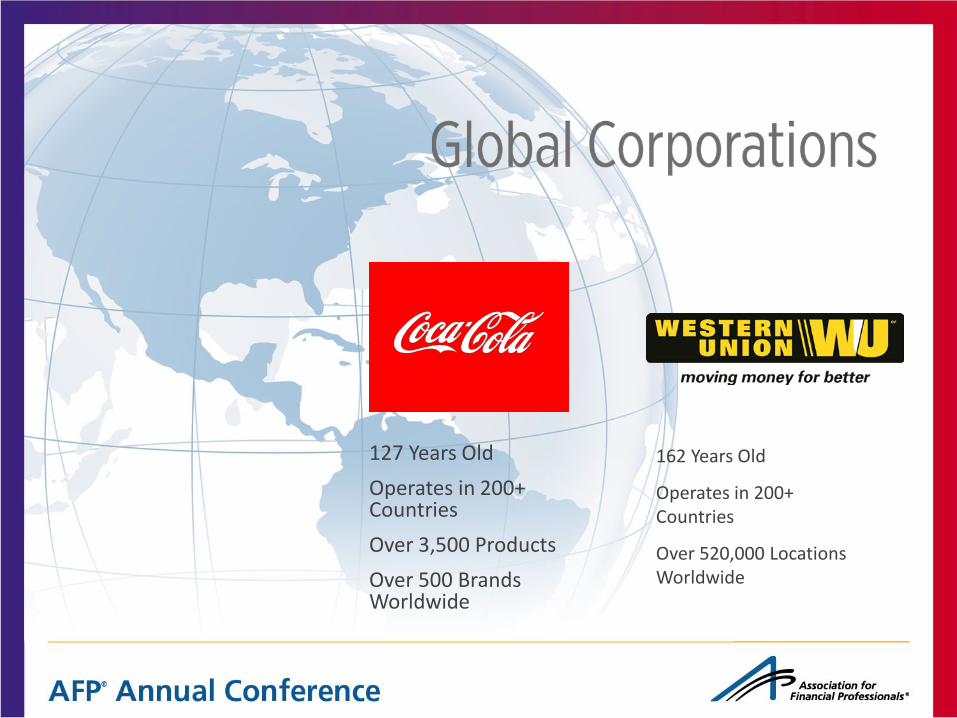
127 Years Old Operates in 200+ Countries Over 3,500 Products Over 500 Brands Worldwide
162 Years Old
Operates in 200+ Countries
Over 520,000 Locations Worldwide

Investment Considerations, Risks and Liquidity Needs
Methods for Evaluating Risk
Understanding the Yield Curve
Analyzing Opportunities to Extend Duration
Using Technology to Manage Risks & Investments
Summary / Key Takeaways
4

Investment Considerations & Approach
4. Actively Manage Portfolios / Managers
• Sector allocation • Security selection • Yield curve structure • Daily risk management
Developing a successful investment strategy requires thoughtful consideration of cash flow planning, investment objectives and risk tolerances
• Liquidity needs • Investment horizon – acquisition plans, capital spending • Cash flow considerations – frequency/magnitude of position changes
1. Identify Liquidity Characteristics
• Risk / return objectives and tolerance • Benchmark selection / guideline parameters • Accounting and tax considerations • Manager selection
2. Formulate Investment Objectives and Establish
Guidelines
• Seek to: • Maximize returns given risk tolerance • Diversify risks • Hedge unwanted risk
3. Construct Optimal Portfolio Allocation
5

Investment Risk RISK TOLERANCE CONSIDERATIONS:
• Tradeoffs of yield versus volatility • Potential for negative returns • Effect of interest rate moves
DESCRIPTIONS OF CERTAIN INVESTMENT RISKS:
Interest Rate Risk - the risk that an investment’s value will change due to changes in the absolute level of interest rates or the shape of the yield curve; risk rises with increasing duration. Reinvestment risk is a competing risk to interest rate risk.
Credit Risk - adverse changes of a security’s value from actual or perceived deterioration in credit quality. Types of risks factors evaluated under credit risk include: profitability, leverage, quality of assets, capital, liquidity, corporate governance, legal risk, and event risk.
Liquidity Risk – risk that a security may not have a ready and deep market into which it may be sold without a substantial discount to price.
Pursuing incremental yield requires a willingness to assume measured risks
6
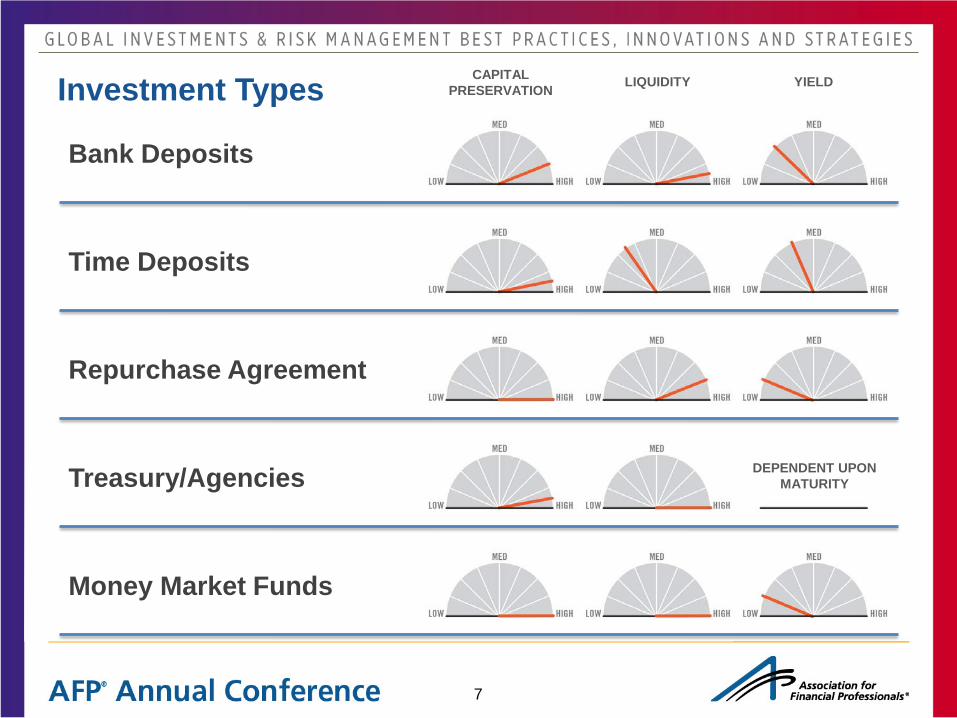
Investment Types CAPITAL PRESERVATION LIQUIDITY YIELD
Bank Deposits
Time Deposits
Repurchase Agreement
Treasury/Agencies
Money Market Funds
DEPENDENT UPON MATURITY
7

Investment Types
CAPITAL PRESERVATION LIQUIDITY YIELD
Bond Funds
CUSTOMIZABLE TO INVESTMENT POLICY, RISK TOLERANCE, AND RETURN OBJECTIVES Separately Managed
Accounts
VARIES DEPENDENING UPON FUND’S PROFILE
8

• Many companies rely solely on money market investments despite the fact that immediate liquidity needs are only a portion of cash balances
• Consider creating 2 to 3 distinct “pools” of cash to improve returns while meeting liquidity needs
Avai
labl
e
Cas
h B
alan
ces
Time
Core Cash
Investment “Pools”
Liquid Cash
Strategic Cash
Identifying Liquidity Characteristics
Money Market Investments
Traditional Corporate Cash Portfolio
Longer Term Strategic
Investments
Medium Term & More
Opportunistic Investments
Money Market Investments
Strategic Cash Core Cash Liquid Cash
9

Consider incorporating “best practices” for investment management – matching liquidity considerations, investment horizons, and risk tolerances
Liquid Cash Core Cash Strategic Cash Investment horizon 0 to 6 months 6 months or longer 1 year +
Typical portfolio duration 60 Days 6 months to 1 Year 2 Years
Cash Flow Volatility High Low Very Low
Objective Preservation of
capital and immediate liquidity
Enhanced returns with minimal principal risk
Risk constrained total return
Strategy Money Market investments Curve and Credit
Incremental curve & credit exposure +
manager skill
Return Expectation Low Improved Highest
Sample Investment Pool Characteristics
Identifying Liquidity Characteristics
10

Investment Considerations, Risks and Liquidity Needs
Methods for Evaluating Risk
Understanding the Yield Curve
Analyzing Opportunities to Extend Duration
Using Technology to Manage Risks & Investments
Summary / Key Takeaways
11

Comparative Default Rates for Municipal & Corporate Debt
Municipal (%) Corporate (%)
AAA 0.00 1.09
AA 0.06 1.15
A 0.10 2.77
BBB 0.39 7.71
BB 2.04 20.52
B 8.84 34.54
CCC/C2 41.45 56.55
Investment-Grade 0.15 3.83
Speculative-Grade 6.75 29.40
Ratings Considerations
(15-Year Cumulative Default Rates) For municipal defaults, S&P’s study period was January 1986 to January 2010. For corporate defaults, S&P’s study period was January 1981 to December 2010.
May add yield & diversification
12

A swap designed to transfer the credit exposure of fixed income products between parties whereby the purchaser of the swap makes payments to the seller up until the maturity date of a contract, in return, the seller agrees to pay off a third party debt if this party defaults on the loan. A CDS is considered insurance against non-payment.
• CDS Spread is the amount over LIBOR that a counterparty charges for credit protection
• The higher the spread, the higher the credit risk of the underlying asset
• Benefits and considerations of using CDS in your analysis
• Real time, market based information (unlike credit ratings)
• Ability to see trends and compare (and ease of use)
• Liquidity / Technicals
• A word of caution
What is CDS? The ability to buy or sell insurance against default
13
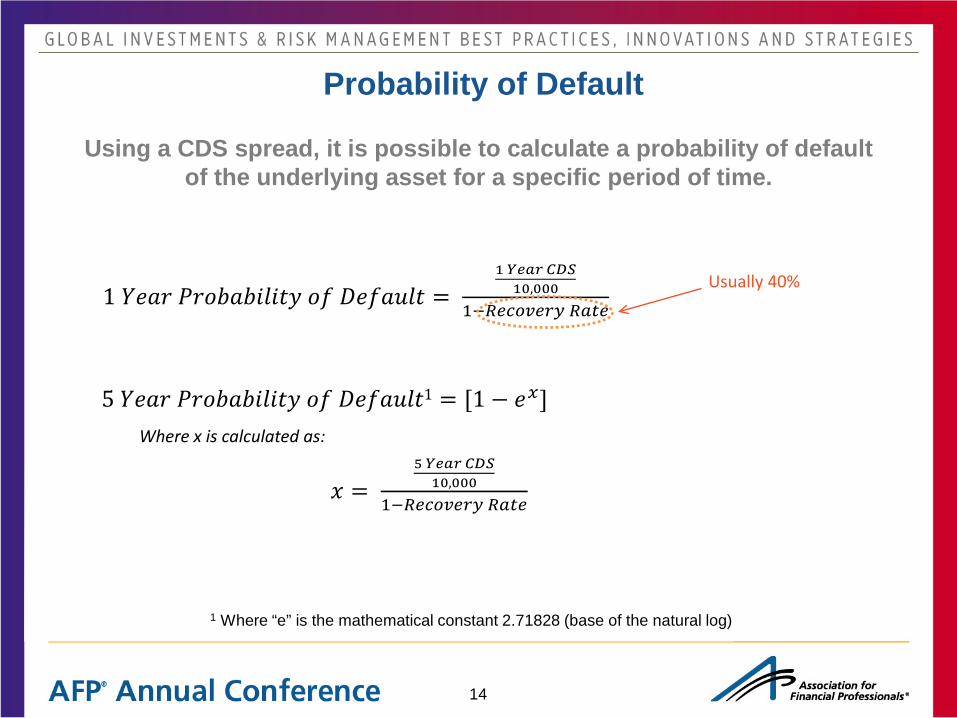
1 Where “e” is the mathematical constant 2.71828 (base of the natural log)
Usually 40%
Probability of Default
Using a CDS spread, it is possible to calculate a probability of default of the underlying asset for a specific period of time.
1 𝑌𝑌𝑌𝑌 𝑃𝑌𝑃𝑃𝑌𝑃𝑃𝑃𝑃𝑃𝑃 𝑃𝑜 𝐷𝑌𝑜𝑌𝐷𝑃𝑃 = 1 𝑌𝑌𝑌𝑌 𝐶𝐶𝐶10,000
1−𝑅𝑅𝑅𝑅𝑅𝑅𝑅𝑅 𝑅𝑅𝑅𝑅
5 𝑌𝑌𝑌𝑌 𝑃𝑌𝑃𝑃𝑌𝑃𝑃𝑃𝑃𝑃𝑃 𝑃𝑜 𝐷𝑌𝑜𝑌𝐷𝑃𝑃1 = [1 − 𝑌𝑥] Where x is calculated as:
𝑥 = 5 𝑌𝑌𝑌𝑌 𝐶𝐶𝐶10,000
1−𝑅𝑅𝑅𝑅𝑅𝑅𝑅𝑅 𝑅𝑅𝑅𝑅
14

JP Morgan (CDS of 91) – 7% Probability of default within 5 years
15
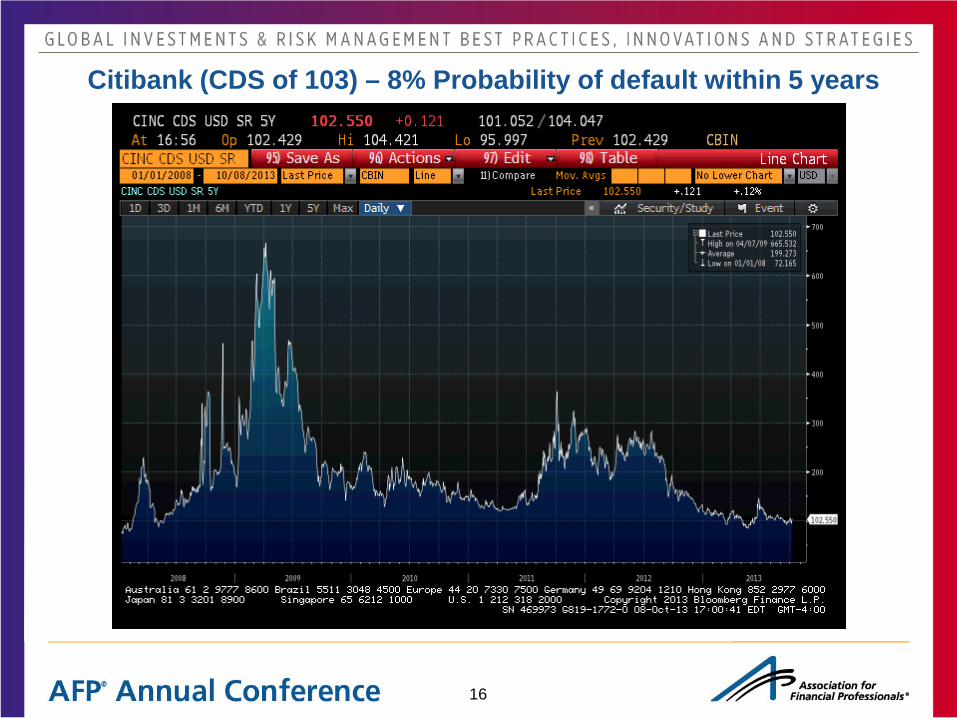
Citibank (CDS of 103) – 8% Probability of default within 5 years
16

Puerto Rico (CDS of 589) – 39% Probability of default within 5 years
17

Venezuela (CDS of 988) – 56% Probability of default within 5 years
18
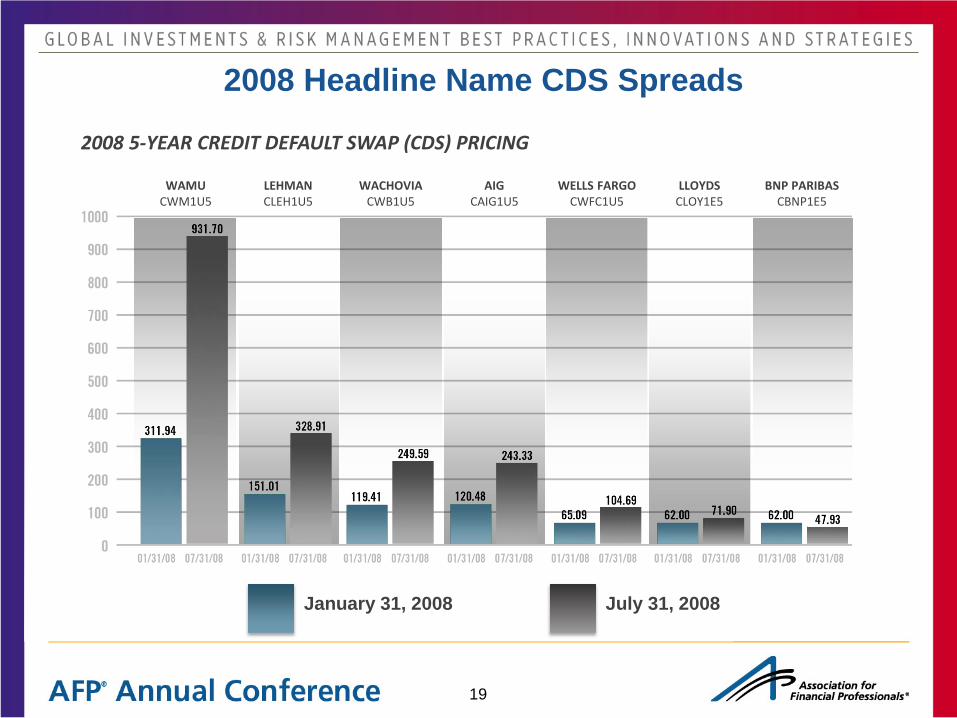
2008 5-YEAR CREDIT DEFAULT SWAP (CDS) PRICING
WAMU CWM1U5
LEHMAN CLEH1U5
WACHOVIA CWB1U5
AIG CAIG1U5
WELLS FARGO CWFC1U5
LLOYDS CLOY1E5
BNP PARIBAS CBNP1E5
January 31, 2008
2008 Headline Name CDS Spreads
July 31, 2008
19

What is Tier 1 Capital?
20
• A comparison between a banking firm's core equity capital and total risk-weighted assets. A firm's core equity capital is known as its Tier 1 capital and is the measure of a bank's financial strength based on the sum of its equity capital and disclosed reserves, and sometimes non-redeemable, non-cumulative preferred stock. A firm's risk-weighted assets include all assets that the firm holds that are systematically weighted for credit risk.
• Benefits and considerations of using Tier 1 capital in your analysis
– Helps determine if a bank in well capitalized (6% or higher to be well capitalized)
– Provides the ability to compare different banks
𝑻𝑻𝑻𝑻 𝟏 𝑹𝑹𝑹𝑻𝑹 =
𝑪𝑹𝑪𝑪𝑹𝑪 𝑺𝑹𝑹𝑺𝑺+ 𝑵𝑹𝑪 − 𝑹𝑻𝑹𝑻𝑻𝑪𝑹𝑹𝑹𝑻 𝑪𝑹𝑪𝑪𝑹𝑪 𝑺𝑹𝑹𝑺𝑺 + 𝑹𝑻𝑹𝑹𝑻𝑪𝑻𝑹 𝑬𝑹𝑻𝑪𝑻𝑪𝑬𝑬 + 𝑫𝑻𝑬𝑺𝑹𝑹𝑬𝑻𝑹 𝑹𝑻𝑬𝑻𝑻𝑹𝑻𝑬𝑻𝑹𝑹𝑹𝑹 𝑨𝑬𝑬𝑻𝑹𝑬

What are -Performing Assets? • A classification used by financial institutions that refer to loans that are in
jeopardy of default. Once the borrower has failed to make interest or principal payments for 90 days the loan is considered to be a non-performing asset
• Benefits and considerations of using Non-Performing Assets in your analysis
– Only as good as the most recent financials – May be late to the game
𝑵𝑹𝑪 − 𝑷𝑻𝑻𝒆𝑹𝑻𝑪𝑻𝑪𝑬 𝑨𝑬𝑬𝑻𝑹𝑬 𝑹𝑹 𝑻𝑹𝑹𝑹𝑹 𝑨𝑬𝑬𝑻𝑹𝑬 = 𝑵𝑹𝑪 − 𝑷𝑻𝑻𝒆𝑹𝑻𝑪𝑻𝑪𝑬 𝑨𝑬𝑬𝑻𝑹𝑬
𝑻𝑹𝑹𝑹𝑹 𝑨𝑬𝑬𝑻𝑹𝑬
What are Non-Performing Assets?
21

Investment Considerations, Risks and Liquidity Needs
Methods for Evaluating Risk
Understanding the Yield Curve
Analyzing Opportunities to Extend Duration
Using Technology to Manage Risks & Investments
Summary / Key Takeaways
22

Interest Rate Risk is the risk an investment declines in value due to an increase in interest rates – is it worth extending duration?
• How severe is the move?
• How long does it take?
• Are maturities affected differently?
• How much is priced in?
• What does the curve tell you?
• What is the volatility of rates and how big a standard deviation move would it take to regret the trade?
• Do you get paid over time for extending duration?
Understanding rate risk when extending maturities to pick-up yield
23

• The current yield curve tells a story of which direction rates are expected to go
• An upward sloping curve says that rates are expected to rise
• A downward (or inverted) yield curve says that rates are expected to decline
• Forward rate (or yield) curves take it a step further. They tell the story of how much and when rates will move over a certain period of time (i.e., 1, 2, 3 years)
• These calculations are interpolated based on the current yield curve.
• You can use the forward rate curves to calculate what is “priced in”
• Priced in means that if you own a maturing security over x number of years versus holding cash you would be indifferent
• A key concept to understand is that in a rising rate environment, you can be indifferent because you still earn income and roll down by owning a maturing security
Yield Curve Tells a Story…
24
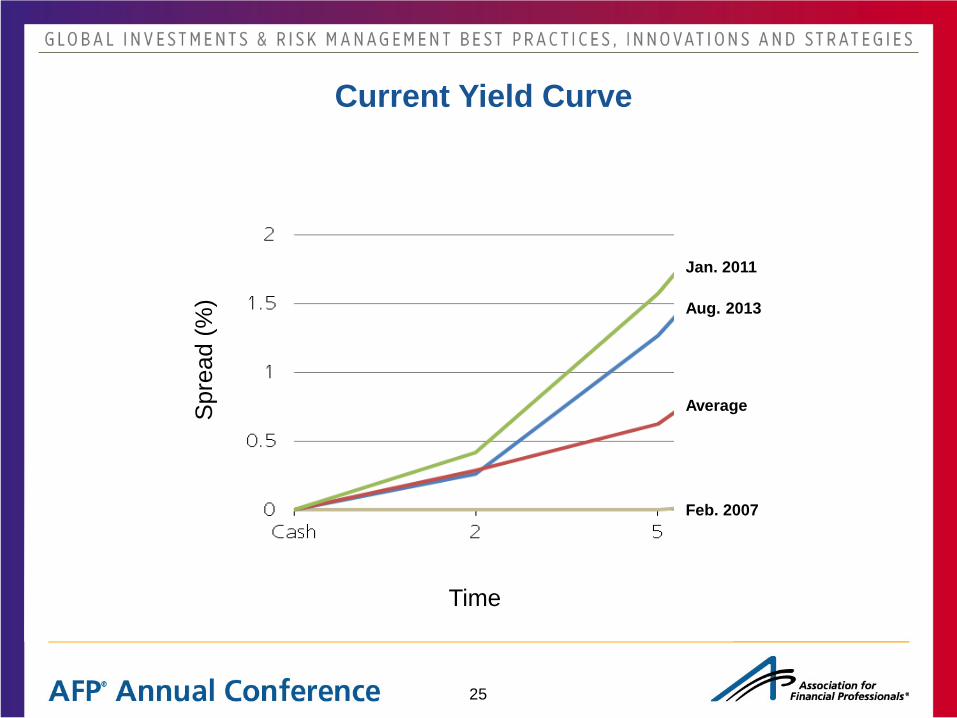
Aug. 2013
Feb. 2007
Average
Jan. 2011
Spr
ead
(%)
Current Yield Curve
Time
25

Investment Options – Putting it Simply OPTION 1
• Buy a 1 year maturity
• 1 year bond yield is 0.25%
• Income 0.25% • Principal 0.00% • Return in 1 year 0.25%
OPTION 2
• Buy a 2 year maturity and sell in 1 year
• 2 year bond yield is 0.60%
• In order to have Option 1 and Option 2 equal each other (or, break even), the 2 year maturity must lose -0.35% in principal value because it’s income is 0.60%.
• Income 0.60% • Principal -0.35% • Return in 1 year 0.25%
• Since a 2 year maturity, one year forward, is a 1 year maturity, how much do rates need to rise in order to lose 0.35% of principal? For a 1 year maturity security, that is 0.35% (1 year duration x 35 bps = 0.35%) therefore, 1 year securities will need to yield 0.95% (0.60% + 0.35%).
• Current 1 year security is 0.25% and the breakeven rate is 0.95%, the market is pricing in a 70 bps rise.
• If rates rise more than 70 bps for 1 year securities, an investor is better off in Option 1. If rates rise less, an investor is better off in Option 2.
26
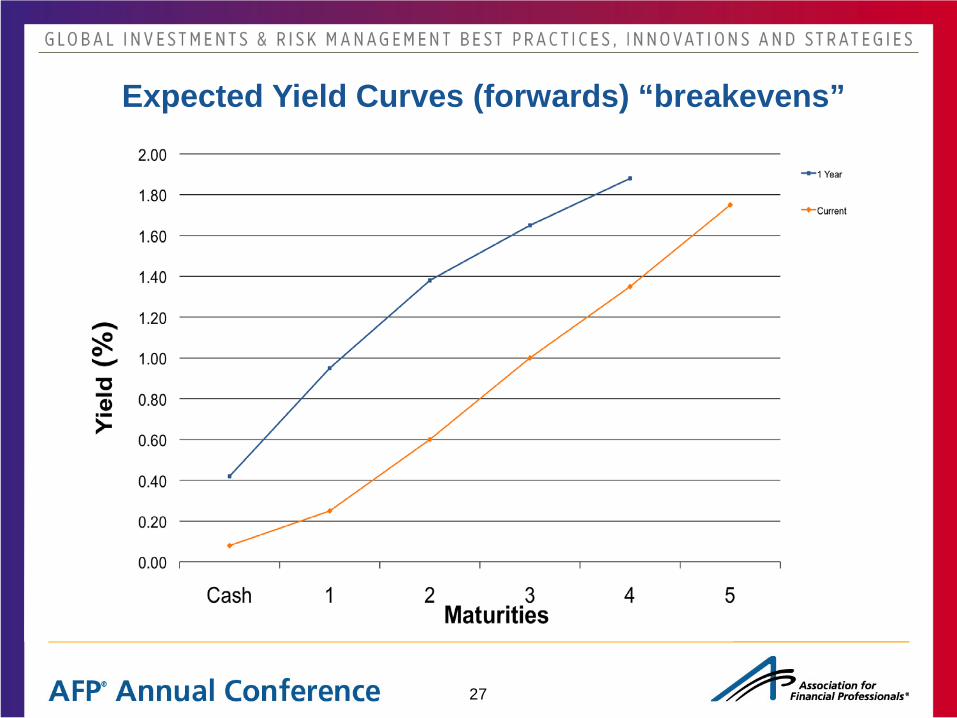
Expected Yield Curves (forwards) “breakevens”
27

Investment Considerations, Risks and Liquidity Needs
Methods for Evaluating Risk
Understanding the Yield Curve
Analyzing Opportunity to Extend Duration
Using Technology to Manage Risks & Investments
Summary / Key Takeaways
28
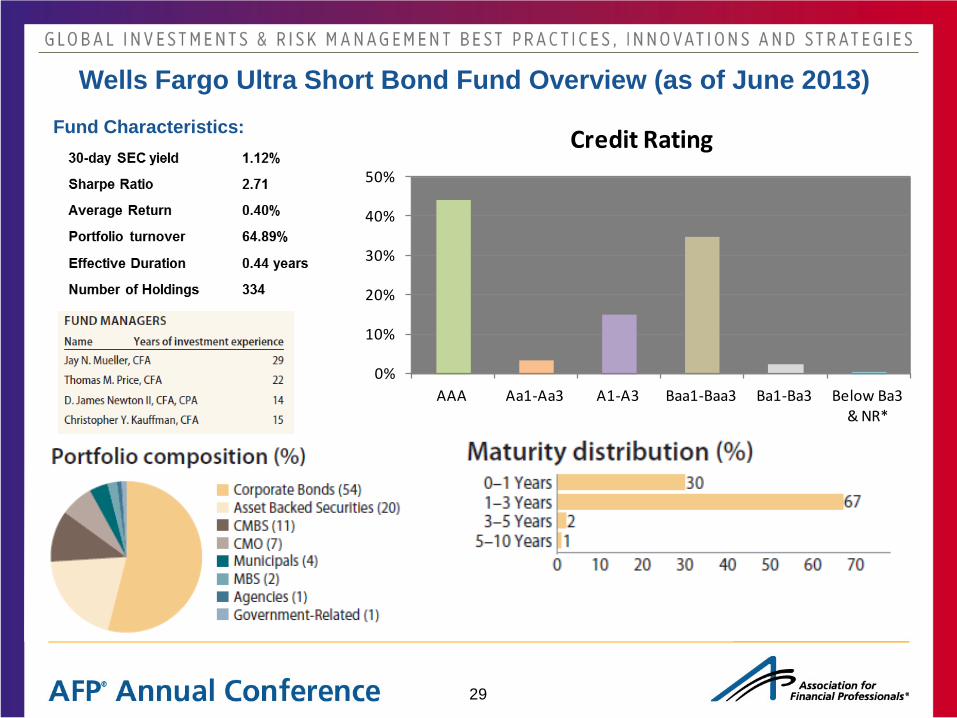
0%
10%
20%
30%
40%
50%
AAA Aa1-Aa3 A1-A3 Baa1-Baa3 Ba1-Ba3 Below Ba3 & NR*
Credit Rating
Wells Fargo Ultra Short Bond Fund Overview (as of June 2013) Fund Characteristics:
29
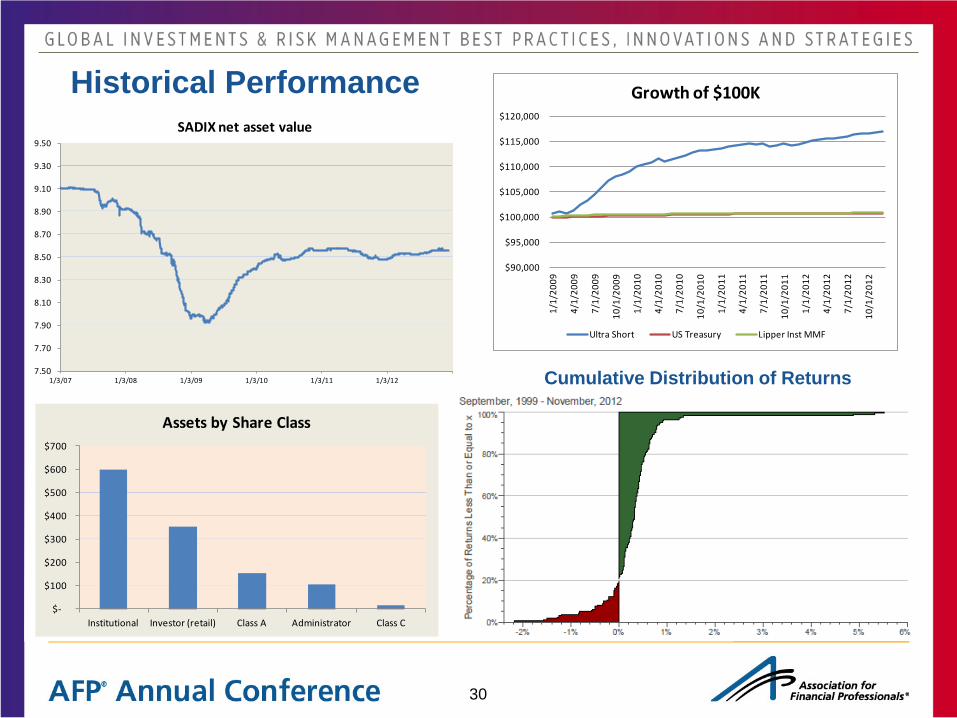
7.50
7.70
7.90
8.10
8.30
8.50
8.70
8.90
9.10
9.30
9.50
1/3/07 1/3/08 1/3/09 1/3/10 1/3/11 1/3/12
SADIX net asset value
Historical Performance
Cumulative Distribution of Returns
$-
$100
$200
$300
$400
$500
$600
$700
Institutional Investor (retail) Class A Administrator Class C
Assets by Share Class
$90,000
$95,000
$100,000
$105,000
$110,000
$115,000
$120,000
1/1/
2009
4/1/
2009
7/1/
2009
10/1
/200
9
1/1/
2010
4/1/
2010
7/1/
2010
10/1
/201
0
1/1/
2011
4/1/
2011
7/1/
2011
10/1
/201
1
1/1/
2012
4/1/
2012
7/1/
2012
10/1
/201
2
Growth of $100K
Ultra Short US Treasury Lipper Inst MMF
30

SADIXAlpha 0.2%Correlation -0.01R-Squared 0.00Beta -0.02Excess Return 0.6%Sharpe 2.7
MPT Statistics Compared to Lipper Inst. MF Index
Sponsor 5yr CDS S&P OutlookWells Fargo 71 A+ NegativeUnited States 41 AA+ NegativeJPMorgan 81 A NegativeFord Motor 165 BB+ PositiveBank of America 117 A- NegativeFiat Industrial 244 BB+ StableGeneral Electric 69 AA+ StableCitigroup 111 A- NegativeMorgan Stanley 138 A- NegativeNordea Bank 76 AA- NegativeSvenska Handelsbanken 68 AA- NegativePorshe Automobil 61 -- --Deutsche Bank 99 A+ NegativeTime Warner 54 BBB StableDominion Resources 36 A- StableDaimler 97 A- Stable
85Weighted Average:
Risk/Reward Trade Off – SADIX
31

Risk/Reward Trade Off – SADIX Continued
Time to Recover 1¢ NAV
32
Breakeven Point
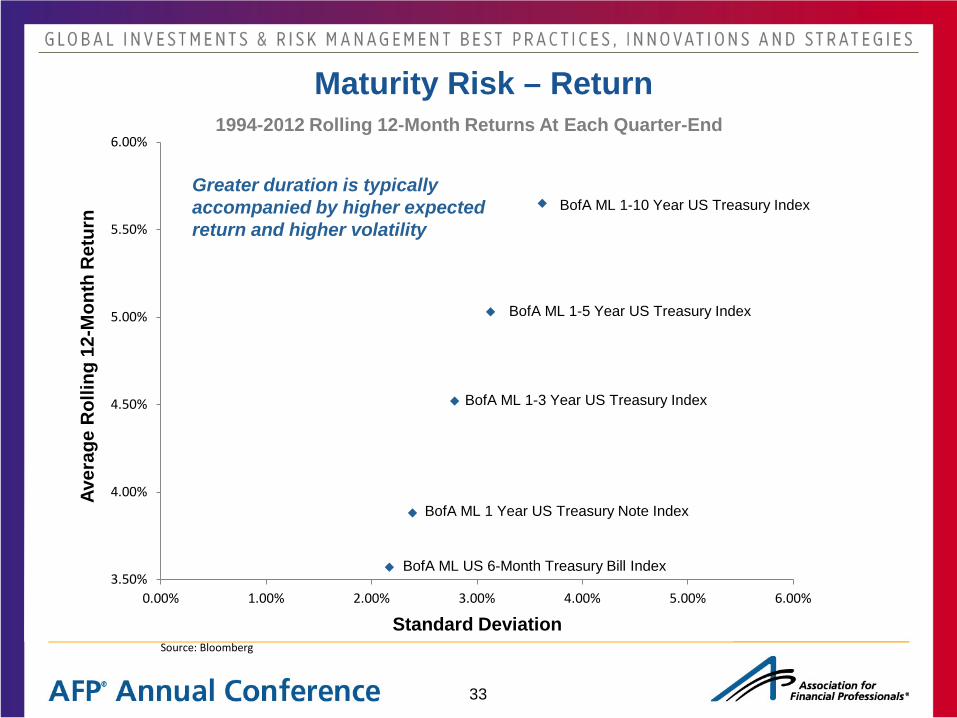
1994-2012 Rolling 12-Month Returns At Each Quarter-End
Source: Bloomberg
Greater duration is typically accompanied by higher expected return and higher volatility
Maturity Risk – Return
3.50%
4.00%
4.50%
5.00%
5.50%
6.00%
0.00% 1.00% 2.00% 3.00% 4.00% 5.00% 6.00%
BofA ML US 6-Month Treasury Bill Index
BofA ML 1 Year US Treasury Note Index
BofA ML 1-3 Year US Treasury Index
BofA ML 1-5 Year US Treasury Index
BofA ML 1-10 Year US Treasury Index
Standard Deviation
Aver
age
Rol
ling
12-M
onth
Ret
urn
33

Rolling 12-Month Returns At Each Quarter-End January 1994- December 2012
*The 1994-2012 period includes one negative return period for the 1-3 Year Index, two negative return periods for the 1-5 Year Index, and five negative return periods for the 1-10 Year Index. Source: Bloomberg
6.90%
8.54%
11.00%
12.83%
14.59%
0.15% 0.24% -0.35% * -0.80%*
-1.71% *
3.57% 3.88% 4.52% 5.03%
5.65%
-4%
-2%
0%
2%
4%
6%
8%
10%
12%
14%
16%
BofA ML US 6-MonthTreasury Bill Index
BofA ML 1-Year USTreasury Note Index
BofA ML 1-3 Year USTreasury Index
BofA ML 1-5 Year USTreasury Index
BofA ML 1-10 Year USTreasury Index
Highest Return
Mean
Lowest Return
Total Return for One Year Holding Periods
34

Investment Considerations, Risks and Liquidity Needs
Methods for Evaluating Risk
Understanding the Yield Curve
Analyzing Opportunity to Extend Duration
Using Technology to Manage Risks & Investments
Summary / Key Takeaways
35

Consolidate trading to small number of platforms
• Invest all Money Market Funds through one platform • ICD portal • Numerous bank portals
• Place time deposit trades electronically • Bloomberg RFQ
Optimize with Integration
36

Bloomberg RFQ
37

Optimize with Integration
Integrate trading platforms to Treasury Workstation
• Eliminates extra work
• Reduces data entry allowing more time for analysis of exposures
• Simplifies reporting
• If everything is in one place, less work
38

Optimize with Integration
39

1. Avoid concentrating funds with too few counterparties
2. Evaluate the relative financial strength of selected counterparties
3. Understand the exposures that your counterparty may have
a. Bank may have a large exposure to a specific country/counterparty
Elements to Managing Counterparty Risk
40

Bank /
Criteria Weighting
Moody's S&P Fitch 30 CDS AVG
CDS from Avg
T1 Capital Ratio
NPA/Total Assets
Wt/Avg Score
Change in Stock Price
10% 10% 10% 25% 25% 20% 100%
Bank 1 7 8 6 1 ok 1 9 5.38 0.02
Bank 2 10 10 10 10 ok 10 10 5.00 0.10
Bank 3 3 4 4 1 ok 10 1 5.00 0.55
Bank 4 10 10 9 7 ok 2 10 7.90 0.20
Bank 5 7 7 6 1 ok 5 5 5.05 0.01
Bank 6 4 10 4 1 ok 9 3 4.70 0.02
Bank 7 9 10 10 10 ok 9 6 5.18 0.08
Bank 8 10 10 10 3 ok 10 10 6.00 5.00
Bank 9 5 10 4 10 Fail 6 2 3.38 0.03
Bank 10 5 10 4 10 Fail 2 1 2.08 0.01
Risk Analysis Tool
41

Direct Exposure
Short Duration Bond Funds
Separately Managed Accounts
Money Market Funds
Risk Management Analysis – Portfolio View
42

Risk Management Analysis – Country Exposure
43

Risk Management Analysis – Fund Holdings
44

Risk Management Analysis – CDS Spreads
45

Risk Management Analysis – Stock Performance
46

13% ABCP
12% ABCP
12% ABCP
13% ABCP
Risk Management Analysis – Sector Allocation
47

Additional Transparency Tools – Separate Accounts
48

Model what can happen in different circumstances • Default scenarios • Spread widening scenarios • Rate shock scenarios / forward curve analysis
• Duration risk – to extend or not
• Money Fund risk analysis • Credit risk in the fund portfolio • Interest rate risk • Risk from heavy investor redemption • What happens if I change my fund lineup
What If Scenarios
49

What are the implications on your liquidity planning of a failure of the U.S. Government to increase the debt ceiling and a potential technical default/payment delay resulting from such inaction?
• The chances of such an event are low but are not zero and while the full implications including unintended consequences can’t be fully known it is important to have a plan to successfully navigate such a scenario
• We may face this issue multiple times
• The payment delay from a default will be temporary and would impact near term maturities and interest payments (no cross-default)
• Money market funds have run stress tests showing even a severe rate shock should not result in a loss of principle, nevertheless they maintained excess liquidity
– Prime funds vs. Treasury / Government Funds
• A sound approach is to stay diversified, keep cash liquid in bank accounts and high quality funds with strong bank sponsors and to continue to monitor counterparty strength / underlying exposures
• Dislocations can also create opportunities
50

Dislocation in T-Bills
51

Investment Considerations, Risks and Liquidity Needs
Methods for Evaluating Risk
Understanding the Yield Curve
Analyzing Opportunity to Extend Duration
Using Technology to Manage Risks & Investments
Summary / Key Takeaways
52

Credit Assessment Internal Rating Assigned
Internal Review • Interview Obligor Management • Perform Structural, Legal, Financial and
Economic Analysis • Review and Deliberate with Portfolio Manager
Site Visit
• Importance of a dedicated team of independent fixed income credit analysts • Internal vs. external resources
• Intensive credit focus on both quantitative and qualitative factors
ESG Review
Credit Review Process
Rating Agencies
Wall Street Research
Offering Documents Investment Banker
Bond Counsel Proposed Deal Structure
Other Data Resources
Media Internet Comparables
53

Utilize a rigorous relative value assessment and a disciplined research process drive security selection with a focus on the factors unique to each sector when evaluating securities for investment.
RELATIVE VALUE ASSESSMENT
Identify securities with attractive risk/reward characteristics
Security misvaluations can be identified and captured
SECURITY SELECTION
Disciplined Approach to Security Selection
Quantitative Analysis Historical spread analysis Volatility Tax considerations
Fundamental Credit Research
Credit score Proactive approach Industry / Company outlook
Security Analysis Maturity characteristics Structure Scenario analysis
Qualitative Analysis
Liquidity Supply outlook Investor demand
54
• Understand liquidity requirements and consider dividing your cash into 2-3 pools / tiers
• Pursuing incremental returns requires assuming measured risks
• Understanding the risks you are assuming is key
– Discussed multiple tools to assist you (CDS, Ratio Analysis, Non-performing assets)
– Make active decisions about the risk you want to assume
• Yield curve Analysis can help you make better decisions on extending duration
• Scenario analysis can be a useful tool for managing risk and investments
– Rate shocks, forward curve analysis
– Changes in holdings
• Utilize the power of technology to bring it all together and save time
– Aggregate exposures
– Analyze trends
– Manage risk, not data (manage your time)
Key Takeaways
55

Thank You!
Moderator
Scott Fox SVP, Business Development ICD
Panelist
Jeff Knapp Senior Treasury Analyst Coca-Cola
Panelist
Devin Parker Vice President & Assistant Treasurer Capital Markets, Investments, Risk & Insurance Western Union