Global Investment Outlook: Midyear 2018 (PDF) · for institutional, professional, qualified...
16
Global Investment Outlook MIDYEAR 2018 BII0718U/E-542516-1699251
Transcript of Global Investment Outlook: Midyear 2018 (PDF) · for institutional, professional, qualified...
Global Investment OutlookMIDYEAR 2018
BII0718U/E-542516-1699251

FOR INSTITUTIONAL, PROFESSIONAL, QUALIFIED INVESTORS AND QUALIFIED CLIENTS. FOR PUBLIC DISTRIBUTION IN THE U.S.
G L O B A L I N V E S T M E N T O U T L O O K S U M M A R Y2
Kate MooreChief Equity Strategist
BlackRock Investment Institute
Jean BoivinGlobal Head of Research
BlackRock Investment Institute
Isabelle Mateos y LagoChief Multi-Asset Strategist
BlackRock Investment Institute
Jeff Rosenberg Chief Fixed Income Strategist
BlackRock Investment Institute
Richard TurnillGlobal Chief
Investment Strategist
BlackRock Investment Institute
SETTING THE SCENE ....... 3
2018 THEMES .............. 4–6Wider range of growth outcomesTighter financial conditionsGreater portfolio resilience
OUTLOOK DEBATE .....7–10Market regime changeGlobal trade risksEuropean fragmentationChina’s balancing act
MARKETS ..................11–15Fixed incomeEquitiesCommodities and currenciesThematic investingAssets in brief
We refresh our 2018 investment themes against a backdrop of steady global growth and strong corporate earnings, but rising uncertainty in the macro outlook. We highlight key debates from our recent Outlook Forum, such as the implications of trade tensions.
• Themes: Our base case sees strong U.S. growth extending positive spillover effects to the rest of the
world, sustaining the global economic expansion. Yet the range of possibilities for the economic
outlook has widened. On the downside: trade war and overheating risks. On the upside: U.S. stimulus-
fueled surprises. This greater uncertainty − along with rising interest rates − has contributed to
tightening financial conditions and argues for building greater resilience into portfolios. A rising U.S.
dollar squeezes dollar-funded entities including emerging markets (EMs) with large external debt loads.
• Outlook debate: The market regime that brought outsized risk-adjusted returns in 2017 is changing.
Rising leverage in pockets of the credit markets is a concern, but we see no flashing red lights yet −
and view liquidity as a greater risk. Global trade disputes pose risks to market sentiment and growth.
A populist Italian government and immigration tensions have raised the risk of European fragmentation,
but we expect the eurozone to muddle through this year. We see China’s economy as steady in the near
term, even as deleveraging poses slowdown risks.
• Market views: We remain pro-risk but have tempered that stance given the uneasy equilibrium we see
between rising macro uncertainty and strong earnings. We prefer U.S. equities over other regions.
We still see momentum equities outperforming, and prefer quality exposures over value. In fixed
income, we favor short-term bonds in the U.S. and take an up-in-quality stance in credit. Rising risk
premia have created value in some EM assets. We like selected private credit and real assets for
diversification. We see sustainable investing adding long-term resilience to portfolios.
BII0718U/E-542516-1699251
FOR INSTITUTIONAL, PROFESSIONAL, QUALIFIED INVESTORS AND QUALIFIED CLIENTS. FOR PUBLIC DISTRIBUTION IN THE U.S.
S E T T I N G T H E S C E N E3
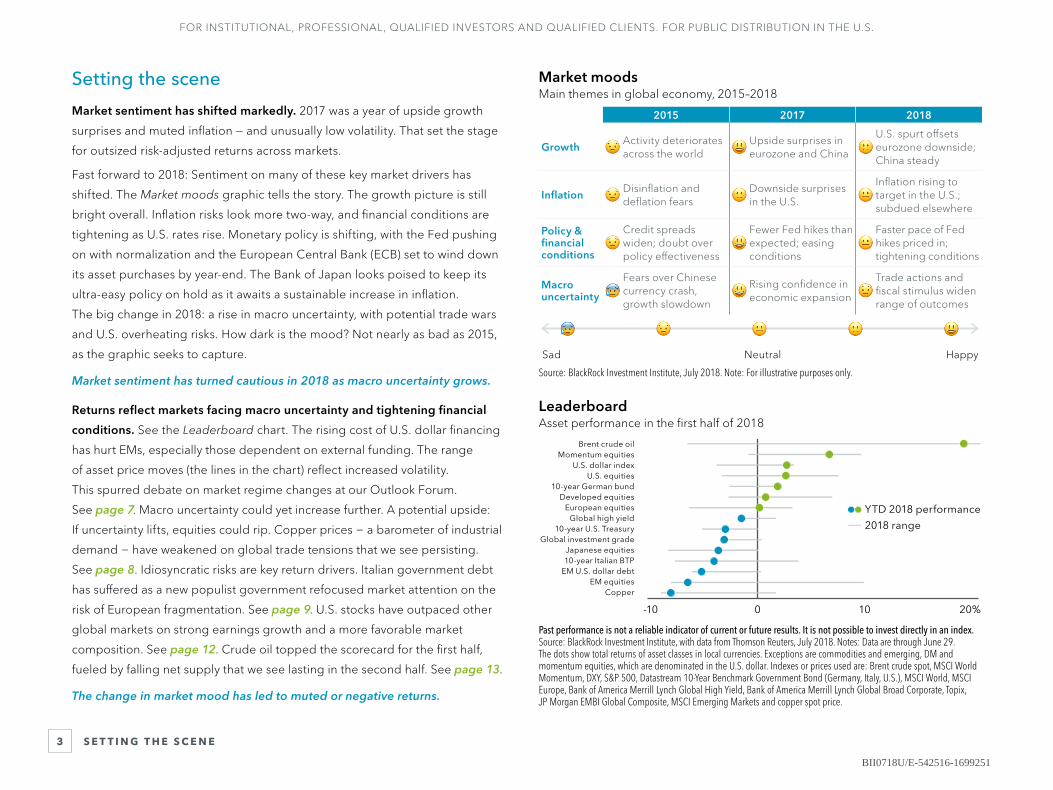
Market moodsMain themes in global economy, 2015–2018
Source: BlackRock Investment Institute, July 2018. Note: For illustrative purposes only.
LeaderboardAsset performance in the first half of 2018
-10 0 10 20%
CopperEM equities
EM U.S. dollar debt10-year Italian BTPJapanese equities
Global investment grade10-year U.S. Treasury
Global high yieldEuropean equities
Developed equities10-year German bund
U.S. equitiesU.S. dollar index
Momentum equitiesBrent crude oil
2018 range
YTD 2018 performance
Past performance is not a reliable indicator of current or future results. It is not possible to invest directly in an index. Source: BlackRock Investment Institute, with data from Thomson Reuters, July 2018. Notes: Data are through June 29. The dots show total returns of asset classes in local currencies. Exceptions are commodities and emerging, DM and momentum equities, which are denominated in the U.S. dollar. Indexes or prices used are: Brent crude spot, MSCI World Momentum, DXY, S&P 500, Datastream 10-Year Benchmark Government Bond (Germany, Italy, U.S.), MSCI World, MSCI Europe, Bank of America Merrill Lynch Global High Yield, Bank of America Merrill Lynch Global Broad Corporate, Topix, JP Morgan EMBI Global Composite, MSCI Emerging Markets and copper spot price.
2015 2017 2018
GrowthActivity deteriorates across the world
Upside surprises in eurozone and China
U.S. spurt offsets eurozone downside; China steady
InflationDisinflation and deflation fears
Downside surprises in the U.S.
Inflation rising to target in the U.S.; subdued elsewhere
Policy & financial conditions
Credit spreads widen; doubt over policy effectiveness
Fewer Fed hikes than expected; easing conditions
Faster pace of Fed hikes priced in; tightening conditions
Macro uncertainty
Fears over Chinese currency crash, growth slowdown
Rising confidence in economic expansion
Trade actions and fiscal stimulus widen range of outcomes
Sad Neutral Happy
Setting the scene
Market sentiment has shifted markedly. 2017 was a year of upside growth
surprises and muted inflation — and unusually low volatility. That set the stage
for outsized risk-adjusted returns across markets.
Fast forward to 2018: Sentiment on many of these key market drivers has
shifted. The Market moods graphic tells the story. The growth picture is still
bright overall. Inflation risks look more two-way, and financial conditions are
tightening as U.S. rates rise. Monetary policy is shifting, with the Fed pushing
on with normalization and the European Central Bank (ECB) set to wind down
its asset purchases by year-end. The Bank of Japan looks poised to keep its
ultra-easy policy on hold as it awaits a sustainable increase in inflation.
The big change in 2018: a rise in macro uncertainty, with potential trade wars
and U.S. overheating risks. How dark is the mood? Not nearly as bad as 2015,
as the graphic seeks to capture.
Market sentiment has turned cautious in 2018 as macro uncertainty grows.
Returns reflect markets facing macro uncertainty and tightening financial
conditions. See the Leaderboard chart. The rising cost of U.S. dollar financing
has hurt EMs, especially those dependent on external funding. The range
of asset price moves (the lines in the chart) reflect increased volatility.
This spurred debate on market regime changes at our Outlook Forum.
See page 7. Macro uncertainty could yet increase further. A potential upside:
If uncertainty lifts, equities could rip. Copper prices − a barometer of industrial
demand − have weakened on global trade tensions that we see persisting.
See page 8. Idiosyncratic risks are key return drivers. Italian government debt
has suffered as a new populist government refocused market attention on the
risk of European fragmentation. See page 9. U.S. stocks have outpaced other
global markets on strong earnings growth and a more favorable market
composition. See page 12. Crude oil topped the scorecard for the first half,
fueled by falling net supply that we see lasting in the second half. See page 13.
The change in market mood has led to muted or negative returns.
BII0718U/E-542516-1699251
FOR INSTITUTIONAL, PROFESSIONAL, QUALIFIED INVESTORS AND QUALIFIED CLIENTS. FOR PUBLIC DISTRIBUTION IN THE U.S.
2 0 18 T H E M E S W I D E R R A N G E O F G R O W T H O U T C O M E S4
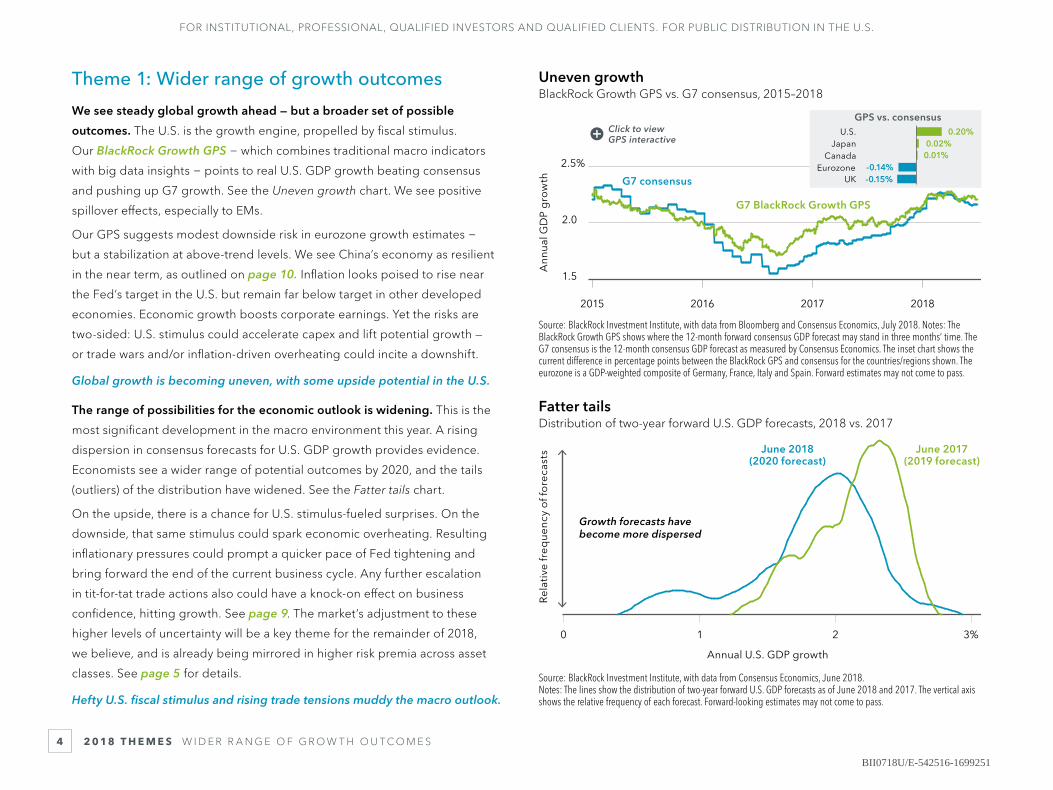
Uneven growthBlackRock Growth GPS vs. G7 consensus, 2015–2018
1.5
2.0
2.5%
Ann
ual G
DP
gro
wth
G7 BlackRock Growth GPS
G7 consensus UK -0.15%Eurozone -0.14%
Japan 0.02%Canada 0.01%
U.S. 0.20%
GPS vs. consensus
2018201720162015
Source: BlackRock Investment Institute, with data from Bloomberg and Consensus Economics, July 2018. Notes: The BlackRock Growth GPS shows where the 12-month forward consensus GDP forecast may stand in three months’ time. The G7 consensus is the 12-month consensus GDP forecast as measured by Consensus Economics. The inset chart shows the current difference in percentage points between the BlackRock GPS and consensus for the countries/regions shown. The eurozone is a GDP-weighted composite of Germany, France, Italy and Spain. Forward estimates may not come to pass.
Fatter tailsDistribution of two-year forward U.S. GDP forecasts, 2018 vs. 2017
Rel
ativ
e fr
eque
ncy
of f
ore
cast
s
Annual U.S. GDP growth
0 1 2 3%
Growth forecasts have become more dispersed
June 2017(2019 forecast)
June 2018 (2020 forecast)
Source: BlackRock Investment Institute, with data from Consensus Economics, June 2018. Notes: The lines show the distribution of two-year forward U.S. GDP forecasts as of June 2018 and 2017. The vertical axis shows the relative frequency of each forecast. Forward-looking estimates may not come to pass.
Click to view GPS interactive
Theme 1: Wider range of growth outcomes
We see steady global growth ahead — but a broader set of possible
outcomes. The U.S. is the growth engine, propelled by fiscal stimulus.
Our BlackRock Growth GPS − which combines traditional macro indicators
with big data insights − points to real U.S. GDP growth beating consensus
and pushing up G7 growth. See the Uneven growth chart. We see positive
spillover effects, especially to EMs.
Our GPS suggests modest downside risk in eurozone growth estimates −
but a stabilization at above-trend levels. We see China’s economy as resilient
in the near term, as outlined on page 10. Inflation looks poised to rise near
the Fed’s target in the U.S. but remain far below target in other developed
economies. Economic growth boosts corporate earnings. Yet the risks are
two-sided: U.S. stimulus could accelerate capex and lift potential growth —
or trade wars and/or inflation-driven overheating could incite a downshift.
Global growth is becoming uneven, with some upside potential in the U.S.
The range of possibilities for the economic outlook is widening. This is the
most significant development in the macro environment this year. A rising
dispersion in consensus forecasts for U.S. GDP growth provides evidence.
Economists see a wider range of potential outcomes by 2020, and the tails
(outliers) of the distribution have widened. See the Fatter tails chart.
On the upside, there is a chance for U.S. stimulus-fueled surprises. On the
downside, that same stimulus could spark economic overheating. Resulting
inflationary pressures could prompt a quicker pace of Fed tightening and
bring forward the end of the current business cycle. Any further escalation
in tit-for-tat trade actions also could have a knock-on effect on business
confidence, hitting growth. See page 9. The market’s adjustment to these
higher levels of uncertainty will be a key theme for the remainder of 2018,
we believe, and is already being mirrored in higher risk premia across asset
classes. See page 5 for details.
Hefty U.S. fiscal stimulus and rising trade tensions muddy the macro outlook.
BII0718U/E-542516-1699251
FOR INSTITUTIONAL, PROFESSIONAL, QUALIFIED INVESTORS AND QUALIFIED CLIENTS. FOR PUBLIC DISTRIBUTION IN THE U.S.
2 0 18 T H E M E S T I G H T E R F I N A N C I A L C O N D I T I O N S5
DeratingEquity market forward price-to-earnings ratios, 2013–2018
9
12
15
18
Emerging markets
Japan
Europe
U.S.
Forw
ard
P/E
rat
io
201820172016201520142013
Source: BlackRock Investment Institute, with data from Thomson Reuters, July 2018. Note: The lines show the 12-month forward price-to-earnings (P/E) ratios for the MSCI USA, MSCI Europe, MSCI Japan and MSCI Emerging Market indexes.Indexes are unmanaged. It is not possible to invest directly in an index.
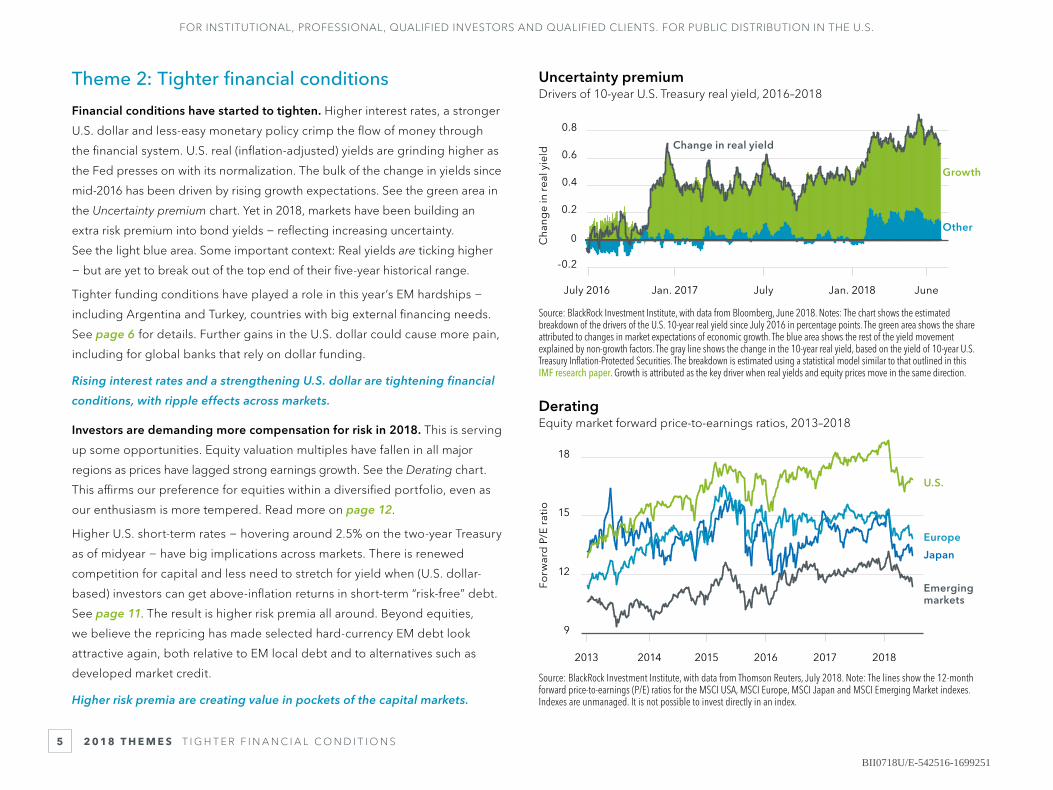
Uncertainty premiumDrivers of 10-year U.S. Treasury real yield, 2016–2018
Other
Growth
Cha
nge
in r
eal y
ield
Change in real yield
JuneJan. 2018JulyJan. 2017July 2016
-0.2
0
0.2
0.4
0.6
0.8
Source: BlackRock Investment Institute, with data from Bloomberg, June 2018. Notes: The chart shows the estimated breakdown of the drivers of the U.S. 10-year real yield since July 2016 in percentage points. The green area shows the share attributed to changes in market expectations of economic growth. The blue area shows the rest of the yield movement explained by non-growth factors. The gray line shows the change in the 10-year real yield, based on the yield of 10-year U.S. Treasury Inflation-Protected Securities. The breakdown is estimated using a statistical model similar to that outlined in this IMF research paper. Growth is attributed as the key driver when real yields and equity prices move in the same direction.
Theme 2: Tighter financial conditions
Financial conditions have started to tighten. Higher interest rates, a stronger
U.S. dollar and less-easy monetary policy crimp the flow of money through
the financial system. U.S. real (inflation-adjusted) yields are grinding higher as
the Fed presses on with its normalization. The bulk of the change in yields since
mid-2016 has been driven by rising growth expectations. See the green area in
the Uncertainty premium chart. Yet in 2018, markets have been building an
extra risk premium into bond yields − reflecting increasing uncertainty.
See the light blue area. Some important context: Real yields are ticking higher
− but are yet to break out of the top end of their five-year historical range.
Tighter funding conditions have played a role in this year’s EM hardships −
including Argentina and Turkey, countries with big external financing needs.
See page 6 for details. Further gains in the U.S. dollar could cause more pain,
including for global banks that rely on dollar funding.
Rising interest rates and a strengthening U.S. dollar are tightening financial
conditions, with ripple effects across markets.
Investors are demanding more compensation for risk in 2018. This is serving
up some opportunities. Equity valuation multiples have fallen in all major
regions as prices have lagged strong earnings growth. See the Derating chart.
This affirms our preference for equities within a diversified portfolio, even as
our enthusiasm is more tempered. Read more on page 12.
Higher U.S. short-term rates − hovering around 2.5% on the two-year Treasury
as of midyear − have big implications across markets. There is renewed
competition for capital and less need to stretch for yield when (U.S. dollar-
based) investors can get above-inflation returns in short-term “risk-free” debt.
See page 11. The result is higher risk premia all around. Beyond equities,
we believe the repricing has made selected hard-currency EM debt look
attractive again, both relative to EM local debt and to alternatives such as
developed market credit.
Higher risk premia are creating value in pockets of the capital markets.
BII0718U/E-542516-1699251
FOR INSTITUTIONAL, PROFESSIONAL, QUALIFIED INVESTORS AND QUALIFIED CLIENTS. FOR PUBLIC DISTRIBUTION IN THE U.S.
2 0 18 T H E M E S G R E AT E R P O R T F O L I O R E S I L I E N C E6
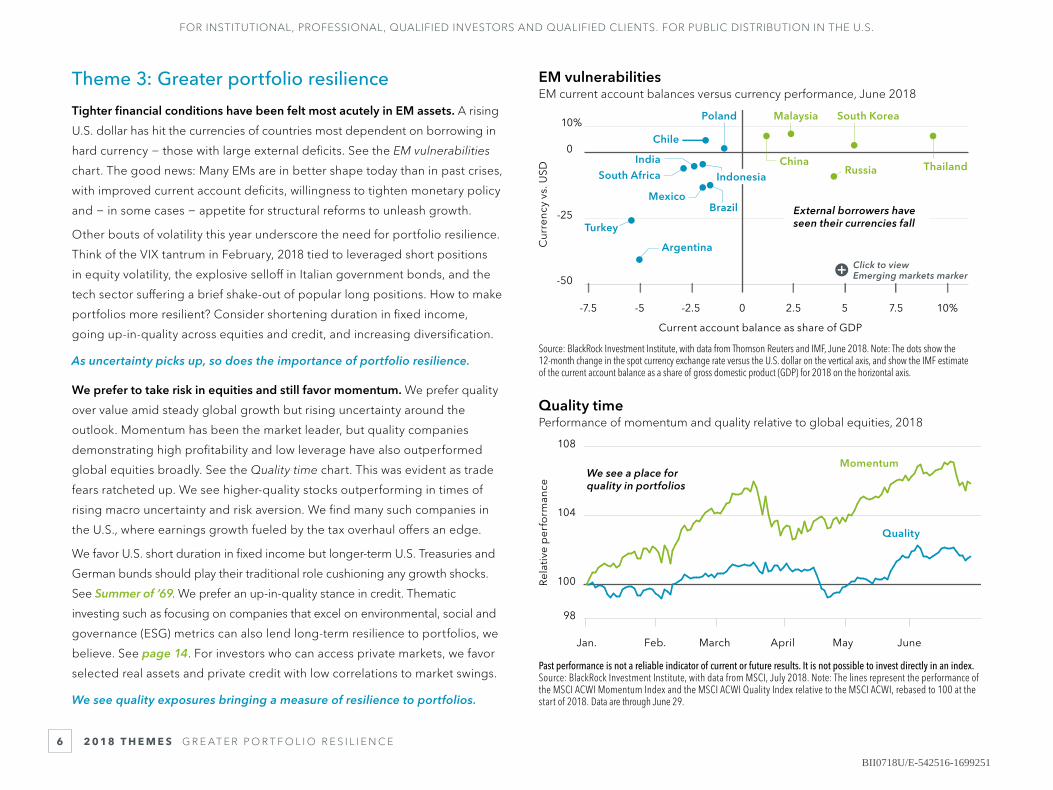
EM vulnerabilitiesEM current account balances versus currency performance, June 2018
-7.5 -5 -2.5 0 2.5 5 7.5 10%
-50
-25
0
10%
Cur
renc
y vs
. USD
Current account balance as share of GDP
India
Poland
Chile
Mexico
Turkey
Brazil
Argentina
Russia
Malaysia South Korea
ThailandChinaIndonesiaSouth Africa
External borrowers have seen their currencies fall
Source: BlackRock Investment Institute, with data from Thomson Reuters and IMF, June 2018. Note: The dots show the 12-month change in the spot currency exchange rate versus the U.S. dollar on the vertical axis, and show the IMF estimate of the current account balance as a share of gross domestic product (GDP) for 2018 on the horizontal axis.
Quality timePerformance of momentum and quality relative to global equities, 2018
98
100
104
108
We see a place for quality in portfolios
Rel
ativ
e p
erfo
rman
ce
Momentum
Quality
JuneMayAprilMarchFeb.Jan.
Past performance is not a reliable indicator of current or future results. It is not possible to invest directly in an index. Source: BlackRock Investment Institute, with data from MSCI, July 2018. Note: The lines represent the performance of the MSCI ACWI Momentum Index and the MSCI ACWI Quality Index relative to the MSCI ACWI, rebased to 100 at the start of 2018. Data are through June 29.
Click to view Emerging markets marker
Theme 3: Greater portfolio resilience
Tighter financial conditions have been felt most acutely in EM assets. A rising
U.S. dollar has hit the currencies of countries most dependent on borrowing in
hard currency − those with large external deficits. See the EM vulnerabilities
chart. The good news: Many EMs are in better shape today than in past crises,
with improved current account deficits, willingness to tighten monetary policy
and − in some cases − appetite for structural reforms to unleash growth.
Other bouts of volatility this year underscore the need for portfolio resilience.
Think of the VIX tantrum in February, 2018 tied to leveraged short positions
in equity volatility, the explosive selloff in Italian government bonds, and the
tech sector suffering a brief shake-out of popular long positions. How to make
portfolios more resilient? Consider shortening duration in fixed income,
going up-in-quality across equities and credit, and increasing diversification.
As uncertainty picks up, so does the importance of portfolio resilience.
We prefer to take risk in equities and still favor momentum. We prefer quality
over value amid steady global growth but rising uncertainty around the
outlook. Momentum has been the market leader, but quality companies
demonstrating high profitability and low leverage have also outperformed
global equities broadly. See the Quality time chart. This was evident as trade
fears ratcheted up. We see higher-quality stocks outperforming in times of
rising macro uncertainty and risk aversion. We find many such companies in
the U.S., where earnings growth fueled by the tax overhaul offers an edge.
We favor U.S. short duration in fixed income but longer-term U.S. Treasuries and
German bunds should play their traditional role cushioning any growth shocks.
See Summer of ’69. We prefer an up-in-quality stance in credit. Thematic
investing such as focusing on companies that excel on environmental, social and
governance (ESG) metrics can also lend long-term resilience to portfolios, we
believe. See page 14. For investors who can access private markets, we favor
selected real assets and private credit with low correlations to market swings.
We see quality exposures bringing a measure of resilience to portfolios.
BII0718U/E-542516-1699251
FOR INSTITUTIONAL, PROFESSIONAL, QUALIFIED INVESTORS AND QUALIFIED CLIENTS. FOR PUBLIC DISTRIBUTION IN THE U.S.
O U T L O O K D E B AT E M A R K E T R E G I M E C H A N G E7
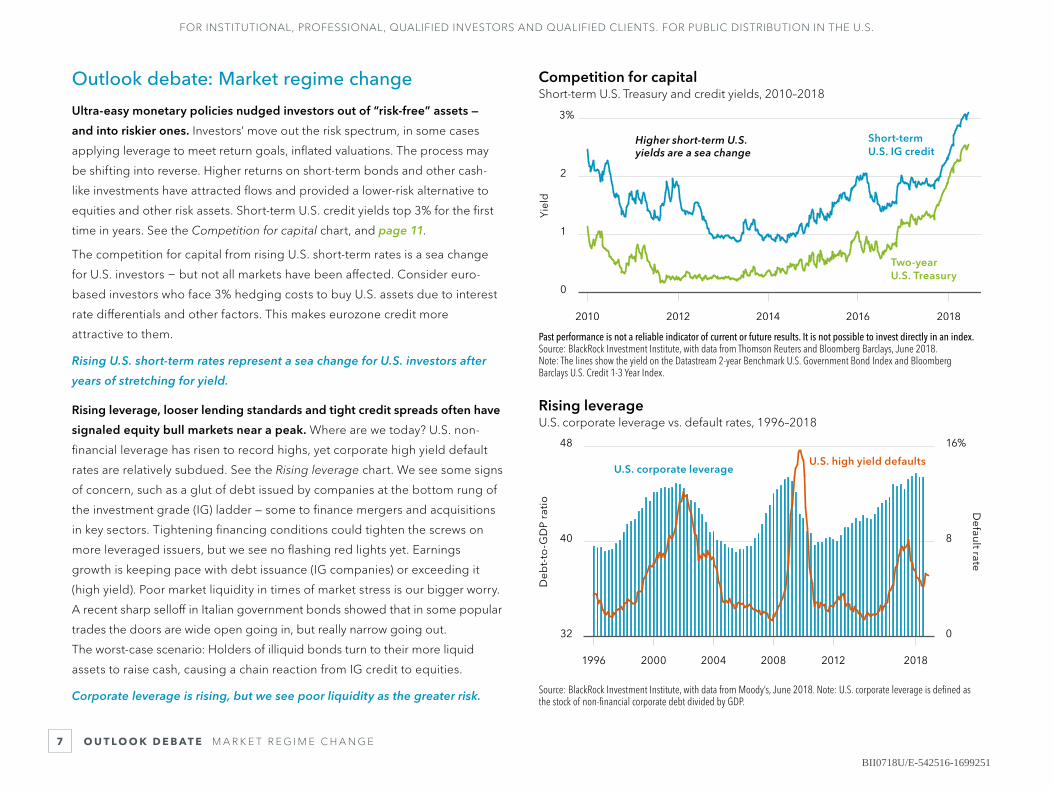
Competition for capitalShort-term U.S. Treasury and credit yields, 2010–2018
Higher short-term U.S. yields are a sea change
0
1
2
3%
Short-term U.S. IG credit
Two-yearU.S. Treasury
20182016201420122010
Yie
ld
Past performance is not a reliable indicator of current or future results. It is not possible to invest directly in an index. Source: BlackRock Investment Institute, with data from Thomson Reuters and Bloomberg Barclays, June 2018.Note: The lines show the yield on the Datastream 2-year Benchmark U.S. Government Bond Index and Bloomberg Barclays U.S. Credit 1-3 Year Index.
Rising leverageU.S. corporate leverage vs. default rates, 1996–2018
32
40
48
Deb
t-to
-GD
P ra
tio
0
8
16%
Default rate
U.S. corporate leverageU.S. high yield defaults
201820122008200420001996
Source: BlackRock Investment Institute, with data from Moody’s, June 2018. Note: U.S. corporate leverage is defined as the stock of non-financial corporate debt divided by GDP.
Outlook debate: Market regime change
Ultra-easy monetary policies nudged investors out of “risk-free” assets —
and into riskier ones. Investors’ move out the risk spectrum, in some cases
applying leverage to meet return goals, inflated valuations. The process may
be shifting into reverse. Higher returns on short-term bonds and other cash-
like investments have attracted flows and provided a lower-risk alternative to
equities and other risk assets. Short-term U.S. credit yields top 3% for the first
time in years. See the Competition for capital chart, and page 11.
The competition for capital from rising U.S. short-term rates is a sea change
for U.S. investors − but not all markets have been affected. Consider euro-
based investors who face 3% hedging costs to buy U.S. assets due to interest
rate differentials and other factors. This makes eurozone credit more
attractive to them.
Rising U.S. short-term rates represent a sea change for U.S. investors after
years of stretching for yield.
Rising leverage, looser lending standards and tight credit spreads often have
signaled equity bull markets near a peak. Where are we today? U.S. non-
financial leverage has risen to record highs, yet corporate high yield default
rates are relatively subdued. See the Rising leverage chart. We see some signs
of concern, such as a glut of debt issued by companies at the bottom rung of
the investment grade (IG) ladder — some to finance mergers and acquisitions
in key sectors. Tightening financing conditions could tighten the screws on
more leveraged issuers, but we see no flashing red lights yet. Earnings
growth is keeping pace with debt issuance (IG companies) or exceeding it
(high yield). Poor market liquidity in times of market stress is our bigger worry.
A recent sharp selloff in Italian government bonds showed that in some popular
trades the doors are wide open going in, but really narrow going out.
The worst-case scenario: Holders of illiquid bonds turn to their more liquid
assets to raise cash, causing a chain reaction from IG credit to equities.
Corporate leverage is rising, but we see poor liquidity as the greater risk.
BII0718U/E-542516-1699251
FOR INSTITUTIONAL, PROFESSIONAL, QUALIFIED INVESTORS AND QUALIFIED CLIENTS. FOR PUBLIC DISTRIBUTION IN THE U.S.
O U T L O O K D E B AT E G L O B A L T R A D E R I S K S8
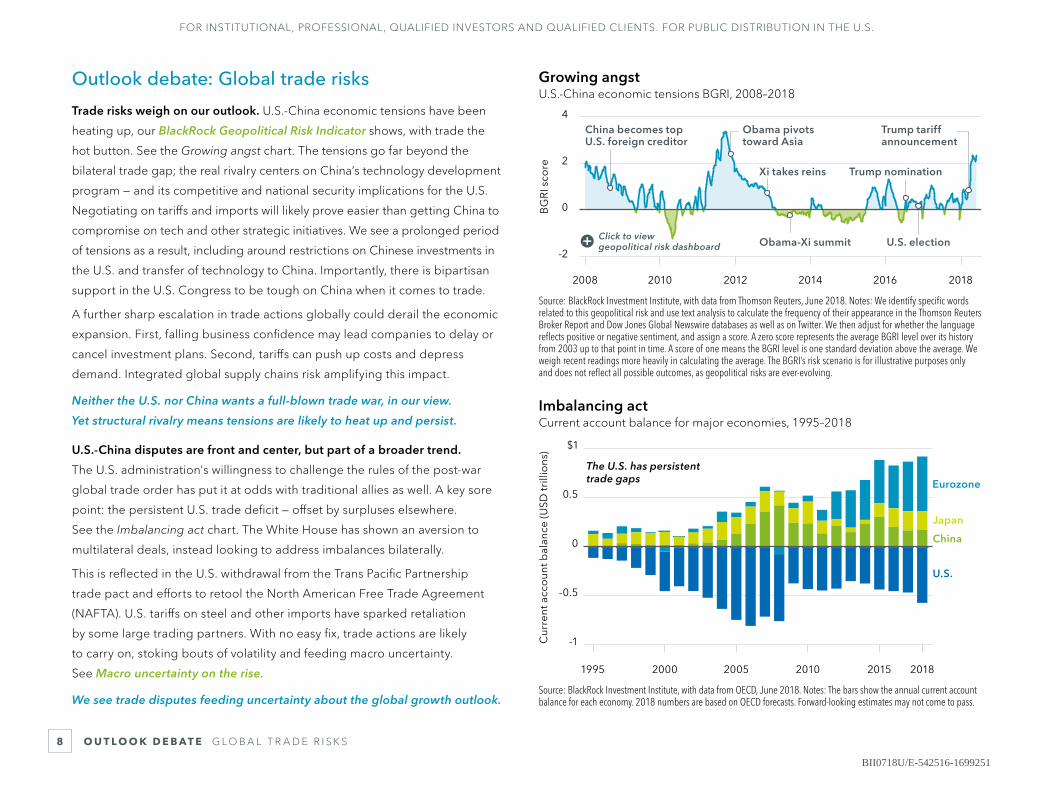
Growing angstU.S.-China economic tensions BGRI, 2008–2018
-2
0
2
4
201820162014201220102008
BG
RI s
core
China becomes top U.S. foreign creditor
Obama pivotstoward Asia
Xi takes reins Trump nomination
Trump tariffannouncement
Obama-Xi summit U.S. election
Source: BlackRock Investment Institute, with data from Thomson Reuters, June 2018. Notes: We identify specific words related to this geopolitical risk and use text analysis to calculate the frequency of their appearance in the Thomson Reuters Broker Report and Dow Jones Global Newswire databases as well as on Twitter. We then adjust for whether the language reflects positive or negative sentiment, and assign a score. A zero score represents the average BGRI level over its history from 2003 up to that point in time. A score of one means the BGRI level is one standard deviation above the average. We weigh recent readings more heavily in calculating the average. The BGRI’s risk scenario is for illustrative purposes only and does not reflect all possible outcomes, as geopolitical risks are ever-evolving.
Imbalancing actCurrent account balance for major economies, 1995–2018
The U.S. has persistent trade gaps
-1
-0.5
0
0.5
$1
2015 20182010200520001995
Eurozone
Japan
China
U.S.
Cur
ren
t acc
oun
t bal
ance
(USD
trill
ions
)
Source: BlackRock Investment Institute, with data from OECD, June 2018. Notes: The bars show the annual current account balance for each economy. 2018 numbers are based on OECD forecasts. Forward-looking estimates may not come to pass.
Click to view geopolitical risk dashboard
Outlook debate: Global trade risks
Trade risks weigh on our outlook. U.S.-China economic tensions have been
heating up, our BlackRock Geopolitical Risk Indicator shows, with trade the
hot button. See the Growing angst chart. The tensions go far beyond the
bilateral trade gap; the real rivalry centers on China’s technology development
program — and its competitive and national security implications for the U.S.
Negotiating on tariffs and imports will likely prove easier than getting China to
compromise on tech and other strategic initiatives. We see a prolonged period
of tensions as a result, including around restrictions on Chinese investments in
the U.S. and transfer of technology to China. Importantly, there is bipartisan
support in the U.S. Congress to be tough on China when it comes to trade.
A further sharp escalation in trade actions globally could derail the economic
expansion. First, falling business confidence may lead companies to delay or
cancel investment plans. Second, tariffs can push up costs and depress
demand. Integrated global supply chains risk amplifying this impact.
Neither the U.S. nor China wants a full-blown trade war, in our view.
Yet structural rivalry means tensions are likely to heat up and persist.
U.S.-China disputes are front and center, but part of a broader trend.
The U.S. administration's willingness to challenge the rules of the post-war
global trade order has put it at odds with traditional allies as well. A key sore
point: the persistent U.S. trade deficit — offset by surpluses elsewhere.
See the Imbalancing act chart. The White House has shown an aversion to
multilateral deals, instead looking to address imbalances bilaterally.
This is reflected in the U.S. withdrawal from the Trans Pacific Partnership
trade pact and efforts to retool the North American Free Trade Agreement
(NAFTA). U.S. tariffs on steel and other imports have sparked retaliation
by some large trading partners. With no easy fix, trade actions are likely
to carry on, stoking bouts of volatility and feeding macro uncertainty.
See Macro uncertainty on the rise.
We see trade disputes feeding uncertainty about the global growth outlook.
BII0718U/E-542516-1699251
FOR INSTITUTIONAL, PROFESSIONAL, QUALIFIED INVESTORS AND QUALIFIED CLIENTS. FOR PUBLIC DISTRIBUTION IN THE U.S.
O U T L O O K D E B AT E E U R O P E A N F R A G M E N TAT I O N9
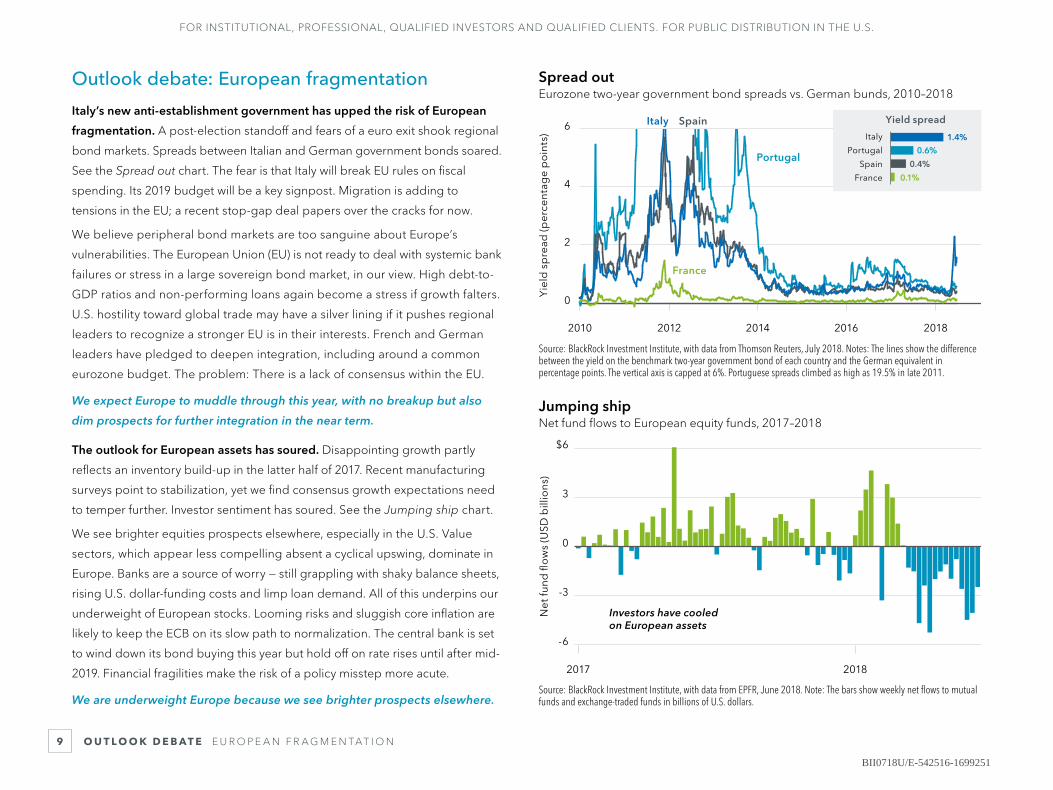
Jumping shipNet fund flows to European equity funds, 2017–2018
Investors have cooled on European assets
-6
-3
0
3
$6
20182017
Net
fund
flo
ws
(USD
bill
ions
)
Source: BlackRock Investment Institute, with data from EPFR, June 2018. Note: The bars show weekly net flows to mutual funds and exchange-traded funds in billions of U.S. dollars.
Spread outEurozone two-year government bond spreads vs. German bunds, 2010–2018
Portugal
SpainItaly
France
Yie
ld s
pre
ad (p
erce
nta
ge
po
ints
)
0
2
4
6
0.6%
0.4%
0.1%
1.4%
Yield spread
France
Spain
Portugal
Italy
20182016201420122010
Source: BlackRock Investment Institute, with data from Thomson Reuters, July 2018. Notes: The lines show the difference between the yield on the benchmark two-year government bond of each country and the German equivalent in percentage points. The vertical axis is capped at 6%. Portuguese spreads climbed as high as 19.5% in late 2011.
Outlook debate: European fragmentation
Italy’s new anti-establishment government has upped the risk of European
fragmentation. A post-election standoff and fears of a euro exit shook regional
bond markets. Spreads between Italian and German government bonds soared.
See the Spread out chart. The fear is that Italy will break EU rules on fiscal
spending. Its 2019 budget will be a key signpost. Migration is adding to
tensions in the EU; a recent stop-gap deal papers over the cracks for now.
We believe peripheral bond markets are too sanguine about Europe’s
vulnerabilities. The European Union (EU) is not ready to deal with systemic bank
failures or stress in a large sovereign bond market, in our view. High debt-to-
GDP ratios and non-performing loans again become a stress if growth falters.
U.S. hostility toward global trade may have a silver lining if it pushes regional
leaders to recognize a stronger EU is in their interests. French and German
leaders have pledged to deepen integration, including around a common
eurozone budget. The problem: There is a lack of consensus within the EU.
We expect Europe to muddle through this year, with no breakup but also
dim prospects for further integration in the near term.
The outlook for European assets has soured. Disappointing growth partly
reflects an inventory build-up in the latter half of 2017. Recent manufacturing
surveys point to stabilization, yet we find consensus growth expectations need
to temper further. Investor sentiment has soured. See the Jumping ship chart.
We see brighter equities prospects elsewhere, especially in the U.S. Value
sectors, which appear less compelling absent a cyclical upswing, dominate in
Europe. Banks are a source of worry — still grappling with shaky balance sheets,
rising U.S. dollar-funding costs and limp loan demand. All of this underpins our
underweight of European stocks. Looming risks and sluggish core inflation are
likely to keep the ECB on its slow path to normalization. The central bank is set
to wind down its bond buying this year but hold off on rate rises until after mid-
2019. Financial fragilities make the risk of a policy misstep more acute.
We are underweight Europe because we see brighter prospects elsewhere.
BII0718U/E-542516-1699251
FOR INSTITUTIONAL, PROFESSIONAL, QUALIFIED INVESTORS AND QUALIFIED CLIENTS. FOR PUBLIC DISTRIBUTION IN THE U.S.
O U T L O O K D E B AT E C H I N A’ S B A L A N C I N G A C T10
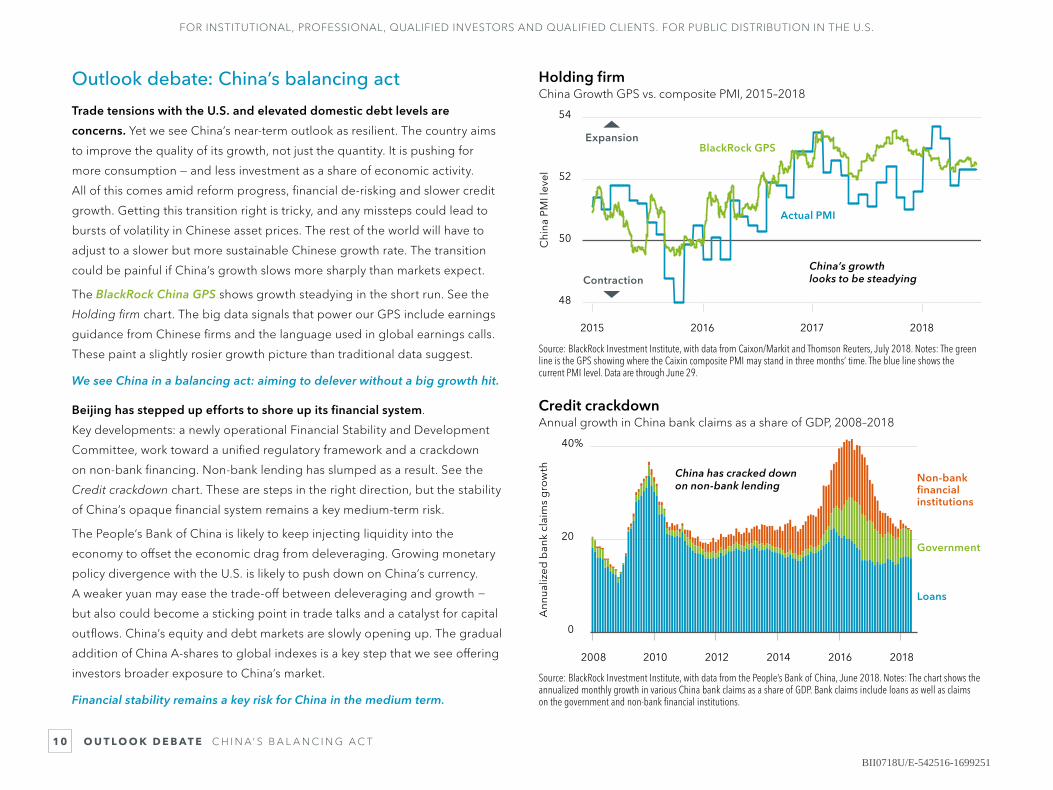
Holding firmChina Growth GPS vs. composite PMI, 2015–2018
China’s growth looks to be steadying
48
50
52
54
Actual PMI
BlackRock GPS
Chi
na P
MI l
evel
Expansion
Contraction
2018201720162015
Source: BlackRock Investment Institute, with data from Caixon/Markit and Thomson Reuters, July 2018. Notes: The green line is the GPS showing where the Caixin composite PMI may stand in three months’ time. The blue line shows the current PMI level. Data are through June 29.
Credit crackdownAnnual growth in China bank claims as a share of GDP, 2008–2018
China has cracked down on non-bank lending
0
20
40%
Non-bankfinancialinstitutions
Government
Loans
201820162014201220102008
Ann
ualiz
ed b
ank
clai
ms
gro
wth
Source: BlackRock Investment Institute, with data from the People’s Bank of China, June 2018. Notes: The chart shows the annualized monthly growth in various China bank claims as a share of GDP. Bank claims include loans as well as claims on the government and non-bank financial institutions.
Outlook debate: China’s balancing act
Trade tensions with the U.S. and elevated domestic debt levels are
concerns. Yet we see China’s near-term outlook as resilient. The country aims
to improve the quality of its growth, not just the quantity. It is pushing for
more consumption — and less investment as a share of economic activity.
All of this comes amid reform progress, financial de-risking and slower credit
growth. Getting this transition right is tricky, and any missteps could lead to
bursts of volatility in Chinese asset prices. The rest of the world will have to
adjust to a slower but more sustainable Chinese growth rate. The transition
could be painful if China’s growth slows more sharply than markets expect.
The BlackRock China GPS shows growth steadying in the short run. See the
Holding firm chart. The big data signals that power our GPS include earnings
guidance from Chinese firms and the language used in global earnings calls.
These paint a slightly rosier growth picture than traditional data suggest.
We see China in a balancing act: aiming to delever without a big growth hit.
Beijing has stepped up efforts to shore up its financial system.
Key developments: a newly operational Financial Stability and Development
Committee, work toward a unified regulatory framework and a crackdown
on non-bank financing. Non-bank lending has slumped as a result. See the
Credit crackdown chart. These are steps in the right direction, but the stability
of China’s opaque financial system remains a key medium-term risk.
The People’s Bank of China is likely to keep injecting liquidity into the
economy to offset the economic drag from deleveraging. Growing monetary
policy divergence with the U.S. is likely to push down on China’s currency.
A weaker yuan may ease the trade-off between deleveraging and growth −
but also could become a sticking point in trade talks and a catalyst for capital
outflows. China’s equity and debt markets are slowly opening up. The gradual
addition of China A-shares to global indexes is a key step that we see offering
investors broader exposure to China’s market.
Financial stability remains a key risk for China in the medium term.
BII0718U/E-542516-1699251
FOR INSTITUTIONAL, PROFESSIONAL, QUALIFIED INVESTORS AND QUALIFIED CLIENTS. FOR PUBLIC DISTRIBUTION IN THE U.S.
M A R K E T S F I X E D I N C O M E11
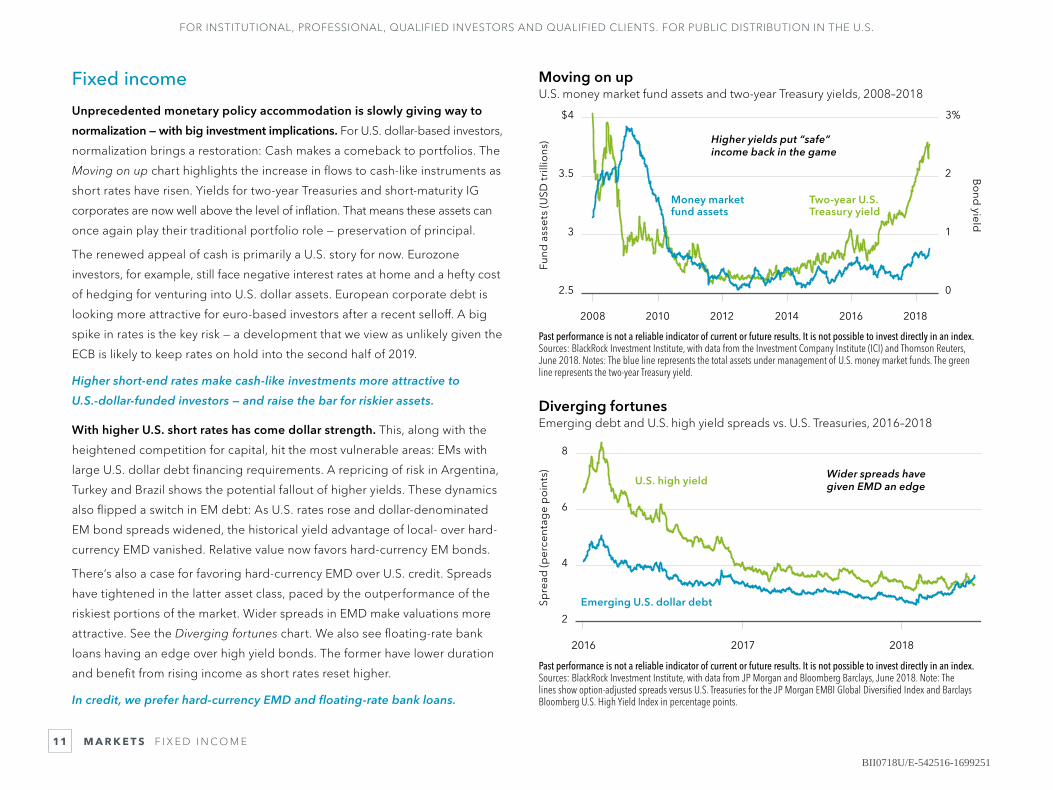
Moving on upU.S. money market fund assets and two-year Treasury yields, 2008–2018
Higher yields put “safe” income back in the game
0
1
2
3%
Two-year U.S.Treasury yield
201820162014201220102008
2.5
3
3.5
$4
Money marketfund assets
Fund
ass
ets
(USD
trill
ions
)
Bo
nd yield
Past performance is not a reliable indicator of current or future results. It is not possible to invest directly in an index. Sources: BlackRock Investment Institute, with data from the Investment Company Institute (ICI) and Thomson Reuters, June 2018. Notes: The blue line represents the total assets under management of U.S. money market funds. The green line represents the two-year Treasury yield.
Diverging fortunesEmerging debt and U.S. high yield spreads vs. U.S. Treasuries, 2016–2018
Wider spreads have given EMD an edge
2
4
6
8
U.S. high yield
Emerging U.S. dollar debtSpre
ad (p
erce
nta
ge
po
ints
)
201820172016
Past performance is not a reliable indicator of current or future results. It is not possible to invest directly in an index. Sources: BlackRock Investment Institute, with data from JP Morgan and Bloomberg Barclays, June 2018. Note: The lines show option-adjusted spreads versus U.S. Treasuries for the JP Morgan EMBI Global Diversified Index and Barclays Bloomberg U.S. High Yield Index in percentage points.
Fixed income
Unprecedented monetary policy accommodation is slowly giving way to
normalization — with big investment implications. For U.S. dollar-based investors,
normalization brings a restoration: Cash makes a comeback to portfolios. The
Moving on up chart highlights the increase in flows to cash-like instruments as
short rates have risen. Yields for two-year Treasuries and short-maturity IG
corporates are now well above the level of inflation. That means these assets can
once again play their traditional portfolio role — preservation of principal.
The renewed appeal of cash is primarily a U.S. story for now. Eurozone
investors, for example, still face negative interest rates at home and a hefty cost
of hedging for venturing into U.S. dollar assets. European corporate debt is
looking more attractive for euro-based investors after a recent selloff. A big
spike in rates is the key risk — a development that we view as unlikely given the
ECB is likely to keep rates on hold into the second half of 2019.
Higher short-end rates make cash-like investments more attractive to
U.S.-dollar-funded investors — and raise the bar for riskier assets.
With higher U.S. short rates has come dollar strength. This, along with the
heightened competition for capital, hit the most vulnerable areas: EMs with
large U.S. dollar debt financing requirements. A repricing of risk in Argentina,
Turkey and Brazil shows the potential fallout of higher yields. These dynamics
also flipped a switch in EM debt: As U.S. rates rose and dollar-denominated
EM bond spreads widened, the historical yield advantage of local- over hard-
currency EMD vanished. Relative value now favors hard-currency EM bonds.
There’s also a case for favoring hard-currency EMD over U.S. credit. Spreads
have tightened in the latter asset class, paced by the outperformance of the
riskiest portions of the market. Wider spreads in EMD make valuations more
attractive. See the Diverging fortunes chart. We also see floating-rate bank
loans having an edge over high yield bonds. The former have lower duration
and benefit from rising income as short rates reset higher.
In credit, we prefer hard-currency EMD and floating-rate bank loans.
BII0718U/E-542516-1699251

FOR INSTITUTIONAL, PROFESSIONAL, QUALIFIED INVESTORS AND QUALIFIED CLIENTS. FOR PUBLIC DISTRIBUTION IN THE U.S.
M A R K E T S E Q U I T I E S12
Spending upswingGlobal capex growth by sector, 1991–2018
Tech leads the business spending uptick
-40
0
40
80%
Other
Technology
Energy
20182015201120072003199919951991
Year
-ove
r-ye
ar c
apex
gro
wth
Source: BlackRock Investment Institute, with data from Thomson Reuters, June 2018. Note: The lines show the year-over-year growth in capital expenditures on a trailing 12-month basis for the energy and technology sectors within the MSCI All-Country World Index (ACWI) and for the ACWI excluding energy and technology.
Cash cushionRelative performance of cash-rich stocks and equity market volatility, 2013–2018
80
100
120
140
5
10
15
20%
Cash-rich versuscash-poor stocks
201820172016201520142013
Equity volatility
Rel
ativ
e p
erfo
rman
ce Equity vo
latility
Past performance is not a reliable indicator of current or future results. It is not possible to invest directly in an index. Source: BlackRock Investment Institute, with data from Bloomberg, June 2018. Notes: The green line shows the relative performance of cash-rich stocks versus cash-poor stocks in the Russell 1000 Index, rebased to 100 as of January 2013. It is calculated by dividing the performance of the stocks with the top decile of cash-to-assets ratios by the stocks with the bottom decile of the ratio. Volatility (blue line) is represented by a three-month rolling average of the CBOE Volatility Index (VIX).
Equities
Capex is picking up globally — with tech leading the charge. See the
Spending upswing chart. Years of policy uncertainty and low confidence kept
company purse strings tight. Their re-opening in an age of technology and
evolving consumer behaviors has much of the spending directed at intellectual
property and innovation — a boon for tech firms. The spending uptick could
spill into 2019 as companies adjust to new U.S. tax laws — provided trade
tensions do not pinch confidence. We see some notes of caution rearing.
The story is not U.S.-only. High capacity utilization rates and aging assets in
Europe point to room for spending. In China, investment in strategic initiatives
is set to accelerate even as it declines in heavy industries. History shows big
spending can eat into stock returns. Yet spending discipline among many
companies gives us confidence that profit margins and earnings could be well
insulated. Read more in Capex: The good, the bad and the murky.
Unmatched earnings growth and spending discipline underscore our
preference for U.S. over other developed market equities.
Where do equity investors look for resilience today? High-yielding
“bond proxy” stocks earned their stripes as defensive picks for much of the
past decade as bond yields were slow to revert back to pre-crisis levels.
But upward rate and inflation momentum challenges the prevailing thinking,
as we discuss in Building the right defense in equities. A good defense today
requires stocks with the potential to weather volatility and outrun inflation.
To us, this means a focus on quality and dividend growth. “Quality”
companies, by our definition, are able to generate and grow free cash flow
while maintaining healthy balance sheets. Companies able — and willing —
to increase dividends appear better poised to withstand volatility. See the
Cash cushion chart. We see a tougher go for highly bid “stable” dividend
stocks as higher U.S. rates make “risk-free” bonds bigger competition.
We favor an allocation to quality companies that can increase dividends
while maintaining healthy balance sheets.
BII0718U/E-542516-1699251

FOR INSTITUTIONAL, PROFESSIONAL, QUALIFIED INVESTORS AND QUALIFIED CLIENTS. FOR PUBLIC DISTRIBUTION IN THE U.S.
M A R K E T S C O M M O D I T I E S A N D C U R R E N C I E S13
Sizing up supply and demandGlobal oil net supply, 2014–2018
-2
-1
0
1
2
20182017201620152014
Upper end
Lower end
Sup
ply
(m
illio
ns o
f bar
rels
)
A global supply deficit supports oil prices
Source: BlackRock Investment Institute, with data from the International Energy Agency, June 2018. Notes: The chart shows the quarterly balance between global oil supply and demand. The solid line represents historical data, and the dotted lines the upper and lower ends of an estimated range for the second half of 2018. We assume an OPEC output increase of 1 million barrels a day (mb/d) and the growth in non-OPEC nations' oil supply and demand at levels consistent with the average of the second halves of the past four years. The “upper end” scenario assumes production losses of 0.5 mb/d in Venezuela, 0.3 mb/d in Iran, 0.2 mb/d each in Libya and West Africa. The “lower end” scenario assumes production losses of 0.5 mb/d in Venezuela, 0.6 mb/d in Iran, 0.4 mb/d each in Libya and West Africa. These assumptions are based on BlackRock’s market analysis.
Dented by the dollarU.S. dollar and EM asset performance, 2018
Ind
ex le
vel
EM equities
EM local debt
USD
JuneMayAprilMarchFeb.Jan.
90
95
100
105
Past performance is not a reliable indicator of current or future results. It is not possible to invest directly in an index. Source: BlackRock Investment Institute, with data from Thomson Reuters Datastream, June 2018. Notes: The U.S. dollar is represented by the DXY U.S. dollar index. EM local debt represents the total return performance of the JP Morgan GBI-EM Global Diversified Composite Unhedged USD Index. EM equities represents the performance of the MSCI EM Index relative to that of the MSCI ACWI Index, excluding dividends. The data are rebased to 100 at the start of 2018.
Commodities and currencies
Oil prices have been on a tear − and we see them well supported in the
second half. A rise in Middle East-related geopolitical risks, along with
favorable supply-demand dynamics, has been driving the gains. We see a
recent decision by the Organization of Petroleum Exporting Countries (OPEC)
to ease oil output restrictions doing little to knock oil off its solid footing.
The most likely scenario, in our view: Production losses from key OPEC
members, potential U.S. supply outages and strong global appetite keep
demand ahead of supply into year-end − supporting prices. We expect this
even in an “upper-end” scenario where supply disruptions ease. See the blue
line in the Sizing up supply and demand chart. Yet we see oil-related equities
as the shinier proposition. Share prices of energy companies have lagged the
run-up in oil itself. It’s been a tougher slog for other commodities. Industrial
metals began to trail off along with softer economic data earlier in the year.
We keep a favorable view given our outlook for sustained global growth.
Oil prices look well supported, but we see greater opportunities in
oil-related stocks that have yet to catch up to the rise in spot prices.
U.S. dollar strength is tightening global financial conditions — with implications
for EM assets in particular. The performance of EM equities and local-currency
debt has flagged since the dollar’s April turnaround. See the Dented by the dollar
chart. With both oil and the U.S. dollar climbing of late — an atypical scenario
— oil-importing countries in EM and beyond are dealt a double whammy.
The U.S. dollar is aided by attractive interest rate and growth differentials
versus other economies. Higher short-end U.S. rates also make the greenback
appealing just as geopolitical uncertainty has investors more willing to dial
back risk and sit tight in cash. Our fair value metrics suggest the U.S. currency
is looking expensive, limiting its upside. But we see the U.S. dollar catching a
bid in any global risk-off episode sparked by risks such as a global trade war.
The U.S. dollar has support in higher global uncertainty and a widening
yield differential versus other economies. But we see its rise capped.
BII0718U/E-542516-1699251
FOR INSTITUTIONAL, PROFESSIONAL, QUALIFIED INVESTORS AND QUALIFIED CLIENTS. FOR PUBLIC DISTRIBUTION IN THE U.S.
M A R K E T S T H E M AT I C I N V E S T I N G14
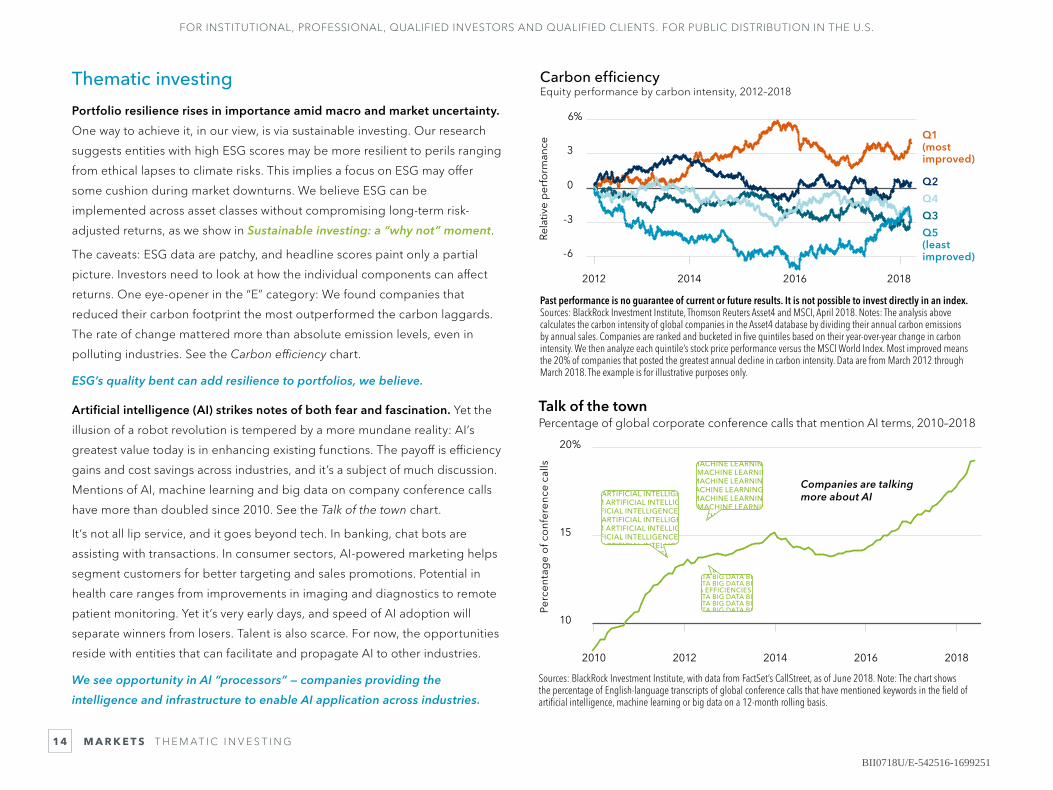
Talk of the townPercentage of global corporate conference calls that mention AI terms, 2010–2018
Companies are talking more about AI
Perc
enta
ge
of c
onf
eren
ce c
alls
10
15
20%
20182016201420122010
MACHINE LEARNING M MACHINE LEARNING
MACHINE LEARNING MACHINE LEARNING M
MACHINE LEARNING M MACHINE LEARNING
MACHINE LEARNING MACHINE LEARNING M
MACHINE LEARNING M MACHINE LEARNING
MACHINE LEARNING MACHINE LEARNING M
MACHINE LEARNING M MACHINE LEARNING
BIG DATA BIG DATA BIG DATA BIG DATA BIG DATA BIG DATA BIG DATA BIG DATA BIG DATA BIG DATA BIG DATA BIG DATA
TA EFFICIENCIES TABIG DATA BIG DATA BIG DATA BIG DATA BIG DATA BIG DATABIG DATA BIG DATA BIG DATA BIG DATA BIG DATA BIG DATABIG DATA BIG DATA BIG DATA BIG DATA BIG DATA BIG DATABIG DATA BIG DATA BIG DATA BIG DATA BIG DATA BIG DATA
ARTIFICIAL INTELLIGENCEM ARTIFICIAL INTELLIGENCEARTIFICIAL INTELLIGENCE M
ARTIFICIAL INTELLIGENCEM ARTIFICIAL INTELLIGENCEARTIFICIAL INTELLIGENCE M
ARTIFICIAL INTELLIGENCEM ARTIFICIAL INTELLIGENCEIFICIAL INTELLIGENCE MMM
ARTIFICIAL INTELLIGENCEM ARTIFICIAL INTELLIGENCEIFICIAL INTELLIGENCE MMM
ARTIFICIAL INTELLIGENCEM ARTIFICIAL INTELLIGENCEARTIFICIAL INTELLIGENCE M
ARTIFICIAL INTELLIGENCEM ARTIFICIAL INTELLIGENCEARTIFICIAL INTELLIGENCE M
Sources: BlackRock Investment Institute, with data from FactSet’s CallStreet, as of June 2018. Note: The chart shows the percentage of English-language transcripts of global conference calls that have mentioned keywords in the field of artificial intelligence, machine learning or big data on a 12-month rolling basis.
Carbon efficiencyEquity performance by carbon intensity, 2012–2018
-6
-3
0
3
6%
Q1 (most improved)
Q2
Q3
Q4
Q5 (least improved)
Rela
tive
per
form
ance
2018201620142012
Past performance is no guarantee of current or future results. It is not possible to invest directly in an index. Sources: BlackRock Investment Institute, Thomson Reuters Asset4 and MSCI, April 2018. Notes: The analysis above calculates the carbon intensity of global companies in the Asset4 database by dividing their annual carbon emissions by annual sales. Companies are ranked and bucketed in five quintiles based on their year-over-year change in carbon intensity. We then analyze each quintile’s stock price performance versus the MSCI World Index. Most improved means the 20% of companies that posted the greatest annual decline in carbon intensity. Data are from March 2012 through March 2018. The example is for illustrative purposes only.
Thematic investing
Portfolio resilience rises in importance amid macro and market uncertainty.
One way to achieve it, in our view, is via sustainable investing. Our research
suggests entities with high ESG scores may be more resilient to perils ranging
from ethical lapses to climate risks. This implies a focus on ESG may offer
some cushion during market downturns. We believe ESG can be
implemented across asset classes without compromising long-term risk-
adjusted returns, as we show in Sustainable investing: a “why not” moment.
The caveats: ESG data are patchy, and headline scores paint only a partial
picture. Investors need to look at how the individual components can affect
returns. One eye-opener in the “E” category: We found companies that
reduced their carbon footprint the most outperformed the carbon laggards.
The rate of change mattered more than absolute emission levels, even in
polluting industries. See the Carbon efficiency chart.
ESG’s quality bent can add resilience to portfolios, we believe.
Artificial intelligence (AI) strikes notes of both fear and fascination. Yet the
illusion of a robot revolution is tempered by a more mundane reality: AI’s
greatest value today is in enhancing existing functions. The payoff is efficiency
gains and cost savings across industries, and it’s a subject of much discussion.
Mentions of AI, machine learning and big data on company conference calls
have more than doubled since 2010. See the Talk of the town chart.
It’s not all lip service, and it goes beyond tech. In banking, chat bots are
assisting with transactions. In consumer sectors, AI-powered marketing helps
segment customers for better targeting and sales promotions. Potential in
health care ranges from improvements in imaging and diagnostics to remote
patient monitoring. Yet it’s very early days, and speed of AI adoption will
separate winners from losers. Talent is also scarce. For now, the opportunities
reside with entities that can facilitate and propagate AI to other industries.
We see opportunity in AI “processors” — companies providing the
intelligence and infrastructure to enable AI application across industries.
BII0718U/E-542516-1699251
FOR INSTITUTIONAL, PROFESSIONAL, QUALIFIED INVESTORS AND QUALIFIED CLIENTS. FOR PUBLIC DISTRIBUTION IN THE U.S.
M A R K E T S A S S E T S I N B R I E F15
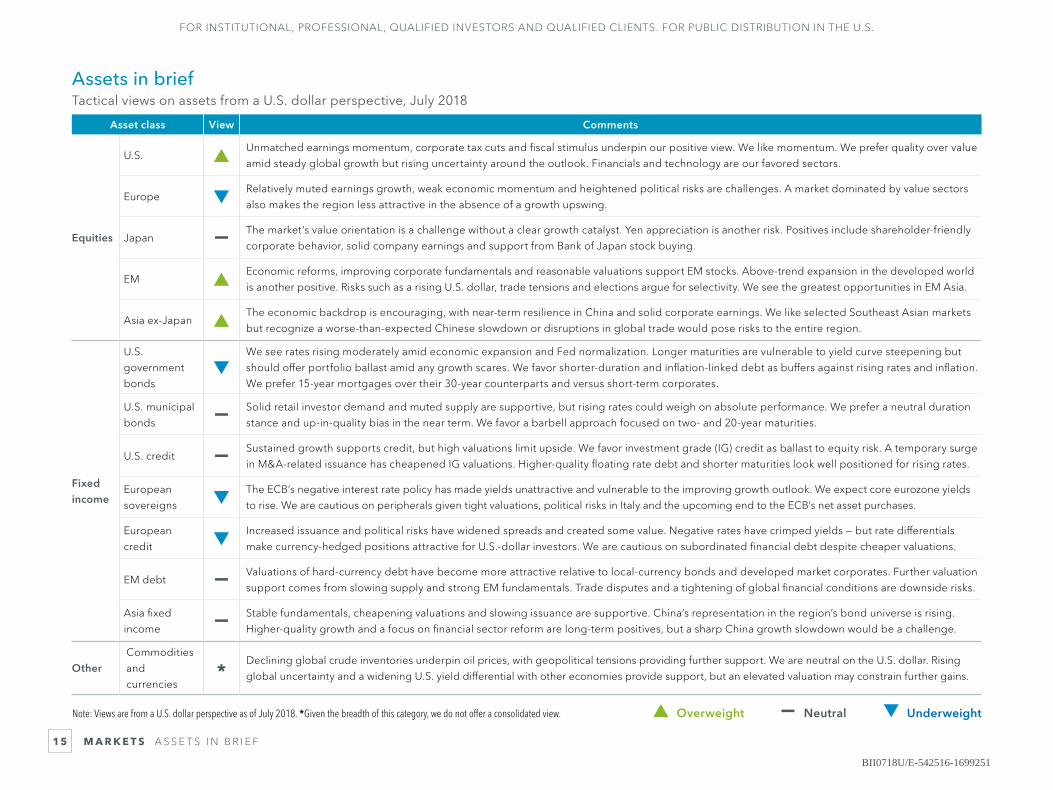
Assets in briefTactical views on assets from a U.S. dollar perspective, July 2018
▲ Overweight — Neutral ▼ Underweight
Asset class View Comments
Equities
U.S. ▲Unmatched earnings momentum, corporate tax cuts and fiscal stimulus underpin our positive view. We like momentum. We prefer quality over value
amid steady global growth but rising uncertainty around the outlook. Financials and technology are our favored sectors.
Europe ▼Relatively muted earnings growth, weak economic momentum and heightened political risks are challenges. A market dominated by value sectors
also makes the region less attractive in the absence of a growth upswing.
Japan — The market’s value orientation is a challenge without a clear growth catalyst. Yen appreciation is another risk. Positives include shareholder-friendly
corporate behavior, solid company earnings and support from Bank of Japan stock buying.
EM ▲Economic reforms, improving corporate fundamentals and reasonable valuations support EM stocks. Above-trend expansion in the developed world
is another positive. Risks such as a rising U.S. dollar, trade tensions and elections argue for selectivity. We see the greatest opportunities in EM Asia.
Asia ex-Japan ▲The economic backdrop is encouraging, with near-term resilience in China and solid corporate earnings. We like selected Southeast Asian markets
but recognize a worse-than-expected Chinese slowdown or disruptions in global trade would pose risks to the entire region.
Fixed income
U.S.
government
bonds▼
We see rates rising moderately amid economic expansion and Fed normalization. Longer maturities are vulnerable to yield curve steepening but
should offer portfolio ballast amid any growth scares. We favor shorter-duration and inflation-linked debt as buffers against rising rates and inflation.
We prefer 15-year mortgages over their 30-year counterparts and versus short-term corporates.
U.S. municipal
bonds — Solid retail investor demand and muted supply are supportive, but rising rates could weigh on absolute performance. We prefer a neutral duration
stance and up-in-quality bias in the near term. We favor a barbell approach focused on two- and 20-year maturities.
U.S. credit — Sustained growth supports credit, but high valuations limit upside. We favor investment grade (IG) credit as ballast to equity risk. A temporary surge
in M&A-related issuance has cheapened IG valuations. Higher-quality floating rate debt and shorter maturities look well positioned for rising rates.
European
sovereigns ▼The ECB’s negative interest rate policy has made yields unattractive and vulnerable to the improving growth outlook. We expect core eurozone yields
to rise. We are cautious on peripherals given tight valuations, political risks in Italy and the upcoming end to the ECB’s net asset purchases.
European
credit ▼Increased issuance and political risks have widened spreads and created some value. Negative rates have crimped yields — but rate differentials
make currency-hedged positions attractive for U.S.-dollar investors. We are cautious on subordinated financial debt despite cheaper valuations.
EM debt — Valuations of hard-currency debt have become more attractive relative to local-currency bonds and developed market corporates. Further valuation
support comes from slowing supply and strong EM fundamentals. Trade disputes and a tightening of global financial conditions are downside risks.
Asia fixed
income — Stable fundamentals, cheapening valuations and slowing issuance are supportive. China’s representation in the region’s bond universe is rising.
Higher-quality growth and a focus on financial sector reform are long-term positives, but a sharp China growth slowdown would be a challenge.
OtherCommodities
and
currencies*
Declining global crude inventories underpin oil prices, with geopolitical tensions providing further support. We are neutral on the U.S. dollar. Rising
global uncertainty and a widening U.S. yield differential with other economies provide support, but an elevated valuation may constrain further gains.
Note: Views are from a U.S. dollar perspective as of July 2018. *Given the breadth of this category, we do not offer a consolidated view.
BII0718U/E-542516-1699251

General disclosure: This material is prepared by BlackRock and is not intended to be relied upon as a forecast, research or investment advice, and is not a recommendation, offer or solicitation to buy or sell any securities or to adopt any investment strategy. The opinions expressed are as of July 2018 and may change as subsequent conditions vary. The information and opinions contained in this material are derived from proprietary and nonproprietary sources deemed by BlackRock to be reliable, are not necessarily all-inclusive and are not guaranteed as to accuracy. As such, no warranty of accuracy or reliability is given and no responsibility arising in any other way for errors and omissions (including responsibility to any person by reason of negligence) is accepted by BlackRock, its officers, employees or agents. This material may contain ‘forward-looking’ information that is not purely historical in nature. Such information may include, among other things, projections and forecasts. There is no guarantee that any forecasts made will come to pass. Reliance upon information in this material is at the sole discretion of the reader. Index data cited herein are from Thomson Reuters, unless otherwise noted.
In the U.S., this material is for public distribution. In the EU, issued by BlackRock Investment Management (UK) Limited (authorised and regulated by the Financial Conduct Authority). Registered office: 12 Throgmorton Avenue, London, EC2N 2DL. Registered in England No. 2020394. Tel: 020 7743 3000. For your protection, telephone calls are usually recorded. BlackRock is a trading name of BlackRock Investment Management (UK) Limited. This material is for distribution to Professional Clients (as defined by the FCA Rules) and Qualified Investors and should not be relied upon by any other persons. For qualified investors in Switzerland, this material shall be exclusively made available to, and directed at, qualified investors as defined in the Swiss Collective Investment Schemes Act of 23 June 2006, as amended. Issued in the Netherlands by the Amsterdam branch office of BlackRock Investment Management (UK) Limited: Amstelplein 1, 1096 HA Amsterdam, Tel: 020 - 549 5200. In South Africa, please be advised that BlackRock Investment Management (UK) Limited is an authorized Financial Services provider with the South African Financial Services Board, FSP No. 43288. In Dubai: This information can be distributed in and from the Dubai International Financial Centre (DIFC) by BlackRock Advisors (UK) Limited — Dubai Branch which is regulated by the Dubai Financial Services Authority (DFSA) and is only directed at 'Professional Clients’ and no other person should rely upon the information contained within it. Neither the DFSA or any other authority or regulator located in the GCC or MENA region has approved this information. This information and associated materials have been provided for your exclusive use. This document is not intended for distribution to, or use by, any person or entity in any jurisdiction or country where such distribution would be unlawful under the securities laws of such. Any distribution, by whatever means, of this document and related material to persons other than those referred to above is strictly prohibited. For investors in Israel: BlackRock Investment Management (UK) Limited is not licensed under Israel's Regulation of Investment Advice, Investment Marketing and Portfolio Management Law, 5755-1995 (the “Advice Law”), nor does it carry insurance thereunder. In Singapore, this is issued by BlackRock (Singapore) Limited (Co. registration no. 200010143N). In Hong Kong, this material is issued by BlackRock Asset Management North Asia Limited and has not been reviewed by the Securities and Futures Commission of Hong Kong. In Korea, this material is for Professional Investors only. In Taiwan, independently operated by BlackRock Investment Management (Taiwan) Limited. Address: 28/F, No. 95, Tun Hwa South Road, Section 2, Taipei 106, Taiwan. Tel: (02)23261600. In Japan, this is issued by BlackRock Japan. Co., Ltd. (Financial Instruments Business Operator: The Kanto Regional Financial Bureau. License No375, Association Memberships: Japan Investment Advisers Association, the Investment Trusts Association, Japan, Japan Securities Dealers Association, Type II Financial Instruments Firms Association.) For Professional Investors only (Professional Investor is defined in Financial Instruments and Exchange Act) and for information or educational purposes only, and does not constitute investment advice or an offer or solicitation to purchase or sells in any securities or any investment strategies. In Australia, issued by BlackRock Investment Management (Australia) Limited ABN 13 006 165 975, AFSL 230 523 (BIMAL). This material is not a securities recommendation or an offer or solicitation with respect to the purchase or sale of any securities in any jurisdiction. The material provides general information only and does not take into account your individual objectives, financial situation, needs or circumstances. BIMAL, its officers, employees and agents believe that the information in this material and the sources on which it is based (which may be sourced from third parties) are correct as at the date of publication. While every care has been taken in the preparation of this material, no warranty of accuracy or reliability is given and no responsibility for the information is accepted by BIMAL, its officers, employees or agents. No guarantee as to the repayment of capital or the performance of any product or rate of return referred to in this material is made by BIMAL or any entity in the BlackRock group of companies. In China, this material may not be distributed to individuals resident in the People's Republic of China (PRC) for such purposes, excluding Hong Kong, Macau and Taiwan) or entities registered in the PRC unless such parties have received all the required PRC government approvals to participate in any investment or receive any investment advisory or investment management services. For other APAC countries, this material is issued for Institutional Investors only (or professional/sophisticated/qualified investors, as such term may apply in local jurisdictions) and does not constitute investment advice or an offer or solicitation to purchase or sell in any securities, BlackRock funds or any investment strategy nor shall any securities be offered or sold to any person in any jurisdiction in which an offer, solicitation, purchase or sale would be unlawful under the securities laws of such jurisdiction. In Canada, this material is intended for permitted clients only. In Latin America and Iberia, this material is for educational purposes only and does not constitute investment advice nor an offer or solicitation to sell or a solicitation of an offer to buy any shares of any fund (nor shall any such shares be offered or sold to any person) in any jurisdiction in which an offer, solicitation, purchase or sale would be unlawful under the securities law of that jurisdiction. If any funds are mentioned or inferred to in this material, it is possible that some or all of the funds have not been registered with the securities regulators of Argentina, Brazil, Chile, Colombia, Mexico, Panama, Peru, Portugal, Spain, Uruguay or any other securities regulator in any Latin American country and thus might not be publicly offered within any such country. The securities regulators of such countries have not confirmed the accuracy of any information contained herein. The information provided here is neither tax nor legal advice. Investors should speak to their tax professional for specific information regarding their tax situation. Investment involves risk including possible loss of principal. International investing involves risks, including risks related to foreign currency, limited liquidity, less government regulation, and the possibility of substantial volatility due to adverse political, economic or other developments. These risks are often heightened for investments in emerging/developing markets or smaller capital markets.
©2018 BlackRock, Inc. All Rights Reserved. BLACKROCK is a registered trademark of BlackRock, Inc. All other trademarks are those of their respective owners.
Lit. No. BII-MID-OUTLOOK-2018 117580-0718
The BlackRock Investment Institute (BII) provides connectivity between BlackRock’s portfolio managers,
originates market research and publishes insights. Our goals are to help our fund managers become
better investors and to produce thought-provoking content for clients and policymakers.
BII0718U/E-542516-1699251