
Global inventory of methane clathrate: sensitivity to ...archer/reprints/buffett.2004.clath... ·...
15
Global inventory of methane clathrate: sensitivity to changes in the deep ocean Bruce Buffett * , David Archer 1 Department of Geophysical Sciences, The University of Chicago, Chicago, IL 60637, USA Received 14 April 2004; received in revised form 10 August 2004; accepted 1 September 2004 Available online 8 October 2004 Editor: E. Bard Abstract We present a mechanistic model for the distribution of methane clathrate in marine sediments, and use it to predict the sensitivity of the steady-state methane inventory to changes in the deep ocean. The methane inventory is determined by binning the seafloor area according to water depth, temperature, and O 2 concentration. Organic carbon rain to the seafloor is treated as a simple function of water depth, and carbon burial for each bin is estimated using a sediment diagenesis model called Muds [Glob. Biogeochem. Cycles 16 (2002)]. The predicted concentration of organic carbon is fed into a clathrate model [J. Geophys. Res. 108 (2003)] to calculate steady-state profiles of dissolved, frozen, and gaseous methane. We estimate the amount of methane in ocean sediments by multiplying the sediment column inventories by the corresponding binned seafloor areas. Our estimate of the methane inventory is sensitive to the efficiency of methane production from organic matter and to the rate of fluid flow within the sediment column. Preferred values for these parameters are taken from previous studies of both passive and active margins, yielding a global estimate of 310 18 g of carbon (3000 Gton C) in clathrate and 210 18 g (2000 Gton C) in methane bubbles. The predicted methane inventory decreases by 85% in response to 3 8C of warming. Conversely, the methane inventory increases by a factor of 2 if the O 2 concentration of the deep ocean decreases by 40 AM or carbon rain increases by 50% (due to an increase in primary production). Changes in sea level have a small effect. We use these sensitivities to assess the past and future state of the methane clathrate reservoir. D 2004 Elsevier B.V. All rights reserved. Keywords: gas hydrates; carbon cycle; global change; early diagenesis 1. Introduction Large amounts of methane are sequestered in marine sediments by an icy solid called methane clathrate (or methane hydrate). Estimates of the global inventory of methane clathrate may exceed 10 19 g of carbon [3–5], which is comparable to estimates of potentially 0012-821X/$ - see front matter D 2004 Elsevier B.V. All rights reserved. doi:10.1016/j.epsl.2004.09.005 * Corresponding author. Tel.: +1 773 702 8107; fax: +1 773 702 9505. E-mail addresses: [email protected] (B. Buffett)8 [email protected] (D. Archer). 1 Tel.: +1 773 702 0823; fax: +1 773 702 9505. Earth and Planetary Science Letters 227 (2004) 185 – 199 www.elsevier.com/locate/epsl
Transcript of Global inventory of methane clathrate: sensitivity to ...archer/reprints/buffett.2004.clath... ·...
www.elsevier.com/locate/epsl
Earth and Planetary Science Le
Global inventory of methane clathrate: sensitivity to changes
in the deep ocean
Bruce Buffett*, David Archer1
Department of Geophysical Sciences, The University of Chicago, Chicago, IL 60637, USA
Received 14 April 2004; received in revised form 10 August 2004; accepted 1 September 2004
Available online 8 October 2004
Editor: E. Bard
Abstract
We present a mechanistic model for the distribution of methane clathrate in marine sediments, and use it to predict the
sensitivity of the steady-state methane inventory to changes in the deep ocean. Themethane inventory is determined by binning the
seafloor area according to water depth, temperature, and O2 concentration. Organic carbon rain to the seafloor is treated as a simple
function of water depth, and carbon burial for each bin is estimated using a sediment diagenesis model called Muds [Glob.
Biogeochem. Cycles 16 (2002)]. The predicted concentration of organic carbon is fed into a clathrate model [J. Geophys. Res. 108
(2003)] to calculate steady-state profiles of dissolved, frozen, and gaseous methane. We estimate the amount of methane in ocean
sediments by multiplying the sediment column inventories by the corresponding binned seafloor areas. Our estimate of the
methane inventory is sensitive to the efficiency of methane production from organic matter and to the rate of fluid flow within the
sediment column. Preferred values for these parameters are taken from previous studies of both passive and active margins,
yielding a global estimate of 3�1018 g of carbon (3000 Gton C) in clathrate and 2�1018 g (2000 Gton C) in methane bubbles. The
predicted methane inventory decreases by 85% in response to 3 8C of warming. Conversely, the methane inventory increases by a
factor of 2 if the O2 concentration of the deep ocean decreases by 40 AM or carbon rain increases by 50% (due to an increase in
primary production). Changes in sea level have a small effect. We use these sensitivities to assess the past and future state of the
methane clathrate reservoir.
D 2004 Elsevier B.V. All rights reserved.
Keywords: gas hydrates; carbon cycle; global change; early diagenesis
0012-821X/$ - see front matter D 2004 Elsevier B.V. All rights reserved.
doi:10.1016/j.epsl.2004.09.005
* Corresponding author. Tel.: +1 773 702 8107; fax: +1 773
702 9505.
E-mail addresses: [email protected] (B. Buffett)8
[email protected] (D. Archer).1 Tel.: +1 773 702 0823; fax: +1 773 702 9505.
1. Introduction
Large amounts of methane are sequestered inmarine
sediments by an icy solid called methane clathrate (or
methane hydrate). Estimates of the global inventory of
methane clathrate may exceed 1019 g of carbon [3–5],
which is comparable to estimates of potentially
tters 227 (2004) 185–199
B. Buffett, D. Archer / Earth and Planetary Science Letters 227 (2004) 185–199186
recoverable coal, oil, and natural gas [6]. The proximity
of this methane reservoir to the seafloor has motivated
speculations about a release of methane in response to
climate change [7,8]. Increases in temperature or
decreases in pressure (through changes in sea level)
tend to dissociate clathrate, releasing methane into the
near-surface environment. Release of methane from
clathrate has been invoked to explain abrupt increases
in the atmospheric concentration of methane during the
last glacial cycle [9]. A more catastrophic release of
methane from clathrate has been proposed [10] to
explain an isotopic excursion and a mass extinction of
benthic foraminifera at the end of the Paleocene
[11,12]. Terrestrial and oceanic values of d13Cdecreased by 2–3x [13], consistent with a release of
1–2�1018 g of methane carbon from clathrate [14,15].
A nearly simultaneous change in d18O in the deep
ocean indicates a temperature increase of 4–6 8C. Theinitial excursions in d18O and d13C occurred in less
than 104 years, whereas the recovery lasted 105 years
[16], comparable to the time required for silicate
weathering to restore the atmospheric concentration
of carbon dioxide [17].
Two issues are important for assessing the role of
methane clathrate in the carbon cycle. First, the
clathrate reservoir must be large enough to influence
the carbon cycle. This appears to be the case at
present, but greater uncertainty exists during the
Paleocene when warmer ocean temperatures reduce
the region of clathrate stability [18]. Second, we need
to know how the clathrate inventory responds to
changes in the deep ocean. The time scale for this
response is important because slow, diffusive loss of
methane probably results in oxidation by sulfate and
precipitation to CaCO3 within the sediments [19],
with negligible effect on climate. A faster response
allows methane oxidation within the ocean, which
increases the concentration of CO2 in the atmosphere.
Support for a rapid release of methane at the end of
the Paleocene is inferred from the abrupt excursion in
terrestrial and oceanic values of d13C. Such rapid
release can occur through slumping of continental
slopes [20] or by pervasive flow along fractures due to
overpressured gas below the seafloor [21]. These
mechanisms may permit methane to enter the ocean or
atmosphere directly. The onset of catastrophic meth-
ane release is probably dependent on the abundance
and spatial distribution of clathrate and methane
bubbles in the sediments prior to failure. Because
the spatial distribution of methane also determines the
global inventory, the size and response of the clathrate
reservoir are interconnected.
Current estimates of the global inventory of
methane clathrate have been inferred from empirical
correlations, often based on observations at a few
well-studied sites. Kvenvolden [3] estimated the
amount of methane clathrate in marine sediments by
determining the area of the ocean in which sediments
accumulate with an organic content in excess of 1%
(dry weight). The abundance of clathrate per square
meter was based on the assumption that clathrate
occupies 10% of the pore volume in the sediments and
that the average thickness of the stability zone was
400 m. Combining these estimates yields an inventory
of 2.1�1019 g of methane carbon (denoted g C).
Different choices for the required organic content
[4,22] or the volume fraction of clathrate [4,5,23]
yield substantially different estimates for the inven-
tory. Uncertainties inevitably arise when observations
from a few locations are extrapolated over the entire
ocean (see [24] for a review). For example, variations
in oxygen concentration in the deep ocean can
strongly affect the preservation of carbon in sediment.
The resulting volume fraction of clathrate can vary
with sedimentation rate, seafloor temperature, and the
efficiency of microbial conversion of organic carbon
to methane [25]. Our approach to this problem is to
use available observations to constrain the mecha-
nisms responsible for clathrate formation. A quantita-
tive model (described in Section 3) is then be used as
the basis for extrapolation.
2. Areal extent and local abundance of methane
clathrate
Methane clathrate is confined to the top few hundred
meters of marine sediment. The zone of stability is
specified using the phase diagram for methane and
water (see Fig. 1). Clathrate is stable when the
temperature is at or below the value T3(P) for three-
phase equilibrium between clathrate, liquid water, and
methane gas. Experimental determinations of T3(P) are
shown in Fig. 1 as a function of depth, assuming a
hydrostatic increase in pressure. Superimposed on this
figure is a schematic illustration of the temperature
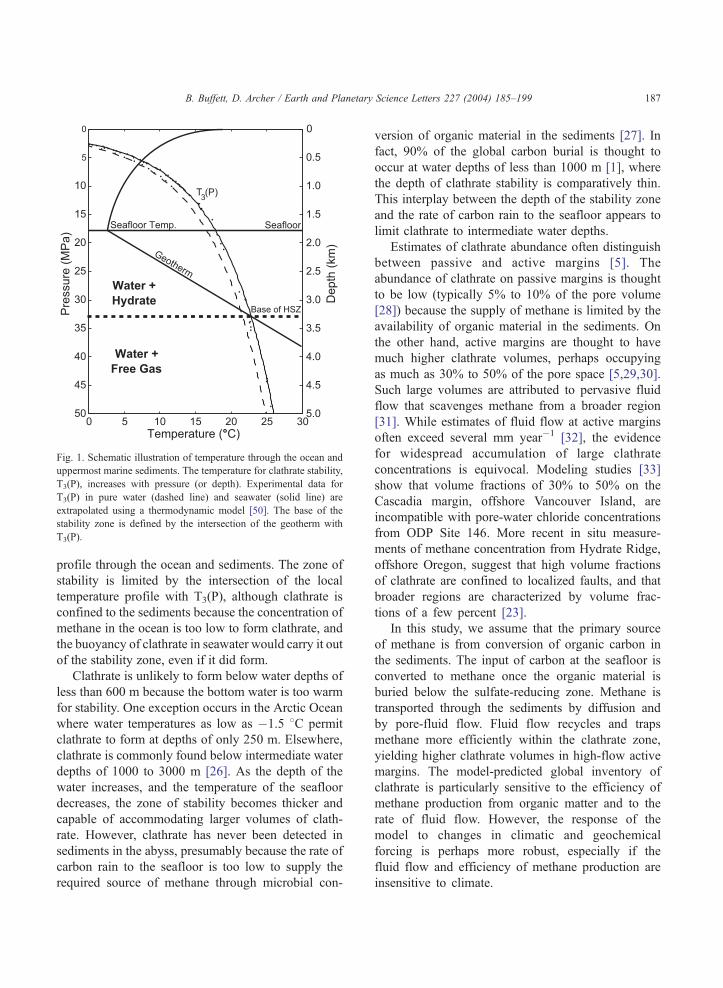
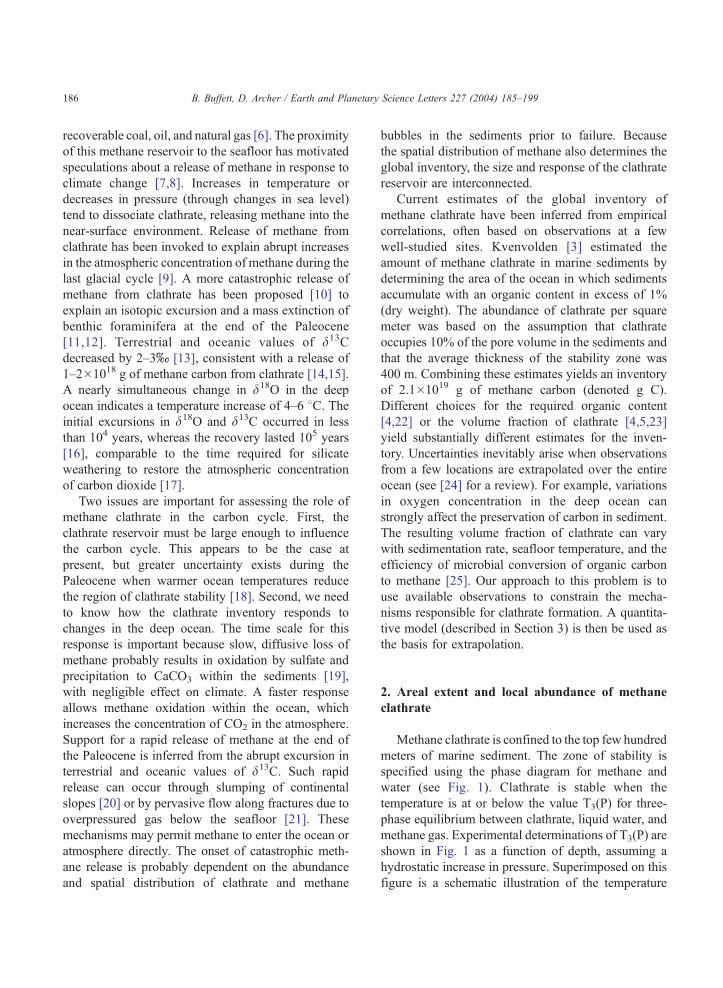
Fig. 1. Schematic illustration of temperature through the ocean and
uppermost marine sediments. The temperature for clathrate stability,
T3(P), increases with pressure (or depth). Experimental data for
T3(P) in pure water (dashed line) and seawater (solid line) are
extrapolated using a thermodynamic model [50]. The base of the
stability zone is defined by the intersection of the geotherm with
T3(P).
B. Buffett, D. Archer / Earth and Planetary Science Letters 227 (2004) 185–199 187
profile through the ocean and sediments. The zone of
stability is limited by the intersection of the local
temperature profile with T3(P), although clathrate is
confined to the sediments because the concentration of
methane in the ocean is too low to form clathrate, and
the buoyancy of clathrate in seawater would carry it out
of the stability zone, even if it did form.
Clathrate is unlikely to form below water depths of
less than 600 m because the bottom water is too warm
for stability. One exception occurs in the Arctic Ocean
where water temperatures as low as �1.5 8C permit
clathrate to form at depths of only 250 m. Elsewhere,
clathrate is commonly found below intermediate water
depths of 1000 to 3000 m [26]. As the depth of the
water increases, and the temperature of the seafloor
decreases, the zone of stability becomes thicker and
capable of accommodating larger volumes of clath-
rate. However, clathrate has never been detected in
sediments in the abyss, presumably because the rate of
carbon rain to the seafloor is too low to supply the
required source of methane through microbial con-
version of organic material in the sediments [27]. In
fact, 90% of the global carbon burial is thought to
occur at water depths of less than 1000 m [1], where
the depth of clathrate stability is comparatively thin.
This interplay between the depth of the stability zone
and the rate of carbon rain to the seafloor appears to
limit clathrate to intermediate water depths.
Estimates of clathrate abundance often distinguish
between passive and active margins [5]. The
abundance of clathrate on passive margins is thought
to be low (typically 5% to 10% of the pore volume
[28]) because the supply of methane is limited by the
availability of organic material in the sediments. On
the other hand, active margins are thought to have
much higher clathrate volumes, perhaps occupying
as much as 30% to 50% of the pore space [5,29,30].
Such large volumes are attributed to pervasive fluid
flow that scavenges methane from a broader region
[31]. While estimates of fluid flow at active margins
often exceed several mm year�1 [32], the evidence
for widespread accumulation of large clathrate
concentrations is equivocal. Modeling studies [33]
show that volume fractions of 30% to 50% on the
Cascadia margin, offshore Vancouver Island, are
incompatible with pore-water chloride concentrations
from ODP Site 146. More recent in situ measure-
ments of methane concentration from Hydrate Ridge,
offshore Oregon, suggest that high volume fractions
of clathrate are confined to localized faults, and that
broader regions are characterized by volume frac-
tions of a few percent [23].
In this study, we assume that the primary source
of methane is from conversion of organic carbon in
the sediments. The input of carbon at the seafloor is
converted to methane once the organic material is
buried below the sulfate-reducing zone. Methane is
transported through the sediments by diffusion and
by pore-fluid flow. Fluid flow recycles and traps
methane more efficiently within the clathrate zone,
yielding higher clathrate volumes in high-flow active
margins. The model-predicted global inventory of
clathrate is particularly sensitive to the efficiency of
methane production from organic matter and to the
rate of fluid flow. However, the response of the
model to changes in climatic and geochemical
forcing is perhaps more robust, especially if the
fluid flow and efficiency of methane production are
insensitive to climate.
B. Buffett, D. Archer / Earth and Planetary Science Letters 227 (2004) 185–199188
3. Description of the model
The inventory of methane clathrate below the
seafloor is ultimately controlled by the supply of
carbon. We quantify the flux of carbon to the seafloor
using a parameterization of the ocean carbon cycle
and predict the efficiency of carbon burial using a
sediment diagenesis model. Once the organic material
is buried below the sulfate-reducing zone, methano-
gens convert a fraction of this carbon to methane. The
resulting distribution of methane in dissolved, gas-
eous, and clathrate phases is predicted using a
clathrate model. Each component of the model is
briefly described below.
3.1. Carbon rain
Organic carbon rain to the seafloor is strongly
correlated with water depth (see Fig. 2a). This reflects
the fact that shallow waters are typically close to
coastlines, where particulate organic carbon produc-
tion and recycling are rapid. Primary production rates
in coastal waters are elevated severalfold over open-
ocean rates by coastal upwelling, nutrient runoff from
rivers, and nutrient recycling from the shallow sedi-
ments. Sediments in coastal waters participate in
nutrient recycling because they are closer to the
Fig. 2. (a) A summary of measurements of organic carbon rain to
the seafloor as a function of water depth. The solid line represents
the best-fitting curve through the data, while the scatter indicates the
regional variability. (b) Average temperature profile in the ocean as
a function of depth for present-day and warmer conditions.
euphotic zone, whereas nutrient recycling in deeper
water does not reach the seafloor. As a result, the
benthic flux of organic matter is amplified in near-
shore regions even more intensely than primary
production is amplified. With the increase in organic
carbon and terriginous material (clay) rain, the burial
efficiency of shallow-water sediments increases as
well, to up to ~50% preservation (compared to just a
few percent in pelagic sediments). These factors
conspire to greatly amplify the burial of organic
matter in near-shore sediments, so that shallow waters
account for ~90% of organic carbon burial in the
global ocean.
Our approach is to treat organic rain as a simple
function of water depth. The depth dependence is
determined by fitting a curve through the data
shown in Fig. 2a. This approach is commonly used
to parameterize carbon rains in models of the ocean
carbon cycle [1,34]. The weakness of the approach
is that it does not account for lateral heterogeneity
in primary production or shelf/slope dynamics.
These influences are reflected in the scatter of the
data. The best-fit curve represents a spatial average
of the carbon rain, which is suitable for estimating
global inventories. However, we are unable to
predict regional anomalies in the geographic dis-
tribution of methane clathrate without resorting to a
spatially dependent description of the carbon rain.
Such extensions are possible and could be applied
without altering the other components of our model.
3.2. Early diagenesis model
Most of the organic carbon rain to the seafloor is
respired rather than buried, and the fraction buried
below 1 m depth is determined by the oxidation/
reduction chemistry of the sediment and the kinetics
of biogenic reactions, such as respiration, bioturba-
tion, and sediment irrigation. We employ a sediment
diagenesis model called Muds, which solves for
organic degradation reactions within the top meter
of the sediment [1]. Muds is based on steady state
diffusion-reaction equations for pore water and solid
sediment. The model equations and reaction kinetics
are similar to previously published sedimentary
diagenetic models [35,36], but steady-state solutions
are obtained directly using an efficient relaxation
method.
B. Buffett, D. Archer / Earth and Planetary Science Letters 227 (2004) 185–199 189
Rate constant parameterizations in Muds were
tuned using a simulated annealing method to repro-
duce solid-phase organic carbon and MnO2, and pore-
water NO3�, NH4
+, Mn2+, Fe2+, and H2S data [1]. Rate
constants for respiration, bioturbation, and pore-water
irrigation by benthic macrofauna are parameterized in
terms of the total organic carbon rain rate and
overlying water O2. The organic carbon initially
reacts with O2 in the pore water, then passes through
the NO3�/MnO2 and SO4
�/FeOOH redox zones. Oxic
respiration rate constants are significantly higher than
anoxic rates, so that organic carbon preservation is
sensitive to the O2 concentration as well as the organic
carbon rain. The model is fairly successful at
predicting the organic carbon concentration in the
sediments, with no bsite-custom tuningQ, based only
on rain rates and the O2 concentration in the overlying
water. The model formulation, parameterizations, and
tuning, were all used as presented in [1], with no
adjustment or revision. The relevant output of the
model includes the organic carbon concentration and
the total sediment accumulation rate.
3.3. Clathrate model
We adopt a steady-state model [2] to describe the
distribution clathrate in the top few hundred meters of
sediment. The steady-state distribution develops after
~106 years of accumulations [25], and reflects the
average environmental conditions over this time
interval. It is also possible to use time-dependent
models, in principle, although we currently lack
detailed knowledge of the relevant history to imple-
ment such a model. The depth of the stability zone in
all calculations is determined from the phase diagram
using the seafloor temperature, geothermal gradient,
water depth and salinity. (We adopt a constant salinity
of 0.035 and assume a constant geothermal gradient of
0.04 K/m on passive margins and 0.06 K/m on active
margins.) The model also includes a region of several
hundred meters below the base of the stability zone to
describe the accumulation of gas bubbles and a
sulfate-reducing zone in the top 10–20 m, depending
on the upward flux of methane toward the seafloor
(see [2] for details).
The primary source of methane in the model is
from conversion of organic carbon in the sediments.
Our emphasis on biological sources of methane is
motivated by the light isotopic composition of carbon
recovered from samples of clathrate (typically
d13C=�60x), which suggests that thermogenic sour-
ces of methane are not important in most cases [37].
We include the possibility of a deep source of methane
by permitting methane-bearing fluid to migrate from
below. The significance of this deep source depends
on the methane content of the incoming fluid. We
consider fluids with a methane concentration of 50%
the saturation level, which is low enough to prevent
clathrate from accumulating without converting
organic material to methane inside the model domain.
The incoming fluid often becomes saturated with
methane as it rises through the region of gas bubbles
below the clathrate stability zone, so the primary role
of fluid flow is to recycle methane from bubbles back
into the stability zone.
Conversion of organic carbon to methane occurs
once the organic material is buried below the sulfate-
reducing zone. The rates of sedimentation and carbon
burial from Muds are used as input parameters in the
clathrate model. Other input parameters in the
clathrate model include the fraction of buried carbon
available to methanogens and the associated rate
constant for carbon consumption. Values for these
parameters are taken from previous studies [33,38],
which fit model predictions to pore-water sulfate and
chloride concentrations from ODP Leg 164 (Blake
Ridge). The same parameter values also yield a good
fit to pore-water sulfate and chloride concentrations
from ODP Leg 146 (Cascadia Margin). The clathrate
model routinely accounts for sediment compaction
and fluid expulsion, assuming an exponential decrease
in sediment porosity with depth [39]. An additional
flow is superimposed on the fluid expulsion to
account for deeper sources of fluid. In this study, we
assume that the deeper source of fluid is driven by
pressure that develops under nonsteady or nonuniform
compaction of the sediments [40]. We express the net
fluid flow as an interstitial velocity at the seafloor and
relate the amplitude of the velocity to the sedimenta-
tion rate. This fluid velocity is intended to represent a
regional average, which we apply in an upward
direction over 50% of the area and downward over
the remaining area. A range of values are explored in
this study, but we ultimately adopt the fluid velocities
inferred from comparisons of the model predictions
with pore-water analysis from ODP Legs 146 and
B. Buffett, D. Archer / Earth and Planetary Science Letters 227 (2004) 185–199190
164. (Details of the model assumptions and fitting
procedure are given in [33,38].)
4. Global inventory of methane clathrate
The procedure for calculating the present-day
inventory of methane clathrate can be summarized
as follows. The area of the seafloor is tabulated into
bins of water depth and O2 concentration using the
ETOPO5 5-min bathymetry and Levitus et al. [41]
distribution of O2. The depth bins coincide with the 33
levels from Levitus et al. [41], and the O2 concen-
tration is binned in increments of 10 AM. We find
nearly equivalent results treating temperature in each
of two ways. In one calculation, the seafloor temper-
ature is treated as a simple function of depth, based on
the average (present-day) temperature profile in the
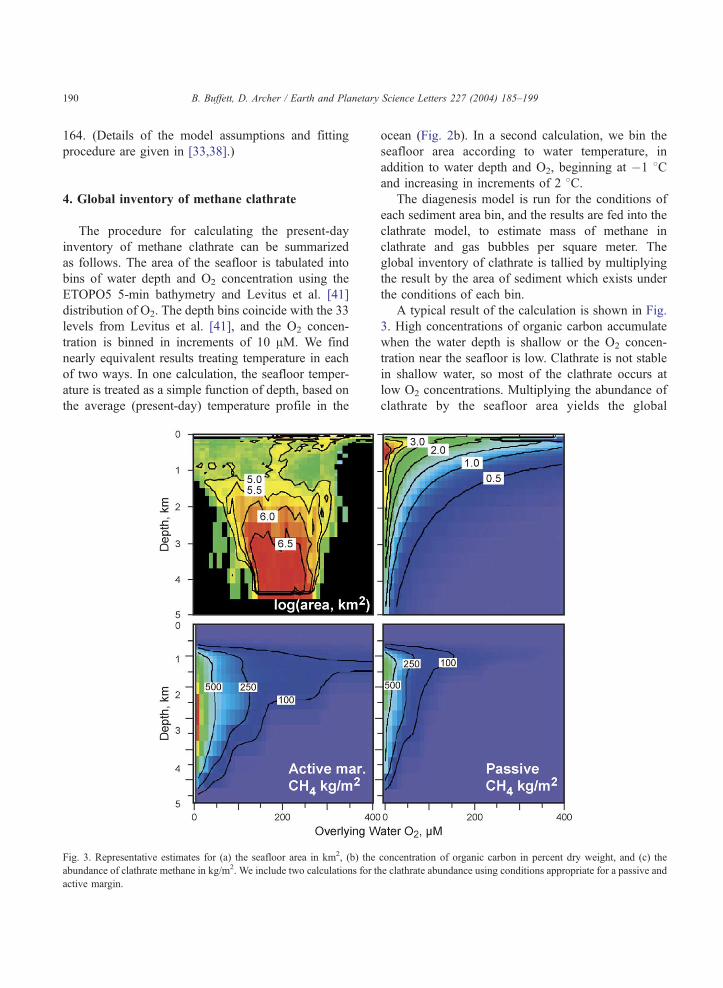
Fig. 3. Representative estimates for (a) the seafloor area in km2, (b) the
abundance of clathrate methane in kg/m2. We include two calculations for t
active margin.
ocean (Fig. 2b). In a second calculation, we bin the
seafloor area according to water temperature, in
addition to water depth and O2, beginning at �1 8Cand increasing in increments of 2 8C.
The diagenesis model is run for the conditions of
each sediment area bin, and the results are fed into the
clathrate model, to estimate mass of methane in
clathrate and gas bubbles per square meter. The
global inventory of clathrate is tallied by multiplying
the result by the area of sediment which exists under
the conditions of each bin.
A typical result of the calculation is shown in Fig.
3. High concentrations of organic carbon accumulate
when the water depth is shallow or the O2 concen-
tration near the seafloor is low. Clathrate is not stable
in shallow water, so most of the clathrate occurs at
low O2 concentrations. Multiplying the abundance of
clathrate by the seafloor area yields the global
concentration of organic carbon in percent dry weight, and (c) the
he clathrate abundance using conditions appropriate for a passive and
B. Buffett, D. Archer / Earth and Planetary Science Letters 227 (2004) 185–199 191
inventory. We give two examples for the clathrate
abundance using estimates of fluid flow appropriate
for passive and active margins. The higher fluid flow
at active margins increases the abundance of clathrate
inventory by recycling methane back into the stability
zone. As a result, clathrate is found over a broader
range of O2 concentration and depth in the active
margin case.
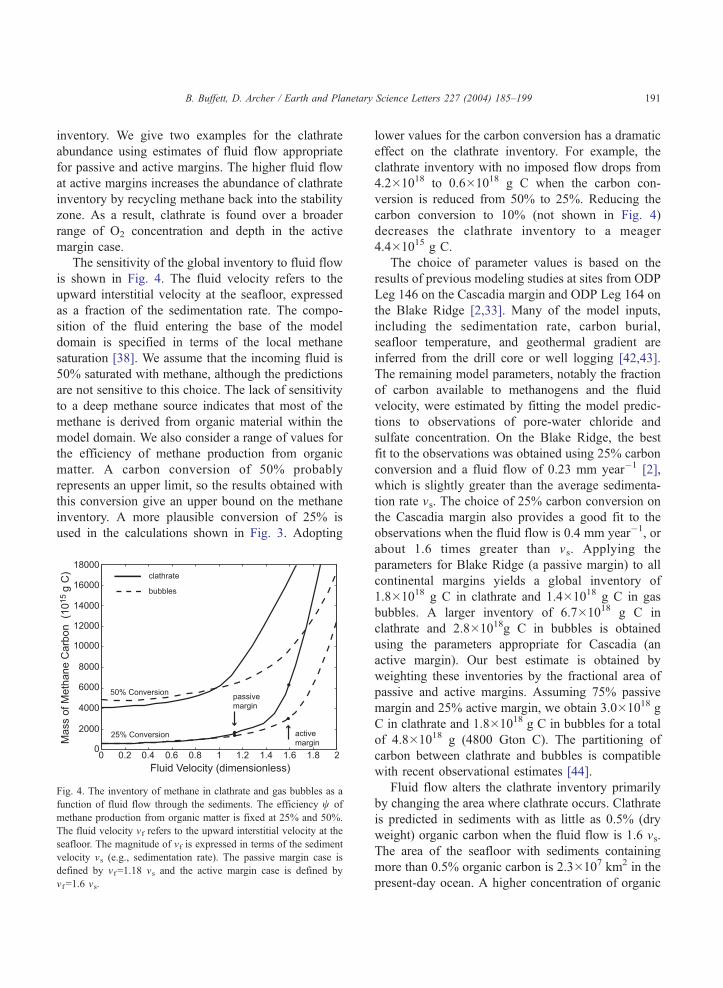
The sensitivity of the global inventory to fluid flow
is shown in Fig. 4. The fluid velocity refers to the
upward interstitial velocity at the seafloor, expressed
as a fraction of the sedimentation rate. The compo-
sition of the fluid entering the base of the model
domain is specified in terms of the local methane
saturation [38]. We assume that the incoming fluid is
50% saturated with methane, although the predictions
are not sensitive to this choice. The lack of sensitivity
to a deep methane source indicates that most of the
methane is derived from organic material within the
model domain. We also consider a range of values for
the efficiency of methane production from organic
matter. A carbon conversion of 50% probably
represents an upper limit, so the results obtained with
this conversion give an upper bound on the methane
inventory. A more plausible conversion of 25% is
used in the calculations shown in Fig. 3. Adopting
Fig. 4. The inventory of methane in clathrate and gas bubbles as a
function of fluid flow through the sediments. The efficiency w of
methane production from organic matter is fixed at 25% and 50%.
The fluid velocity vf refers to the upward interstitial velocity at the
seafloor. The magnitude of vf is expressed in terms of the sediment
velocity vs (e.g., sedimentation rate). The passive margin case is
defined by vf =1.18 vs and the active margin case is defined by
vf =1.6 vs.
lower values for the carbon conversion has a dramatic
effect on the clathrate inventory. For example, the
clathrate inventory with no imposed flow drops from
4.2�1018 to 0.6�1018 g C when the carbon con-
version is reduced from 50% to 25%. Reducing the
carbon conversion to 10% (not shown in Fig. 4)
decreases the clathrate inventory to a meager
4.4�1015 g C.
The choice of parameter values is based on the
results of previous modeling studies at sites from ODP
Leg 146 on the Cascadia margin and ODP Leg 164 on
the Blake Ridge [2,33]. Many of the model inputs,
including the sedimentation rate, carbon burial,
seafloor temperature, and geothermal gradient are
inferred from the drill core or well logging [42,43].
The remaining model parameters, notably the fraction
of carbon available to methanogens and the fluid
velocity, were estimated by fitting the model predic-
tions to observations of pore-water chloride and
sulfate concentration. On the Blake Ridge, the best
fit to the observations was obtained using 25% carbon
conversion and a fluid flow of 0.23 mm year�1 [2],
which is slightly greater than the average sedimenta-
tion rate vs. The choice of 25% carbon conversion on
the Cascadia margin also provides a good fit to the
observations when the fluid flow is 0.4 mm year�1, or
about 1.6 times greater than vs. Applying the
parameters for Blake Ridge (a passive margin) to all
continental margins yields a global inventory of
1.8�1018 g C in clathrate and 1.4�1018 g C in gas
bubbles. A larger inventory of 6.7�1018 g C in
clathrate and 2.8�1018g C in bubbles is obtained
using the parameters appropriate for Cascadia (an
active margin). Our best estimate is obtained by
weighting these inventories by the fractional area of
passive and active margins. Assuming 75% passive
margin and 25% active margin, we obtain 3.0�1018 g
C in clathrate and 1.8�1018 g C in bubbles for a total
of 4.8�1018 g (4800 Gton C). The partitioning of
carbon between clathrate and bubbles is compatible
with recent observational estimates [44].
Fluid flow alters the clathrate inventory primarily
by changing the area where clathrate occurs. Clathrate
is predicted in sediments with as little as 0.5% (dry
weight) organic carbon when the fluid flow is 1.6 vs.
The area of the seafloor with sediments containing
more than 0.5% organic carbon is 2.3�107 km2 in the
present-day ocean. A higher concentration of organic
B. Buffett, D. Archer / Earth and Planetary Science Letters 227 (2004) 185–199192
carbon (~1% dry weight) is required when the fluid
velocity is reduced to 1.18 vs. The corresponding area
of the seafloor reduces to 0.98�107 km2 (or 2.7% of
the seafloor area), which is very close to the value
assumed in the global inventory of Kvenvolden [3].
The change in seafloor area accounts for most of the
change in clathrate inventory when the fluid flow is
varied from passive to active margin conditions. The
remainder of the change in inventory is due to a
modest change in the volume fraction of clathrate and
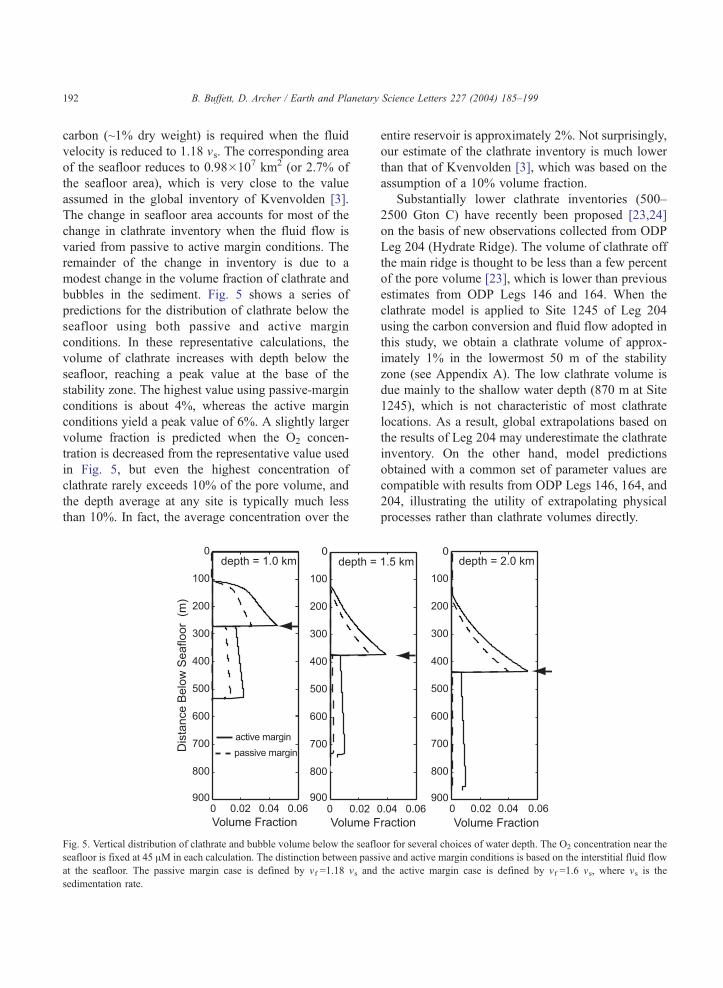
bubbles in the sediment. Fig. 5 shows a series of
predictions for the distribution of clathrate below the
seafloor using both passive and active margin
conditions. In these representative calculations, the
volume of clathrate increases with depth below the
seafloor, reaching a peak value at the base of the
stability zone. The highest value using passive-margin
conditions is about 4%, whereas the active margin
conditions yield a peak value of 6%. A slightly larger
volume fraction is predicted when the O2 concen-
tration is decreased from the representative value used
in Fig. 5, but even the highest concentration of
clathrate rarely exceeds 10% of the pore volume, and
the depth average at any site is typically much less
than 10%. In fact, the average concentration over the
Fig. 5. Vertical distribution of clathrate and bubble volume below the seaflo
seafloor is fixed at 45 AM in each calculation. The distinction between pass
at the seafloor. The passive margin case is defined by vf =1.18 vs and
sedimentation rate.
entire reservoir is approximately 2%. Not surprisingly,
our estimate of the clathrate inventory is much lower
than that of Kvenvolden [3], which was based on the
assumption of a 10% volume fraction.
Substantially lower clathrate inventories (500–
2500 Gton C) have recently been proposed [23,24]
on the basis of new observations collected from ODP
Leg 204 (Hydrate Ridge). The volume of clathrate off
the main ridge is thought to be less than a few percent
of the pore volume [23], which is lower than previous
estimates from ODP Legs 146 and 164. When the
clathrate model is applied to Site 1245 of Leg 204
using the carbon conversion and fluid flow adopted in
this study, we obtain a clathrate volume of approx-
imately 1% in the lowermost 50 m of the stability
zone (see Appendix A). The low clathrate volume is
due mainly to the shallow water depth (870 m at Site
1245), which is not characteristic of most clathrate
locations. As a result, global extrapolations based on
the results of Leg 204 may underestimate the clathrate
inventory. On the other hand, model predictions
obtained with a common set of parameter values are
compatible with results from ODP Legs 146, 164, and
204, illustrating the utility of extrapolating physical
processes rather than clathrate volumes directly.
or for several choices of water depth. The O2 concentration near the
ive and active margin conditions is based on the interstitial fluid flow
the active margin case is defined by vf =1.6 vs, where vs is the
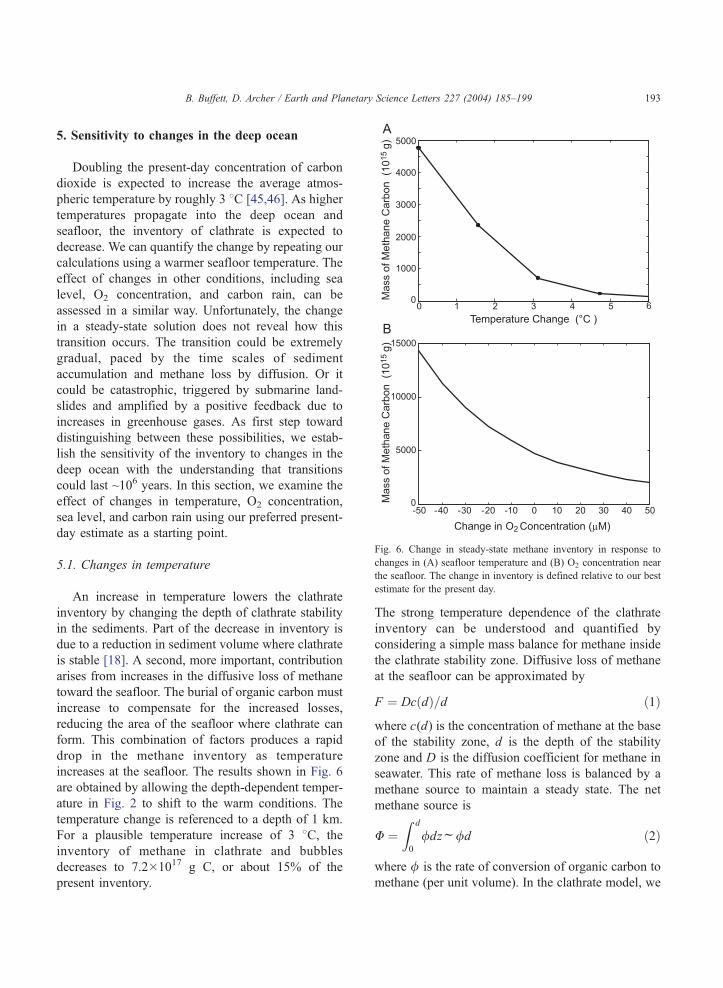
Fig. 6. Change in steady-state methane inventory in response to
changes in (A) seafloor temperature and (B) O2 concentration nea
the seafloor. The change in inventory is defined relative to our bes
estimate for the present day.
B. Buffett, D. Archer / Earth and Planetary Science Letters 227 (2004) 185–199 193
5. Sensitivity to changes in the deep ocean
Doubling the present-day concentration of carbon
dioxide is expected to increase the average atmos-
pheric temperature by roughly 3 8C [45,46]. As higher
temperatures propagate into the deep ocean and
seafloor, the inventory of clathrate is expected to
decrease. We can quantify the change by repeating our
calculations using a warmer seafloor temperature. The
effect of changes in other conditions, including sea
level, O2 concentration, and carbon rain, can be
assessed in a similar way. Unfortunately, the change
in a steady-state solution does not reveal how this
transition occurs. The transition could be extremely
gradual, paced by the time scales of sediment
accumulation and methane loss by diffusion. Or it
could be catastrophic, triggered by submarine land-
slides and amplified by a positive feedback due to
increases in greenhouse gases. As first step toward
distinguishing between these possibilities, we estab-
lish the sensitivity of the inventory to changes in the
deep ocean with the understanding that transitions
could last ~106 years. In this section, we examine the
effect of changes in temperature, O2 concentration,
sea level, and carbon rain using our preferred present-
day estimate as a starting point.
5.1. Changes in temperature
An increase in temperature lowers the clathrate
inventory by changing the depth of clathrate stability
in the sediments. Part of the decrease in inventory is
due to a reduction in sediment volume where clathrate
is stable [18]. A second, more important, contribution
arises from increases in the diffusive loss of methane
toward the seafloor. The burial of organic carbon must
increase to compensate for the increased losses,
reducing the area of the seafloor where clathrate can
form. This combination of factors produces a rapid
drop in the methane inventory as temperature
increases at the seafloor. The results shown in Fig. 6
are obtained by allowing the depth-dependent temper-
ature in Fig. 2 to shift to the warm conditions. The
temperature change is referenced to a depth of 1 km.
For a plausible temperature increase of 3 8C, the
inventory of methane in clathrate and bubbles
decreases to 7.2�1017 g C, or about 15% of the
present inventory.
r
t
The strong temperature dependence of the clathrate
inventory can be understood and quantified by
considering a simple mass balance for methane inside
the clathrate stability zone. Diffusive loss of methane
at the seafloor can be approximated by
F ¼ Dc dð Þ=d ð1Þ
where c(d) is the concentration of methane at the base
of the stability zone, d is the depth of the stability
zone and D is the diffusion coefficient for methane in
seawater. This rate of methane loss is balanced by a
methane source to maintain a steady state. The net
methane source is
U ¼Z d
0
/dzf/d ð2Þ
where / is the rate of conversion of organic carbon to
methane (per unit volume). In the clathrate model, we
B. Buffett, D. Archer / Earth and Planetary Science Letters 227 (2004) 185–199194
express / as a linear function of the organic carbon
concentration a in the sediments and assume that only
a fraction w of a is converted to methane. In this
approximation, the methane source becomes
Ufkwad ð3Þ
where the rate constant k includes the conversion
between the units of a (% dry weight) and c (mass
fraction of the pore liquid). Equating the source U and
the loss F yields
a ¼ Dc dð Þ=kwd2 ð4Þ
which relates the organic carbon in the sediments to
the concentration of dissolved methane at the base of
the stability zone. Clathrate becomes stable when c(d)
equals the local solubility ceq(d), so the minimum
value of a is given by
amin ¼ Dceq dð Þ=kwd2 ð5Þ
As the depth of the stability field decreases, the
concentration of organic carbon in sediments must
increase in order satisfy Eq. (5). [The depth depend-
ence of ceq(d) is fairly weak due to the counteracting
effects of pressure and temperature]. The area of the
seafloor with organic carbon in excess of amin can be
approximated by
AðaminÞfAða0Þða0=aminÞ3=2 ð6Þ
where A(a0) is the area of the seafloor with organic
carbon in excess of a0=1% (roughly the area of the
present-day inventory). The corresponding volume of
the present-day inventory is defined by V(d0)=A(a0)
d0, where d0 is the average depth of the stability zone.
When the average depth d decreases due to warming,
the value of amin goes up, according to Eq. (5), and
the area A(amin) goes down, according to Eq. (6). The
volume of the clathrate inventory can be estimated by
combining Eqs. (5) and (6) to yield
V dð Þ=V ðd0Þfðd=d0Þ4 ð7Þ
The change in V(d) accounts for most of the
change in the clathrate inventory due to warming. For
example, we can reduce the volume of the clathrate
inventory to 15% of the present-day value by
decreasing the average depth of the stability zone to
d=0.62 d0. The minimum concentration of organic
carbon increases to 2.5% on passive margins and
1.2% on active margins. Such high values of organic
carbon greatly reduce the area where clathrate can
form.
The effect of warming is clearly illustrated by
comparing the vertical distribution of clathrate before
and after a temperature increase of 3 8C. Fig. 5 shows
the distribution of clathrate at water depths of 1, 1.5,
and 2 km prior to warming. The distribution of
clathrate at the same depths is shown in Fig. 7 after
warming. We see that clathrate has disappeared from a
depth of 2 km because the supply of carbon at this
depth is no longer sufficient to saturate the pore water
with methane (see Fig. 7B). Because the supply of
organic material to the sediments is not altered by
temperature in our calculation, the disappearance of
clathrate at a depth of 2 km is due to increased
diffusive losses. At depths of 1 and 1.5 km, the
volume fractions of clathrate and gas bubbles after
warming are slightly smaller than those prior to
warming. However, the decrease in volume fraction
has only a modest influence on the inventory. The
largest effect is due to the reduction in the range of
water depths (and hence seafloor area) where clathrate
can form.
5.2. Changes in O2 concentration
Organic carbon burial in sediment is sensitive to
the concentration of oxygen in the overlying water.
Lower deep-ocean oxygen concentrations could
therefore drive an increase in clathrate abundance
by increasing the methane supply rate to the
clathrate zone. The minimum concentration of
organic matter required to drive clathrate formation
(~1% in the present-day ocean) is unchanged by a
change in deep oxygen, but the area where such
sediments are found increases greatly when oxygen
levels are lower. We predict the effect of oxygen
levels by computing the apparent oxygen utilization
(AOU) of the present-day ocean as the potential
disequilibrium of each subsurface water parcel,
relative to atmospheric oxygen at the sea surface.
Deep ocean oxygen is decreased by linearly
increasing the observed, AOU, and vice versa.
Even a modest 40-AM decrease in O2 concentration
is sufficient to increase in the methane inventory by
a factor of 2 (Fig. 7B). Conversely, a 40-AM
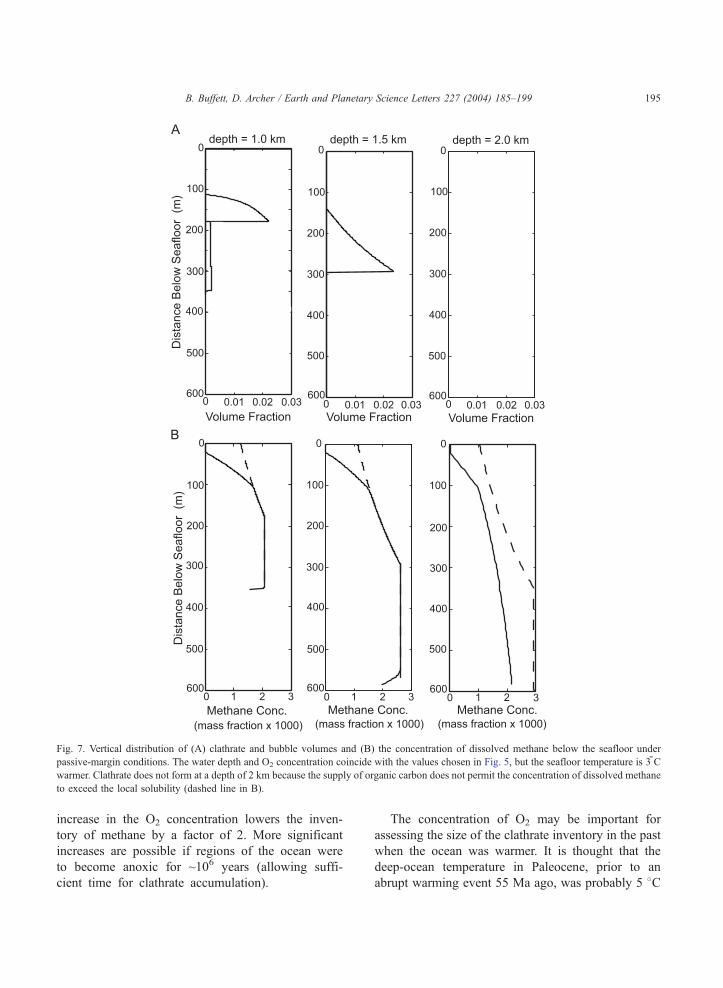
Fig. 7. Vertical distribution of (A) clathrate and bubble volumes and (B) the concentration of dissolved methane below the seafloor under
passive-margin conditions. The water depth and O2 concentration coincide with the values chosen in Fig. 5, but the seafloor temperature is 3̄ C
warmer. Clathrate does not form at a depth of 2 km because the supply of organic carbon does not permit the concentration of dissolved methane
to exceed the local solubility (dashed line in B).
B. Buffett, D. Archer / Earth and Planetary Science Letters 227 (2004) 185–199 195
increase in the O2 concentration lowers the inven-
tory of methane by a factor of 2. More significant
increases are possible if regions of the ocean were
to become anoxic for ~106 years (allowing suffi-
cient time for clathrate accumulation).
The concentration of O2 may be important for
assessing the size of the clathrate inventory in the past
when the ocean was warmer. It is thought that the
deep-ocean temperature in Paleocene, prior to an
abrupt warming event 55 Ma ago, was probably 5 8C
B. Buffett, D. Archer / Earth and Planetary Science Letters 227 (2004) 185–199196
warmer than present. If the ocean at that time was
otherwise similar to the ocean today, then our
calculations suggest that the steady-state inventory
of methane was insufficient to explain the magnitude
of the excursion in d13C [15]. We can restore clathrate
as a viable source of carbon for the isotopic excursion
by appealing to a lower O2 concentration in the ocean.
For example, our calculations suggest that several
thousand Gton C could be stored in clathrate below an
anoxic Arctic Ocean.
5.3. Changes in the rate of carbon rain
Changes in primary production under warmer
conditions can alter the clathrate inventory by altering
the rate of carbon rain to the seafloor. An increase in
carbon rain during the Paleocene has been evoked to
explain the occurrence of a large clathrate reservoir
when the deep ocean is warm [15]. We alter the rate of
carbon rain in the model using one of two assump-
tions. In one case, we assume that the ratio of organic
carbon to clay is fixed. An increase in carbon rain
implies an increase in sedimentation rate without
substantially altering the concentration of organic
carbon. In the second case, we increase the carbon
rain without altering the clay rain. The sedimentation
rate is effectively unchanged, but the concentration of
organic carbon in the sediments increases. We use
these two approximations to investigate the effect of a
50% increase in carbon rain. The diagenesis model is
rerun with revised inputs, and the results are fed into
the clathrate model to determine the global inventory.
The resulting inventory of methane increases by
a roughly a factor of 2 in both approximations.
Most of the additional methane is stored as bubbles
when the sedimentation rate increases, whereas
comparable increases in bubble and clathrate
volumes occur when the concentration of organic
carbon increases. (The bubble volume depends
primarily on the flux of clathrate through the base
of the stability field. An increase in bubble volume
arises from an increase in either the clathrate
volume or sedimentation rate). The increase in
sedimentation rate also reduces the concentration
of organic carbon required to form clathrate. We
find that a 50% increase in sedimentation rate
reduces the required concentration of organic
carbon by almost 50%. However, the change in
carbon rain is not sufficient on its own to fully
compensate for higher temperature during the
Paleocene.
5.4. Changes in sea level
Changes in sea level alter the inventory of clathrate
by modifying the pressure at the seafloor. A drop in
sea level lowers pressure at the seafloor, causing a
reduction in the thickness of the stability zone. The
effect on the clathrate inventory is completely
analogous to the effect of a temperature change. The
main difference is that plausible changes in sea level
cause only a small change in the thickness of the
stability zone. For example, a 100-m drop in sea level
reduces the thickness of the stability zone by less than
10 m in most locations. We predict a 3% decrease in
the clathrate inventory when the steady-state model is
rerun with a 100-m decrease in sea level. Because sea
level has only a small influence on the clathrate
inventory, we expect cooler temperatures during
glacial periods to produce a net increase in the
clathrate inventory.
6. Discussion
Several millions years are required to accumulate a
steady inventory [25], whereas the decline due to
warming may be comparatively rapid [15]. This
asymmetry in the time scale for growth and decline
affects the clathrate inventory when conditions vary.
For example, glacial periods favor larger inventories
because the effect of cool conditions should prevail
over the effect of lower sea level. On the other hand,
rapid adjustment to warmer interglacial periods may
be sufficient to make the present inventory compatible
with steady-state predictions based on current (inter-
glacial) conditions. A substantial decrease in the
clathrate inventory is expected in the future as
temperatures exceed those experienced in the past
few million years. Lower O2 concentrations or higher
rates of carbon rain cannot offset the effects of higher
temperatures because the clathrate reservoir grows
slowly in response to changes.
Several mechanisms have been proposed to permit
a rapid release of methane from clathrate. Submarine
slides can release regional accumulations of clathrate
B. Buffett, D. Archer / Earth and Planetary Science Letters 227 (2004) 185–199 197
and bubbles in a matter of minutes. Failure is thought
to occur in response to elevated pressure in the pore
water because the phase change from clathrate to
methane and water involves a volume increase [20].
The factors that contribute to failure include the
abundance of clathrate, the magnitude of warming
and the permeability of the sediments. It is not known
if future warming is sufficient to cause failure of
continental slopes on a global scale, but isotopic
evidence of rapid carbon release in the past is
suggestive.
A more recent proposal for rapid release of
methane is based on elevated pressure in the gas
phase [21,44]. Interconnection of gas bubbles below
the clathrate stability zone transmits hydrostatic
pressures from greater depths by virtue of the low
density of the gas phase. The excess (nonhydrostatic)
pressure at the top of the gas layer may be sufficient to
fracture the sediments and drive gas toward the
seafloor. Evidence for gas escaping through the
seafloor on the Blake Ridge suggests that this process
is possible [47]. However, it is not clear if the process
occurs on most continental margins. The volume
fraction of gas needed for interconnection is thought
to be about 10% [21], which is substantially higher
than the typical volume predicted in our calculations.
In fact, most clathrate locations are predicted have gas
volumes less than 1% of the pore volume, which is at
the limit of detection in geophysical surveys [48,49].
Whether larger volumes of gas develop during the
transient response to warming remains to be deter-
mined using time-dependent models.
7. Conclusions
We use a steady-state model to predict the present-
day inventory of methane clathrate below the seafloor.
Our best estimate yields 3�1018 g C in clathrate and
1.8�1018 g C in bubbles. The largest source of
uncertainty is due to the efficiency of methane
production from organic matter and to the rate of
vertical fluid flow. Values for these parameters are
taken from previous modeling studies at both passive
and active margins.
Changes in the clathrate inventory are predicted
using plausible changes in the deep ocean. Awarming
of 3 8C reduces the clathrate inventory to 15% of its
present value. Much of this decrease is attributed an
increase in the organic carbon needed to sustain
clathrate in sediments when the zone of stability
becomes thin. The area of seafloor with sufficient
organic carbon drops sharply as the stability zone gets
thinner. A reduction in sea level has a similar effect,
although the change in the inventory is small because
the depth of the stability zone is typically altered by
less than 10 m for a nominal 100-m drop in sea level.
Future warming implies substantial changes in
the clathrate inventory. However, our calculations
do not predict the time scale for this adjustment.
Several mechanisms permit rapid release of meth-
ane, and it appears that one or more of these
mechanisms must have operated at the end of the
Paleocene if the excursion in d13C is caused by a
total collapse of the clathrate inventory. On the
other hand, the clathrate reservoir prior to this
collapse may have been insufficient to explain the
isotopic excursion because the deep ocean was
warmer than today. One way to increase the
clathrate inventory is to lower the concentration
of dissolved O2. We show that a 40-AM decrease in
O2 concentration can increase the clathrate inven-
tory by a factor of 2. Similarly, a 50% increase in
the rate of carbon rain can also increase the
clathrate inventory by a factor of 2.
Acknowledgements
We thank Peter Brewer, Jerry Dickens and Mark
Maslin for many constructive comments and
suggestions.
Appendix A. Supplementary data
Supplementary data associated with this article can
be found, in the online version, at doi:10.1016/
j.epsl.2004.09.005.
References
[1] D.E. Archer, J.L. Morford, S.R. Emerson, A model of suboxic
sedimentary diagenesis suitable for automatic tuning and
gridded global domains, Glob. Biogeochem. Cycles 16
(2002) doi:10.1029/2000GB001288.
B. Buffett, D. Archer / Earth and Planetary Science Letters 227 (2004) 185–199198
[2] M.K. Davie, B.A. Buffett, A steady state model for marine
hydrate formation: constraints on methane supply from pore
water sulfate profiles, J. Geophys. Res. 108 (B10) (2003)
doi:10.1029/2002JB002300.
[3] K.A. Kvenvolden, Methane hydrate—a major reservoir of
carbon in the shallow geosphere, Chem. Geol. 71 (1–3) (1988)
41–51.
[4] G.J. MacDonald, The future of methane as an energy resource,
Annu. Rev. Energy 15 (1990) 53–83.
[5] V. Gornitz, I. Fung, Potential distribution of methane hydrate
in the world’s oceans, Glob. Biogeochem. Cycles 8 (1994)
335–347.
[6] E.T. Sundquist, Geological perspectives on carbon dioxide and
the carbon cycle, in: W.S.B.E.T. Sundquist (Ed.), The Carbon
Cycle and Atmospheric CO2: Natural Variations Archean to
Present, vol. 32, American Geophysical Union, Washington,
DC, 1985, p. 5.
[7] K.A. Kvenvolden, Methane hydrates and global climate, Glob.
Biogeochem. Cycles 2 (1988) 221–229.
[8] G.J. MacDonald, Role of methane clathrates in past and future
climates, Clim. Change 16 (1990) 247–281.
[9] J.P. Kennett, K.G. Cannariato, I.L. Hendry, R.J. Behl, Carbon
isotopic evidence for methane hydrate instability during
quaternary interstadials, Science 288 (2000) 128–133.
[10] G.R. Dickens, J.R. O’Neil, D.K. Rea, R.M. Owens, Dissoci-
ation of oceanic methane hydrate as a cause of the carbon
isotope excursion at the end of the Paleocene, Paleoceanog-
raphy 10 (1995) 965–971.
[11] J.P. Kennett, L.D. Stott, Abrupt deep sea warming, paleocea-
nographic changes and benthic extinctions at the end of the
Paleocene, Nature 353 (1991) 225–229.
[12] E. Thomas, N.J. Shackleton, The Paleocene–Eocene benthic
foraminiferal extinction and stable isotope anomalies, Spec.
Publ.-Geol. Soc. Lond. 101 (1996) 401–411.
[13] P.L. Koch, J.C. Zachos, P.D. Gingerich, Coupled isotopic
change in marine and continental carbon reservoirs near the
Paleocene/Eocene boundary, Nature 358 (1992) 319–322.
[14] M.E. Katz, D.K. Pak, G.R. Dickens, K.G. Miller, The
source and fate of massive carbon input during the
latest Paleocene thermal maximum, Science 286 (1999)
1531–1533.
[15] G.R. Dickens, Rethinking the global carbon cycle with a large,
dynamic and microbially mediated gas hydrate capacitor, Earth
Planet. Sci. Lett. 213 (2003) 169–183.
[16] G.R. Dickens, Methane oxidation during the late Paleocene
thermal maximum, Bull. Soc. Geol. Fr. 171 (2000) 37–49.
[17] D. Archer, H. Kheshgi, E. Maier-Riemer, Multiple timescales
for neutralization of fossil fuel CO2, Geophys. Res. Lett. 24
(1997) 405–408.
[18] G.R. Dickens, The potential volume of oceanic methane
hydrates with variable external conditions, Org. Geochem. 32
(2001) 1179–1193.
[19] W.S. Borowski, C.K. Paull, W. Ussler, Carbon cycling
within the methanogenic zone of continental rise sediments:
an example from methane-rich sediments overlying the
Blake Ridge gas hydrate deposits, Mar. Chem. 57 (1997)
299–311.
[20] R.E. Kayen, H.J. Lee, Pleistocene slope instability of gas
hydrate-laden sediment of Beaufort Sea margin, Mar. Geo-
technol. 10 (1991) 125–141.
[21] B.P. Flemings, X. Liu, W.J. Winters, Critical pressure and
multiphase flow in Blake Ridge gas hydrates, Geology 31
(2003) 1057–1060.
[22] L.D.D. Harvey, Z. Huang, Evaluation of the potential impact
of methane clathrate destabilization on future global warming,
J. Geophys. Res. 100 (1995) 2905–2926.
[23] A.V. Milkov, G.E. Claypool, Y.-J. Lee, W. Xu, G.R. Dickens,
W.S. Borowski, O.L.S. Party, In situ methane concentrations at
Hydrate Ridge, offshore Oregon: new constraints on the global
gas hydrate inventory from an active margin, Geology 31
(2003) 833–836.
[24] A.V. Milkov, Global estimates of hydrate-bound gas in marine
sediments: how much is really out there? Earth Sci. Rev. 66
(2004) 183–197.
[25] M.K. Davie, B.A. Buffett, A numerical model for the
formation of gas hydrate below the seafloor, J. Geophys.
Res. 106 (B1) (2001) 497–514.
[26] K.A. Kvenvolden, Gas hydrates—geological perspective and
global change, Rev. Geophys. 31 (2) (1993) 173–187.
[27] G.E. Claypool, K.A. Kvenvolden, Methane and other hydro-
carbon gases in marine sediment, Annu. Rev. Earth Planet. Sci.
11 (1983) 299–327.
[28] W.S. Holbrook, H. Hoskins, W.T. Wood, R.A. Stephen, D.
Lizzaralde, Methane hydrate and free gas on the Blake
Ridge from vertical seismic profiling, Science 273 (1996)
1840–1843.
[29] T. Yuan, R.D. Hyndman, G.D. Spence, B. Desmons,
Seismic velocity increase and deep-sea gas hydrate concen-
tration above a bottom-simulating reflector on the northern
Cascadia continental slope, J. Geophysical Res., B 101
(1996) 13655–13671.
[30] R.D. Hyndman, T. Yuan, K. Moran, The concentration of
deep sea gas hydrates from downhole electrical resistivity
logs and laboratory data, Earth Planet. Sci. Lett. 172 (1999)
167–177.
[31] R.D. Hyndman, E.E. Davis, A mechanism for the formation
of methane hydrate and seafloor bottom simulating reflec-
tors by vertical expulsion, J. Geophys. Res. 97 (1992)
7025–7041.
[32] R.D. Hyndman, G.F. Moore, K. Moran, Velocity, porosity, and
pore-fluid loss from the Nankai subduction zone accretionary
prism, Proc. Ocean Drill. Program Sci. Results 131 (1993)
211–220.
[33] M.K. Davie, B.A. Buffett, Sources of methane for marine gas
hydrate: inferences from a comparison of observations and
numerical models, Earth Planet. Sci. Lett. 206 (1–2) (2003)
51–63.
[34] D.E. Archer, A data-driven model of the global calcite
lysocline, Glob. Biogeochem. Cycles 10 (1996) 511–526.
[35] D. Burdige, J.M. Geiskes, A pore water/solid phase diagenetic
model for manganese in marine sediments, Am. J. Sci. 283
(1983) 29–47.
[36] P.v. Cappellen, Y. Wang, Cycling of iron and manganese in
surface sediments: a general theory for the coupled transport
B. Buffett, D. Archer / Earth and Planetary Science Letters 227 (2004) 185–199 199
and reaction of carbon, oxygen, nitrogen, sulfur, iron and
manganese, Am. J. Sci. 296 (1996) 197–243.
[37] K.A. Kvenvolden, A review of the geochemistry of
methane in natural gas hydrate, Org. Geochem. 23 (1995)
992–1008.
[38] M.K. Davie, O.Y. Zatsepina, B.A. Buffett, Methane solubility
in marine hydrate environments, Mar. Geol. 203 (2004)
177–184.
[39] I. Hutchinson, The effect of sedimentation and compaction on
oceanic heat flow, Geophys. J. R. Astron. Soc. 82 (1985)
439–459.
[40] B. Dugan, P.B. Flemings, Overpressure and fluid flow in the
New Jersey continental slope: implications for slope failure
and cold seeps, Science 289 (2000) 288–291.
[41] S. Levitus, M.E. Conkright, J.L. Reid, R.G. Najjar, A.
Mantyla, Distribution of nitrate, phosphate, and silicate in
the world’s oceans, Prog. Oceanogr. 31 (1993) 245–273.
[42] G.K. Westbrook, B. Carson, R.J. Musgrave, et al., Proceedings
of the Ocean Drilling Program, in: Initial Reports, vol. 146,
1994, College Station, TX.
[43] C.K. Paull, R. Matsumoto, P.J. Wallace, et al., Proceeding of
the Ocean Drilling Program, in: Initial Reports, vol. 164, 1996,
College Station, TX.
[44] M.J. Hornbach, D.M. Saffer, W.S. Holbrook, Critically
pressured free-gas reservoirs below gas hydrate provinces,
Nature 427 (2004) 142–144.
[45] R.J. Stouffer, S. Manabe, Response of a coupled ocean-
atmosphere model to increasing atmospheric carbon dioxide:
sensitivity to the rate of increase, J. Climate 12 (8) (1999)
2224–2237.
[46] S. Manabe, R.J. Stouffer, Multiple-century response of a
coupled ocean-atmosphere model to an increase of atmos-
pheric carbon dioxide, J. Climate 7 (1994) 5–23.
[47] A.R. Gorman, W.S. Holbrook, M.J. Hornbach, K.L. Hackwith,
D. Lizarralde, I. Pecher, Migration of methane gas through a
hydrate stability zone in a low-flux hydrate province, Geology
30 (2002) 327–330.
[48] W. Wood, P. Stoffa, T. Shipley, Quantitative detection of
methane hydrate through high-resolution seismic velocity
analysis, J. Geophys. Res. 99 (1994) 9681–9695.
[49] I.A. Pecher, T.A. Minshull, S.C. Singh, R.v. Huene, Velocity
structure of a bottom simulating reflector offshore Peru: results
from full waveform inversion, Earth Planet. Sci. Lett. 139
(1996) 459–469.
[50] E.D. Sloan, Clathrate Hydrates of Natural Gas, Marcel Dekker,
New York, 1998.


![PHASE EQUILIBRIA OF METHANE CLATHRATE HYDRATE FROM …€¦ · carrier gases such as methane [4,5] and hydrogen [6,7], as a natural carbon sink on the Martian surface [8],and for](https://static.fdocuments.net/doc/165x107/60623d9ced426123323a59ce/phase-equilibria-of-methane-clathrate-hydrate-from-carrier-gases-such-as-methane.jpg)
