Global Innovator of Performance-Enhancing Chemistries and...
32
NYSE LISTED: “OMN” Global Innovator of Performance-Enhancing Chemistries and Surfaces Investor Presentation – First Quarter 2019
Transcript of Global Innovator of Performance-Enhancing Chemistries and...

NYSE LISTED: “OMN”
Global Innovator of Performance-Enhancing Chemistries and Surfaces
Investor Presentation – First Quarter 2019

INVESTOR PRESENTATION | First Quarter 2019 NYSE OMN
› Forward Looking Statements
Cautionary Statements
This presentation includes descriptions of OMNOVA's current business, operations, assets and other matters affecting the Company as well as "forward-looking statements" as defined by federal securities laws. All forward-looking statements by the Company,
including verbal statements, are intended to qualify for the protections afforded forward-looking statements under the Private Securities Litigation Reform Act of 1995. Forward-looking statements reflect management's current expectation, judgment, belief,
assumption, estimate or forecast about future events, circumstances or results and may address business conditions and prospects, strategy, capital structure, debt and cash levels, sales, profits, earnings, markets, products, technology, operations, customers,
raw materials, claims and litigation, financial condition, and accounting policies among other matters. Words such as, but not limited to, "will," "may," "should," "projects," "forecasts," "seeks," "believes," "expects," "anticipates," "estimates," "intends," "plans,"
"targets," "optimistic," "likely," "would," "could," "committed," and similar expressions or phrases identify forward-looking statements.
All descriptions of OMNOVA's current business, operations and assets, as well as all forward-looking statements, involve risks and uncertainties. Many risks and uncertainties are inherent in business generally. Other risks and uncertainties are more specific to
the Company's businesses and strategy, or to any new businesses the Company may enter into or acquire. There also may be risks and uncertainties not currently known to the Company. The occurrence of any such risks and uncertainties and the impact of
such occurrences is often not predictable or within the Company's control. Such impacts could adversely affect the Company's business, operations or assets as well as the Company's results and the value of your investment in the Company. In some cases,
such impact could be material. Certain risks and uncertainties facing the Company are described below or in the Company's Quarterly Report on Form 10-Q and Annual Report and the value of your investment in the Company on Form 10-K.
All written and verbal descriptions of OMNOVA's current business, operations and assets and all forward-looking statements attributable to the Company or any person acting on the Company's behalf are expressly qualified in their entirety by the risks,
uncertainties, and cautionary statements contained or referenced herein. All such descriptions and any forward-looking statement speak only as of the date on which such description or statement is made, and the Company undertakes no obligation, and
specifically declines any obligation, other than that imposed by law, to publicly update or revise any such description or forward-looking statements whether as a result of new information, future events or otherwise.
The Company's actual and projected results and the value of your investment in OMNOVA may differ, perhaps materially, from expectations due to a number of risks and uncertainties including, but not limited to: (1) the Company's exposure to general
economic, business, and industry conditions; (2) changes in raw material prices and availability; (3) extraordinary events such as natural disasters, political disruptions, terrorist attacks and acts of war; (4) the risk of doing business in foreign countries and
markets; (5) the highly competitive markets the Company serves and continued consolidations among its competitors and customer base; (6) extensive and increasing governmental regulation, including environmental, health and safety regulations; (7) the
Company's inability to protect its intellectual property or successfully defend itself from intellectual property claims; (8) claims and litigation; (9) changes in accounting policies, standards, and interpretations; (10) the actions of activist shareholders; (11) risks
inherent in the operation of manufacturing facilities; (12) the Company's inability to achieve or achieve in a timely manner the objectives and benefits of cost reduction initiatives; (13) the Company's ability to develop and commercialize new products that can be
value priced; (14) the Company's ability to identify and complete strategic transactions; (15) the Company’s ability to successfully integrate acquired companies; (16) information system failures and breaches in security; (17) the Company's use of purchase
orders rather than long-term contracts for most of its business; (18) the disproportionate impact of certain product lines on the Company's operating profitability; (19) customer credit risk; (20) continued increases in healthcare costs; (21) the Company's ability
retain or attract key employees; (22) the Company's ability to renew collective bargaining agreements with employees on acceptable terms and the risk of work stoppages; (23) the Company's contribution obligations under its U.S. pension plan; (24) the
Company's reliance on foreign financial institutions to hold some of its funds; (25) the effect of goodwill impairment charges; (26) the volatility in the market price of the Company’s common shares; (27) the Company's substantial debt position; (28) a decision to
incur additional debt; (29) the operational and financial restrictions contained in the Company's debt agreements; (30) the effects of a default under the Company's term loan or revolving credit facility; (31) the Company's ability to generate sufficient cash to
service its outstanding debt; and (32) potential changes in the LIBOR calculation method and the expected phase-out of LIBOR.
OMNOVA Solutions provides greater detail regarding these risks and uncertainties in its 2018 Form 10-K and subsequent filings, which are available online at www.omnova.com and www.sec.gov.
OMNOVA Solutions Inc. is a global innovator of performance-enhancing chemistries and surfaces used in products for a variety of commercial, industrial and residential applications. As a strategic business-to-business supplier, OMNOVA provides The Science
in Better Brands, with emulsion polymers, specialty chemicals, and functional and decorative surfaces that deliver critical performance attributes to top brand-name, end-use products sold around the world. OMNOVA's sales for the trailing twelve months ended
February, 2019, were approximately $760 million. The Company has a global workforce of approximately 1,900 employees. Visit OMNOVA Solutions on the internet at www.omnova.com.
NON-GAAP FINANCIAL MEASURES
This presentation includes certain non-GAAP financial measures as defined by the Securities and Exchange Commission, such as Adjusted Segment Operating Profit, Adjusted Segment EBITDA, Adjusted Income, Adjusted Diluted Earnings Per Share from
Adjusted Income, Adjusted Consolidated EBITDA and Net Leverage Ratio. For a reconciliation to the most directly comparable GAAP financial measures, refer to the Appendix.
2

INVESTOR PRESENTATION | First Quarter 2019 NYSE OMN
About OMNOVA Solutions
› Global technology-based supplier of customized
performance-critical products
› Established in 1999; formerly part of General
Tire/GenCorp and Goodyear
› Deep focus on Research and Development (R&D) and
Innovation across all our businesses
› Diverse end-markets that value innovative solutions
› World Class manufacturing facilities, optimized through
LEAN SixSigma to achieve operational excellence
3

INVESTOR PRESENTATION | First Quarter 2019 NYSE OMN
Our Vision and Values
To be a mid-sized premier global specialties provider delivering innovative, tailored solutions to win leading positions in targeted high value markets.
AgilityWe swiftly and efficiently adapt to
changing environments
We make timely, data-driven decisions
IntegrityOur legal, regulatory and ethical behavior is impeccable
We are candid, transparent and respectful
SafetyWe promote a safety-first culture
PRODUCE PRODUCT SAFELY – and encourage safe working conditions and behaviors
AccountabilityWe own our work and our results
We are committed to development –ourselves and others
OMNOVAVALUES
4

INVESTOR PRESENTATION | First Quarter 2019 NYSE OMN
› More than a century of Transformation and Innovation
Long Heritage as Solutions Provider
5
20181915 1952
CHEMICAL/PLASTICS
DIVISION
1984 1999
THE GOODYEAR TIRE &
RUBBER COMPANY
1898 1941
GOODYEAR CHEMICALS
2001 2010 2015
NEW FLUID
SOLUTIONS
2017
CREOLE
CHEMICALS
*
* Announced September 26, 2018.

INVESTOR PRESENTATION | First Quarter 2019 NYSE OMN
Manufacturing and Technology on Three Continents
OMNOVA Locations
6
● World Headquarters
● Surfaces Manufacturing
● Chemicals Manufacturing
● Sales, Technology and / or
Distribution
Shanghai (Regional HQ)
Rayong, Thailand
London, U.K.
Le Havre, France
Villejust, France
(Regional HQ)
Mumbai, IndiaSingapore
Caojing, China
Ningbo, China
Monroe, NC
Chester, SC
Calhoun, GA
Fitchburg, MA
Auburn, PA
Jeannette, PA
Green Bay, WI Akron, OH (Technology Center)
Mogadore/Akron, OH
Beachwood, OH (Headquarters)
Columbus, MS
Plus Broad Distribution Network
Stafford, TXDubai, UAE
Sintra, Portugal
(Resiquímica)*
* Announced September 26, 2018.
INVESTOR PRESENTATION | First Quarter 2019 NYSE OMN
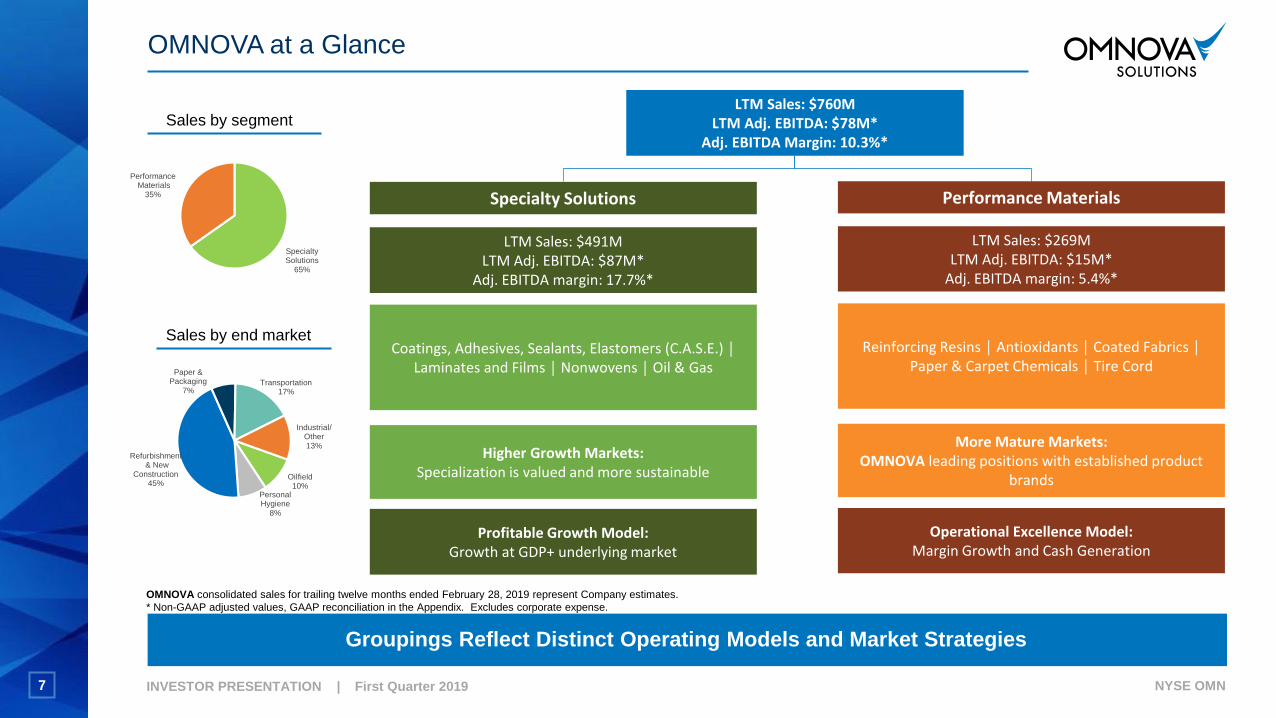
Groupings Reflect Distinct Operating Models and Market Strategies
OMNOVA at a Glance
OMNOVA consolidated sales for trailing twelve months ended February 28, 2019 represent Company estimates.
* Non-GAAP adjusted values, GAAP reconciliation in the Appendix. Excludes corporate expense.
Sales by end market
Sales by segment
Specialty Solutions
Coatings, Adhesives, Sealants, Elastomers (C.A.S.E.) │ Laminates and Films │ Nonwovens │ Oil & Gas
Profitable Growth Model:Growth at GDP+ underlying market
LTM Sales: $491MLTM Adj. EBITDA: $87M*
Adj. EBITDA margin: 17.7%*
Higher Growth Markets:Specialization is valued and more sustainable
LTM Sales: $760MLTM Adj. EBITDA: $78M*
Adj. EBITDA Margin: 10.3%*
Reinforcing Resins │ Antioxidants │ Coated Fabrics │ Paper & Carpet Chemicals │ Tire Cord
Operational Excellence Model:Margin Growth and Cash Generation
LTM Sales: $269MLTM Adj. EBITDA: $15M*
Adj. EBITDA margin: 5.4%*
Performance Materials
More Mature Markets:OMNOVA leading positions with established product
brands
Specialty Solutions
65%
PerformanceMaterials
35%
Oilfield10%
PersonalHygiene
8%
Refurbishment& New
Construction45%
Paper & Packaging
7%Transportation
17%
Industrial/Other13%
7
INVESTOR PRESENTATION | First Quarter 2019 NYSE OMN
0
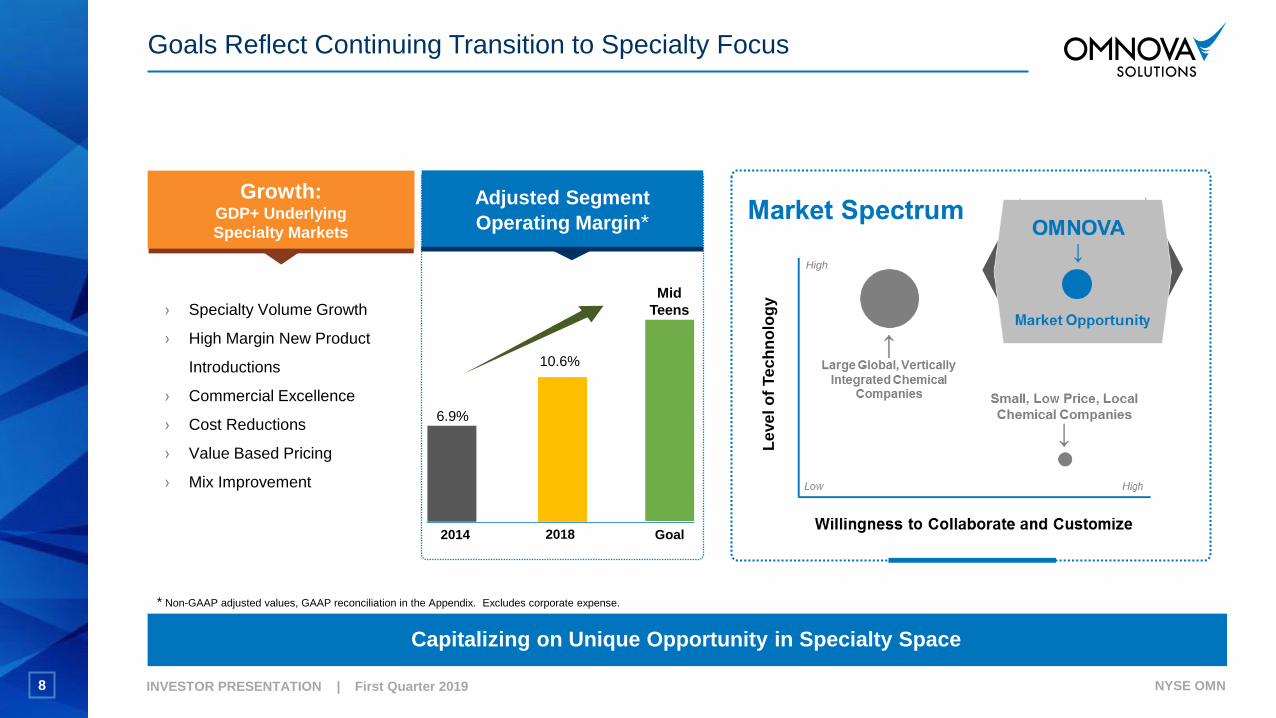
Capitalizing on Unique Opportunity in Specialty Space
Goals Reflect Continuing Transition to Specialty Focus
Growth:GDP+ Underlying
Specialty Markets
› Specialty Volume Growth
› High Margin New Product
Introductions
› Commercial Excellence
› Cost Reductions
› Value Based Pricing
› Mix Improvement
Adjusted Segment
Operating Margin*
Le
ve
l o
f Te
ch
no
log
y
High
2014 Goal2018
6.9%
Mid
Teens
10.6%
* Non-GAAP adjusted values, GAAP reconciliation in the Appendix. Excludes corporate expense.
8
INVESTOR PRESENTATION | First Quarter 2019 NYSE OMN
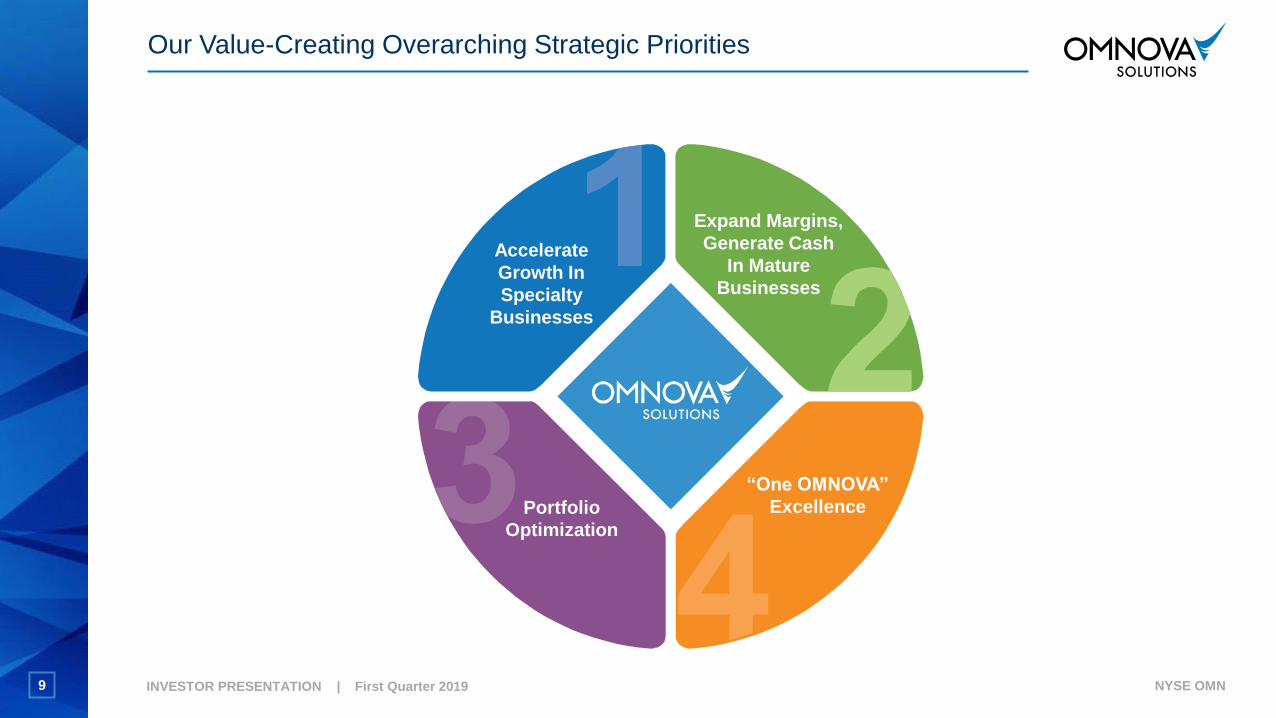
Our Value-Creating Overarching Strategic Priorities
Accelerate
Growth In
Specialty
Businesses
Expand Margins,
Generate Cash
In Mature
Businesses
Portfolio
Optimization
“One OMNOVA”
Excellence
9

INVESTOR PRESENTATION | First Quarter 2019 NYSE OMN
Accelerate Growth in Specialty Businesses
Targeting Specialty Growth Markets
› Higher growth/higher margin businesses
› Significant opportunities to grow share
Strengthening Commercial Excellence
› Integrated sales, marketing and product development
› Cross-selling
› Value based pricing
› Aggressive strategic marketing plans
› Stronger key account value added selling
Strengthening Leadership & Capabilities
› Enhanced organization in place
Strong, Broad-Based Innovation w/ Global Footprint
› Facilities on three continents
› Transformed innovation pipeline
› Tailored solutions
>80% of revenue
targeted from
specialty
businesses
10

INVESTOR PRESENTATION | First Quarter 2019 NYSE OMN
› Targeting robust markets with demand for high performance, high margin products
Common Characteristics: Higher Margin; Large and Growing Markets; Customer Need for Differentiation; Strong OMNOVA Niche Position with Opportunities for Growth
Specialty Growth: Targeted Markets
MARKET
SIZE:*
Coatings Adhesives Sealants Elastomers Laminates Nonwovens Oil & Gas
› Masonry
› Intumescent (fire
resistant)
› Direct-to-Metal
› Primers
› Odor and Stain
Blocking
› Wood Treatment
› Tapes
› Release Coatings
› Adhesives
› Construction
Binders
› Roofing
› Caulking
› Casting
› Cement
› Gaskets
› Foam Sealants
› Concrete
› Transportation
› Industrial
› Consumer
Thermoplastic
Products
› Retail Display
› Cabinets
› Food Service
› Kitchen and Bath
› Recreational Vehicles
› Flooring
› Healthcare
› Commercial Furniture
› Diapers
› Adult Incontinence
› Healthcare
› Wipes
› Transportation
› Filtration
› Drilling
› Cementing
› Fracking
>$25.0B >$20.0B >$5.0B >$10.0B >$5.0B >$25.0B >$5.5B
3 – 4% /yr 4 – 5% /yr 3 – 4% /yr 3 – 5% /yr 2 – 3% /yr 3 – 5% /yr 3 – 5% /yr
C.A.S.E
GROWTH
RATE:**
* Market data based on internal estimates and OMNOVA’s place in the value chain.
** Estimated market growth rate.
11

INVESTOR PRESENTATION | First Quarter 2019 NYSE OMN
› Increased access to specialty markets
Diversifying Chemistries & Geographies
Total OMNOVA
Global Expansion
Total Company
Other Chemistries
SB Latex
Total Company
80%
20%
27%
73%
Pre-2010 2018
87%
11%
2%
24%
11%
87%
15%
2018Pre-2010
Asia
N. America
Europe
61%
Diversifying Chemistries
and Markets
12

INVESTOR PRESENTATION | First Quarter 2019 NYSE OMN
› Transforming the portfolio to be a leading provider of Sustainable, Greener, SMARTer innovative solutions
Targeting Vitality Index >25% at Specialty Margins
New Product Introductions
Voice of the
Customer
Sustainable
Solutions
SMART
Technologies
Disruptive
Innovation
Recently Introduced New Products
Pliotec LEB20 – Unique water-based resin
for exterior masonry paints excellent color
retention, rain resistance, and dirt pick-up
resistance
Pliotec HDT16 – Resin for Superior Direct-to-
Metal and Multi-Surface Coatings
Hydro Pliolite 211 – Base Polymer
Waterborne Intumescent Coatings
GenFlo 3967 – Improved Binder for Sports
Surfaces
OMNAPEL – Hydrophobic Polymer for
Sealants
GenFlo – Binder for Softer Personal
Hygiene Products
SoftWick SF20 – Hydrophilic Surface
Treatment for Nonwovens
surf(x) Matte Luxe - Paint Replacement
Films For Kitchen & Bath Cabinetry
GenFlo FR 2800 – Specialty Flame
Retardant Carpet Binder
Pexorate 530 – Rate of Penetration
Enhancer for Drilling
IF-201L – Dispersant for Well Cementing
13
DECORATIVE
LAMINATES
OIL & GAS

INVESTOR PRESENTATION | First Quarter 2019 NYSE OMN
Expand Margins, Increase Cash Generation in Performance Materials Businesses
Strengthening Customer Relationships
› Value-based pricing
› Capture growth in carpet and non-carpet flooring
› Working capital optimization
Lowering Our Cost Base
› Realigned manufacturing
› SG&A effectiveness and efficiency
Improving Ability to Serve
› New GM & management team
› Selective innovation
Expand and
grow margins
Increase cash generation
to fund specialty growth
Maintain leadership
positions
Exited Commodity Paper in 2018
› Announced closure of Green Bay plant
14

INVESTOR PRESENTATION | First Quarter 2019 NYSE OMN
2018 – 2019 :
› Closure of Green Bay Plant
expected by 2H 2019. $7 – 8 million of segment
operating profit benefit expected by 2H 2020
› Exited Commodity Paper
by 4Q 2018
› Dedicated Sales Resources
for Antioxidants, Reinforcing Resins, and Coated Fabrics
› Selective Innovation and Value Pricing
› Cost Savings and Operational Efficiency
2015 – 2017:
› Realigned Manufacturing Footprint
through facility closures, capacity
reductions, and manufacturing
consolidations
› Restructured SG&A Company-Wide
by appointing new leadership and
reorganizing regional and
commercial structure
Continued Focus on Cost Savings & Efficiency
Performance Materials Manufacturing Realignment and SG&A Restructuring
15

INVESTOR PRESENTATION | First Quarter 2019 NYSE OMN
Portfolio Optimization
M&A
1. Close-in
› Emulsion polymers
› Consolidation opportunities
2. Adjacencies
› Market driven
C.A.S.E.
Nonwovens
Oil & gas
Diversification
› Products
› Markets
› Geographies
› Customers
Strategic Alliances
› Lower investment risk
› Accelerate innovation
› Expand portfolio
› Geographic expansion
Balanced
specialty portfolio
Sustainable earnings
growth
› Joint development &
licensing agreements
› Geographic swaps/tolling
› Manufacturing and/or full
function JVs
16

INVESTOR PRESENTATION | First Quarter 2019 NYSE OMN
Strategic Alliances and M&A to Accelerate Specialty Growth
C.A.S.E., Nonwovens, Oil & Gas
Emulsion Polymers› N.A. SB consolidation› Specialty acrylics
New Polymers Selected Additives
M&A
Close-In
Adjacencies
› Joint development
agreements
› License technology
› Geographic swaps / tolling
› License cost-saving
production technology
› Use contract
manufacturing
› Manufacturing JVs
› License 3rd party
technology
› Full function JVs
› Joint distribution
BENEFITS:
› Profitable growth
and minimal risk
› Accelerates
innovation
› Expands
portfolio
› Low investment
for geographic
expansion
TechnologyTechnology
TechnologyOperations &
Supply Chain
TechnologyCommercial
STRATEGIC ALLIANCES
TARGET MARKETS
17

INVESTOR PRESENTATION | First Quarter 2019 NYSE OMN
“One OMNOVA” Excellence
Excellence Focus
› Sales
› Innovation
› Marketing
› Operations
Reporting Segment Alignment with
Business Model
› Specialty Solutions
› Performance Materials
Reduced Complexity
› Common processes, tools and systems
› Reduced SG&A >$3M /yr
› Organizational redesign
› Cost competitive manufacturing
Agile, strong
foundation to drive
profitable growth
18
INVESTOR PRESENTATION | First Quarter 2019 NYSE OMN
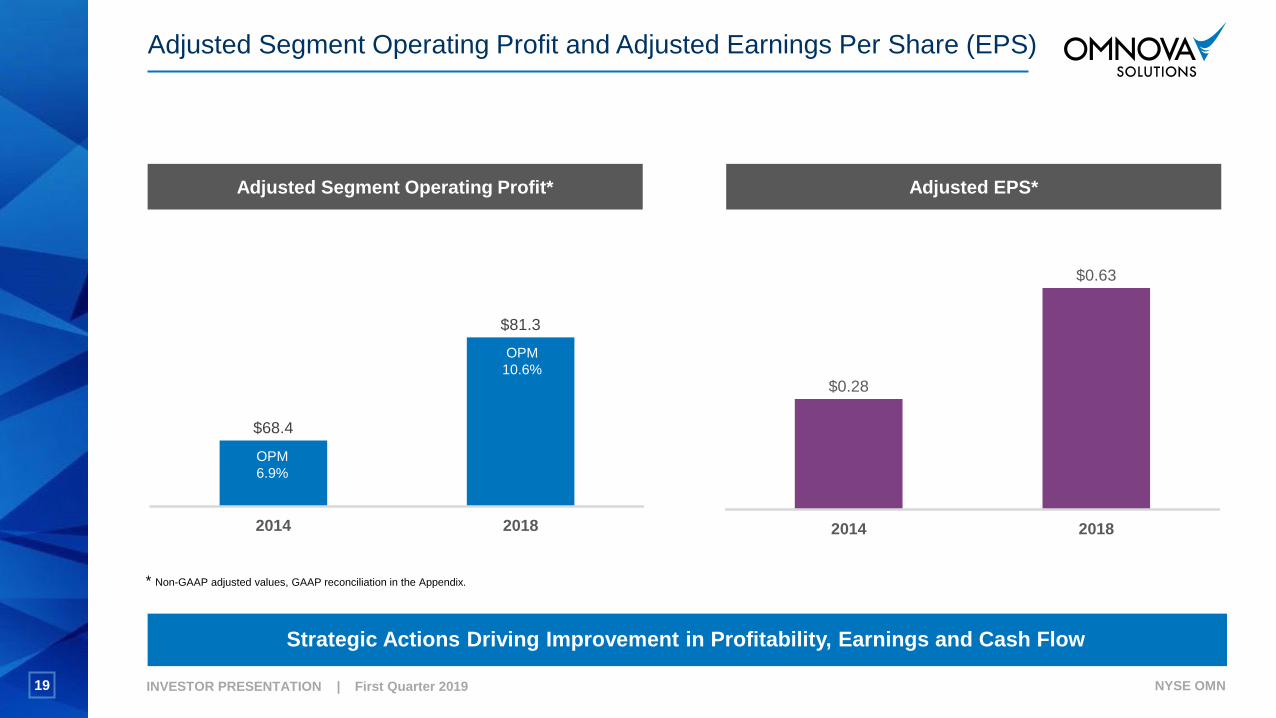
Strategic Actions Driving Improvement in Profitability, Earnings and Cash Flow
Adjusted Segment Operating Profit and Adjusted Earnings Per Share (EPS)
$68.4
$81.3
2014 2018
$0.28
$0.63
2014 2018
PM
8.9%
OPM
6.9%
Adjusted Segment Operating Profit* Adjusted EPS*
* Non-GAAP adjusted values, GAAP reconciliation in the Appendix.
OPM
10.6%
19

INVESTOR PRESENTATION | First Quarter 2019 NYSE OMN
Record of Cash Generation and De-Leveraging
Volume growth
› Gaining traction on specialty growth
Refinancing completed in Q1 2018
Reduced gross debt by ~$140M since 2011
Increasing earnings and consistent cash flow driving
down adjusted net leverage
Strong cash conversion driven by:
› Improved earnings
› Low maintenance capex requirement
› Working capital management
› No US cash taxes in near term (Federal N.O.L. $65.4M
as of 1Q 2019)
3.8 3.9 3.6 3.2 3.2
0.0
2.0
4.0
6.0
11/2014 11/2015 11/2016 11/2017 11/2018
OMNOVA Net Adjusted Leverage (TTM)*
3.3
* Non-GAAP adjusted values, GAAP reconciliation in the Appendix.
** Includes debt and cash used in acquisition of Resiquimica in September 2018.
(14.8)
19.725.3
22.732.9
-20.0
0.0
20.0
40.0
2014 2015 2016 2017 2018
Cash Flow from Operations less CAPEX
1.1%
6.7%
1.0%
5.1%
16.1%
2.4% 2.0%
8.0%
1.8%
0%
5%
10%
15%
20%
Q12017
Q22017
Q33017
Q42017
Q12018
Q22018
Q32018
Q42018
Q12019
Specialty Sales Growth Due to Volume YOY
20
**
INVESTOR PRESENTATION | First Quarter 2019 NYSE OMN
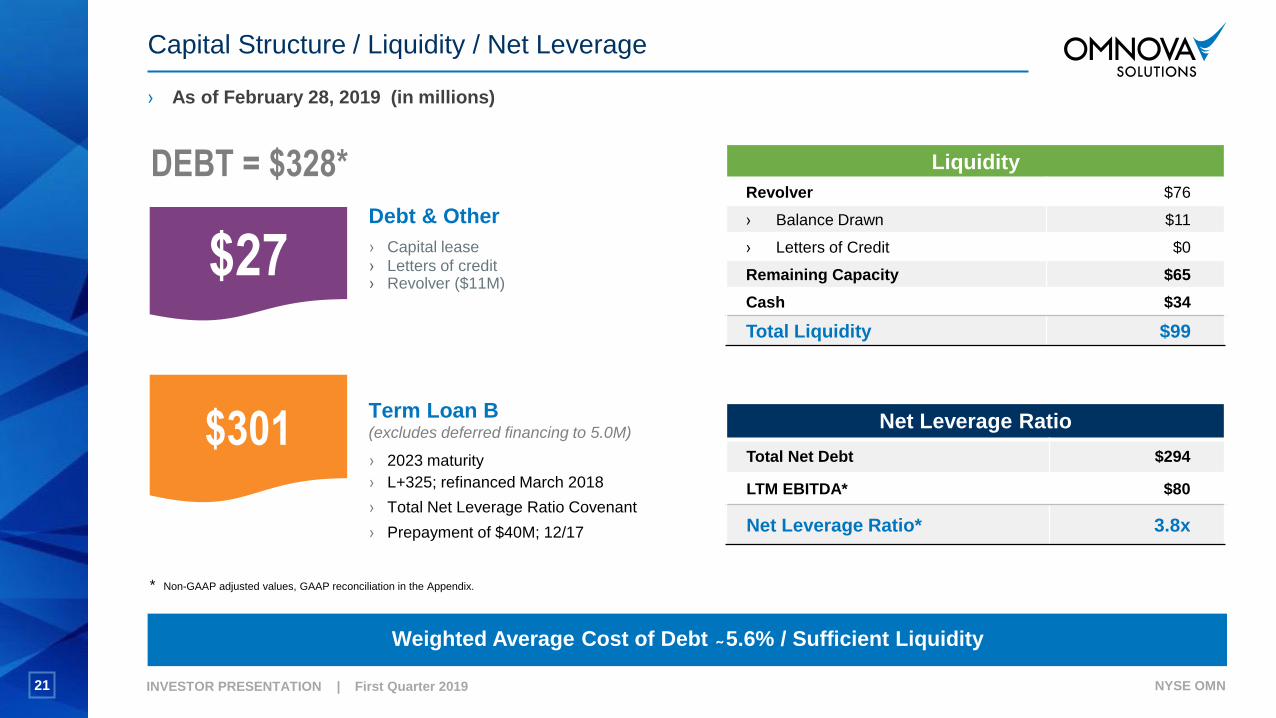
› As of February 28, 2019 (in millions)
Capital Structure / Liquidity / Net Leverage
$301
DEBT = $328*
Debt & Other
› Capital lease
› Letters of credit› Revolver ($11M)
Term Loan B (excludes deferred financing to 5.0M)
› 2023 maturity
› L+325; refinanced March 2018
› Total Net Leverage Ratio Covenant
› Prepayment of $40M; 12/17
$27
Liquidity
Revolver $76
› Balance Drawn $11
› Letters of Credit $0
Remaining Capacity $65
Cash $34
Total Liquidity $99
Net Leverage Ratio
Total Net Debt $294
LTM EBITDA* $80
Net Leverage Ratio* 3.8x
Weighted Average Cost of Debt ̴ 5.6% / Sufficient Liquidity
21
* Non-GAAP adjusted values, GAAP reconciliation in the Appendix.

INVESTOR PRESENTATION | First Quarter 2019 NYSE OMN
Goal: Become a Premier Global Innovative Specialty Solutions Provider
Specialty Growth
› Marketing, Innovation and Sales Excellence
› First to market with differentiated, high margin new products
› Key account growth
› Geographic expansion
Continued focus on operational excellence, delivered margin expansion, mix optimization and increased cash generation
Transform the business through organic growth and portfolio optimization in specialties
One OMNOVA to reduce complexity and lead as an agile, innovative specialty solutions provider
GDP+Growth versus underlying
specialty markets
>15%Targeted Segment
Operating Profit Margin
>80%Specialty Markets as
a % of total revenue
22

Appendix
› SB Raw Material Costs and Performance Features
› Non-GAAP Financial Measures
› Reconciliations

INVESTOR PRESENTATION | First Quarter 2019 NYSE OMN
With the recent price drop, SB Latex maintains an Advantaged Position
SB Raw Material Costs and Performance Features Contribute to Greater Cost-in-Use Advantage
24

INVESTOR PRESENTATION | First Quarter 2019 NYSE OMN
Appendix – Non-GAAP Financial Measures
This presentation includes Adjusted Segment Operating Profit, Adjusted Segment EBITDA, Adjusted Income from Continuing Operations Before Income Taxes, Adjusted Consolidated EBITDA and other financial measures which are Non-GAAP financial measures as defined by the Securities and Exchange Commission.
OMNOVA’s Adjusted Segment Operating Profit is calculated as Segment Operating Profit (Loss) less restructuring and severance expenses, asset impairments and other items. Adjusted Segment EBITDA is calculated as Adjusted Segment Operating Profit less depreciation and amortization expense less accelerated depreciation.
OMNOVA’s Adjusted Income from Continuing Operations Before Income Taxes is calculated as Adjusted Segment Operating Profit less corporate expenses, interest, restructuring and severance, asset impairments and other items. OMNOVA’s Adjusted EBITDA is calculated as Adjusted Income from Continuing Operations Before Income Taxes less interest expense less debt premium and depreciation and amortization expense less accelerated depreciation.
Adjusted Segment Operating Profit and Adjusted Segment and/or Consolidated EBITDA and the other financial measures (collectively, the “Non-GAAP financial measures”) are not calculated in the same manner by all companies and, accordingly, are not necessarily comparable to similarly titled measures of other companies and may not be appropriate measures for comparing performance relative to other companies. The Non-GAAP financial measures should not be construed as indicators of the Company’s operating performance or liquidity and should not be considered in isolation from or as a substitute for net income (loss), cash flows from operations or cash flow data, which are all prepared in accordance with GAAP. The Non-GAAP financial measures are not intended to represent, and should not be considered more meaningful than or as an alternative to, measures of operating performance as determined in accordance with GAAP. Management believes that presenting this information is useful to investors because these measures are commonly used as analytical indicators to evaluate performance and by management to allocate resources. Set forth in the appendices are the reconciliations of these Non-GAAP financial measures to their most directly comparable GAAP financial measure.
All appendix results are pro forma reflecting continuing business excluding the sale of the global wallcovering business.
25

INVESTOR PRESENTATION | First Quarter 2019 NYSE OMN
Appendix 1 ̶ Reconciliation of Reported Segment Sales and Operating Profit to Net Sales and Net Income
26
Three Months Ended
February 28, (In millions) 2019 2018
Net Sales:
Specialty Solutions $ 112.7 $ 109.2
Performance Materials 56.2 69.5
Total Net Sales 168.9 178.7
Segment Operating Profit:
Specialty Solutions 9.3 13.6
Performance Materials (2.8 ) 2.1
Interest expense (5.0 ) (5.1 )
Corporate expenses (6.9 ) (8.4 )
Income (Loss) Before Income Taxes (5.4 ) 2.2
Income tax (benefit) expense (.8 ) (5.1 )
Net Income (Loss) $ (4.6 ) $ 7.3
Depreciation and amortization $ 8.0 $ 7.2
Capital expenditures $ 7.4 $ 3.2

INVESTOR PRESENTATION | First Quarter 2019 NYSE OMN
Appendix 2 ̶ OMNOVA Consolidated Adjusted EBITDA
27
Year Ended November 30, LTM*
(Dollars in millions except per share data) 2015 2016 2017 2018 2019
Sales $ 838.0 $ 759.9 $ 783.1 $ 769.8 $ 760.0
Unadjusted Segment Operating Profit $ 34.8 $ 68.3 $ 47.3 $ 60.9 $ 51.6
Segment Excluded Items
Restructuring and severance 5.8 3.5 2.3 1.8 1.8
Asset impairment, facility closure costs and other 20.0 7.2 33.9 15.4 16.0
Accelerated depreciation 5.8 3.0 — 1.2 1.8
Operational improvements costs 5.0 (.4) — — —
Environmental costs 3.0 .3 — .2 (.1)
Acquisition and integration related expense — 1.1 (2.0) 1.8 1.5
Vacation policy change — (2.8) — — —
Subtotal for Segment Excluded Items 39.6 11.9 34.2 20.4 21.0
Adjusted Segment Operating Profit $ 74.4 $ 80.2 $ 81.5 $ 81.3 $ 72.6
Adjusted Segment Operating Profit as a % of Sales 8.9 % 10.6 % 10.4 % 10.6 % 9.6 %

INVESTOR PRESENTATION | First Quarter 2019 NYSE OMN
Appendix 2 ̶ OMNOVA Consolidated Adjusted EBITDA (continued)
28
Year Ended November 30, LTM*
(Dollars in millions except per share data) 2015 2016 2017 2018 2019
Corporate Expense (27.6) (33.7) (29.9) (27.1) (25.5)
Interest expense (28.3) (24.7) (21.5) (19.3) (19.2)
Corporate Excluded Items
Restructuring and severance .1 4.9 2.9 .9 .3
Asset impairment, facility closure costs and other .6 — 1.8 .1 .1
Operational improvements costs .4 — — — —
Gain on sale of assets — — — (.9) (.9)
Debt issuance costs write-off and additional
interest .6 4.9 — .8 —
Pension settlement — — .4 — —
Corporate headquarters relocation costs — (.2) — — —
Other financing costs 1.0 — — — —
Shareholder activist costs 1.9 — — — —
Acquisition and integration related expense .4 .9 .3 2.2 2.1
Vacation accrual adjustment — (.6) — — —
Subtotal for Management Excluded Items 5.0 9.9 5.4 3.1 1.6
Adjusted Income from Continuing Operations
before Income Taxes $ 23.5 $ 31.7 $ 35.5 $ 38.0 $ 29.5
Tax Expense ** (7.0) (9.5) (10.7) (9.5) (7.4)
Adjusted Income From Continuing Operations $ 16.6 $ 22.2 $ 24.8 $ 28.5 $ 22.1
Adjusted Diluted Earnings Per Share from
Adjusted
Income from Continuing Operations *** $ 0.36 $ 0.50 $ 0.56 $ 0.63 $ 0.49

INVESTOR PRESENTATION | First Quarter 2019 NYSE OMN
Appendix 2 ̶ OMNOVA Consolidated Adjusted EBITDA (continued)
29
Year Ended November 30, LTM*
(Dollars in millions except per share data) 2015 2016 2017 2018 2019
Adjusted Income from Continuing Operations
before Income Taxes $ 23.5 $ 31.7 $ 35.5 $ 38.0 $ 29.5
Unallocated corporate interest (excluding debt
premium) 27.3 22.7 21.5 19.3 19.2
Adjusted Consolidated EBIT 50.8 54.4 57.0 57.3 48.7
Depreciation and amortization (excluding
accelerated depreciation) 28.2 27.6 27.9 29.0 29.2
Adjusted Consolidated EBITDA $ 79.0 $ 82.0 $ 84.9 $ 86.3 $ 77.9
Adjusted Consolidated EBITDA as a % of Sales 9.4 % 10.8 % 10.8 % 11.2 % 10.3 %
Consolidated Capital Expenditures $ 24.0 $ 25.6 $ 25.1 $ 23.8 $ 28.0
Net Leverage
Total Short and Long Term Debt**** 356.7 366.0 361.8 329.7 327.7
Less Cash and Restricted Cash (44.9) (72.0) (88.0) (54.1) (34.1)
Net Debt 311.8 294.0 273.8 275.6 293.6
Net Leverage Ratio***** 3.9 x 3.6 x 3.2 x 3.2 x 3.8 x
* LTM = Last Twelve Months as of February 28, 2019
** Tax rate is based on the Company’s estimated normalized annual effective tax rate
*** Adjusted EPS is calculated using Diluted Shares Outstanding at the end of the period
**** LTM excludes OID and deferred financing fees of $7.6M for Q1 2019
***** The above calculation is not intended to be used for purposes of calculating debt covenant compliance

INVESTOR PRESENTATION | First Quarter 2019 NYSE OMN
Appendix 3 ̶ OMNOVA Trailing Twelve Months Ended February 28, 2019
30
(In millions except per share data)
Specialty
Solutions
Performance
Materials
Combined
Segments Corporate Consolidated
Net Sales $ 491.2 $ 268.8 $ 760.0 $ — $ 760.0
Segment Operating Profit / Corporate Expense $ 66.3 $ (14.7) $ 51.6 $ (25.5) $ 26.1
Interest expense — — — (19.2) (19.2)
Income (Loss) Before Income Taxes $ 66.3 $ (14.7) $ 51.6 $ (44.7) $ 6.9
Management Excluded Items
Restructuring and severance — 1.8 1.8 .3 2.1
Accelerated depreciation .1 1.7 1.8 — 1.8
Asset impairment, facility closure costs and other 1.1 14.9 16.0 .1 16.1
Environmental costs — (.1) (.1) — (.1)
Gain on sale of assets — — — (.9) (.9)
Acquisition and integration related expense 1.3 .2 1.5 2.1 3.6
Subtotal for management excluded items 2.5 18.5 21.0 1.6 22.6
Adjusted Segment Operating Profit / Corporate
Expense Before Income Taxes $ 68.8 $ 3.8 $ 72.6 $ (43.1) $ 29.5
Income tax expense (7.4)
Adjusted Income (Loss) $ 22.1
Adjusted Diluted Earnings Per Share From Adjusted Income $ 0.49

INVESTOR PRESENTATION | First Quarter 2019 NYSE OMN
Appendix 3 ̶ OMNOVA Trailing Twelve Months Ended February 28, 2019 (continued)
31
* The above calculation is not intended to be used for purposes of calculating debt covenant compliance.
(In millions except per share data)
Specialty
Solutions
Performance
Materials
Combined
Segments Corporate Consolidated
Adjusted Segment Operating Profit as a % of Sales 14.0 % 1.4 % 9.6 %
Segment / Corporate Capital Expenditures $ 19.4 $ 7.3 $ 26.7 $ 1.3 $ 28.0
Adjusted Segment Operating Profit / Corporate
Expense Before Income Taxes $ 68.8 $ 3.8 $ 72.6 $ (43.1) $ 29.5
Unallocated corporate interest — — — 19.2 19.2
Segment / Consolidated Adjusted EBIT 68.8 3.8 72.6 (23.9) 48.7
Depreciation and amortization 18.3 10.7 29.0 .2 29.2
Segment / Consolidated Adjusted EBITDA $ 87.1 $ 14.5 $ 101.6 $ (23.7) $ 77.9
Adjusted EBITDA as a % of sales 17.7 % 5.4 % 13.4 % 10.3 %
Net Leverage
Total short and long-term debt (excluding OID and deferred financing fees of $7.6M). $ 327.7
Less cash (34.1)
Net Debt (Debt less Cash) $ 293.6
Net Leverage Ratio* 3.8x

Investor Relations Contacts
Paul DeSantis, Senior Vice President, Chief Financial Officer & Treasurer
Frank Esposito, Corporate Secretary and Investor Relations
(216) 682-7003
World Headquarters
25435 Harvard Road
Beachwood, OH 44122
(216) 682-7000
www.omnova.com
INVESTOR PRESENTATION
|