Global Imbalances— 2017 External Sector...
28
International Monetary Fund Global Imbalances— 2017 External Sector Report Gustavo Adler and Luis Cubeddu IMF Research Department Bruegel Brussels, September 26, 2017
Transcript of Global Imbalances— 2017 External Sector...
International Monetary Fund
Global Imbalances—2017 External Sector Report
Gustavo Adler and Luis CubedduIMF Research Department
BruegelBrussels, September 26, 2017
I. Recent developmentsII. Assessing external positionsIII. External assessments for 2016IV. Outlook, Risks and PoliciesV. Analytical themes
2
Roadmap
I. Recent developments
3
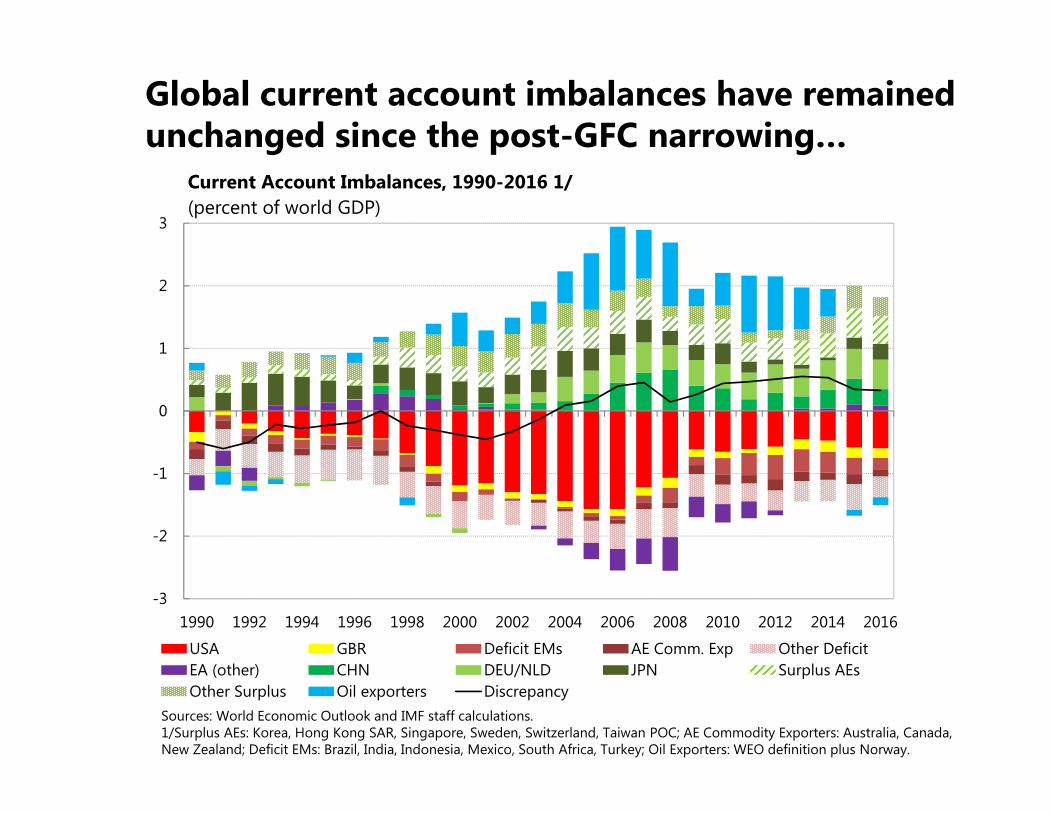
Global current account imbalances have remained unchanged since the post-GFC narrowing…
-3
-2
-1
0
1
2
3
1990 1992 1994 1996 1998 2000 2002 2004 2006 2008 2010 2012 2014 2016
Current Account Imbalances, 1990-2016 1/ (percent of world GDP)
USA GBR Deficit EMs AE Comm. Exp Other DeficitEA (other) CHN DEU/NLD JPN Surplus AEsOther Surplus Oil exporters Discrepancy
Sources: World Economic Outlook and IMF staff calculations.1/Surplus AEs: Korea, Hong Kong SAR, Singapore, Sweden, Switzerland, Taiwan POC; AE Commodity Exporters: Australia, Canada, New Zealand; Deficit EMs: Brazil, India, Indonesia, Mexico, South Africa, Turkey; Oil Exporters: WEO definition plus Norway.
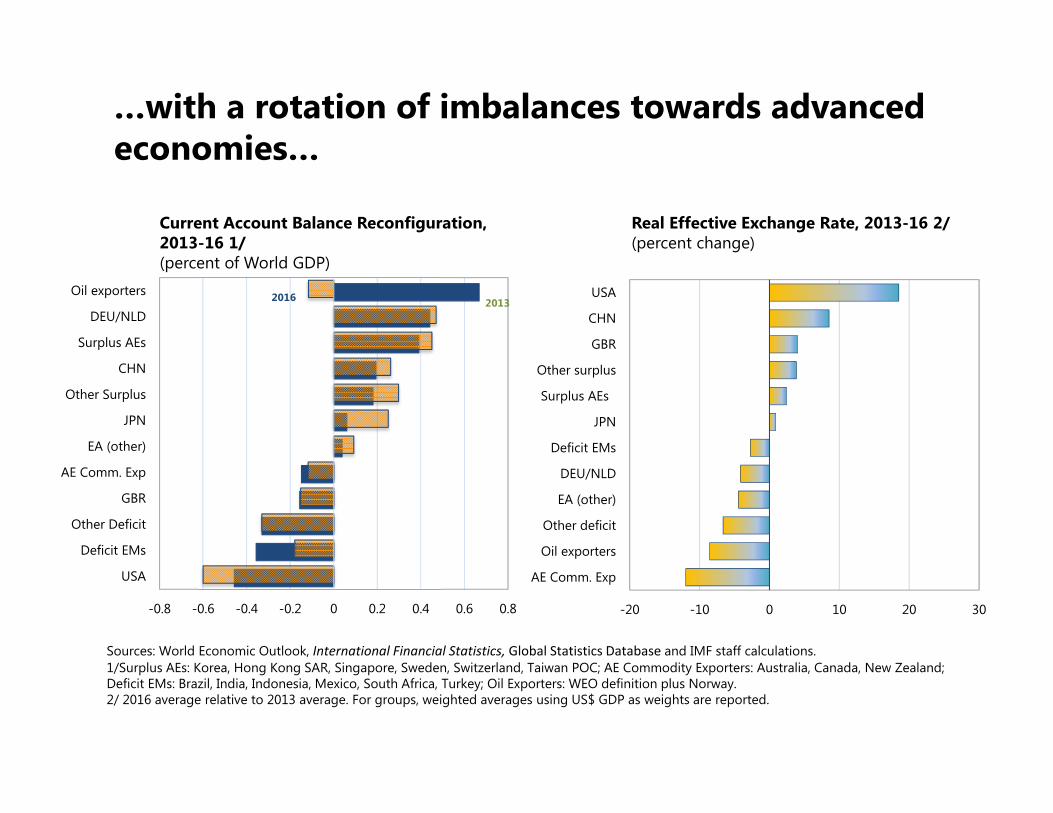
-20 -10 0 10 20 30
AE Comm. Exp
Oil exporters
Other deficit
EA (other)
DEU/NLD
Deficit EMs
JPN
Surplus AEs
Other surplus
GBR
CHN
USA
-0.8 -0.6 -0.4 -0.2 0 0.2 0.4 0.6 0.8
USA
Deficit EMs
Other Deficit
GBR
AE Comm. Exp
EA (other)
JPN
Other Surplus
CHN
Surplus AEs
DEU/NLD
Oil exporters 2016 2013
Current Account Balance Reconfiguration, 2013-16 1/(percent of World GDP)
Real Effective Exchange Rate, 2013-16 2/(percent change)
Sources: World Economic Outlook, International Financial Statistics, Global Statistics Database and IMF staff calculations.1/Surplus AEs: Korea, Hong Kong SAR, Singapore, Sweden, Switzerland, Taiwan POC; AE Commodity Exporters: Australia, Canada, New Zealand; Deficit EMs: Brazil, India, Indonesia, Mexico, South Africa, Turkey; Oil Exporters: WEO definition plus Norway.2/ 2016 average relative to 2013 average. For groups, weighted averages using US$ GDP as weights are reported.
…with a rotation of imbalances towards advanced economies…
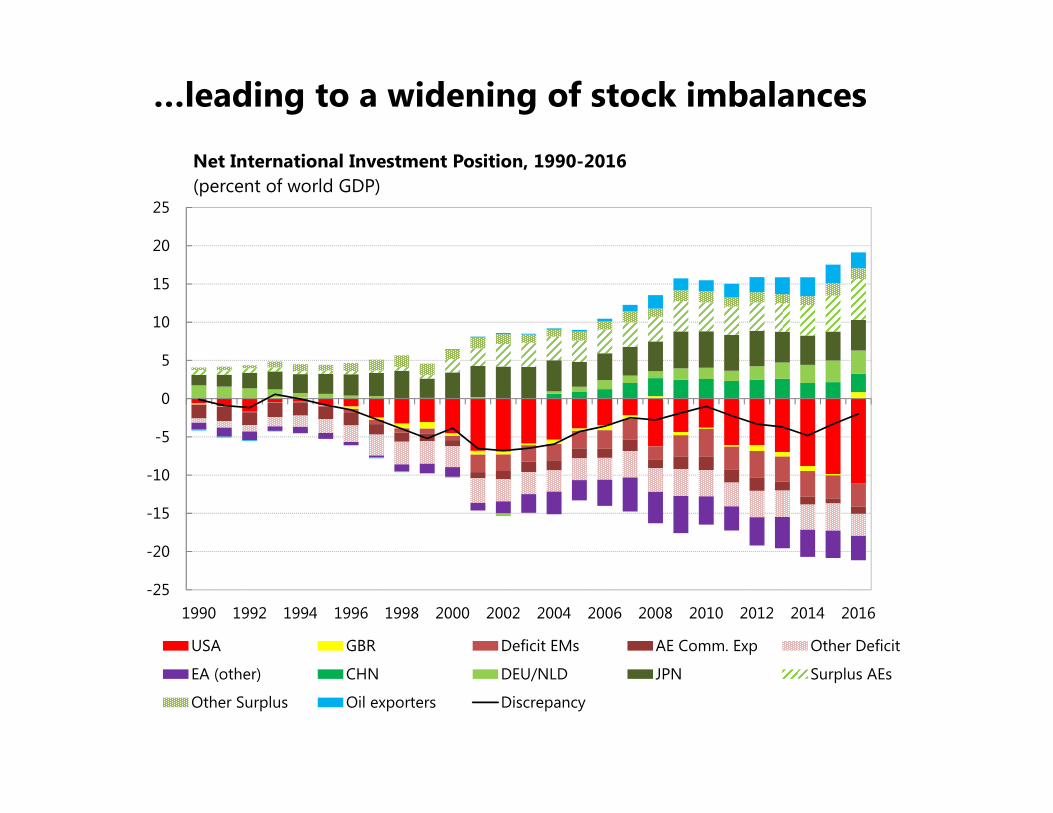
…leading to a widening of stock imbalances
-25
-20
-15
-10
-5
0
5
10
15
20
25
1990 1992 1994 1996 1998 2000 2002 2004 2006 2008 2010 2012 2014 2016
Net International Investment Position, 1990-2016 (percent of world GDP)
USA GBR Deficit EMs AE Comm. Exp Other Deficit
EA (other) CHN DEU/NLD JPN Surplus AEs
Other Surplus Oil exporters Discrepancy
II. Assessing external positions
7
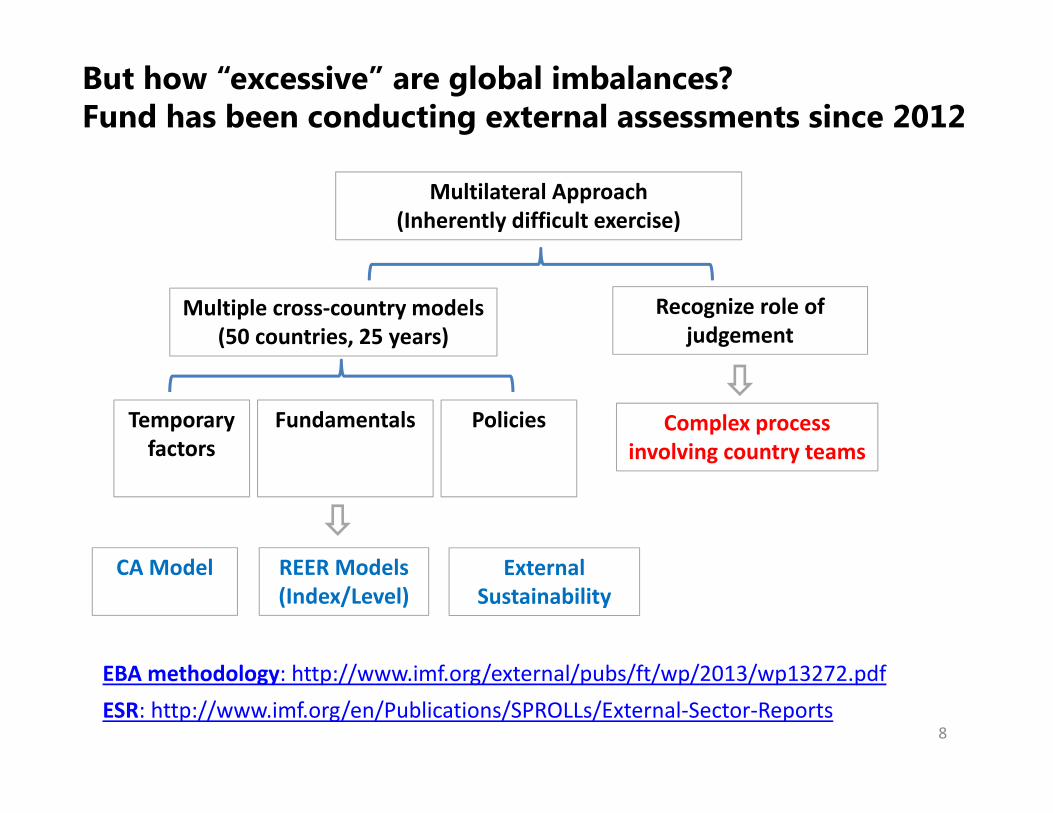
But how “excessive” are global imbalances? Fund has been conducting external assessments since 2012
8
Multilateral Approach(Inherently difficult exercise)
CA Model
Temporary factors
Multiple cross-country models (50 countries, 25 years)
Recognize role of judgement
External Sustainability
REER Models(Index/Level)
Policies Complex process involving country teams
Fundamentals
EBA methodology: http://www.imf.org/external/pubs/ft/wp/2013/wp13272.pdfESR: http://www.imf.org/en/Publications/SPROLLs/External-Sector-Reports
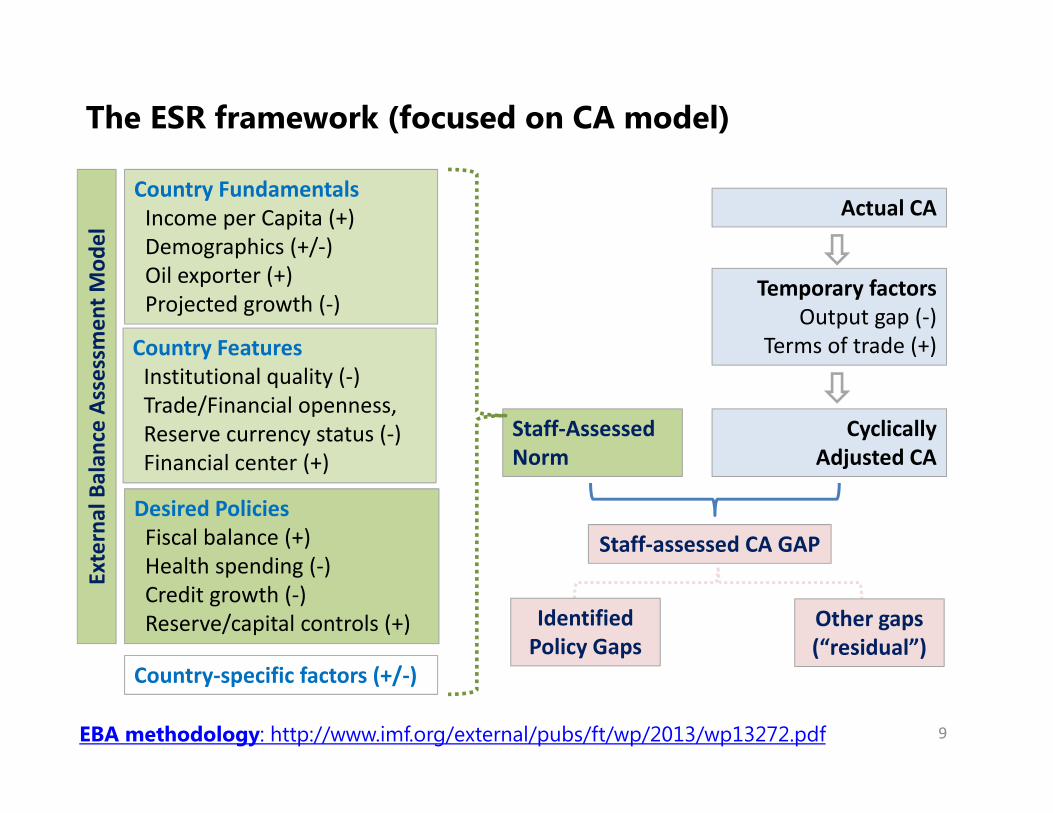
The ESR framework (focused on CA model)
9
Country FundamentalsIncome per Capita (+)Demographics (+/-)Oil exporter (+)Projected growth (-)
Desired PoliciesFiscal balance (+)Health spending (-)Credit growth (-)Reserve/capital controls (+)
Staff-Assessed Norm
Actual CA
Temporary factorsOutput gap (-)
Terms of trade (+)
Cyclically Adjusted CA
Staff-assessed CA GAP
Identified Policy Gaps
Other gaps (“residual”)
Country-specific factors (+/-)
Exte
rnal
Bal
ance
Ass
essm
ent M
odel
EBA methodology: http://www.imf.org/external/pubs/ft/wp/2013/wp13272.pdf
Country FeaturesInstitutional quality (-)Trade/Financial openness,Reserve currency status (-)Financial center (+)
III. External Assessments for 2016
10
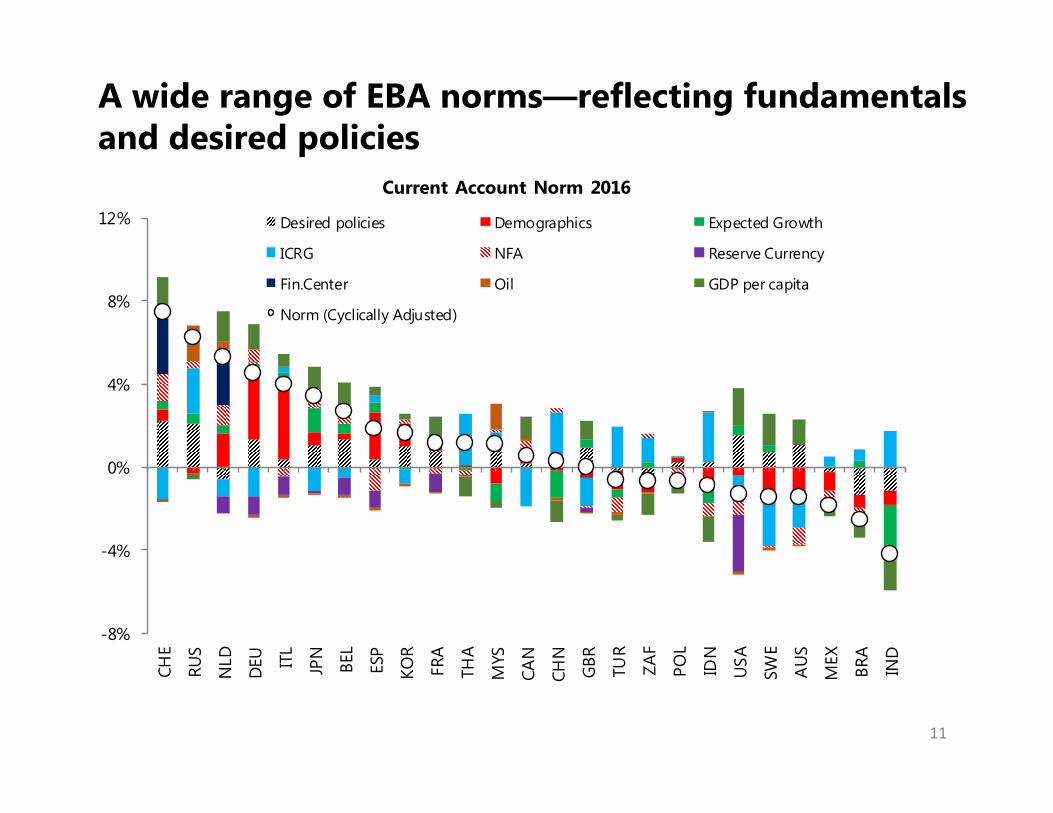
A wide range of EBA norms—reflecting fundamentals and desired policies
11
-8%
-4%
0%
4%
8%
12%
CHE
RUS
NLD
DEU IT
L
JPN
BEL
ESP
KOR
FRA
THA
MYS
CAN
CHN
GBR TU
R
ZAF
POL
IDN
USA
SWE
AU
S
MEX
BRA
IND
Current Account Norm 2016
Desired policies Demographics Expected Growth
ICRG NFA Reserve Currency
Fin.Center Oil GDP per capita
Norm (Cyclically Adjusted)
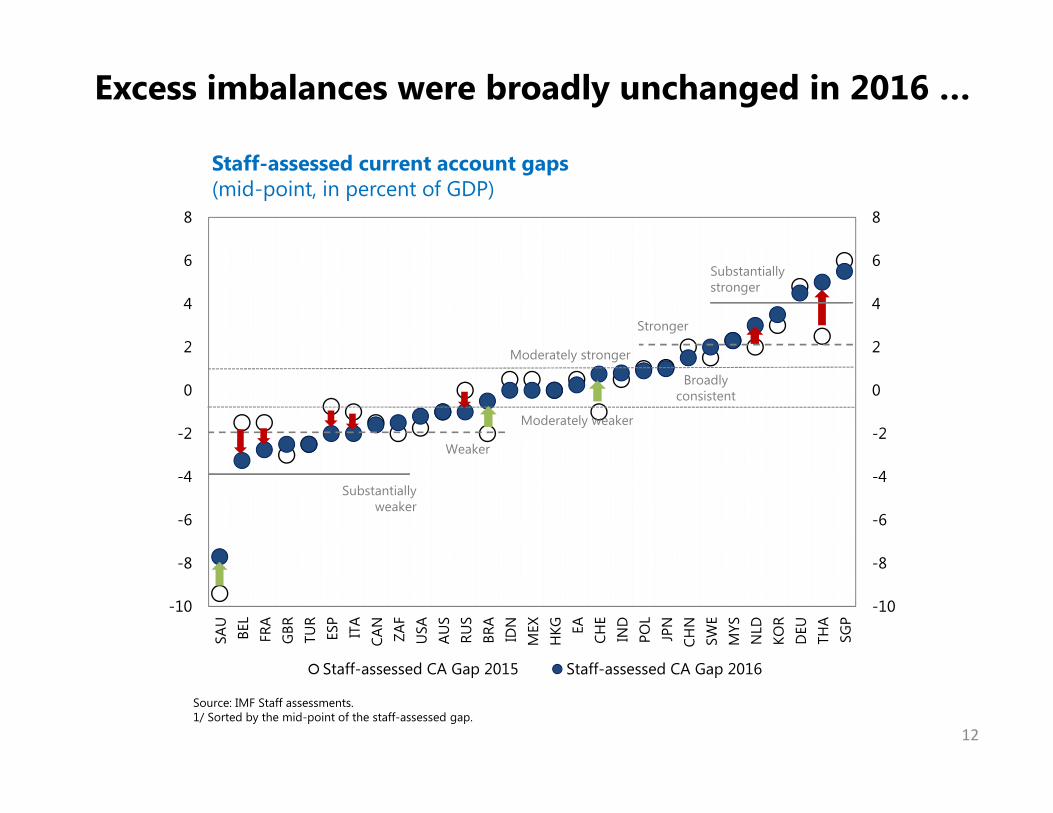
Excess imbalances were broadly unchanged in 2016 …
Staff-assessed current account gaps(mid-point, in percent of GDP)
Source: IMF Staff assessments.1/ Sorted by the mid-point of the staff-assessed gap.
-10
-8
-6
-4
-2
0
2
4
6
8
-10
-8
-6
-4
-2
0
2
4
6
8SA
UBE
LFR
AG
BR TUR
ESP
ITA
CAN
ZAF
USA
AUS
RUS
BRA
IDN
MEX
HKG EA
CHE
IND
POL
JPN
CHN
SWE
MYS
NLD
KOR
DEU
THA
SGP
Staff-assessed CA Gap 2015 Staff-assessed CA Gap 2016
Weaker
Moderately weaker
Broadlyconsistent
Moderately stronger
Stronger
Substantiallystronger
Substantiallyweaker
12

CHNJPN
EA
USA
GBR
DEU
NLD
ESPITA
BEL
FRA
SGP
KOR
SWE
HKG
CHE
AUS
CAN
THA
MYS
POL IND
IDNMEX
RUSBRA
ZAF TUR
-4
-3
-2
-1
0
1
2
3
4
5
6
-20 -15 -10 -5 0 5 10 15 20
Staff-assessed REER GAP(in percent)
Staf
f-as
sess
ed C
A G
AP
(in p
erce
nt o
f GD
P)
OvervaluedUndervaluedWea
ker
Stro
nger
Staff-assessed Current Account and REER Gaps, 2016
Source: IMF Staff assessments.1/ Midpoints of REER and CA Gaps. Shaded area represents general range for "broadly in line" assessment.
Staff-assessed REER gaps in line with CA gaps for most cases.
13
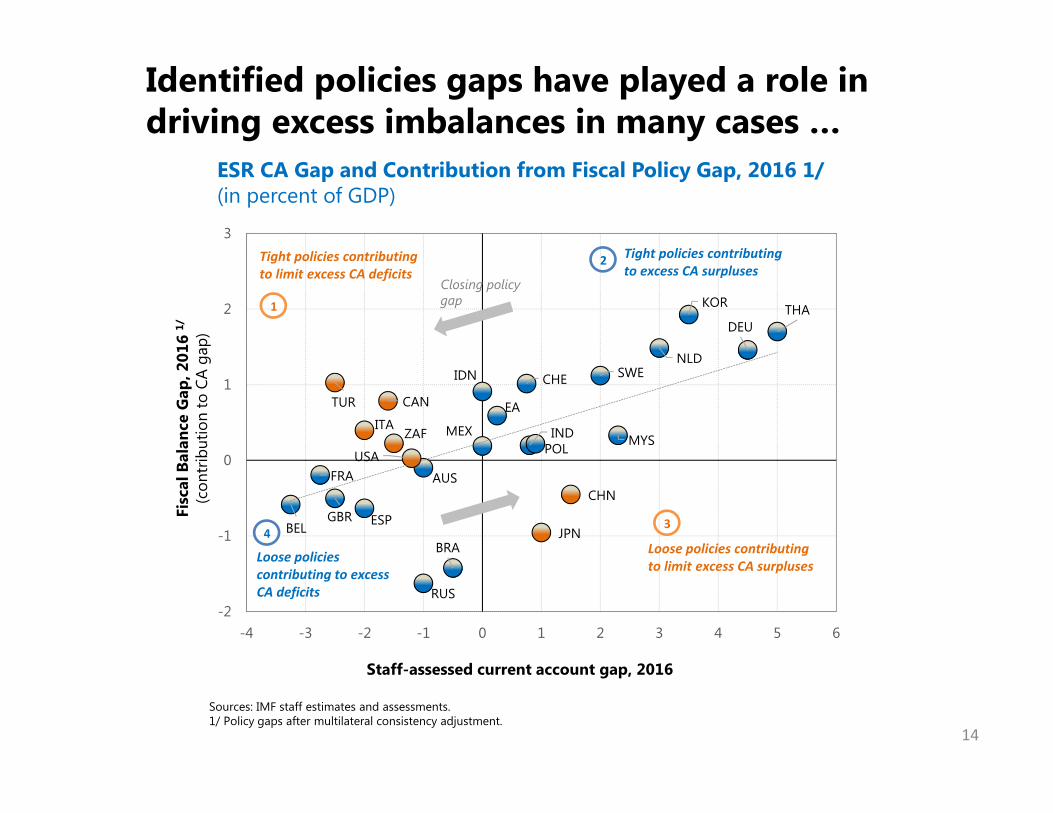
Identified policies gaps have played a role in driving excess imbalances in many cases …
ESR CA Gap and Contribution from Fiscal Policy Gap, 2016 1/ (in percent of GDP)
14
GBR
TUR
ZAF
BRA
USA
CAN
BEL
FRA AUS
CHE
ITA
ESP
RUS
EA
MEX
IDN
INDPOL
JPN
SWE
CHN
NLD
THA
MYS
KOR
DEU
-2
-1
0
1
2
3
-4 -3 -2 -1 0 1 2 3 4 5 6
Staff-assessed current account gap, 2016
Fisc
al B
alan
ce G
ap, 2
016
1/
(con
trib
utio
n to
CA
gap)
Tight policies contributing to excess CA surpluses
Loose policies contributing to excess CA deficits
Tight policies contributing to limit excess CA deficits
Loose policies contributing to limit excess CA surpluses
1
2
43
Closing policy gap
Sources: IMF staff estimates and assessments.1/ Policy gaps after multilateral consistency adjustment.
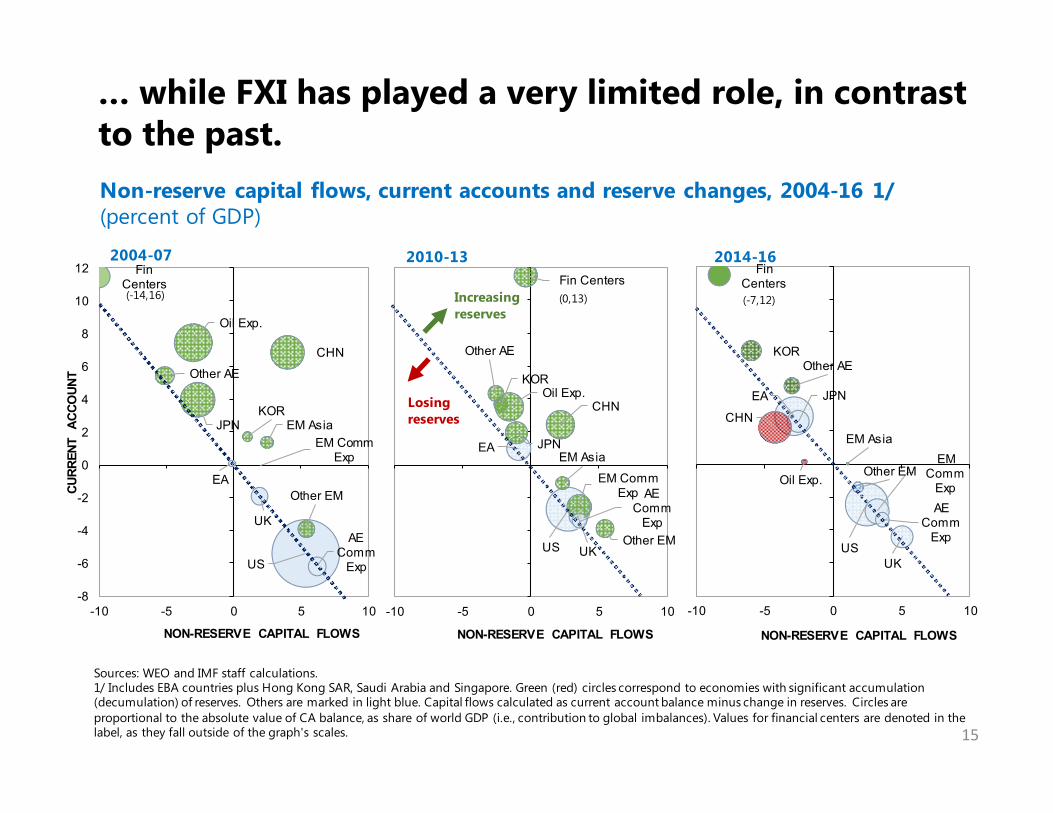
… while FXI has played a very limited role, in contrast to the past.
US
EA JPN
UK
CHN
KOROil Exp.
EM Comm Exp
EM Asia
Other EM
AE Comm
Exp
Other AE
Fin Centers
-8
-6
-4
-2
0
2
4
6
8
10
12
-10 -5 0 5 10
NON-RESERVE CAPITAL FLOWS
(0,13)Increasing reserves
Losing reserves
US
EA JPN
UK
CHN
KOR
Oil Exp.
EM Comm
Exp
EM Asia
Other EM
AE Comm
Exp
Other AE
Fin Centers
-8
-6
-4
-2
0
2
4
6
8
10
12
-10 -5 0 5 10
NON-RESERVE CAPITAL FLOWS
(-7,12)
2010-13 2014-16
Non-reserve capital flows, current accounts and reserve changes, 2004-16 1/(percent of GDP)
US
EA
JPN
UK
CHN
KOR
Oil Exp.
EM Comm Exp
EM Asia
Other EM
AE Comm
Exp
Other AE
Fin Centers
-8
-6
-4
-2
0
2
4
6
8
10
12
-10 -5 0 5 10
CURR
ENT
ACCO
UNT
NON-RESERVE CAPITAL FLOWS
(-14,16)
2004-07
Sources: WEO and IMF staff calculations.1/ Includes EBA countries plus Hong Kong SAR, Saudi Arabia and Singapore. Green (red) circles correspond to economies with significant accumulation (decumulation) of reserves. Others are marked in light blue. Capital flows calculated as current account balance minus change in reserves. Circles are proportional to the absolute value of CA balance, as share of world GDP (i.e., contribution to global imbalances). Values for financial centers are denoted in the label, as they fall outside of the graph's scales. 15
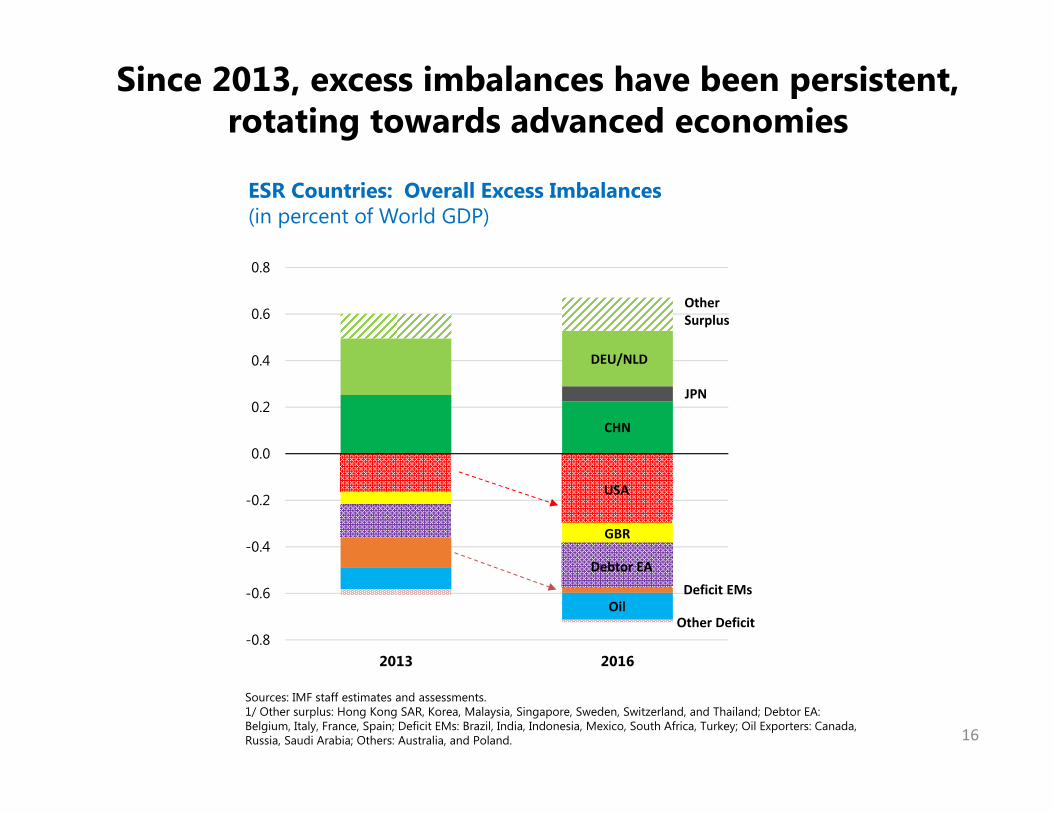
-0.8
-0.6
-0.4
-0.2
0.0
0.2
0.4
0.6
0.8
2013 2016
USA
GBR
Debtor EA
Deficit EMsOil
CHN
DEU/NLD
JPN
Other Surplus
Other Deficit
Sources: IMF staff estimates and assessments.1/ Other surplus: Hong Kong SAR, Korea, Malaysia, Singapore, Sweden, Switzerland, and Thailand; Debtor EA: Belgium, Italy, France, Spain; Deficit EMs: Brazil, India, Indonesia, Mexico, South Africa, Turkey; Oil Exporters: Canada, Russia, Saudi Arabia; Others: Australia, and Poland.
ESR Countries: Overall Excess Imbalances (in percent of World GDP)
Since 2013, excess imbalances have been persistent, rotating towards advanced economies
16
IV. Outlook, Risks and Policies
17
Going forward, the projected persistence of flow imbalances will further widen stock positions …
Selected ESR Economies. Current Account and NIIP, 2002-21
-6
-3
0
3
6
9
12
15
2006 2008 2010 2012 2014 2016 2018 2020
United States Japan GermanyChina Other creditors
Current Account Balance, 2006-21(percent of GDP)
-25
-20
-15
-10
-5
0
5
10
15
20
25
2002 2004 2006 2008 2010 2012 2014 2016 2018 2020USA GBR Deficit EMsAE Comm. Exp Other Deficit EA (other)CHN DEU/NLD JPN
Projected
Sources: World Economic Outlook and IMF staff calculations.1/Surplus AEs: Korea, Hong Kong SAR, Singapore, Sweden, Switzerland, Taiwan POC; AE Commodity Exporters: Australia, Canada, New Zealand; Deficit EMs: Brazil, India, Indonesia, Mexico, South Africa, Turkey; Oil Exporters: WEO definition plus Norway.
Net International Investment Position, 2002-21 1/(percent of world GDP)
18
Sources: World Economic Outlook and IMF staff calculations.1/ Dots correspond to the CA balance if gaps are closed.2/ Other creditors: weighted average of key oil exporters and financial centers (Russia, Saudi Arabia, Hong Kong SAR, Singapore and Switzerland).
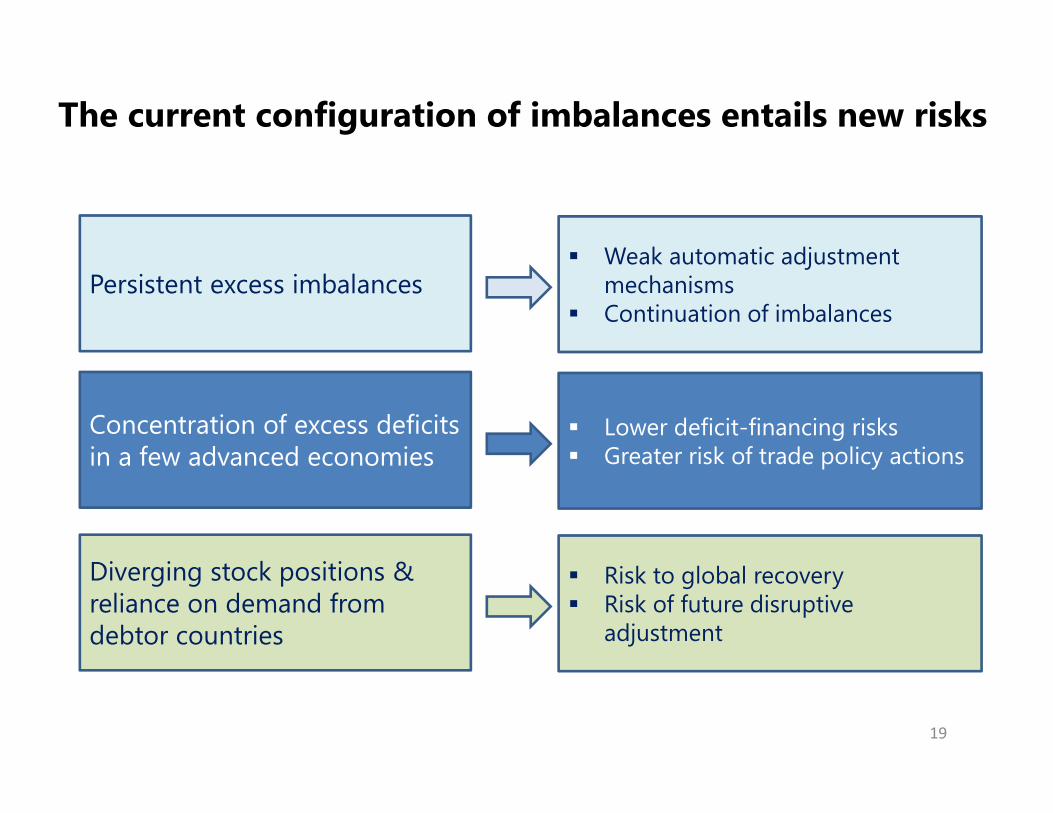
The current configuration of imbalances entails new risks
19
Persistent excess imbalances Weak automatic adjustment
mechanisms Continuation of imbalances
Concentration of excess deficits in a few advanced economies
Lower deficit-financing risks Greater risk of trade policy actions
Diverging stock positions & reliance on demand from debtor countries
Risk to global recovery Risk of future disruptive
adjustment
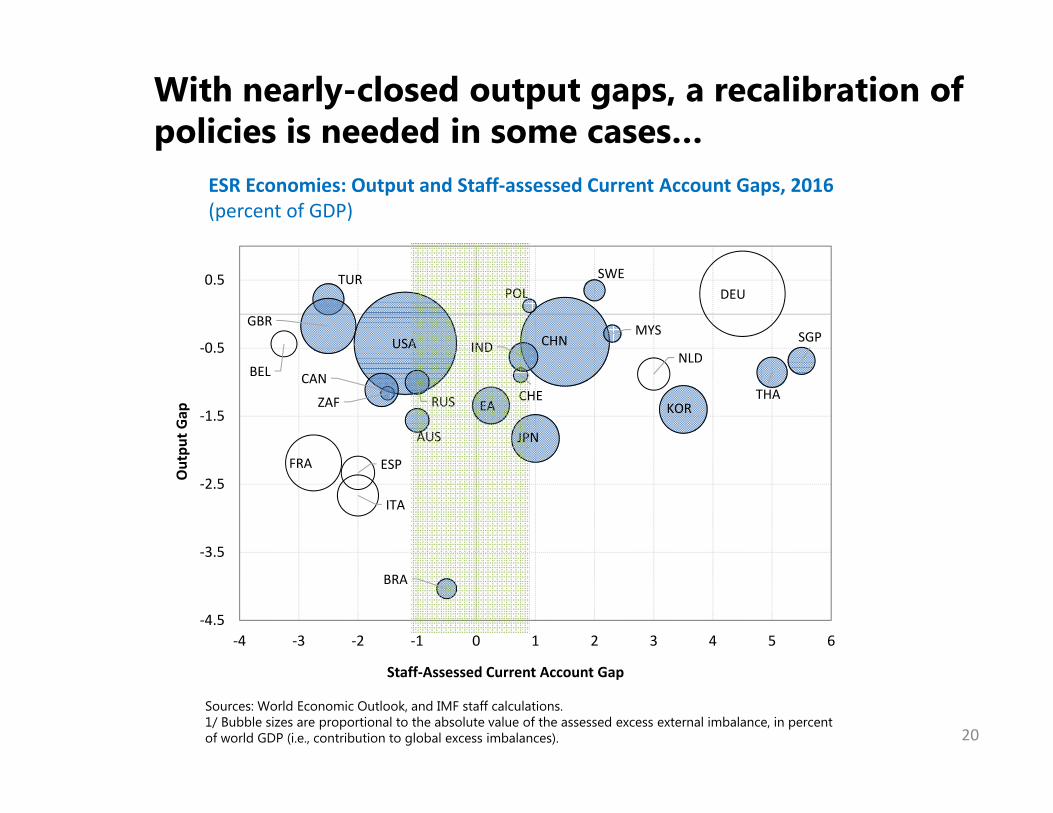
With nearly-closed output gaps, a recalibration of policies is needed in some cases…
BEL
ITA
JPN
USA
AUS
CHN
FRA
KOR
MYS
POL
RUSZAF
SWE
CHE THA
TUR
BRA
CAN
EA
DEU
INDNLD
ESP
GBRSGP
-4.5
-3.5
-2.5
-1.5
-0.5
0.5
-4 -3 -2 -1 0 1 2 3 4 5 6
Out
put G
ap
Staff-Assessed Current Account Gap
ESR Economies: Output and Staff-assessed Current Account Gaps, 2016(percent of GDP)
Sources: World Economic Outlook, and IMF staff calculations. 1/ Bubble sizes are proportional to the absolute value of the assessed excess external imbalance, in percent of world GDP (i.e., contribution to global excess imbalances). 20
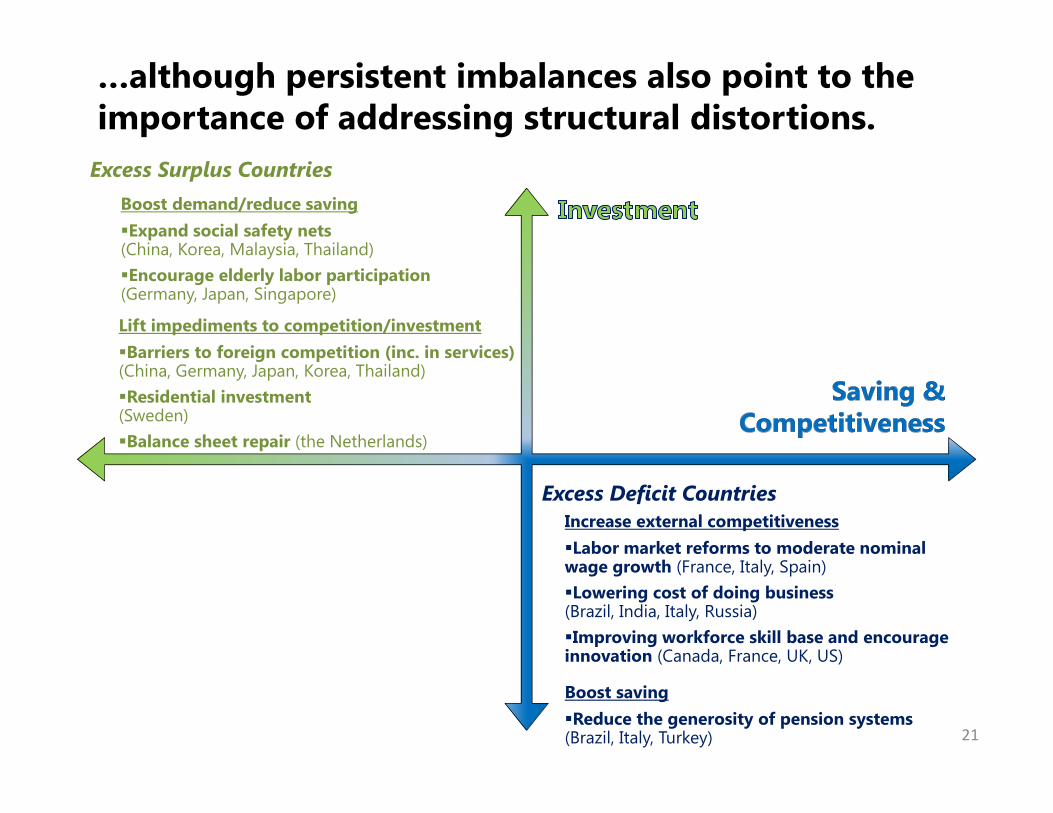
…although persistent imbalances also point to the importance of addressing structural distortions.
Excess Surplus Countries
Excess Deficit Countries
Boost demand/reduce savingExpand social safety nets (China, Korea, Malaysia, Thailand)Encourage elderly labor participation (Germany, Japan, Singapore)
Lift impediments to competition/investmentBarriers to foreign competition (inc. in services)(China, Germany, Japan, Korea, Thailand)Residential investment(Sweden)Balance sheet repair (the Netherlands)
Increase external competitivenessLabor market reforms to moderate nominal wage growth (France, Italy, Spain)Lowering cost of doing business (Brazil, India, Italy, Russia)Improving workforce skill base and encourage innovation (Canada, France, UK, US)
Boost savingReduce the generosity of pension systems(Brazil, Italy, Turkey) 21
V. Analytical themes
22
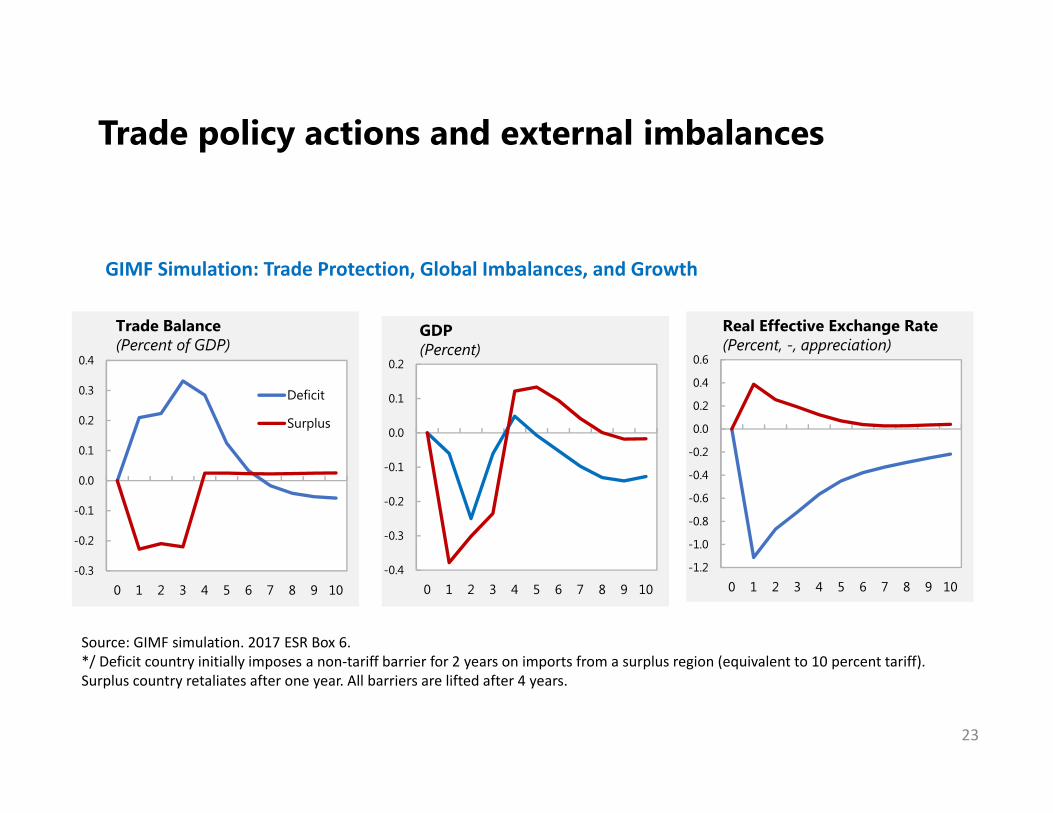
Trade policy actions and external imbalances
GIMF Simulation: Trade Protection, Global Imbalances, and Growth
23
-0.3
-0.2
-0.1
0.0
0.1
0.2
0.3
0.4
0 1 2 3 4 5 6 7 8 9 10
Deficit
Surplus
Trade Balance(Percent of GDP)
-0.4
-0.3
-0.2
-0.1
0.0
0.1
0.2
0 1 2 3 4 5 6 7 8 9 10
GDP(Percent)
-1.2
-1.0
-0.8
-0.6
-0.4
-0.2
0.0
0.2
0.4
0.6
0 1 2 3 4 5 6 7 8 9 10
Real Effective Exchange Rate(Percent, -, appreciation)
Source: GIMF simulation. 2017 ESR Box 6.*/ Deficit country initially imposes a non-tariff barrier for 2 years on imports from a surplus region (equivalent to 10 percent tariff). Surplus country retaliates after one year. All barriers are lifted after 4 years.
24
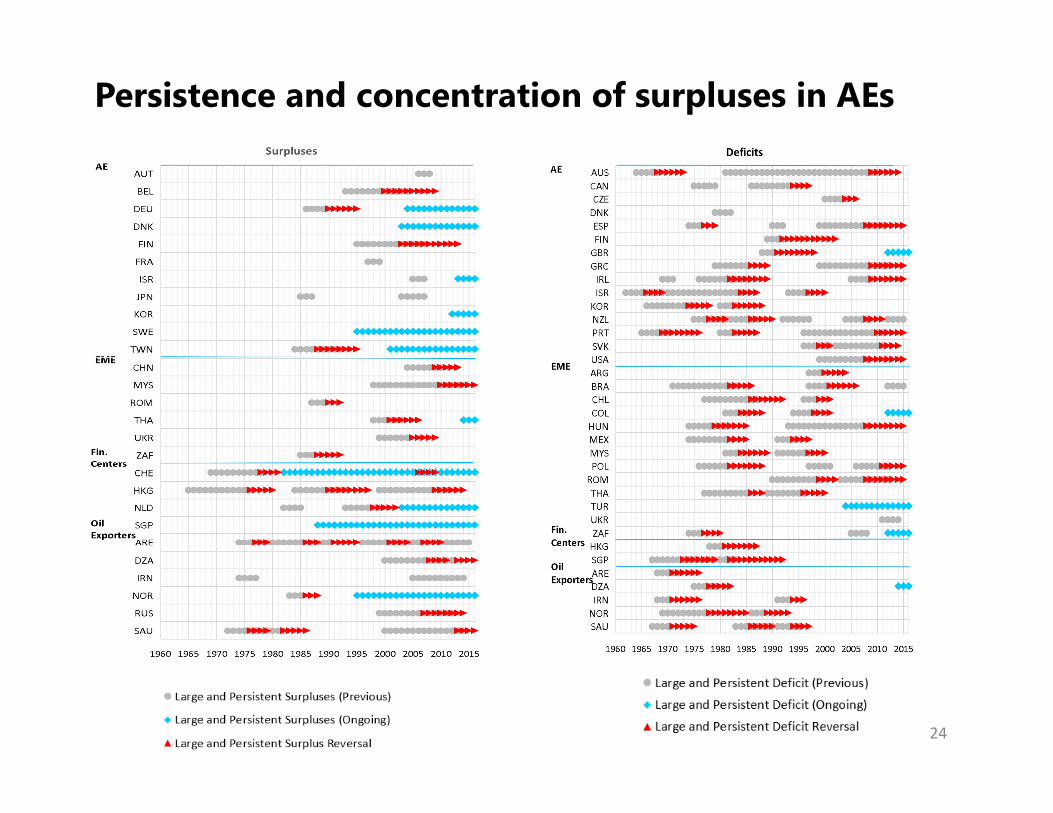
Persistence and concentration of surpluses in AEs
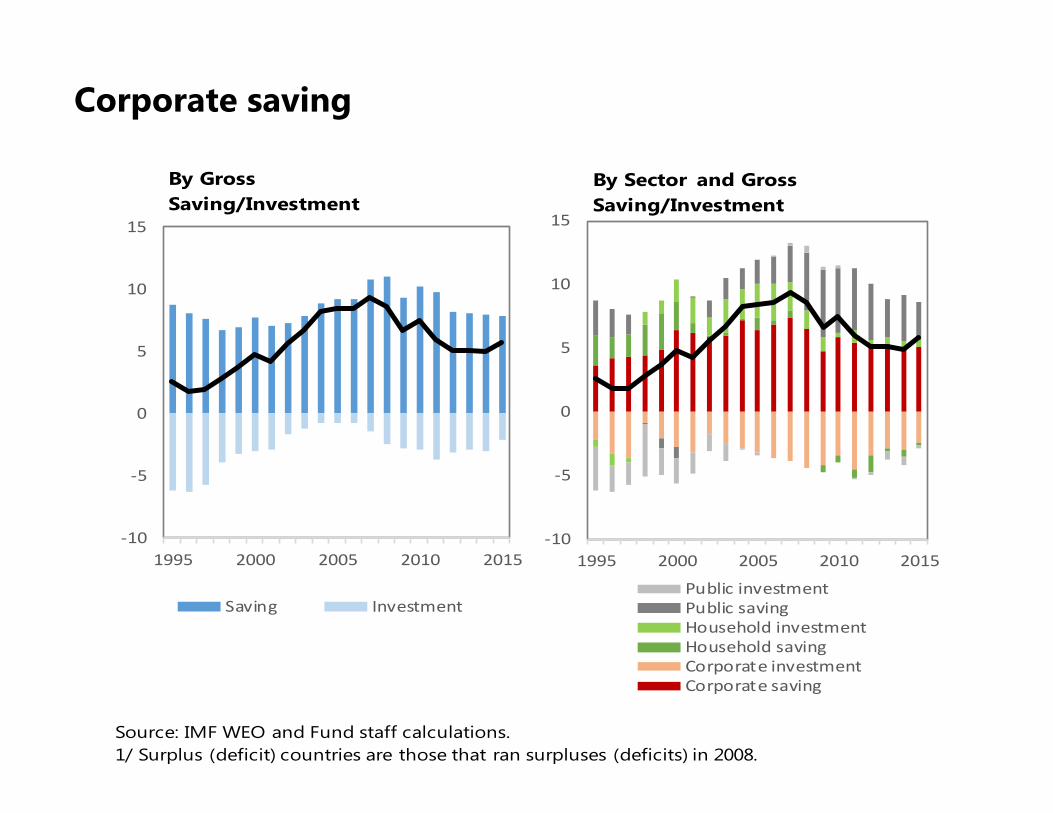
Corporate saving
25
-10
-5
0
5
10
15
1995 2000 2005 2010 2015
Saving Investment
-10
-5
0
5
10
15
1995 2000 2005 2010 2015
Public investmentPublic savingHousehold investmentHousehold savingCorporate investmentCorporate saving
By Gross Saving/Investment
By Sector and GrossSaving/Investment
Source: IMF WEO and Fund staff calculations.1/ Surplus (deficit) countries are those that ran surpluses (deficits) in 2008.
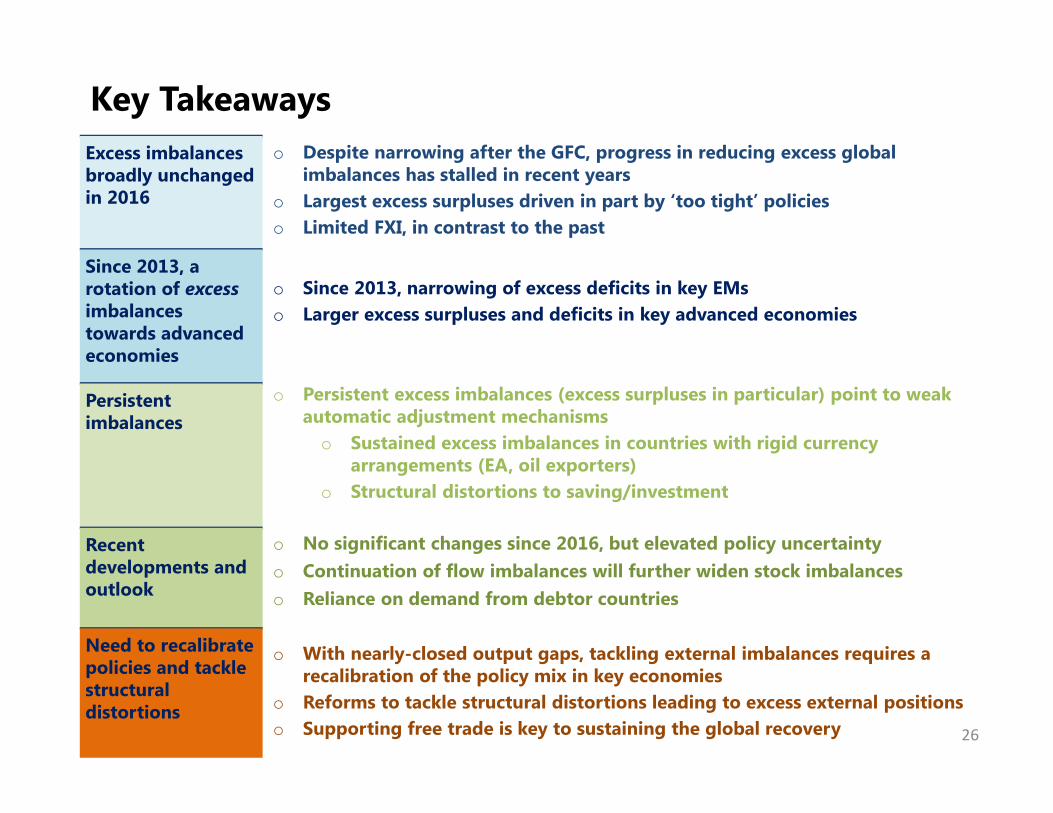
Key TakeawaysExcess imbalances broadly unchanged in 2016
Since 2013, a rotation of excessimbalances towards advanced economies
Persistent imbalances
Recent developments and outlook
Need to recalibrate policies and tackle structural distortions
o Despite narrowing after the GFC, progress in reducing excess global imbalances has stalled in recent years
o Largest excess surpluses driven in part by ‘too tight’ policieso Limited FXI, in contrast to the past
o Since 2013, narrowing of excess deficits in key EMso Larger excess surpluses and deficits in key advanced economies
o With nearly-closed output gaps, tackling external imbalances requires a recalibration of the policy mix in key economies
o Reforms to tackle structural distortions leading to excess external positionso Supporting free trade is key to sustaining the global recovery
o No significant changes since 2016, but elevated policy uncertaintyo Continuation of flow imbalances will further widen stock imbalanceso Reliance on demand from debtor countries
o Persistent excess imbalances (excess surpluses in particular) point to weak automatic adjustment mechanismso Sustained excess imbalances in countries with rigid currency
arrangements (EA, oil exporters)o Structural distortions to saving/investment
26
Some useful links
2017 External Sector Reporthttp://www.imf.org/en/Publications/Policy-Papers/Issues/2017/07/27/2017-
external-sector-report
“Global Imbalances: Avoiding a Tragedy of the Commons” (blog)https://blogs.imf.org/2017/07/28/global-imbalances-avoiding-a-tragedy-of-
the-commons/
“Assessing Global Imbalances: The Nuts and Bolts” (blog)https://blogs.imf.org/2017/06/26/assessing-global-imbalances-the-nuts-and-
bolts/
EBA Methodology (working paper)http://www.imf.org/external/pubs/ft/wp/2013/wp13272.pdf

International Monetary Fund
Global Imbalances—2017 External Sector Report
Gustavo Adler and Luis CubedduIMF Research Department
BruegelBrussels, September 26, 2017