GLOBAL FOREST LAND-USE CHANGE FROM 1990 TO 2010: …
14
GLOBAL FOREST LAND-USE CHANGE FROM 1990 TO 2010: AN UPDATE TO A GLOBAL REMOTE SENSING SURVEY OF FORESTS Forest Resources Assessment Working Paper 187
Transcript of GLOBAL FOREST LAND-USE CHANGE FROM 1990 TO 2010: …
GLOBAL FOREST LAND- USE CHANGE FROM 1990 TO 2010: AN UPDATE TO A GLOBAL REMOTE SENSING SURVEY OF FORESTS
Forest Resources Assessment Working Paper 187
The designations employed and the presentation of material in this information product do not imply the expression of any opinion whatsoever on the part of the Food and Agriculture Organization of the United Nations (FAO) concerning the legal or development status of any country, territory, city or area or of its authorities, or concerning the delimitation of its frontiers or boundaries. The mention of specific companies or products of manufacturers, whether or not these have been patented, does not imply that these have been endorsed or recommended by FAO in preference to others of a similar nature that are not mentioned.
The views expressed in this information product are those of the author(s) and do not necessarily reflect the views or policies of FAO.
© FAO, 2017
FAO encourages the use, reproduction and dissemination of material in this information product. Except where otherwise indicated, material may be copied, downloaded and printed for private study, research and teaching purposes, or for use in non-commercial products or services, provided that appropriate acknowledgement of FAO as the source and copyright holder is given and that FAO’s endorsement of users’ views, products or services is not implied in any way.
All requests for translation and adaptation rights, and for resale and other commercial use rights should be made via www.fao.org/contact-us/licence-request or addressed to [email protected].
FAO information products are available on the FAO website (www.fao.org/publications) and can be purchased through [email protected].
FOOD AND AGRICULTURE ORGANIZATION OF THE UNITED NATIONS Rome, 2017
Global forest land- use change from 1990 to 2010:
an update to a global remote sensing
survey of forests
Authors:D’Annunzio, RémiLindquist, Erik J.
MacDicken, Kenneth G.
Forest Resources Assessment Working Paper 187
Contents
Introduction 1
Data and Methods 2
Survey results 4
Conclusion 7
References 8
Global forest land-use change from 1990 to 2010
1
Introduction
Monitoring the Earth’s global forest resources is important. The Global Forest Resources Assessment (FRA) team of the FAO collects and collates national statistics on forest resources on 5 -10 year intervals to provide globally synthesized information. In FRA 2010, results from a global remote sensing survey were included as an independent means of collecting comparable time-series data on the state of the World’s forests between 1990 and 2005 at the regional, climatic domain and global levels (FAO and JRC, 2012). For FRA 2015, this quasi-systematic survey of remotely-sensed data was updated with satellite imagery and analysis for year 2010. The updated analysis allowed sites lacking year 1990 and 2000 data, and thus omitted in the previous survey, to be re-analyzed and updated. This note presents updated results for the extent of forest-land and changes in forest land use for the time period 1990 to 2010. The work is the result of a partnership between FAO, its member countries and the European Commission Joint Research Centre (JRC).
Global forest land-use change from 1990 to 2010
2
Data and Methods
A systematic sampling design delivers globally consistent, statistically reliable resultsGlobally, over 13 500 sample sites located at the intersection of each degree of longitude and latitude (Figure 1) were analyzed. No sample sites were located at latitudes higher than 75 degrees north or south. The area surveyed provided a sampling intensity of about one percent of the global land surface. The JRC processed pan-tropical sites whereas the FAO processed sites in the boreal, temperate and sub-tropical domains.
Best-available Landsat satellite imagery was used to track change in forest areaMost of the data was provided by the USGS Landsat Global Land Survey, which is composed of the best Landsat satellite images acquired closest to the target years of 1990, 2000 and 2010. Landsat imagery was used as the primary source of data because its global coverage, long time series, spectral characteristics and 30 m spatial resolution made it suitable for the detection of tree cover and change in tree cover over time. Image samples were classified to land cover and land use using an automated, supervised approach. As some new data points were added since the previous survey, historical data were reprocessed together with the new data for 2010.
Over 1 billion pixels were aggregated into polygons (minimum mapping unit of 5 hectares) and analyzed at each time interval to enable detection of forest area, forest gains and forest losses.

Global forest land-use change from 1990 to 2010
3
FIGURE 1Spatial distribution of sample sites across the globe
Forest land use and land-use change reportedThe forest area and forest area change results of this survey are presented as a land use, in order to be consistent with the forest definition used in FAO’s Global Forest Resources Assessment country reports and national reports to the United Nations Framework Convention on Climate Change (UNFCCC).
Forest land use may include periods during which the land is devoid of tree cover, for example during cycles of forest harvesting and regeneration. In such cases, a land use is considered to be forest land use when management or natural processes will, within a reasonable time, restore tree cover to the point where it constitutes a forest.
National experts in over 100 countries reviewed dataThe automated classification of the sample imagery produced spatial outputs compatible with the specific tool developed by FAO and JRC. This tool was used by over 204 national experts in 107 countries to review and revise the land cover and land use interpretation of all the sample sites.
Global forest land-use change from 1990 to 2010
4
Survey results
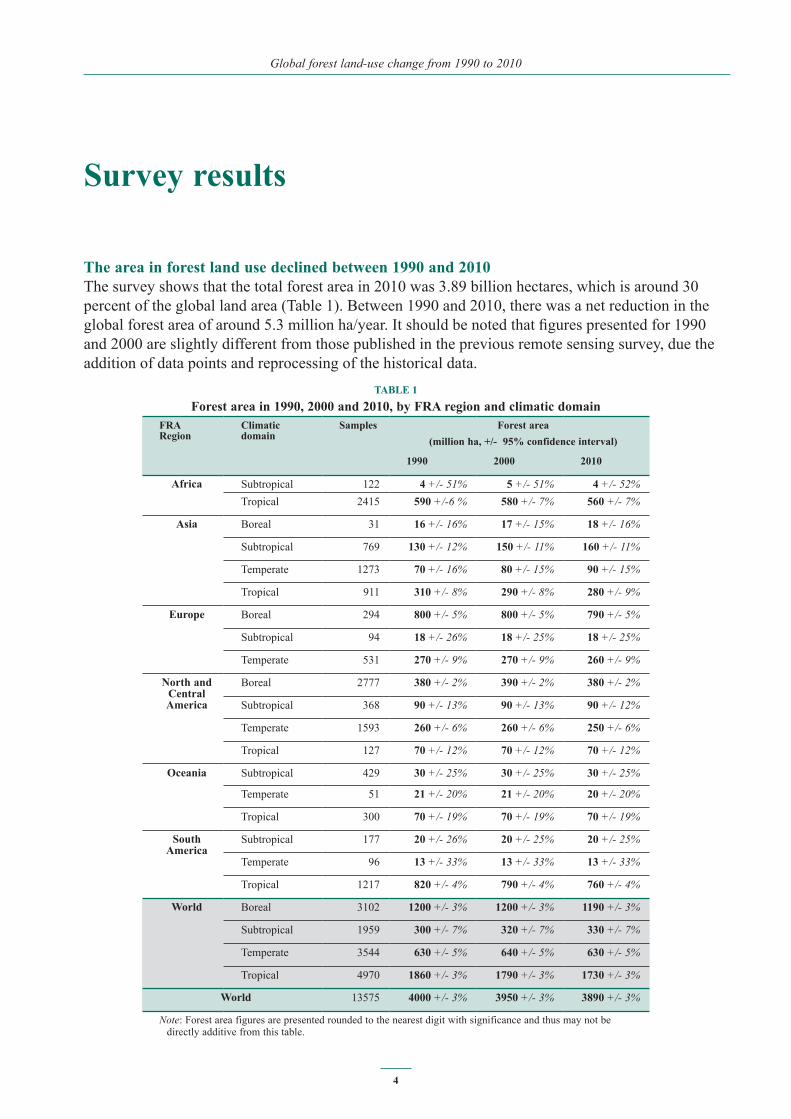
The area in forest land use declined between 1990 and 2010The survey shows that the total forest area in 2010 was 3.89 billion hectares, which is around 30 percent of the global land area (Table 1). Between 1990 and 2010, there was a net reduction in the global forest area of around 5.3 million ha/year. It should be noted that figures presented for 1990 and 2000 are slightly different from those published in the previous remote sensing survey, due the addition of data points and reprocessing of the historical data.
TABLE 1Forest area in 1990, 2000 and 2010, by FRA region and climatic domain
FRA Region
Climatic domain
Samples Forest area (million ha, +/- 95% confidence interval)
1990 2000 2010
Africa Subtropical 122 4 +/- 51% 5 +/- 51% 4 +/- 52%Tropical 2415 590 +/-6 % 580 +/- 7% 560 +/- 7%
Asia Boreal 31 16 +/- 16% 17 +/- 15% 18 +/- 16%
Subtropical 769 130 +/- 12% 150 +/- 11% 160 +/- 11%
Temperate 1273 70 +/- 16% 80 +/- 15% 90 +/- 15%
Tropical 911 310 +/- 8% 290 +/- 8% 280 +/- 9%
Europe Boreal 294 800 +/- 5% 800 +/- 5% 790 +/- 5%
Subtropical 94 18 +/- 26% 18 +/- 25% 18 +/- 25%
Temperate 531 270 +/- 9% 270 +/- 9% 260 +/- 9%
North and Central America
Boreal 2777 380 +/- 2% 390 +/- 2% 380 +/- 2%
Subtropical 368 90 +/- 13% 90 +/- 13% 90 +/- 12%
Temperate 1593 260 +/- 6% 260 +/- 6% 250 +/- 6%
Tropical 127 70 +/- 12% 70 +/- 12% 70 +/- 12%
Oceania Subtropical 429 30 +/- 25% 30 +/- 25% 30 +/- 25%
Temperate 51 21 +/- 20% 21 +/- 20% 20 +/- 20%
Tropical 300 70 +/- 19% 70 +/- 19% 70 +/- 19%
South America
Subtropical 177 20 +/- 26% 20 +/- 25% 20 +/- 25%
Temperate 96 13 +/- 33% 13 +/- 33% 13 +/- 33%
Tropical 1217 820 +/- 4% 790 +/- 4% 760 +/- 4%
World Boreal 3102 1200 +/- 3% 1200 +/- 3% 1190 +/- 3%
Subtropical 1959 300 +/- 7% 320 +/- 7% 330 +/- 7%
Temperate 3544 630 +/- 5% 640 +/- 5% 630 +/- 5%
Tropical 4970 1860 +/- 3% 1790 +/- 3% 1730 +/- 3%
World 13575 4000 +/- 3% 3950 +/- 3% 3890 +/- 3%
Note: Forest area figures are presented rounded to the nearest digit with significance and thus may not be directly additive from this table.
Global forest land-use change from 1990 to 2010
5
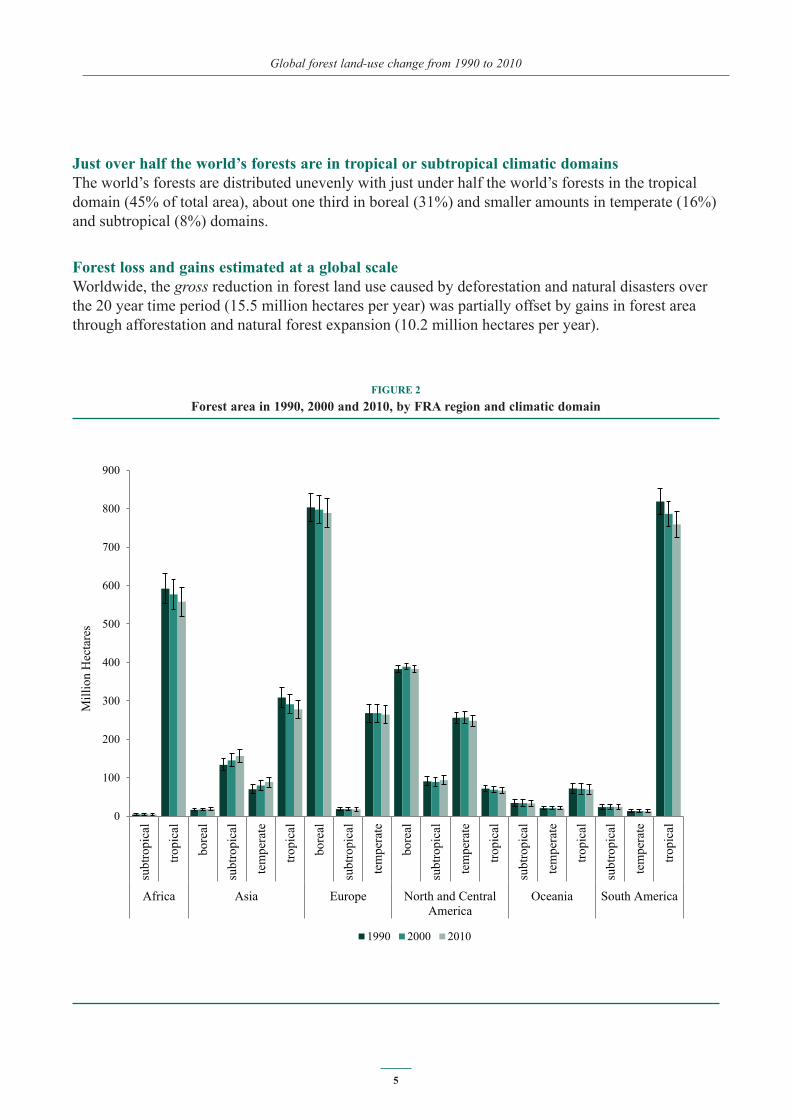
FIGURE 2Forest area in 1990, 2000 and 2010, by FRA region and climatic domain
0
100
200
300
400
500
600
700
800
900
subt
ropi
cal
tropi
cal
bore
al
subt
ropi
cal
tem
pera
te
tropi
cal
bore
al
subt
ropi
cal
tem
pera
te
bore
al
subt
ropi
cal
tem
pera
te
tropi
cal
subt
ropi
cal
tem
pera
te
tropi
cal
subt
ropi
cal
tem
pera
te
tropi
cal
Africa Asia Europe North and CentralAmerica
Oceania South America
Mill
ion
Hec
tare
s
1990 2000 2010
Just over half the world’s forests are in tropical or subtropical climatic domains The world’s forests are distributed unevenly with just under half the world’s forests in the tropical domain (45% of total area), about one third in boreal (31%) and smaller amounts in temperate (16%) and subtropical (8%) domains.
Forest loss and gains estimated at a global scaleWorldwide, the gross reduction in forest land use caused by deforestation and natural disasters over the 20 year time period (15.5 million hectares per year) was partially offset by gains in forest area through afforestation and natural forest expansion (10.2 million hectares per year).
Global forest land-use change from 1990 to 2010
6
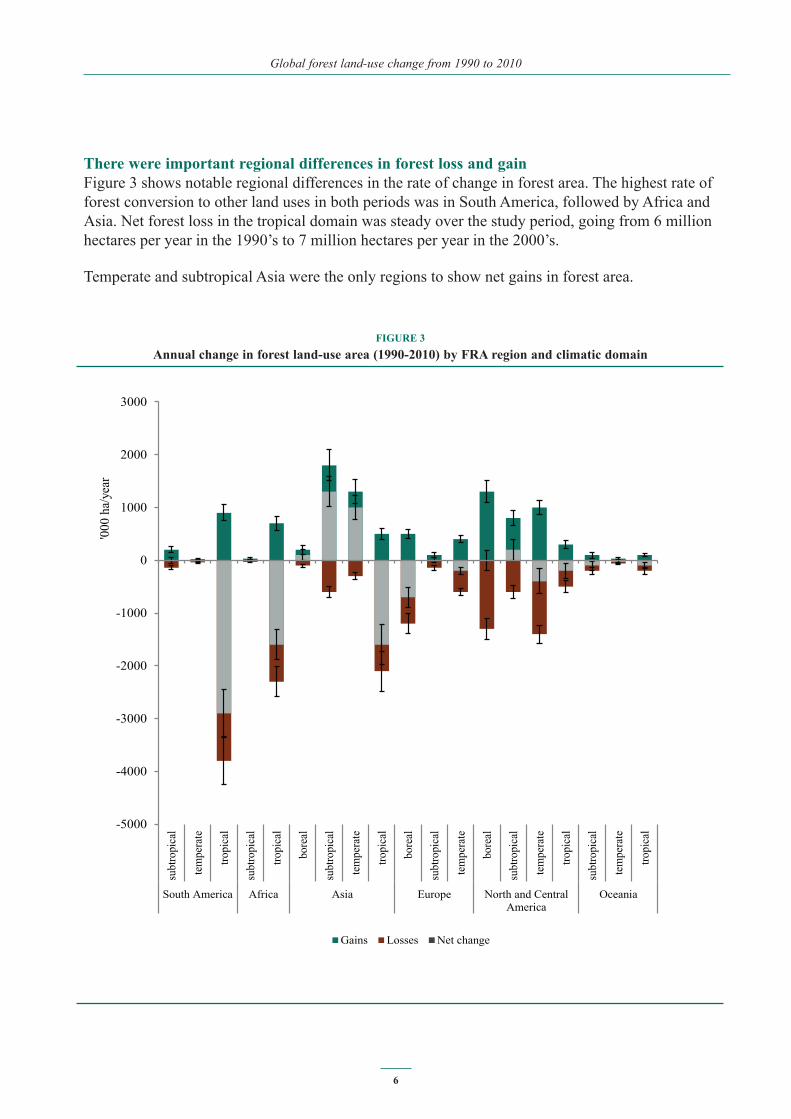
There were important regional differences in forest loss and gainFigure 3 shows notable regional differences in the rate of change in forest area. The highest rate of forest conversion to other land uses in both periods was in South America, followed by Africa and Asia. Net forest loss in the tropical domain was steady over the study period, going from 6 million hectares per year in the 1990’s to 7 million hectares per year in the 2000’s.
Temperate and subtropical Asia were the only regions to show net gains in forest area.
FIGURE 3Annual change in forest land-use area (1990-2010) by FRA region and climatic domain
-5000
-4000
-3000
-2000
-1000
0
1000
2000
3000
subt
ropi
cal
tem
pera
te
tropi
cal
subt
ropi
cal
tropi
cal
bore
al
subt
ropi
cal
tem
pera
te
tropi
cal
bore
al
subt
ropi
cal
tem
pera
te
bore
al
subt
ropi
cal
tem
pera
te
tropi
cal
subt
ropi
cal
tem
pera
te
tropi
cal
South America Africa Asia Europe North and CentralAmerica
Oceania
'000
ha/y
ear
Gains Losses Net change
Global forest land-use change from 1990 to 2010
7
Conclusion
The survey was designed to detect and report on forest area changes at global, regional and climatic zone scales. It complements the country-based FRA process, which collects a wide range of other information that is also needed to monitor and report on the world’s forests. Importantly, the remote sensing survey provides information on changes in forest land use in different climatic domains - something which is currently impossible to obtain from a compilation of national data.
The methods developed through the remote sensing survey will be used to improve the measurement and reporting of forest area and change in forest area over time as part of the continual improvement of the FRA process and can be adapted for use at national scales. These results can be an important input to national and international reporting processes where forest area and change statistics are needed such as the Convention for Biological diversity and Reducing Emissions from Deforestation and Forest Degradation in Developing countries mechanism (REDD+) under the UN Framework Convention on Climate Change.
Global forest land-use change from 1990 to 2010
8
References
FAO & JRC. 2012. Global forest land-use change 1990–2005, by E.J. Lindquist, R. D’Annunzio, A. Gerrand, K. MacDicken, F. Achard, R. Beuchle, A. Brink, H.D. Eva, P. Mayaux, J. San-Miguel-Ayanz & H-J. Stibig. FAO Forestry Paper No. 169. Food and Agriculture Organization of the UnitedNations and European Commission Joint Research Centre. Rome, FAO
Lindquist, E. D’Annunzio, R., 2016. Assessing Global Forest Land-Use Change by Object-Based Image Analysis, Remote Sens. 2016, 8, 678; doi:10.3390/rs8080678


I5098EN/1/06.17


