
GLOBAL FLEET & MRO MARKET FORECAST COMMENTARY · Oliver Wyman’s Global Fleet & MRO Market...
51
GLOBAL FLEET & MRO MARKET FORECAST COMMENTARY 2018–2028 AUTHORS Tom Cooper, Vice President John Smiley, Senior Manager Chad Porter, Technical Specialist Chris Precourt, Technical Analyst
Transcript of GLOBAL FLEET & MRO MARKET FORECAST COMMENTARY · Oliver Wyman’s Global Fleet & MRO Market...
GLOBAL FLEET & MRO MARKET FORECAST COMMENTARY 2018–2028
AUTHORS Tom Cooper, Vice President John Smiley, Senior Manager Chad Porter, Technical Specialist Chris Precourt, Technical Analyst
Copyright © Oliver Wyman
FOREWORD
Oliver Wyman’s Global Fleet & MRO Market Forecast Commentary 2018–2028 marks our firm’s 18th assessment of the 10-year outlook for the commercial airline transport fleet and the associated maintenance, repair, and overhaul (MRO) market. We’re proud to say that the annually produced research, along with our Airline Economic Analysis (AEA), has become a staple resource of aviation executives—whether in companies that build aircraft, fly them, or work in the aftermarket, as well as for those with financial interests in the sector through private equity firms and investment banks.
This research focuses on airline fleet growth and related trends affecting aftermarket demand, maintenance costs, technology, and labor supply. The outlook reveals significant changes that are important to understand when making business decisions and developing long-term plans.
As you will see from the report, the next decade holds great opportunities and challenges for the industry as both technological innovation and the move away from traditional energy sources redefine business as usual across industries and the globe. This will be an era of disruptive growth, driving companies to ask tough, fundamental questions about what it will take to stay relevant and expand.
In conjunction with the Fleet and MRO Forecast, we conduct an annual survey on hot topics, critical issues, and new opportunities across the maintenance, repair, and overhaul space. To participate in this year’s edition, please contact the research team at [email protected].
Oliver Wyman’s Aviation Competitive & Market Intelligence team, partners, and vice presidents are available to assist with any questions about this forecast, as well as the AEA. We hope you find the data and insights valuable as you refine your business models and develop strategies for moving forward.
Best regards and wishes for a wonderful 2018,
Tom Cooper Vice President and Study Leader
January 18, 2018
Copyright © Oliver Wyman
CONTENTS
EXECUTIVE SUMMARY 1
STATE OF THE INDUSTRY 7
FLEET FORECAST 20
MRO MARKET FORECAST 34
ECONOMIC SENSITIVITY ANALYSIS 42

1
EXECUTIVE SUMMARY
Executive Summary
Copyright © Oliver Wyman 2
EXECUTIVE SUMMARY These are heydays for the commercial aviation industry as well as businesses supporting it from the maintenance, repair, and overhaul (MRO) sector. For the first time in airline history, carriers recorded three consecutive years of record or near record profits, thanks to constrained fuel prices and operational efficiencies. Rising demand for air travel is keeping production lines at aircraft, engine, and component manufacturers busy and setting records. Lower oil prices, along with the willingness of airlines to spend on upkeep, are resulting in delayed retirements of older jets, which in turn provide more business for the MRO industry because of their additional servicing needs. And despite recent political instability and rising global tensions, aviation seems headed for more of the same—at least over the short term.
Across economies—both developed and developing—increases in gross domestic product (GDP) and disposable income, as well as expanding middle classes, are producing an unprecedented global demand for passenger air travel and cargo transport. In China, where the size of the middle class now equals the population of the United States, demand for air travel is expected to grow 9.5 percent annually between 2018 and 2028, despite a slight slowing in economic growth over the same 10 years.
While for decades air travel rose in tandem with GDP, increased demand this year—and in the next several—will help it outpace economic growth in most regions, particularly in emerging markets like Asia and Latin America. In Asia, for instance, air travel is expected to expand 8.3 percent in 2018, while real GDP—that is, adjusted for inflation—will rise 5.6 percent. Even in more mature economies, this trend is evident: In 2017, air passenger miles rose four percent in North America versus a 2.2 percent increase in GDP and eight percent in Europe versus GDP growth of 2.5 percent. In Eastern Europe, where little growth was expected, the industry is seeing airlines such as Budapest-based Wizz Air place large aircraft orders. Wizz expects delivery of nearly 300 Airbus A320 family aircraft between now and 2027.
Myriad reasons have led to this intensified demand for air travel. They include rising disposable income in emerging markets, expanding numbers globally of well-off retirees with a propensity to travel, an increase in digital connectivity worldwide through the use of digital boarding passes, greater Wi-Fi accessibility, and on-board tablet usage that makes flying easier. Additionally, a spike in the number and size of low-cost carriers and ultra-low-cost carriers has created downward pressure on airfares and other travel costs.
Responding to the demand, US airlines increased available seat miles (ASM) 7.3 percent during 2017 across both domestic and international operations. The year-over-year growth was the largest since the 2007–2009 worldwide economic recession, according to the 2018 Oliver Wyman Airline Economic Analysis (AEA).
The swelling demand continues to drive expansion of the global fleet. Where in our 2017–2027 forecast we projected annual growth averaging 3.4 percent, our current outlook ratchets up that yearly increase to 3.7 percent.
Executive Summary
Copyright © Oliver Wyman 3
Inevitably, all this spells more business for the major aircraft manufacturers, pushing production rates to levels never seen before for commercial aircraft. The two biggest—Boeing and Airbus—have reported they expect their production of Boeing 737s and A320s to reach an unprecedented 60 aircraft per month each sometime in 2019. This compares with 42 per month as recently as 2015—a jump of 43 percent in just four years.
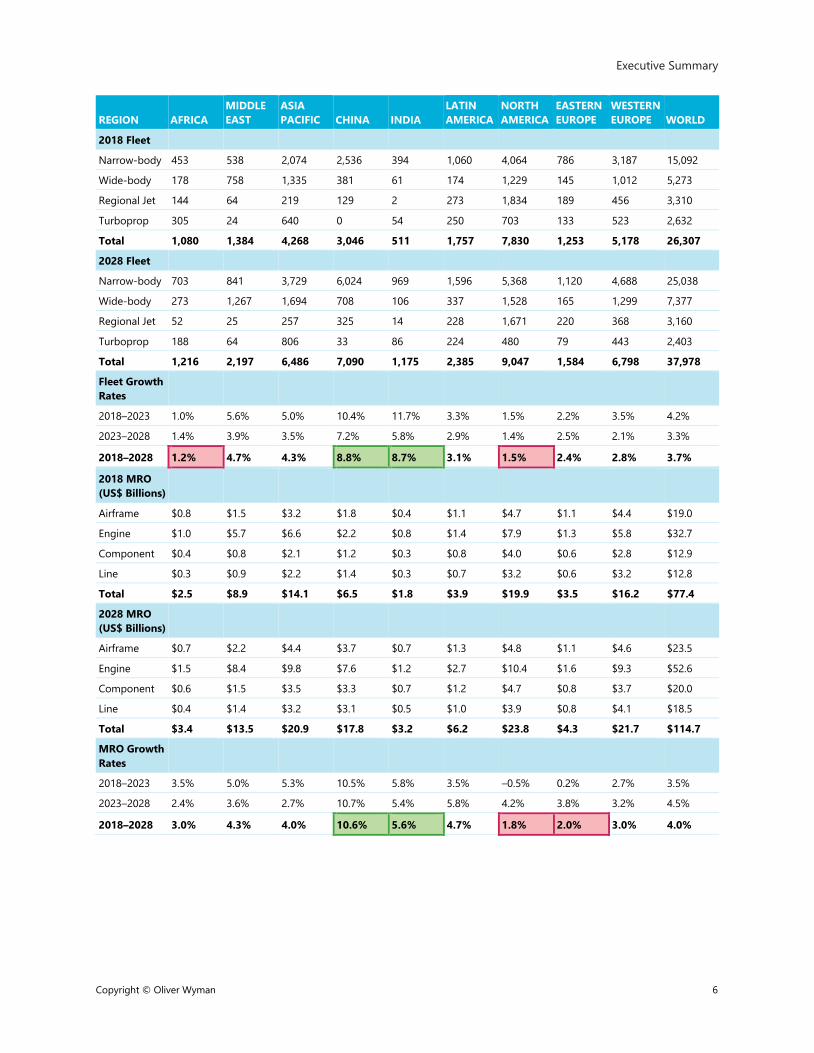
By 2028, our forecast projects the worldwide fleet will total 37,978, up from the 2018 total of 26,307. Narrow-body aircraft will be the biggest beneficiary of this expansion, increasing from about 56 percent of the fleet in 2018 to 66 percent in 2028 thanks to operating costs, range, and capabilities that allow them to encroach on territory once reserved for wide-bodies.
By 2028, 55 percent of the fleet will have been designed and built after 2000 and boast the advanced systems, materials, and components that will help keep operating costs down over the near term. We do not expect that recent consolidations—particularly those in Europe—or mergers to come will interrupt this transformation of the fleet.
With this gradual changeover to newer aircraft, airlines will retire older, less fuel-efficient models—although at a slightly slower rate than expected last year. Because of strong demand and production challenges with a few of the newer engines and aircraft, such as the PW1000G and A350, some airlines are deferring retirements to give themselves more flexibility to deal with unexpected problems and delays. It’s a smart risk-management strategy that allows airlines to incorporate next-generation aircraft more seamlessly. (See our Forbes.com article, Nov. 1, 2017 for more details on this strategy.)
According to our forecast, 54 percent of the aircraft to be retired over the next decade date back to the 1990s. Another 34 percent were built in the 1980s, and 12 percent were made in either the 1970s or post 2000. Those most likely to be mothballed are smaller-capacity narrow-body planes, regional jets, and turboprops. By 2028, jets built in the 1990s will drop from comprising two-thirds of the global fleet to 41 percent. By that year, aircraft built in 2010 or later—equipped with advanced sensors, data collection, analytics, and autonomous functions—will make up more than 36 percent of the fleet.
The commercial air transport MRO market is growing at a similar clip, with total MRO spending expected to rise to $114.7 billion from $77.4 billion in 2018. That’s a jump of 48 percent on an average four percent compound annual growth rate (CAGR); in 2017, our forecast projected a slightly lower 3.8 percent CAGR. The expansion is back-end loaded, with growth averaging 3.5 percent for the first five years, increasing the total to $91.9 billion by 2023, and rising to 4.5 percent yearly growth between 2023 and 2028.
Prospects for growth in air travel and the technological innovation disrupting all sectors of aviation is spawning mergers and acquisitions. That’s true for the aftermarket, too, with Illinois-based AAR’s agreement to buy two Canadian MRO facilities from Premier Aviation and China’s HNA Aviation Group’s purchase of Swiss-based SR Technics as prime examples. The trend in MRO is cutting the number of players while simultaneously increasing the scale of those left standing.
Executive Summary
Copyright © Oliver Wyman 4
Some of the fastest growth is projected for MRO operations owned by aircraft manufacturers and other major original equipment manufacturers (OEMs), such as engine maker General Electric. Boeing, for instance, has set a $50 billion goal for its aftermarket services as part of its effort to capture more life-cycle value out of its aircraft. That represents a tripling of its current revenue from the aftermarket.
Our research indicates that OEMs servicing engines handle about 53 percent of the market, while airlines and their affiliated MRO operations control 64 percent of the airframe maintenance market. OEMs handle about 58 percent of the component MRO aftermarket.
As airlines begin to favor small and midsize wide-bodies, such as Boeing’s 777 and 787 and Airbus’ A350, another maintenance challenge will present itself—a function of how doing better can sometimes cause unexpected problems. For instance, the newer aircraft like the 787 and A350 have longer airframe maintenance intervals, essentially extending the time between scheduled maintenance downtime. While this has a positive impact on airlines’ bottom lines, it causes a small problem for them keeping up their interiors. Whereas conventional check intervals once provided carriers a time slot to refurbish interior components—such as seats, overhead bins, and lavatories—newer, technologically advanced aircraft with extended check intervals no longer afford timely opportunities for cabin repairs. This can cause image problems for airlines, given their renewed emphasis on customer experience, and may leave some passengers wondering where the new aircraft are.
One new technology that could shake up the aftermarket later in the decade is 3-D printing, which is also called additive manufacturing. Using models built through computer-aided design, 3-D printing can produce virtually any solid object—even those with complex architectures—in a range of materials, including plastic, ceramic, and metal. For aerospace manufacturers, this has been a boon for producing prototypes, an activity that accounts for half of additive manufacturing today.
While potentially transformative, the technology has had only a limited impact. The cost of the equipment and OEMs’ reluctance to share proprietary designs make it difficult for the MRO industry to adopt 3-D printing for spare parts or for the aftermarket to derive any real tangible benefit from the new technology. That’s less the case for the OEMs, which have incorporated additive manufacturing into a few operations and may expand its use in the future.
While the forecast for aviation, fleet growth, and the MRO market is basically bullish, there are still risks on the horizon. Fast growth often leads to strained capacity and higher costs as pent-up demand allows suppliers to raise rates and workers to seek higher wages. The MRO industry is no exception, and companies are beginning to feel the pinch, particularly when it comes to finding qualified mechanics.
In mature economies especially, a scarcity of technicians trained to service both the older and newer model aircraft will put pressure on payrolls over the next decade. As we reported last year, the retirement of baby boomer mechanics and the lack of interest in the job among millennials will produce a shortfall in the United States by 2022, with a nine percent gap projected between the supply of aircraft technicians and the demand for them by 2027. This shortage could produce problems for the aviation industry just as the fleet is expanding and technologically sophisticated aircraft are being incorporated.
Executive Summary
Copyright © Oliver Wyman 5
The aviation industry as a whole is more resilient after years of restructuring and improved management, but the growth and prosperity are not evenly distributed. While emerging-market economies showed strong growth in the decade following the 2007–2009 global financial crisis, industry profits during those 10 years were primarily concentrated in the advanced economies of the United States and the Eurozone, where the industry was busy consolidating and restructuring. North American and European airlines controlled a combined 46.5 percent of airline capacity in 2017, but accounted for more than 70 percent of carrier profits, according to the 2018 Oliver Wyman Airline Economic Analysis and data from the International Air Transport Association (IATA).
Moving forward, that dearth of profits could prove problematic for airlines in developing nations faced with burgeoning consumer classes demanding more air travel. Over the next decade, more than three-quarters of the pickup in global growth will be fueled by emerging economies, especially China and India.
The industry also faces uncertainties over global regulation aimed at reducing emissions in compliance with the Paris Climate Accord and as a result of the implementation of Brexit, the United Kingdom’s decision to leave the European Union (EU). While the aviation industry has been working on biofuels as a possible route to reduced emissions, it’s unclear whether progress on that solution will be enough to meet unfolding environmental regulations, coming at this point mostly from European and Asian efforts to meet the Paris reduction targets. And while there have been warnings of dire consequences with a “hard” Brexit in aviation, it seems unlikely that either side will allow that to happen, given the importance of transportation to both the EU and Britain.
That said, there are few foreseeable stumbling blocks that could derail the expansionary outlook for either the fleet or the MRO industry. If anything, our research for the decade between 2018 and 2028 shows acceleration of the growth trends we reported in earlier research.
Executive Summary
Copyright © Oliver Wyman 6
REGION AFRICA MIDDLE EAST
ASIA PACIFIC CHINA INDIA
LATIN AMERICA
NORTH AMERICA
EASTERN EUROPE
WESTERN EUROPE WORLD
2018 Fleet
Narrow-body 453 538 2,074 2,536 394 1,060 4,064 786 3,187 15,092
Wide-body 178 758 1,335 381 61 174 1,229 145 1,012 5,273
Regional Jet 144 64 219 129 2 273 1,834 189 456 3,310
Turboprop 305 24 640 0 54 250 703 133 523 2,632
Total 1,080 1,384 4,268 3,046 511 1,757 7,830 1,253 5,178 26,307
2028 Fleet
Narrow-body 703 841 3,729 6,024 969 1,596 5,368 1,120 4,688 25,038
Wide-body 273 1,267 1,694 708 106 337 1,528 165 1,299 7,377
Regional Jet 52 25 257 325 14 228 1,671 220 368 3,160
Turboprop 188 64 806 33 86 224 480 79 443 2,403
Total 1,216 2,197 6,486 7,090 1,175 2,385 9,047 1,584 6,798 37,978
Fleet Growth Rates
2018–2023 1.0% 5.6% 5.0% 10.4% 11.7% 3.3% 1.5% 2.2% 3.5% 4.2%
2023–2028 1.4% 3.9% 3.5% 7.2% 5.8% 2.9% 1.4% 2.5% 2.1% 3.3%
2018–2028 1.2% 4.7% 4.3% 8.8% 8.7% 3.1% 1.5% 2.4% 2.8% 3.7%
2018 MRO (US$ Billions)
Airframe $0.8 $1.5 $3.2 $1.8 $0.4 $1.1 $4.7 $1.1 $4.4 $19.0
Engine $1.0 $5.7 $6.6 $2.2 $0.8 $1.4 $7.9 $1.3 $5.8 $32.7
Component $0.4 $0.8 $2.1 $1.2 $0.3 $0.8 $4.0 $0.6 $2.8 $12.9
Line $0.3 $0.9 $2.2 $1.4 $0.3 $0.7 $3.2 $0.6 $3.2 $12.8
Total $2.5 $8.9 $14.1 $6.5 $1.8 $3.9 $19.9 $3.5 $16.2 $77.4
2028 MRO (US$ Billions)
Airframe $0.7 $2.2 $4.4 $3.7 $0.7 $1.3 $4.8 $1.1 $4.6 $23.5
Engine $1.5 $8.4 $9.8 $7.6 $1.2 $2.7 $10.4 $1.6 $9.3 $52.6
Component $0.6 $1.5 $3.5 $3.3 $0.7 $1.2 $4.7 $0.8 $3.7 $20.0
Line $0.4 $1.4 $3.2 $3.1 $0.5 $1.0 $3.9 $0.8 $4.1 $18.5
Total $3.4 $13.5 $20.9 $17.8 $3.2 $6.2 $23.8 $4.3 $21.7 $114.7
MRO Growth Rates
2018–2023 3.5% 5.0% 5.3% 10.5% 5.8% 3.5% –0.5% 0.2% 2.7% 3.5%
2023–2028 2.4% 3.6% 2.7% 10.7% 5.4% 5.8% 4.2% 3.8% 3.2% 4.5%
2018–2028 3.0% 4.3% 4.0% 10.6% 5.6% 4.7% 1.8% 2.0% 3.0% 4.0%

2 STATE OF THE INDUSTRY
State of the Industry
Copyright © Oliver Wyman 8
STATE OF THE INDUSTRY The drivers of growth in air travel, as they are for the global economy, are changing. Where growth was once determined by the demand generated in large Western economies and Japan, moving forward it will be driven by the purchasing power in emerging markets in Asia, Latin America, the Middle East, and Eastern Europe. A staggering 6.2 billion people—85 percent of the world’s population—reside in these developing nations. And thanks to globalization, millions of their citizens are filling the ranks of a growing global middle class each year—a newly affluent population that, among other things, wants to travel.
As we enter 2018, the global economy seems to be on relatively solid footing. In October 2017, the International Monetary Fund (IMF) revised upward its World Economic Outlook, calling for global growth of 3.6 percent in 2017 and 3.7 percent in 2018. That would be up from 3.2 percent in 2016. And globally, many regional economies have been seeing similar official upward revisions since the second half of 2016.
Although air travel demand is often tied closely to GDP growth, IATA reports that passenger traffic has outpaced global GDP for a decade. That trend will continue for the next two decades. Air travel in 2017, as measured by revenue passenger kilometers (RPKs), is expected to grow at almost twice the rate of the world economy at a healthy 7.4 percent and is projected to continue to expand five percent annually for the next 20 years.
GLOBAL ECONOMIC OUTLOOK Over the past two years, both mature and developing economies have benefited from buoyant financial markets and a return of consumer and business confidence. Global economic activity has seen a long-awaited cyclical recovery in investment, manufacturing, and trade, and commodity prices have strengthened since the beginning of 2016 as a result of the economic pickup and a campaign by oil producers to reduce the global oversupply of crude.
State of the Industry
Copyright © Oliver Wyman 9
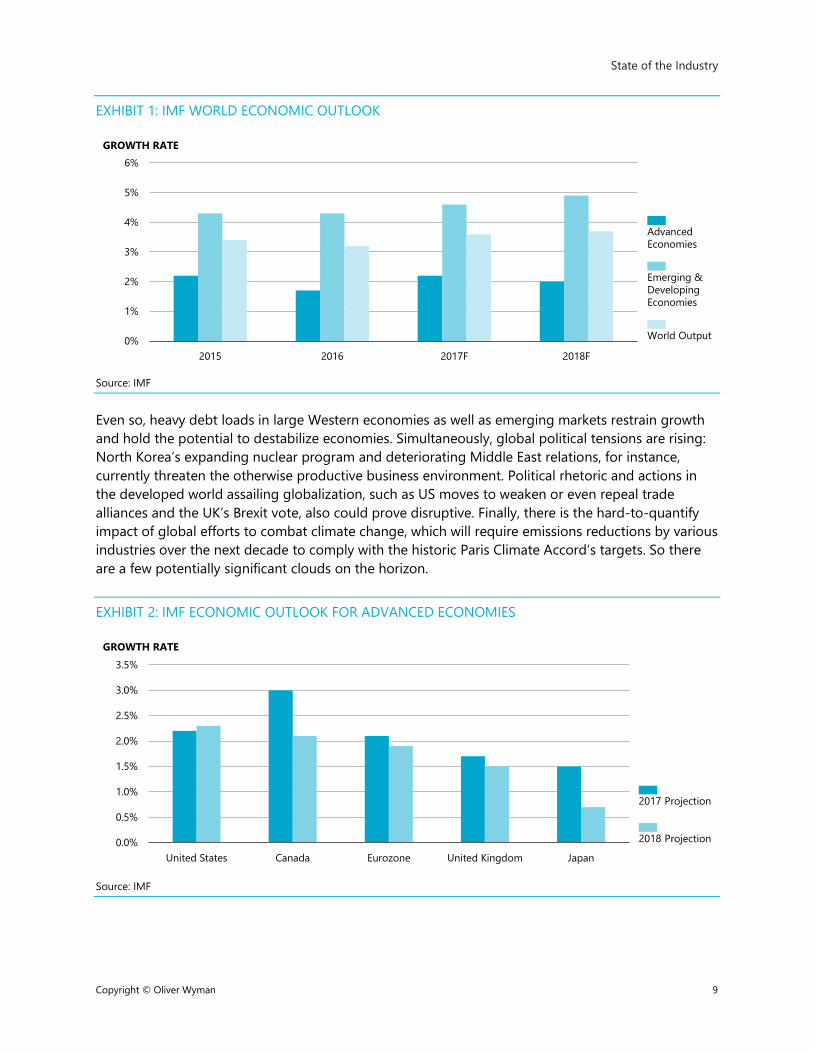
EXHIBIT 1: IMF WORLD ECONOMIC OUTLOOK
Source: IMF
Even so, heavy debt loads in large Western economies as well as emerging markets restrain growth and hold the potential to destabilize economies. Simultaneously, global political tensions are rising: North Korea’s expanding nuclear program and deteriorating Middle East relations, for instance, currently threaten the otherwise productive business environment. Political rhetoric and actions in the developed world assailing globalization, such as US moves to weaken or even repeal trade alliances and the UK’s Brexit vote, also could prove disruptive. Finally, there is the hard-to-quantify impact of global efforts to combat climate change, which will require emissions reductions by various industries over the next decade to comply with the historic Paris Climate Accord’s targets. So there are a few potentially significant clouds on the horizon.
EXHIBIT 2: IMF ECONOMIC OUTLOOK FOR ADVANCED ECONOMIES
Source: IMF
0%
1%
2%
3%
4%
5%
6%
2015 2016 2017F 2018F
GROWTH RATE
AdvancedEconomies
Emerging &DevelopingEconomies
World Output
0.0%
0.5%
1.0%
1.5%
2.0%
2.5%
3.0%
3.5%
United States Canada Eurozone United Kingdom Japan
GROWTH RATE
2017 Projection
2018 Projection
State of the Industry
Copyright © Oliver Wyman 10
UNITED STATES Third-quarter GDP growth, adjusted for inflation, spiked to 3.2 percent, the highest in three years even with a series of devastating hurricanes in Texas, Florida, and Puerto Rico during that three-month period. The unexpected boost was attributed to stronger-than-anticipated business investment and consumer confidence. The United States has now hit three percent growth for two consecutive quarters, and expectations are for three percent-plus during the final quarter of 2017. The Federal Reserve raised its inflation-adjusted growth estimate for 2018 to 2.5 percent from 2.1 percent, based on the bank’s assessment of the anticipated modest and short-term impact of the federal income tax cut.
While monetary policy normalization in the US could trigger a faster-than-expected tightening in global financial conditions, markets appear to anticipate gradual rate tightening, even in the wake of long-term bond yields rebounding in late June and early July. Over the long term, US growth is expected to moderate because of the nation’s aging population and the consequent diminished growth in the workforce—a trend further exacerbated by tighter immigration policies.
CANADA Canada’s GDP is forecast to grow at three percent in 2017 and 2.1 percent in 2018, a significant increase from 1.5 percent in 2016. The growth projection has increased from earlier in the year, reflecting reduced drag from the adjustment to lower oil and gas prices and accommodative fiscal and monetary policies.
EUROZONE AND THE UNITED KINGDOM Growth in countries such as France, Germany, Italy, and Spain was slow in the first three quarters of 2017, but still above what was expected at the beginning of the year. For the full year, economists expect growth of about 2.1 percent; GDP expansion in 2018 will decline slightly to 1.9 percent. This modest growth is projected to be supported by a mildly expansionary fiscal stance, accommodative financial conditions, a weaker euro, and a beneficial spillover from the US tax cut.
One major factor expected to inject some instability into the economic climate is the future uncertain relationship between the European Union and the United Kingdom as a result of the Brexit vote in favor of Britain’s departure from the alliance. While early analysis anticipated contraction of the UK economy, neither side so far has shown many negative impacts from the vote and ongoing negotiations. GDP growth in the UK is expected to come in at 1.7 percent for 2017 and then fall marginally to 1.5 percent in 2018.
State of the Industry
Copyright © Oliver Wyman 11
JAPAN Japan’s modest momentum has been driven by the strengthening of global demand and policy actions to sustain a positive fiscal stance. Growth is expected to slow in 2018 based on the assumption that fiscal support will begin to fade as currently scheduled and private consumption growth will moderate. GDP growth was one percent in 2016 and is forecast to reach 1.5 percent in 2017 and shrink to 0.7 percent in 2018.
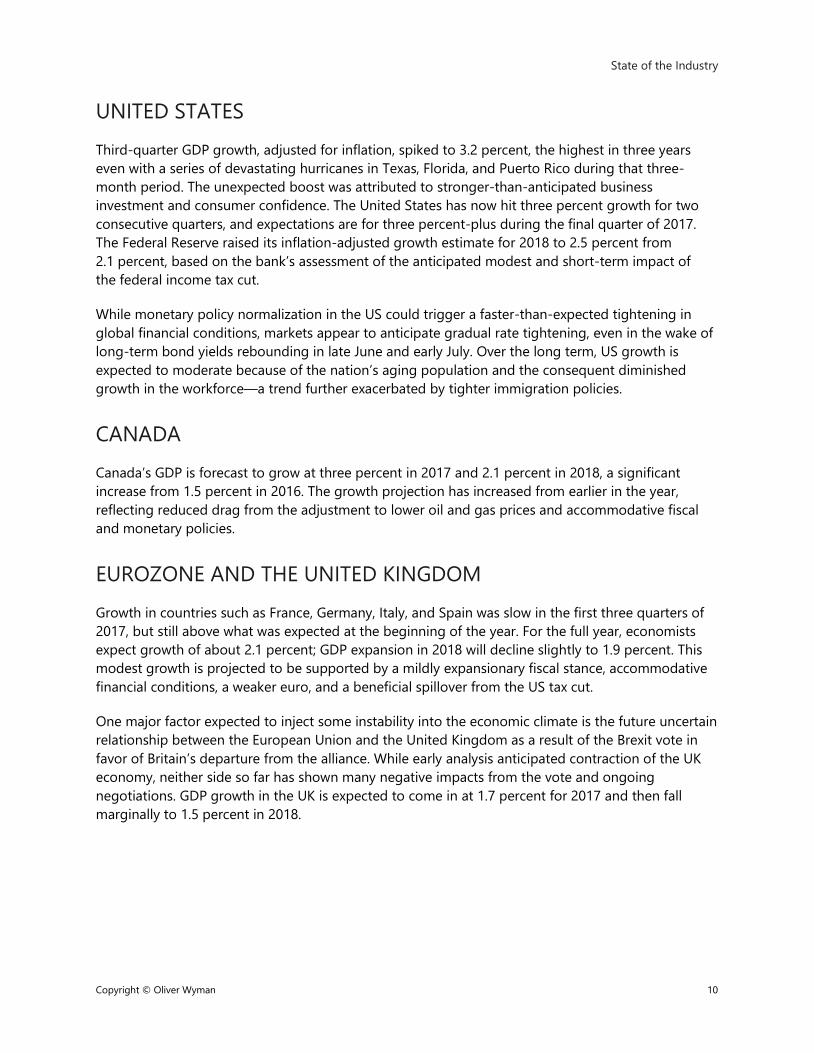
EXHIBIT 3: IMF ECONOMIC OUTLOOK FOR EMERGING ECONOMIES
Note: ASEAN is the Association of Southeast Asian Nations; CIS is the Commonwealth of Independent States; MENAP is the Middle East, North Africa, Afghanistan and Pakistan Source: IMF
Emerging markets have become increasingly important to the health of the overall global economy. Over the near and medium term, most of the pickup in projected global growth will be a result of stronger activity in these economies, which stunningly account for more than 75 percent of global growth in output and consumption. These economies are forecast to see 4.6 percent GDP growth in 2017, a 0.3 percent increase over 2016. In contrast to the mature economies, 2018 GDP growth in the emerging world is expected to top 2017, with projections for a 4.9 percent expansion.
The anticipated upturn has fueled optimism about emerging-market prospects, which in turn has been reflected in strengthening equity valuations and a contraction in interest rate spreads. Part of the rosier outlook for the emerging world is tied to the long-awaited recovery in commodity prices for agricultural products, metals, oil and gas, and other exports since 2015. The recovery, which is expected to push inflation up to 4.4 percent in 2018, follows years of rock-bottom prices and painful economic conditions in the wake of the global financial crisis.
That said, the emerging world faces challenges. Financial conditions have been more volatile than in the US and Europe and more vulnerable to external factors. For instance, in the immediate aftermath of the election of Donald Trump, long-term interest rates moved up and equity valuations down as investors feared increasing protectionism and tightening monetary policy. Over the medium term, most emerging economies must wrestle with an ongoing slowdown of productivity growth.
0%
2%
4%
6%
8%
10%
China India ASEAN CIS Russia Latin America MENAP
GROWTH RATE
2017 Projection
2018 Projection
State of the Industry
Copyright © Oliver Wyman 12
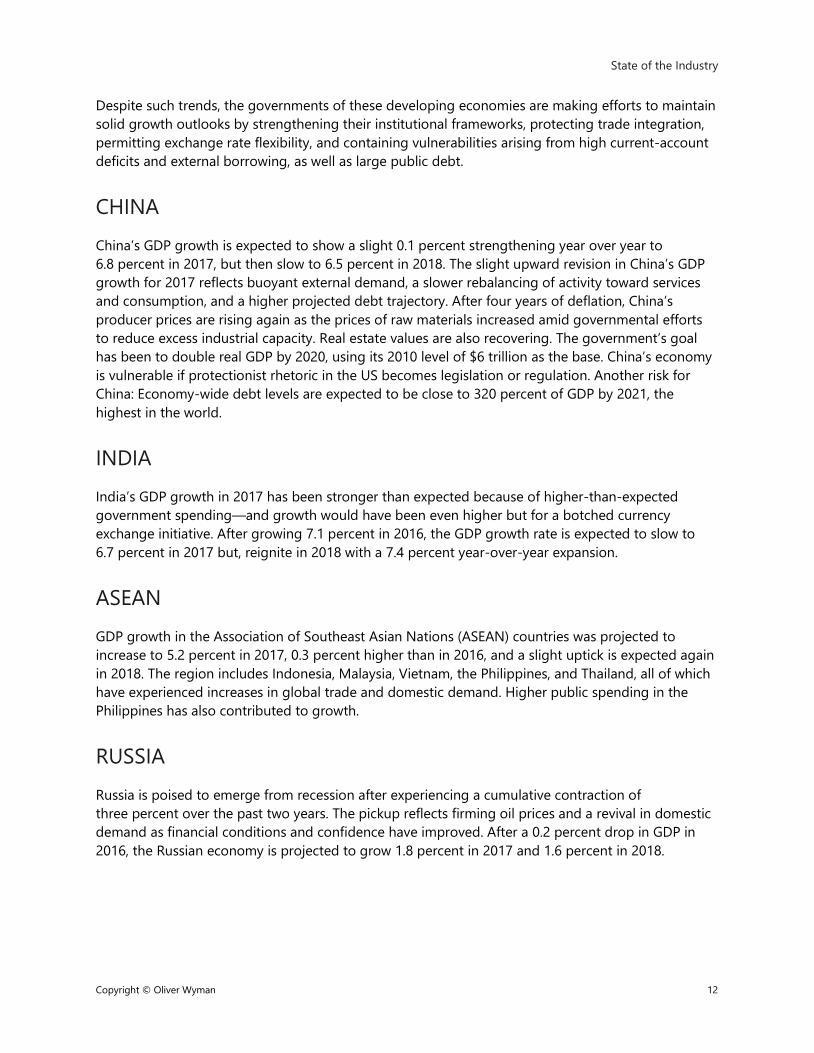
Despite such trends, the governments of these developing economies are making efforts to maintain solid growth outlooks by strengthening their institutional frameworks, protecting trade integration, permitting exchange rate flexibility, and containing vulnerabilities arising from high current-account deficits and external borrowing, as well as large public debt.
CHINA China’s GDP growth is expected to show a slight 0.1 percent strengthening year over year to 6.8 percent in 2017, but then slow to 6.5 percent in 2018. The slight upward revision in China’s GDP growth for 2017 reflects buoyant external demand, a slower rebalancing of activity toward services and consumption, and a higher projected debt trajectory. After four years of deflation, China’s producer prices are rising again as the prices of raw materials increased amid governmental efforts to reduce excess industrial capacity. Real estate values are also recovering. The government’s goal has been to double real GDP by 2020, using its 2010 level of $6 trillion as the base. China’s economy is vulnerable if protectionist rhetoric in the US becomes legislation or regulation. Another risk for China: Economy-wide debt levels are expected to be close to 320 percent of GDP by 2021, the highest in the world.
INDIA India’s GDP growth in 2017 has been stronger than expected because of higher-than-expected government spending—and growth would have been even higher but for a botched currency exchange initiative. After growing 7.1 percent in 2016, the GDP growth rate is expected to slow to 6.7 percent in 2017 but, reignite in 2018 with a 7.4 percent year-over-year expansion.
ASEAN GDP growth in the Association of Southeast Asian Nations (ASEAN) countries was projected to increase to 5.2 percent in 2017, 0.3 percent higher than in 2016, and a slight uptick is expected again in 2018. The region includes Indonesia, Malaysia, Vietnam, the Philippines, and Thailand, all of which have experienced increases in global trade and domestic demand. Higher public spending in the Philippines has also contributed to growth.
RUSSIA Russia is poised to emerge from recession after experiencing a cumulative contraction of three percent over the past two years. The pickup reflects firming oil prices and a revival in domestic demand as financial conditions and confidence have improved. After a 0.2 percent drop in GDP in 2016, the Russian economy is projected to grow 1.8 percent in 2017 and 1.6 percent in 2018.
State of the Industry
Copyright © Oliver Wyman 13
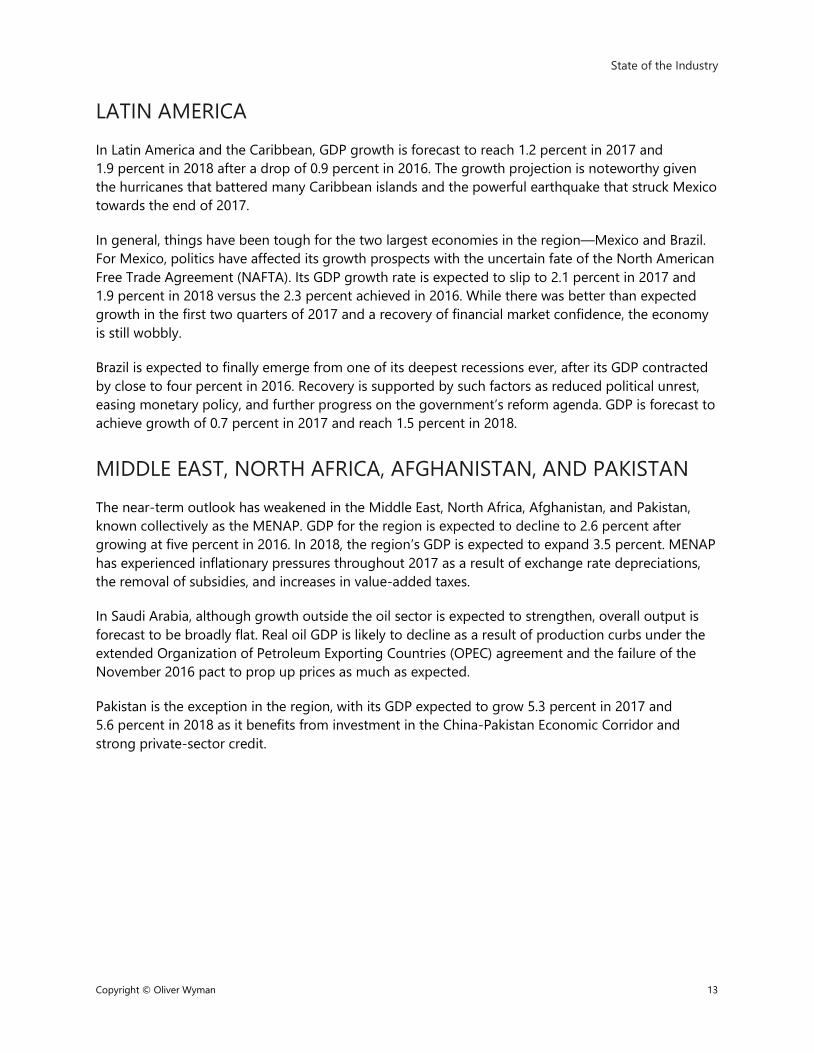
LATIN AMERICA In Latin America and the Caribbean, GDP growth is forecast to reach 1.2 percent in 2017 and 1.9 percent in 2018 after a drop of 0.9 percent in 2016. The growth projection is noteworthy given the hurricanes that battered many Caribbean islands and the powerful earthquake that struck Mexico towards the end of 2017.
In general, things have been tough for the two largest economies in the region—Mexico and Brazil. For Mexico, politics have affected its growth prospects with the uncertain fate of the North American Free Trade Agreement (NAFTA). Its GDP growth rate is expected to slip to 2.1 percent in 2017 and 1.9 percent in 2018 versus the 2.3 percent achieved in 2016. While there was better than expected growth in the first two quarters of 2017 and a recovery of financial market confidence, the economy is still wobbly.
Brazil is expected to finally emerge from one of its deepest recessions ever, after its GDP contracted by close to four percent in 2016. Recovery is supported by such factors as reduced political unrest, easing monetary policy, and further progress on the government’s reform agenda. GDP is forecast to achieve growth of 0.7 percent in 2017 and reach 1.5 percent in 2018.
MIDDLE EAST, NORTH AFRICA, AFGHANISTAN, AND PAKISTAN The near-term outlook has weakened in the Middle East, North Africa, Afghanistan, and Pakistan, known collectively as the MENAP. GDP for the region is expected to decline to 2.6 percent after growing at five percent in 2016. In 2018, the region’s GDP is expected to expand 3.5 percent. MENAP has experienced inflationary pressures throughout 2017 as a result of exchange rate depreciations, the removal of subsidies, and increases in value-added taxes.
In Saudi Arabia, although growth outside the oil sector is expected to strengthen, overall output is forecast to be broadly flat. Real oil GDP is likely to decline as a result of production curbs under the extended Organization of Petroleum Exporting Countries (OPEC) agreement and the failure of the November 2016 pact to prop up prices as much as expected.
Pakistan is the exception in the region, with its GDP expected to grow 5.3 percent in 2017 and 5.6 percent in 2018 as it benefits from investment in the China-Pakistan Economic Corridor and strong private-sector credit.
State of the Industry
Copyright © Oliver Wyman 14
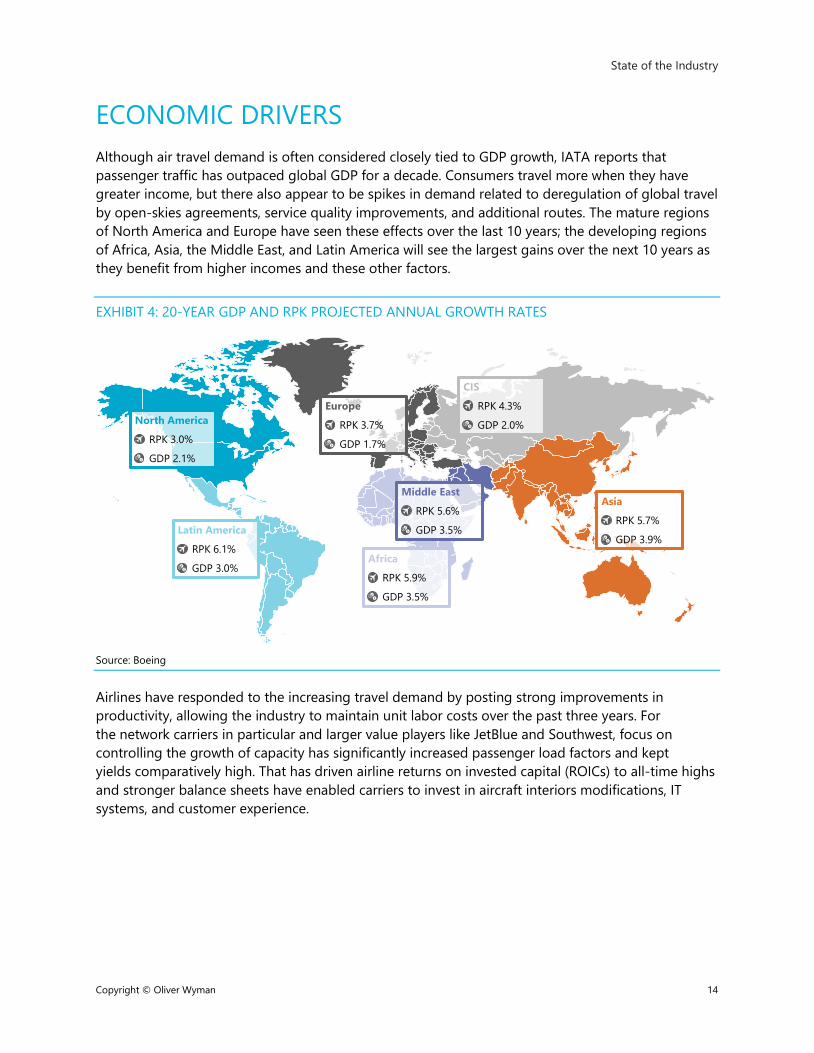
ECONOMIC DRIVERS Although air travel demand is often considered closely tied to GDP growth, IATA reports that passenger traffic has outpaced global GDP for a decade. Consumers travel more when they have greater income, but there also appear to be spikes in demand related to deregulation of global travel by open-skies agreements, service quality improvements, and additional routes. The mature regions of North America and Europe have seen these effects over the last 10 years; the developing regions of Africa, Asia, the Middle East, and Latin America will see the largest gains over the next 10 years as they benefit from higher incomes and these other factors.
EXHIBIT 4: 20-YEAR GDP AND RPK PROJECTED ANNUAL GROWTH RATES
Source: Boeing
Airlines have responded to the increasing travel demand by posting strong improvements in productivity, allowing the industry to maintain unit labor costs over the past three years. For the network carriers in particular and larger value players like JetBlue and Southwest, focus on controlling the growth of capacity has significantly increased passenger load factors and kept yields comparatively high. That has driven airline returns on invested capital (ROICs) to all-time highs and stronger balance sheets have enabled carriers to invest in aircraft interiors modifications, IT systems, and customer experience.
RPK 3.0%
GDP 2.1%
North America
RPK 6.1%
GDP 3.0%
Latin America
RPK 5.9%
GDP 3.5%
Africa
RPK 5.6%
GDP 3.5%
Middle East
RPK 3.7%
GDP 1.7%
Europe RPK 4.3%
GDP 2.0%
CIS
RPK 5.7%
GDP 3.9%
Asia
State of the Industry
Copyright © Oliver Wyman 15
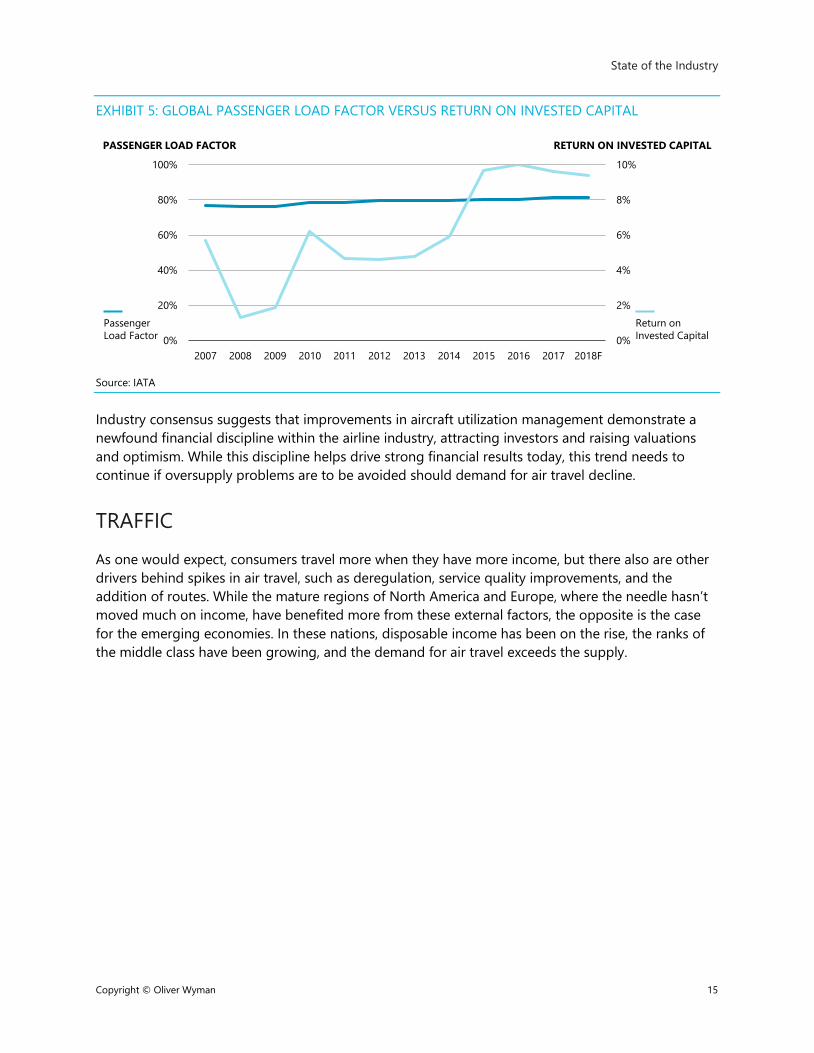
EXHIBIT 5: GLOBAL PASSENGER LOAD FACTOR VERSUS RETURN ON INVESTED CAPITAL
Source: IATA
Industry consensus suggests that improvements in aircraft utilization management demonstrate a newfound financial discipline within the airline industry, attracting investors and raising valuations and optimism. While this discipline helps drive strong financial results today, this trend needs to continue if oversupply problems are to be avoided should demand for air travel decline.
TRAFFIC As one would expect, consumers travel more when they have more income, but there also are other drivers behind spikes in air travel, such as deregulation, service quality improvements, and the addition of routes. While the mature regions of North America and Europe, where the needle hasn’t moved much on income, have benefited more from these external factors, the opposite is the case for the emerging economies. In these nations, disposable income has been on the rise, the ranks of the middle class have been growing, and the demand for air travel exceeds the supply.
0%
2%
4%
6%
8%
10%
0%
20%
40%
60%
80%
100%
2007 2008 2009 2010 2011 2012 2013 2014 2015 2016 2017 2018F
Return onInvested Capital
PassengerLoad Factor
PASSENGER LOAD FACTOR RETURN ON INVESTED CAPITAL
State of the Industry
Copyright © Oliver Wyman 16
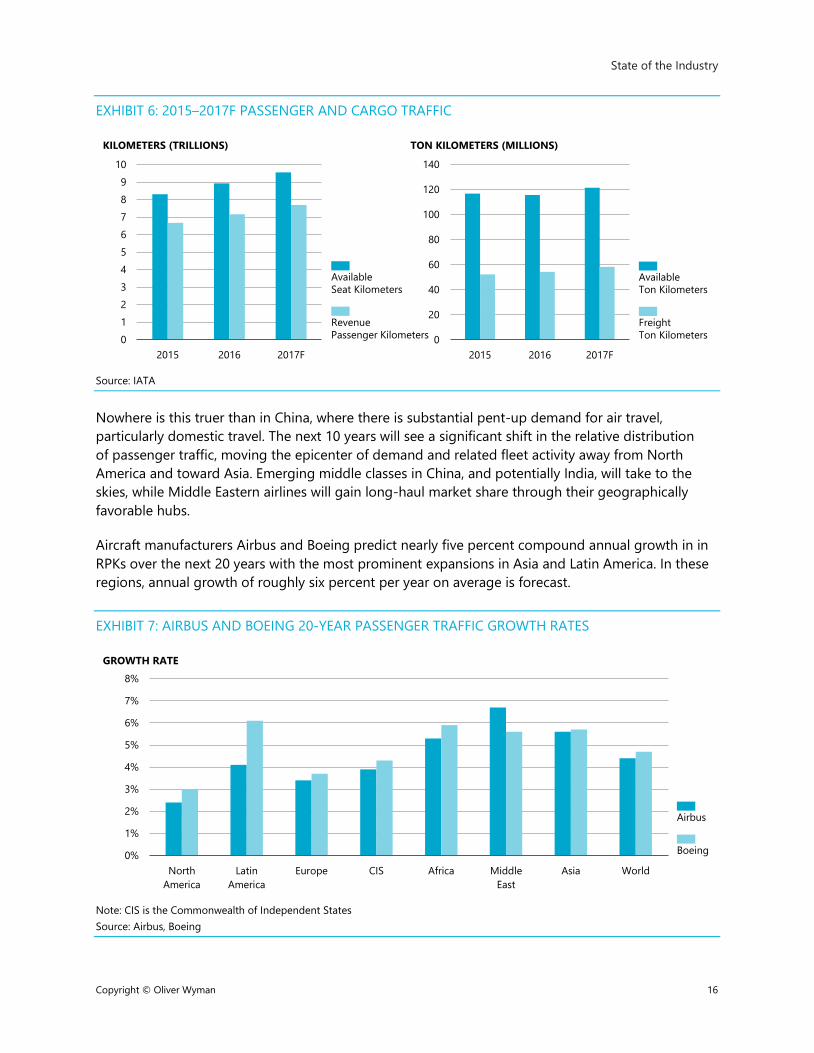
EXHIBIT 6: 2015–2017F PASSENGER AND CARGO TRAFFIC
Source: IATA
Nowhere is this truer than in China, where there is substantial pent-up demand for air travel, particularly domestic travel. The next 10 years will see a significant shift in the relative distribution of passenger traffic, moving the epicenter of demand and related fleet activity away from North America and toward Asia. Emerging middle classes in China, and potentially India, will take to the skies, while Middle Eastern airlines will gain long-haul market share through their geographically favorable hubs.
Aircraft manufacturers Airbus and Boeing predict nearly five percent compound annual growth in in RPKs over the next 20 years with the most prominent expansions in Asia and Latin America. In these regions, annual growth of roughly six percent per year on average is forecast.
EXHIBIT 7: AIRBUS AND BOEING 20-YEAR PASSENGER TRAFFIC GROWTH RATES
Note: CIS is the Commonwealth of Independent States Source: Airbus, Boeing
0
20
40
60
80
100
120
140
2015 2016 2017F0123456789
10
2015 2016 2017F
KILOMETERS (TRILLIONS) TON KILOMETERS (MILLIONS)
FreightTon Kilometers
AvailableTon Kilometers
RevenuePassenger Kilometers
AvailableSeat Kilometers
0%
1%
2%
3%
4%
5%
6%
7%
8%
NorthAmerica
LatinAmerica
Europe CIS Africa MiddleEast
Asia World
GROWTH RATE
Airbus
Boeing
State of the Industry
Copyright © Oliver Wyman 17
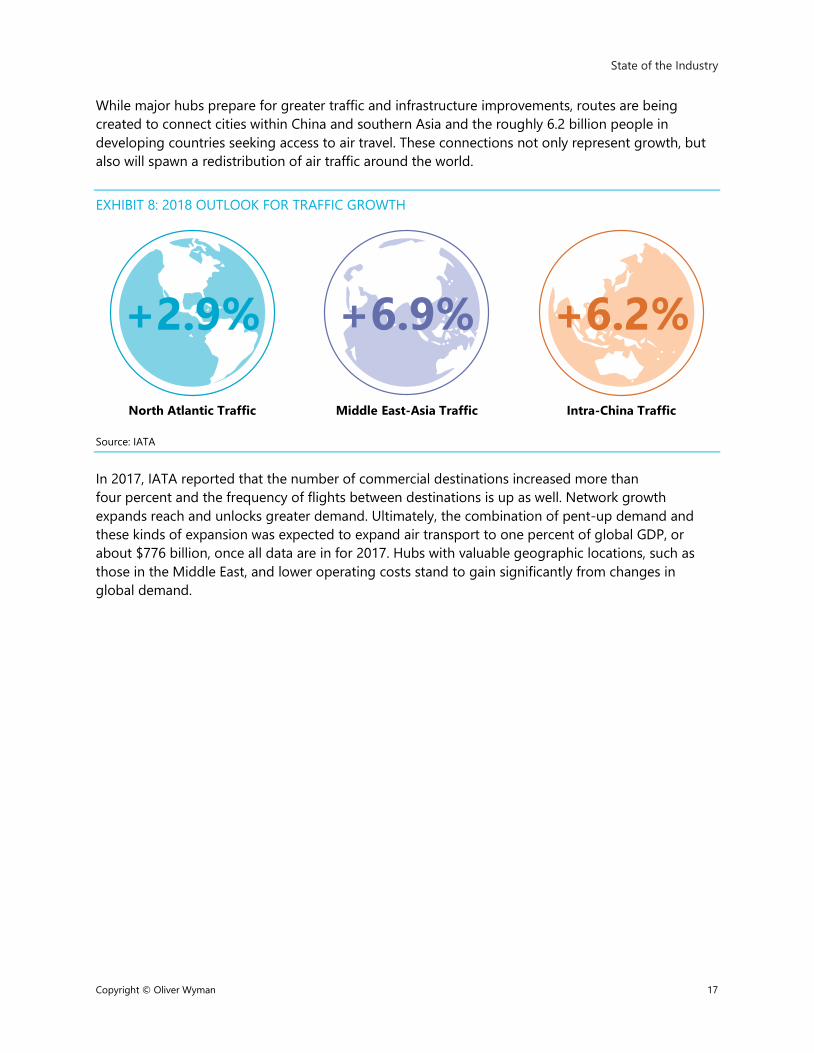
While major hubs prepare for greater traffic and infrastructure improvements, routes are being created to connect cities within China and southern Asia and the roughly 6.2 billion people in developing countries seeking access to air travel. These connections not only represent growth, but also will spawn a redistribution of air traffic around the world.
EXHIBIT 8: 2018 OUTLOOK FOR TRAFFIC GROWTH
Source: IATA
In 2017, IATA reported that the number of commercial destinations increased more than four percent and the frequency of flights between destinations is up as well. Network growth expands reach and unlocks greater demand. Ultimately, the combination of pent-up demand and these kinds of expansion was expected to expand air transport to one percent of global GDP, or about $776 billion, once all data are in for 2017. Hubs with valuable geographic locations, such as those in the Middle East, and lower operating costs stand to gain significantly from changes in global demand.
+2.9% +6.2%+6.9%
Middle East-Asia TrafficNorth Atlantic Traffic Intra-China Traffic
State of the Industry
Copyright © Oliver Wyman 18
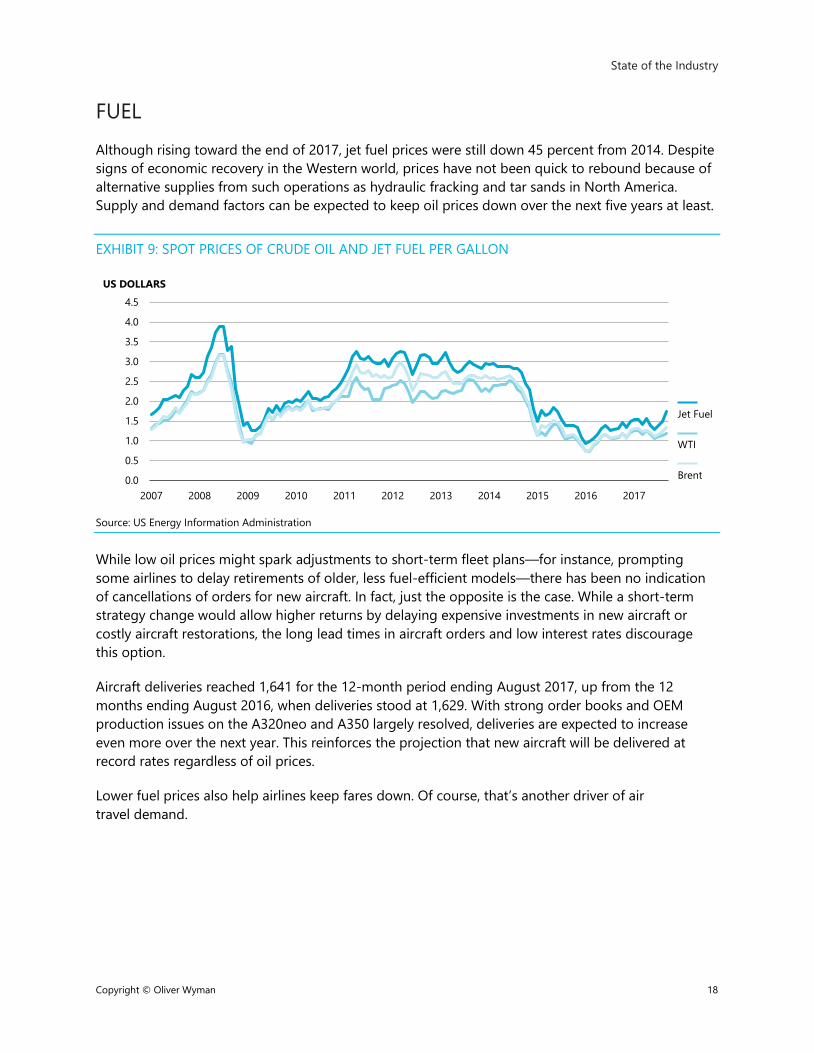
FUEL Although rising toward the end of 2017, jet fuel prices were still down 45 percent from 2014. Despite signs of economic recovery in the Western world, prices have not been quick to rebound because of alternative supplies from such operations as hydraulic fracking and tar sands in North America. Supply and demand factors can be expected to keep oil prices down over the next five years at least.
EXHIBIT 9: SPOT PRICES OF CRUDE OIL AND JET FUEL PER GALLON
Source: US Energy Information Administration
While low oil prices might spark adjustments to short-term fleet plans—for instance, prompting some airlines to delay retirements of older, less fuel-efficient models—there has been no indication of cancellations of orders for new aircraft. In fact, just the opposite is the case. While a short-term strategy change would allow higher returns by delaying expensive investments in new aircraft or costly aircraft restorations, the long lead times in aircraft orders and low interest rates discourage this option.
Aircraft deliveries reached 1,641 for the 12-month period ending August 2017, up from the 12 months ending August 2016, when deliveries stood at 1,629. With strong order books and OEM production issues on the A320neo and A350 largely resolved, deliveries are expected to increase even more over the next year. This reinforces the projection that new aircraft will be delivered at record rates regardless of oil prices.
Lower fuel prices also help airlines keep fares down. Of course, that’s another driver of air travel demand.
0.0
0.5
1.0
1.5
2.0
2.5
3.0
3.5
4.0
4.5
2007 2008 2009 2010 2011 2012 2013 2014 2015 2016 2017
US DOLLARS
Brent
Jet Fuel
WTI
State of the Industry
Copyright © Oliver Wyman 19
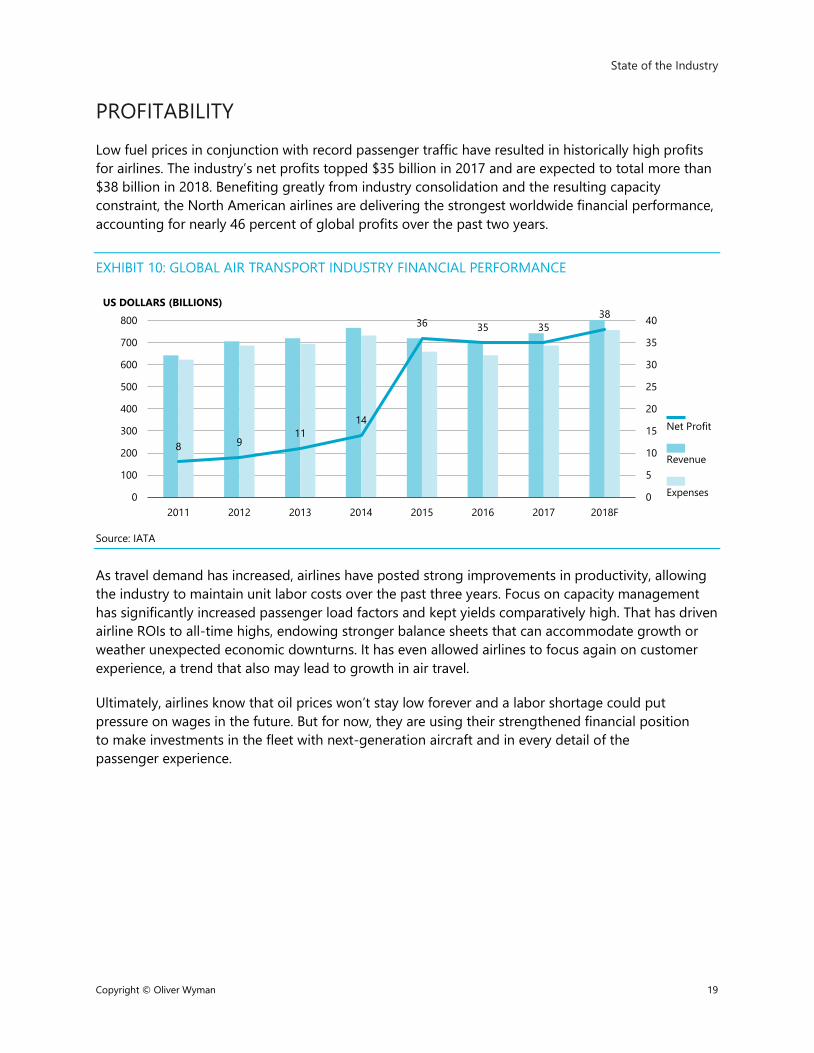
PROFITABILITY Low fuel prices in conjunction with record passenger traffic have resulted in historically high profits for airlines. The industry’s net profits topped $35 billion in 2017 and are expected to total more than $38 billion in 2018. Benefiting greatly from industry consolidation and the resulting capacity constraint, the North American airlines are delivering the strongest worldwide financial performance, accounting for nearly 46 percent of global profits over the past two years.
EXHIBIT 10: GLOBAL AIR TRANSPORT INDUSTRY FINANCIAL PERFORMANCE
Source: IATA
As travel demand has increased, airlines have posted strong improvements in productivity, allowing the industry to maintain unit labor costs over the past three years. Focus on capacity management has significantly increased passenger load factors and kept yields comparatively high. That has driven airline ROIs to all-time highs, endowing stronger balance sheets that can accommodate growth or weather unexpected economic downturns. It has even allowed airlines to focus again on customer experience, a trend that also may lead to growth in air travel.
Ultimately, airlines know that oil prices won’t stay low forever and a labor shortage could put pressure on wages in the future. But for now, they are using their strengthened financial position to make investments in the fleet with next-generation aircraft and in every detail of the passenger experience.
8 911
14
36 35 3538
0
5
10
15
20
25
30
35
40
0
100
200
300
400
500
600
700
800
2011 2012 2013 2014 2015 2016 2017 2018F
US DOLLARS (BILLIONS)
Net Profit
Expenses
Revenue

3 FLEET FORECAST
Fleet Forecast
Copyright © Oliver Wyman 21
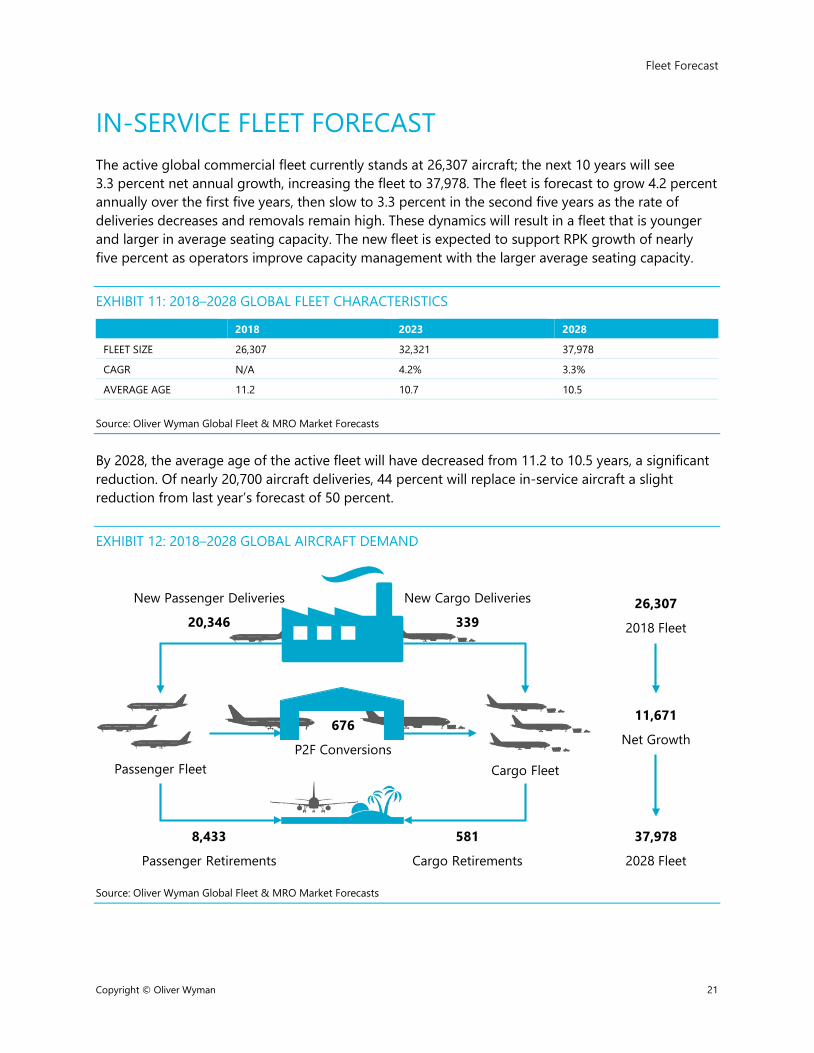
IN-SERVICE FLEET FORECAST The active global commercial fleet currently stands at 26,307 aircraft; the next 10 years will see 3.3 percent net annual growth, increasing the fleet to 37,978. The fleet is forecast to grow 4.2 percent annually over the first five years, then slow to 3.3 percent in the second five years as the rate of deliveries decreases and removals remain high. These dynamics will result in a fleet that is younger and larger in average seating capacity. The new fleet is expected to support RPK growth of nearly five percent as operators improve capacity management with the larger average seating capacity.
EXHIBIT 11: 2018–2028 GLOBAL FLEET CHARACTERISTICS
2018 2023 2028
FLEET SIZE 26,307 32,321 37,978
CAGR N/A 4.2% 3.3%
AVERAGE AGE 11.2 10.7 10.5 Source: Oliver Wyman Global Fleet & MRO Market Forecasts
By 2028, the average age of the active fleet will have decreased from 11.2 to 10.5 years, a significant reduction. Of nearly 20,700 aircraft deliveries, 44 percent will replace in-service aircraft a slight reduction from last year’s forecast of 50 percent.
EXHIBIT 12: 2018–2028 GLOBAL AIRCRAFT DEMAND
Source: Oliver Wyman Global Fleet & MRO Market Forecasts
New Cargo Deliveries
339
New Passenger Deliveries
20,346
581
Cargo Retirements
8,433
Passenger Retirements
Passenger Fleet
676
P2F ConversionsCargo Fleet
37,978
2028 Fleet
11,671
Net Growth
26,307
2018 Fleet
Fleet Forecast
Copyright © Oliver Wyman 22
The passenger fleet is forecast to grow nearly 11,700 by 2028, while the cargo fleet is forecast to grow by 434 aircraft. Of new deliveries, 1.6 percent is forecast to be cargo aircraft. Two-thirds of the cargo aircraft introduced over the forecast period will be passenger-to-freighter (P2F) conversions.
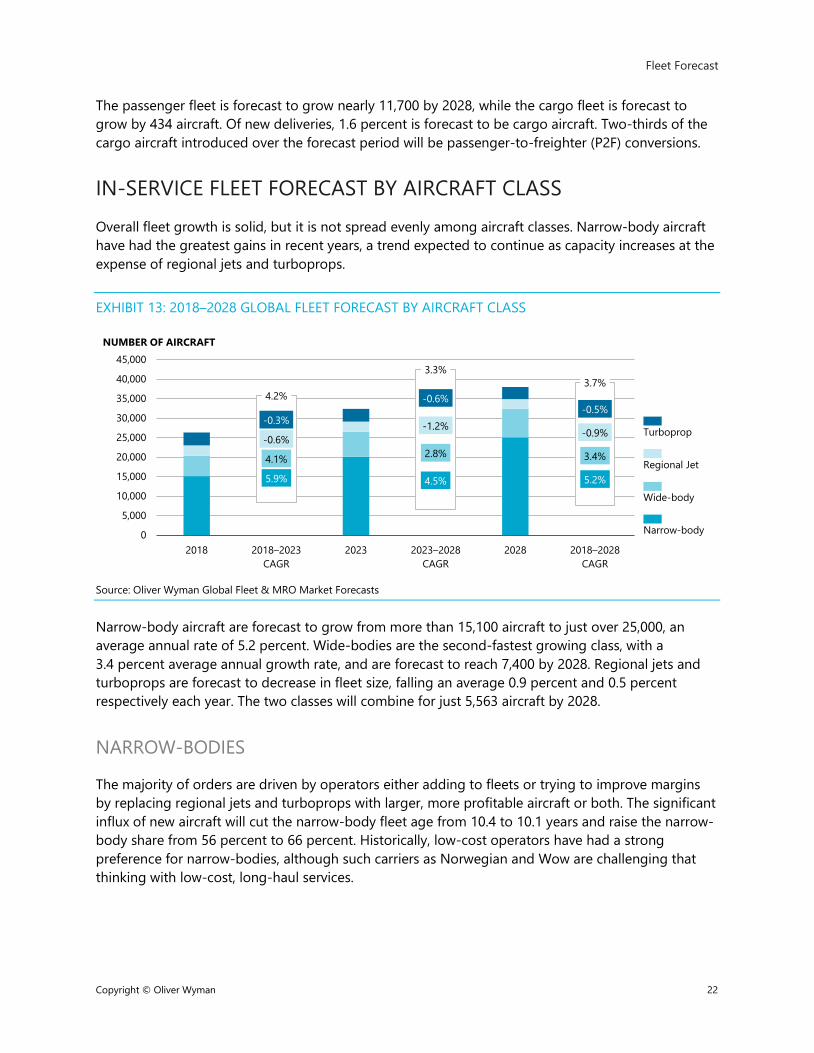
IN-SERVICE FLEET FORECAST BY AIRCRAFT CLASS Overall fleet growth is solid, but it is not spread evenly among aircraft classes. Narrow-body aircraft have had the greatest gains in recent years, a trend expected to continue as capacity increases at the expense of regional jets and turboprops.
EXHIBIT 13: 2018–2028 GLOBAL FLEET FORECAST BY AIRCRAFT CLASS
Source: Oliver Wyman Global Fleet & MRO Market Forecasts
Narrow-body aircraft are forecast to grow from more than 15,100 aircraft to just over 25,000, an average annual rate of 5.2 percent. Wide-bodies are the second-fastest growing class, with a 3.4 percent average annual growth rate, and are forecast to reach 7,400 by 2028. Regional jets and turboprops are forecast to decrease in fleet size, falling an average 0.9 percent and 0.5 percent respectively each year. The two classes will combine for just 5,563 aircraft by 2028.
NARROW-BODIES
The majority of orders are driven by operators either adding to fleets or trying to improve margins by replacing regional jets and turboprops with larger, more profitable aircraft or both. The significant influx of new aircraft will cut the narrow-body fleet age from 10.4 to 10.1 years and raise the narrow-body share from 56 percent to 66 percent. Historically, low-cost operators have had a strong preference for narrow-bodies, although such carriers as Norwegian and Wow are challenging that thinking with low-cost, long-haul services.
5.9%
4.1%
-0.6%
-0.3%
4.5%
2.8%
-1.2%
-0.6%
5.2%
3.4%
-0.9%
-0.5%4.2%
3.3%3.7%
0
5,000
10,000
15,000
20,000
25,000
30,000
35,000
40,000
45,000
2018 2018–2023CAGR
2023 2023–2028CAGR
2028 2018–2028CAGR
NUMBER OF AIRCRAFT
Narrow-body
Wide-body
Regional Jet
Turboprop
Fleet Forecast
Copyright © Oliver Wyman 23
EXHIBIT 14: 2018–2028 NARROW-BODY FLEET CHARACTERISTICS
2017 2022 2027
FLEET SIZE 15,092 20,068 25,038
CAGR N/A 5.9% 4.5%
MARKET SHARE 56% 62% 66%
AVERAGE AGE 10.4 10.0 10.1 Source: Oliver Wyman Global Fleet & MRO Market Forecasts
For the first time, Boeing and Airbus narrow-bodies are being challenged by the Bombardier C Series, COMAC’s C919 and Irkut’s MC-21. However, the C Series program experienced delays that surrendered the entry into service timing advantage it originally had over the A320neo and 737MAX, both of which experienced no development delays and have the efficiency gains the latest technology engines offer similar to the C Series. The Chinese C919 and Russian MC-21 will serve only a small portion of operators in their home countries, given certification hurdles in other parts of the world. Even with new competitors, the Boeing 737 and Airbus A320 platforms are forecast to account for 92 percent of all narrow-body deliveries through 2028.
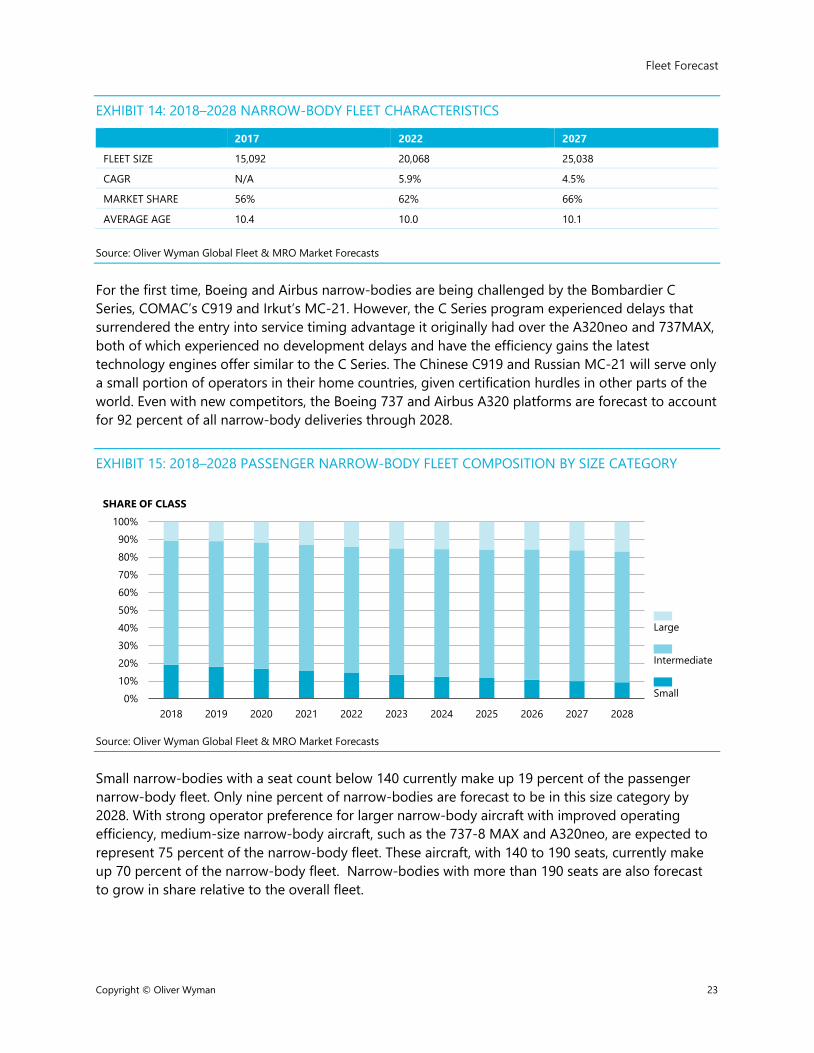
EXHIBIT 15: 2018–2028 PASSENGER NARROW-BODY FLEET COMPOSITION BY SIZE CATEGORY
Source: Oliver Wyman Global Fleet & MRO Market Forecasts
Small narrow-bodies with a seat count below 140 currently make up 19 percent of the passenger narrow-body fleet. Only nine percent of narrow-bodies are forecast to be in this size category by 2028. With strong operator preference for larger narrow-body aircraft with improved operating efficiency, medium-size narrow-body aircraft, such as the 737-8 MAX and A320neo, are expected to represent 75 percent of the narrow-body fleet. These aircraft, with 140 to 190 seats, currently make up 70 percent of the narrow-body fleet. Narrow-bodies with more than 190 seats are also forecast to grow in share relative to the overall fleet.
0%10%20%30%40%50%60%70%80%90%
100%
2018 2019 2020 2021 2022 2023 2024 2025 2026 2027 2028
SHARE OF CLASS
Small
Intermediate
Large
Fleet Forecast
Copyright © Oliver Wyman 24
EXHIBIT 16: 2018–2028 NARROW-BODY AIRCRAFT SIZE CATEGORIES
SMALL INTERMEDIATE LARGE
SEAT COUNT <140 140–190 >190
AIRCRAFT TYPE VARIANT 737-700 A319 C SERIES
737-7 MAX, 737-800, 737-8 MAX, 737-900 A319neo, A320, A320neo Irkut MC-21 COMAC C919
737-9 MAX, 737-10 MAX 737 MAX 200 A321, A321neo
Source: Oliver Wyman Global Fleet & MRO Market Forecasts
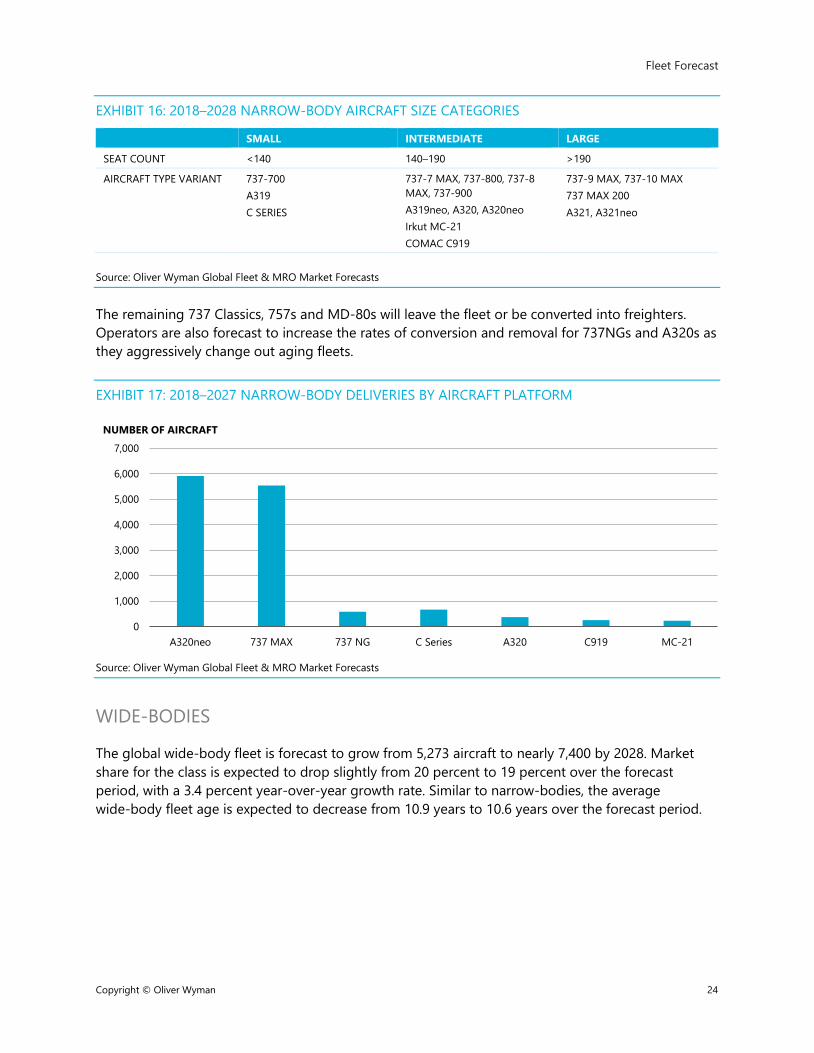
The remaining 737 Classics, 757s and MD-80s will leave the fleet or be converted into freighters. Operators are also forecast to increase the rates of conversion and removal for 737NGs and A320s as they aggressively change out aging fleets.
EXHIBIT 17: 2018–2027 NARROW-BODY DELIVERIES BY AIRCRAFT PLATFORM
Source: Oliver Wyman Global Fleet & MRO Market Forecasts
WIDE-BODIES
The global wide-body fleet is forecast to grow from 5,273 aircraft to nearly 7,400 by 2028. Market share for the class is expected to drop slightly from 20 percent to 19 percent over the forecast period, with a 3.4 percent year-over-year growth rate. Similar to narrow-bodies, the average widebody fleet age is expected to decrease from 10.9 years to 10.6 years over the forecast period.
0
1,000
2,000
3,000
4,000
5,000
6,000
7,000
A320neo 737 MAX 737 NG C Series A320 C919 MC-21
NUMBER OF AIRCRAFT
Fleet Forecast
Copyright © Oliver Wyman 25
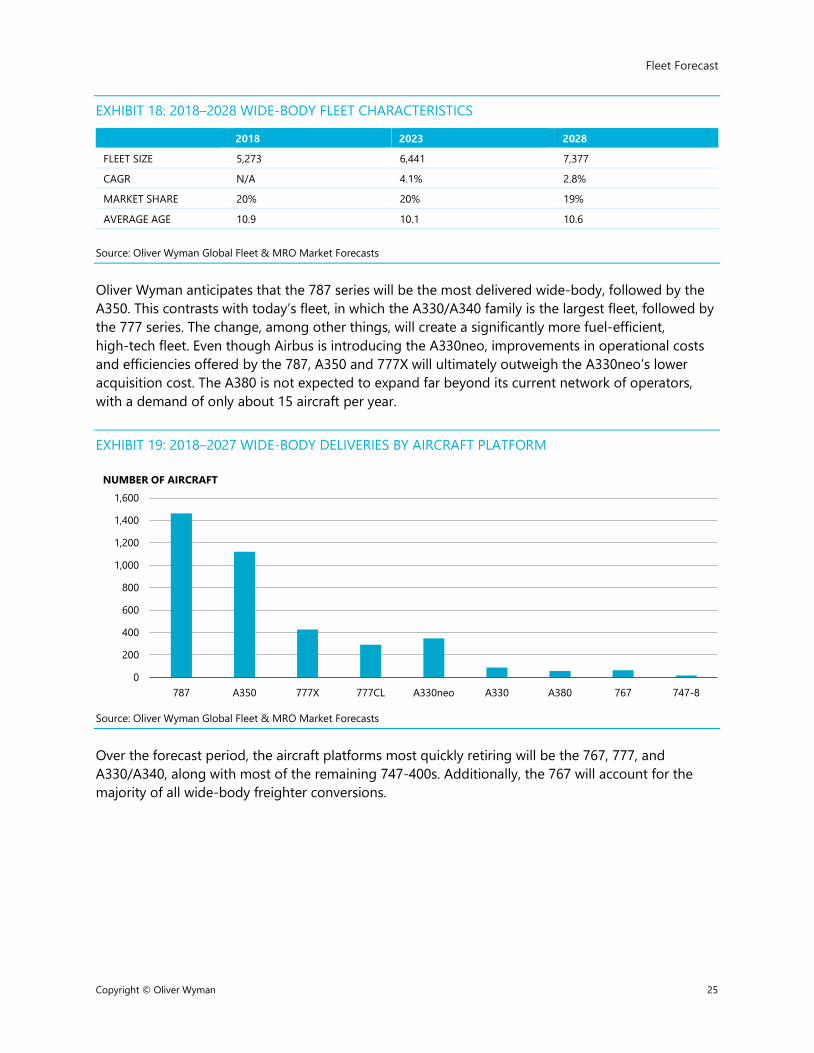
EXHIBIT 18: 2018–2028 WIDE-BODY FLEET CHARACTERISTICS
2018 2023 2028
FLEET SIZE 5,273 6,441 7,377
CAGR N/A 4.1% 2.8%
MARKET SHARE 20% 20% 19%
AVERAGE AGE 10.9 10.1 10.6 Source: Oliver Wyman Global Fleet & MRO Market Forecasts
Oliver Wyman anticipates that the 787 series will be the most delivered wide-body, followed by the A350. This contrasts with today’s fleet, in which the A330/A340 family is the largest fleet, followed by the 777 series. The change, among other things, will create a significantly more fuel-efficient, hightech fleet. Even though Airbus is introducing the A330neo, improvements in operational costs and efficiencies offered by the 787, A350 and 777X will ultimately outweigh the A330neo’s lower acquisition cost. The A380 is not expected to expand far beyond its current network of operators, with a demand of only about 15 aircraft per year.
EXHIBIT 19: 2018–2027 WIDE-BODY DELIVERIES BY AIRCRAFT PLATFORM
Source: Oliver Wyman Global Fleet & MRO Market Forecasts
Over the forecast period, the aircraft platforms most quickly retiring will be the 767, 777, and A330/A340, along with most of the remaining 747-400s. Additionally, the 767 will account for the majority of all wide-body freighter conversions.
0
200
400
600
800
1,000
1,200
1,400
1,600
787 A350 777X 777CL A330neo A330 A380 767 747-8
NUMBER OF AIRCRAFT
Fleet Forecast
Copyright © Oliver Wyman 26
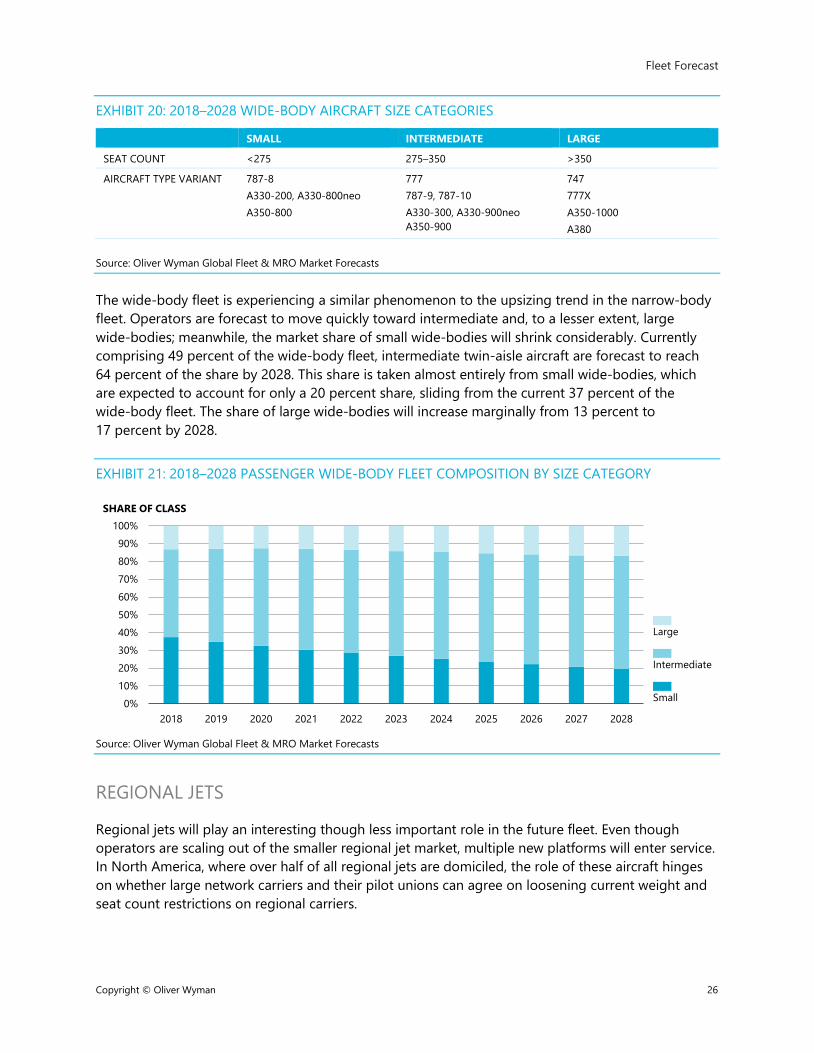
EXHIBIT 20: 2018–2028 WIDE-BODY AIRCRAFT SIZE CATEGORIES
SMALL INTERMEDIATE LARGE
SEAT COUNT <275 275–350 >350
AIRCRAFT TYPE VARIANT 787-8 A330-200, A330-800neo A350-800
777 787-9, 787-10 A330-300, A330-900neo A350900
747 777X A350-1000 A380
Source: Oliver Wyman Global Fleet & MRO Market Forecasts
The wide-body fleet is experiencing a similar phenomenon to the upsizing trend in the narrow-body fleet. Operators are forecast to move quickly toward intermediate and, to a lesser extent, large widebodies; meanwhile, the market share of small wide-bodies will shrink considerably. Currently comprising 49 percent of the wide-body fleet, intermediate twin-aisle aircraft are forecast to reach 64 percent of the share by 2028. This share is taken almost entirely from small wide-bodies, which are expected to account for only a 20 percent share, sliding from the current 37 percent of the widebody fleet. The share of large wide-bodies will increase marginally from 13 percent to 17 percent by 2028.
EXHIBIT 21: 2018–2028 PASSENGER WIDE-BODY FLEET COMPOSITION BY SIZE CATEGORY
Source: Oliver Wyman Global Fleet & MRO Market Forecasts
REGIONAL JETS
Regional jets will play an interesting though less important role in the future fleet. Even though operators are scaling out of the smaller regional jet market, multiple new platforms will enter service. In North America, where over half of all regional jets are domiciled, the role of these aircraft hinges on whether large network carriers and their pilot unions can agree on loosening current weight and seat count restrictions on regional carriers.
0%10%20%30%40%50%60%70%80%90%
100%
2018 2019 2020 2021 2022 2023 2024 2025 2026 2027 2028
SHARE OF CLASS
Small
Intermediate
Large
Fleet Forecast
Copyright © Oliver Wyman 27
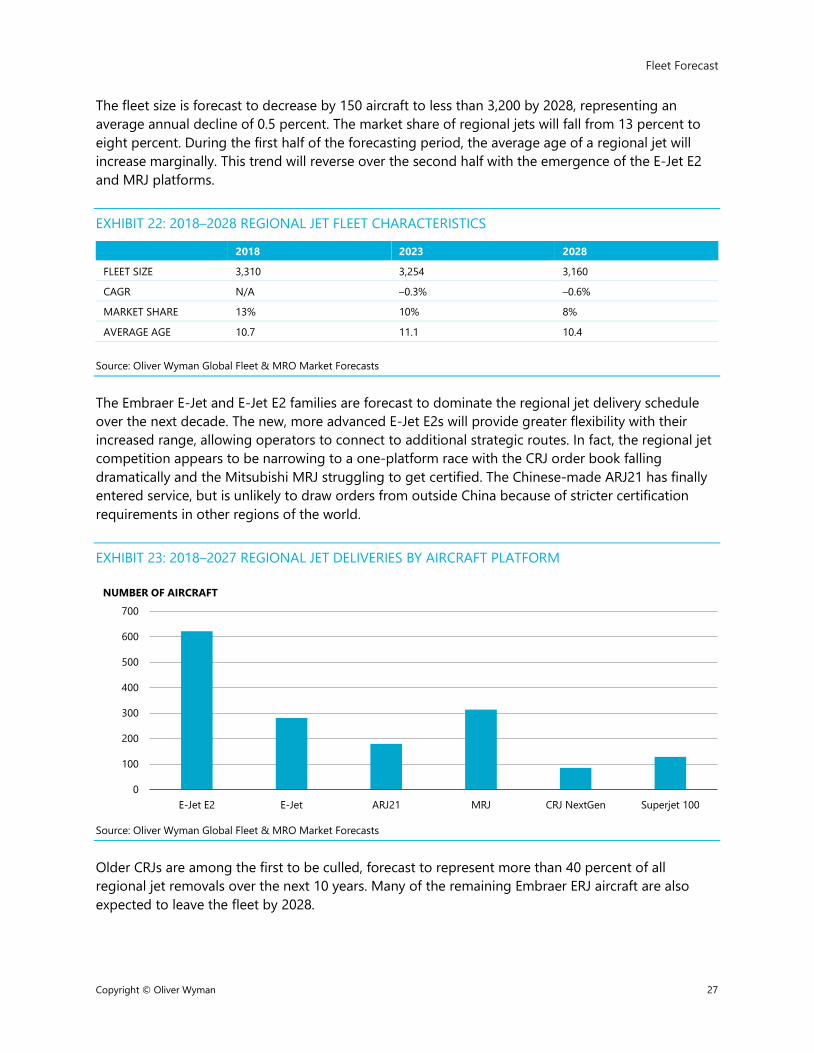
The fleet size is forecast to decrease by 150 aircraft to less than 3,200 by 2028, representing an average annual decline of 0.5 percent. The market share of regional jets will fall from 13 percent to eight percent. During the first half of the forecasting period, the average age of a regional jet will increase marginally. This trend will reverse over the second half with the emergence of the EJet E2 and MRJ platforms.
EXHIBIT 22: 2018–2028 REGIONAL JET FLEET CHARACTERISTICS
2018 2023 2028
FLEET SIZE 3,310 3,254 3,160
CAGR N/A –0.3% –0.6%
MARKET SHARE 13% 10% 8%
AVERAGE AGE 10.7 11.1 10.4 Source: Oliver Wyman Global Fleet & MRO Market Forecasts
The Embraer EJet and EJet E2 families are forecast to dominate the regional jet delivery schedule over the next decade. The new, more advanced EJet E2s will provide greater flexibility with their increased range, allowing operators to connect to additional strategic routes. In fact, the regional jet competition appears to be narrowing to a one-platform race with the CRJ order book falling dramatically and the Mitsubishi MRJ struggling to get certified. The Chinese-made ARJ21 has finally entered service, but is unlikely to draw orders from outside China because of stricter certification requirements in other regions of the world.
EXHIBIT 23: 2018–2027 REGIONAL JET DELIVERIES BY AIRCRAFT PLATFORM
Source: Oliver Wyman Global Fleet & MRO Market Forecasts
Older CRJs are among the first to be culled, forecast to represent more than 40 percent of all regional jet removals over the next 10 years. Many of the remaining Embraer ERJ aircraft are also expected to leave the fleet by 2028.
0
100
200
300
400
500
600
700
E-Jet E2 E-Jet ARJ21 MRJ CRJ NextGen Superjet 100
NUMBER OF AIRCRAFT
Fleet Forecast
Copyright © Oliver Wyman 28
TURBOPROPS
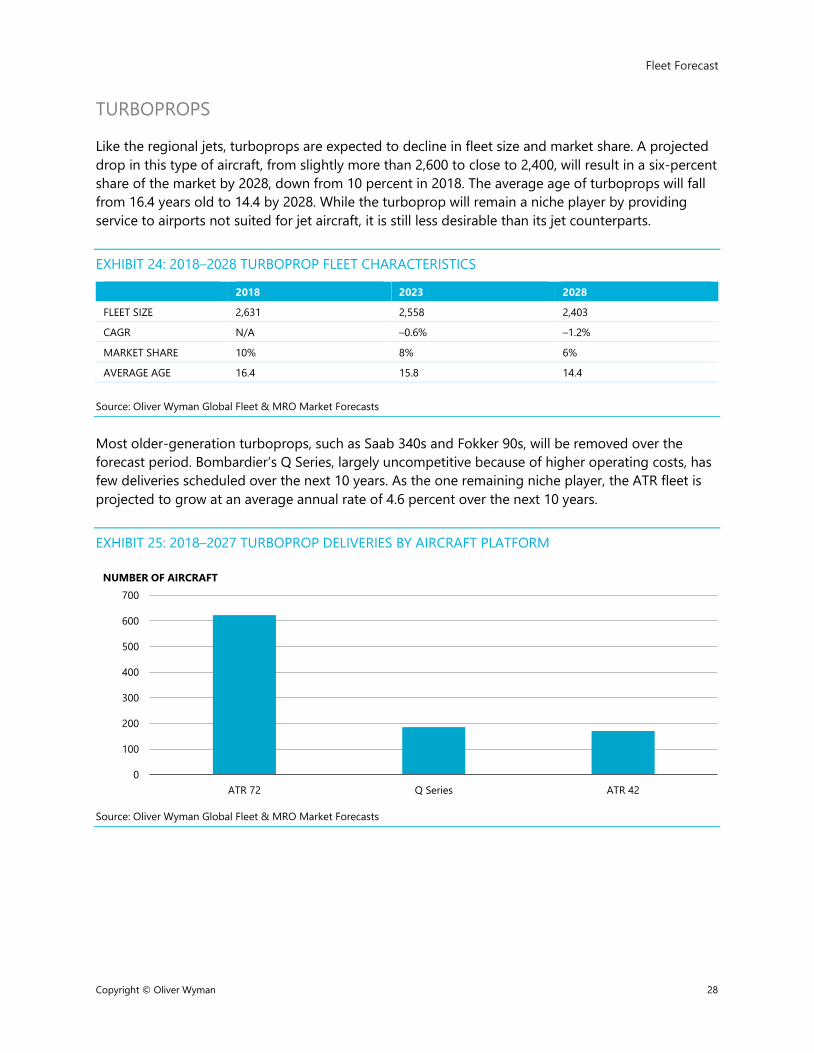
Like the regional jets, turboprops are expected to decline in fleet size and market share. A projected drop in this type of aircraft, from slightly more than 2,600 to close to 2,400, will result in a six-percent share of the market by 2028, down from 10 percent in 2018. The average age of turboprops will fall from 16.4 years old to 14.4 by 2028. While the turboprop will remain a niche player by providing service to airports not suited for jet aircraft, it is still less desirable than its jet counterparts.
EXHIBIT 24: 2018–2028 TURBOPROP FLEET CHARACTERISTICS
2018 2023 2028
FLEET SIZE 2,631 2,558 2,403
CAGR N/A –0.6% –1.2%
MARKET SHARE 10% 8% 6%
AVERAGE AGE 16.4 15.8 14.4 Source: Oliver Wyman Global Fleet & MRO Market Forecasts
Most older-generation turboprops, such as Saab 340s and Fokker 90s, will be removed over the forecast period. Bombardier’s Q Series, largely uncompetitive because of higher operating costs, has few deliveries scheduled over the next 10 years. As the one remaining niche player, the ATR fleet is projected to grow at an average annual rate of 4.6 percent over the next 10 years.
EXHIBIT 25: 2018–2027 TURBOPROP DELIVERIES BY AIRCRAFT PLATFORM
Source: Oliver Wyman Global Fleet & MRO Market Forecasts
0
100
200
300
400
500
600
700
ATR 72 Q Series ATR 42
NUMBER OF AIRCRAFT
Fleet Forecast
Copyright © Oliver Wyman 29
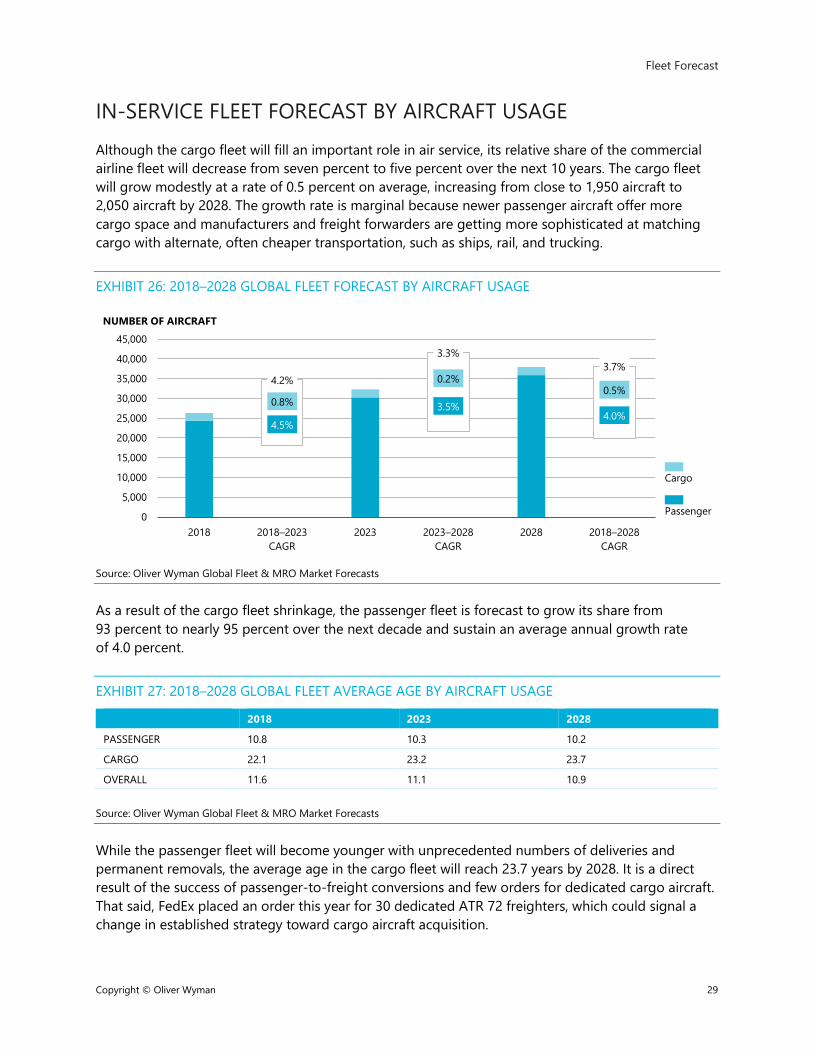
IN-SERVICE FLEET FORECAST BY AIRCRAFT USAGE Although the cargo fleet will fill an important role in air service, its relative share of the commercial airline fleet will decrease from seven percent to five percent over the next 10 years. The cargo fleet will grow modestly at a rate of 0.5 percent on average, increasing from close to 1,950 aircraft to 2,050 aircraft by 2028. The growth rate is marginal because newer passenger aircraft offer more cargo space and manufacturers and freight forwarders are getting more sophisticated at matching cargo with alternate, often cheaper transportation, such as ships, rail, and trucking.
EXHIBIT 26: 2018–2028 GLOBAL FLEET FORECAST BY AIRCRAFT USAGE
Source: Oliver Wyman Global Fleet & MRO Market Forecasts
As a result of the cargo fleet shrinkage, the passenger fleet is forecast to grow its share from 93 percent to nearly 95 percent over the next decade and sustain an average annual growth rate of 4.0 percent.
EXHIBIT 27: 2018–2028 GLOBAL FLEET AVERAGE AGE BY AIRCRAFT USAGE
2018 2023 2028
PASSENGER 10.8 10.3 10.2
CARGO 22.1 23.2 23.7
OVERALL 11.6 11.1 10.9 Source: Oliver Wyman Global Fleet & MRO Market Forecasts
While the passenger fleet will become younger with unprecedented numbers of deliveries and permanent removals, the average age in the cargo fleet will reach 23.7 years by 2028. It is a direct result of the success of passenger-to-freight conversions and few orders for dedicated cargo aircraft. That said, FedEx placed an order this year for 30 dedicated ATR 72 freighters, which could signal a change in established strategy toward cargo aircraft acquisition.
4.5%
0.8% 3.5%
0.2%
4.0%
0.5%4.2%
3.3%3.7%
0
5,000
10,000
15,000
20,000
25,000
30,000
35,000
40,000
45,000
2018 2018–2023CAGR
2023 2023–2028CAGR
2028 2018–2028CAGR
NUMBER OF AIRCRAFT
Passenger
Cargo
Fleet Forecast
Copyright © Oliver Wyman 30
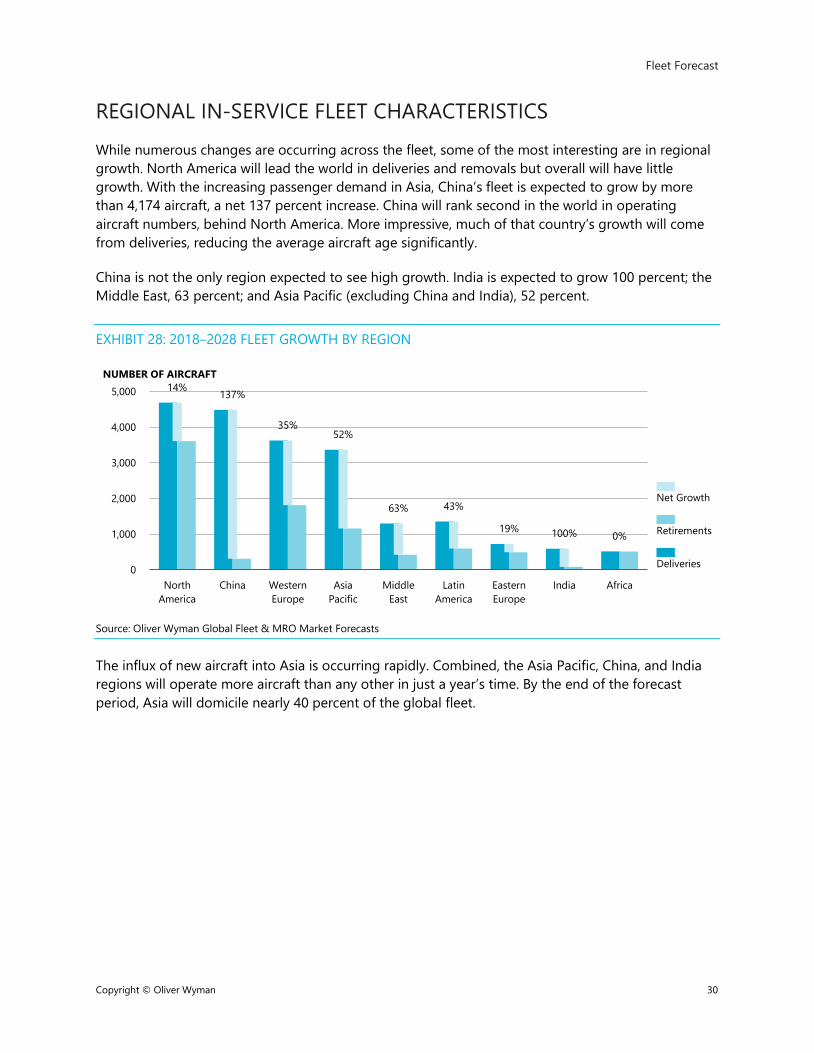
REGIONAL IN-SERVICE FLEET CHARACTERISTICS While numerous changes are occurring across the fleet, some of the most interesting are in regional growth. North America will lead the world in deliveries and removals but overall will have little growth. With the increasing passenger demand in Asia, China’s fleet is expected to grow by more than 4,174 aircraft, a net 137 percent increase. China will rank second in the world in operating aircraft numbers, behind North America. More impressive, much of that country’s growth will come from deliveries, reducing the average aircraft age significantly.
China is not the only region expected to see high growth. India is expected to grow 100 percent; the Middle East, 63 percent; and Asia Pacific (excluding China and India), 52 percent.
EXHIBIT 28: 2018–2028 FLEET GROWTH BY REGION
Source: Oliver Wyman Global Fleet & MRO Market Forecasts
The influx of new aircraft into Asia is occurring rapidly. Combined, the Asia Pacific, China, and India regions will operate more aircraft than any other in just a year’s time. By the end of the forecast period, Asia will domicile nearly 40 percent of the global fleet.
14% 137%
35%52%
63% 43%
19% 100% 0%
0
1,000
2,000
3,000
4,000
5,000
NorthAmerica
China WesternEurope
AsiaPacific
MiddleEast
LatinAmerica
EasternEurope
India Africa
Deliveries
Retirements
Net Growth
NUMBER OF AIRCRAFT
Fleet Forecast
Copyright © Oliver Wyman 31
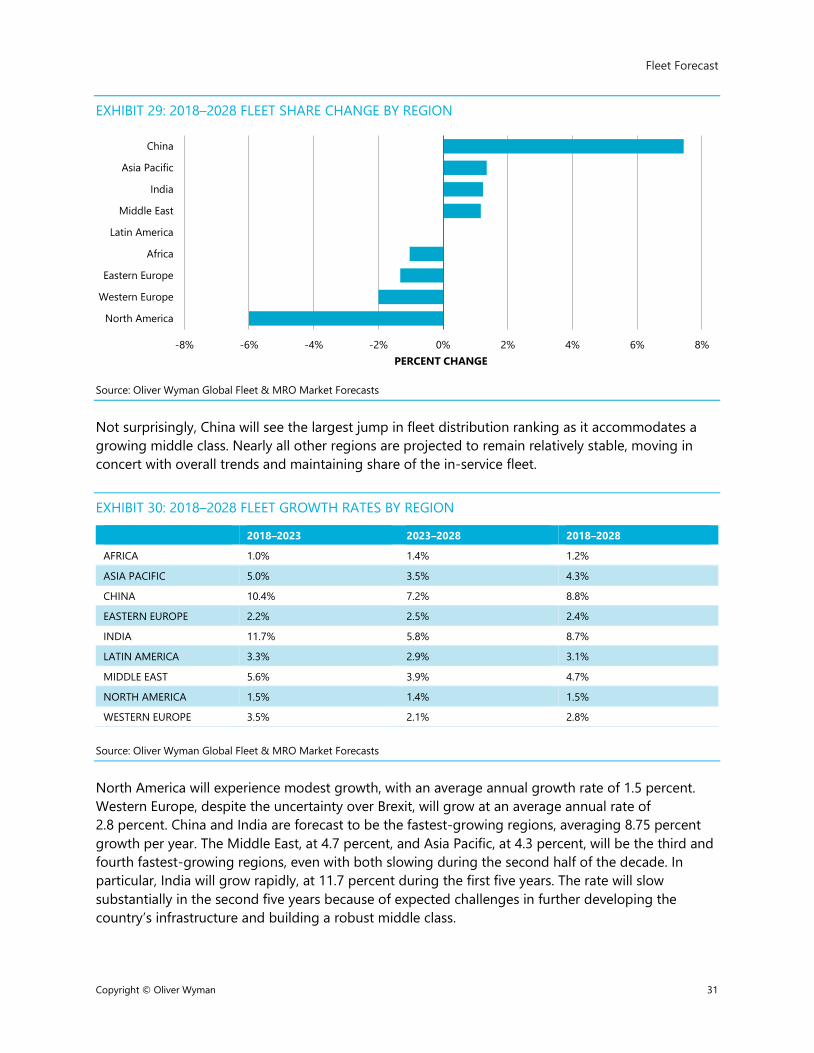
EXHIBIT 29: 2018–2028 FLEET SHARE CHANGE BY REGION
Source: Oliver Wyman Global Fleet & MRO Market Forecasts
Not surprisingly, China will see the largest jump in fleet distribution ranking as it accommodates a growing middle class. Nearly all other regions are projected to remain relatively stable, moving in concert with overall trends and maintaining share of the in-service fleet.
EXHIBIT 30: 2018–2028 FLEET GROWTH RATES BY REGION
2018–2023 2023–2028 2018–2028
AFRICA 1.0% 1.4% 1.2%
ASIA PACIFIC 5.0% 3.5% 4.3%
CHINA 10.4% 7.2% 8.8%
EASTERN EUROPE 2.2% 2.5% 2.4%
INDIA 11.7% 5.8% 8.7%
LATIN AMERICA 3.3% 2.9% 3.1%
MIDDLE EAST 5.6% 3.9% 4.7%
NORTH AMERICA 1.5% 1.4% 1.5%
WESTERN EUROPE 3.5% 2.1% 2.8% Source: Oliver Wyman Global Fleet & MRO Market Forecasts
North America will experience modest growth, with an average annual growth rate of 1.5 percent. Western Europe, despite the uncertainty over Brexit, will grow at an average annual rate of 2.8 percent. China and India are forecast to be the fastest-growing regions, averaging 8.75 percent growth per year. The Middle East, at 4.7 percent, and Asia Pacific, at 4.3 percent, will be the third and fourth fastest-growing regions, even with both slowing during the second half of the decade. In particular, India will grow rapidly, at 11.7 percent during the first five years. The rate will slow substantially in the second five years because of expected challenges in further developing the country’s infrastructure and building a robust middle class.
-8% -6% -4% -2% 0% 2% 4% 6% 8%
North America
Western Europe
Eastern Europe
Africa
Latin America
Middle East
India
Asia Pacific
China
PERCENT CHANGE
Fleet Forecast
Copyright © Oliver Wyman 32
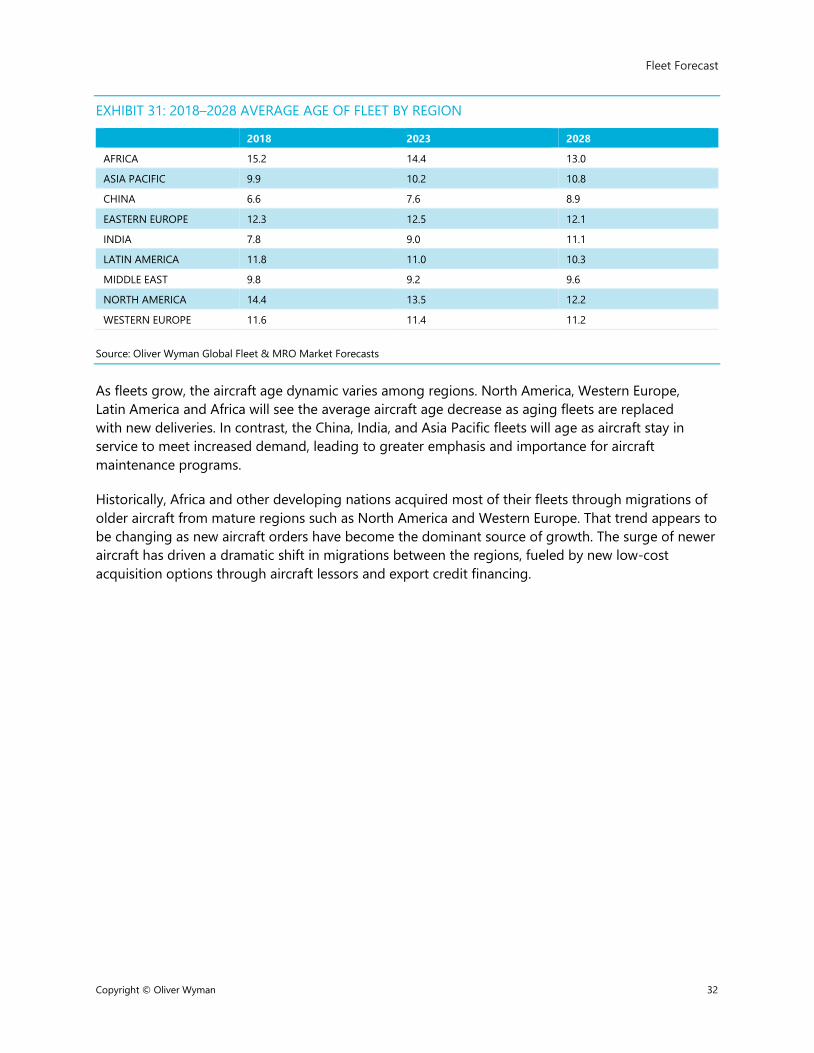
EXHIBIT 31: 2018–2028 AVERAGE AGE OF FLEET BY REGION
2018 2023 2028
AFRICA 15.2 14.4 13.0
ASIA PACIFIC 9.9 10.2 10.8
CHINA 6.6 7.6 8.9
EASTERN EUROPE 12.3 12.5 12.1
INDIA 7.8 9.0 11.1
LATIN AMERICA 11.8 11.0 10.3
MIDDLE EAST 9.8 9.2 9.6
NORTH AMERICA 14.4 13.5 12.2
WESTERN EUROPE 11.6 11.4 11.2 Source: Oliver Wyman Global Fleet & MRO Market Forecasts
As fleets grow, the aircraft age dynamic varies among regions. North America, Western Europe, Latin America and Africa will see the average aircraft age decrease as aging fleets are replaced with new deliveries. In contrast, the China, India, and Asia Pacific fleets will age as aircraft stay in service to meet increased demand, leading to greater emphasis and importance for aircraft maintenance programs.
Historically, Africa and other developing nations acquired most of their fleets through migrations of older aircraft from mature regions such as North America and Western Europe. That trend appears to be changing as new aircraft orders have become the dominant source of growth. The surge of newer aircraft has driven a dramatic shift in migrations between the regions, fueled by new low-cost acquisition options through aircraft lessors and export credit financing.
Fleet Forecast
Copyright © Oliver Wyman 33
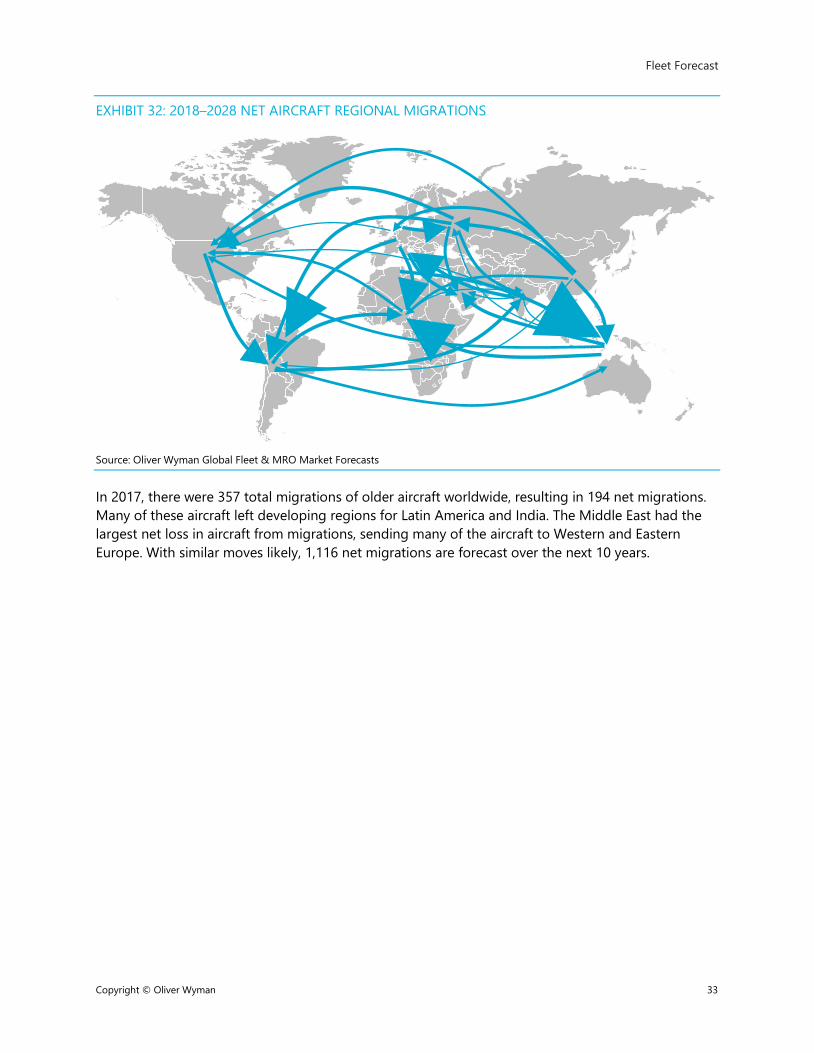
EXHIBIT 32: 2018–2028 NET AIRCRAFT REGIONAL MIGRATIONS
Source: Oliver Wyman Global Fleet & MRO Market Forecasts
In 2017, there were 357 total migrations of older aircraft worldwide, resulting in 194 net migrations. Many of these aircraft left developing regions for Latin America and India. The Middle East had the largest net loss in aircraft from migrations, sending many of the aircraft to Western and Eastern Europe. With similar moves likely, 1,116 net migrations are forecast over the next 10 years.

4 MRO MARKET FORECAST
MRO Market Forecast
Copyright © Oliver Wyman 35
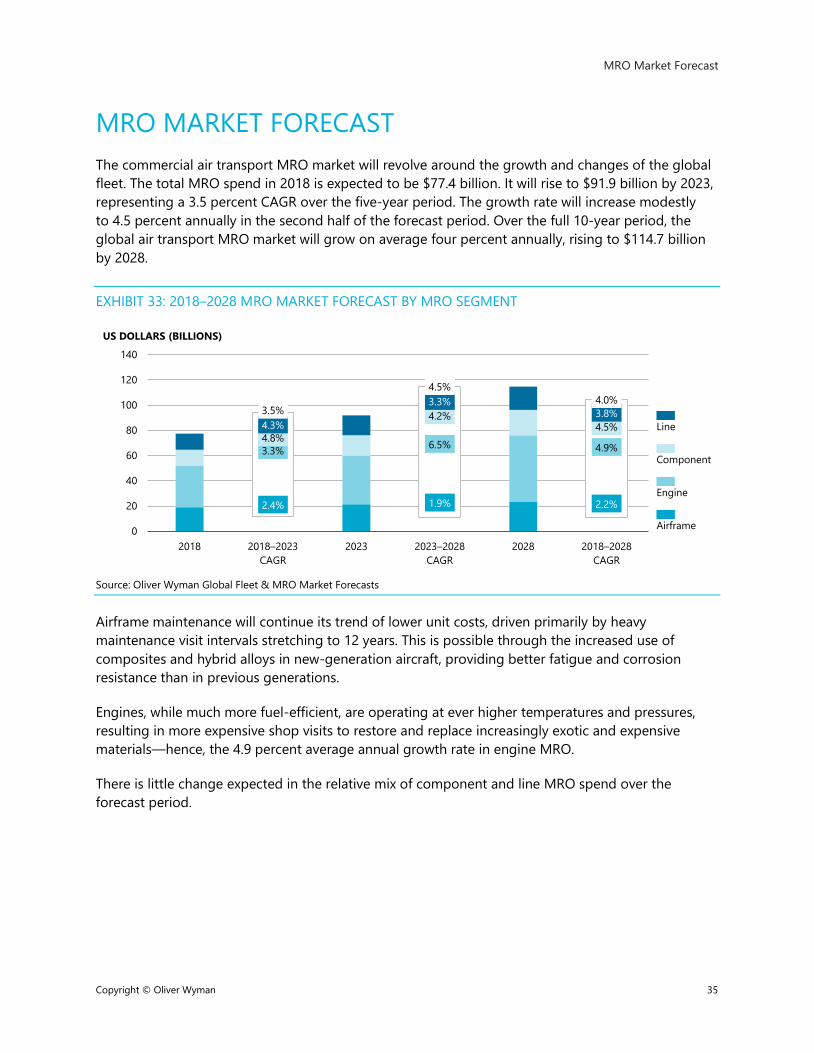
MRO MARKET FORECAST The commercial air transport MRO market will revolve around the growth and changes of the global fleet. The total MRO spend in 2018 is expected to be $77.4 billion. It will rise to $91.9 billion by 2023, representing a 3.5 percent CAGR over the five-year period. The growth rate will increase modestly to 4.5 percent annually in the second half of the forecast period. Over the full 10-year period, the global air transport MRO market will grow on average four percent annually, rising to $114.7 billion by 2028.
EXHIBIT 33: 2018–2028 MRO MARKET FORECAST BY MRO SEGMENT
Source: Oliver Wyman Global Fleet & MRO Market Forecasts
Airframe maintenance will continue its trend of lower unit costs, driven primarily by heavy maintenance visit intervals stretching to 12 years. This is possible through the increased use of composites and hybrid alloys in new-generation aircraft, providing better fatigue and corrosion resistance than in previous generations.
Engines, while much more fuel-efficient, are operating at ever higher temperatures and pressures, resulting in more expensive shop visits to restore and replace increasingly exotic and expensive materials—hence, the 4.9 percent average annual growth rate in engine MRO.
There is little change expected in the relative mix of component and line MRO spend over the forecast period.
2.4%
3.3%4.8%4.3%
1.9%
6.5%
4.2%3.3%
2.2%
4.9%
4.5%3.8%3.5%
4.5%4.0%
0
20
40
60
80
100
120
140
2018 2018–2023CAGR
2023 2023–2028CAGR
2028 2018–2028CAGR
US DOLLARS (BILLIONS)
Airframe
Engine
Component
Line
MRO Market Forecast
Copyright © Oliver Wyman 36
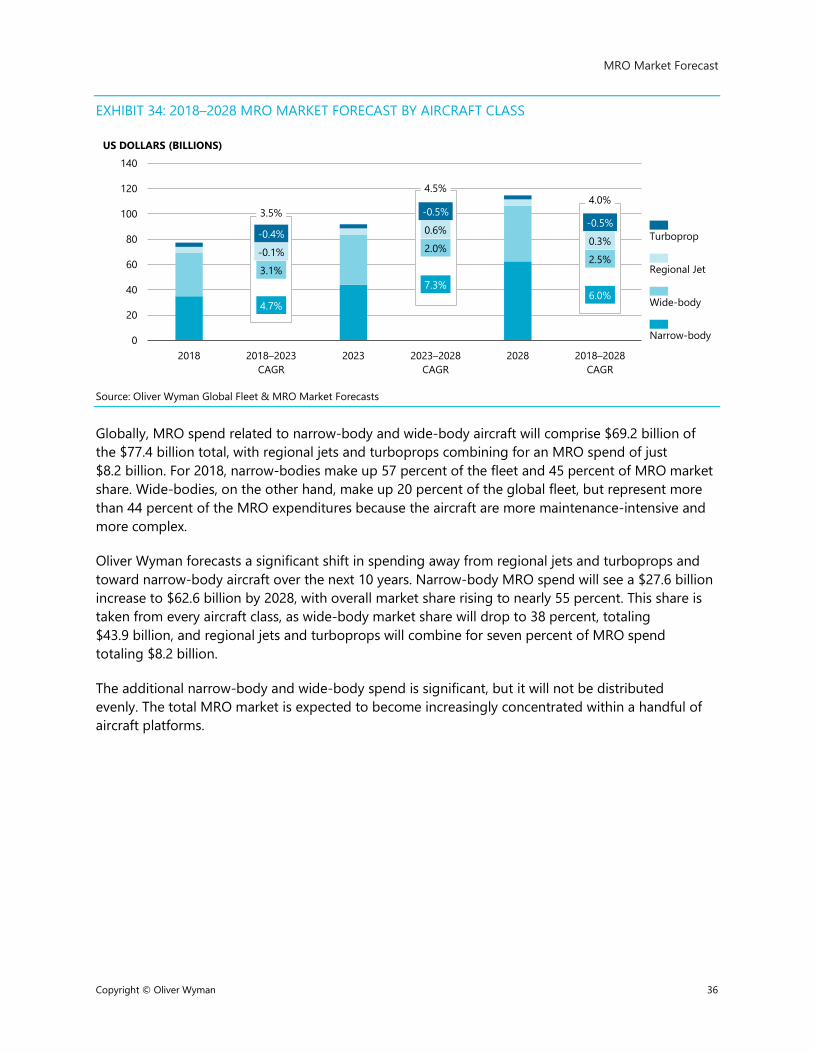
EXHIBIT 34: 2018–2028 MRO MARKET FORECAST BY AIRCRAFT CLASS
Source: Oliver Wyman Global Fleet & MRO Market Forecasts
Globally, MRO spend related to narrow-body and wide-body aircraft will comprise $69.2 billion of the $77.4 billion total, with regional jets and turboprops combining for an MRO spend of just $8.2 billion. For 2018, narrow-bodies make up 57 percent of the fleet and 45 percent of MRO market share. Wide-bodies, on the other hand, make up 20 percent of the global fleet, but represent more than 44 percent of the MRO expenditures because the aircraft are more maintenance-intensive and more complex.
Oliver Wyman forecasts a significant shift in spending away from regional jets and turboprops and toward narrow-body aircraft over the next 10 years. Narrow-body MRO spend will see a $27.6 billion increase to $62.6 billion by 2028, with overall market share rising to nearly 55 percent. This share is taken from every aircraft class, as wide-body market share will drop to 38 percent, totaling $43.9 billion, and regional jets and turboprops will combine for seven percent of MRO spend totaling $8.2 billion.
The additional narrow-body and wide-body spend is significant, but it will not be distributed evenly. The total MRO market is expected to become increasingly concentrated within a handful of aircraft platforms.
4.7%
3.1%-0.1%-0.4%
7.3%
2.0%0.6%-0.5%
6.0%
2.5%0.3%-0.5%
3.5%
4.5%4.0%
0
20
40
60
80
100
120
140
2018 2018–2023CAGR
2023 2023–2028CAGR
2028 2018–2028CAGR
US DOLLARS (BILLIONS)
Narrow-body
Wide-body
Regional Jet
Turboprop
MRO Market Forecast
Copyright © Oliver Wyman 37
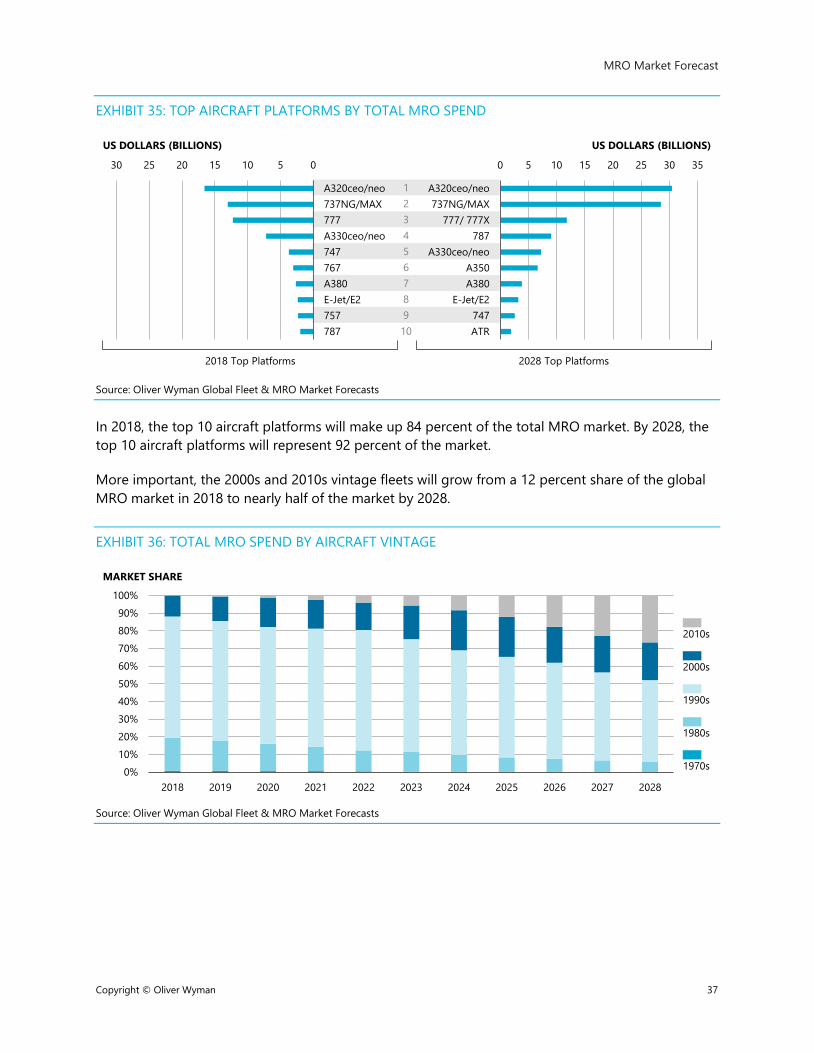
EXHIBIT 35: TOP AIRCRAFT PLATFORMS BY TOTAL MRO SPEND
Source: Oliver Wyman Global Fleet & MRO Market Forecasts
In 2018, the top 10 aircraft platforms will make up 84 percent of the total MRO market. By 2028, the top 10 aircraft platforms will represent 92 percent of the market.
More important, the 2000s and 2010s vintage fleets will grow from a 12 percent share of the global MRO market in 2018 to nearly half of the market by 2028.
EXHIBIT 36: TOTAL MRO SPEND BY AIRCRAFT VINTAGE
Source: Oliver Wyman Global Fleet & MRO Market Forecasts
12345678910
051015202530
A320ceo/neo737NG/MAX777A330ceo/neo747767A380E-Jet/E2757787
0 5 10 15 20 25 30 35
A320ceo/neo737NG/MAX
777/ 777X787
A330ceo/neoA350A380
E-Jet/E2747ATR
US DOLLARS (BILLIONS) US DOLLARS (BILLIONS)
2018 Top Platforms 2028 Top Platforms
0%10%20%30%40%50%60%70%80%90%
100%
2018 2019 2020 2021 2022 2023 2024 2025 2026 2027 2028
MARKET SHARE
1970s
1980s
1990s
2000s
2010s
MRO Market Forecast
Copyright © Oliver Wyman 38
Given the rapid transition to new-generation aircraft over the next decade, it’s evident that MRO providers must prepare for the work associated with the newer fleet types or focus their strategy to capture end-of-life markets. From an airframe MRO perspective, providers must be able to handle the new composite and metal matrix materials dominant in the latest-generation aircraft, such as the 787 and A350. Advancements include much more sophisticated avionics and systems that interface with health monitoring technology, designed to recognize pending system or component failures. This new era of “big data” capture and processing will require a clear strategy to take full advantage of its potential.
Challenges extend to component and line maintenance MRO providers as well. Component MROs need the capital to acquire testing equipment and licenses to access OEM manuals and data for these new parts. Line maintenance providers will face challenges related to training and the use of the new aircraft health monitoring systems, fault isolation systems, and software configuration protocols.
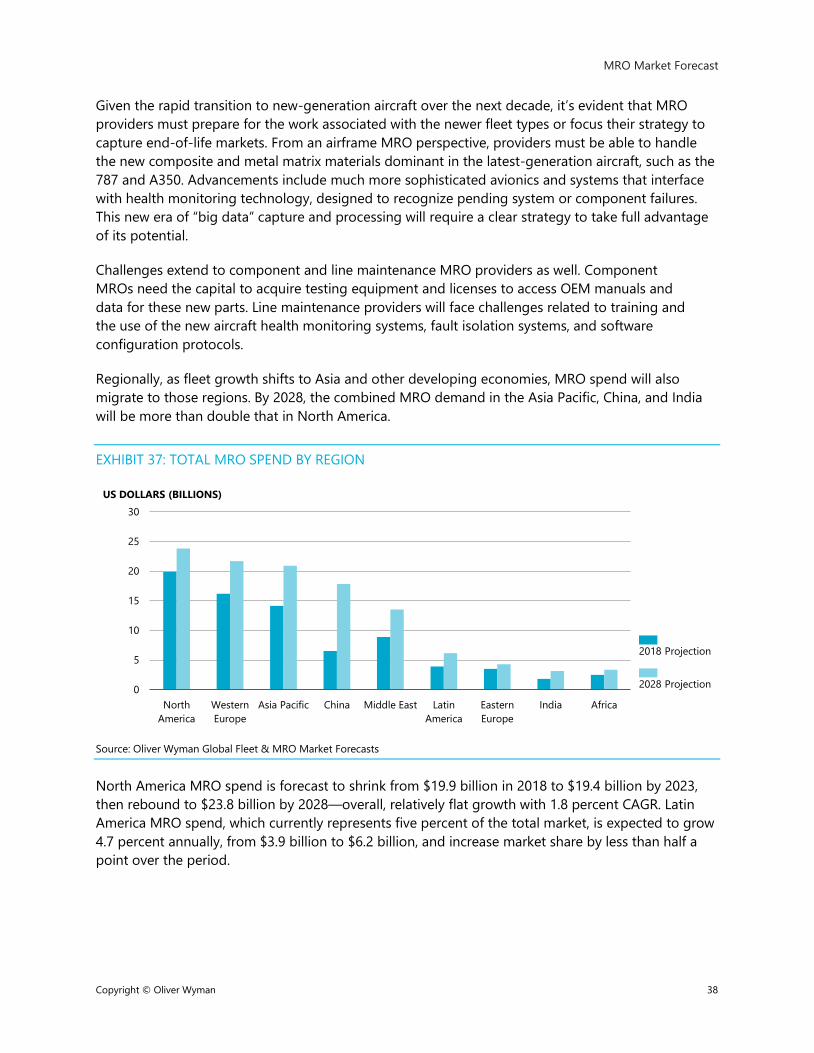
Regionally, as fleet growth shifts to Asia and other developing economies, MRO spend will also migrate to those regions. By 2028, the combined MRO demand in the Asia Pacific, China, and India will be more than double that in North America.
EXHIBIT 37: TOTAL MRO SPEND BY REGION
Source: Oliver Wyman Global Fleet & MRO Market Forecasts
North America MRO spend is forecast to shrink from $19.9 billion in 2018 to $19.4 billion by 2023, then rebound to $23.8 billion by 2028—overall, relatively flat growth with 1.8 percent CAGR. Latin America MRO spend, which currently represents five percent of the total market, is expected to grow 4.7 percent annually, from $3.9 billion to $6.2 billion, and increase market share by less than half a point over the period.
0
5
10
15
20
25
30
NorthAmerica
WesternEurope
Asia Pacific China Middle East LatinAmerica
EasternEurope
India Africa
US DOLLARS (BILLIONS)
2018 Projection
2028 Projection
MRO Market Forecast
Copyright © Oliver Wyman 39
European MRO spend is expected to fare marginally better than that of North America. Western Europe MRO, as it grows at three percent annually, will lose four percentage points of market share and add $5.5 billion to its current $16.2 billion MRO demand. Eastern Europe, though continuing to suffer from economic sanctions placed on Russia, is forecast to increase two percent annually.
Growing at a 4.3 percent average annual rate, the Middle East is expected to add over $4.6 billion in MRO demand and will constitute nearly 12 percent of the global MRO market by 2028. Africa, highly subject to terrorism and political unrest, is still expected to grow three percent per year and will retain its current three percent market share.
Asia, as has been the case for years, remains the driver of MRO growth. India is forecast to grow 5.6 percent annually but will represent less than three percent of the market. The Asia Pacific region will grow at a healthy four percent annually, with MRO demand levels rising to equal those of Western Europe and North America. China, forecast to jump 10.6 percent annually, is expected to increase market size to nearly 16 percent of world MRO.
While China will be the key driver of MRO spend growth in Asia, rising labor costs, coupled with temporary infrastructure and capacity constraints, are likely to force Chinese operators to look to countries south and east to fulfill maintenance needs.
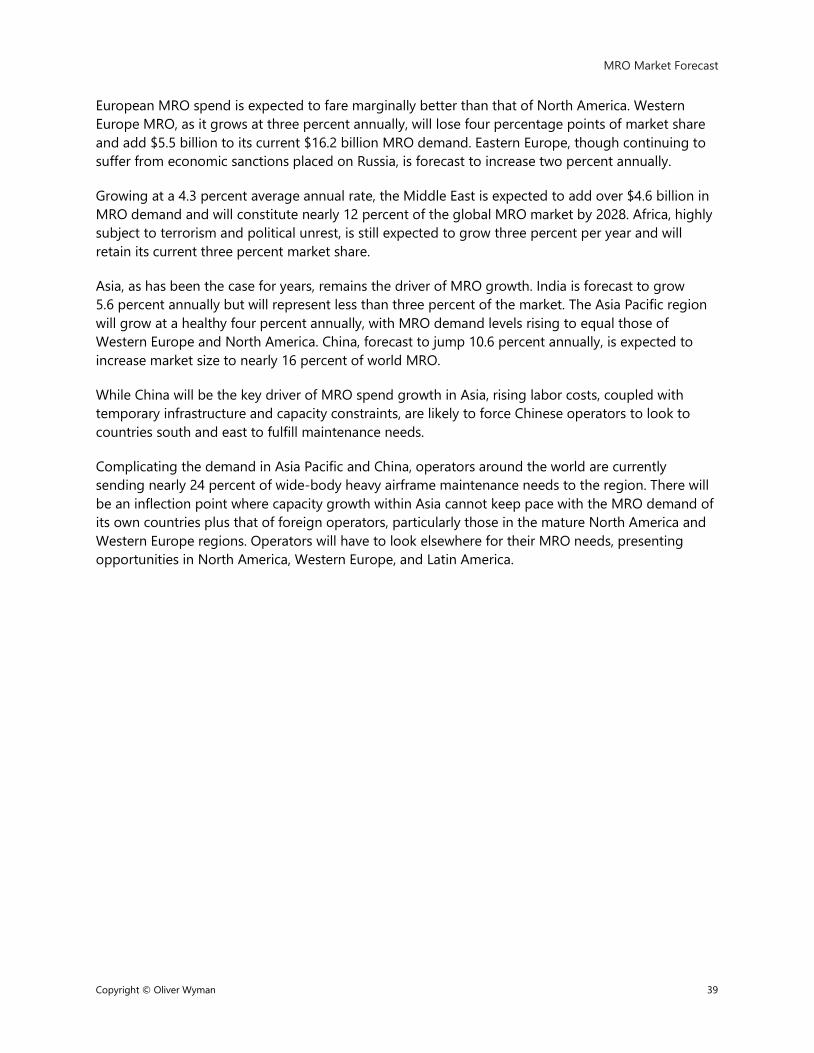
Complicating the demand in Asia Pacific and China, operators around the world are currently sending nearly 24 percent of wide-body heavy airframe maintenance needs to the region. There will be an inflection point where capacity growth within Asia cannot keep pace with the MRO demand of its own countries plus that of foreign operators, particularly those in the mature North America and Western Europe regions. Operators will have to look elsewhere for their MRO needs, presenting opportunities in North America, Western Europe, and Latin America.
MRO Market Forecast
Copyright © Oliver Wyman 40
EXHIBIT 38: NORTH AMERICA AND WESTERN EUROPE WIDE-BODY HEAVY AIRFRAME MAINTENANCE IMPORTED FROM ASIA
Source: Oliver Wyman Global Fleet & MRO Market Forecasts
MROs can target wide-body work currently performed by Asia-based MROs with the introduction of new capacity and the development of the necessary technical skills. As regional labor rates move toward global parity, MROs that invest in new wide-body capabilities and can deliver a high-quality, on-time product will be positioned to capture market share from operators that get squeezed out of the Asia market.
Notwithstanding the potential, capturing market share will not be simple. Even when labor rate parity is reached, Asian MROs have demonstrated the capacity and skills to secure long-term contracts. Although MROs in developing regions do have wide-body capability, investment in facilities, equipment, tooling, and training is essential. Paying the cost of capital for expansion will be a necessity to compete.
The repatriating of wide-body heavy maintenance work will create some revenue growth in otherwise stagnant MRO markets in North America and Western Europe; a global focus is needed to meet the growing demand being generated in Asia.
MROs are already expanding facilities to increase capacity and opening operations closer to their Asian customers. Adding and improving facilities is not a silver bullet; better use of process analysis and production methodology to reduce errors, rework, and turn times, as well as to expedite material or repair delivery, will increase capacity and competitiveness. Increasing capacity, capability, and efficiency can be combined with partnerships for engineering and workforce development to maximize growth in any market, particularly a better-positioned region.
$312 MIMPORTED
North America
$77 MIMPORTED
Western Europe
$139 MEXPORTED
China
$250 MEXPORTED
Asia Pacific
Other Region Exports/Imports
Exported to Mature Markets
Imported from Asia
M = Millions, B = Billions

MRO Market Forecast
Copyright © Oliver Wyman 41
THIS PAGE IS INTENTIONALLY LEFT BLANK

5 ECONOMIC SENSITIVITY ANALYSIS
Economic Sensitivity Analysis
Copyright © Oliver Wyman 43
ECONOMIC SENSITIVITY ANALYSIS Forecasting, particularly over the long term, is complex and subject to many variables. This analysis is based on Oliver Wyman’s view of the most likely scenario, but slight changes in assumptions relating to the political and economic landscape can lead to considerable differences in the size and complexion of the global fleet and MRO market when the effects are amplified over time. Commercial airlines are highly subject to external influences, and it takes only one significant global event to alter the course of the industry. Given the degree of uncertainty surrounding particular economic and political variables over time, numerous scenarios are possible, each resulting in disparate fleet and MRO market predictions based on key factors.
EXHIBIT 39: FACTORS AFFECTING FORECASTING
Source: Oliver Wyman Global Fleet & MRO Market Forecasts
Global GDP, passenger traffic growth, jet fuel prices, and long-term interest rates are the four primary factors affecting growth in the global fleet and MRO market. These elements influence demand and therefore can alter airline fleet planning, ultimately affecting the delivery rate of new aircraft and the retirement rate of in-service aircraft. A climb in the global GDP would likely result in increased traffic for operators, leading to a greater demand for new aircraft. If the opposite occurs—a slowdown in the world economy that hurts demand—operators will likely alter fleet plan growth or even scale back to more closely match the demand. Alternatively, a significant jump in jet fuel prices would encourage airlines to increase retirements of old, less fuel-efficient aircraft. Interest rates at their current levels benefit operators and lessors as the cost of financing is very low. If interest rates continue to rise, operators may stick with their current fleets as the cost of borrowing increases.
The four factors impact the global fleet and MRO market with different magnitudes. Global GDP, a proxy for traffic growth, will contribute the most to potential changes to the fleet over the forecast period. If passenger and cargo growth is soaring, operators are going to supply the world with the appropriate number of seat and ton miles to handle demand regardless of fuel prices and interest rates.
GDP FUEL PRICESTRAFFIC INTEREST RATES
Economic Sensitivity Analysis
Copyright © Oliver Wyman 44
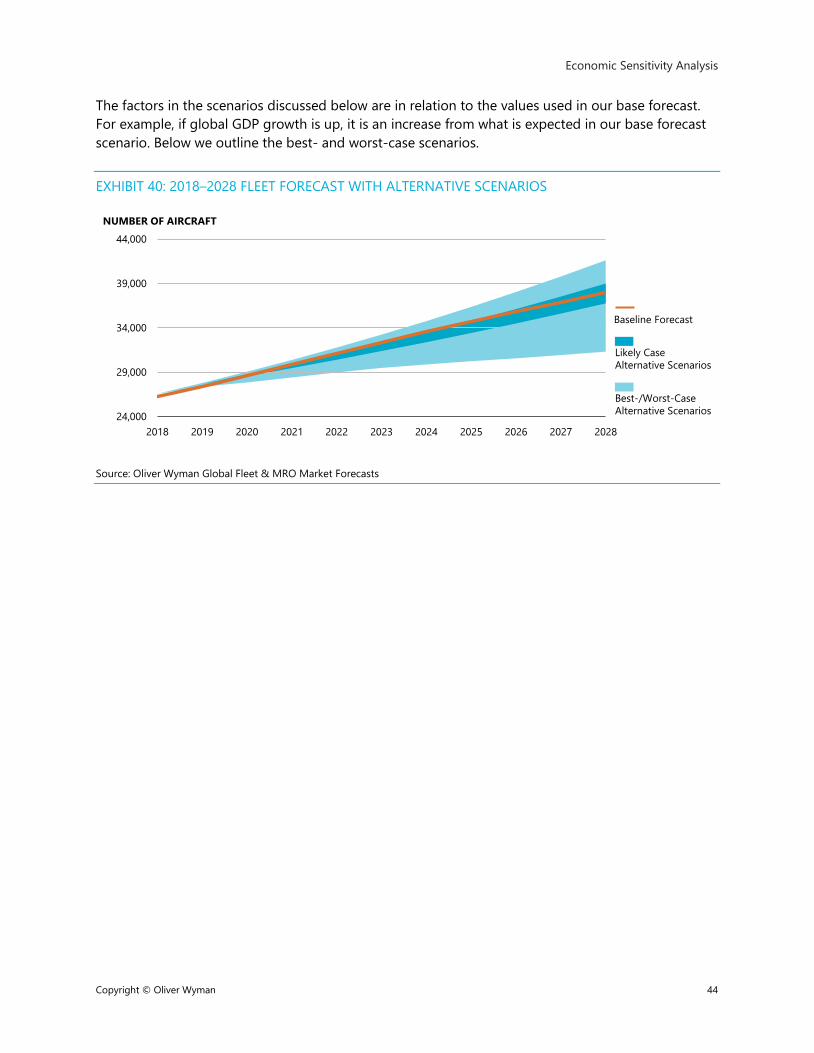
The factors in the scenarios discussed below are in relation to the values used in our base forecast. For example, if global GDP growth is up, it is an increase from what is expected in our base forecast scenario. Below we outline the best- and worst-case scenarios.
EXHIBIT 40: 2018–2028 FLEET FORECAST WITH ALTERNATIVE SCENARIOS
Source: Oliver Wyman Global Fleet & MRO Market Forecasts
24,000
29,000
34,000
39,000
44,000
2018 2019 2020 2021 2022 2023 2024 2025 2026 2027 202824,000
29,000
34,000
39,000
44,000
2016 2017 2018 2019 2020 2021 2022 2023 2024 2025 202624,000
29,000
34,000
39,000
44,000
2018 2019 2020 2021 2022 2023 2024 2025 2026 2027 2028
NUMBER OF AIRCRAFT
Best-/Worst-CaseAlternative Scenarios
Likely CaseAlternative Scenarios
Baseline Forecast
Economic Sensitivity Analysis
Copyright © Oliver Wyman 45
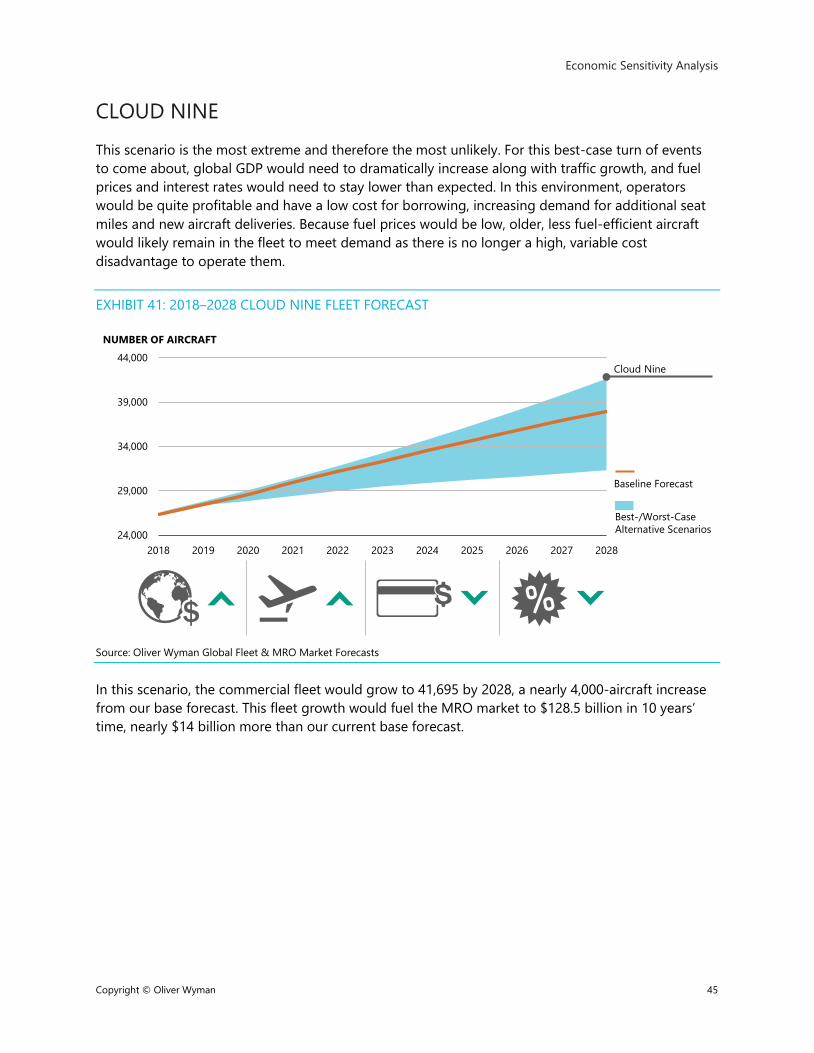
CLOUD NINE This scenario is the most extreme and therefore the most unlikely. For this best-case turn of events to come about, global GDP would need to dramatically increase along with traffic growth, and fuel prices and interest rates would need to stay lower than expected. In this environment, operators would be quite profitable and have a low cost for borrowing, increasing demand for additional seat miles and new aircraft deliveries. Because fuel prices would be low, older, less fuel-efficient aircraft would likely remain in the fleet to meet demand as there is no longer a high, variable cost disadvantage to operate them.
EXHIBIT 41: 2018–2028 CLOUD NINE FLEET FORECAST
Source: Oliver Wyman Global Fleet & MRO Market Forecasts
In this scenario, the commercial fleet would grow to 41,695 by 2028, a nearly 4,000-aircraft increase from our base forecast. This fleet growth would fuel the MRO market to $128.5 billion in 10 years’ time, nearly $14 billion more than our current base forecast.
24,000
29,000
34,000
39,000
44,000
2017 2018 2019 2020 2021 2022 2023 2024 2025 2026 202724,000
29,000
34,000
39,000
44,000
2018 2019 2020 2021 2022 2023 2024 2025 2026 2027 2028
NUMBER OF AIRCRAFT
Cloud Nine
Baseline Forecast
Best-/Worst-CaseAlternative Scenarios
Economic Sensitivity Analysis
Copyright © Oliver Wyman 46
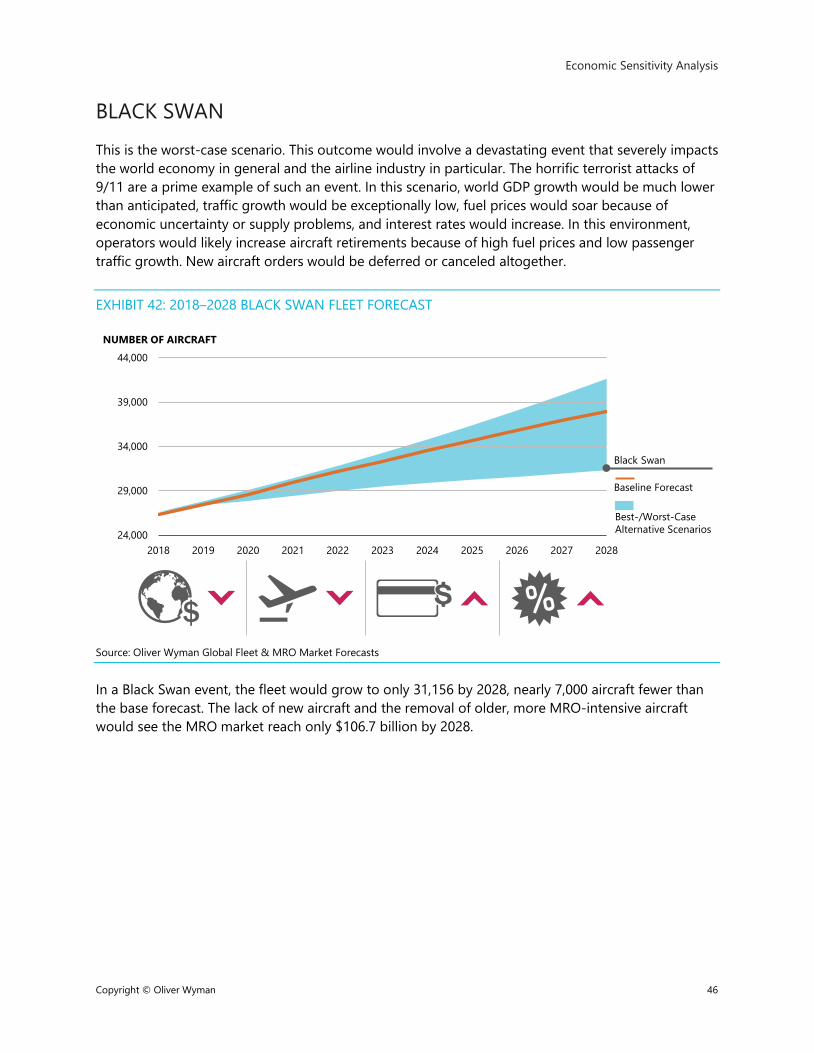
BLACK SWAN This is the worst-case scenario. This outcome would involve a devastating event that severely impacts the world economy in general and the airline industry in particular. The horrific terrorist attacks of 9/11 are a prime example of such an event. In this scenario, world GDP growth would be much lower than anticipated, traffic growth would be exceptionally low, fuel prices would soar because of economic uncertainty or supply problems, and interest rates would increase. In this environment, operators would likely increase aircraft retirements because of high fuel prices and low passenger traffic growth. New aircraft orders would be deferred or canceled altogether.
EXHIBIT 42: 2018–2028 BLACK SWAN FLEET FORECAST
Source: Oliver Wyman Global Fleet & MRO Market Forecasts
In a Black Swan event, the fleet would grow to only 31,156 by 2028, nearly 7,000 aircraft fewer than the base forecast. The lack of new aircraft and the removal of older, more MRO-intensive aircraft would see the MRO market reach only $106.7 billion by 2028.
24,000
29,000
34,000
39,000
44,000
2018 2019 2020 2021 2022 2023 2024 2025 2026 2027 202824,000
29,000
34,000
39,000
44,000
2018 2019 2020 2021 2022 2023 2024 2025 2026 2027 2028
NUMBER OF AIRCRAFT
Baseline Forecast
Black Swan
Best-/Worst-CaseAlternative Scenarios
Copyright © Oliver Wyman 47
RECENT PUBLICATIONS FROM OLIVER WYMAN
For these publications and other inquiries, please visit www.oliverwyman.com.
MOBILITY 2040 STAYING AHEAD OF DISRUPTION Our new research study of emerging trends and the future of passenger transport.
AIRLINE ECONOMIC ANALYSIS 2017–2018 An annual study that provides a detailed breakdown of airline economic data.
MRO SURVEY 2017 Insights from our latest survey of executives in the maintenance, repair, and overhaul (MRO) industry.
AUTOMOTIVE MANAGER 2017 Perspectives on the latest trends and issues in the automotive industry.
PERSPECTIVES ON MANUFACTURING INDUSTRIES A collection of viewpoints on challenges and trends in manufacturing.
VELOCITY JOURNAL Annual journal for the travel, transport, and logistics industries. Covers topics on innovation and business operations.
FORBES CONTRIBUTORSHIP Oliver Wyman’s transportation team regularly explores transformative ideas and technologies across travel and transport for Forbes.com.
NOW ARRIVING Oliver Wyman’s PlaneStats.com publishes an in-depth data chart each day. Subscribe to daily email delivery at www.planestats.com/ arrival_subscribe.
ABOUT OLIVER WYMAN
Oliver Wyman is a global leader in management consulting with offices in 50+ cities across 26 countries.
Our aviation, aerospace, and defense experts advise global, regional and cargo carriers, aerospace and defense OEMs and suppliers, airports, MROs, and other service providers in the transport and travel sector to grow shareholder and stakeholder value, optimize operations, and maximize commercial and organizational effectiveness.
The team’s capabilities also include: CAVOK, technical consulting on safety and compliance, maintenance programs, and certification (www.cavokgroup.com); analytical data tools at PlaneStats.com; and strategies and modeling for market share, network, and fleet planning analyses via our Network Simulation Center.
This deep industry expertise and our specialized capabilities make us a leader in serving the needs of the sector.
Oliver Wyman is a wholly owned subsidiary of Marsh & McLennan Companies [NYSE: MMC].
For more information, visit www.oliverwyman.com. Follow us on Twitter @OliverWyman
Copyright © 2018 Oliver Wyman
All rights reserved. This report may not be reproduced or redistributed, in whole or in part, without the written permission of Oliver Wyman and Oliver Wyman accepts no liability whatsoever for the actions of third parties in this respect.