Fair value accounting and financial stability - European Central Bank

3chapter
Fair Value accounting and Procyclicality
Since the 2007 market turmoil surround-ing complex structured credit products, fair value accounting (FVA) and its application through the business cycle
has been a topic of considerable debate. As the illiquidity of certain products became more severe, financial institutions turned increas-ingly to model-based valuations that, despite increased disclosure requirements, were nev-ertheless accompanied by growing opacity in the classification of products across the fair value (FV) spectrum. Moreover, under stressed liquidity conditions, financial institutions made wider use of unobservable inputs in their valu-ations, increasing uncertainty among financial institutions, supervisors, and investors regarding the valuation of financial products under such conditions.
It has been during this period that the pro-cyclical impact of FVA on bank balance sheets
and, more specifically, the valuation of com-plex financial instruments in illiquid markets came to the fore, raising questions on the use of market prices below “theoretical valuation” and the validity of “distressed sales.” Financial products were fair valued despite concerns that the current market prices were not an accurate reflection of the product’s underlying cash flows or of the price at which the instru-ment might eventually be sold. Sales decisions based on fair value pricing in a weak market with already falling prices resulted in further declines in market prices, reflecting a market illiquidity premium. Additionally, falling prices can, and did, activate margin calls and sale trig-gers that are components of risk management criteria, contributing further to the downward trend. As bank net worth is positively corre-lated with the business cycle, and as fair market values for collateral values fall, losses have been passed through to banks’ capital (Kashyap, 2005). The weakening of bank balance sheets and regulatory requirements for prudential capital replenishment has served to heighten concerns as to the future course of some mar-
105105
In light of the uncertainties about valuation highlighted by the 2007–08 mar-ket turbulence, this chapter provides an empirical examination of the potential procyclicality that fair value accounting (FVA) methods could introduce in bank balance sheets. The chapter finds that, while weaknesses in the FVA methodol-ogy may introduce unintended volatility and procyclicality, thus requiring some enhancements, it is still the preferred accounting framework for financial institutions. It concludes that capital buffers, forward-looking provisioning, and more refined disclosures can help to mitigate the procyclicality of FVA. The analysis presented does not preclude that there are other dimensions to FVA that are relevant and that, after further scrutiny, may indicate the need for additional refinements to the FVA methodology. Going forward, the valuation approaches for accounting, prudential measures, and risk management need to be reconciled and will require adjustments on the part of all parties.
Note: This chapter was written by a team led by Jodi Scarlata and comprised of Alicia Novoa and Juan Solé. Kenneth Sullivan provided consultancy support. Yoon Sook Kim provided research support, and Xiaobo Shao provided technical support.
chaPter 3 Fair Value accounting and Procyclicality
106
kets, the health of banks, and, more broadly, the financial system.
This chapter reviews the principles and application of fair value accounting and the implications of its features and how these impact bank balance sheets. Using a simple model, it provides empirical support for the public discussions regarding the procyclicality of FVA on bank balance sheets. Utilizing representative bank balance sheets from a sample of actual institutions, the chapter examines the applica-tion of FVA to banks’ balance sheets during the course of a normal business cycle, as well as during extreme shocks, such as have recently occurred, to distill in what manner FVA may contribute to procyclicality. The chapter exam-ines the results obtained, discusses actual and proposed alternatives to FVA, and elaborates on policy implications going forward.
The chapter addresses one angle of the FVA debate, focusing on the relationship between procyclicality, FVA, and its impact on banks’ balance sheets. This chapter does not intend to provide a definitive assessment of FVA and recognizes that—beyond its cyclical aspects—there may be additional elements that deserve further scrutiny, such as regulatory and risk management considerations, and the need for further enhancements to the FVA methodology. In its specific analysis of FVA and procyclicality, the chapter finds that, while the application of FVA methodology introduces unwanted volatil-ity across time, for the purposes of obtaining a point estimate at a specific date of a bank’s cur-rent financial condition, FVA ensures the most accurate assessment—alternative techniques have their own shortcomings. Yet difficulties exist not only in determining the fair values of assets in downturns and illiquid markets, but also during boom times in active markets when prices can overshoot and incorporate risk premia that inflate profits. Under such circum-stances, market prices may not accurately reflect risks and can result in exaggerated profits that distort incentives (e.g., management compen-sation) and amplify the cyclical upturn. In rapidly evolving financial markets, inaccurate
valuations may quickly alter the implications for solvency and, more broadly, financial stability.
The chapter emphasizes that FVA should be structured so that it contributes to good risk management and ensures that financial state-ments include adequate disclosure of valuations, methodologies, and volatilities such that inher-ent uncertainties are well understood. While the volatility of estimation errors in valuation tech-niques should be reduced as much as possible, genuine economic volatility should be faithfully reflected in financial statements and preserved by regulators and supervisors (Barth, 2004; Borio and Tsatsaronis, 2005). The chapter concludes by providing some quantitative insight for regula-tors and supervisors to better assess the implica-tions of FVA on bank balance sheets and capital, and puts forward proposals for dealing with issues of the volatility of FVA and FV classifica-tion. Importantly, it stresses the need for resolv-ing the tensions between valuation approaches across risk managers, accountants, and pruden-tial supervisors and regulators, so as to ensure that accounting frameworks do not unduly con-tribute to potential financial instability.
Fair Value accounting through the Business cycle
the current accounting Framework
Both U.S. Generally Accepted Accounting Principles (U.S. GAAP) and International Financial Reporting Standards (IFRS) use a mixed attributes model in which differ-ent valuation criteria are applied to different types of assets and liabilities, depending on their characteristics and on management’s intentions in holding them. In essence, both frameworks require FV valuation for financial assets and liabilities held for trading purposes and available-for-sale assets, and all deriva-tives. Held-to-maturity (HTM) investments,�
�Nonderivative financial assets with fixed or determin-able payments and fixed maturity that an entity has the intention and ability to hold to maturity.
107
loans, and liabilities not fair valued are valued at amortized cost. Both frameworks provide a carefully specified option to fair value (FVO) certain financial assets and liabilities2 that would normally be valued at amortized cost.
The mixed attributes model is intended to be as neutral as possible—without emphasiz-ing one accounting principle over another. But its uneven application to balance sheets pro-duces accounting volatility and may not fully capture the effects of economic events in all instruments included in the banks’ financial statements.
What is Fair Value?
IFRS and U.S. GAAP similarly define FV as the amount for which an asset could be exchanged, and a liability settled, between knowledgeable, willing parties, in an arm’s-length, orderly transaction. U.S. GAAP (Finan-cial Accounting Standard (FAS) �57) are more
2Namely, when they are risk-managed on a FV basis, though differences remain between FAS �59 and IAS 39.
prescriptive than IFRS because they consider that FV is an “exit” or “selling” price.3 Both accounting frameworks prescribe a hierarchy of FV methodologies that start with observ-able prices in active markets (Level �), using prices for similar instruments in active or not active markets or valuation models using observable inputs (Level 2), and moving to a mark-to-model methodology with unobservable inputs and model assumptions (Level 3).4 The absence of market prices, trading activity, or comparable instruments’ prices and inputs is a prominent feature of complex structured credit products, many of which are held off-balance-sheet (Box 3.�). Consequently, both frameworks require extensive disclosures of information on
3Nevertheless, differences will disappear given the international convergence to IFRS currently under way, led by both the U.S. Financial Accounting Standards Board and the International Accounting Standards Board, which will help achieve a single set of high-quality accounting standards.
4This language is U.S. GAAP-specific and not IFRS, but it is used extensively in the banking industry and in financial statements of IFRS users as well.
Recent market turmoil has heightened public awareness of the extensive use of off-balance-sheet entities (OBSEs) by financial institutions. With variations, both the International Financial Reporting Standards and the U.S. Generally Accepted Accounting Principles (U.S. GAAP) have specific criteria to determine when instru-ments transferred to OBSEs should be consoli-dated on-balance-sheet. Any retained interest in securitized financial assets should be on-balance-sheet and accounted for at fair value, usually in the trading book.
Mandatory disclosures on OBSEs are not prev-alent. Their absence may have added to market confusion and contributed to procyclical behav-ior by helping to create a market perception that
the banks were standing behind their OBSEs. Both the International Accounting Standards Board (IASB) and the U.S. Financial Accounting Standards Board (FASB) have projects under way to improve OBSE disclosures and enhance the criteria for derecognition and consolidation of OBSEs. Examples are the IASB’s consolida-tion and derecognition projects, and the FASB’s changes to FAS �40 and Interpretation 46(R). The FASB’s recently revised standard, FAS �40, would go into effect for fiscal years beginning after November �5, 2009.
Regardless, OBSEs require financial supervi-sors to revisit prudential reporting so that the integrity of banks’ risk exposures can be better captured and explained, as well as adequately buffered (i.e., capital) to the satisfaction of supervisors.
Box 3.1. off-Balance-Sheet entities and Procyclicality
Note: Alicia Novoa prepared this box.
Fair Value accounting through the Business cycle
chaPter 3 Fair Value accounting and Procyclicality
108
the FV methodologies used, specific assump-tions, risk exposures, sensitivities, etc.
Thus defined, FV does not require the pres-ence of deep and liquid markets to be applied. FV can be estimated when a market does not exist, as FV valuation models comprise the expected, risk-discounted cash flows that mar-ket participants could obtain from a financial instrument at a certain point in time. While FV incorporates forward-looking assessments, it must also reflect current market conditions and measures of risk-return factors,5 and incorpo-rate all factors that market participants consider relevant, with firm-specific risk preferences or inputs kept to a minimum. Under this defini-tion, two key issues underlying the FV method-ology present a challenge—what constitutes an active market, and what can be considered an observable price or input.
Forced or “fire” sales would not be valid determinants of market prices, because the accounting frameworks presume that a report-ing entity is a going concern that does not need or intend to liquidate its assets, or materially curtail the scale of its operations. Yet, account-ing standard setters have decided to leave to the judgment of management, supervisors, and auditors how to determine “regularly occur-ring” or “distressed” sales, and when sales in thin markets, at heavy discounts, could be used for balance sheets’ FVA.6 Consequently, market participants and supervisors would expect to
5IFRS do not explicitly mention some risk factors (e.g., counterparty credit risk, liquidity risk), which may have added confusion to financial statement preparers during the 2007–08 turmoil. An International Account-ing Standards Board Expert Advisory Group is currently working on this and other FV issues. The U.S. Financial Accounting Standards Board is reevaluating some disclo-sure requirements (e.g., credit derivatives) and has issued new standards (e.g., FAS �6� on derivatives and hedging). Both boards are examining requirements for off-balance-sheet entities.
6White papers prepared by the six largest international audit firms and other audit firms summarize guidance on what constitutes an active market, FV measurement in illiquid markets, and forced sales. See Center for Audit Quality (2007) and Global Public Policy Committee (2007).
see banks’ external auditors use a very cautious approach to examining the prices and inputs used to FV financial instruments in order to minimize late write-downs or write-offs and opportunities for management to “cherry-pick” the accounting treatment of financial instruments.7
disclosures of Fair Value accounting
Both IFRS and U.S. GAAP mandate vari-ous disclosures, particularly when information other than market inputs is used to estimate FV. For example, IFRS 7 requires disclosure (�) if the transaction price of a financial instrument differs from its FV when it is first recorded in the balance sheet; and (2) of the implica-tions of using “reasonably possible alternative assumptions” to reflect the sensitivities of FV measurement.8 IFRS 7 also contains report-ing requirements that include the publication of sensitivity tests for individual items of the financial statements. Similarly, FAS �57 requires banks’ balance sheets to be sufficiently clear and transparent so as to fully explain to market participants, through quantitative and qualita-tive notes to the financial statements, the nature of the changes and the methodologies used, to name a few items.9
Although some U.S. and European Union (EU) financial institutions voluntarily provide such disclosures, neither IFRS nor U.S. GAAP require disclosure on the governance and man-agement control processes�0 surrounding FV
7The International Auditing and Assurance Standards Board has issued ISA 540, “Auditing Accounting Esti-mates, Including Fair Value Accounting Estimates, and Related Disclosures,” providing criteria on how auditors must assess accounting estimates, and might issue further guidance on the audit of FV estimates some time in 2009, if warranted.
8IFRS 7, “Financial Instruments: Disclosures,” became effective on January �, 2007.
9For those financial assets measured at amortized cost, the entity must also disclose the FV in the notes to the statements.
�0Including audit-related programs.

109
valuation.�� Enhancement of disclosures in this direction could increase confidence in banks’ balance sheets and lower investors’ aversion to transact in instruments whose valuations may not be well understood (Box 3.2).�2 This would not necessarily indicate a need for more disclosures, but for a more appropriate composition, medium (e.g., websites), and frequency of disclosures.
Volatility and Procyclicality of Fair Value accounting
Barth (2004) argues that there are three potential channels through which FV may intro-duce volatility into financial statements. The first is the volatility associated with changes in the underlying economic parameters. The second is
��The Financial Stability Forum recommends dis-closures about price verification processes to enhance governance and controls over valuations and related disclosures (Box 3.2). Disclosures regarding risk manage-ment governance structures and controls would also be welcome.
�2An example is the U.S. Securities and Exchange Com-mission letter of March 2007 to major financial institu-tions outlining the nature of recommended disclosures.
the volatility produced by measurement errors and/or changing views regarding economic prospects throughout the business cycle. As to the third, volatility may be introduced by rely-ing on the mixed attributes model that applies FVA to certain instruments and amortized cost to others, reducing the netting effect that full fair valuation of assets and liabilities would produce.�3 Each of these sources of volatility is either explicitly or implicitly present in the simu-lation exercises examined later in the chapter.
The mixed attributes model adopted by IFRS and U.S. GAAP has embedded volatility and pro-cyclicality aspects.�4 On the one hand, historical cost accounting, applicable to HTM investments
�3Barth (2004) argues that mixed attributes models impair the relevance and reliability of financial state-ments and that this constitutes one of the primary rea-sons behind hedge accounting. IAS 39 aimed to alleviate mismatches in assets and liabilities valuations due to the mixed attributes model and the complexities of hedge accounting.
�4It should be noted that procyclicality of account-ing and reporting standards existed prior to the recent attention to FVA. It has long been recognized that as the business cycle and market sentiment change, so too will valuations of assets and liabilities.
At the request of the Financial Stability Forum (FSF), a Senior Supervisors Group conducted a survey of disclosure practices for selected financial exposures such as special purpose entities (SPE) and collateralized debt obligations, among others. The group issued a report concluding that disclosure practices currently observed can be enhanced with-out amending existing accounting disclosure requirements.� The FSF is encouraging financial institutions to use these disclosure practices for their mid-year 2008 financial reports and urging
Note: Alicia Novoa prepared this box.�“Leading-Practice Disclosures for Selected Expo-
sures,” April ��, 2008. Twenty large, internationally oriented financial firms were surveyed (�5 banks and five securities firms) as of end-2007.
supervisors to improve risk disclosure require-ments in Pillar 3 of Basel II.
A preliminary reading of financial reports prepared for mid-2008 by some U.S., European Union and Canadian banks shows the inclu-sion by U.S. banks of more quantitative notes in their financial statements, as compared with their end-2007 reporting.2 Typical information includes financial assets securitized, cash flows received on SPE-retained interests, assets in non-consolidated variable-interest entities (VIEs), and maximum exposures to loss in consolidated and nonconsolidated VIEs, with details broken down by instrument.
2Canada has postponed adoption of the full Inter-national Financial Reporting Standards until 20��.
Box 3.2. disclosures recommended by the Financial Stability Forum
Fair Value accounting through the Business cycle

chaPter 3 Fair Value accounting and Procyclicality
110
and loans, is less volatile and backward-looking. When such an investment or loan is correctly priced at origination, its FV equals its face value. Over the life of the asset and until maturity, its reported stream of profits is stable and its car-rying value is based on its value at origination. But if market conditions negatively affect these portfolios and there is evidence of a credit loss event and asset impairment, then the report-ing values must be reassessed and provisions for losses must be accrued or write-offs recorded. The latter is often a late recognition of excess risk taken earlier, in good times. In this sense, historical costs are subject to a backward-looking assessment of value (e.g., signs of loan distress) combined with procyclical provisioning, which often coincide with a downturn of an economic cycle, adding to stresses.
On the other hand, FVA introduces more volatility in earnings and capital during the life of an asset or liability than historical cost accounting and incorporates forward-looking assessments.�5 Gains and losses in fair valued instruments generally affect the income state-ment, and this increased volatility of FVA and resulting procyclical effects may create incen-tives for banks to restructure their balance sheets (e.g., lower loan originations, higher/lower securitizations, introduce hedging, etc.).�6 Nevertheless, higher FV volatility, per se, would not necessarily be a problem if market partici-pants are well informed and could correctly interpret the information provided in the finan-cial statements. In this sense, increased volatility may be thought of as part of the process of fair valuing financial instruments, and a reflection of genuine economic volatility, not as a cause itself of procyclicality.
However, in some cases, the symmetrical treat-ment within FVA can produce seemingly mis-leading results. For example, the use of FVA on
�5IFRS and U.S. GAAP accounting standards—and FVA is no exception—are applicable to reporting entities irrespective of their size or systemic importance.
�6One intention of the FVO in both accounting frame-works is to enable entities to reduce accounting mis-matches by applying FV on matching assets and liabilities.
–20
0
20
40
60
80
Goldman
Sachs
Bear S
tearns
Bank o
f Ameri
ca
Morgan
Stanley
JPMorg
an Cha
se &
Co.
Citigrou
p
Lehm
an Brot
hers
Merrill
Lync
h
–80
–60
–40
–20
0
20
40
60
80
Goldman
Sachs
Bear S
tearns
Bank o
f Ameri
ca
Morgan
Stanley
JPMorg
an Cha
se &
Co.
Citigrou
p
Lehm
an Brot
hers
Merrill
Lync
h
–80
–60
–40
–20
0
20
40
60
80
Goldman
Sachs
Bear S
tearns
Bank o
f Ameri
ca
Morgan
Stanley
JPMorg
an Cha
se &
Co.
Citigrou
p
Lehm
an Brot
hers
Merrill
Lync
h
Level 3 Assets
Level 1 Assets
Level 2 Assets
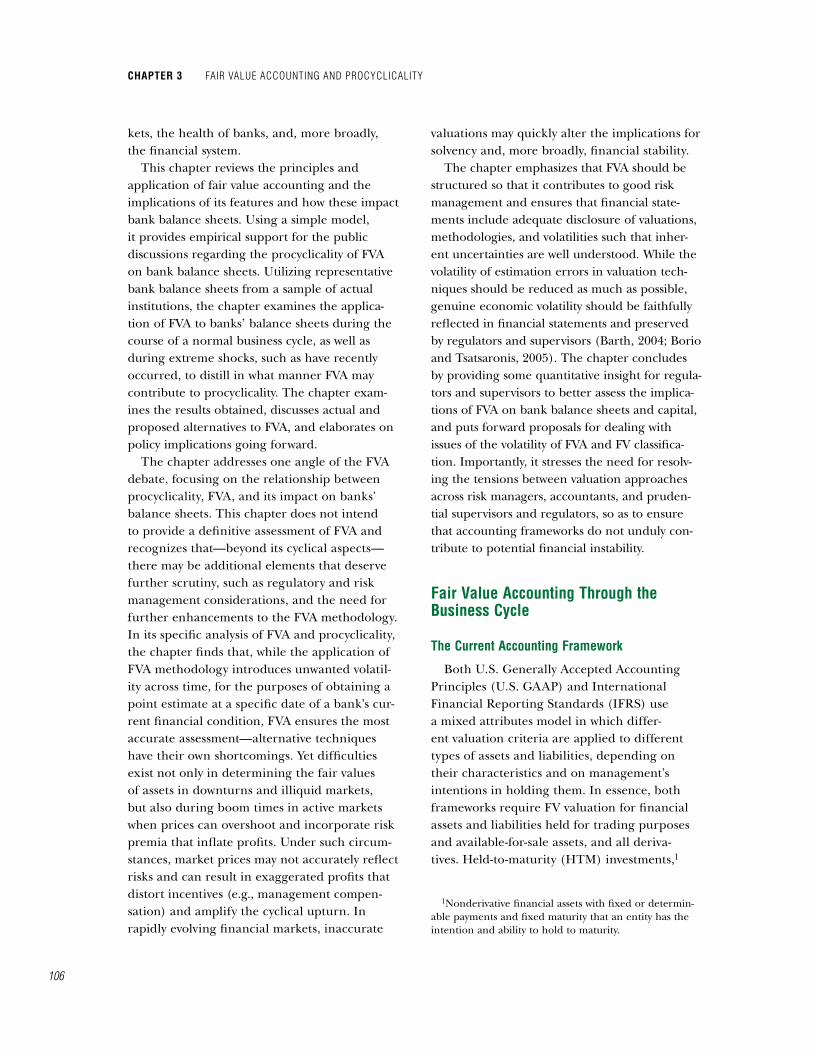
Source: Quarterly reports.Note: Level 1 assets use quoted prices for identical assets. Level 2 assets use a
more illiquid market where prices are observable for similar products, or for the same product but at different dates. Level 3 defines the absence of a material observable input used in the item’s valuation. Citigroup, JPMorgan Chase & Co., Lehman Brothers, and Merrill Lynch reported fourth quarter at end-December, while the other banks concluded their fourth quarter at end-November.
Figure 3.1. Selected U.S.-Based Financial Institutions: Change in Level 1, 2, and 3 Assets(Percent change; 2007:Q1–2008:Q1)
Percent change between Q1 and Q2
Percent change between Q3 and Q4Percent change between Q2 and Q3
Percent change between 2007:Q4 and 2008:Q1

111
a bank’s own debt, where the price of the bank’s bonds and notes falls due to a decline in its own creditworthiness, will result in a gain that must be recognized in the bank’s financial statements, equal to the difference between the original value of the debt and its market price. As coun-ter intuitive as this situation may be, it is still a faithful representation of FV and is a signal to supervisors or other users of financial state-ments to have appropriate tools (e.g., prudential filters)�7 for understanding the implications of FVA and the impact on regulatory capital.
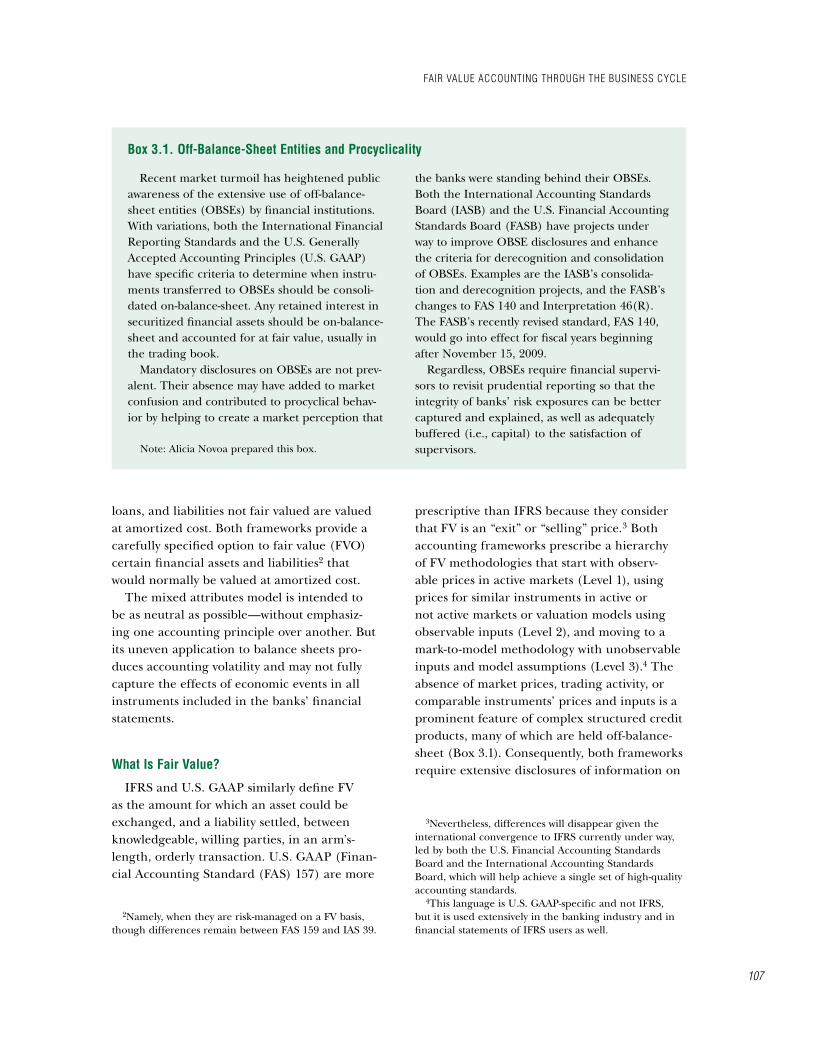
As valuation moves from market prices to mark-to-model valuation, FVA poses reliability challenges to which markets, particularly under distress, are sensitive.�8 These “subjective” aspects of FVA may compound market illiquid-ity or price spirals if they increase uncertainty around valuations. In both the United States and European Union, financial institutions’ balance sheets are heavily represented in Level 2 instruments, a possible indication that financial institutions are biased toward using Level 2 methods due to their flexibility, as well as a desire to avoid “obscure” Level 3 assets and liabilities (Figures 3.� and 3.2). Falling valuations can activate certain management decision rules that trigger the liquidation of certain assets or portfolios, adding additional stress. Hence, there is a need for good risk management practices to be consistent with FV mark-to-model valuations. Clear and transpar-ent quantitative and qualitative notes to the financial statements regarding the nature of the changes and methodologies could enhance reliability of mark-to-model valuations.
�7Bank supervisors use prudential filters as a tool to adjust changes in the (accounting) equity of a bank due to the application of the accounting framework, so that the quality of regulatory capital may be properly assessed. For example, when the gains that result from a dete-rioration in a bank’s own creditworthiness (fair valued liability) are included in a bank’s prudential own funds, they must be “filtered out” by the supervisor in order to determine the true amount of regulatory own funds.
�8In principle, valuations are thus better aligned with the prevailing mark-to-model techniques used in risk management.
TotalEuropean financial institutions
U.S. financial institutions
0
10
20
30
40
50
60
70
80
90
100
Source: Fitch Ratings.1Aggregates asset and liability positions.
Figure 3.2. Aggregate Fair Value Hierarchy, End-20071
(In percent)
Level 1 valuationsLevel 2 valuations
Level 3 valuations
22 28 25
72 67 69
6 5 6
Fair Value accounting through the Business cycle

chaPter 3 Fair Value accounting and Procyclicality
112
Although more volatile, FVA could play a role by partially mitigating the turbulence if warning signals are heeded, thereby helping
markets to recover earlier before damaging self-fulfilling downturns worsen. FVA that captures and reflects current market condi-
A key improvement in the Basel II framework is its enhanced risk sensitivity. Yet this very feature is associated with the unintended effect of heightening its procyclical propensity. Basel II recognizes possible business cycle effects and how they should be addressed in both Pillar � (minimum capital requirements) and Pillar 2 (supervisory review process) of the framework. If Basel II is properly implemented, then greater risk sensitivity can lead banks to restore capital earlier in a cyclical downturn, thus preventing a buildup of required capital when it could amplify the cycle.
Under Basel II’s Standardized Approach, risk weights are based on external ratings con-structed to see through the cycle, so that cyclical effects are muted. It is in the internal-ratings-based (IRB) approaches that deterioration in credit risk feeds more directly into the capital requirements. The three main risk compo-nents in the IRB approaches (e.g., probability of default, loss given default, and exposure at default) are themselves influenced by cycli-cal movements and may give rise to a cyclical impact on banks’ capital requirements.
Basel II includes mitigating measures to address these concerns. Although Pillar � does not mandate the use of through-the-cycle mod-els, it promotes estimates of risk components based on observations that “ideally cover at least one economic cycle,” and whose validation must be based on data histories covering one or more complete business cycles. It also requires the use of the so-called downturn loss given default which factors in the risk that recoveries will fall as defaults increase in downturns. Sound stress testing processes must be in place that involve scenarios based on economic or industry down-turns and include specific credit risk stress tests
that take into account a mild recession to assess the effects on the bank’s risk parameters.
Pillar 2 places the onus on both banks and supervisors to assess business cycle risk and take appropriate measures to deal with it. Banks are required to be “mindful of the stage of the busi-ness cycle in which they are operating” in their internal assessment of capital adequacy, perform forward-looking stress tests, address capital vola-tility in their capital allocation, and define strate-gic plans for raising capital. In turn, encouraging forward-looking credit risk assessments or higher provisioning for loan losses (that consider losses over the loans’ whole life) is left to national supervisors.� Thus, where Pillar � does not adequately capture business cycle effects, supervi-sors should take remedial action under Pillar 2, including through additional capital buffers.
The capital disclosures required by Pillar 3 may assist markets and stakeholders in exercis-ing pressure on the banks to maintain their capital levels throughout the full business cycle.
In its recent report, “Enhancing Market and Institutional Resilience,” the Financial Stabil-ity Forum called for the Basel Committee to develop Pillar 2 guidance on stress testing practices and their use in assessing capital adequacy through the cycle; examine the bal-ance between risk sensitivity and cyclicality; and update the risk parameters and the calibration of the framework, if needed (Financial Stabil-ity Forum, 2008). In response, the committee is establishing a data collection framework to monitor Basel II’s impact on the level and cycli-cality of prudential capital requirements over time across member countries. The committee is expected to use these results to further cali-brate the capital adequacy framework.
�The U.S. Financial Accounting Standards Board has a project under way to address provisioning and related credit risk disclosures.
Box 3.3. dealing with Procyclicality in the Basel ii Framework
Note: Aditya Narain and Alicia Novoa prepared this box.
113
tions on a timely basis could lead to a better identification of a bank’s risk profile, if better information is provided. An earlier warning that can prompt corrective action by sharehold-ers, management, and supervisors allows for a timelier assessment of the impact of banks’ risky actions on regulatory capital and financial stability. Moreover, since FVA should lead to earlier recognition of bank losses, it could have a less protracted impact on the economy than, for example, loan portfolios whose provisions for losses are usually made when the economy is already weak. Raising new capital at an ear-lier stage might enable banks to retain written-down assets or other assets originally not for sale on their balance sheets and, thus, to avoid asset price spirals.
On the prudential front, the negative impact of vastly lower valuations stemming from recent market conditions raises questions as to whether increases in regulatory capital may be needed for complex structured products, off-balance-sheet entities (OBSEs), or other risks. Guidance from Pillar 2 of Basel II could encourage banks to put greater attention into FV during periods of falling or rising asset prices, so that they may better control for the procyclical aspects of FVA (Box 3.3). Pillar 3 disclosures could improve the transparency of valuations, methodologies, and uncertainties. Nevertheless, FVA can serve as an early warn-ing system for supervisors to pursue closer scrutiny of a bank’s risk profile, risk-bearing capacity, and risk management practices.
Modeling Fair Value accounting through the Business cycle using Simulations
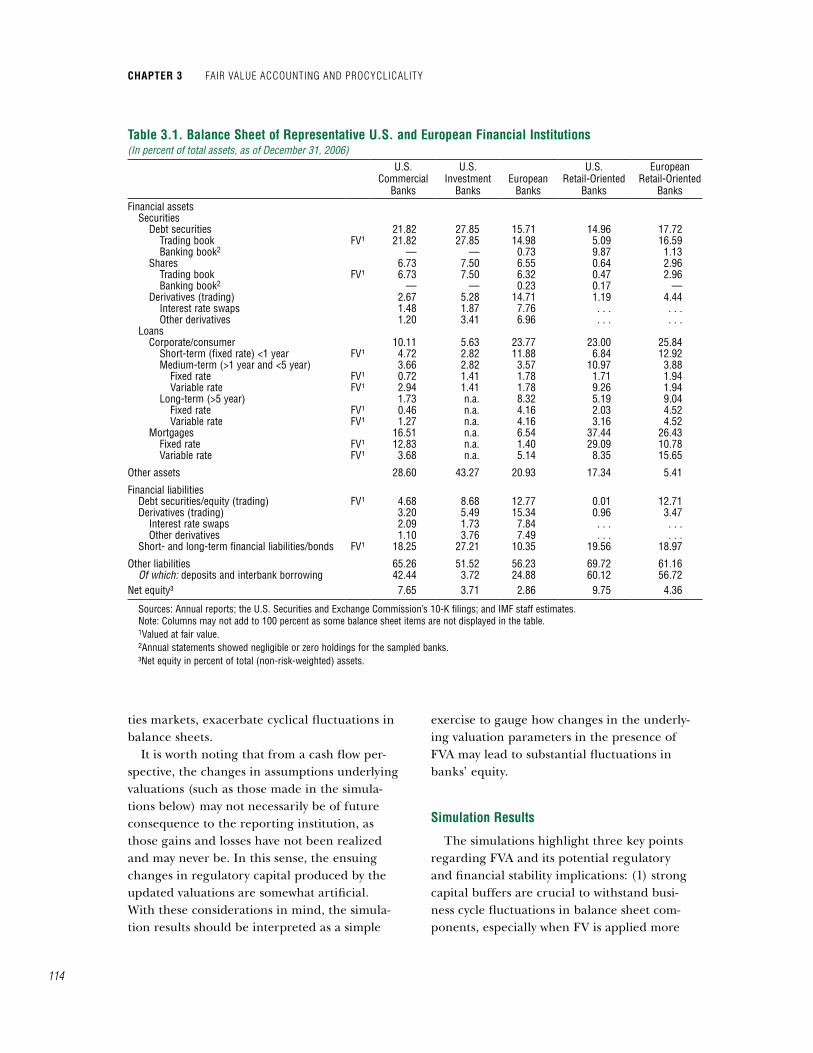
Using model simulations, this section assesses the effects that changes in financial instruments’ fair value have on the balance sheet of three types of large, internationally active financial institutions—U.S. commercial banks, U.S. investment banks, and European banks—as well as more retail-oriented U.S. and EU banks. The balance sheets of a sample of representative institutions were taken as
of end-2006 to construct prototypical institu-tions (Table 3.�). The simulations illustrate the impact of changes in valuations and, ultimately, on these representative banks’ equity capital. The section also explores possible alternatives related to FVA and its current application—full fair value, smoothing techniques, circuit break-ers, and reclassifications—that aim to reduce its volatility on balance sheets (Box 3.4).
The first simulation serves as the baseline for subsequent scenarios and consists of track-ing the evolution of the banks’ balance sheets throughout a normal business cycle.�9 Four scenarios are applied to the normal cycle with the goal of gauging the degree to which fair valuations amplify fluctuations in balance sheet components, and more notably, on accounting capital.20 The sources of increased cyclicality are (�) a bust-boom cycle in equity valuations; (2) a bust-boom cycle in the housing market; (3) a widening and then contraction of banks’ funding spreads; and (4) a bust-boom cycle in debt securities’ valuations, all of which are calibrated using the most current cyclical move-ments (Table 3.2). As noted by Fitch Ratings (2008a, 2008b), among others, the sensitivities of FV measurements to changes in significant assumptions are particularly important when valuations are model-based and/or markets become highly illiquid. Specifically, the method by which an institution chooses to value components of its balance sheet constitutes one of the three main transmission channels through which FVA introduces volatility into the balance sheet (Barth, 2004). The simula-tions help underscore this point and provide a sense of the magnitude of these effects. In addition, the simulations illustrate how a sud-den tightening in banks’ funding conditions, or changes in the liquidity conditions in securi-
�9Annex 3.� discusses the data and underlying assump-tions for the simulations.
20Enria and others (2004) examine the impact of several one-off shocks on the balance sheet of a repre-sentative European bank under alternative accounting frameworks.
Modeling Fair Value accounting through the Business cycle using siMulations
chaPter 3 Fair Value accounting and Procyclicality
114
ties markets, exacerbate cyclical fluctuations in balance sheets.
It is worth noting that from a cash flow per-spective, the changes in assumptions underlying valuations (such as those made in the simula-tions below) may not necessarily be of future consequence to the reporting institution, as those gains and losses have not been realized and may never be. In this sense, the ensuing changes in regulatory capital produced by the updated valuations are somewhat artificial. With these considerations in mind, the simula-tion results should be interpreted as a simple
exercise to gauge how changes in the underly-ing valuation parameters in the presence of FVA may lead to substantial fluctuations in banks’ equity.
Simulation results
The simulations highlight three key points regarding FVA and its potential regulatory and financial stability implications: (�) strong capital buffers are crucial to withstand busi-ness cycle fluctuations in balance sheet com-ponents, especially when FV is applied more
table 3.1. Balance Sheet of representative u.S. and european Financial institutions(In percent of total assets, as of December 31, 2006)
U.S. Commercial
Banks
U.S. Investment
BanksEuropean
Banks
U.S. Retail-Oriented
Banks
European Retail-Oriented
BanksFinancial assets
Securities Debt securities 21.82 27.85 15.71 14.96 17.72
Trading book FV¹ 21.82 27.85 14.98 5.09 16.59Banking book2 — — 0.73 9.87 1.13
Shares 6.73 7.50 6.55 0.64 2.96Trading book FV¹ 6.73 7.50 6.32 0.47 2.96Banking book2 — — 0.23 0.17 —
Derivatives (trading) 2.67 5.28 14.71 1.19 4.44Interest rate swaps 1.48 1.87 7.76 . . . . . .Other derivatives 1.20 3.41 6.96 . . . . . .
Loans Corporate/consumer 10.11 5.63 23.77 23.00 25.84
Short-term (fixed rate) <1 year FV¹ 4.72 2.82 11.88 6.84 12.92Medium-term (>1 year and <5 year) 3.66 2.82 3.57 10.97 3.88
Fixed rate FV¹ 0.72 1.41 1.78 1.71 1.94Variable rate FV¹ 2.94 1.41 1.78 9.26 1.94
Long-term (>5 year) 1.73 n.a. 8.32 5.19 9.04Fixed rate FV¹ 0.46 n.a. 4.16 2.03 4.52Variable rate FV¹ 1.27 n.a. 4.16 3.16 4.52
Mortgages 16.51 n.a. 6.54 37.44 26.43Fixed rate FV¹ 12.83 n.a. 1.40 29.09 10.78Variable rate FV¹ 3.68 n.a. 5.14 8.35 15.65
Other assets 28.60 43.27 20.93 17.34 5.41
Financial liabilities Debt securities/equity (trading) FV¹ 4.68 8.68 12.77 0.01 12.71Derivatives (trading) 3.20 5.49 15.34 0.96 3.47
Interest rate swaps 2.09 1.73 7.84 . . . . . .Other derivatives 1.10 3.76 7.49 . . . . . .
Short- and long-term financial liabilities/bonds FV¹ 18.25 27.21 10.35 19.56 18.97
Other liabilities 65.26 51.52 56.23 69.72 61.16Of which: deposits and interbank borrowing 42.44 3.72 24.88 60.12 56.72
Net equity³ 7.65 3.71 2.86 9.75 4.36
Sources: Annual reports; the U.S. Securities and Exchange Commission’s 10-K filings; and IMF staff estimates.Note: Columns may not add to 100 percent as some balance sheet items are not displayed in the table.1Valued at fair value.2Annual statements showed negligible or zero holdings for the sampled banks. ³Net equity in percent of total (non-risk-weighted) assets.

115
Modeling Fair Value accounting through the Business cycle using siMulations
The procyclicality of fair value accounting has prompted the search for options that allow financial institutions to cope with situations of market turmoil. Alternatives range from considering a wider selection of “observable” prices or inputs to a change in the accounting treatment of financial instruments.
Consensus Pricing Services
Consensus pricing services, often independent brokers and agencies, can provide price quotes for complex or illiquid financial instruments, often using prices based on their own sales of relevant instruments that allow them to observe price behavior and market-test their estimates. Through this approach, illiquid products could obtain a Level 2 price, potentially limiting valuation uncer-tainty and underpricing in downturns. However, difficulties may remain if there is a wide dispersion of values or if banks contend that values do not reflect market conditions.
Valuation Adjustments
Banks could estimate the “uncertainty” surround-ing the price of certain assets and make a valuation adjustment to the carrying value of an instrument disclosed in the financial statements. Valuation adjustments would allow banks to work with less perfect prices that are corrected to reflect current market conditions. These estimates of “uncertainty” might incorporate the liquidity of inputs, counter-party risk, or any market reaction likely to occur when the bank’s position is realized. Valuation adjustments could improve fair value measurements and discipline in reporting, yet they need close monitoring to ensure that this practice does not evolve into management “cherry picking,” provid-ing a means to evade a certain accounting fair value level classification, or improving the balance sheet.
Reclassifications
The transfer of assets from available-for-sale or trading to the held-to-maturity category could avoid the volatility resulting from valuation changes amid a downward spiral. From an accounting perspective, reclassifications could be penalized
by not allowing banks to revert to the trading book when markets rebound. From a prudential standpoint, deteriorated held-to-maturity assets would require higher regulatory capital. Allow-ing reclassifications—particularly if not fully disclosed—may postpone the weaknesses of the bal-ance sheets, and promote cherry-picking elements of the accounting framework.
Full Fair Value Accounting
Recognizing the significant challenges full fair value accounting would pose, a longer-term alter-native would be to adopt a full fair value model for all financial assets and liabilities, irrespective of an entity’s intention of holding them. One single fair value principle, with some limited exceptions, would reduce the complexity of financial instru-ments reporting, balance sheet window dressing, and cherry picking, and allow for more transpar-ent representations of the financial condition of an entity. It could improve the comparability of finan-cial information across balance sheets and enhance market discipline, but it would pose challenges for implementation, modeling capabilities, and auditing estimates.
Internal Decision Rules
Regulators could require banks to have internal decision rules based on fair value that require care-ful review of all the implications of changing fair value and the specific occasions when such changes could trigger management decisions, so that these decisions do not adversely affect regulatory capital or accentuate downward price spirals.
Smoothing Techniques and Circuit Breakers
Smoothing asset prices and circuit breakers could be used as price adjusters to fair value accounting to reduce excessive price volatility in the balance sheet. However, both reduce the infor-mation content of financial statements by suspend-ing equity at an artificially higher-than-fair-value calculated level.
The simulation exercises examine the following alternatives: reclassifications, full fair value account-ing, smoothing techniques, and circuit breakers.
Box 3.4. options Surrounding the application of Fair Value accounting to Mitigate Procyclicality
Note: Alicia Novoa and Jodi Scarlata prepared this box.

chaPter 3 Fair Value accounting and Procyclicality
116
extensively to assets than liabilities; (2) fair valuing an expanded set of liabilities acts to dampen the overall procyclicality of the balance sheet; and (3) when combined with additional liquidity shortages in financial markets, the FVA framework magnifies the cyclical volatility of capital.
The Effects of Economic Shocks Under Full Fair Value
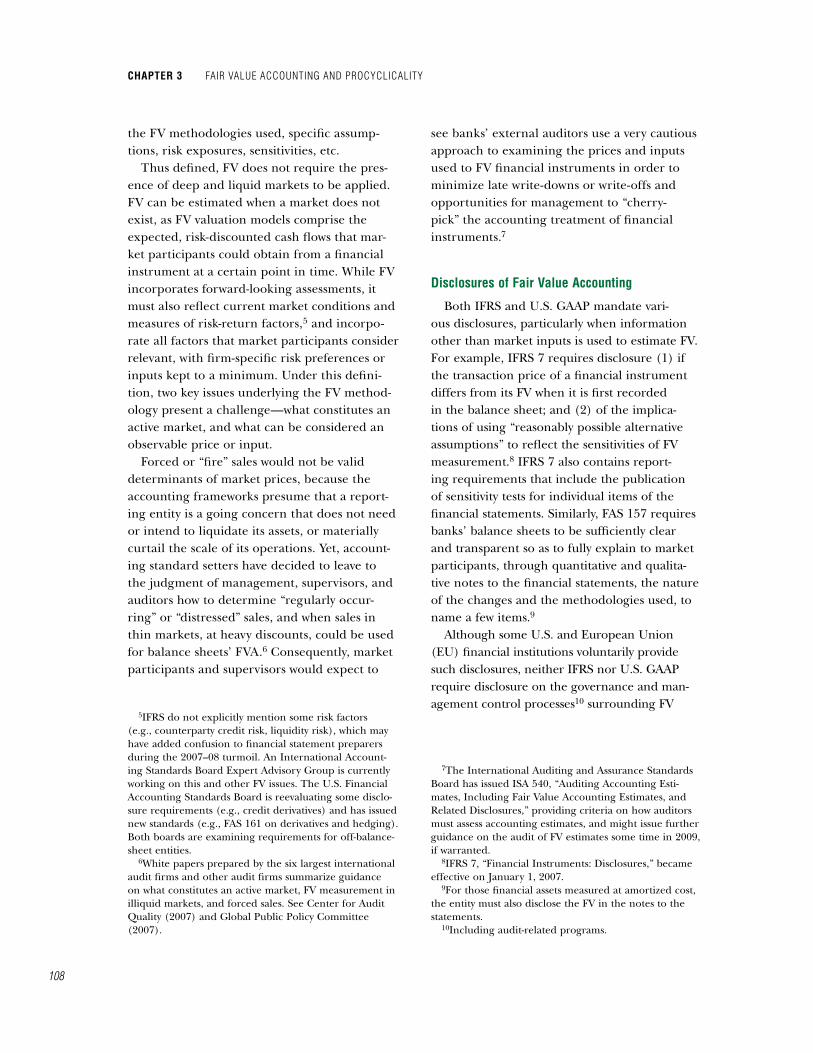
In the normal cycle, fair valuing both sides of the balance sheet produces fluctuations that are mild compared with the bust-boom sce-narios seen in Figure 3.3, an intuitive result.2� However, it is worth noting that, in the case of the representative U.S. investment bank, equity
2�The results are presented in terms of the evolution of banks’ normalized equity through the cycle—that is, at each point in the cycle, banks’ equity is divided by their initial level of equity (i.e., at end-2006).
behaves in a countercyclical manner due to the strong effect of fair valuing the liabilities.22 Under full fair value (FFV), the value of the bank’s liabilities declines as economic activity weakens and probabilities of default (PDs) rise, mitigating the decline in equity. This effect arises because of the asset/liability structure of the investment banks’ balance sheet, which con-sists of a large proportion of financial liabilities that are fair valued. Liabilities at FFV, as is done by some U.S. investment banks, can introduce an element of countercyclicality by serving as an implicit counterbalancing hedge to the fair
22Chapter 4 of the October 2008 World Economic Outlook (IMF, 2008a) examines the procyclicality of leverage ratios of U.S. investment banks, finding their extreme variation across the cycle. Note that this is consistent with the scenario conducted later in this chapter where fund-ing spreads vary through the cycle, producing the same procyclicality found in IMF (2008a).
table 3.2. Parameter Values for each Simulation(In percent)
Business Cycle Trend Points
Business Cycle Trough Points
Business Cycle Peak Points
Normal cycle PD for all loans and securities 1.18 1.40 0.73LGD for mortgages 20.30 20.30 20.30LGD for loans1 and securities 46.20 46.20 46.20Stock market index 100.00 100.00 100.00
Stock market cycle PD for all loans and securities 1.18 1.40 0.73LGD for mortgages 20.30 20.30 20.30LGD for loans1 and securities 46.20 46.20 46.20Stock market index 100.00 80.00 120.00
Real estate market cycle PD for mortgages 1.18 5.29 0.73PD for loans1 and securities 1.18 1.40 0.73LGD for mortgages 20.30 30.50 20.30LGD for loans1 and securities 46.20 46.20 46.20Stock market index 100.00 100.00 100.00
Funding spreads cycle PD for all loans and securities 1.18 1.40 0.73LGD for mortgages 20.30 20.30 20.30LGD for loans1 and securities 46.20 46.20 46.20Stock market index 100.00 100.00 100.00Change in spreads (in basis points) 0.00 58.66 –58.66
Debt securities valuation cycle PD for all loans and securities 1.18 1.40 0.73LGD for mortgages 20.30 20.30 20.30LGD for loans1 46.20 46.20 46.20Stock market index 100.00 100.00 100.00LGD for debt securities 46.20 67.30 25.10
Sources: IMF staff estimates; Nickell and others (2000); and BCBS (2006a).Note: PD = probability of default; LGD = loss given default.1 Loans excluding mortgages.

117
valuation of assets.23 This phenomenon has raised related concerns by some market observ-ers who regard with unease a bank’s ability to record revaluation gains as its own creditwor-thiness weakens and the price of its own debt declines.24 The presence of gains that are a construct of the particular technique chosen for valuation signals the need for clear disclosure of underlying assumptions to avoid misrepresen-tation of financial statements.
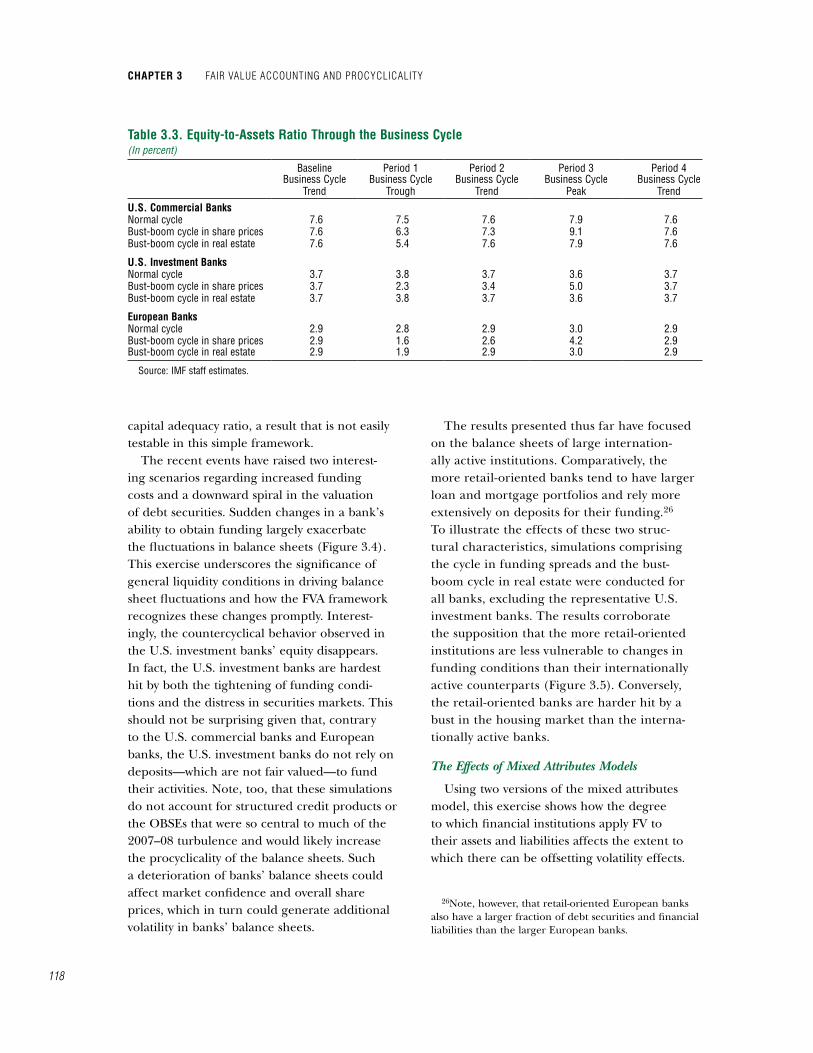
In the bust-boom cycles in equity valuations and in the housing market, the European banks exhibit the largest deviations from trend. For the equity price shock, despite roughly com-parable magnitudes of equity shares across the portfolios of the three groups of banks shown in Table 3.�, a combination of two effects are at work. First, there is the countercyclical effect of the relatively greater proportion of FV liabilities for U.S. investment banks. Second, European banks have a lower capital base and thus the relative size of valuation changes to normalized equity capital is larger. In the housing market scenario, the European banks exhibit wider fluc-tuations, despite the fact that the U.S. commer-cial banks hold a much larger fraction—about two-and-half times greater—of their loan port-folio in mortgages. In both scenarios, the lower capital base of the European banks vis-à-vis the U.S. commercial banks is a key element. Similar results in terms of capital-to-assets ratios are pre-sented in Table 3.3, but reflect a less dramatic impact on European banks.25 More generally, a bank’s balance sheet would evolve through the cycle—contracting in downturns and expanding in upturns—such that it would restore a bank’s
23Note, however, that this result reflects only one element of countercyclical forces, as “other liabilities” represent about 50 percent of the balance sheet and can potentially introduce additional countercyclicality.
24See Guerrera and White (2008). Additionally, Barth, Hodder, and Stubben (2008) suggest that these counter-intuitive effects are attributable primarily to incomplete recognition of contemporaneous changes in asset values.
25Some portion of the lower equity position in Euro-pean banks may stem from differences in IFRS versus U.S. GAAP accounting treatments (Citigroup, 2008; and Financial Times, 2008).
Modeling Fair Value accounting through the Business cycle using siMulations
94
96
98
100
102
104
106
Business cycle trend
Normal Cycle
Business cycle trend
Business cycle trend
Businesscycle trough
Business cycle peak
40
60
80
100
120
140
160
Business cycle trend
Bust-Boom Cycle in Share Prices
Business cycle trend
Business cycle trend
Business cycle trough
Business cycle peak
40
60
80
100
120
140
160
Business cycle trend
Bust-Boom Cycle in Real Estate
Business cycle trend
Business cycle trend
Business cycle trough
Business cycle peak
105.1
96.9
101.5
97.6
149.3
121.4
105.1
96.9
66.7
101.5
53.5
80.7
Source: IMF staff estimates.
Figure 3.3. Simulation of Full Fair Value
U.S. commercial banksU.S. investment banks
European banks
chaPter 3 Fair Value accounting and Procyclicality
118
capital adequacy ratio, a result that is not easily testable in this simple framework.
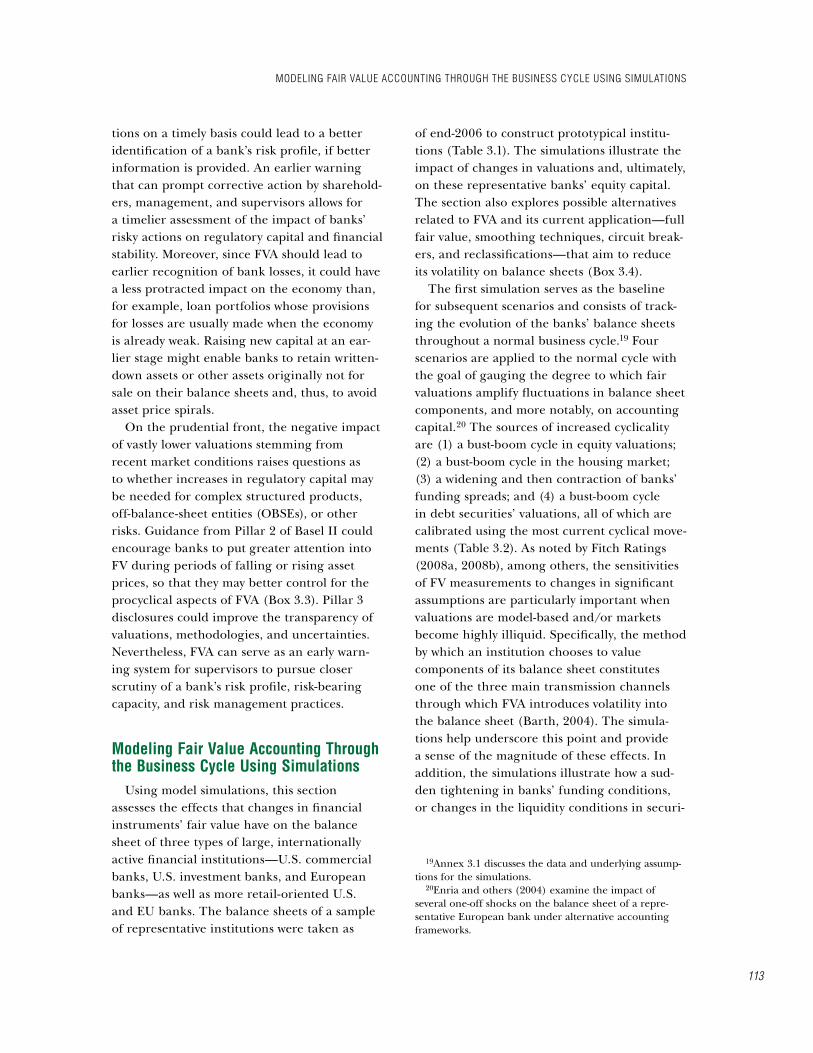
The recent events have raised two interest-ing scenarios regarding increased funding costs and a downward spiral in the valuation of debt securities. Sudden changes in a bank’s ability to obtain funding largely exacerbate the fluctuations in balance sheets (Figure 3.4). This exercise underscores the significance of general liquidity conditions in driving balance sheet fluctuations and how the FVA framework recognizes these changes promptly. Interest-ingly, the countercyclical behavior observed in the U.S. investment banks’ equity disappears. In fact, the U.S. investment banks are hardest hit by both the tightening of funding condi-tions and the distress in securities markets. This should not be surprising given that, contrary to the U.S. commercial banks and European banks, the U.S. investment banks do not rely on deposits—which are not fair valued—to fund their activities. Note, too, that these simulations do not account for structured credit products or the OBSEs that were so central to much of the 2007–08 turbulence and would likely increase the procyclicality of the balance sheets. Such a deterioration of banks’ balance sheets could affect market confidence and overall share prices, which in turn could generate additional volatility in banks’ balance sheets.
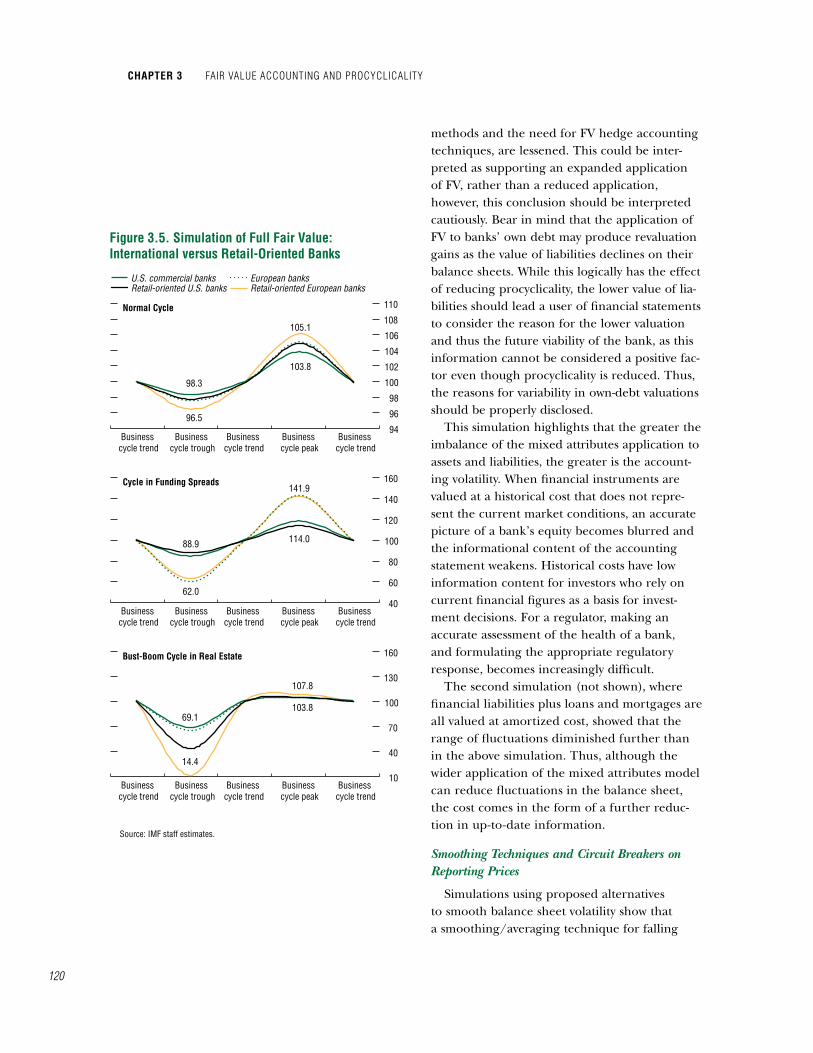
The results presented thus far have focused on the balance sheets of large internation-ally active institutions. Comparatively, the more retail-oriented banks tend to have larger loan and mortgage portfolios and rely more extensively on deposits for their funding.26 To illustrate the effects of these two struc-tural characteristics, simulations comprising the cycle in funding spreads and the bust-boom cycle in real estate were conducted for all banks, excluding the representative U.S. investment banks. The results corroborate the supposition that the more retail-oriented institutions are less vulnerable to changes in funding conditions than their internationally active counterparts (Figure 3.5). Conversely, the retail-oriented banks are harder hit by a bust in the housing market than the interna-tionally active banks.
The Effects of Mixed Attributes Models
Using two versions of the mixed attributes model, this exercise shows how the degree to which financial institutions apply FV to their assets and liabilities affects the extent to which there can be offsetting volatility effects.
26Note, however, that retail-oriented European banks also have a larger fraction of debt securities and financial liabilities than the larger European banks.
table 3.3. equity-to-assets ratio through the Business cycle(In percent)
Baseline Period 1 Period 2 Period 3 Period 4Business Cycle
TrendBusiness Cycle
TroughBusiness Cycle
TrendBusiness Cycle
PeakBusiness Cycle
Trendu.S. commercial BanksNormal cycle 7.6 7.5 7.6 7.9 7.6Bust-boom cycle in share prices 7.6 6.3 7.3 9.1 7.6Bust-boom cycle in real estate 7.6 5.4 7.6 7.9 7.6
u.S. investment BanksNormal cycle 3.7 3.8 3.7 3.6 3.7Bust-boom cycle in share prices 3.7 2.3 3.4 5.0 3.7Bust-boom cycle in real estate 3.7 3.8 3.7 3.6 3.7
european BanksNormal cycle 2.9 2.8 2.9 3.0 2.9Bust-boom cycle in share prices 2.9 1.6 2.6 4.2 2.9Bust-boom cycle in real estate 2.9 1.9 2.9 3.0 2.9
Source: IMF staff estimates.

119
Table 3.4 shows that financial institutions apply FV differentially. But what is not shown in the table is the extent to which the vast majority of banks continue to use amortized cost to value their loan portfolio. Thus, for the purposes of the simulations, two variations of the model are considered: (�) “financial liabilities and bonds” are valued at amortized cost throughout the cycle; and (2) “loans” and “mortgages” are also valued at amortized cost.27
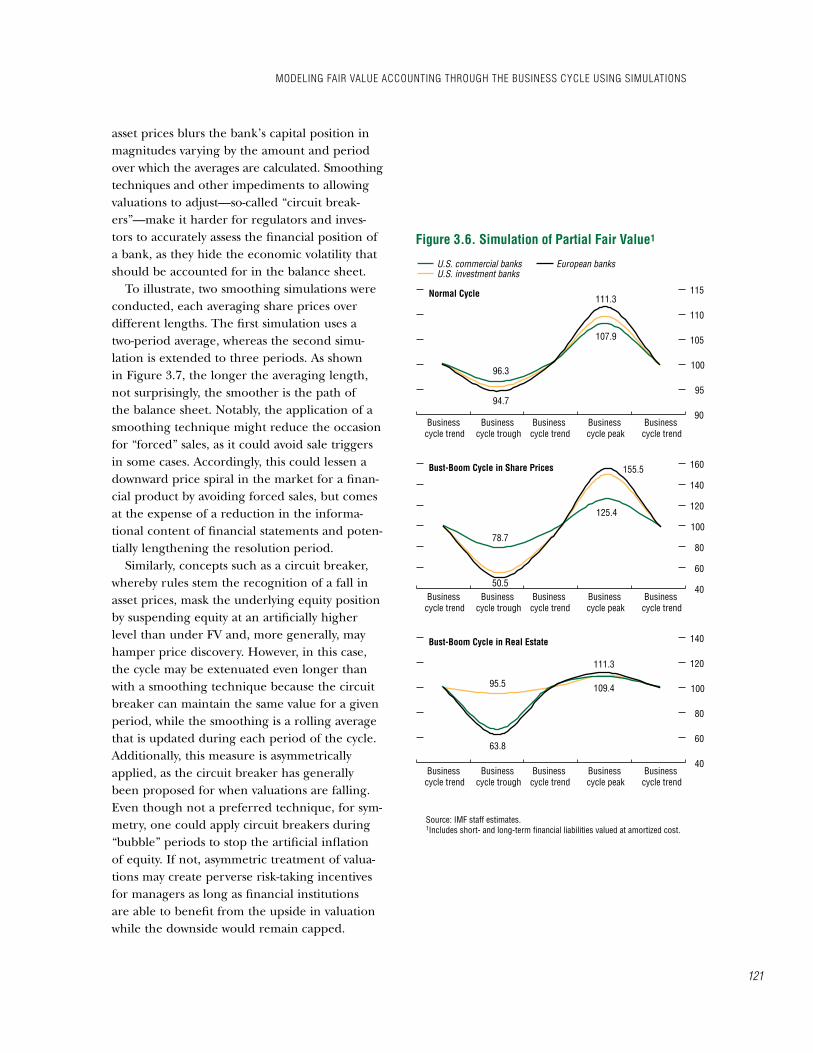
Figure 3.6 underscores the idea that the asymmetric application of a mixed attributes model, where FV is applied more extensively to assets than liabilities, has the effect of mechani-cally increasing the procyclical behavior of the balance sheet. In other words, the fluctuations in equity—for all types of institutions and for all the scenarios considered—are larger when a smaller fraction of liabilities are fair valued (compare with Figure 3.3., the results under FFV). Thus, the benefits intended by the intro-duction of the FVO, which were to reduce the accounting volatility of the mixed attributes
27In effect, valuing these instruments at amortized cost would produce comparable results to being classified as HTM.
Modeling Fair Value accounting through the Business cycle using siMulations
table 3.4. application of Fair Value by u.S. and european Banks, 2007(In percent of total balance sheet )
Financial Institutions
Assets at Fair Value
on a Recurring Basis
Liabilities at Fair Value
on a Recurring Basis
Return on
EquityJPMorgan Chase & Co. 41 16 12.86Citigroup 39 22 3.08Bank of America 27 6 10.77Goldman Sachs 64 43 31.52Lehman Brothers 42 22 20.89Merrill Lynch 44 33 –25.37Morgan Stanley 44 27 9.75Credit Suisse 64 39 17.88Société Générale 46 32 3.36Royal Bank of Scotland 45 31 15.13BNP Paribas 65 55 16.98Deutsche Bank 75 48 18.55UBS 54 35 –10.28HSBC 40 25 16.18Barclays 52 39 20.50Crédit Agricole 44 24 10.67
Sources: Fitch Ratings (2006b); and Bloomberg L.P. 5565758595
105115125135145
Business cycle trend
U.S. Commercial Banks
Business cycle trend
Business cycle trend
Business cycle trough
Business cycle peak
5565758595
105115125135145
Business cycle trend
U.S. Investment Banks
Business cycle trend
Business cycle trend
Business cycle trough
Business cycle peak
5565758595
105115125135145
Business cycle trend
European Banks
Business cycle trend
Business cycle trend
Business cycle trough
Business cycle peak
117.4
103.8
85.0
98.3
140.9
96.9
58.8
101.5
62.0
97.6
141.9
105.1
Source: IMF staff estimates.Note: LGD = loss given default.
Figure 3.4. Simulation of Full Fair Value: Changes in Funding Conditions and Financial Market Distress
Normal cycleCycle in funding spreads
Cycle in debt securities’ LGDs
chaPter 3 Fair Value accounting and Procyclicality
120
methods and the need for FV hedge accounting techniques, are lessened. This could be inter-preted as supporting an expanded application of FV, rather than a reduced application, however, this conclusion should be interpreted cautiously. Bear in mind that the application of FV to banks’ own debt may produce revaluation gains as the value of liabilities declines on their balance sheets. While this logically has the effect of reducing procyclicality, the lower value of lia-bilities should lead a user of financial statements to consider the reason for the lower valuation and thus the future viability of the bank, as this information cannot be considered a positive fac-tor even though procyclicality is reduced. Thus, the reasons for variability in own-debt valuations should be properly disclosed.
This simulation highlights that the greater the imbalance of the mixed attributes application to assets and liabilities, the greater is the account-ing volatility. When financial instruments are valued at a historical cost that does not repre-sent the current market conditions, an accurate picture of a bank’s equity becomes blurred and the informational content of the accounting statement weakens. Historical costs have low information content for investors who rely on current financial figures as a basis for invest-ment decisions. For a regulator, making an accurate assessment of the health of a bank, and formulating the appropriate regulatory response, becomes increasingly difficult.
The second simulation (not shown), where financial liabilities plus loans and mortgages are all valued at amortized cost, showed that the range of fluctuations diminished further than in the above simulation. Thus, although the wider application of the mixed attributes model can reduce fluctuations in the balance sheet, the cost comes in the form of a further reduc-tion in up-to-date information.
Smoothing Techniques and Circuit Breakers on Reporting Prices
Simulations using proposed alternatives to smooth balance sheet volatility show that a smoothing/averaging technique for falling
94
96
98
100
102
104
106
108
110
Business cycle trend
Normal Cycle
Business cycle trend
Business cycle trend
Business cycle trough
Business cycle peak
40
60
80
100
120
140
160
Business cycle trend
Cycle in Funding Spreads
Business cycle trend
Business cycle trend
Business cycle trough
Business cycle peak
10
40
70
100
130
160
Business cycle trend
Bust-Boom Cycle in Real Estate
Business cycle trend
Business cycle trend
Business cycle trough
Business cycle peak
Source: IMF staff estimates.
Figure 3.5. Simulation of Full Fair Value: International versus Retail-Oriented Banks
U.S. commercial banksRetail-oriented U.S. banks
European banksRetail-oriented European banks
105.1
103.8
96.5
98.3
62.0
88.9
141.9
114.0
107.8
103.8
14.4
69.1
121
asset prices blurs the bank’s capital position in magnitudes varying by the amount and period over which the averages are calculated. Smoothing techniques and other impediments to allowing valuations to adjust—so-called “circuit break-ers”—make it harder for regulators and inves-tors to accurately assess the financial position of a bank, as they hide the economic volatility that should be accounted for in the balance sheet.
To illustrate, two smoothing simulations were conducted, each averaging share prices over different lengths. The first simulation uses a two-period average, whereas the second simu-lation is extended to three periods. As shown in Figure 3.7, the longer the averaging length, not surprisingly, the smoother is the path of the balance sheet. Notably, the application of a smoothing technique might reduce the occasion for “forced” sales, as it could avoid sale triggers in some cases. Accordingly, this could lessen a downward price spiral in the market for a finan-cial product by avoiding forced sales, but comes at the expense of a reduction in the informa-tional content of financial statements and poten-tially lengthening the resolution period.
Similarly, concepts such as a circuit breaker, whereby rules stem the recognition of a fall in asset prices, mask the underlying equity position by suspending equity at an artificially higher level than under FV and, more generally, may hamper price discovery. However, in this case, the cycle may be extenuated even longer than with a smoothing technique because the circuit breaker can maintain the same value for a given period, while the smoothing is a rolling average that is updated during each period of the cycle. Additionally, this measure is asymmetrically applied, as the circuit breaker has generally been proposed for when valuations are falling. Even though not a preferred technique, for sym-metry, one could apply circuit breakers during “bubble” periods to stop the artificial inflation of equity. If not, asymmetric treatment of valua-tions may create perverse risk-taking incentives for managers as long as financial institutions are able to benefit from the upside in valuation while the downside would remain capped.
Modeling Fair Value accounting through the Business cycle using siMulations
90
95
100
105
110
115
Business cycle trend
Normal Cycle
Business cycle trend
Business cycle trend
Business cycle trough
Business cycle peak
40
60
80
100
120
140
160
Business cycle trend
Bust-Boom Cycle in Share Prices
Business cycle trend
Business cycle trend
Business cycle trough
Business cycle peak
40
60
80
100
120
140
Business cycle trend
Bust-Boom Cycle in Real Estate
Business cycle trend
Business cycle trend
Business cycle trough
Business cycle peak
Source: IMF staff estimates.1Includes short- and long-term financial liabilities valued at amortized cost.
Figure 3.6. Simulation of Partial Fair Value1
U.S. commercial banksU.S. investment banks
European banks
111.3
107.9
94.7
96.3
155.5
125.4
50.5
78.7
63.8
95.5
111.3
109.4
chaPter 3 Fair Value accounting and Procyclicality
122
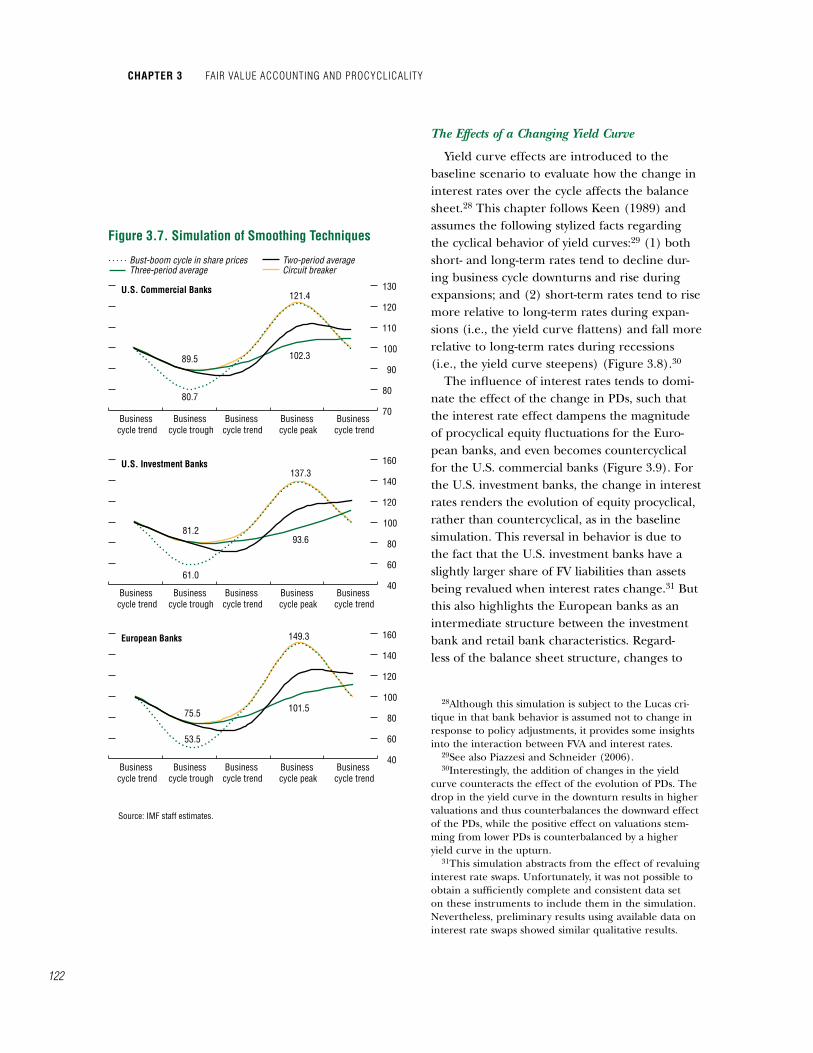
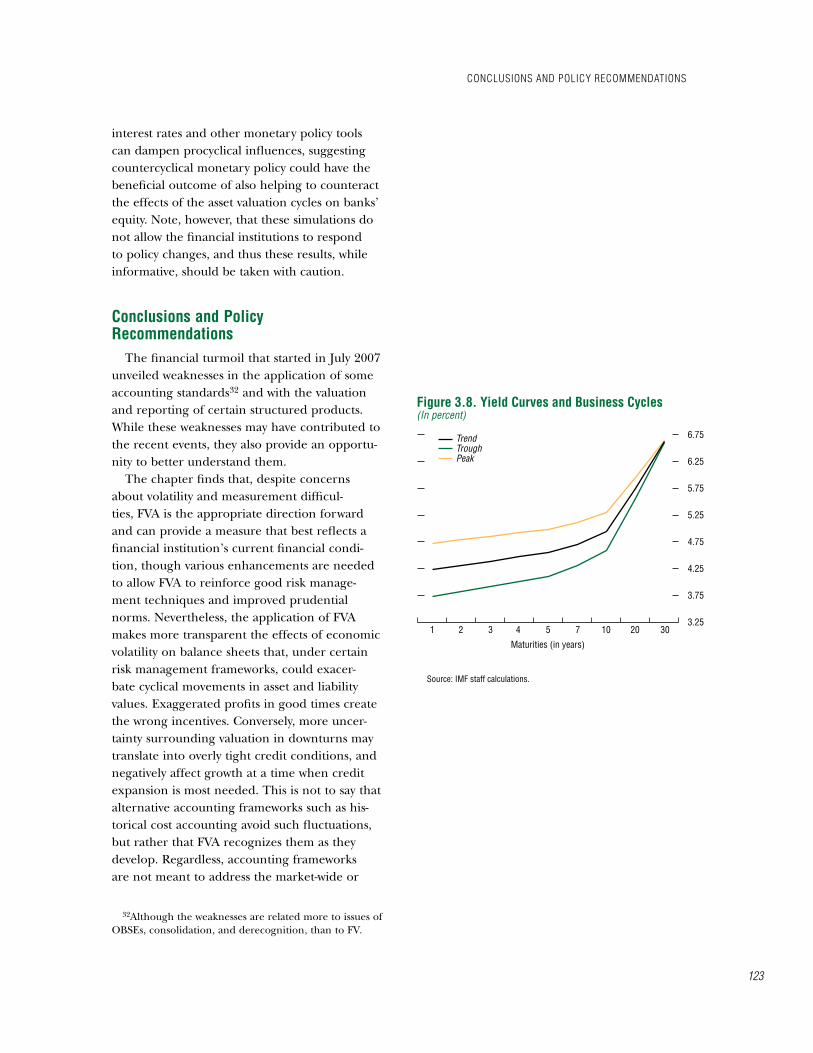
The Effects of a Changing Yield Curve
Yield curve effects are introduced to the baseline scenario to evaluate how the change in interest rates over the cycle affects the balance sheet.28 This chapter follows Keen (�989) and assumes the following stylized facts regarding the cyclical behavior of yield curves:29 (�) both short- and long-term rates tend to decline dur-ing business cycle downturns and rise during expansions; and (2) short-term rates tend to rise more relative to long-term rates during expan-sions (i.e., the yield curve flattens) and fall more relative to long-term rates during recessions (i.e., the yield curve steepens) (Figure 3.8).30
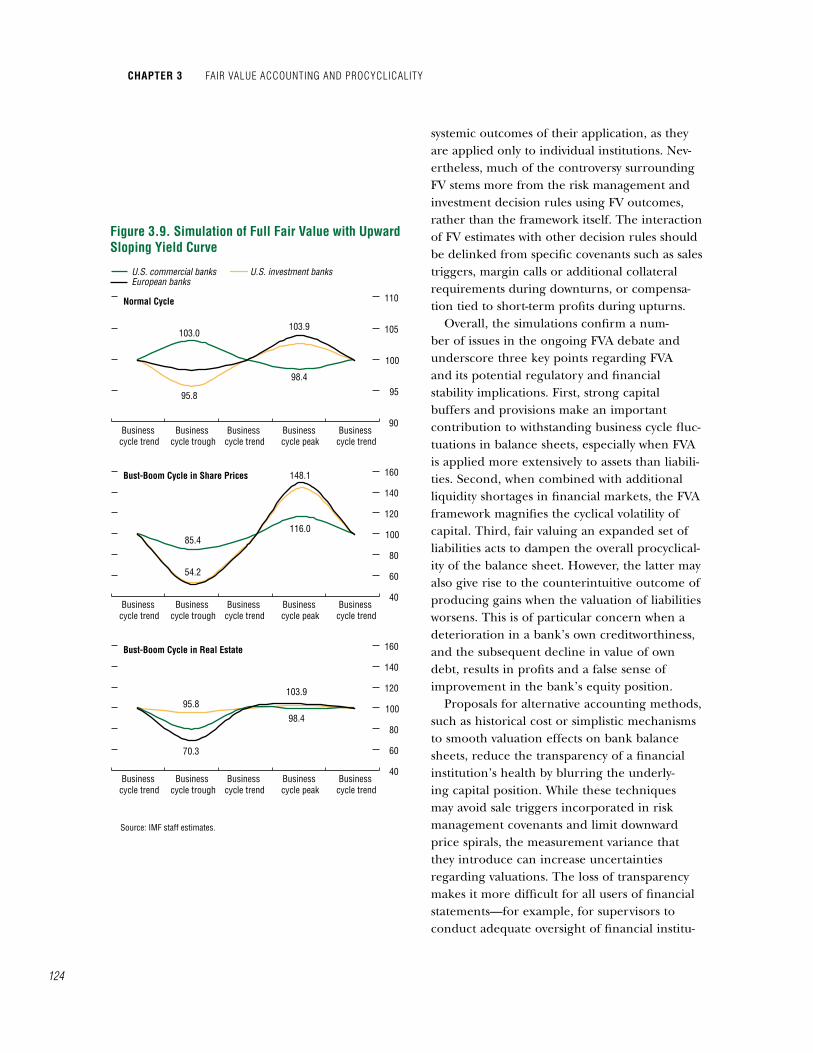
The influence of interest rates tends to domi-nate the effect of the change in PDs, such that the interest rate effect dampens the magnitude of procyclical equity fluctuations for the Euro-pean banks, and even becomes countercyclical for the U.S. commercial banks (Figure 3.9). For the U.S. investment banks, the change in interest rates renders the evolution of equity procyclical, rather than countercyclical, as in the baseline simulation. This reversal in behavior is due to the fact that the U.S. investment banks have a slightly larger share of FV liabilities than assets being revalued when interest rates change.3� But this also highlights the European banks as an intermediate structure between the investment bank and retail bank characteristics. Regard-less of the balance sheet structure, changes to
28Although this simulation is subject to the Lucas cri-tique in that bank behavior is assumed not to change in response to policy adjustments, it provides some insights into the interaction between FVA and interest rates.
29See also Piazzesi and Schneider (2006).30Interestingly, the addition of changes in the yield
curve counteracts the effect of the evolution of PDs. The drop in the yield curve in the downturn results in higher valuations and thus counterbalances the downward effect of the PDs, while the positive effect on valuations stem-ming from lower PDs is counterbalanced by a higher yield curve in the upturn.
3�This simulation abstracts from the effect of revaluing interest rate swaps. Unfortunately, it was not possible to obtain a sufficiently complete and consistent data set on these instruments to include them in the simulation. Nevertheless, preliminary results using available data on interest rate swaps showed similar qualitative results.
70
80
90
100
110
120
130
Business cycle trend
U.S. Commercial Banks
Business cycle trend
Business cycle trend
Business cycle trough
Business cycle peak
40
60
80
100
120
140
160
Business cycle trend
U.S. Investment Banks
Business cycle trend
Business cycle trend
Business cycle trough
Business cycle peak
40
60
80
100
120
140
160
Business cycle trend
European Banks
Business cycle trend
Business cycle trend
Business cycle trough
Business cycle peak
Source: IMF staff estimates.
Figure 3.7. Simulation of Smoothing Techniques
Bust-boom cycle in share pricesThree-period average
Two-period averageCircuit breaker
121.4
102.3
80.7
89.5
61.0
81.2
137.3
93.6
149.3
101.5
53.5
75.5
123
interest rates and other monetary policy tools can dampen procyclical influences, suggesting countercyclical monetary policy could have the beneficial outcome of also helping to counteract the effects of the asset valuation cycles on banks’ equity. Note, however, that these simulations do not allow the financial institutions to respond to policy changes, and thus these results, while informative, should be taken with caution.
conclusions and Policy recommendations
The financial turmoil that started in July 2007 unveiled weaknesses in the application of some accounting standards32 and with the valuation and reporting of certain structured products. While these weaknesses may have contributed to the recent events, they also provide an opportu-nity to better understand them.
The chapter finds that, despite concerns about volatility and measurement difficul-ties, FVA is the appropriate direction forward and can provide a measure that best reflects a financial institution’s current financial condi-tion, though various enhancements are needed to allow FVA to reinforce good risk manage-ment techniques and improved prudential norms. Nevertheless, the application of FVA makes more transparent the effects of economic volatility on balance sheets that, under certain risk management frameworks, could exacer-bate cyclical movements in asset and liability values. Exaggerated profits in good times create the wrong incentives. Conversely, more uncer-tainty surrounding valuation in downturns may translate into overly tight credit conditions, and negatively affect growth at a time when credit expansion is most needed. This is not to say that alternative accounting frameworks such as his-torical cost accounting avoid such fluctuations, but rather that FVA recognizes them as they develop. Regardless, accounting frameworks are not meant to address the market-wide or
32Although the weaknesses are related more to issues of OBSEs, consolidation, and derecognition, than to FV.
conclusions and Policy recoMMendations
3020107543213.25
3.75
4.25
4.75
5.25
5.75
6.25
6.75
Figure 3.8. Yield Curves and Business Cycles(In percent)
TrendTroughPeak
Maturities (in years)
Source: IMF staff calculations.
chaPter 3 Fair Value accounting and Procyclicality
124
systemic outcomes of their application, as they are applied only to individual institutions. Nev-ertheless, much of the controversy surrounding FV stems more from the risk management and investment decision rules using FV outcomes, rather than the framework itself. The interaction of FV estimates with other decision rules should be delinked from specific covenants such as sales triggers, margin calls or additional collateral requirements during downturns, or compensa-tion tied to short-term profits during upturns.
Overall, the simulations confirm a num-ber of issues in the ongoing FVA debate and underscore three key points regarding FVA and its potential regulatory and financial stability implications. First, strong capital buffers and provisions make an important contribution to withstanding business cycle fluc-tuations in balance sheets, especially when FVA is applied more extensively to assets than liabili-ties. Second, when combined with additional liquidity shortages in financial markets, the FVA framework magnifies the cyclical volatility of capital. Third, fair valuing an expanded set of liabilities acts to dampen the overall procyclical-ity of the balance sheet. However, the latter may also give rise to the counterintuitive outcome of producing gains when the valuation of liabilities worsens. This is of particular concern when a deterioration in a bank’s own creditworthiness, and the subsequent decline in value of own debt, results in profits and a false sense of improvement in the bank’s equity position.
Proposals for alternative accounting methods, such as historical cost or simplistic mechanisms to smooth valuation effects on bank balance sheets, reduce the transparency of a financial institution’s health by blurring the underly-ing capital position. While these techniques may avoid sale triggers incorporated in risk management covenants and limit downward price spirals, the measurement variance that they introduce can increase uncertainties regarding valuations. The loss of transparency makes it more difficult for all users of financial statements—for example, for supervisors to conduct adequate oversight of financial institu-
90
95
100
105
110
Business cycle trend
Normal Cycle
Business cycle trend
Business cycle trend
Business cycle trough
Business cycle peak
40
60
80
100
120
140
160
Business cycle trend
Bust-Boom Cycle in Share Prices
Business cycle trend
Business cycle trend
Business cycle trough
Business cycle peak
40
60
80
100
120
140
160
Business cycle trend
Bust-Boom Cycle in Real Estate
Business cycle trend
Business cycle trend
Business cycle trough
Business cycle peak
Source: IMF staff estimates.
Figure 3.9. Simulation of Full Fair Value with Upward Sloping Yield Curve
U.S. commercial banksEuropean banks
U.S. investment banks
103.9
98.4
95.8
103.0
148.1
116.0
54.2
85.4
103.9
98.4
70.3
95.8

125
tions and recommend appropriate regulatory measures to deal with prudential concerns, and for investors who will demand increased risk premia in the face of uncertainty.
Policy Proposals
Most proposals should aim to deal with the use of FV estimates to lessen the volatility that FVA can introduce to the balance sheet. Assess-ments of provisioning and capital adequacy should take better account of the business cycle. Improved transparency can be achieved not necessarily by more disclosures, but better dis-closures. The proposal this year by the Financial Stability Forum (2008) on disclosure practices in financial reports provides recommendations in this direction.
The simulations support the relevance of establishing a capital buffer that looks through the cycle, augmenting the capital position dur-ing boom cycles to withstand the burden on capital that stems from economic downturns. Although a partial analysis, the simulations show that FVA can introduce financial statement vola-tility and provide a first indication that buffers of around 2 to 4 percent of additional capital would help banks weather normal cyclical down-turns, whereas higher buffers—on the order of 30 to 40 percent extra capital—would be needed to offset more severe shocks. Recognizing that these estimates do not reflect concurrent changes in risk-weighted assets, they nevertheless provide an initial estimate of the magnitude of the needed capital buffer, as well as the direc-tion for further analysis. Note that these are not adjustments to FV calculation, per se, but are adjustments meant to help mitigate the impact on bank balance sheets. Consideration to mak-ing other changes to the accounting framework so that the FV calculations themselves obviate the need for these other adjustments would be useful at this juncture.
Broadening the current narrow concept of provisions to incorporate additional methods of retaining income in upswings could provide a way of better offsetting balance sheets’ procy-
clical effects. It is generally agreed that provi-sions protect against expected losses and capital protects against unexpected losses. A buildup of provisions better linked to the expected volatility, higher risks, and potentially larger losses of an asset could better anticipate the potential negative effects on the balance sheet that would be reflected through the cycle, as long as the buildup does not provide a way for smoothing or manipulating earnings. Coordination between accounting standard setters and supervisors would be needed to effect such changes.
Similarly, the use of forward-looking provision-ing,33 combined with a supervisor’s experienced credit judgment in assessing the probability of default, loss given default, and loan loss provi-sioning,34 could mitigate the procyclical forces on the balance sheet. The recognition of credit losses in the loan portfolio earlier in a downward cycle would lessen an accompanying decline in bank profits and the potential for a squeeze in credit extension that could contribute to a further downward economic trend. Similarly, on the upside, dividend distributions should only come from realized earnings that are not biased by upward cyclical moves.
From an oversight perspective, the simulations underscore the importance of understanding the cyclical implications of FVA. An enhanced role for prudential supervisors will be needed to ensure close inspection of a bank’s risk pro-
33Forward-looking provisioning denotes provisions based on the likelihood of default over the lifetime of the loan, reflecting any changes in the probability of default (after taking into account recovery rates). Dynamic (or statistical) provisioning can be considered an extension of forward-looking provisions with reliance on historical data on losses for provisioning calculations. Conceptually, dynamic provisioning would entail that during the upside of the cycle, specific provisions are low and the statistical provision builds up, generating a fund; during the down-turn, the growth in specific provisions can be met using the statistical fund instead of the profit and loss account. See Enria and others (2004) and Bank of Spain (2007). For further discussion of this topic and the transparency of the Spanish provisioning method, see Fernández de Lis, Pagés, and Saurina (2000) and Jiménez and Saurina (2006).
34Basel Committee on Banking Supervision (2006b) and IAS 39.
conclusions and Policy recoMMendations

chaPter 3 Fair Value accounting and Procyclicality
126
file and risk management practices, and make appropriate recommendations for augmented capital buffers and provisions, as needed. A com-prehensive bank supervisory framework should include stress tests of FV positions through the business cycle. Similarly, auditors will have a critical role to play in ensuring credibility, consistency, and neutrality in the application of FVA, and overall in supporting market confi-dence rather than appearing to augment procy-clicality by encouraging lower valuations during a downturn. A closer collaborative framework among audit and accounting standard setters and supervisors would be highly beneficial for markets and financial stability.
In light of the different dynamics through the financial cycle and the doubts that can surround valuations, FV estimates should be supplemented by information on a financial instrument’s price history, the variance around the FV calculations, and management’s forward-looking view of asset-price progression and how it will impact the institution’s balance sheet. Reporting a range within which the FV price could fall would help users of financial state-ments to better understand and utilize the vola-tilities with which they are dealing. FV estimates should be supplemented with detailed notes on the assumptions underlying the valuations and sensitivity analyses so that investors can conduct their own scenario analyses and determine whether the FV price is representative of market conditions.
More refined disclosures could meet the expanding needs of various users, including investors, supervisors, and depositors, in a com-mon framework of disclosure. For example, a series of shorter reports that would be available on websites,35 issued more frequently (e.g., quarterly),36 and cater to a narrower group of users’ needs could highlight the most relevant
35The Financial Accounting Standards Board’s XRBL project for financial institutions would provide data online in about three years, as discussed in the April 2008 edition of the Global Financial Stability Report (IMF, 2008b).
36This would be separate from U.S. SEC �0-Q filings.
information, with a particular emphasis on risk developments. Further, the volatility associated with an FV balance sheet may mean that the bal-ance sheet is no longer the primary medium for evaluating bank capital. Market participants and supervisors may increasingly turn to cash flow statements, income and equity statements, and risk measures to provide enhanced information, and these statements must evolve in response to users’ needs.
Albeit of a simple structure and subject to isolated shock scenarios, the simulations point to the fact that the application of FV to both sides of the balance sheet would introduce a countercyclical component that may cushion some of the financial shocks that can result in large swings in bank equity. This result, how-ever, arises in the shock scenarios, in part, from a deterioration in the own-debt values as risk premia rise on the liability side of the balance sheet. This logically compensates for the dete-rioration of the asset side during a downturn. From the viewpoint of assessing the riskiness of the financial institution or its future prospects, the result can be viewed as paradoxical, as it can hardly be regarded as a positive factor for the financial institution to have its own-debt values deteriorate. The simulations also illustrate how a bank’s response to a particular shock varies substantially depending on the specific bal-ance sheet structure and thus there is a need to discern the source of the cyclicality through additional disclosures.
A key challenge going forward will be to enrich the FVA framework so that market par-ticipants and supervisors are better informed in order to promote market discipline and financial stability. The fragmented solution that currently exists between the accounting, prudential, and risk management approaches to valuation is insufficient and must be reconciled. Importantly, this will require adjustments on the part of all three disciplines to resolve these tensions. As the 2007–08 financial turmoil continues to unfold, FVA alternatives and dis-closures will continue to be tested and provide insights for improvement.

127
annex 3.1. data and Modeling assumptions37
This annex presents the construction of the simulation exercises and reviews the assumptions underlying the various scenarios.
Banks’ Balance Sheets
To accurately reflect the balance sheets of a representative large U.S. commercial bank, a large U.S. investment bank, a large European bank, and retail-oriented U.S. and European banks, the financial statements at end-2006 for these five banking groups were compiled from the institutions’ annual reports and the U.S. Securities and Exchange Commission’s �0-K fil-ings.38 Individual bank balance sheets were then used to construct a weighted average for each type of institution, and the resulting representa-tive balance sheets (Table 3.�).
Table 3.� indicates the line items that were fair valued in the simulations.39,40 Not all the items in the balance sheet were fair valued in the simulations: items that are typically not available for sale (e.g., securities in the bank-ing book) and items that fall under the “other” categories were held constant.4�
37Juan Solé prepared this annex. 38December 2006 was selected as the filing period in
order to obtain balance sheets that are relatively recent, while at the same time not reflecting too closely banks’ balance sheet structure in the run-up to or fall-out from the 2007–08 U.S. subprime meltdown.
39For simulation purposes, all banks were assumed to be newly established, so that all balance sheet items are at fair value at the start of the simulations. Thus, the shocks applied to the baseline reflect only the pure impact of the shocks, and not a combination of the imposed shock plus any initial deviations from fair value.
40IAS 39 prevents the valuation of demand deposits at less than face value, even if a significant portion of these display economic characteristics of a term deposit. Conse-quently, deposits remain at face value in the exercise.
4�Despite credit derivative exposures being a central element in the 2007–08 turmoil, an explicit breakdown of them was unavailable in the 2006 reports. Some mortgage-backed securities were included in the debt securities category.
Valuation of assets and liabilities under Fair Value
Loans and debt securities are valued at their expected net present value (NPV), which takes into account the probability of default (PD) and the loss given default (LGD) of each instrument. In other words, the value of a given security (or loan) with a maturity of T years is given by the expression
T E(CFt)NPV = Σ ————, t =� (� + dt)t
where dt is the discount rate for year t, and E(CFt) is the expected cash flow for year t factor-ing in the possibility that the security (or loan) defaults, that is,
E(CFt) = [PDt⋅(� + rt)⋅N⋅(� – LGDt)] + [(� – PDt)⋅rt⋅N] for all t < T,
and
E(CFT) = [PDT⋅(� + rT)⋅N⋅(� – LGDT)] + [(� – PDt)⋅(� + rT)⋅N ],
where PDt stands for probability of default,42 rt is the interest rate on the loan, N is the notional amount of the loan, and LGDt is the loss given default.
Under fair value (FV), traded shares are valued at their market price. Since the detailed composition of the shares portfolio of banks was not available, it was assumed that banks hold a generic type of share that represents the Standard & Poor’s 500 Stock Market Index. Therefore, the number of shares for each type of bank was obtained by dividing the value of their shares portfolio at end-2006 by the value of the S&P 500 index at the same date.
characterization of the Business cycles
To simplify the analysis, the chapter consid-ers a stylized business cycle consisting of four periods representing different points in a typical
42Strictly speaking, PDt is the conditional probability of default at time t. That is, the probability that, condi-tional on not having defaulted before, a loan defaults in period t.
annex 3.1. data and Modeling assuMPtions
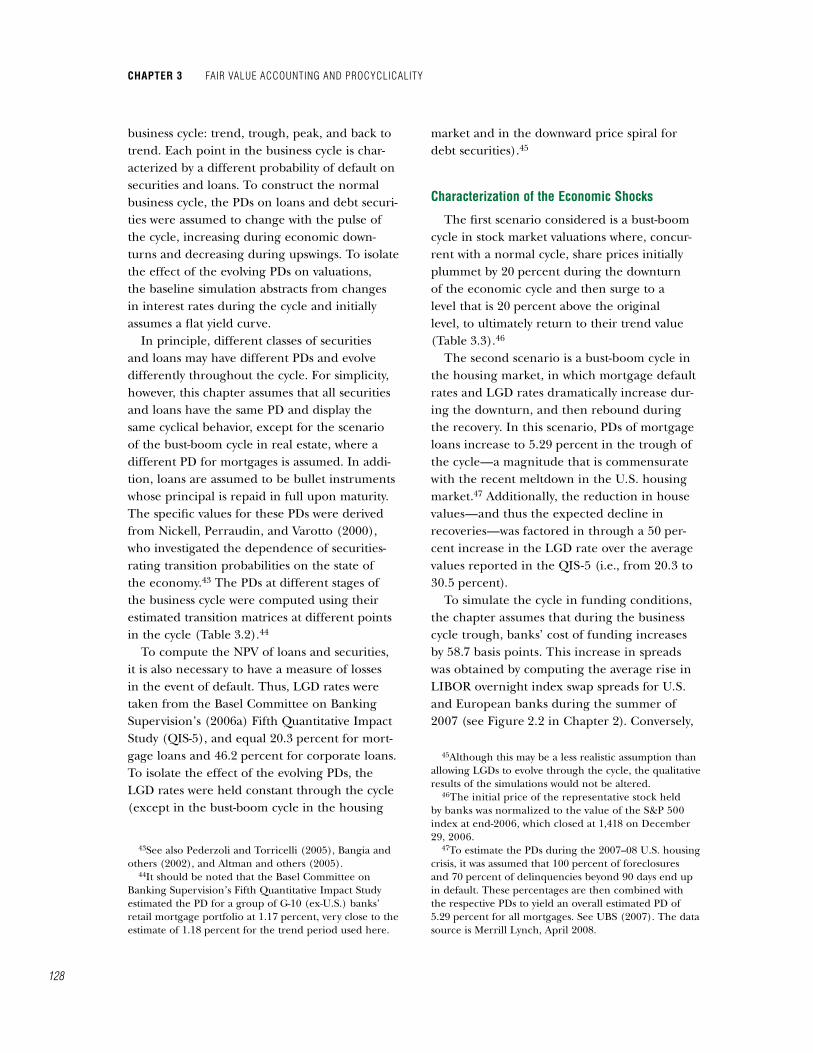
chaPter 3 Fair Value accounting and Procyclicality
128
business cycle: trend, trough, peak, and back to trend. Each point in the business cycle is char-acterized by a different probability of default on securities and loans. To construct the normal business cycle, the PDs on loans and debt securi-ties were assumed to change with the pulse of the cycle, increasing during economic down-turns and decreasing during upswings. To isolate the effect of the evolving PDs on valuations, the baseline simulation abstracts from changes in interest rates during the cycle and initially assumes a flat yield curve.
In principle, different classes of securities and loans may have different PDs and evolve differently throughout the cycle. For simplicity, however, this chapter assumes that all securities and loans have the same PD and display the same cyclical behavior, except for the scenario of the bust-boom cycle in real estate, where a different PD for mortgages is assumed. In addi-tion, loans are assumed to be bullet instruments whose principal is repaid in full upon maturity. The specific values for these PDs were derived from Nickell, Perraudin, and Varotto (2000), who investigated the dependence of securities-rating transition probabilities on the state of the economy.43 The PDs at different stages of the business cycle were computed using their estimated transition matrices at different points in the cycle (Table 3.2).44
To compute the NPV of loans and securities, it is also necessary to have a measure of losses in the event of default. Thus, LGD rates were taken from the Basel Committee on Banking Supervision’s (2006a) Fifth Quantitative Impact Study (QIS-5), and equal 20.3 percent for mort-gage loans and 46.2 percent for corporate loans. To isolate the effect of the evolving PDs, the LGD rates were held constant through the cycle (except in the bust-boom cycle in the housing
43See also Pederzoli and Torricelli (2005), Bangia and others (2002), and Altman and others (2005).
44It should be noted that the Basel Committee on Banking Supervision’s Fifth Quantitative Impact Study estimated the PD for a group of G-�0 (ex-U.S.) banks’ retail mortgage portfolio at �.�7 percent, very close to the estimate of �.�8 percent for the trend period used here.
market and in the downward price spiral for debt securities).45
characterization of the economic Shocks
The first scenario considered is a bust-boom cycle in stock market valuations where, concur-rent with a normal cycle, share prices initially plummet by 20 percent during the downturn of the economic cycle and then surge to a level that is 20 percent above the original level, to ultimately return to their trend value (Table 3.3).46
The second scenario is a bust-boom cycle in the housing market, in which mortgage default rates and LGD rates dramatically increase dur-ing the downturn, and then rebound during the recovery. In this scenario, PDs of mortgage loans increase to 5.29 percent in the trough of the cycle—a magnitude that is commensurate with the recent meltdown in the U.S. housing market.47 Additionally, the reduction in house values—and thus the expected decline in recoveries—was factored in through a 50 per-cent increase in the LGD rate over the average values reported in the QIS-5 (i.e., from 20.3 to 30.5 percent).
To simulate the cycle in funding conditions, the chapter assumes that during the business cycle trough, banks’ cost of funding increases by 58.7 basis points. This increase in spreads was obtained by computing the average rise in LIBOR overnight index swap spreads for U.S. and European banks during the summer of 2007 (see Figure 2.2 in Chapter 2). Conversely,
45Although this may be a less realistic assumption than allowing LGDs to evolve through the cycle, the qualitative results of the simulations would not be altered.
46The initial price of the representative stock held by banks was normalized to the value of the S&P 500 index at end-2006, which closed at �,4�8 on December 29, 2006.
47To estimate the PDs during the 2007–08 U.S. housing crisis, it was assumed that �00 percent of foreclosures and 70 percent of delinquencies beyond 90 days end up in default. These percentages are then combined with the respective PDs to yield an overall estimated PD of 5.29 percent for all mortgages. See UBS (2007). The data source is Merrill Lynch, April 2008.
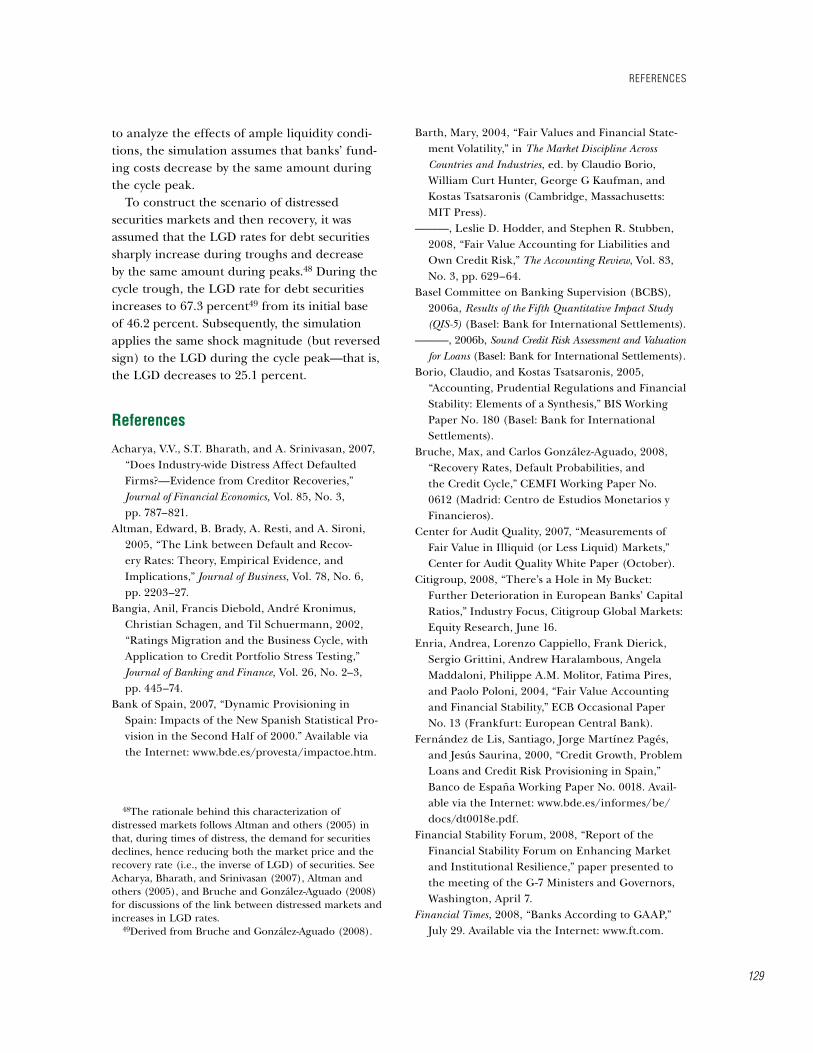
129
to analyze the effects of ample liquidity condi-tions, the simulation assumes that banks’ fund-ing costs decrease by the same amount during the cycle peak.
To construct the scenario of distressed securities markets and then recovery, it was assumed that the LGD rates for debt securities sharply increase during troughs and decrease by the same amount during peaks.48 During the cycle trough, the LGD rate for debt securities increases to 67.3 percent49 from its initial base of 46.2 percent. Subsequently, the simulation applies the same shock magnitude (but reversed sign) to the LGD during the cycle peak—that is, the LGD decreases to 25.� percent.
references
Acharya, V.V., S.T. Bharath, and A. Srinivasan, 2007, “Does Industry-wide Distress Affect Defaulted Firms?—Evidence from Creditor Recoveries,” Journal of Financial Economics, Vol. 85, No. 3, pp. 787–82�.
Altman, Edward, B. Brady, A. Resti, and A. Sironi, 2005, “The Link between Default and Recov-ery Rates: Theory, Empirical Evidence, and Implications,” Journal of Business, Vol. 78, No. 6, pp. 2203–27.
Bangia, Anil, Francis Diebold, André Kronimus, Christian Schagen, and Til Schuermann, 2002, “Ratings Migration and the Business Cycle, with Application to Credit Portfolio Stress Testing,” Journal of Banking and Finance, Vol. 26, No. 2–3, pp. 445–74.
Bank of Spain, 2007, “Dynamic Provisioning in Spain: Impacts of the New Spanish Statistical Pro-vision in the Second Half of 2000.” Available via the Internet: www.bde.es/provesta/impactoe.htm.
48The rationale behind this characterization of distressed markets follows Altman and others (2005) in that, during times of distress, the demand for securities declines, hence reducing both the market price and the recovery rate (i.e., the inverse of LGD) of securities. See Acharya, Bharath, and Srinivasan (2007), Altman and others (2005), and Bruche and González-Aguado (2008) for discussions of the link between distressed markets and increases in LGD rates.
49Derived from Bruche and González-Aguado (2008).
Barth, Mary, 2004, “Fair Values and Financial State-ment Volatility,” in The Market Discipline Across Countries and Industries, ed. by Claudio Borio, William Curt Hunter, George G Kaufman, and Kostas Tsatsaronis (Cambridge, Massachusetts: MIT Press).
———, Leslie D. Hodder, and Stephen R. Stubben, 2008, “Fair Value Accounting for Liabilities and Own Credit Risk,” The Accounting Review, Vol. 83, No. 3, pp. 629–64.
Basel Committee on Banking Supervision (BCBS), 2006a, Results of the Fifth Quantitative Impact Study (QIS-5) (Basel: Bank for International Settlements).
———, 2006b, Sound Credit Risk Assessment and Valuation for Loans (Basel: Bank for International Settlements).
Borio, Claudio, and Kostas Tsatsaronis, 2005, “Accounting, Prudential Regulations and Financial Stability: Elements of a Synthesis,” BIS Working Paper No. �80 (Basel: Bank for International Settlements).
Bruche, Max, and Carlos González-Aguado, 2008, “Recovery Rates, Default Probabilities, and the Credit Cycle,” CEMFI Working Paper No. 06�2 (Madrid: Centro de Estudios Monetarios y Financieros).
Center for Audit Quality, 2007, “Measurements of Fair Value in Illiquid (or Less Liquid) Markets,” Center for Audit Quality White Paper (October).
Citigroup, 2008, “There’s a Hole in My Bucket: Further Deterioration in European Banks’ Capital Ratios,” Industry Focus, Citigroup Global Markets: Equity Research, June �6.
Enria, Andrea, Lorenzo Cappiello, Frank Dierick, Sergio Grittini, Andrew Haralambous, Angela Maddaloni, Philippe A.M. Molitor, Fatima Pires, and Paolo Poloni, 2004, “Fair Value Accounting and Financial Stability,” ECB Occasional Paper No. �3 (Frankfurt: European Central Bank).
Fernández de Lis, Santiago, Jorge Martínez Pagés, and Jesús Saurina, 2000, “Credit Growth, Problem Loans and Credit Risk Provisioning in Spain,” Banco de España Working Paper No. 00�8. Avail-able via the Internet: www.bde.es/informes/be/docs/dt00�8e.pdf.
Financial Stability Forum, 2008, “Report of the Financial Stability Forum on Enhancing Market and Institutional Resilience,” paper presented to the meeting of the G-7 Ministers and Governors, Washington, April 7.
Financial Times, 2008, “Banks According to GAAP,” July 29. Available via the Internet: www.ft.com.
reFerences

chaPter 3 Fair Value accounting and Procyclicality
130
Fitch Ratings, 2008a, “Fair Value Accounting: Is It Helpful in Illiquid Markets?” Credit Policy Special Report (April 28). Available via the Internet (by subscription): www.fitchratings.com.
———, 2008b, “Fair Value Disclosures: A Reality Check,” Credit Policy Special Report, (June 26). Available via the Internet (by subscription): www.fitchratings.com.
Global Public Policy Committee, 2007, “Determining Fair Value of Financial Instruments under IFRS in Current Market Conditions.” Available via the Internet: www.pwc.com.
Guerrera, F., and B. White, 2008, “Banks Find Way to Cushion Losses,” Financial Times, July 8. Available via the Internet: www.ft.com.
International Accounting Standards Board (IASB), 200�, “Financial Instruments: Recognition and Measurement,” IAS 39. Available via the Internet: www.iasb.org.
———, 2007, “Disclosure of Financial Instruments,” IFRS 7. Available via the Internet: www.iasb.org.
International Monetary Fund (IMF), 2008a, “Financial Stress and Economic Downturns,” Chapter 4, World Economic Outlook, World Economic and Financial Surveys (Washington, October).
———, 2008b, Global Financial Stability Report, World Eco-nomic and Financial Surveys (Washington, April).
Jiménez, Gabriel, and Jésus Saurina, 2006, “Credit Cycles, Credit Risk, and Prudential Regulation,”
International Journal of Central Banking, Vol. 2, No. 2 (June), pp. 65–98.
Kashyap, Anil, 2005, “Financial System Procyclical-ity,” paper presented at the “Joint Conference of the IDB and Federal Reserve Bank of Atlanta’s Americas Center: Toward Better Banking in Latin America,” Washington, January �0.
Keen, Howard, �989, “The Yield Curve as a Predic-tor of Business Cycle Turning Points,” Business Economics, (October). Available via the Internet: http://findarticles.com/p/articles/mi_m�094/is_n4_v24/ai_7987�67.
Nickell, Pamela, William Perraudin, and Simone Varotto, 2000, “Stability of Rating Transitions,” Journal of Banking and Finance, Vol. 24, No. �–2, pp. 203–27.
Pederzoli, Chiara, and Costanza Torricelli, 2005, “Capital Requirements and Business Cycle Regimes: Forward-Looking Modeling of Default Probabilities,” Journal of Banking and Finance, Vol. 29, No. �2 (December), pp. 3�2�–�40.
Piazzesi, Monica, and Martin Schneider, 2006, “Equilibrium Yield Curves,” NBER Working Paper No. �2609 (Cambridge, Massachusetts: National Bureau of Economic Research).
Union Bank of Switzerland (UBS), 2007, “Subprime Loss Protection—A Do-It-Yourself Kit,” Mortgage Strategist, June 26.