
GLOBAL EVENTS, TRENDS & IMPACTS FROM A MACRO-LEVEL … · GLOBAL EVENTS, TRENDS & IMPACTS FROM A...
40
EVESTMENT INSTITUTIONAL INVESTMENT INTELLIGENCE 2016 GLOBAL EVENTS, TRENDS & IMPACTS FROM A MACRO-LEVEL VIEW
Transcript of GLOBAL EVENTS, TRENDS & IMPACTS FROM A MACRO-LEVEL … · GLOBAL EVENTS, TRENDS & IMPACTS FROM A...
E V E S T M E N T I N S T I T U T I O N A L I N V E S T M E N T I N T E L L I G E N C E 2 0 1 6
GLOBAL EVENTS, TRENDS & IMPACTS FROM A MACRO-LEVEL VIEW

SPEAKERS:
Peter LaurelliCharles AshwandenTate Haymond
Samuel Lanasa
GLOBAL EMERGING MARKET EQUITY
CURRENCY TRENDS
THE SHIFT FROM DIVERSIFIED ASSET CLASS
HOST

GLOBAL EMERGING MARKET EQUITY
Asset Flow and Activity Analysis (07/2015 – 06/2016)

GLOBAL EMERGING MARKETS EQUITY – TOTAL AUM ($M)
0
200,000
400,000
600,000
800,000
1,000,000
1,200,000
1,400,000
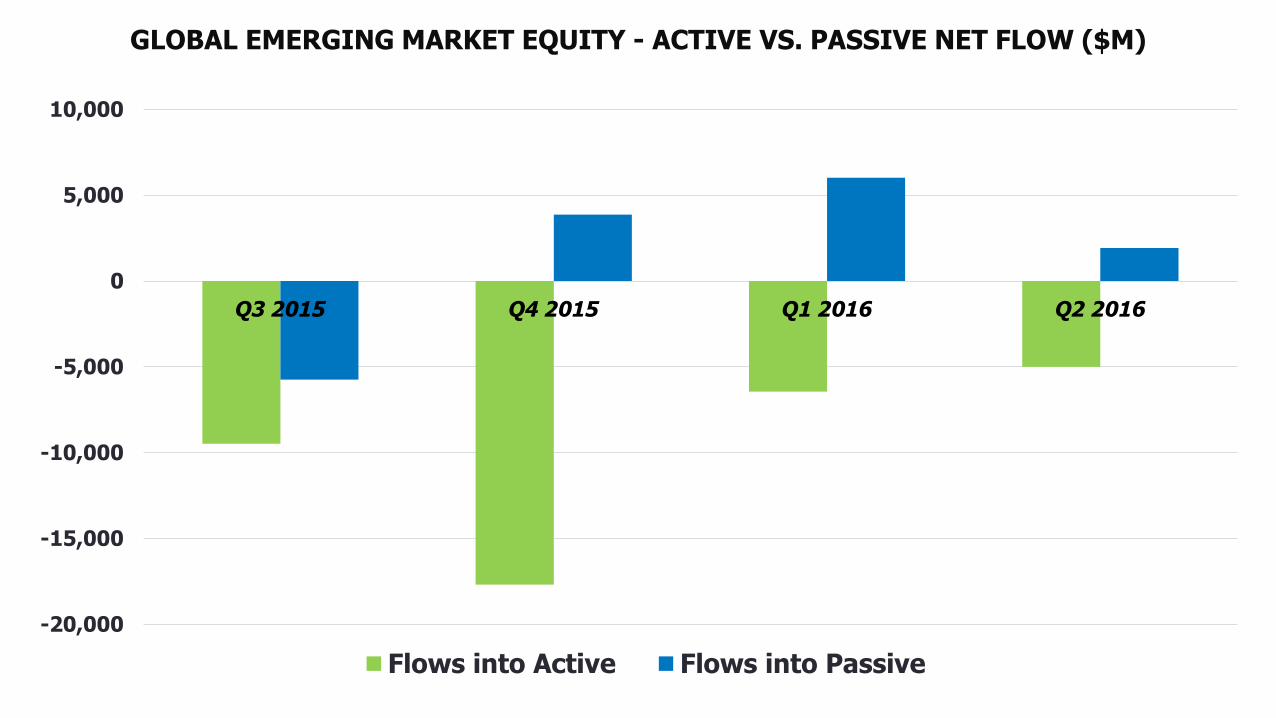
GLOBAL EMERGING MARKET EQUITY - ACTIVE VS. PASSIVE NET FLOW ($M)
-20,000
-15,000
-10,000
-5,000
0
5,000
10,000
Q3 2015 Q4 2015 Q1 2016 Q2 2016
Flows into Active Flows into Passive

GEM ACTIVE EQUITY AUM GROWTH BY DISTRIBUTION CHANNEL (07/15 - 06/16)
-10.8% -10.9%
-17.3%
-11.7%
SEGREGATED ACCOUNTS
INSTITUTIONAL
FUNDSRETAILFUNDS
MSCI EM EQUITY 1 YR
RETURN

$19,018.3
$10,757.4
$5,817.1
2,338.91
TOP QUARTILE 2ND QUARTILE 3RD QUARTILE BOTTOM QUARTILE
Global Emerging Market Active Equity – 1 Year Net Asset Inflow Analysis by 3yr performance quartile ranking
$-14,684.4$-18,293.6
$-26,129.2
-17,187.58
TOP QUARTILE 2ND QUARTILE 3RD QUARTILE BOTTOM QUARTILE
Global Emerging Market Active Equity – 1 Year Net Asset Outflow Analysis by 3yr performance quartile ranking (07/15 - 06/16)
* Quartiles are based on 3 year performance as of end of Q2 2016 relative to the eVestment Emerging Markets Equity Peer Group

$-2,561.9$-5,046.6
$-12,954.1
$-6,651.3
TOP QUARTILE (MOST CONCENTRATED) 2ND QUARTILE 3RD QUARTILE BOTTOM QUARTILE
GEM Active Equity – 1 year Net Flows by quartile: Portfolio Concentration
$-13,470.8 $-2,274.6 $-2,670.4 $-465.6
TOP QUARTILE (HIGHEST FEE) 2ND QUARTILE 3RD QUARTILE BOTTOM QUARTILE
GEM Active Equity – 1 year Net Flows by quartile: Fees
$-5,130.1
$-13,357.4
$-2,417.7
$-8,202.1
TOP QUARTILE (HIGHEST TE) 2ND QUARTILE 3RD QUARTILE BOTTOM QUARTILE
GEM Active Equity – 1 year Net Flows by quartile: Tracking Error (3yr)

$525.1$-10,890.1
$-17,382.3
$-2,155.9
TOP QUARTILE (HIGHEST ACTIVE SHARE) 2ND QUARTILE 3RD QUARTILE BOTTOM QUARTILE
GEM ACTIVE EQUITY – 1 YEAR NET FLOWS BY QUARTILE: ACTIVE SHARE
$-10,703.5
$-7,319.5
$-1,702.2
$-8,472.0
TOP QUARTILE (HIGHEST DY) 2ND QUARTILE 3RD QUARTILE BOTTOM QUARTILE
GEM Active Equity – 1 year Net Flows by quartile: Dividend Yield (1yr)
$-6,644.2$-5,648.4
$-1,573.8
$-5,241.0
TOP QUARTILE (HIGHEST SD) 2ND QUARTILE 3RD QUARTILE BOTTOM QUARTILE
GEM Active Equity – 1 year Net Flows by quartile: Standard Deviation (3yr)
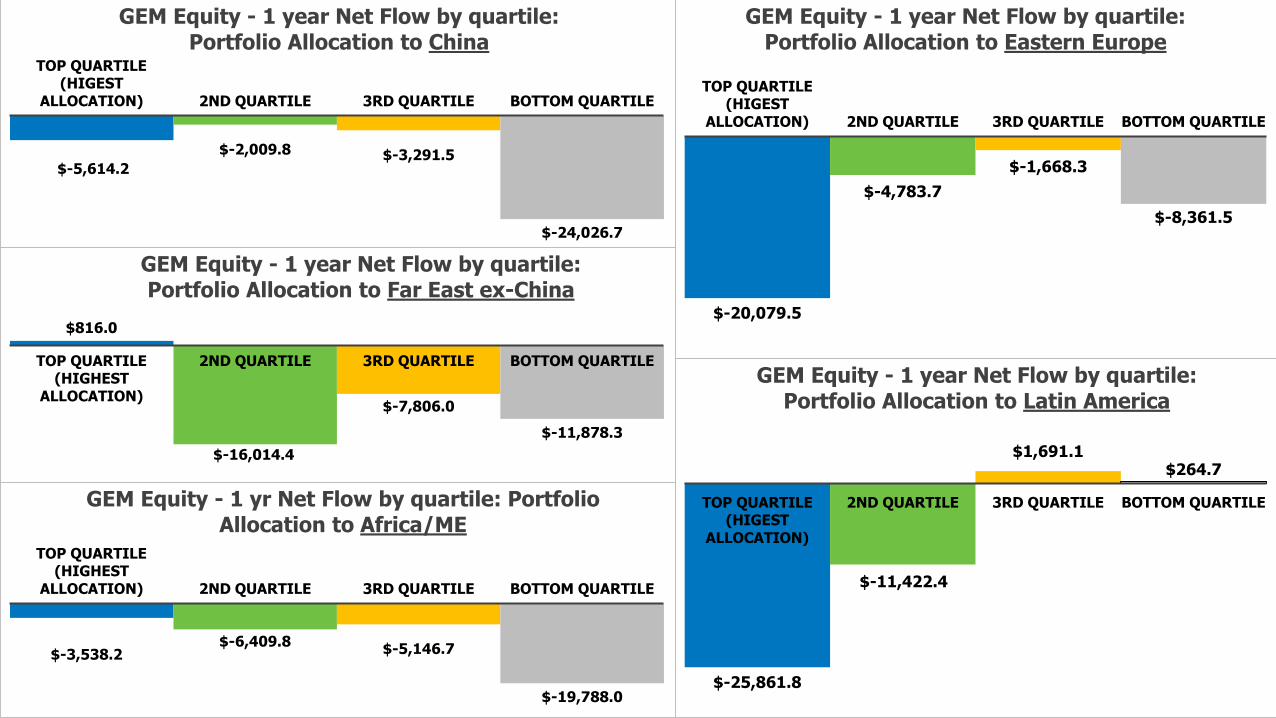
$-5,614.2
$-2,009.8 $-3,291.5
$-24,026.7
TOP QUARTILE (HIGEST
ALLOCATION) 2ND QUARTILE 3RD QUARTILE BOTTOM QUARTILE
GEM Equity - 1 year Net Flow by quartile:Portfolio Allocation to China
$816.0
$-16,014.4
$-7,806.0
$-11,878.3
TOP QUARTILE (HIGHEST
ALLOCATION)
2ND QUARTILE 3RD QUARTILE BOTTOM QUARTILE
GEM Equity - 1 year Net Flow by quartile:Portfolio Allocation to Far East ex-China
$-3,538.2$-6,409.8
$-5,146.7
$-19,788.0
TOP QUARTILE (HIGHEST
ALLOCATION) 2ND QUARTILE 3RD QUARTILE BOTTOM QUARTILE
GEM Equity - 1 yr Net Flow by quartile: Portfolio Allocation to Africa/ME
$-20,079.5
$-4,783.7
$-1,668.3
$-8,361.5
TOP QUARTILE (HIGEST
ALLOCATION) 2ND QUARTILE 3RD QUARTILE BOTTOM QUARTILE
GEM Equity - 1 year Net Flow by quartile: Portfolio Allocation to Eastern Europe
$-25,861.8
$-11,422.4
$1,691.1$264.7
TOP QUARTILE (HIGEST
ALLOCATION)
2ND QUARTILE 3RD QUARTILE BOTTOM QUARTILE
GEM Equity - 1 year Net Flow by quartile: Portfolio Allocation to Latin America

CONCLUSIONS
MetricQuartile Range
associated with the smallest 1 year net flow
Quartile Range associated with the largest 1 year net
flow
Fees 35 - 78bps 100 - 150bps
Active Share .907 - 1 .737 - .817
3-year Tracking Error (MSCI EM) 3.53 - 4.88 4.88 - 6.37
Number of Holdings 15 - 58 94 - 180
Dividend Yield 2.13% - 2.60% 3.11% - 3.86%
Africa/ME Allocation 11% - 17.6% 0% - 6.7%
China Allocation 19.5% - 24% 0% - 12.4%
Far East ex China Allocation 48.1% - 60.1% 43.3% - 48.1%
Eastern Europe Allocation 2.7% - 5.2% 7% - 12.6%
Latin America Allocation 0% - 10.9% 16.8% - 25.8%

Global Active EM Equity – Flow Trends
EM Equity Net Flows - Last 3 years EM Equity Net Flows- Last 6 months
+$685m
-$3,356m
-$1,141m
+$14,122m
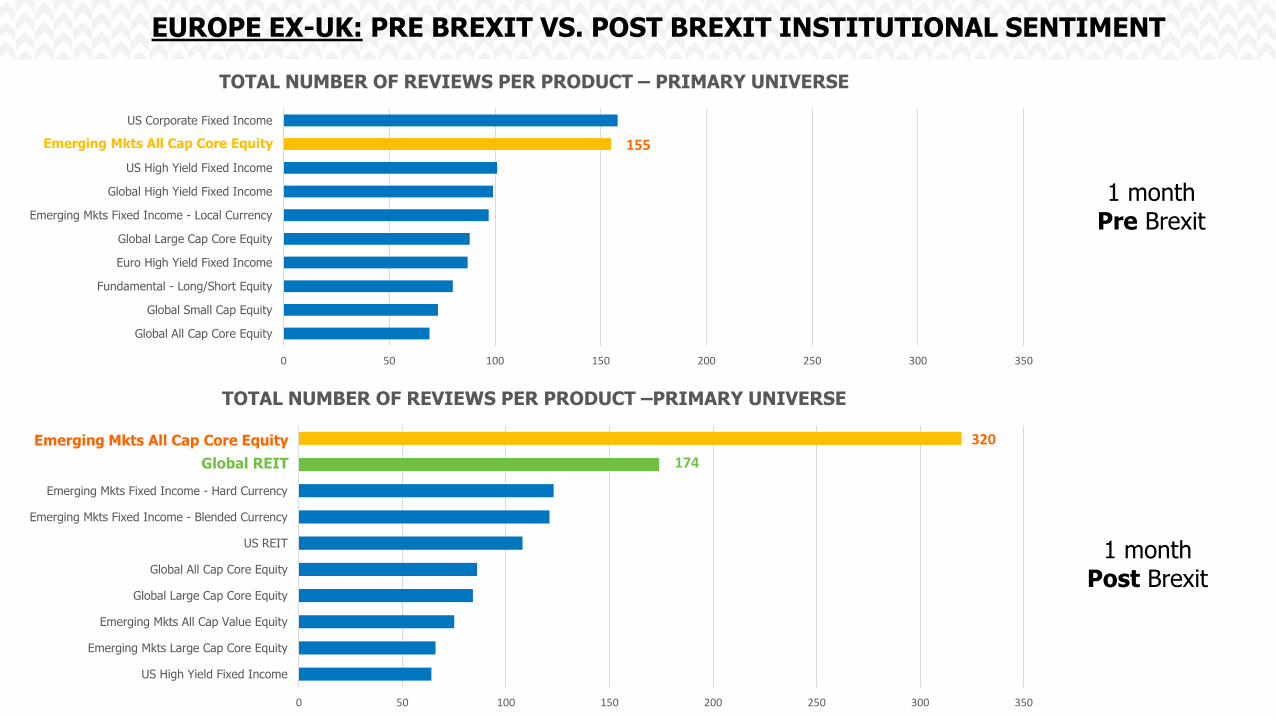
EUROPE EX-UK: PRE BREXIT VS. POST BREXIT INSTITUTIONAL SENTIMENT
1 month Pre Brexit
1 month Post Brexit
0 50 100 150 200 250 300 350
Global All Cap Core Equity
Global Small Cap Equity
Fundamental - Long/Short Equity
Euro High Yield Fixed Income
Global Large Cap Core Equity
Emerging Mkts Fixed Income - Local Currency
Global High Yield Fixed Income
US High Yield Fixed Income
Emerging Mkts All Cap Core Equity
US Corporate Fixed Income
TOTAL NUMBER OF REVIEWS PER PRODUCT – PRIMARY UNIVERSE
0 50 100 150 200 250 300 350
US High Yield Fixed Income
Emerging Mkts Large Cap Core Equity
Emerging Mkts All Cap Value Equity
Global Large Cap Core Equity
Global All Cap Core Equity
US REIT
Emerging Mkts Fixed Income - Blended Currency
Emerging Mkts Fixed Income - Hard Currency
Global REIT
Emerging Mkts All Cap Core Equity
TOTAL NUMBER OF REVIEWS PER PRODUCT –PRIMARY UNIVERSE
Emerging Mkts All Cap Core Equity
Emerging Mkts All Cap Core Equity
Global REIT
155
320
174

Key Takeaway: Q3 Net EM Active Equity up $6.7BN
$25K
$20K
$15K
$10K
$5K
$0K
$-25K
$-20K
$-15K
$-10K
$-5K
$-30K
$-35K
Q3-2015
Gross Flows – Total AUM
Inflows Outflows Net Flows

CURRENCY TRENDS
Influence on Global Al locations
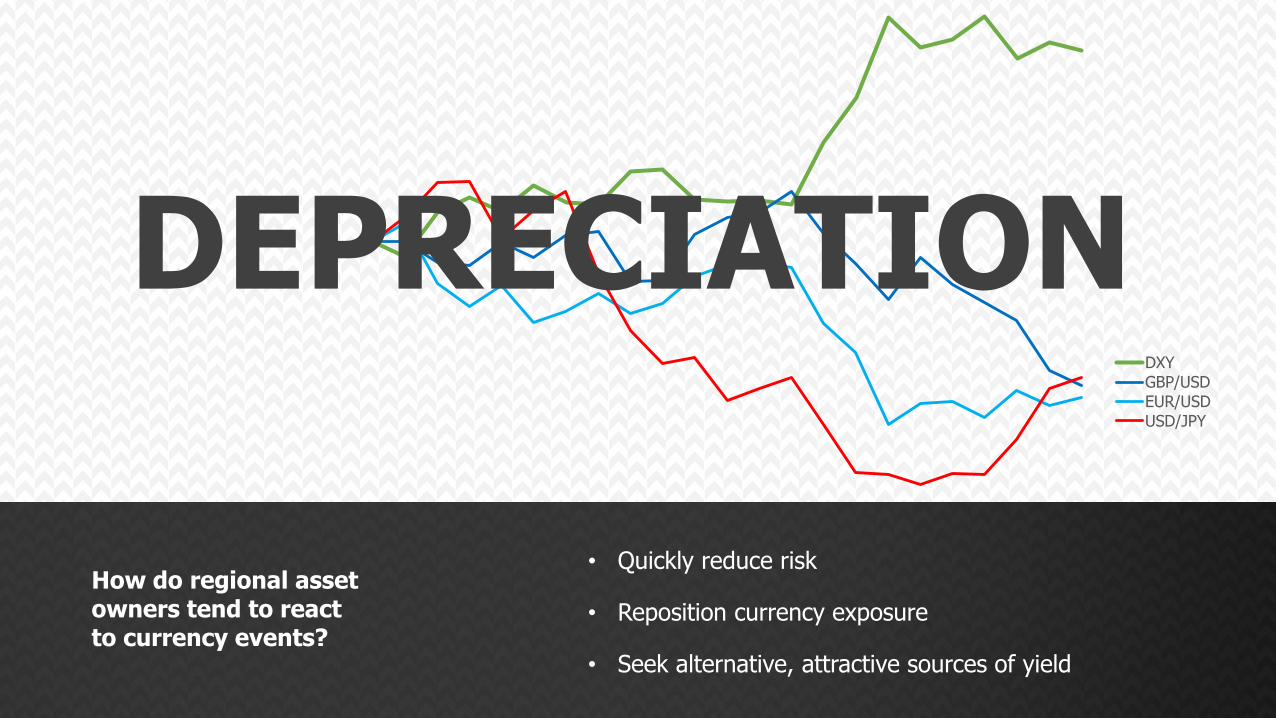
DXY
GBP/USD
EUR/USD
USD/JPY
DEPRECIATION
• Quickly reduce risk
• Reposition currency exposure
• Seek alternative, attractive sources of yield
How do regional asset owners tend to react to currency events?

1. Quickly reduce risk
2. Reposition currency exposure
3. Seek attractive, alternative sourceof yield
WHEN YEN DECLINED
J AP AN E S E I N V E ST O R S
USD
mill
ions
-$25,000
-$10,000
$5,000
$20,000
$35,000
-35%
-25%
-15%
-5%
5%
Mar-11 Feb-12 Jan-13 Dec-13 Nov-14 Oct-15 Sep-16
USD/JPY US Corp Fixed Income Emerging Markets Fixed Income Europe Fixed Income

USD
mill
ions
-25%
-20%
-15%
-10%
-5%
0%
5%
-$5,000
$5,000
$15,000
$25,000
$35,000
$45,000
$55,000
Mar-11 Feb-12 Jan-13 Dec-13 Nov-14 Oct-15 Sep-16
EM Fixed Income US High Yield EUR/USD (right)
E UR O P EAN I N V E ST OR S
1. Quickly reduce risk
WHEN EURO DECLINED

-$10,000
$0
$10,000
$20,000
$30,000
-$22,000
-$6,000
$10,000
$26,000
$42,000
Mar-11 Dec-11 Sep-12 Jun-13 Mar-14 Dec-14 Sep-15 Jun-16
Europe Fixed Income Euro High Yield (right)
EUR/USD
E UR O P EAN I N V E ST OR S
USD
mill
ions
2. Accelerate allocations to home currency markets
E UR O P EAN I N V E ST OR S
WHEN EURO DECLINED
USD
mill
ions
75
80
85
90
95
100
105
-$750
-$250
$250
$750
$1,250
$1,750
$2,250
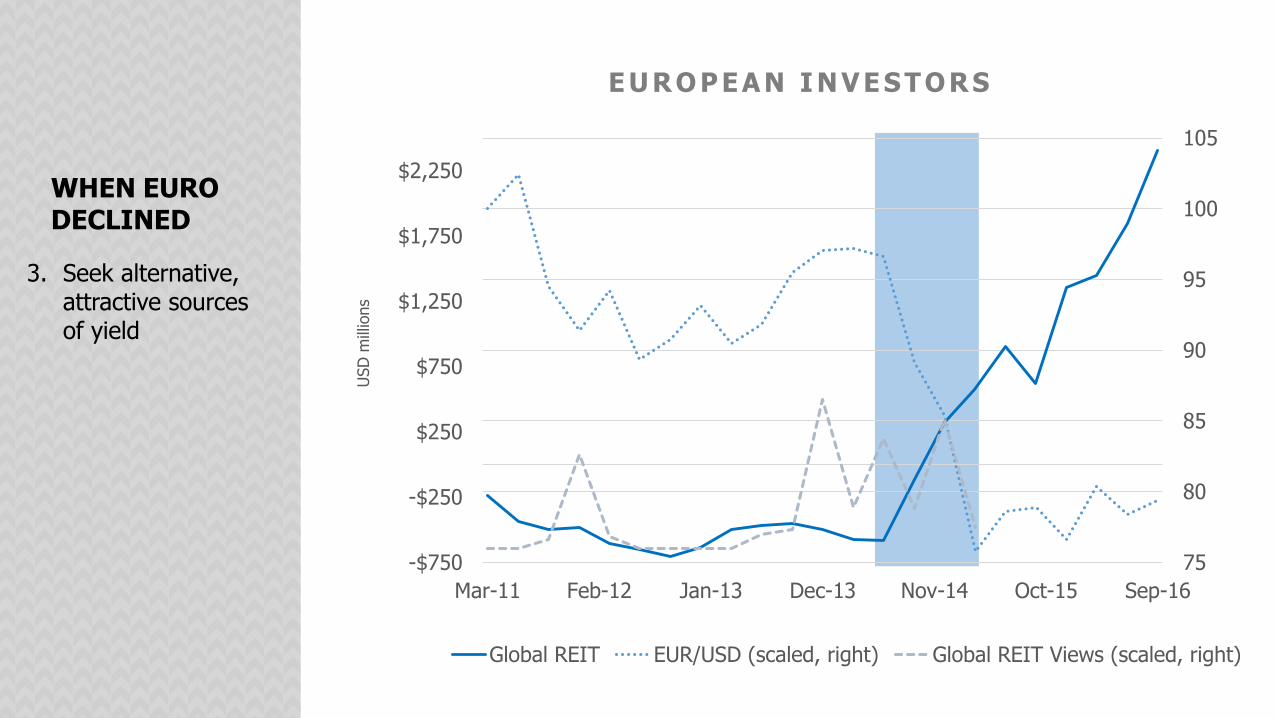
Mar-11 Feb-12 Jan-13 Dec-13 Nov-14 Oct-15 Sep-16
Global REIT EUR/USD (scaled, right) Global REIT Views (scaled, right)
E UR O P EAN I N V E ST OR S
3. Seek alternative, attractive sources of yield
WHEN EURO DECLINED

GBP/USD GBP/EUR
-$90,000
-$70,000
-$50,000
-$30,000
-$10,000
$10,000
-$2,000
$0
$2,000
$4,000
$6,000
$8,000
$10,000
EM Fixed Income US HY (right)
USD
mill
ions
WHEN GBP/USD DECLINED
1. Quickly reduce risk
UK I N V E S T OR S

-5%
0%
5%
10%
15%
20%
25%
-$55,000
-$35,000
-$15,000
$5,000
$25,000
Global Fixed Income UK Fixed Income
UK + US Enhanced Cash GBP/EUR
USD
mill
ions
UK I N V E S T OR S
BUT WHEN GBP/EUR DECLINED NEXT…
1. Further reduce external exposure
2. Allocate to home currency/cash
3. Seek alternative source of yield (not quite there yet)

N O N - US E Q UI T Y – GL O B AL I N V E ST O RS
USD
mill
ions
USD
mill
ions
-$10,000
$0
$10,000
$20,000
$30,000
$40,000
$50,000
-$20,000
$20,000
$60,000
$100,000
$140,000
Passive - US (left) Quant - US Quant - Europe ex-UK
Quant Canada Quant - Japan
PASSIVE. QUANTITATIVE.
• International,not U.S.
• U.S., Japan, Canada to quant after USD appreciation
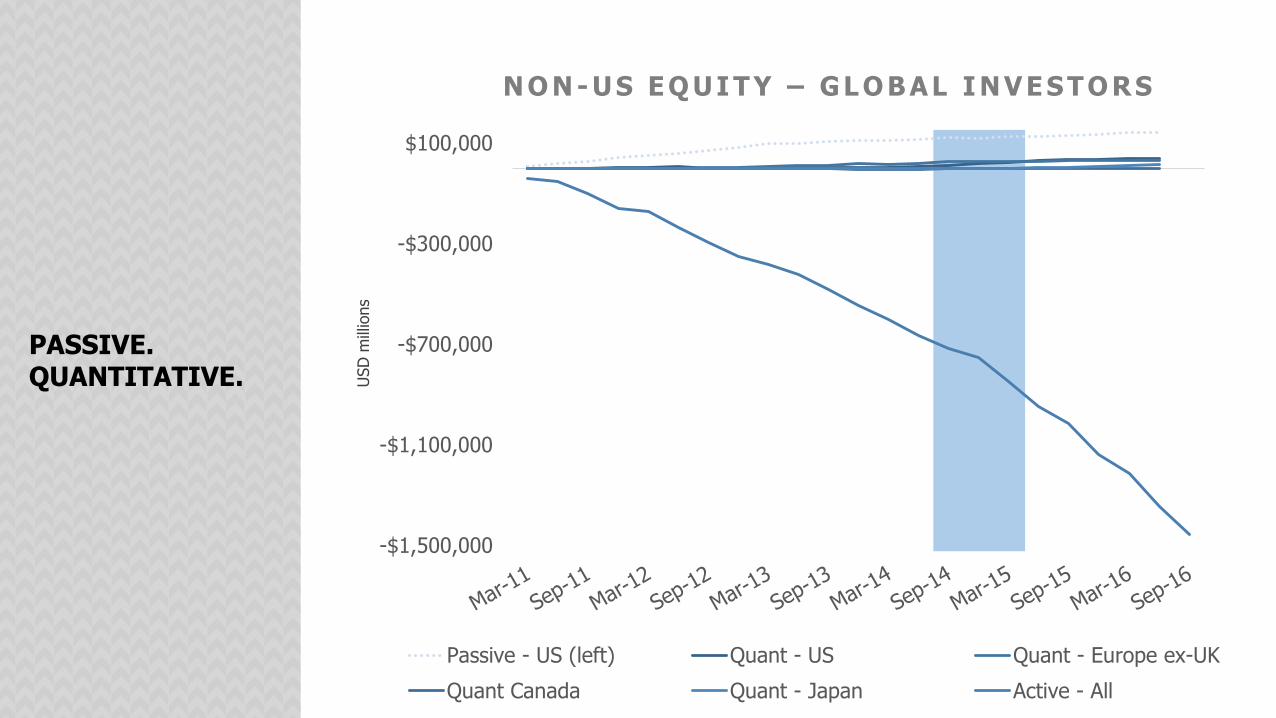
N O N - US E Q UI T Y – GL O B AL I N V E ST O RS
USD
mill
ions
-$1,500,000
-$1,100,000
-$700,000
-$300,000
$100,000
Passive - US (left) Quant - US Quant - Europe ex-UK
Quant Canada Quant - Japan Active - All
PASSIVE. QUANTITATIVE.

The Shift from Diversified Asset Class to Factor-Driven Index Portfolios Reshapes Active Management & Wealth Distribution
Overview of Key Findings from the 2016 Citi Industry Evolution Survey
November 2016
Citi Global Investor Sales
For Institutional Investors Only
Citi Business Advisory Services
Sam LaNasa, 212-723-9078 [email protected]

Low ReturnEnvironment
Reduced BankLiquidity
Improved Portfolio Risk
Analytics
Disruptive Impact of Emerging
Technologies
Growth in Retirees & Self-
Directed Investing
5 MAJOR TRENDS DRIVING THE INVESTMENT MANAGEMENT INDUSTRY
Each of these drivers is contributing to a foundational shift in how investors view portfolio construction. All are helping to promote increased use of passive products.
Increased Demand for Low Cost
Investment Funds
Benefit ofHolding IndexesOver Individual
Securities
Better InsightInto the
Factors that Make Up Returns
DemocratizationOf QuantitativeRisk & PortfolioConstruction Frameworks
Use of Robo-Advisory toSupport Fiduciary
Role & AvoidUnderperformance
Confluence of these Factors Moving the Industry to the Tipping Point for Passive Investing
Impact

MACRO INVESTING ENVIRONMENT LIMITS RETURNSPolicy rates plummeted and correlations across and within asset classes increased in the wake of the GFC making yield scarcer and diversification harder.
Actions stemming from the Global Financial Crisis (GFC) either created or exaggerated the following challenges to effective portfolio management:
• Falling yields compressed the return environment.
• Diminished independence between yields of the same asset class across countries, and also between different asset classes in the same country
• Increasing correlations that were already evident pre-GFC accelerated making it harder to diversify the portfolio
Source: Bloomberg, Citi Business Advisory Services
Interest Rate Trends in the Period Pre- & Post-GFC
Correlation Between U.S. Equities & Bonds
1. Low Return Environment
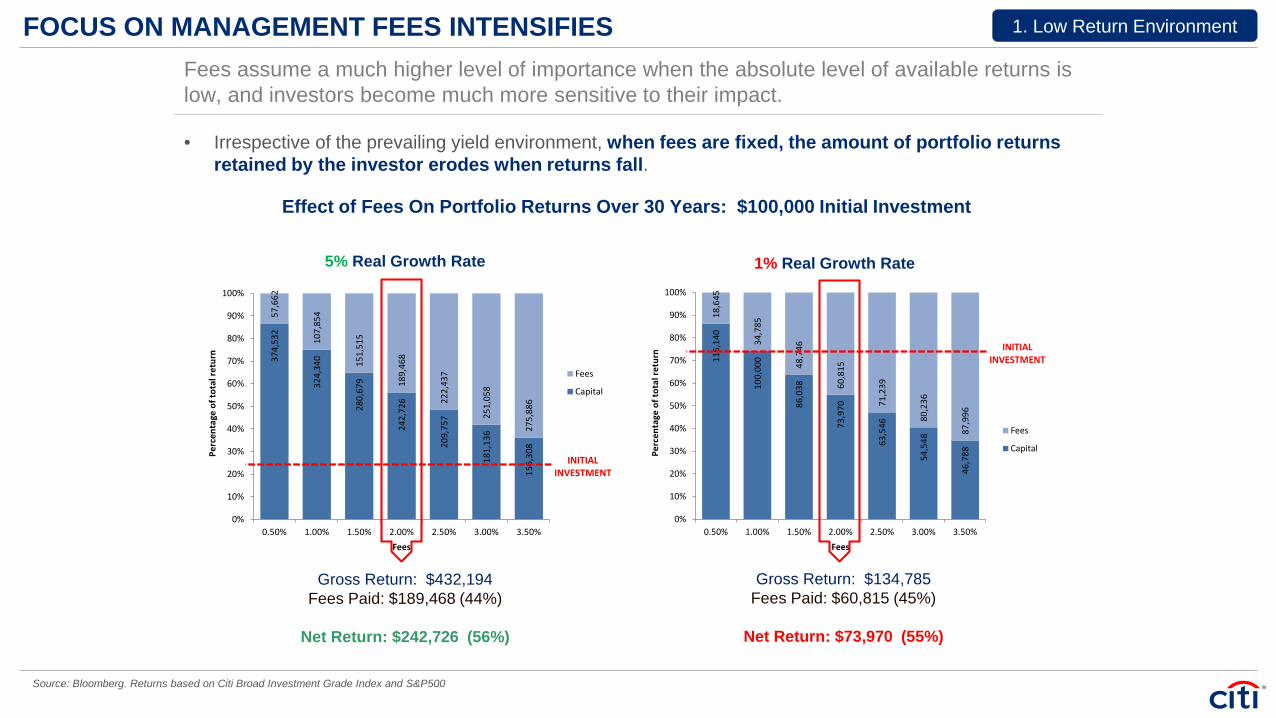
FOCUS ON MANAGEMENT FEES INTENSIFIESFees assume a much higher level of importance when the absolute level of available returns is low, and investors become much more sensitive to their impact.
• Irrespective of the prevailing yield environment, when fees are fixed, the amount of portfolio returns retained by the investor erodes when returns fall.
Source: Bloomberg. Returns based on Citi Broad Investment Grade Index and S&P500
374,
532
324,
340
280,
679
242,
726
209,
757
181,
136
156,
308
57,6
62
107,
854
151,
515
189,
468
222,
437
251,
058
275,
886
0%
10%
20%
30%
40%
50%
60%
70%
80%
90%
100%
0.50% 1.00% 1.50% 2.00% 2.50% 3.00% 3.50%
Perc
enta
ge o
f tot
al re
turn
Fees
Fees
Capital
INITIALINVESTMENT
116,
140
100,
000
86,0
38
73,9
70
63,5
46
54,5
48
46,7
88
18,6
45
34,7
85
48,7
46
60,8
15
71,2
39
80,2
36
87,9
96
0%
10%
20%
30%
40%
50%
60%
70%
80%
90%
100%
0.50% 1.00% 1.50% 2.00% 2.50% 3.00% 3.50%
Perc
enta
ge o
f tot
al re
turn
Fees
Fees
Capital
INITIALINVESTMENT
Gross Return: $432,194Fees Paid: $189,468 (44%)
Net Return: $242,726 (56%)
Gross Return: $134,785Fees Paid: $60,815 (45%)
Net Return: $73,970 (55%)
Effect of Fees On Portfolio Returns Over 30 Years: $100,000 Initial Investment
5% Real Growth Rate 1% Real Growth Rate
1. Low Return Environment

LIQUIDITY CONCERNS IMPACT TRADING DECISIONSPost-GFC capital requirements for banks have resulted in much less liquid markets, driving investors to change how they obtain exposures from individual securities towards index products.
• Basel III capital requirements resulted in a significant reduction in banks’ balance sheets post-GFC
• Reduced capacity and appetite to take on and warehouse risk from the sell-side has made markets more difficult to trade
• Survey participants noted that these challenges are discouraging many investors from holding individual securities and instead prompting them to look at replacing those exposures with indexes
Sources: Tradable Securities from the Federal Reserve Board of New York, Quarterly Trends for Consolidated U.S. Banking Organizations Q1 2016, http://www.newyorkfed.org/research/banking_researc/quarterly_trends.html ;Source for S&P 500 Volume charts, Bloomberg .
493
268
0
100
200
300
400
500
2011 2016
Vol
ume
(mill
ions
of s
hare
s)
-46%1.461
0.958
0
0.5
1
1.5
2011 2016
Vo
lum
e (m
illio
ns
of
shar
es)
-34%
S&P 500: Volume Comparisons
Tradable Securities Held on U.S. Consumer BankBalance Sheets (Excluding Loans)
5 Most Actively Traded Stocks 5 Least Actively Traded Stocks
2. Reduced Bank Liquidity

BETTER INSIGHT INTO PORTFOLIO RISK & RETURN FACTORSWith greater transparency into their investment managers’ position holdings in the years post-GFC, institutional investors are now better at grouping & understanding their portfolio level risks.
Risk Factors Running Across Asset Classes
Source: Citi Business Advisory Services based on inputs from Callan Associates
An enhanced ability to view, slice and dice their portfolio level risks has led institutional investors to the following realizations:
• Each asset in a portfolio is composed of a complex set of risk factors
• Risks run across asset classes
• Equities, bonds and alternative allocations (absolute return and real assets) share many of the same risk exposures
Equities
Bonds
AbsoluteReturn
RealAssets
Inte
rest
Rat
e Se
nsiti
vity
ASSE
T C
LASS
ES
RETURN DRIVERS
Equi
ty R
isk:
Abi
lity
to G
ener
ate
Earn
ings
on
Cas
h
Cre
dit R
isk:
Abi
lity
to R
epay
Infla
tion
Sens
itivi
ty
3. Improved Risk Analytics

DEMOCRATIZED ACCESS TO QUANTITATIVE FRAMEWORKSIncreased processing speed and real-time analysis of vast pools of data are democratizing access to quantitative frameworks that were once only the domain of specialized investment firms.
Portfolio dissection and risk modelling tools provide insights to identify the factor exposures that make up portfolio holdings and manage those exposures in a timeframe that results in meaningful impacts
Improved processing power and velocity enables the data crunching required to dynamically reweight indices or construct factor portfolios in a cost-effective and timely manner
Once solely the domain of professional wealth advisors, new robo-advisory modelling tools can assess an investor’s risk tolerance and return targets in order to construct a well diversified investment portfolioavailable to individual investors via the internet and mobile devices
Sources: Falling Cost of Memory Chart from “Let’s Talk Data Blog” , Phillip Johnson, http://letstalkdata.com/2014/04/falling-cost-of-memory-1957-to-present/ Quote: “A Modern Smartphone or a Vintage Supercomputer: Which is More Powerful?”, June 14, 2014, http://www.phonearena.com/news/A-modern-smartphone-or-a-vintage-supercomputer-which-is-more-powerful_id57149
Falling Cost of Memory
Actionable RiskInsights
Dynamic Index& Factor Portfolios
Targeted Portfolio
Construction
“Today, your cell phone has more computer power than all of NASA back in 1969 when it
placed two men on the moon.”Dr. Michio Kaku, futurist and co-founder of String Theory.
4. Impact of Emerging Technologies

MASSIVE INCREASE IN LONG-LIVING RETIREESThe population is ageing and living longer. Baby boomers have longer retirements to fund than previous generations. Their children & grandchildren will have to wait longer to inherit what is left.
Changing World Demographics: 2015 vs. 2030
Source: Demographic chart, U.S. Census Bureau, http://www.census.gov/population/international/data/idb/informationGateway.php Years of Retirement: Global Health & Aging Report, National Institute on Aging, U.S. Health & Human Services, https://www.nia.nih.gov/research/publication/global-health-and-aging/note-about-data-behind-report
• By 2030, 16.9% (1.4 billion people) of the world’s projected population(8.3 billion) will be aged 60+
• 45% of the expected population increase will be individuals age 60 or over
• The life expectancy of those retirees also continues to rise
5. Retirees & Self-Directed Investing

HIGH COSTS CAUSE ACTIVELY MANAGED FUNDS TO UNDERPERFORM INDICESThe value proposition that returns from active management offer sufficient outperformance to both cover costs and beat their relevant benchmark is challenged by the actual performance data.
• Data on the relative performance of active managers versus their underlying indexes seems to support the efficient market theory -- few active managers were able to generate sufficient outperformance to both cover the costs of their funds and still outperform their benchmark
Source: S&P Dow Jones Indices, LLC https://us.spindices.com
SPIVA H1 2016 Scorecard: Percent of Time Indices Outperformed Active Managers
Fund Category 1-Yr 3-Yr 5-Yr 10-Yr
All Domestic U.S. Equity Funds 90.20% 87.41% 94.58% 87.47%
Global Equity Funds 75.35% 76.96% 82.45% 81.19%
Emerging Market Equity Funds 42.22% 77.42% 67.63% 81.94%
Investment Grade Long Funds 94.39% 97.32% 98.41% 98.21%
High Yield Funds 75.00% 80.47% 88.78% 96.62%
Emerging Market Debt Funds 74.65% 88.89% 92.31% 81.82%
80%+ of Active Managers Underperformed the Index
50-79% of Active ManagersUnderperformed the Index
49% or less of Active ManagersUnderperformed the Index

INVESTOR FLOWS MOVE OUT OF ACTIVE & INTO PASSIVEAUM in passive strategies represents a growing share of the global asset management industry and the rate of investor flows out of active and into passive is accelerating.
• Since January 2014 net inflows into Passive have been ~$1 Trillion, compared to net outflows of -$668 Billion from traditional Actively managed funds
• YTD inflows into Passive have been $280 Billion and we are on track for a record setting year of ~$560 Billion net positive flows
• YTD outflows from traditional Active are -$249 Billion, on track for a record outflow year of -$498 Billion.
Source: AUM Chart: Citi Business Advisory Services estimates based on Global Asset Management 2016: Doubling Down on Data, The Boston Consulting Group, https://www.bcgperspectives.com/content/articles/financial-institutions-global-asset-management-2016-doubling-down-on-data/ ; Flows: Citi Business Advisory Services based on data from eVestment, Preqin, HFR, Strategic Insight, BlackRock ETP report, IMA, OECD, Towers Watson, P&I Lipper
Growth in Passive AUM & Passive as Percent of Total Industry AUM
Net New Investor Flows into Active & Passive Products

ETF GROWTH BEGINS TO OUTPACE GAINS IN OTHER PASSIVE PRODUCTSThe dramatic growth in ETFs is coming not only at the direct expense of actively managed funds, but is even outstripping growth of index mutual funds and other passive products.
• Between 2007 and 2015, investors pulled $835B from actively managed U.S. equity mutual funds & put $1.2T in U.S. equity passive funds
• U.S. equity index ETF AUM rose from $573B (43% of U.S. passive) to $1.76T (49%) between 2007 and 2015
Source: ETF Growth: Citi Business Advisory Services analysis based on proprietary data subscription to Strategic Insight SimFund database. U.S. Flows: Note: Equity mutual fund flows include net new cash flow and reinvested dividends. Data excludes mutual funds that invest primarily in other mutual funds. Source: ICI, 2016 Fact Book, www.ICI.org
Growth of ETFs Cumulative Flows into U.S. Domestic Equity Funds: Monthly 2007-2015
• From 2007 to 2011, the number of ETFs in the market place nearly tripled from 1,315 to 3,608 while assets nearly doubled, rising from $825B to $1.5T.
• Growth since 2011 has continued apace. By June 2016, there were 5,169 ETFs and a record $3.1T AUM.

PASSIVE PRODUCT INNOVATION DRIVES ADOPTIONETFs overcome the disadvantages of SMAs and mutual fund wrappers and represent a significant step forward in making a wide variety of index exposures affordable and liquid.
Source: Citi Business Advisory Services

PORTFOLIO CONSTRUCTION MOVING TOWARD SET OF DIVERSIFIED FACTOR EXPOSURESThe growing numbers and types of index trading products are making it easier to look through asset classes as an organizing principle for the portfolio to factors as a new diversification option.
• Today, the average institutional portfolio can be abstracted into a matrix that combines the main asset classes (equities, bonds, alternatives) with different selection criteria (style, geography & macro sector/theme)
• Many survey participants saw this use of asset classes as an allocation framework as being too coarse
Current State Portfolio Construction
Future State Portfolio Construction• The range of index offerings - not only
around smart beta and risk premia, but also style boxes and niche strategies - is pushing the industry towards a fundamental shift in how portfolios are constructed.
• Easy to access, low cost, ETFs, often built around indices or risk factors, is expanding investors’ portfolio construction and beta capture choices.
Source: Citi Business Advisory Services

THE FACTOR CUBE AS THE EMERGING CORE PORTFOLIO BUILDING BLOCKThe factor cube’s ability to provide a set of highly diversified beta exposures is likely to make this the core portfolio building block for all investors with most realizing that exposure via ETFs.
• More technically advanced institutional investors are already using this factor cube approach. Those organizations indicated that 70-80% of their core equity holdings were allocated in this manner
• The institutional approach is likely to quickly work its way downstream to other investment audiences - the main building blocks are readily available and can be found in low cost ETF products
Retail
Investor TypeInstitution
Broa
dLi
mite
d
Acc
essi
bilit
y of
Ret
urn
Stre
am
Diversified Index Exposure
HNW QIP
Foundational Building Block
Low
Hig
her
Cos
t of O
btai
ning
Ret
urns
Use of Factor-Cube in Future-State Portfolio Construction
Source: Citi Business Advisory Services

DisclaimerThis communication is provided by a member of the Business Advisory Services Group of Citigroup Global Markets Inc. (together with its affiliates, "Citi"). For important disclosures and disclaimers please see https://icg.citi.com/icg/data/documents/ST_ExternalDiscl.pdf. This message is for the internal use of the intended recipients and may contain information proprietary to Citi which may not be reproduced, redistributed, or copied in whole or in part without Citi's prior consent.
The information contained in this communication is for discussion purposes only. Information provided does not constitute or include professional legal and tax or any other form of advice and should not be relied on as such.
Information is provided to the recipient solely on the basis that the recipient will make all decisions, regardless of their nature, based on its own independent evaluation and judgment regarding their appropriateness for the recipient's own business. Any decisions made by the recipient will be made independently and separate from this communication and any other material provided by Citi, and in reliance on the advice of its other professional advisors as the recipient may deem necessary and not in reliance on any communication whether written or oral from Citi. Though Citi hopes its services will be helpful, Citi is not acting as investment advisor or fiduciary to the recipient or its clients, and the recipient's clients are not third-party beneficiaries of Citi's services. No communication whether written or oral will be understood to be an assurance or guarantee of results.
This communication is provided by Citi on a confidential basis for the recipient's use and may not be publicly disclosed. The information contained herein (a) is for informational purposes only and may not be publicly disclosed, (b) is not an offer to buy or sell any securities or service, and (c) may contain estimates and projections which may be incomplete or condensed and may be inaccurate. No representation or warranty, express or implied, is made as to the accuracy or completeness of the information and nothing herein is, or shall be relied upon as, a representation. Citi has no obligation to update or otherwise revise any such information.
IRS Circular 230 Disclosure: Citigroup Inc. and its employees are not in the business of providing, and do not provide, tax or legal advice. Any discussion of tax matters in these materials is not intended or written to be used, and cannot be used or relied upon, by any taxpayer for the purpose of avoiding tax penalties. Any such taxpayer should seek advice based on the taxpayer's particular circumstances from an independent tax advisor.
© 2016 Citigroup Global Markets Inc. Member SIPC. All rights reserved. Citi and Arc Design are trademarks and service marks of Citigroup Inc. or its affiliates and are used and registered throughout the world.
52

IRS Circular 230 Disclosure: Citigroup Inc. and its affiliates do not provide tax or legal advice. Any discussion of tax matters in these materials (i) is not intended or written to be used, and cannot be used orrelied upon, by you for the purpose of avoiding any tax penalties and (ii) may have been written in connection with the "promotion or marketing" of any transaction contemplated hereby ("Transaction").Accordingly, you should seek advice based on your particular circumstances from an independent tax advisor.
In any instance where distribution of this communication is subject to the rules of the US Commodity Futures Trading Commission ("CFTC"), this communication constitutes an invitation to consider enteringinto a derivatives transaction under U.S. CFTC Regulations §§ 1.71 and 23.605, where applicable, but is not a binding offer to buy/sell any financial instrument.
Any terms set forth herein are intended for discussion purposes only and are subject to the final terms as set forth in separate definitive written agreements. This presentation is not a commitment to lend, syndicate afinancing, underwrite or purchase securities, or commit capital nor does it obligate us to enter into such a commitment, nor are we acting as a fiduciary to you. By accepting this presentation, subject to applicable law orregulation, you agree to keep confidential the information contained herein and the existence of and proposed terms for any Transaction.
Prior to entering into any Transaction, you should determine, without reliance upon us or our affiliates, the economic risks and merits (and independently determine that you are able to assume these risks) as well as the legal,tax and accounting characterizations and consequences of any such Transaction. In this regard, by accepting this presentation, you acknowledge that (a) we are not in the business of providing (and you are not relying on usfor) legal, tax or accounting advice, (b) there may be legal, tax or accounting risks associated with any Transaction, (c) you should receive (and rely on) separate and qualified legal, tax and accounting advice and (d) youshould apprise senior management in your organization as to such legal, tax and accounting advice (and any risks associated with any Transaction) and our disclaimer as to these matters. By acceptance of these materials,you and we hereby agree that from the commencement of discussions with respect to any Transaction, and notwithstanding any other provision in this presentation, we hereby confirm that no participant in any Transactionshall be limited from disclosing the U.S. tax treatment or U.S. tax structure of such Transaction.
We are required to obtain, verify and record certain information that identifies each entity that enters into a formal business relationship with us. We will ask for your complete name, street address, and taxpayer ID number.We may also request corporate formation documents, or other forms of identification, to verify information provided.
Any prices or levels contained herein are preliminary and indicative only and do not represent bids or offers. These indications are provided solely for your information and consideration, are subject to change at any timewithout notice and are not intended as a solicitation with respect to the purchase or sale of any instrument. The information contained in this presentation may include results of analyses from a quantitative model whichrepresent potential future events that may or may not be realized, and is not a complete analysis of every material fact representing any product. Any estimates included herein constitute our judgment as of the date hereofand are subject to change without any notice. We and/or our affiliates may make a market in these instruments for our customers and for our own account. Accordingly, we may have a position in any such instrument at anytime.
Although this material may contain publicly available information about Citi corporate bond research, fixed income strategy or economic and market analysis, Citi policy (i) prohibits employees from offering, directly orindirectly, a favorable or negative research opinion or offering to change an opinion as consideration or inducement for the receipt of business or for compensation; and (ii) prohibits analysts from being compensated forspecific recommendations or views contained in research reports. So as to reduce the potential for conflicts of interest, as well as to reduce any appearance of conflicts of interest, Citi has enacted policies and proceduresdesigned to limit communications between its investment banking and research personnel to specifically prescribed circumstances.
[TRADEMARK SIGNOFF: add the appropriate signoff for the relevant legal vehicle]
© 2016 Citigroup Global Markets Inc. Member SIPC. All rights reserved. Citi and Citi and Arc Design are trademarks and service marks of Citigroup Inc. or its affiliates and are used and registered throughout the world.
© 2016 Citibank, N.A. All rights reserved. Citi and Citi and Arc Design are trademarks and service marks of Citigroup Inc. or its affiliates and are used and registered throughout the world.
© 2016 Citigroup Inc. All rights reserved. Citi and Citi and Arc Design are trademarks and service marks of Citigroup Inc. or its affiliates and are used and registered throughout the world.
© 2016 Citigroup Global Markets Limited. Authorised by the Prudential Regulation Authority and regulated by the Financial Conduct Authority and the Prudential Regulation Authority. All rights reserved. Citi and Citi and ArcDesign are trademarks and service marks of Citigroup Inc. or its affiliates and are used and registered throughout the world.
© 2016 Citibank, N.A. London. Authorised and regulated by the Office of the Comptroller of the Currency (USA) and authorised by the Prudential Regulation Authority. Subject to regulation by the Financial Conduct Authorityand limited regulation by the Prudential Regulation Authority. Details about the extent of our regulation by the Prudential Regulation Authority are available from us on request. All rights reserved. Citi and Citi and Arc Designare trademarks and service marks of Citigroup Inc. or its affiliates and are used and registered throughout the world.
© 2016 [Name of Legal Vehicle] [Name of regulatory body.] All rights reserved. Citi and Citi and Arc Design are trademarks and service marks of Citigroup Inc. or its affiliates and are used and registered throughout theworld.
Citi believes that sustainability is good business practice. We work closely with our clients, peer financial institutions, NGOs and other partners to finance solutions to climate change, develop industry standards, reduce ourown environmental footprint, and engage with stakeholders to advance shared learning and solutions. Citi’s Sustainable Progress strategy focuses on sustainability performance across three pillars: Environmental Finance;Environmental and Social Risk Management; and Operations and Supply Chain. Our cornerstone initiative is our $100 Billion Environmental Finance Goal – to lend, invest and facilitate $100 billion over 10 years to activitiesfocused on environmental and climate solutions.


