Global Equity Insights 2017 · · 2018-03-01Equity-based compensation and company success —the...
40
Global Equity Insights 2017 group
Transcript of Global Equity Insights 2017 · · 2018-03-01Equity-based compensation and company success —the...
Global Equity Insights 2017
groupGlobal Equate Solutions
Premium Sponsors and Sponsors
group
Global Equate Solutions
Premium Sponsors
Sponsors
Equity-based compensation and company success —the same side of the coin
Equity-based compensation is an established part of
compensation packages of executives and employees around
the world and its importance has constantly increased in
recent years.
This trend is supported by the findings of this year’s Global
Equity Insights Survey providing evidence that successful
companies use equity-based compensation to a larger
extent, thus fostering the attraction, motivation, retention
and ownership culture of their employees. This unique study
shows what is market best practice in terms of plan design,
administration and communication of long-term incentive plans
(LTIP) and share purchase plans (SPP). It furthermore highlights
potential obstacles and success factors for running stock
plans.
The study provides insights for companies seeking to optimize
the potential of their stock plans as well as for companies
considering the introduction of LTIP or SPP.
Global Equity Insights 2017

4Global Equity Insights 2017
Introduction 5
Background 6
Survey Participants at a Glance 7
Survey Design & Analysis 8
Long-Term Incentive Plans 9
Objectives & Eligibility 9
Pay Mix & Country Coverage 12
Types & Performance Measures 14
Vesting & Settlement 18
Administration & Success 21
Share Purchase Plans 23
Implementation & Participation 23
Types & Performance Measures 25
Objectives & Success 27
Administration & Communication 30
Conclusion 32
Appendix 33
List of Survey Participants 33
Editors 34
Premium Sponsors 36
Sponsors 38
Table of Contents

5Global Equity Insights 2017
Introduction
Dear Reader,
Equity-based compensation continues to be an important
topic on company agendas. Companies from North
America, Europe and other economic regions are making
every effort to develop and increase their equity culture.
While North American companies are the pioneers of this
development, companies from Europe and other economic
regions are catching up. The different types of long-
term incentive plans seem to be converging into a global
market practice for some design features. Most notably,
companies have substituted stock options (which were
most popular during the 90s) with some form of full-value
share grants that offer a more balanced risk profile than
options. Today, North American companies predominantly
use restricted stock (units), while European companies
prefer performance shares, and companies from other
regions rely on both types. This convergence in market
practices for varying types of long-term incentives is only
one of the interesting observations from our Global Equity
Insights 2017 survey.
Fifth edition of Global Equity Insights in 2017—The foremost global report on equity-based compensation practices and their impact on company performanceAfter four successful surveys on equity-based
compensation in 2013, 2014, 2015, and 2016 we are
delighted to present the results of the Global Equity Insights
2017 survey. This year we focus on long-term incentives
and share purchase plans. Our analysis covers the
international market practice for both, detects trends, and
identifies relationships between design features, company
performance and employee satisfaction.
Again, we are proud of the survey’s high participation rate
and broad country coverage reaching another record this
year. The sample includes 163 large global companies from
17 countries. We would like to thank all survey participants
for sharing their long-term incentive and share purchase
plan experiences with us. Their contribution makes this
report a unique source for the latest trends in equity-based
compensation. We welcome you to contact us with any
questions or comments.
Joint survey by leading experts on equity-based compensationMany leading companies have contributed to the great
success of the Global Equity Insights survey. First and
foremost, we are grateful for the commitment of our
Premium Sponsors: Equatex—a leading provider of global
compensation plan management solutions; Fidelity—a
leading provider of global equity compensation services;
the Global Equity Organization (GEO)—a non-profit
association dedicated to advancing the understanding
and use of share plans around the globe; hkp/// group—
an international consulting firm for compensation, talent
and performance management; SAP—a market leader
in enterprise application software; Siemens—a global
technology powerhouse; and the Chair of Management
and Control of the University of Goettingen—renowned
for academic research in corporate governance and
management incentives. We also highly appreciate the
support of our Sponsor, the Fellowship Program in Equity
Compensation and Employee Stock Ownership at the
Rutgers University School of Management and Labor
Relations—a leading source of expertise in the world of
work.
Special thanks go to our co-operation partners: the
Certified Equity Professional Institute (CEPI), ProShare,
Irish ProShare Association (IPSA) and the South African
Reward Association (SARA) for inviting all their members
and relevant contacts to participate. They have helped us
significantly in expanding the survey’s scope and gaining
new international ground.
Finally, we would like to thank the people who passionately
drove this project: Sebastian Firk (University of Goettingen)
for his tremendous engagement and excellent analytical
skills; Bjoern Hinderlich, Nina Roeper and Barry Kitz
(hkp/// group) for bringing this challenging project to life.
Sincerely,
Mitan Patel (Equatex)
Emily Cervino (Fidelity)
Danyle Anderson (GEO)
Michael H. Kramarsch (hkp/// group)
Marc Muntermann (Siemens)
Jessica Vinsand (SAP)
Sandra Sussman (SAP)
Prof. Dr. Michael Wolff (University of Goettingen)
6Global Equity Insights 2017
Implementing Long-Term Incentive Plans—Motivation and challengesIn the aftermath of the global financial crisis, governments
around the world put reforms of corporate governance high
on the agenda. Many of these reforms address executive
compensation in general and long-term incentives in
particular. The focus on long-term incentives is based
on the notion that they foster sustainable corporate
development and discourage excessive risk-taking and
myopic decision-making. The regulatory changes in the
institutional environment partly explain the dominant role
of long-term incentives in compensation designs, although
many leading global companies had already implemented
long-term incentive plans years ago. These plans form
an integral part of a company’s equity culture and are an
effective tool for maximizing shareholder value.*
Nevertheless, in practice companies and compensation
experts face many challenges and obstacles. These have
a special focus in this year’s study. Companies have to
navigate through a complex landscape of regulatory and
tax regimes and a seemingly infinite number of design
alternatives. Besides this, varying experiences with global
long-term incentive plans aggravate the situation, while
the complex nature of the plans requires sophisticated
communication so they are comprehensible for employees.
Smart communication and satisfaction with the plans are
crucial determinants for successful implementation and
thus the company’s success.
Our study addresses these issues regarding company
equity culture—both for LTIP and SPP. There is a significant
difference in what successful companies and other
companies do: design features, as well as how these
features are perceived from an employee and employer
perspective, differ considerably. Therefore, good plan
communication is identified as a crucial tool to develop and
increase the equity culture within the company.
Background
Contribution of the Global Equity Insights surveyOur report addresses and helps resolve many practical
issues on the implementation of long-term incentive plans
and share purchase plans. Firstly, we find a positive link
between long-term incentives and company performance
among the surveyed companies. Secondly, we provide
concrete information regarding global market practice by
analyzing the extent of eligibility, plan types, and design
features (such as performance measures, vesting periods,
caps). Thirdly, we present insights into administration
and successful aspects of long-term incentives. A similar
approach is used to analyze share purchase plans.
Lastly, we present insights into implementation and
communication aspects of equity-based compensation. In
conclusion, we summarize our primary findings and point
out practical implications.
* Many academic studies document the positive effect of long-term incentives on corporate performance and firm value. See e.g. Chang/Mayers (1992): Managerial vote ownership and shareholder wealth: Evidence from employee stock ownership plans, Journal of Financial Economics, 32,101-103.; Rapp/Schaller/Wolff (2012): Do stock-based incentives promote long-term oriented firm behavior? Evidence from the recent credit crises, Journal of Business Economics, 82 (10), 1057-1087.

7Global Equity Insights 2017
Survey Participants at a Glance
A broad sample representing a selection of the world’s largest companies in 17 countries
u 163 participating companies including the largest
corporations worldwide: 90% of participants have a
market capitalization above USD 1 billion; the top 8%
exceeded USD 100 billion in market capitalization at
year-end 2016
u 60% of companies generated revenues of more than
USD 5 billion in 2016
u National leading companies from 17 countries around
the world
u Representative sample across 10 industries
Participants by market capitalization
> USD 100 billion
USD 50 billion – 100 billion
USD 10 billion – 50 billion
USD 1 billion – 10 billion
< USD 1 billion
8
12
33
37
10
Fig. 1: Participants by market capitalization at year-end 2016 in % of companies
USA 78
Germany 25
Switzerland 12
South Africa 11
UK 8
Australia 8
Canada 5
Japan 3
Ireland 3
Netherlands 2
France 2
Sweden 1
India 1
China (Hong Kong) 1
Finland 1
Bermuda 1
Austria 1
Country distribution
Fig. 3: Participants by headquarter’s country
Industry clusters
Technology 37
Consumer Goods 24
Financials 24
Industrials 21
Health Care 19
Consumer Services 13
Utilities 8
Basic Materials 7
Telecommunications 6
Oil and Gas 4
Fig. 4: Participants by industry
▶▶▶ Please find the full list of participants on page 33.
Participants by revenue*
> USD 100 billion
USD 50 billion – 100 billion
USD 20 billion – 50 billion
USD 5 billion – 20 billion
< USD 5 billion
6
5
18
32
40
Fig. 2: Participants by revenue in fiscal year 2016 in % of companies
* Due to roundings, totals may not equal exactly 100% throughout the report
8Global Equity Insights 2017
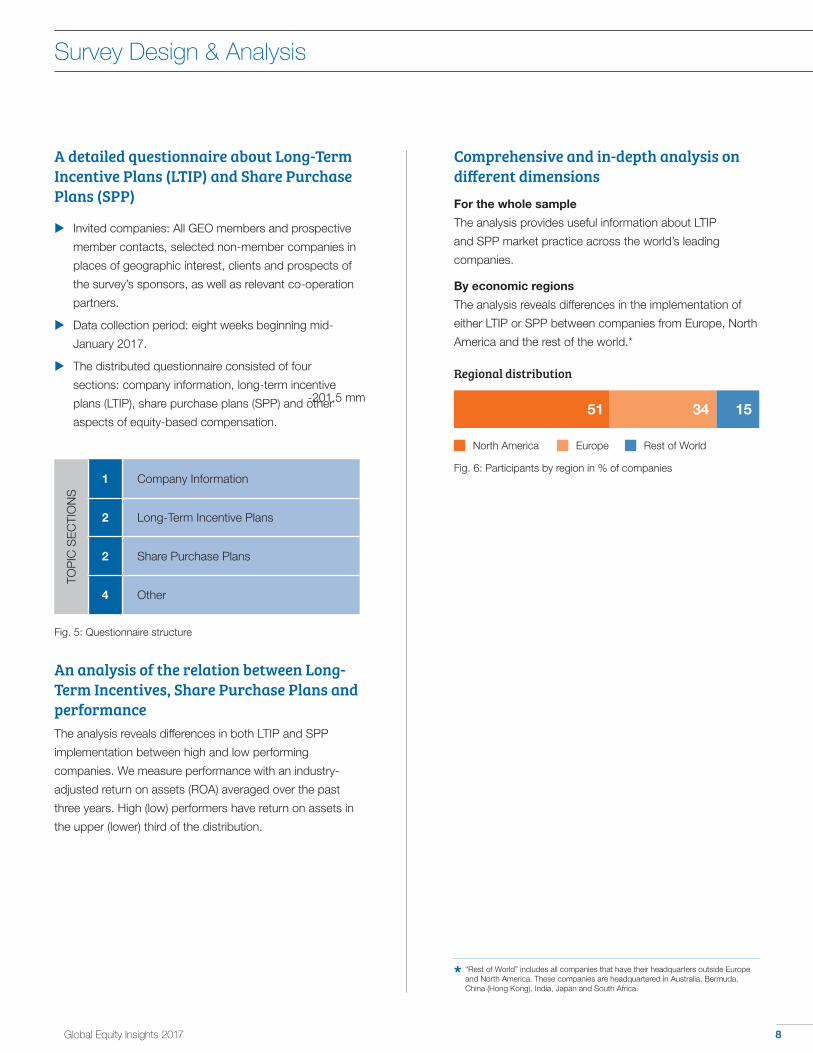
A detailed questionnaire about Long-Term Incentive Plans (LTIP) and Share Purchase Plans (SPP)
u Invited companies: All GEO members and prospective
member contacts, selected non-member companies in
places of geographic interest, clients and prospects of
the survey’s sponsors, as well as relevant co-operation
partners.
u Data collection period: eight weeks beginning mid-
January 2017.
u The distributed questionnaire consisted of four
sections: company information, long-term incentive
plans (LTIP), share purchase plans (SPP) and other
aspects of equity-based compensation.
Survey Design & AnalysisTO
PIC
SE
CTI
ON
S
1 Company Information
2 Long-Term Incentive Plans
2 Share Purchase Plans
4 Other
Comprehensive and in-depth analysis on different dimensionsFor the whole sample
The analysis provides useful information about LTIP
and SPP market practice across the world’s leading
companies.
By economic regions
The analysis reveals differences in the implementation of
either LTIP or SPP between companies from Europe, North
America and the rest of the world.*
* “Rest of World” includes all companies that have their headquarters outside Europe and North America. These companies are headquartered in Australia, Bermuda, China (Hong Kong), India, Japan and South Africa.
Fig. 5: Questionnaire structure
An analysis of the relation between Long-Term Incentives, Share Purchase Plans and performanceThe analysis reveals differences in both LTIP and SPP
implementation between high and low performing
companies. We measure performance with an industry-
adjusted return on assets (ROA) averaged over the past
three years. High (low) performers have return on assets in
the upper (lower) third of the distribution.
51 34 15
Regional distribution
Fig. 6: Participants by region in % of companies
North America Europe Rest of World
-201,5 mm

9Global Equity Insights 2017
Long-Term Incentive Plans – Objectives & Eligibility
■ Retention is the first-order objective of LTIP implementation.
■ Broad LTIP eligibility is positively related to company performance.
■ LTIP eligibility is commonly determined by the employee’s career level.
Demographic shifts and the recent economic recovery
in several countries have intensified the competition for
talent, with many companies using LTIP to successfully
attract sought-after employees. Almost half of the surveyed
companies regard retention as the most important
objective of LTIP implementation. However, companies also
give high priority to motivation and competitive pay.
Successful companies make more employees LTIP eligible
Objectives of LTIP grants
Very low Low Moderate High Very high
Fig. 7: LTIP objectives in % of companies
2
2
2
6
2
4
12
12
10
13
24
36
42
34
59
48
42
51
Retention
Motivation
Stay competitive paywise
Identification with the company
Best market pay
Share ownership
Strategy
Employee engagement
Profit/performance sharing
Compliance with regulatory requirements
Total
Total
Total
Total
Total
Total
Total
Total
Total
Total
Europe
Europe
Europe
Europe
Europe
Europe
Europe
Europe
Europe
Europe
North America
North America
North America
North America
North America
North America
North America
North America
North America
North America
Rest of World
Rest of World
Rest of World
Rest of World
Rest of World
Rest of World
Rest of World
Rest of World
Rest of World
Rest of World
2
3
28
14
3
44
15
55
13
28
42
29
31
39
50
2 2
2
2
5
6
3
33
3
17
23
38
18
56
38
27
34
22
33
40
11
21
5
6
22
17
27
22
37
38
32
50
30
25
36
22
1
10
2
8
5
29
23
22
39
17
38
44
22
49
31
28
32
2
2
2
28
6
16
2
50
24
16
30
22
41
47
34
27
20
33
5
2
4
12
11
12
8
18
23
17
30
18
36
39
32
41
25
29
26
12
11
23
7
6
32
29
35
53
34
49
33
29
24
25
12
5
27
8
9
17
13
11
9
22
43
33
9
38
17
31
45
18
17
27
12
10
17
6
15
17
13
18
21
20
23
18
34
32
38
29
18
22
10
29
10Global Equity Insights 2017
Long-Term Incentive Plans – Objectives & Eligibility
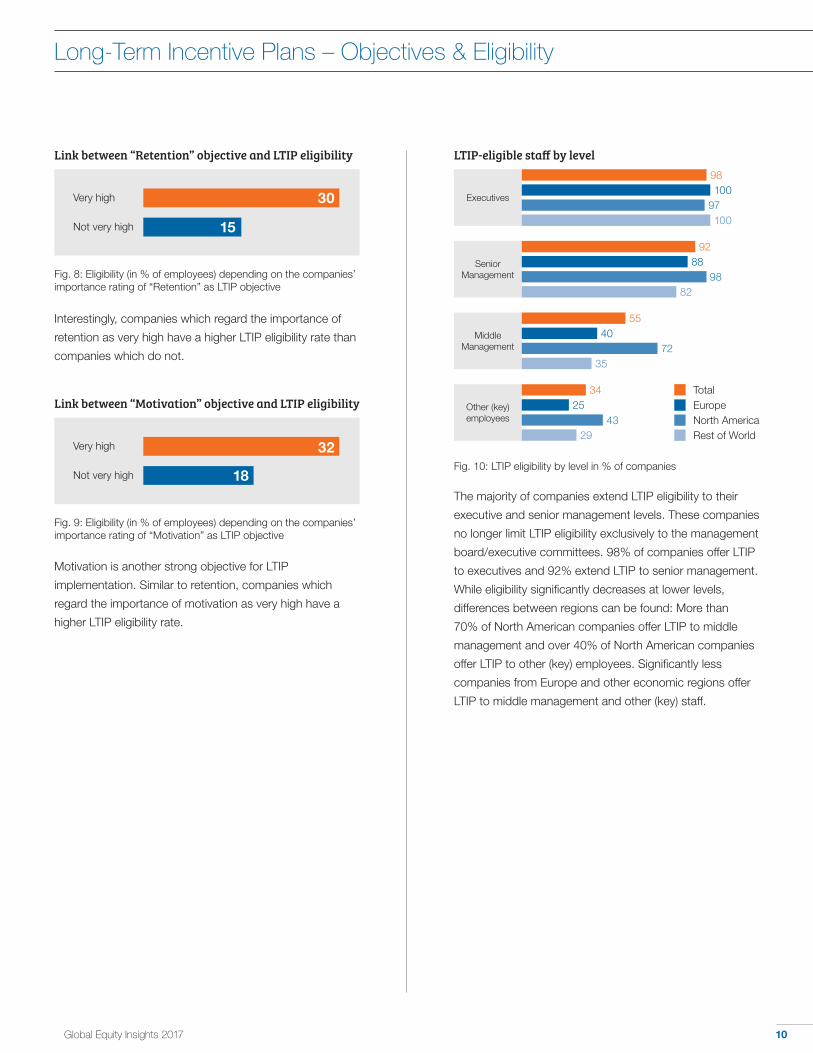
The majority of companies extend LTIP eligibility to their
executive and senior management levels. These companies
no longer limit LTIP eligibility exclusively to the management
board/executive committees. 98% of companies offer LTIP
to executives and 92% extend LTIP to senior management.
While eligibility significantly decreases at lower levels,
differences between regions can be found: More than
70% of North American companies offer LTIP to middle
management and over 40% of North American companies
offer LTIP to other (key) employees. Significantly less
companies from Europe and other economic regions offer
LTIP to middle management and other (key) staff.
LTIP-eligible staff by level
Other (key)employees
Middle Management
Senior Management
55
92
40
88
72
98
35
82
TotalEuropeNorth AmericaRest of World
Fig. 10: LTIP eligibility by level in % of companies
3425
4329
Executives
98100
97100
Fig. 8: Eligibility (in % of employees) depending on the companies’ importance rating of “Retention” as LTIP objective
Interestingly, companies which regard the importance of
retention as very high have a higher LTIP eligibility rate than
companies which do not.
Link between “Retention” objective and LTIP eligibility
Very high 30
Not very high 15
Fig. 9: Eligibility (in % of employees) depending on the companies’ importance rating of “Motivation” as LTIP objective
Motivation is another strong objective for LTIP
implementation. Similar to retention, companies which
regard the importance of motivation as very high have a
higher LTIP eligibility rate.
Link between “Motivation” objective and LTIP eligibility
Very high 32
Not very high 18

11Global Equity Insights 2017
Long-Term Incentive Plans – Objectives & Eligibility
Link between LTIP eligibilty and performance
Low performing companies 26
High performing companies 30
Fig. 12: LTIP eligibility in % of all employees
Portion of LTIP-eligible staff
< 25%
25 – 50%
51 – 75%
> 75%
73
9
1
17
86
6
2
6
59
9
0
32
82
18
0
0
TotalEuropeNorth AmericaRest of World
Fig. 11: Portion of LTIP-eligible staff in % of companies
Criteria for LTIP eligibility
Career level
Management discretion
Criticality of retention
Performance rating
Skill-set
Career event
Hiring
Other
79
59
56
48
29
29
25
82
57
47
47
20
12
20
81
66
63
50
40
44
34
Fig. 13: Criteria determining LTIP eligibility in % of companies
63
42
53
42
16
16
5
Total
Europe
North America
Rest of World
14
18
11
11
There are regional differences in the portions of LTIP-eligible
staff. 32% of companies from North America have more
than 75% of their employees LTIP eligible. The number
drops to 6% for European companies with 86% of them
having less than 25% of their employees eligible.
LTIP eligibility rates also demonstrate the importance
of long-term incentives for company success. High
performing companies have higher LTIP eligibility rates
than low performing companies. Hence, the extension
of LTIP to a broader range of employees provides great
potential for performance improvement. Such an extension
increases the equity culture within the company, enhances
long-term perspective, and creates sustainable value.
Moreover, eligible employees of high performing companies
participate more often in LTIP than eligible employees of
low performing companies.
Across all economic regions, companies apply similar
criteria for determining LTIP eligibility. Important criteria are
career level (79%), management discretion (59%), criticality
of retention (56%) and performance rating (48%).

12Global Equity Insights 2017
■ Successful companies give more weight to LTIP in their compensation structure across all organizational levels.
■ Differences in the compensation structure are most pronounced for top management.
■ Low portions of LTIP at lower staff levels indicate potential for a better incentive alignment with the interests of shareholders.
Pay mix by level & economic region
Companies from North America are pioneers regarding
the use of LTIP and remain at the forefront of LTIP grants.
Employees of North American companies receive a
higher portion of long-term incentives than their European
counterparts across all levels of the corporate hierarchy.
While European companies have recently made strong
progress in the development of equity culture, a gap
still exists to North American companies, indicating
considerable potential for further improvements.
Across all economic regions, the portion of long-term
incentives decreases with corporate hierarchy—ranging
from 39% for the management board/executive committee
to 12% for (key) employees*. Currently, LTIP play a minor
role in the compensation of senior and middle managers.
The expansion of LTIP to senior and middle management
levels also provides an opportunity to align the managers’
interests with shareholders’ interests.
Management Board/Executive Committee
Executives
Senior Management
Middle Management
(Key) Employees*
36
41
55
72
36
47
79
30
35
52
68
50
57
71
26
26
23
16
31
27
13
21
24
21
17
26
25
20
39
32
22
12
33
26
8
49
42
27
15
24
18
9
Total
Total
Total
Europe
Europe
Europe
North America
North America
North America
Rest of World
Rest of World
Rest of World
Fig. 14: Compensation structure by level and region in % of total direct compensation
Long-Term Incentive Plans – Pay Mix & Country Coverage
Total
Europe
North America
Rest of World
66 20 14
71 20 9
63 19 18
67 22 11
Base Salary STI LTI
Successful companies make more use of Long-Term Incentives
* The term “(key) employees” refers to employees at lower staff levels in general. Some companies offer LTIP only to selected staff such as high potentials, while other companies offer LTIP to all employees.
46 29 25
58 25 17
Total
Europe
North America
Rest of World
13Global Equity Insights 2017
Long-Term Incentive Plans – Pay Mix & Country Coverage
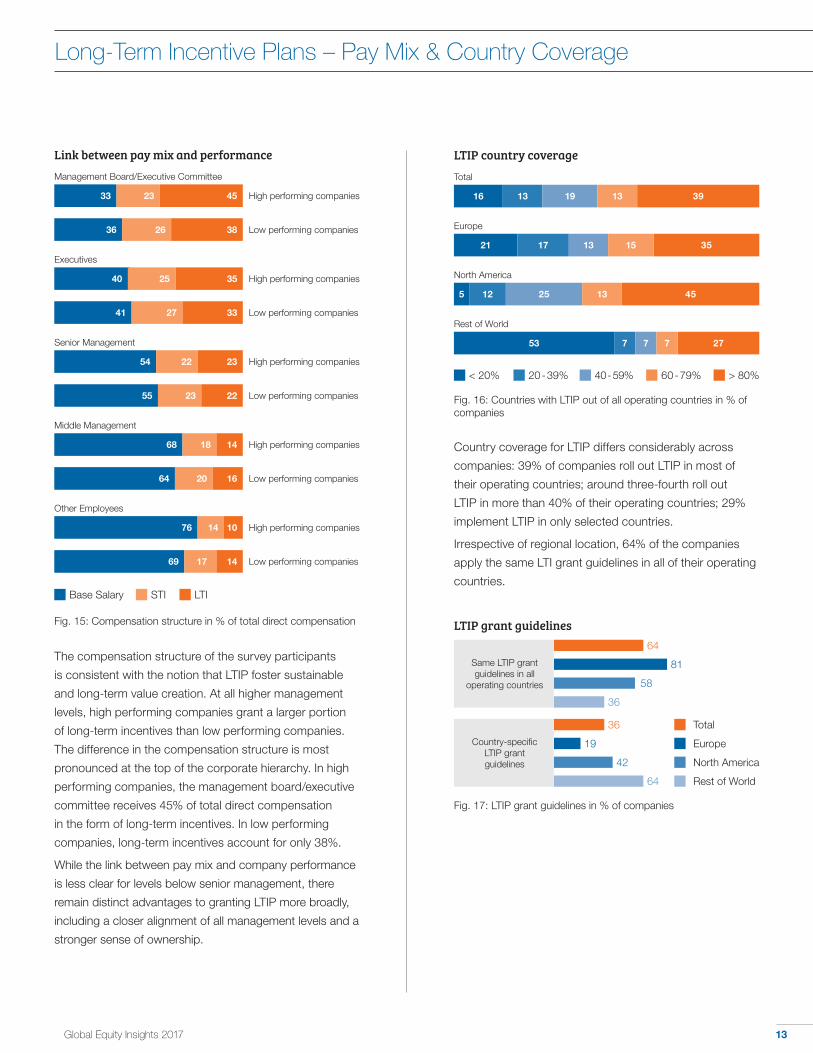
The compensation structure of the survey participants
is consistent with the notion that LTIP foster sustainable
and long-term value creation. At all higher management
levels, high performing companies grant a larger portion
of long-term incentives than low performing companies.
The difference in the compensation structure is most
pronounced at the top of the corporate hierarchy. In high
performing companies, the management board/executive
committee receives 45% of total direct compensation
in the form of long-term incentives. In low performing
companies, long-term incentives account for only 38%.
While the link between pay mix and company performance
is less clear for levels below senior management, there
remain distinct advantages to granting LTIP more broadly,
including a closer alignment of all management levels and a
stronger sense of ownership.
Country coverage for LTIP differs considerably across
companies: 39% of companies roll out LTIP in most of
their operating countries; around three-fourth roll out
LTIP in more than 40% of their operating countries; 29%
implement LTIP in only selected countries.
Irrespective of regional location, 64% of the companies
apply the same LTI grant guidelines in all of their operating
countries.
LTIP country coverage
Fig. 16: Countries with LTIP out of all operating countries in % of companies
Link between pay mix and performanceManagement Board/Executive Committee
Executives
Senior Management
Middle Management
Other Employees
36
41
55
64
69
33
40
54
68
76
26
27
23
20
17
23
25
22
18
14
38
33
22
16
14
45
35
23
14
10
Low performing companies
Low performing companies
Low performing companies
Low performing companies
Low performing companies
High performing companies
High performing companies
High performing companies
High performing companies
High performing companies
Fig. 15: Compensation structure in % of total direct compensation
Base Salary STI LTI
Total
Europe
North America
Rest of World
16
21
5
53
13
17
12
7
19
13
25
7
39
35
45
27
< 20% 20 - 39% 40 - 59% 60 - 79% > 80%
13
15
13
7
LTIP grant guidelines
Same LTIP grant guidelines in all
operating countries
Country-specific LTIP grant guidelines
64
36
81
19
58
42
Total
Europe
North America
Rest of World
Fig. 17: LTIP grant guidelines in % of companies
36
64

14Global Equity Insights 2017
LTIP types
Restricted stock(units)
Performance shares
Stock options
Performancecash
Cash deferral
Equity deferral
Stock appreciation
rights
Share matching
Other
31
29
15
7
5
4
2
2
26
33
6
15
8
6
0
0
34
27
19
5
4
3
3
2
Fig. 18: LTIP types ranked by prevalence in %
27
27
18
0
9
6
6
6
Total
Europe
North America
Rest of World
Plan types and performance measures
■ Distribution of plan types differs considerably between Europe and North America.
■ European and North American companies prefer external performance measures (e.g. TSR).
■ High performing companies make more often use of relative performance measures than low performing companies.
The market practice for LTIP types confirms certain
trends we identified in our prior surveys. In particular, the
popularity of stock options has declined over the past
years and has stabilized at a relatively low level. In Europe
and North America a decade ago, stock options were
the predominant plan type. Today, stock options rank
third among the companies from North America, and for
European companies they rank even lower at fifth place.
Generally, the distribution of plan types differs significantly
between European and North American companies. While
European companies prefer performance shares as a
long-term incentive (33%), North American companies
prefer restricted stock (units) (34%). Other plan types such
as share matching, discount plans and equity or cash
deferrals only play a minor role in the compensation mix.
The preference for performance shares and restricted stock
(units) reflects the notion that stock awards provide a more
balanced risk profile than stock options. In the aftermath
of the financial crisis, many public commentators and
politicians argued – rightly or wrongly – that stock options
caused excessive risk-taking.
Long-Term Incentive Plans – Types & Performance Measures
Discount
1
1
2
0
2
4
2
0

15Global Equity Insights 2017
Long-Term Incentive Plans – Types & Performance Measures
The total shareholder return (TSR) is used by more than
one-fifth of companies surveyed and is the most popular
performance measure for European and North American
companies. Among internal performance measures,
companies prefer profit/earnings (17%) and return on
capital (12%) respectively. The additional choice of
performance measures differs between European and
North American companies: European companies tend
to use share price, while North American companies
tend to use sales/revenue measures. These tendencies
reflect cultural differences between the intended uses
of LTIP. In Europe, companies explicitly emphasize the
incentive effect of LTIP by linking the final number of
performance shares to external performance measures. In
North America, companies rely more strongly on implicit
incentives that result from holding restricted stock (units):
internal performance measures often determine the budget
available for restricted stock (unit) grants.
Performance measures
TSR
Profit/earnings
Return on capital
Sales/revenues
EPS (Earnings per share)
Share price
Cash flow
(Economic/cash) Value added
Return on sales
21
17
12
11
11
8
5
2
1
23
18
12
10
3
14
5
2
2
20
16
10
11
17
4
5
1
0
Fig. 19: LTIP performance measures ranked by prevalence in %
14
14
18
11
7
7
4
7
4
Other non- financial
measures
53
57
TotalEuropeNorth AmericaRest of World
Other financial measures
87
97
16Global Equity Insights 2017
Long-Term Incentive Plans – Types & Performance Measures
83
12
27
15
19
17
88
73
85
62
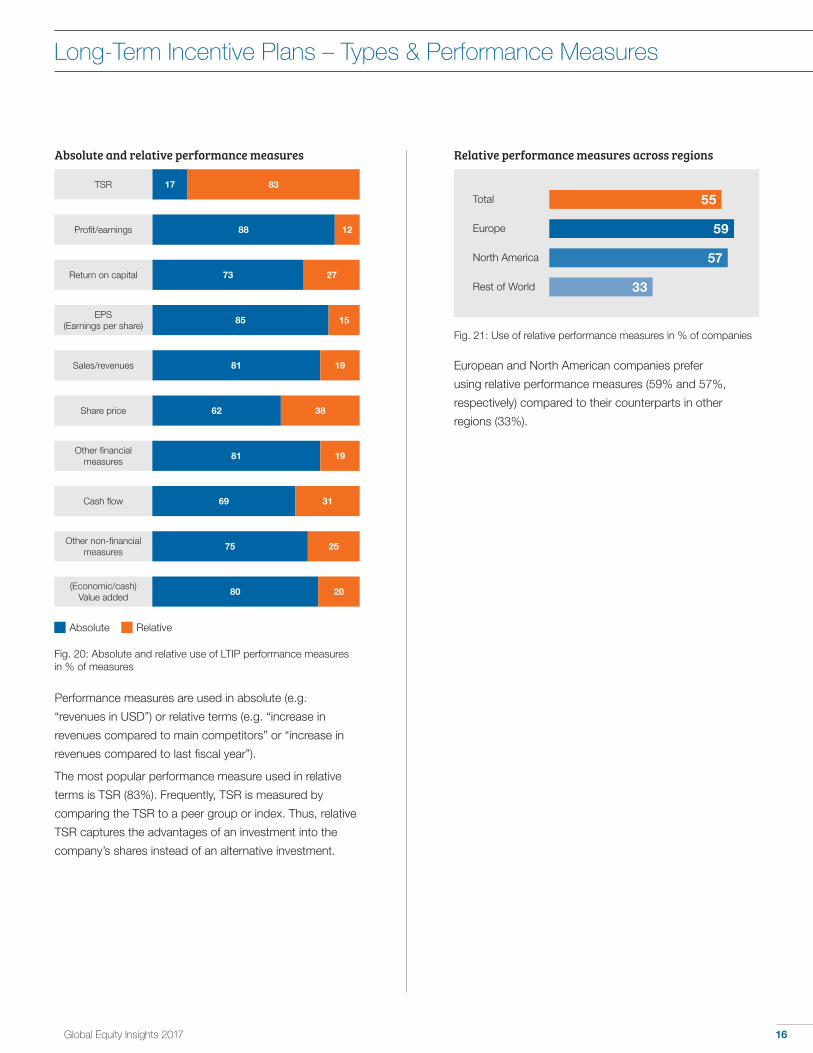
Fig. 20: Absolute and relative use of LTIP performance measures in % of measures
Absolute Relative
TSR
Profit/earnings
Return on capital
EPS (Earnings per share)
Sales/revenues
Share price
Other financial measures
Cash flow
Other non-financial measures
(Economic/cash) Value added
81
38
1981
69 31
2575
2080
Absolute and relative performance measures
Performance measures are used in absolute (e.g.
“revenues in USD”) or relative terms (e.g. “increase in
revenues compared to main competitors” or “increase in
revenues compared to last fiscal year”).
The most popular performance measure used in relative
terms is TSR (83%). Frequently, TSR is measured by
comparing the TSR to a peer group or index. Thus, relative
TSR captures the advantages of an investment into the
company’s shares instead of an alternative investment.
Total 55
Europe 59
North America 57
Rest of World 33
Fig. 21: Use of relative performance measures in % of companies
Relative performance measures across regions
European and North American companies prefer
using relative performance measures (59% and 57%,
respectively) compared to their counterparts in other
regions (33%).
17Global Equity Insights 2017
single
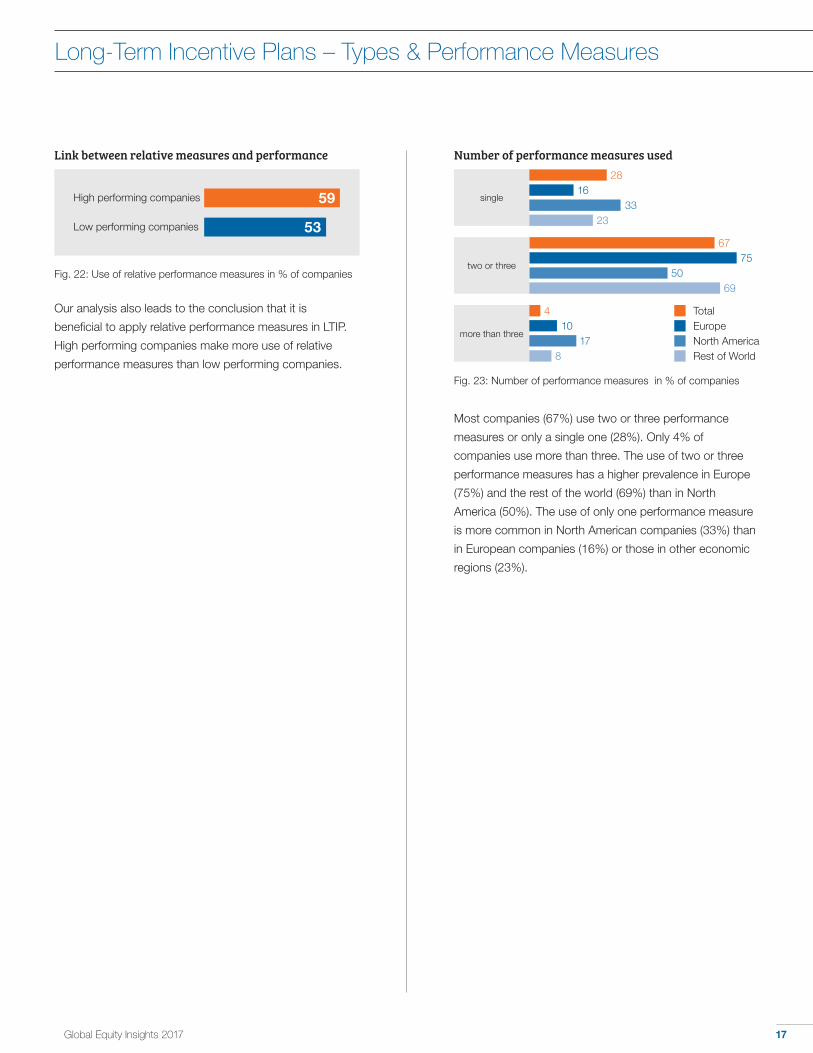
Fig. 23: Number of performance measures in % of companies
more than three
TotalEuropeNorth AmericaRest of World
two or three
6775
5069
2816
3323
Number of performance measures used
Long-Term Incentive Plans – Types & Performance Measures
Most companies (67%) use two or three performance
measures or only a single one (28%). Only 4% of
companies use more than three. The use of two or three
performance measures has a higher prevalence in Europe
(75%) and the rest of the world (69%) than in North
America (50%). The use of only one performance measure
is more common in North American companies (33%) than
in European companies (16%) or those in other economic
regions (23%).
410
178
Our analysis also leads to the conclusion that it is
beneficial to apply relative performance measures in LTIP.
High performing companies make more use of relative
performance measures than low performing companies.
Link between relative measures and performance
Low performing companies 53
High performing companies 59
Fig. 22: Use of relative performance measures in % of companies
18Global Equity Insights 2017
Long-Term Incentive Plans – Vesting & Settlement
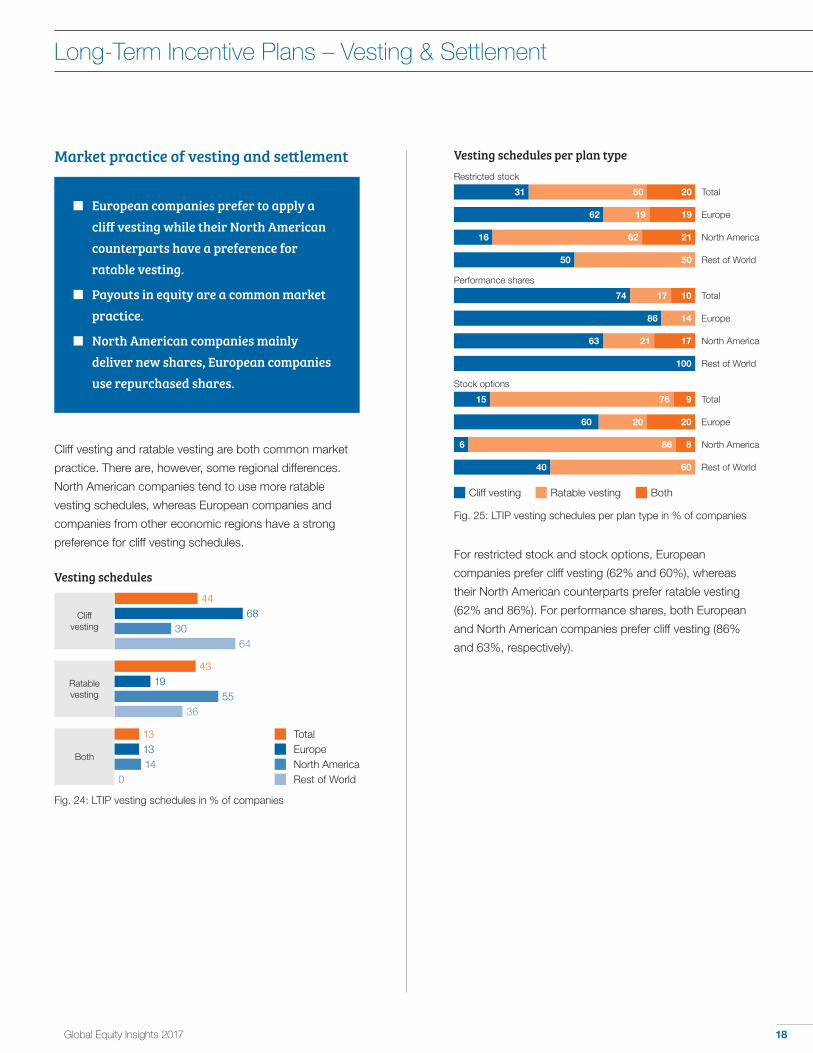
Cliff vesting and ratable vesting are both common market
practice. There are, however, some regional differences.
North American companies tend to use more ratable
vesting schedules, whereas European companies and
companies from other economic regions have a strong
preference for cliff vesting schedules.
Market practice of vesting and settlement
■ European companies prefer to apply a cliff vesting while their North American counterparts have a preference for ratable vesting.
■ Payouts in equity are a common market practice.
■ North American companies mainly deliver new shares, European companies use repurchased shares.
Ratable vesting
44
43
68
19
30
5536
Fig. 24: LTIP vesting schedules in % of companies
64
Cliff vesting
Vesting schedules
For restricted stock and stock options, European
companies prefer cliff vesting (62% and 60%), whereas
their North American counterparts prefer ratable vesting
(62% and 86%). For performance shares, both European
and North American companies prefer cliff vesting (86%
and 63%, respectively).
Both
131314
0
TotalEuropeNorth AmericaRest of World
Vesting schedules per plan typeRestricted stock
Performance shares
Stock options
31
15
60
16
6
62
40
50
76
20
62
86
19
60
20
9
20
21
8
19
Total
Total
Europe
Europe
North America
North America
Rest of World
Rest of World
Fig. 25: LTIP vesting schedules per plan type in % of companies
74 17 10
86 14
63 21 17
100
Cliff vesting Ratable vesting Both
50 50
Total
Europe
North America
Rest of World
19Global Equity Insights 2017
Long-Term Incentive Plans – Vesting & Settlement
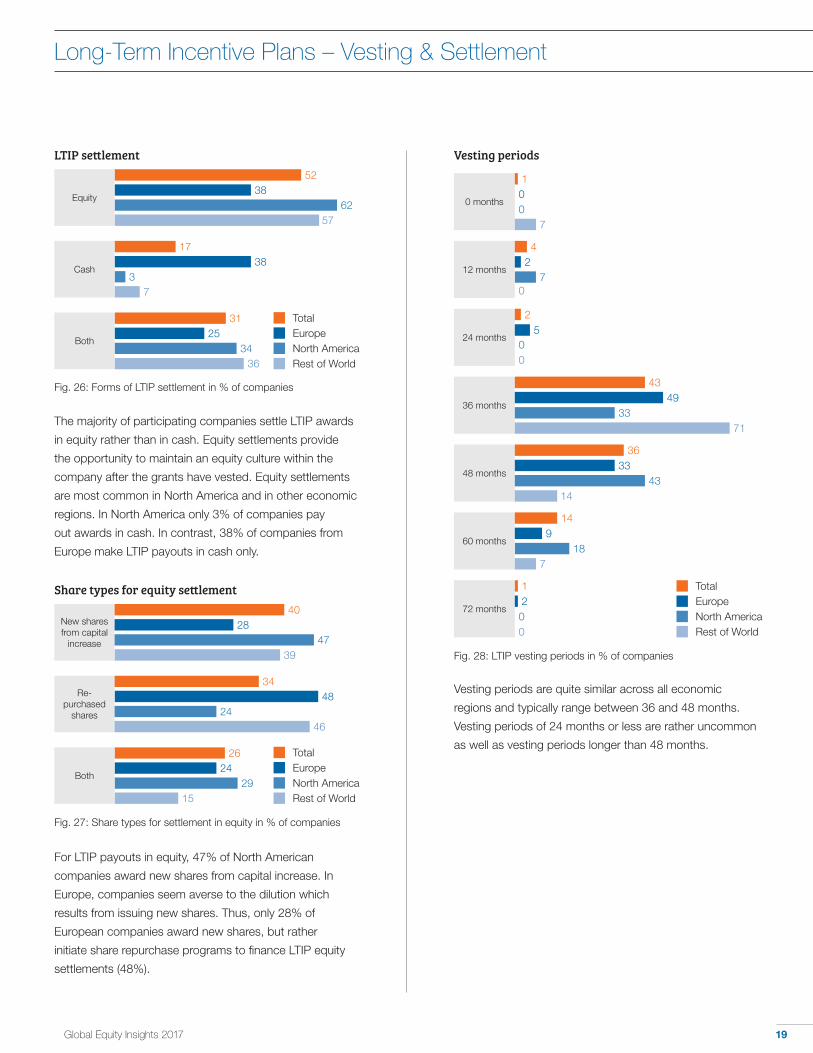
The majority of participating companies settle LTIP awards
in equity rather than in cash. Equity settlements provide
the opportunity to maintain an equity culture within the
company after the grants have vested. Equity settlements
are most common in North America and in other economic
regions. In North America only 3% of companies pay
out awards in cash. In contrast, 38% of companies from
Europe make LTIP payouts in cash only.
LTIP settlement
Equity
Cash
Both
52
17
31
38
38
25
62
3
34
57
Fig. 26: Forms of LTIP settlement in % of companies
7
36
For LTIP payouts in equity, 47% of North American
companies award new shares from capital increase. In
Europe, companies seem averse to the dilution which
results from issuing new shares. Thus, only 28% of
European companies award new shares, but rather
initiate share repurchase programs to finance LTIP equity
settlements (48%).
Share types for equity settlement
New shares from capital
increase
Re-purchased
shares
Both
40
34
26
28
48
24
47
24
29
39
Fig. 27: Share types for settlement in equity in % of companies
46
15
Vesting periods
0 months
24 months
36 months
48 months
72 months
5
49
33
2
0
33
43
0
0
71
14
0
Fig. 28: LTIP vesting periods in % of companies
00
7
TotalEuropeNorth AmericaRest of World
60 months9
187
12 months2
70
Vesting periods are quite similar across all economic
regions and typically range between 36 and 48 months.
Vesting periods of 24 months or less are rather uncommon
as well as vesting periods longer than 48 months.
TotalEuropeNorth AmericaRest of World
TotalEuropeNorth AmericaRest of World
1
4
2
43
36
14
1
20Global Equity Insights 2017
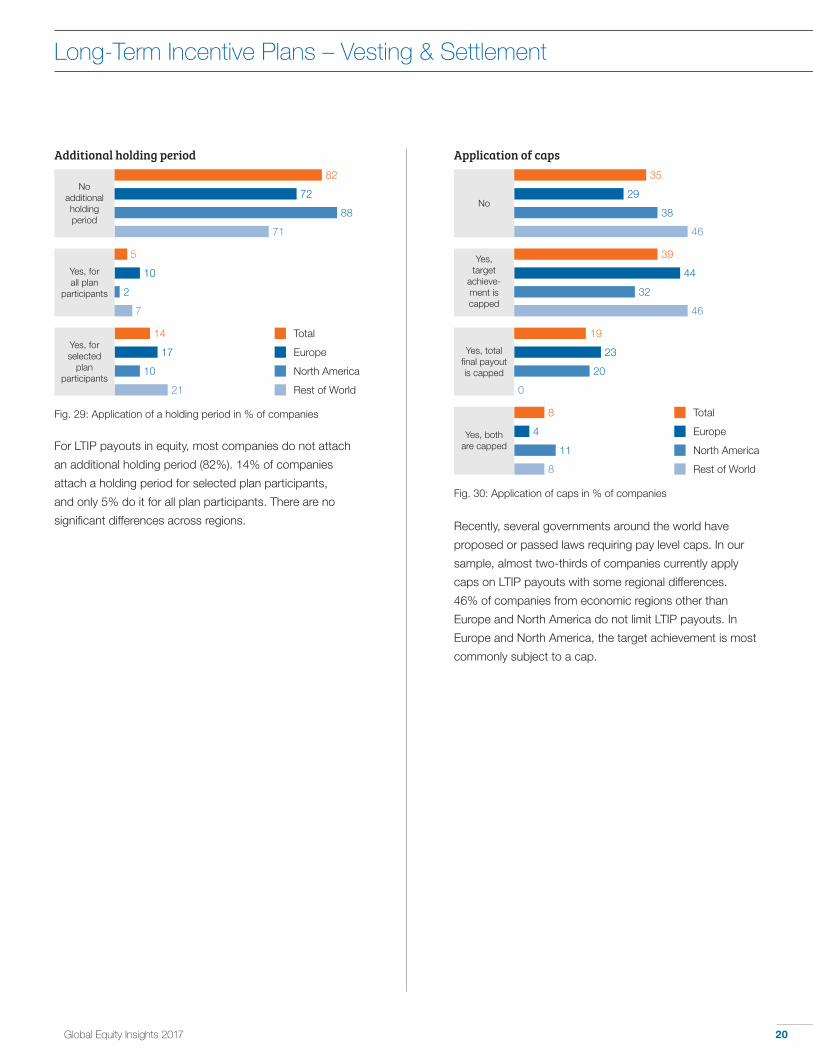
Application of caps
Yes, total final payout is capped
Yes, both are capped
19
8
23
4
20
11
Total
Europe
North America
Rest of World
Fig. 30: Application of caps in % of companies
0
8
Long-Term Incentive Plans – Vesting & Settlement
For LTIP payouts in equity, most companies do not attach
an additional holding period (82%). 14% of companies
attach a holding period for selected plan participants,
and only 5% do it for all plan participants. There are no
significant differences across regions.
Yes, target
achieve-ment is capped
39
44
32
46
No
35
29
38
46
Additional holding period
No additional holding period
Yes, for all plan
participants
Yes, for selected
plan participants
82
5
14
72
17
2
10
71
Total
Europe
North America
Rest of World
Fig. 29: Application of a holding period in % of companies
21
88
10
7
Recently, several governments around the world have
proposed or passed laws requiring pay level caps. In our
sample, almost two-thirds of companies currently apply
caps on LTIP payouts with some regional differences.
46% of companies from economic regions other than
Europe and North America do not limit LTIP payouts. In
Europe and North America, the target achievement is most
commonly subject to a cap.
21Global Equity Insights 2017
Long-Term Incentive Plans – Administration & Success
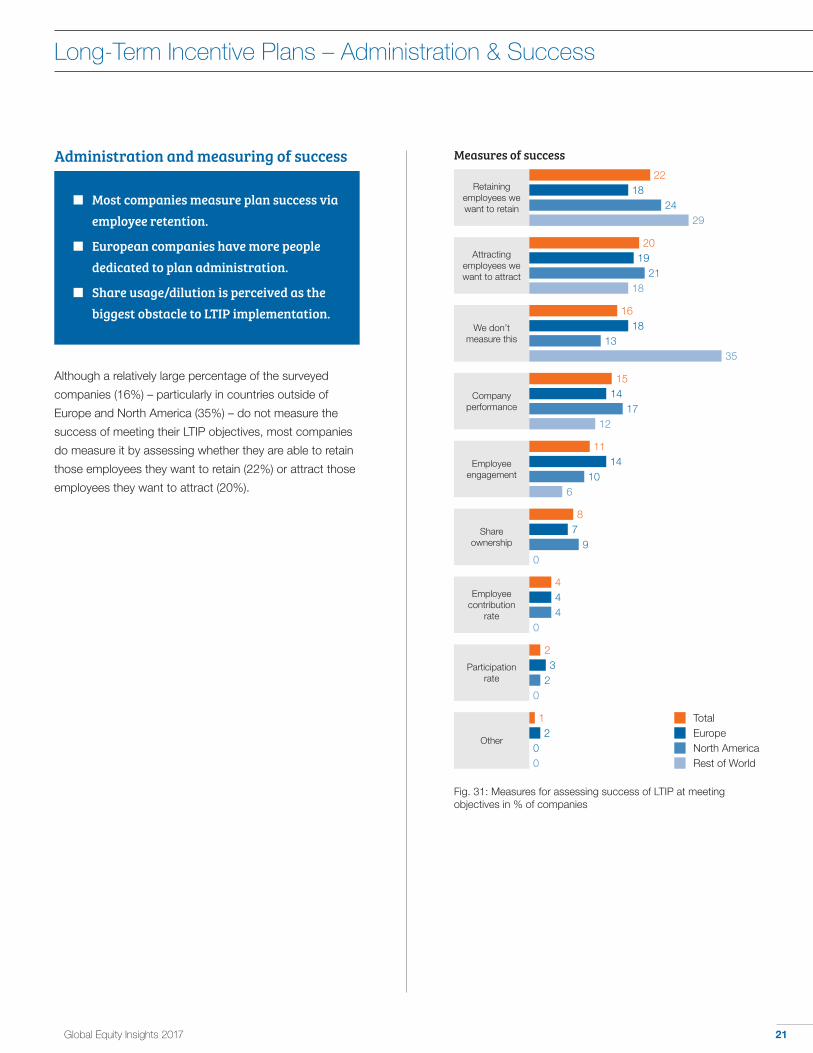
Measures of success
Retaining employees we want to retain
We don’t measure this
Company performance
Employee engagement
Share ownership
Employee contribution
rate
Participation rate
22
16
15
11
8
4
2
18
18
14
14
7
4
3
24
13
17
10
9
4
2
29
35
12
6
0
0
0
TotalEuropeNorth AmericaRest of World
Fig. 31: Measures for assessing success of LTIP at meeting objectives in % of companies
Other
12
00
Although a relatively large percentage of the surveyed
companies (16%) – particularly in countries outside of
Europe and North America (35%) – do not measure the
success of meeting their LTIP objectives, most companies
do measure it by assessing whether they are able to retain
those employees they want to retain (22%) or attract those
employees they want to attract (20%).
■ Most companies measure plan success via employee retention.
■ European companies have more people dedicated to plan administration.
■ Share usage/dilution is perceived as the biggest obstacle to LTIP implementation.
Administration and measuring of success
Attracting employees we want to attract
2019
2118

22Global Equity Insights 2017
Long-Term Incentive Plans – Administration & Success
Obstacles to implementation Share usage/dilution
Shareholder concerns
Regulatory requirements
Costs
IT implementation
Implementation proccess
Participant interest
Total
Total
Total
Total
Total
Total
Total
Europe
Europe
Europe
Europe
Europe
Europe
Europe
North America
North America
North America
North America
North America
North America
North America
Fig. 33: LTIP implementation obstacles in % of companies
Very low Low Moderate High Very high
6
6
4
17
31
41
22
42
25
26
27
8
22
15
27
17
16
12
20
17 Rest of World
Rest of World
Rest of World
Rest of World
Rest of World
Rest of World
Rest of World
4
5
4
38
23
30
14
15
34
30
42
46
24
23
20
15
13
20
5
4
4
8
22
13
26
42
34
38
36
8
25
27
26
17
14
18
8
25
2
2
2
45
18
13
16
40
48
42
36
30
33
26
18
10
4
14
15
14
20
70
31
26
28
10
32
30
39
12
21
7
20
9
9
7
13
11
16
8
27
11
33
58
32
32
38
8
21
36
11
8
9
2
25
20
17
23
17
23
19
23
33
30
22
35
33
23
36
16
8
4
6
2
8
Number of FTEs in administration
Total 4.2
Europe 6.5
North America 3.1
Rest of World 3.2
Fig. 32: Average number of FTEs dedicated to equity-based compensation plan administration
Companies assess share usage/dilution as a main obstacle
to LTIP implementation, while other perceived issues
are shareholder concerns and regulatory requirements.
Fewer companies consider costs, IT implementation,
the implementation process or (a lack of) participant
interest as high obstacles. Comparing regions, European
companies point to regulatory requirements as their highest
obstacle, while North American companies point to share
usage/dilution and shareholder concerns as their highest
obstacles. Shareholder concerns are less of an obstacle for
European companies, compared to their North American
peers.
On average, companies employ 4.2 FTEs (full-time
equivalent) for the administration of equity-based
compensation plans. However, there are large regional
differences. While North American companies as well as
companies from other economic regions only employ
around 3 FTEs on average, European companies employ
6.5 FTEs.

23Global Equity Insights 2017
Share Purchase Plans – Implementation & Participation
SPP eligibility
< 25%
25 – 50%
51 – 75%
> 75%
21
10
22
48
29
11
11
50
7
10
33
50
60
0
20
20
TotalEuropeNorth AmericaRest of World
Fig. 36: Employees eligible for SPP in % of companies
SPP implementation
Total 59
Europe 62
North America 62
Rest of World 38
Fig. 35: Implementation of SPP in % of companies
Link between SPP participation rate and performance
Low performing companies 55
High performing companies 65
Fig. 34: SPP participation rate in %
Implementation and success of Share Purchase Plans
■ High performing companies have higher SPP participation rates.
■ More than half of all companies surveyed have implemented SPP.
■ Almost half of the companies offer SPP to over 75% of their employees.
Participation in SPP shows a positive relation with
company performance. High performing companies show
a participation rate of 65%, whereas the participation rate
in low performing companies is only 55%. Hence, SPP
may not only be a crucial factor of success in a competitive
labor market, but also a more general value lever when
it comes to participation. SPP turn a large part of a
company’s population into equity investors of the company
and thereby incentivize employees to act in the best
interest of shareholders.
Companies seem to be aware of the beneficial impact of
SPP since more than half have implemented such plans.
However, there are great regional differences. European
and American companies show a higher implementation
rate than companies in other economic regions.
Companies often use SPP to establish a comprehensive
equity culture within their organization. Almost half of
companies offer SPP to over 75% of their employees.
24Global Equity Insights 2017
Share Purchase Plans – Implementation & Participation
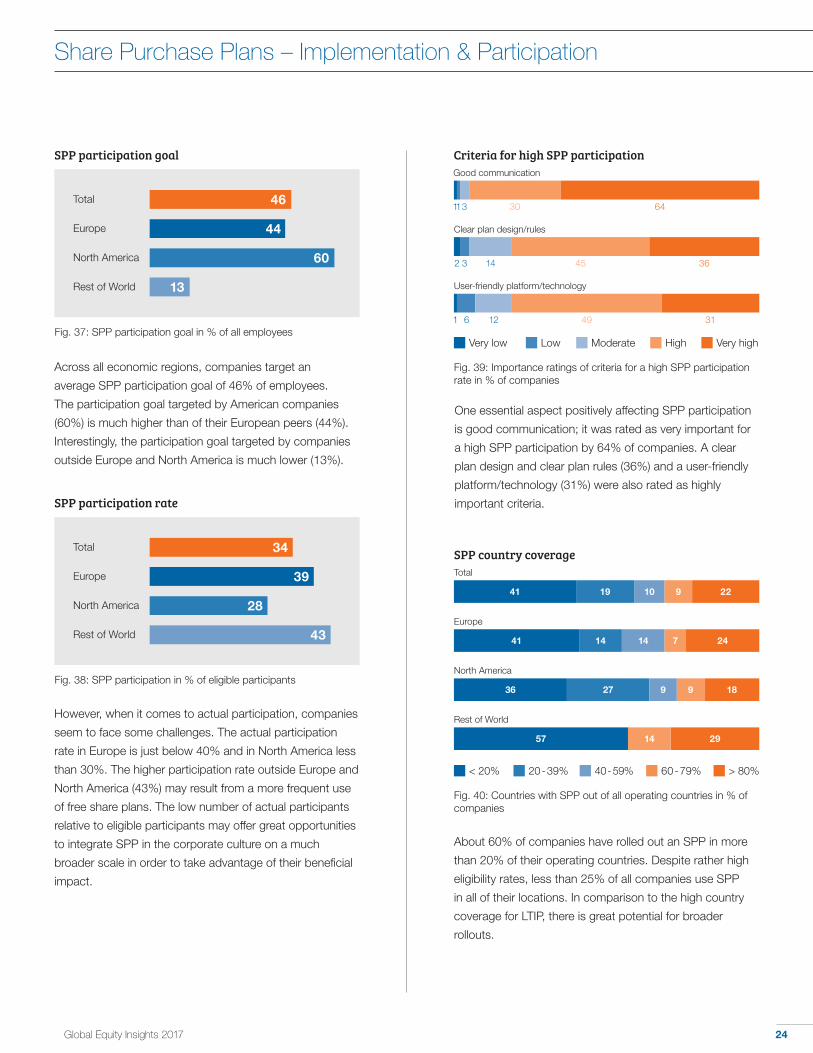
Criteria for high SPP participationGood communication
Clear plan design/rules
User-friendly platform/technology
1
3
6
3
14
12
64
36
31
30
45
49
1
2
1
Very low Low Moderate High Very high
Fig. 39: Importance ratings of criteria for a high SPP participation rate in % of companies
SPP participation rate
Total 34
Europe 39
North America 28
Rest of World 43
Fig. 38: SPP participation in % of eligible participants
However, when it comes to actual participation, companies
seem to face some challenges. The actual participation
rate in Europe is just below 40% and in North America less
than 30%. The higher participation rate outside Europe and
North America (43%) may result from a more frequent use
of free share plans. The low number of actual participants
relative to eligible participants may offer great opportunities
to integrate SPP in the corporate culture on a much
broader scale in order to take advantage of their beneficial
impact.
Across all economic regions, companies target an
average SPP participation goal of 46% of employees.
The participation goal targeted by American companies
(60%) is much higher than of their European peers (44%).
Interestingly, the participation goal targeted by companies
outside Europe and North America is much lower (13%).
SPP country coverage
Fig. 40: Countries with SPP out of all operating countries in % of companies
Europe
North America
Rest of World
41
36
57
14
27
14
9
24
18
29
< 20% 20 - 39% 40 - 59% 60 - 79% > 80%
7
9
14
SPP participation goal
Total 46
Europe 44
North America 60
Rest of World 13
Fig. 37: SPP participation goal in % of all employees
About 60% of companies have rolled out an SPP in more
than 20% of their operating countries. Despite rather high
eligibility rates, less than 25% of all companies use SPP
in all of their locations. In comparison to the high country
coverage for LTIP, there is great potential for broader
rollouts.
Total
41 19 10 229
One essential aspect positively affecting SPP participation
is good communication; it was rated as very important for
a high SPP participation by 64% of companies. A clear
plan design and clear plan rules (36%) and a user-friendly
platform/technology (31%) were also rated as highly
important criteria.
25Global Equity Insights 2017
Share Purchase Plans – Types & Performance Measures
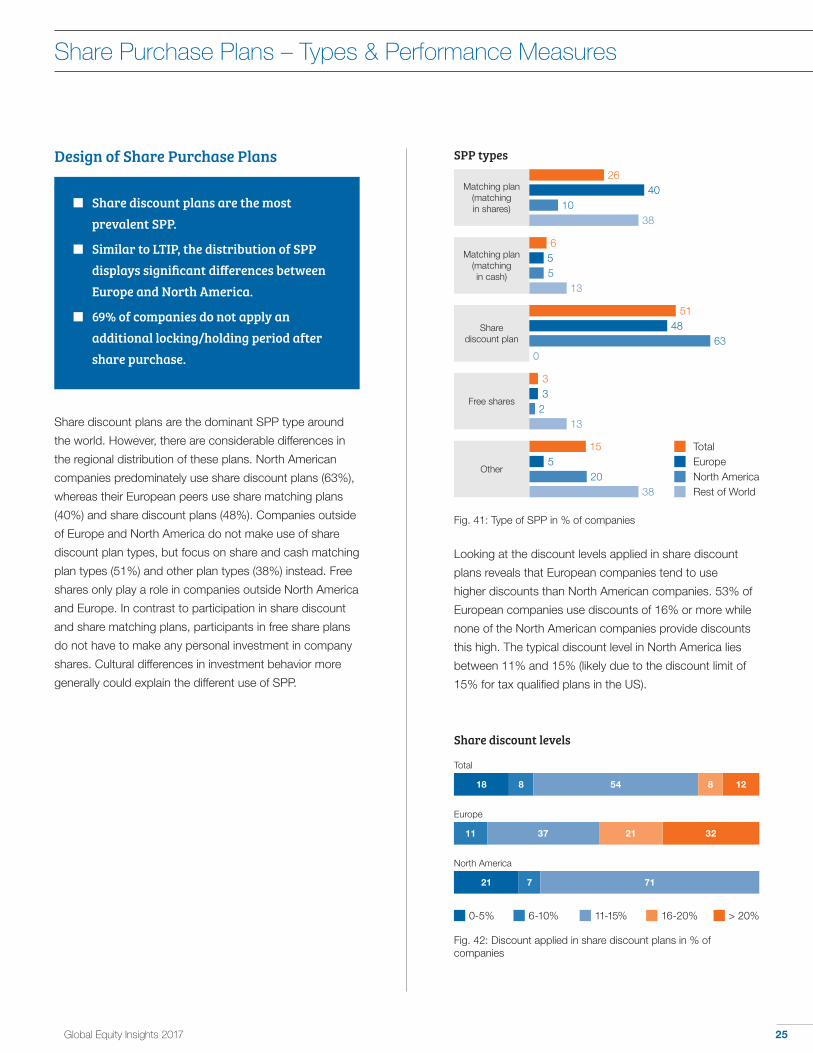
Design of Share Purchase Plans
■ Share discount plans are the most prevalent SPP.
■ Similar to LTIP, the distribution of SPP displays significant differences between Europe and North America.
■ 69% of companies do not apply an additional locking/holding period after share purchase.
Share discount plans are the dominant SPP type around
the world. However, there are considerable differences in
the regional distribution of these plans. North American
companies predominately use share discount plans (63%),
whereas their European peers use share matching plans
(40%) and share discount plans (48%). Companies outside
of Europe and North America do not make use of share
discount plan types, but focus on share and cash matching
plan types (51%) and other plan types (38%) instead. Free
shares only play a role in companies outside North America
and Europe. In contrast to participation in share discount
and share matching plans, participants in free share plans
do not have to make any personal investment in company
shares. Cultural differences in investment behavior more
generally could explain the different use of SPP.
SPP types
Matching plan (matching in shares)
Matching plan (matching in cash)
Share discount plan
Free shares
26
6
51
3
40
5
48
3
10
5
63
2
38
13
0
13
TotalEuropeNorth AmericaRest of World
Fig. 41: Type of SPP in % of companies
Other
155
2038
Share discount levels
Fig. 42: Discount applied in share discount plans in % of companies
Total
Europe
North America
18 8
11
54
37
12
32
0-5% 6-10% 11-15% 16-20% > 20%
8
21
21 7 71
Looking at the discount levels applied in share discount
plans reveals that European companies tend to use
higher discounts than North American companies. 53% of
European companies use discounts of 16% or more while
none of the North American companies provide discounts
this high. The typical discount level in North America lies
between 11% and 15% (likely due to the discount limit of
15% for tax qualified plans in the US).
26Global Equity Insights 2017
Share Purchase Plans – Types & Performance Measures
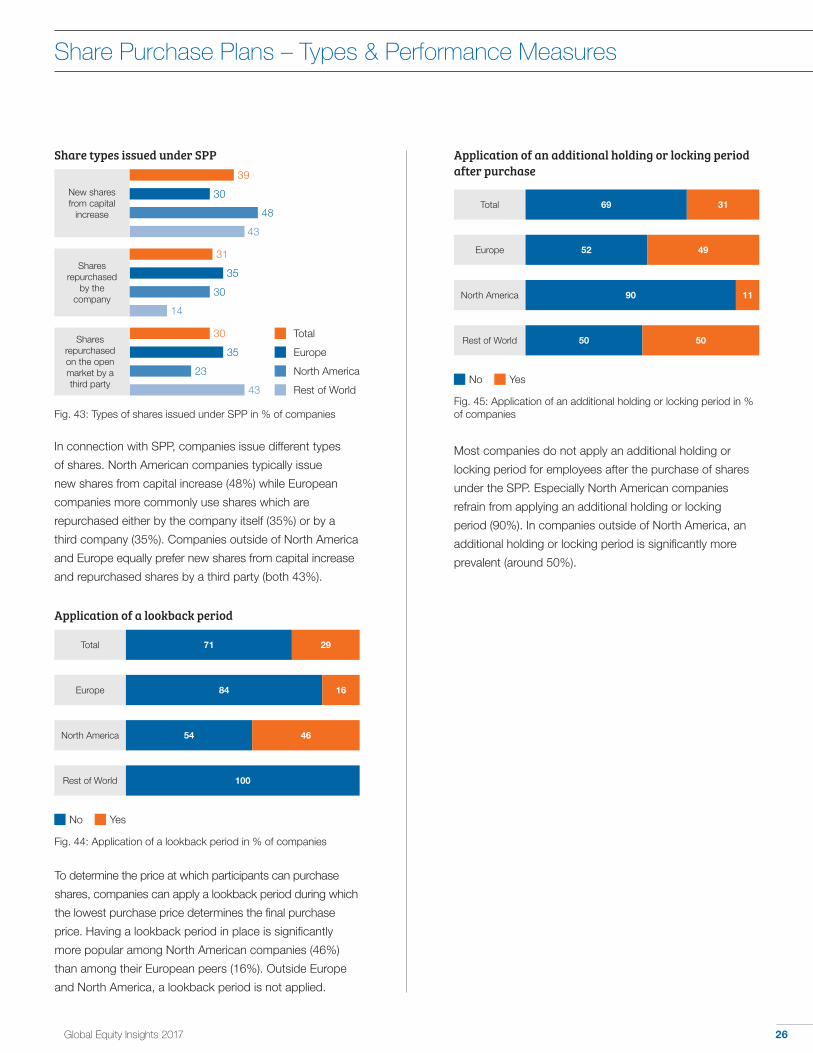
Share types issued under SPP
New shares from capital
increase
Shares repurchased
by the company
Shares repurchased on the open market by a third party
39
31
30
30
35
35
48
30
23
43
Total
Europe
North America
Rest of World
Fig. 43: Types of shares issued under SPP in % of companies
14
43
Application of a lookback period
No Yes
Total
Europe
North America
Rest of World
71 29
1684
4654
100
Fig. 44: Application of a lookback period in % of companies
Most companies do not apply an additional holding or
locking period for employees after the purchase of shares
under the SPP. Especially North American companies
refrain from applying an additional holding or locking
period (90%). In companies outside of North America, an
additional holding or locking period is significantly more
prevalent (around 50%).
In connection with SPP, companies issue different types
of shares. North American companies typically issue
new shares from capital increase (48%) while European
companies more commonly use shares which are
repurchased either by the company itself (35%) or by a
third company (35%). Companies outside of North America
and Europe equally prefer new shares from capital increase
and repurchased shares by a third party (both 43%).
To determine the price at which participants can purchase
shares, companies can apply a lookback period during which
the lowest purchase price determines the final purchase
price. Having a lookback period in place is significantly
more popular among North American companies (46%)
than among their European peers (16%). Outside Europe
and North America, a lookback period is not applied.
Application of an additional holding or locking period after purchase
No Yes
Total
Europe
North America
Rest of World
69 31
4952
1190
50
Fig. 45: Application of an additional holding or locking period in % of companies
50

27Global Equity Insights 2017
Share Purchase Plans – Objectives & Success
Evaluation of Share Purchase Plans
■ Share ownership and identification with the company are the most important objectives for SPP implementation.
■ Regulatory requirements and costs are the main obstacles for SPP implementation.
■ Companies use participation rate to measure success and satisfaction.
By implementing an SPP, companies typically target
certain objectives. Almost half of the surveyed companies
regard share ownership as the most important objective
for SPP implementation. Identification with the company
and employee engagement are also highly ranked SPP
objectives.
However, there are also some regional differences: In
Europe, identification with the company is the most
important objective for the implementation of an SPP, while
in North America this is share ownership.
2
3
5
8
6
3
10
13
25
25
30
45
41
30
17
34
28
40
35
Objectives of SPP* Share ownership
Identification with the company
Employee engagement
Motivation
Profit/Performance sharing
Retention
Stay competitive paywise
Strategy
Best market pay
Total
Total
Total
Total
Total
Total
Total
Total
Total
Europe
Europe
Europe
Europe
Europe
Europe
Europe
Europe
Europe
North America
North America
North America
North America
North America
North America
North America
North America
North America
4
4
4
4
7
4
12
7
25
22
32
24
44
50
33
16
20
37
21
44
44
40
6
6
10
13
19
26
33
27
42
32
27
17
32
32
30
30
Very low Low Moderate High Very high
Fig. 46: SPP objectives across regions in % of companies
3
13
9 9 25 1542
9 26 133517
4 4 35 1542
8 8 29 1540
13 27 133313
12 46 835
5 16 31 1534
20 17 233010
10 29 1052
6 13 29 1338
15 27 192712
4 4 50 438
5 14 36 1234
20 23 20307
* Rest of world is not included due to small sample size

28Global Equity Insights 2017
Share Purchase Plans – Objectives & Success
Satisfaction with SPP is an important topic and survey
results indicate that companies measure employee
satisfaction in different ways. Although 26% of all
companies do not measure employee satisfaction with
SPP at all, participation rate is the most popular measure
(42%). There are no significant differences across
economic regions. However, attrition rate is a measure
which is much more frequently used outside of Europe and
North America.
Companies indicate two main obstacles to the
implementation of an SPP: regulatory requirements
and costs. The implementation process itself, IT
implementation, (a lack of) participant acceptance,
share usage/dilution and shareholder concerns are
assessed as less important obstacles. Regulatory
requirements are particularly seen as an obstacle by
European companies, with 38% of them considering these
as a very high obstacle to SPP implementation.
5
3
7
12
7
15
28
28
30
27
24
26
28
38
22
Obstacles to SPP implementation*Regulatory requirements
Total
Europe
North America
3
4
4
13
11
14
43
39
46
20
25
14
20
21
21
Costs
Total
Europe
North America
14
7
19
16
15
15
33
30
31
28
41
19
10
7
15
Implementation process
Total
Europe
North America
16
11
20
16
15
16
34
37
28
25
26
28
9
11
8
IT implementation
Total
Europe
North America
Participation acceptance
12
11
12
26
30
27
22
15
23
33
41
27
7
4
12
Total
Europe
North America
Share usage/dilution
13
13
7
42
50
33
29
21
41
11
8
15
5
8
4
Total
Europe
North America
Shareholder concerns
28
35
8
32
30
35
28
22
38
8
9
4
4
4
15
Total
Europe
North America
Fig. 47: SPP obstacles across regions in % of companies
Very low Low Moderate High Very high
SPP satisfaction measures
Focus groups
Employee surveys
Attrition rate
12
7
16
6
9
7
0
14
We don’t measure this
TotalEuropeNorth AmericaRest of World
Fig. 48: SPP satisfaction measures in % of companies
34
20
Participation rate
42414343
Manager/executive feedback
1014
70
2618
3343
* Rest of world is not included due to small sample size
29Global Equity Insights 2017
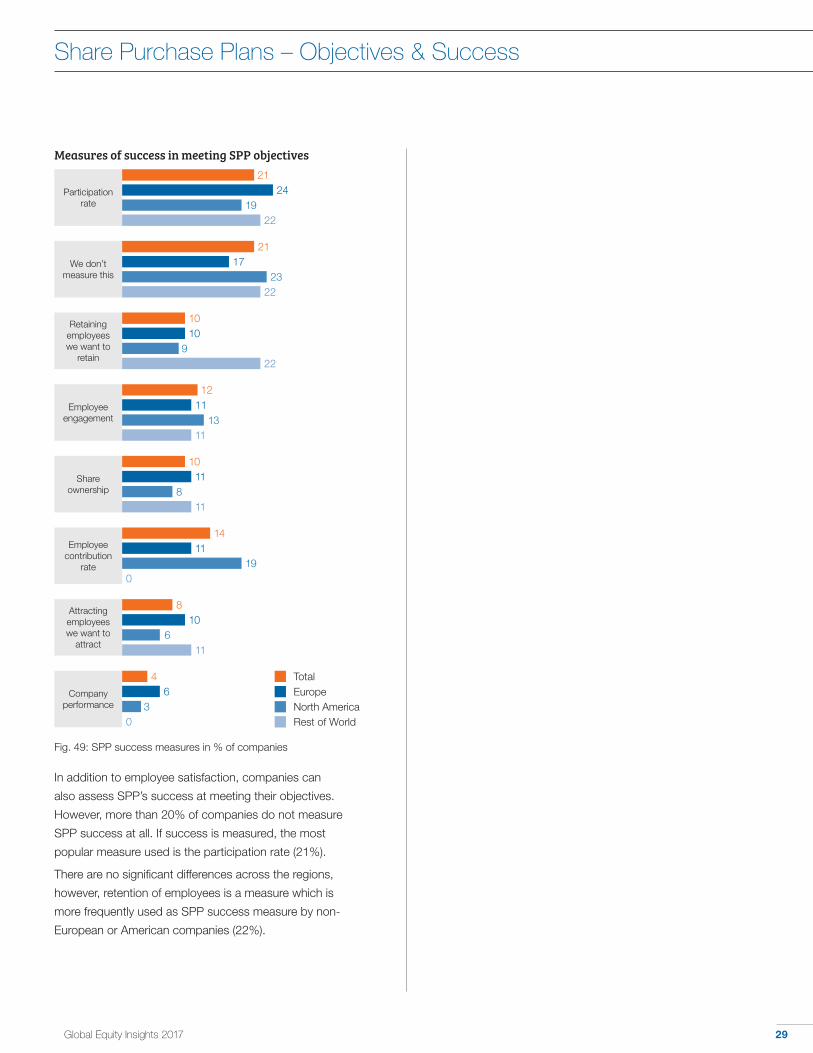
Share Purchase Plans – Objectives & Success
In addition to employee satisfaction, companies can
also assess SPP’s success at meeting their objectives.
However, more than 20% of companies do not measure
SPP success at all. If success is measured, the most
popular measure used is the participation rate (21%).
There are no significant differences across the regions,
however, retention of employees is a measure which is
more frequently used as SPP success measure by non-
European or American companies (22%).
Measures of success in meeting SPP objectives
Employee engagement
Retaining employees we want to
retain
We don’t measure this
10
21
10
17
9
2322
Company performance
TotalEuropeNorth AmericaRest of World
Fig. 49: SPP success measures in % of companies
1211
1311
Participation rate
2124
1922
Share ownership
Employee contribution
rate
Attracting employees we want to
attract
46
30
22
10
14
8
11
11
10
8
19
6
11
0
11
30Global Equity Insights 2017
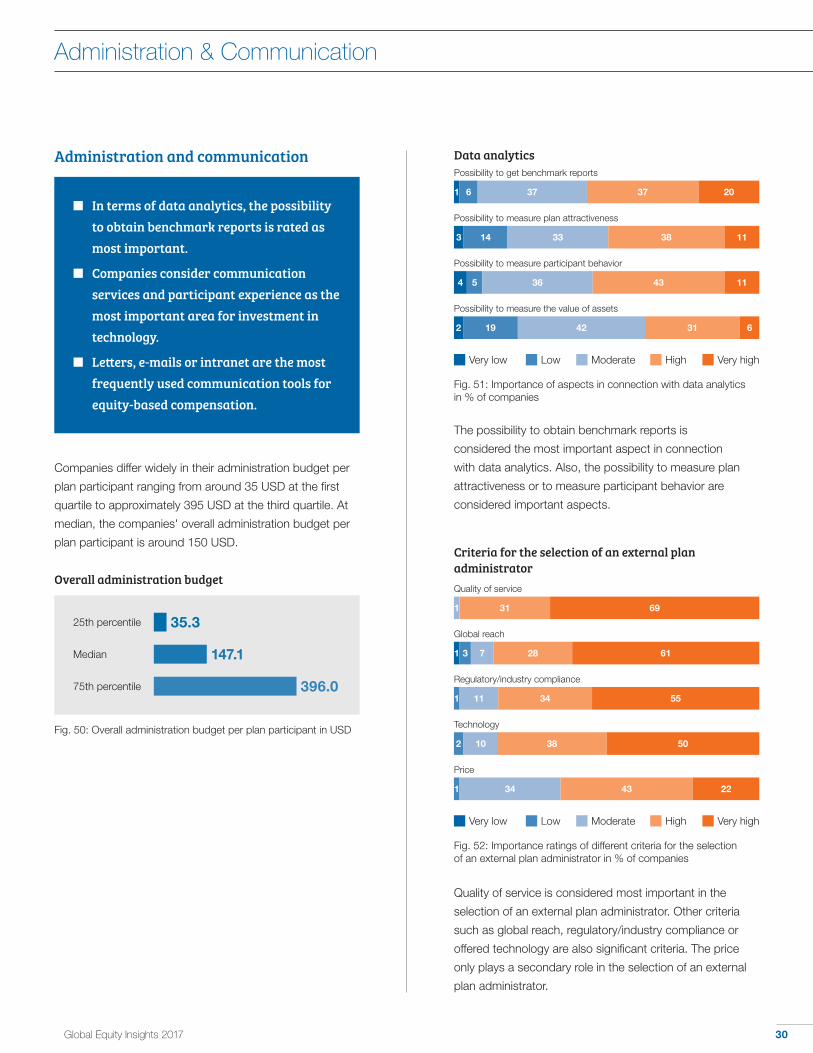
Administration & Communication
The possibility to obtain benchmark reports is
considered the most important aspect in connection
with data analytics. Also, the possibility to measure plan
attractiveness or to measure participant behavior are
considered important aspects.
Administration and communication
■ In terms of data analytics, the possibility to obtain benchmark reports is rated as most important.
■ Companies consider communication services and participant experience as the most important area for investment in technology.
■ Letters, e-mails or intranet are the most frequently used communication tools for equity-based compensation.
Data analyticsPossibility to get benchmark reports
Possibility to measure plan attractiveness
Possibility to measure participant behavior
Possibility to measure the value of assets
Very low Low Moderate High Very high
Fig. 51: Importance of aspects in connection with data analytics in % of companies
3
4
14
5
33
36
38
43
11
11
1 6 37 37 20
2 19 42 31 6
Criteria for the selection of an external plan administratorQuality of service
Global reach
Regulatory/industry compliance
Technology
Very low Low Moderate High Very high
Fig. 52: Importance ratings of different criteria for the selection of an external plan administrator in % of companies
1 31 69
1 3 7 28 61
1 11 34 55
2 10 38 50
1 34 43 22
Price
Quality of service is considered most important in the
selection of an external plan administrator. Other criteria
such as global reach, regulatory/industry compliance or
offered technology are also significant criteria. The price
only plays a secondary role in the selection of an external
plan administrator.
Overall administration budget
25th percentile 35.3
Median 147.1
396.0
Fig. 50: Overall administration budget per plan participant in USD
75th percentile
Companies differ widely in their administration budget per
plan participant ranging from around 35 USD at the first
quartile to approximately 395 USD at the third quartile. At
median, the companies' overall administration budget per
plan participant is around 150 USD.
31Global Equity Insights 2017
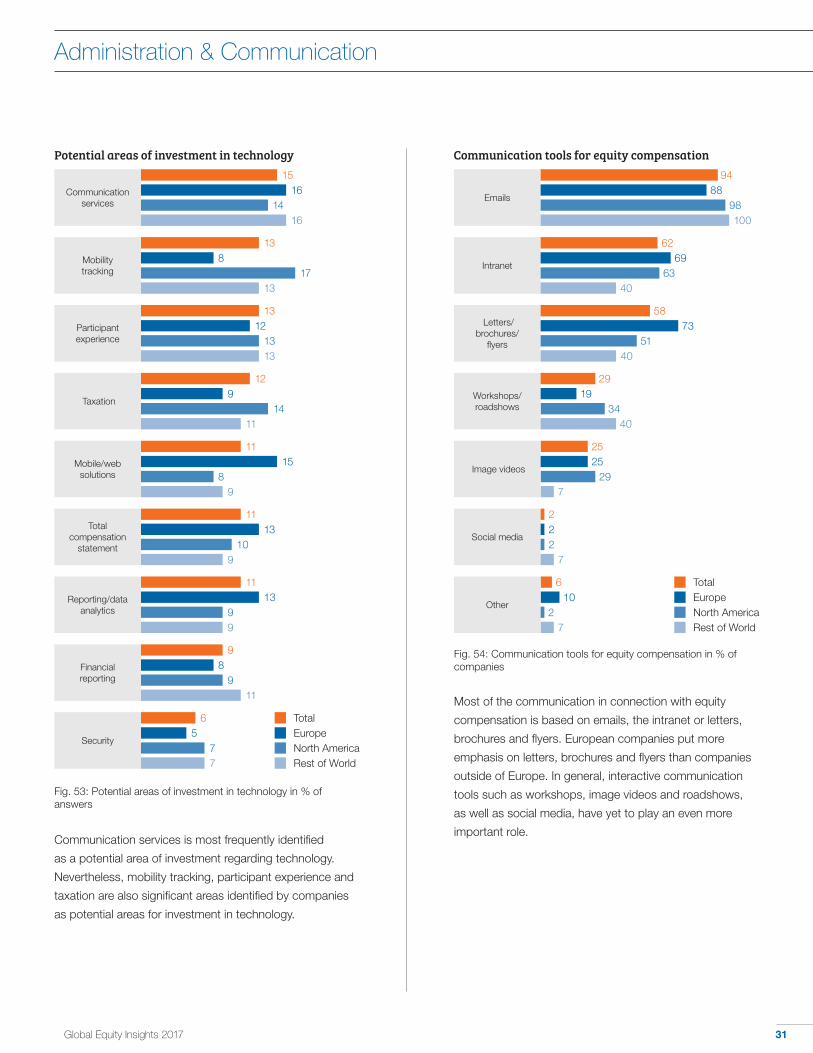
Administration & Communication
Potential areas of investment in technology
Communication services
Participant experience
Taxation
Financial reporting
Security
15
13
12
9
6
16
12
9
8
5
14
13
14
9
7
Fig. 53: Potential areas of investment in technology in % of answers
16
13
11
11
7
TotalEuropeNorth AmericaRest of World
Communication services is most frequently identified
as a potential area of investment regarding technology.
Nevertheless, mobility tracking, participant experience and
taxation are also significant areas identified by companies
as potential areas for investment in technology.
Intranet
Emails
Letters/ brochures/
flyers
Workshops/roadshows
Image videos
Other
94
62
58
29
25
6
88
69
73
19
25
10
98
63
51
34
29
2
Fig. 54: Communication tools for equity compensation in % of companies
100
40
40
40
7
7
TotalEuropeNorth AmericaRest of World
Communication tools for equity compensation
Most of the communication in connection with equity
compensation is based on emails, the intranet or letters,
brochures and flyers. European companies put more
emphasis on letters, brochures and flyers than companies
outside of Europe. In general, interactive communication
tools such as workshops, image videos and roadshows,
as well as social media, have yet to play an even more
important role.
Social media
222
7
Mobility tracking
138
1713
Mobile/web solutions
Total compensation
statement
Reporting/data analytics
11
11
11
15
13
13
8
10
9
9
9
9

32Global Equity Insights 2017
Company success
This report sheds light on the current market practice of
long-term incentives and share purchase plans and reveals
links between plan design and company performance. In
general, we continue to substantiate the findings of our
prior surveys. Participating companies have established a
sound equity culture. This is indicated by the high portion
of long-term incentives in the compensation structure of
executives and by the comparably high prevalence of share
purchase plans. While companies from North America
traditionally have a strong equity culture, companies from
other regions are making considerable effort to catch up.
This development will likely intensify as global competition
for talent increases.
A sophisticated equity culture positively shapes the
performance culture within companies. High performing
companies have higher levels of LTIP eligibility, often
grant higher LTIP portions and have more frequently
implemented a share purchase plan. In addition, high
performing companies more frequently use relative
performance measures than low performing companies.
Hence, a compensation strategy that aims at a deeply
integrated and well-balanced equity culture is a crucial
factor for company success.
Communication is a powerful tool to implement
such a compensation strategy. However, interactive
communication tools such as workshops, image videos,
and roadshows, as well as social media, have yet to play
a more important role in the communication of equity
compensation. The fact that communication services
are considered one of the highest potential areas for
investment in technology shows us that companies already
see room for further improvement in this area.
In conclusion, companies can increase their equity culture
and in turn improve their performance by focusing on three
main factors in their compensation strategy:
Broad-based eligibilty
High portion in the pay structure
Relative performance measures
Increased communication efforts
Long-Term Incentive Plans
■ First, companies should increase both
the portion of LTIP in the compensation
structure and the portion of LTIP-eligible
employees.
■ Second, companies should actively
promote their equity culture by
introducing LTIP on a broad scale as
well as broad SPP. Both LTIP and SPP are
key factors to compete successfully in a
globalized economy.
■ Third, companies should communicate
their LTIP and SPP more intensively.
Intensive communication is key
in making LTIP and SPP more
understandable, increases employee
satisfaction and participation and thus
creates a higher return on the investment
associated with LTIP and SPP.
Conclusion

33Global Equity Insights 2017
Appendix
Survey participants
ABB
Accenture
adidas
Aditya Birla Management
AES
AGL
Allianz
Amazon
Aon
Applied Materials
Arthur J. Gallagher
Aspen Technology
Autoneum Management
Avaya
Averile Ryder Global Reward Specialists
Aviva
Bayer
BENTELER
BHP Billiton
BKW Energie
BMC Software
BMW Group
Boehringer Ingelheim
Bombardier
Booz Allen Hamilton
Boston Scientific
Brambles
Brenntag
Cabot Microelectronics
Cardinal Health
Cargill
Carnival
CBS
CDW
Celesio
CGI
Charles River Laboratories
Citi
Clicks Group
CommScope
Computershare
Conagra Brands
Continental
Costco
Criteo
CSL
Daimler
Danaher
Deutsche Lufthansa
Deutsche Post DHL
Discovery Communications
Eaton
Eli Lilly
Emergence Growth
EOH HCS
Equiniti
Ericsson
Evonik Industries
FedEx Corporation
FICO
Fidelity National Information Services
Finisar
First National Bank
FirstGroup
Franklin Templeton Investments
Fresenius Medical Care
GAM Holding
General Motors
GoDaddy
Halimede
Hansgrohe
Heidelberger Druckmaschinen
Henkel
Hilton Worldwide
Hollard
Hologic
Hortonworks
IDP Education Ltd
Illinois Tool Works
Illumina
Information Services Group
innogy
Invesco
ION Geophysical Corporation
Jazz Pharmaceuticals
Johnson Electric
JPMorgan Chase & Co.
Kimberly-Clark Corporation
Kinross Gold Corporation
L Brands
LANXESS
Leaf Group
Logitech
Lonmin
Maxim Integrated
McCormick & Co.
Mercer
Merck
Microsoft
Moody‘s
MorphoSys
Naspers
NEC
Newell Brands
News Corp
Nike
NN Group
Nokia
Nomura
Novartis
NuVasive
Pacira
Panalpina
Philip Morris International
Qantas Airways
Qualcomm
Red Hat
Royal Philips
Sanlam
Sanofi
Santa Fe Relocation Services
SAP
Schaeffler
Schindler
Scripps Networks Interactive
Seadrill Management
SEEK
SGL Carbon
Shell International
Shiseido
Siemens
Simpson Manufacturing
Solium
Standard Bank Group
Staples
Stepan Company
STMicroelectronics
Sun Life Financial
SunPower Corporation
Swiss Re
Tableau Software
The Coca-Cola Company
The Foschini Group
The Gap
The J.M. Smucker Company
The Priceline Group
ThyssenKrupp
Time
Time Warner
TransUnion
U.S. Bank
UBS
United Technologies
Validus Holdings
Verint Systems
Walmart
Waters
Work Dynamics
Xylem
Yelp
Zurich Insurance

34Global Equity Insights 2017
Danyle Anderson serves as the Executive Director of the Global Equity Organization (GEO), a member-founded and member-driven not-for-profit organization dedicated to advancing knowledge and understanding of equity compensation worldwide through a global community of well-informed professionals.
Prior to joining GEO, Danyle was the Programs Director for the National Association of Stock Plan Professionals (NASPP). Danyle also served as Head of Investor Relations and Shareholder Services for Tech Data Corporation, where she had responsibility for all aspects of the company’s equity plans providing benefits in more than 38 countries. Prior to Tech Data, Danyle was a member of the audit division of Deloitte & Touche LLP.
Danyle holds a Bachelor of Science degree in Accounting from the University of South Florida, is a Certified Public Accountant, a Chartered Global Management Accountant, a Certified Equity Professional, and a member of the Advisory Board of the Certified Equity Professional Institute.
Contact: [email protected]
Danyle Anderson – GEO
In his more than 20 years as a consultant, Michael H. Kramarsch has established himself as one of the most highly regarded experts in corporate governance, performance management, and top executive compensation in German-speaking countries. In 1998, he joined an international HR management consulting firm as Head of Executive Compensation and ultimately gaining responsibility for all of the newly formed company’s business in German-speaking countries in 2005. In 2010, he founded hkp/// group, a consulting firm with focus on performance management, talent management, and compensation.
Michael was a named specialty expert for German regulatory bodies as Governmental Commission on Corporate Governance and the Government Commission German Corporate Governance Code. He is founding member and CEO of the German Association of Independent Compensation Consultants (VUVB) as well as member of the advisory board of HHL Center for Corporate Governance, Leipzig.
His books and other publications on issues of management compensation and corporate governance as well as his public commentary on current developments have underpinned his status as an expert.
Contact: [email protected]
Michael H. Kramarsch – hkp/// group
Editors
Emily Cervino is Vice President at Fidelity Stock Plan Services. Emily has been working in varied roles in the equity compensation industry since 1998 and has a unique appreciation for the opportunities and challenges of equity compensation. At Fidelity Stock Plan Services, Emily focuses on strategic marketing initiatives, thought leadership, and building Fidelity’s strong industry presence.
In her former role as executive director of the Certified Equity Professional Institute (CEPI) at the Santa Clara University, Emily was involved in all aspects of certification, research, and program marketing. In previous roles, Emily managed all the equity compensation programs at National Semiconductor and held various roles at E*TRADE/ShareData.
Emily is a frequent speaker at equity compensation events, past president of the Silicon Valley Chapter of the NASPP, a member of NASPP, GEO, and NCEO, and a 2015 recipient of the NASPP’s Individual Achievement Award. Emily is a Certified Equity Professional (CEP) and she holds Series 7 and 63 securities registrations.
Contact: [email protected]
Emily Cervino – Fidelity
Mitan Patel is Global Sales and Marketing Director at Equatex. He was appointed as Global Sales and Marketing Director of Equatex in April 2016. In this key role he is responsible to strengthen the Equatex teams across key international markets and support the company’s growth ambitions. Mitan has extensive expertise of both broad-based and executive compensation plans on a global basis. He joined from Computershare where he was Business Development Director for Europe.
Mitan brings 15 plus years of experience in the international equity compensation industry and has held senior roles at Computershare, Morgan Stanley and Citi. He has been involved with many industry award-winning equity plans for a number of high profile companies. In July 2016, Mitan was elected as a board member to the Global Equity Organisation “GEO” board of directors. This engagement underpins Equatex’s commitment to play an active role in shaping the future of the compensation and share plan industry.
Contact: [email protected]
Mitan Patel – Equatex

35Global Equity Insights 2017
Editors
Marc Muntermann joined Siemens in October 2011. He holds a graduate degree in vocational studies and economic education from the University of Cologne—where he specialized in the fields of Vocational Education and Corporate Development and Organization—and a Master’s Degree in Business Administration (MBA)—where he specialized in Accounting.
Within Siemens, Marc is leading the Global Share Programs team. In this position he is responsible for the design and administration of all company-wide equity plans. This includes the global Long-Term Incentive and Employee Participation Program that was introduced in 2009 and has been rolled out to 67 countries with 153,000 employees already participating in the plans.
Before joining Siemens, Marc was practice leader in Towers Watson’s Talent & Rewards line of business where he was responsible for Global Data Services and conducted consulting activities with regards to non-executives, executives, executive board, and supervisory board remuneration.
Contact: [email protected]
Marc Muntermann – Siemens
Prof. Dr. Michael Wolff is full professor and holds the Chair of Management and Control at the Georg-August-Universitaet Goettingen, Germany. Before joining the University of Goettingen, he was Professor for Corporate Governance at the University of Mainz and management consultant at McKinsey & Company, Inc. He studied at the University of Frankfurt and holds a doctoral degree from the HHL—Leipzig Graduate School of Management.
Besides aspects of corporate strategy and governance, his main research areas are the design and implementation of incentive systems for executives and employees and their impact on firm behavior and performance. He published several articles in national and international journals with theoretical and practical references to these topics. Moreover, he taught courses on corporate strategy, value-based management, and corporate governance in several graduate, MBA, and PhD programs.
Contact: [email protected]
Michael Wolff – University of Goettingen
Sandra Sussman is a seasoned professional with over 25 years of experience in global equity compensation, global stock plan services management and administration, and legal and corporate governance administration. In her current role at SAP, Sandra shares responsibility for global equity compensation strategy and the design of best-in-class global equity compensation programs to facilitate SAP‘s attraction and retention of key talent. She has played a central role in the implementation, design support, and administration of equity compensation programs in several prior leadership roles, both in-house and with third-party advisors.
Sandra also spent a number of years as Executive Director of the National Association of Stock Plan Professionals (NASPP), overseeing a wide range of initiatives and activities. During that time, she was a co-editor of The Corporate Executive and The Corporate Counsel newsletters, both invaluable resources for securities and tax law, accounting regulations, and interpretations affecting both equity and executive compensation.
Sandra holds a B.A. degree in political science from the University of Virginia, and began her professional career as an active-duty officer in the U.S. Army Transportation Corps. She is a Certified Equity Professional, and an active member of the Global Equity Organization and the National Association of Stock Plan Professionals.
Contact: [email protected]
Sandra Sussman – SAP
Jessica Vinsand is a Total Rewards expert focused on equity compensation strategy and plan design at SAP. In this role, Jessica shares the responsibility for designing best-in-class equity compensation programs for all employees globally to facilitate SAP‘s attraction and retention of key talent in current and future labor markets. She is proud to be a part of the team that designed and implemented Own SAP, for which SAP won the 2016 GEO Award for ‘Most Innovative and Creative Plan Design’.
Prior to joining SAP, Jessica was the Director, Client Solutions at Global Shares. In this role she worked closely with sales and operations to ensure that non-standard client needs were handled effectively and efficiently. Prior to Global Shares, she served as the Customer Service Manager at Equity Administration Solutions, Inc., which is now known as Certent.
Jessica holds a Bachelor of Arts degree in Economics from Mills College in Oakland California, and is a Certified Equity Professional. She contributes to the Certified Equity Professional Institute as a member of the Continuing Education Committee.
Contact: [email protected]
Jessica Vinsand – SAP
36Global Equity Insights 2017
Premium Sponsors
Global Equity Organization (GEO)The Global Equity Organization (GEO) is a member-founded and member-driven not-for-profit organization dedicated to advancing knowledge and understanding of equity and executive compensation worldwide through a global community of well-informed professionals.
GEO provides its members—regardless of location, position, or affiliation—opportunities to share and learn about the strategic, governance, financial, cultural, legal, tax, communication, and administrative issues affecting equity-based employee compensation around the world, from the fundamentals to the latest market intelligence.
GEO was founded in 1999 to support corporate executives and equity compensation professionals dealing with the challenges of creating, managing, and administering employee share plans—large and small, nationally and globally.
GEO has more than 4,500 individual members representing over 1,500 companies and professional firms in more than 60 countries around the world.
hkp/// groupThe hkp/// group is a partner-led, international consulting firm specializing in performance management, talent management, and compensation.
The hkp/// approach to performance management integrates the requirements of financial management and HR strategies. At the same time it connects the performance management requirements at the corporate level with those at individual level. Based consistently on a value- and values-oriented implementation, this approach helps our clients achieve sustainable long-term success.
The hkp/// partners possess many years of international consulting experience. They are recognized experts in the market for compensation, talent, financial, and risk management. In these focus areas, our clients—supervisory boards, top managers, and management boards, as well as specialists—rely on us as a competent partner for value-enhancing, innovative, results-oriented solutions.
hkp/// has a special business unit providing advisory consulting services to executive committees such as supervisory and management boards. Through our work with regulators, banks, and insurances, we have in particular established a leading position in advising financial service companies on performance management and compensation systems.
Fidelity Stock Plan ServicesFidelity is building the FUTURE of Global Service in share plan recordkeeping. With 16 years of experience, market leadership in the U.S.,
and an unprecedented No. 1* rating six years in a row, Fidelity Stock Plan Services has a solid foundation in share plans. Our unwavering
dedication to the share plan industry, and continued investment in products and services, is paving the way toward the future of global
service in share plan recordkeeping.
Global capabilities are a top priority at Fidelity:
§ Full-service global capabilities
§ Multi-currency display offering 98 currency choices
§ European Global Service Center with live language support serving 26 countries
§ Website translation to 11 languages
§ Global Tax Management System enabling global tax compliance
* According to full administration plan sponsors surveyed in the 2011, 2012, 2013, 2014, 2015, and 2016 Group Five Stock Plan Administration Benchmark Studies. Group Five LLC is a business-to-business research and consulting firm in San Anselmo, CA. Group Five LLC and Fidelity Stock Plan Services are not affiliated. 769372.2.0 Fidelity Stock Plan Services, LLC
EquatexEquatex provides global compensation plan management solutions for today’s global enterprise, supporting clients with participants across Europe, Asia, Australia and America. With world-class cloud technologies and market leading financial reporting capabilities, Equatex enables companies to deliver engaging compensation schemes across borders, languages and currencies. Equatex supports over 200 international businesses and their 1.5 million employees, providing customized end-to-end solutions from funding instruments to administration, execution, accounting and financial reporting.
37Global Equity Insights 2017
Premium Sponsors
SiemensSiemens, Berlin and Munich, is a global technology powerhouse that has stood for engineering excellence, innovation, quality, reliability, and internationality for more than 165 years. The company is active in more than 200 countries, focusing on the areas of electrification, automation, and digitalization.
One of the world‘s largest producers of energy-efficient, resource-saving technologies, Siemens is No. 1 in offshore wind turbine construction, a leading supplier of gas and steam turbines for power generation, a major provider of power transmission solutions, and a pioneer in infrastructure solutions as well as automation, drive and software solutions for industry.
The company is also a leading provider of medical imaging equipment—such as computed tomography and magnetic resonance imaging systems—and a leader in laboratory diagnostics as well as clinical IT. In fiscal 2016, which ended on September 30, 2016, Siemens generated revenue from continuing operations of €79.6 billion and net income of €5.6 billion. At the end of September 2016, the company had around 351,000 employees worldwide.
University of GoettingenFounded in 1737, Georg-August-Universitaet Goettingen is a research university of international renown with strong focuses in researchled teaching. The university is distinguished by the rich diversity of its subject spectrum particularly in the humanities, its excellent facilities for the pursuit of scientific research, and the outstanding quality of the areas that define its profile. From 2007 to 2012, Georg-August- Universitaet Goettingen was rewarded funding from the Initiative of Excellence of the German Federal and State Governments with its institutional strategy for the future entitled “Tradition—Innovation—Autonomy”.
The Chair of Management & Control, which is the academic partner of the Global Equity Insights survey, is part of the Faculty of Economic Sciences and the University of Goettingen, and is led by Prof. Dr. Michael Wolff. Based on state-of-art econometric methods, several researchers of the Chair analyze the design and impact of incentive systems of executives and non-executives (e.g. the positive impact of equity compensation on long-term decision and performance). Results of these research activities are published in national and internationals journals with theoretical and practical orientation.
SAPAs market leader in enterprise application software, SAP helps companies of all sizes and industries innovate through simplification. From back office to boardroom, warehouse to storefront, on premise to cloud, desktop to mobile device—SAP empowers people and organizations to work together more efficiently and use business insight more effectively to stay ahead of the competition. SAP applications and services enable customers to operate profitably, adapt continuously, and grow sustainably.
Headquartered in Walldorf, Germany, SAP has locations in more than 130 countries, and 345,000 customers around the world.

38Global Equity Insights 2017
Sponsor
Rutgers University School of Management and Labor RelationsRutgers’ School of Management and Labor Relations (SMLR) is the leading source of expertise on the world of work, building effective and sustainable organizations, and the changing employment relationship. The Fellowship Program in Equity Compensation and Employee Stock Ownership at the School coordinates over 120 scholars at universities throughout the United States and the world studying equity compensation and employee stock ownership plans. The Program sponsors the annual Beyster Symposium and Workshop in honor of Louis O. Kelso, along with the Beyster Fellowships, the Kelso Fellowships, the Fidelity Investments Fellowship in Equity Compensation, and other fellowships. The program awards 10-15 competitive research fellowships to young and emerging scholars annually.
Equatex AG
Vulkanstrasse 106
8048 Zurich
Switzerland
Fidelity Stock Plan Services
200 Seaport Blvd.
Boston, MA 02210
USA
Global Equity Organization
1442 E. Lincoln Ave. #487
Orange, CA 92865
USA
hkp/// group
Tower 185
Friedrich-Ebert-Anlage 35-37
60327 Frankfurt am Main
Germany
SAP SE
Dietmar-Hopp-Allee 16
69190 Walldorf
Germany
Siemens AG
Wittelsbacherplatz 2
80333 Munich
Germany
Georg-August-Universität Göttingen
Platz der Göttinger Sieben 3
37073 Göttingen
Germany
Professor Joseph R. Blasi, Director
Fellowship Program
Rutgers University School of Management and Labor Relations
Janice H. Levin Building
94 Rockafeller Road, Suite 200C
New Brunswick, NJ 08903
design: maks.at, vienna/austria

Global Equity Insights 2017