
GLOBAL ENTREPRENEURSHIP MONITOR - United...
63
Paul D. Reynolds • S. Michael Camp • William D. Bygrave • Erkko Autio • Michael Hay 2001 Executive Report GLOBAL ENTREPRENEURSHIP MONITOR
Transcript of GLOBAL ENTREPRENEURSHIP MONITOR - United...
Paul D.Reynolds • S.Michael Camp • William D.Bygrave • Erkko Autio • Michael Hay
2001 Executive Report
G L O B A L E N T R E P R E N E U R S H I P M O N I T O R

The Business Council for the United Nations welcomes the
third annual Global Entrepreneurship Monitor report. The
GEM report’s groundbreaking research and analysis in an
ever-expanding group of countries around the world
demonstrates the power of entrepreneurship as one of the
most important roads to rapid and substantial economic
development. The Business Council for the UN is pleased
to promote this good work throughout the United Nations
system and our own network of business leaders.
William P. Underwood
Executive Director
Business Council for the United Nations

G l o b a l E n t r e p r e n e u r s h i p M o n i t o r
2001 Executive Report
Paul D. Reynolds
S. Michael Camp
William D. Bygrave
Erkko Autio
Michael Hay

t a b l e o f c o n t e n t st a b l e o f c o n t e n t s
Lists of Tables and Figures . . . . . . . . . . . . . . . . . . . . . . . . . . . . . . . . . . . . . . . . . . . . . . . . . . . . . . . . . . . . 1
GEM 2001 Coordination Team, National Teams and Sponsors . . . . . . . . . . . . . . . . . . . . . . . . . . . . . . . . 2
Executive Summary . . . . . . . . . . . . . . . . . . . . . . . . . . . . . . . . . . . . . . . . . . . . . . . . . . . . . . . . . . . . . . . . . 4
Entrepreneurial Activity . . . . . . . . . . . . . . . . . . . . . . . . . . . . . . . . . . . . . . . . . . . . . . . . . . . . . . . . . . . . . . 6
Entrepreneurial Activity and Economic Growth . . . . . . . . . . . . . . . . . . . . . . . . . . . . . . . . . . . . . . . . . . . . 12
What Makes a Country Entrepreneurial? . . . . . . . . . . . . . . . . . . . . . . . . . . . . . . . . . . . . . . . . . . . . . . . . . 14
Demography: Personal Characteristics . . . . . . . . . . . . . . . . . . . . . . . . . . . . . . . . . . . . . . . . . . . . . . 15
National Characteristics . . . . . . . . . . . . . . . . . . . . . . . . . . . . . . . . . . . . . . . . . . . . . . . . . . . . . . . . . 19
Informal Finance and Venture Capital: A Closer Look . . . . . . . . . . . . . . . . . . . . . . . . . . . . . . . . . . . . . . . 24William D. Bygrave
Research and Technological Development and Entrepreneurial Activity: A Closer Look . . . . . . . . . . . . . 28Erkko Autio and Riikka-Leena Leskelä
Insights . . . . . . . . . . . . . . . . . . . . . . . . . . . . . . . . . . . . . . . . . . . . . . . . . . . . . . . . . . . . . . . . . . . . . . 28
Conclusions . . . . . . . . . . . . . . . . . . . . . . . . . . . . . . . . . . . . . . . . . . . . . . . . . . . . . . . . . . . . . . . . . . . 30
National Assessments: Expert Insights . . . . . . . . . . . . . . . . . . . . . . . . . . . . . . . . . . . . . . . . . . . . . . . . . . 31
Defining the Global Landscape . . . . . . . . . . . . . . . . . . . . . . . . . . . . . . . . . . . . . . . . . . . . . . . . . . . . 31
Patterns Between Countries . . . . . . . . . . . . . . . . . . . . . . . . . . . . . . . . . . . . . . . . . . . . . . . . . . . . . . 32
The State of Entrepreneurship: Country Summaries . . . . . . . . . . . . . . . . . . . . . . . . . . . . . . . . . . . . . . . . 35
Implications for Public Policy . . . . . . . . . . . . . . . . . . . . . . . . . . . . . . . . . . . . . . . . . . . . . . . . . . . . . . . . . . 50
Appendix . . . . . . . . . . . . . . . . . . . . . . . . . . . . . . . . . . . . . . . . . . . . . . . . . . . . . . . . . . . . . . . . . . . . . . . . . 52
Global Entrepreneurship Monitor: The Model and Methodology . . . . . . . . . . . . . . . . . . . . . . . . . . 52
End Notes . . . . . . . . . . . . . . . . . . . . . . . . . . . . . . . . . . . . . . . . . . . . . . . . . . . . . . . . . . . . . . . . . . . . . . . . 55
1
List of Tables
Table 1 . . . . . . Entrepreneurship Motives and Selected Factors
Table 2 . . . . . . Inter-Correlations Among Measures of Entrepreneurial Activity
Table 3 . . . . . . Correlations Between Measures of Entrepreneurial Activity and Economic Growth
Table 4 . . . . . . Educational Attainment and Types of Entrepreneurial Ventures
Table 5 . . . . . . National Background Conditions and Entrepreneurial Activity
Table 6 . . . . . . Intermediate Conditions and Entrepreneurial Activity
Table 7 . . . . . . Short-Term Conditions and Entrepreneurial Activity
Table 8 . . . . . . Correlations Between Entrepreneurial Activity and National Research and
Technological Development Indicators
Table 9 . . . . . . Expert Evaluations: Culture, Financial Support and Government Policy
Table 10 . . . . . Survey Research Firms and Sample Sizes
List of Figures
Figure 1 . . . . . Total Entrepreneurial Activity (TEA) by Country
Figure 2 . . . . . Total Entrepreneurial Activity (TEA) by Global Region
Figure 3 . . . . . Opportunity-Based Entrepreneurial Activity by Country
Figure 4 . . . . . Necessity-Based Entrepreneurial Activity by Country
Figure 5 . . . . . Necessity Entrepreneurship and 2002 Projected Growth in GDP
Figure 6 . . . . . Entrepreneurial Activity by Gender and Age
Figure 7 . . . . . Entrepreneurial Activity by Gender by Country
Figure 8 . . . . . Entrepreneurial Activity by Gender and Educational Attainment
Figure 9 . . . . . Entrepreneurial Activity by Gender and Household Income
Figure 10 . . . . Informal Investment by Country
Figure 11 . . . . Domestic Venture Capital Investment as a Percent of GDP
Figure 12 . . . . Number of Companies Receiving Venture Capital in 2000
Figure 13 . . . . Domestic Venture Capital Invested per Company (US$1,000)
Figure 14 . . . . Total Informal and Venture Capital Investment per Person
Figure 15 . . . . GEM Conceptual Model
l i s t s o f T a b l e s a n d F i g u r e sl i s t s o f T a b l e s a n d F i g u r e s

2
Unit
GEM ProjectDirectors
GEM ProjectCoordinatorGEM CoordinationTeam
Team
Argentina
Australia
Belgium
Brazil
Canada
Denmark
Finland
France
Germany
Hungary
India
Ireland
Institution
Babson College Kauffman Center for Entrepreneurial LeadershipLondon Business School Babson College London Business School Babson College
London Business School
Institution
Center for EntrepreneurshipIAE Business SchoolUniversity AustralAustralian Graduate School of EntrepreneurshipSwinburne University of TechnologyVlerick Leuven Gent Management School
IBQP - PR Instituto Brasileiro daQualidade e Productividade no Paraná
York University and École desHautes Etudes Commerciales de Montreal
University of Southern Denmark
Helsinki University of TechnologyTurku School of Economics andBusiness AdministrationEM Lyon
University of Cologne
University of Pécs
Indian Institute of Management Bangalore
University College, Dublin
Members
William D. Bygrave S. Michael Camp
Michael Hay
Paul D. Reynolds
Paul D. Reynolds William D. BygraveMarcia Cole
Paul D. Reynolds Erkko AutioMichael HaySteven Hunt Paloma Lopez-Garcia Andreas Rauch Isabelle ServaisMichelle HaleNiels Billou, Emily Ng, Congcong Zheng
Members
Silvia Torres CarbonellHector RochaFlorencia RicoKevin HindleSusan RushworthNatalie De BonoSophie ManigartBart ClarysseHans CrijnsHilde GoossensNico VermeirenAnneleen WaterloosLúcio Renato de Fraga BruschMarcos Mueller SchlemmSimara Maria S. S. GrecoMariano de Matos MacedoRaphael ProençaRein PetersonNathaly RiverinAlex GavrilineCarol ChanYasmin GriffithAgustina CochelloMick HancockKim KlyverTorben BagerErkko AutioPia AreniusAnne KovalainenThierry VoleryIsabelle ServaisAurélien EminetMatthieu CabrolRolf SternbergHeiko BergmannChristine TámasyLászlo SerbZoltán AcsAttila VargaJózsef UlbertRitesh DharMathew ManimalaSrinivas PrakhyaPaula FitzsimonsColm O'GormanFrank Roche
Financial Sponsor
Kauffman Center for Entrepreneurial Leadership
IBMThe Laing Family Charitable Settlement
IBM
Financial Sponsor
IAE Business SchoolHSBC Private Equity Latin America
Pacific Access Pty Ltd
Vlerick Leuven Gent Management School
IBQP - PR Instituto Brasileiro daQualidade e Productividade no Paraná SEBRAE- Serviço Brasileiro de Apoioàs Micro e Pequenas EmpresasAnne & Max Tanenbaum Chair inFamily Enterprise; Dean's Office,Schulich School of Business, YorkUniversity; & Ecole des HautesEtudes Commerciales de Montreal
Danish Agency for Trade and IndustryErnst & Young (Denmark)
Ministry of Trade and IndustryTekes, National Technology Agencyof FinlandCaisse des Dépôts et ConsignationsChaire Rodolphe MérieuxEntreprendre
Deutsche Augleichsbank Ernst & YoungImpulse University of PécsMinistry of Economic AffairsUniversity of Baltimore
N.S Raghavan Centre forEntrepreneurial Learning, IIM BangaloreEnterprise Ireland, Forfas
G E M 2 0 0 1 C o o r d i n a t i o n T e a m ,N a t i o n a l T e a m s a n d S p o n s o r sG E M 2 0 0 1 C o o r d i n a t i o n T e a m ,N a t i o n a l T e a m s a n d S p o n s o r s
3
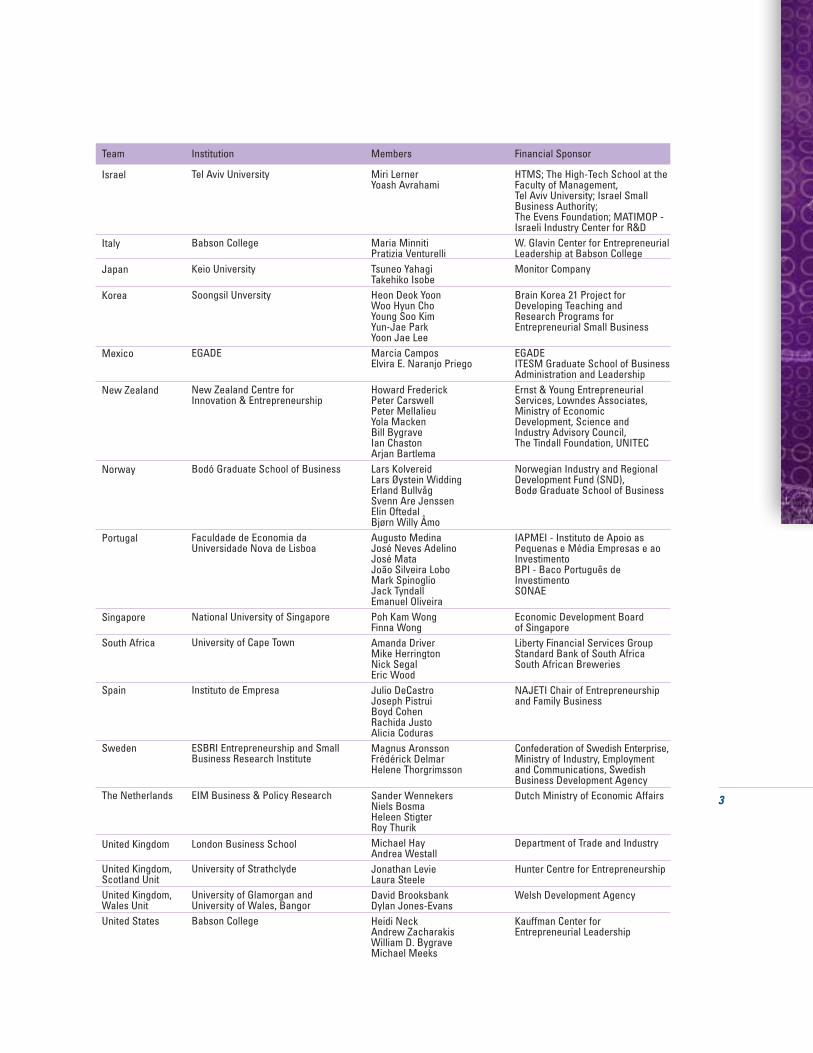
Israel
Italy
Japan
Korea
Mexico
New Zealand
Norway
Portugal
Singapore
South Africa
Spain
Sweden
The Netherlands
United Kingdom
United Kingdom, Scotland UnitUnited Kingdom,Wales UnitUnited States
Tel Aviv University
Babson College
Keio University
Soongsil Unversity
EGADE
New Zealand Centre forInnovation & Entrepreneurship
Bodó Graduate School of Business
Faculdade de Economia daUniversidade Nova de Lisboa
National University of Singapore
University of Cape Town
Instituto de Empresa
ESBRI Entrepreneurship and SmallBusiness Research Institute
EIM Business & Policy Research
London Business School
University of Strathclyde
University of Glamorgan andUniversity of Wales, BangorBabson College
Miri LernerYoash Avrahami
Maria MinnitiPratizia VenturelliTsuneo YahagiTakehiko IsobeHeon Deok YoonWoo Hyun ChoYoung Soo KimYun-Jae ParkYoon Jae LeeMarcia CamposElvira E. Naranjo Priego
Howard FrederickPeter CarswellPeter MellalieuYola MackenBill BygraveIan ChastonArjan BartlemaLars KolvereidLars Øystein WiddingErland BullvågSvenn Are JenssenElin OftedalBjørn Willy ÅmoAugusto MedinaJosé Neves AdelinoJosé MataJoão Silveira LoboMark SpinoglioJack TyndallEmanuel OliveiraPoh Kam WongFinna WongAmanda DriverMike HerringtonNick SegalEric WoodJulio DeCastroJoseph PistruiBoyd CohenRachida JustoAlicia CodurasMagnus AronssonFrédérick DelmarHelene Thorgrimsson
Sander WennekersNiels BosmaHeleen StigterRoy ThurikMichael HayAndrea WestallJonathan LevieLaura SteeleDavid BrooksbankDylan Jones-EvansHeidi NeckAndrew ZacharakisWilliam D. BygraveMichael Meeks
HTMS; The High-Tech School at theFaculty of Management, Tel Aviv University; Israel SmallBusiness Authority; The Evens Foundation; MATIMOP -Israeli Industry Center for R&DW. Glavin Center for EntrepreneurialLeadership at Babson CollegeMonitor Company
Brain Korea 21 Project forDeveloping Teaching and Research Programs forEntrepreneurial Small Business
EGADEITESM Graduate School of BusinessAdministration and LeadershipErnst & Young EntrepreneurialServices, Lowndes Associates,Ministry of Economic Development, Science and Industry Advisory Council, The Tindall Foundation, UNITEC
Norwegian Industry and RegionalDevelopment Fund (SND), Bodø Graduate School of Business
IAPMEI - Instituto de Apoio asPequenas e Média Empresas e aoInvestimentoBPI - Baco Português deInvestimentoSONAE
Economic Development Board of SingaporeLiberty Financial Services Group Standard Bank of South Africa South African Breweries
NAJETI Chair of Entrepreneurshipand Family Business
Confederation of Swedish Enterprise, Ministry of Industry, Employmentand Communications, SwedishBusiness Development AgencyDutch Ministry of Economic Affairs
Department of Trade and Industry
Hunter Centre for Entrepreneurship
Welsh Development Agency
Kauffman Center for Entrepreneurial Leadership
Team Institution Members Financial Sponsor
4
E x e c u t i v e S u m m a r yE x e c u t i v e S u m m a r y
For several years now, evidence has accumulatedthat documents the significant relationship betweenentrepreneurship and national economic adaptationand expansion. As a result, the rate of public and private investments devoted to entrepreneurial activity has exploded in the hopes of acceleratinginnovation, technology development and job creationbenefits. Despite the added attention, however, there have been few systematic cross-national comparisons of the level of entrepreneurship, itsassociation with national economic growth, or thefactors that influence it over time.
The third annual assessment of these issueshas been completed with 29 countries involved in theGlobal Entrepreneurship Monitor (GEM) program.GEM was initiated in 1997 by leading scholars fromBabson College and the London Business School,with strong support from the Kauffman Center forEntrepreneurial Leadership at the Ewing MarionKauffman Foundation in Kansas City, Missouri. IBMbecame a global sponsor for GEM 2001.
In 1999, the first year of the assessment, 10countries participated. Twenty-one countries participated in 2000 and 29 in 2001. The countriesincluded in the 2001 assessment are:
European Region
Belgium, Denmark, Finland, France,
Germany, Hungary, Ireland, Italy,
the Netherlands, Norway, Poland,
Portugal, Russia, Spain, Sweden and
the United Kingdom
Asian Region
India, Japan, Korea and Singapore
Latin American Region
Argentina, Brazil and Mexico
North American Region
Canada and the United States
Other Regions
Australia, Israel, New Zealand
and South Africa
The central aim of GEM is to assemble theworld’s leading scholars to address three compellingquestions:
■ Does the level of entrepreneurial activity varybetween countries?
■ Are the differences in entrepreneurial activityassociated with national economic growth?
■ What national characteristics are related to differences in the level of entrepreneurial activity?
Data were assembled for each participatingcountry from four basic sources: 1) surveys of at least 2,000 adults in each country; 2) in-depth interviews with more than 950 national experts onentrepreneurship; 3) standardized questionnairescompleted by the national experts; and 4) a wideselection of standardized national data.
The key findings from the 2001 assessment are:
■ Entrepreneurship is a global phenomenonwith significant differences betweencountries. About 1.4 billion working-age individuals (20 to 64 years old) live in the 29GEM 2001 countries. Slightly less than 10 percent of these people are, at any point intime, in the process of creating and growingnew businesses. Thus, in the GEM countriesalone, almost 150 million people are engagedin some form of entrepreneurial activity! Andthe level of that activity varies from country tocountry, from a low of approximately 5 percentof the adults in Belgium and Japan to about 18percent in Mexico. In addition, about 3 percentof the adults in the 29 countries have recentlyinvested personal funds into the new businessesof other individuals.
■ Entrepreneurship is a multi-faceted phenomenon. The GEM 2001 assessmentuncovered a dynamic dimension inside entrepreneurial activity. Each respondent wasasked to indicate whether he was starting and growing his business to take advantage of a unique market opportunity (opportunityentrepreneurship) or because it was the bestoption available (necessity entrepreneurship).The average opportunity entrepreneurshipprevalence rate across the 29 GEM countrieswas about 6.5 percent, while the average fornecessity entrepreneurship was 2.5 percent.
5
Four countries ranked highest in opportunity entrepreneurship(in alphabetical order): Australia, Mexico, New Zealand andthe United States. Five countries ranked among the highestgroup for necessity entrepreneurship (in alphabetical order):Brazil, India, Korea, Mexico and Poland. The analysis indicatedthat developing countries generally have a higher prevalencerate for necessity entrepreneurship.
■ The relationship between entrepreneurship and economic growth is complex. The prevalence rate fornecessity entrepreneurship in 2001 was positively associatedwith national economic growth. This association was strongerwhen countries highly dependent on international trade —Belgium, Hungary, Ireland, the Netherlands and Singapore —were excluded. The prevalence rate of opportunity entrepre-neurship, on the other hand, was not associated with anymeasure of national economic growth. Without longitudinaldata it is difficult to unravel the mystery of causality in theserelationships. However, it does appear that in developingcountries, necessity entrepreneurship may have a strongmacro-economic function.
■ Several national contextual factors influence the levelof entrepreneurial activity. Both opportunity and necessity entrepreneurship were higher in countries wherethere was greater income inequality and where the adultsexpected the national economic situation to improve.Opportunity entrepreneurship was higher where there was(a) a reduced national emphasis in manufacturing, (b) lessintrusive government regulations, (c) a higher prevalence ofinformal investors, and (d) a significant level of respect for entrepreneurial activity. Necessity entrepreneurship was higher in countries where (a) economic development was relatively low, (b) the economy was less dependent on international trade, (c) there was not an extensive social welfare system and (d) women were less empowered in the economy.
The policy implications of the findings from the GEM 2001assessment are numerous. Although implementation of any ofthese principles will vary from country to country, several havegeneral applicability.
■ Emphasize economic adaptation as a collective responsibility. Governments at all levels can promote theview that all citizens share responsibility for change in theeconomic system. The greater the proportion of economicactivity conducted in the private sector, the greater the potential for entrepreneurial activity.
■ Enhance education — general and entrepreneurship-specific. A strong commitment to education, both generaland entrepreneurship-specific, is clearly justified across allnational contexts. Not only are those with limited educationless likely to participate in entrepreneurial initiatives, theytend to match their business aspirations to their level of skillsand knowledge. As a consequence, they generally emphasizeless ambitious business activities.
■ Lessen the regulatory burden on new and small firms.The GEM 2001 assessment clearly identified government regulatory burdens as a major deterrent to higher levels ofentrepreneurial activity. Governments should ensure that every aspect of their national economic system is supportiveof entrepreneurship, including reducing and simplifying the regulatory burden, minimizing taxation and lowering non-wagelabor costs.
■ Strike a balance between economic security and self-sufficiency. GEM 2001 revealed a strong negative association between the level and duration of unemploymentbenefits and the prevalence of necessity entrepreneurship.National policy should strive to balance the need to protectthe unemployed with the need to encourage higher levels ofindividual self-sufficiency.
■ Facilitate greater levels of female participation. Womenparticipate in entrepreneurship at about one-half the rate ofmen across all GEM 2001 countries. There is perhaps nogreater initiative a country can take to accelerate its pace of entrepreneurial activity than to encourage more of itswomen to participate.
■ Compensate for gaps in the population age structure.Across the 29 GEM 2001 countries, participation of adults inentrepreneurship is highest between the ages of 25 and 44.Countries with a relative shortage of these mid-career adultsor a projected decline in adults in this age range, particularlymales, should explore ways to encourage their older citizensto become more active in entrepreneurial efforts.
■ Encourage toleration of diversity in personal incomeand wealth. GEM has indicated that greater diversity inhousehold and personal income is consistently associatedwith higher levels of entrepreneurial activity. As long as this diversity reflects appropriate contributions to nationaleconomic growth, governments should ensure that policiesreflect a recognition and acceptance of diversity in wealth.

6
E n t r e p r e n e u r i a l A c t i v i t yE n t r e p r e n e u r i a l A c t i v i t y
The Global Entrepreneurship Monitor (GEM) program was designed to answer threefundamental questions:
■ Does the level of entrepreneurial activityvary between countries, and, if so, by how much?
■ Are the differences in entrepreneurial activity associated with national economicgrowth?
■ What national characteristics are related to differences in entrepreneurial activity?
Data were assembled for each participatingcountry from four basic sources: 1) surveys of atleast 2,000 adults in each country; 2) in-depthinterviews with more than 950 national experts onentrepreneurship; 3) standardized questionnairescompleted by the national experts; and 4) a wideselection of standardized national data. In a trulycollaborative manner, each country was representedby a national team that participated in developmentof the research design, collected all data from the national experts, paid for the adult populationsurveys, contributed to the costs of the coordinationactivity and reviewed the final data sets for errorsand ambiguities.
The total population of the 29 countries participating in GEM 2001 is about 2.5 billion.Approximately 56 percent (1.4 billion) are adults ofworking age. GEM surveyed random samples of atleast 2,000 adults from each participating countryto ascertain several measures of entrepreneurialactivity. From the more than 74,000 surveys conducted with those 18 to 64 years of age,about 10 percent of the adults were engaged inentrepreneurial activities. Results were similar for the 21 countries participating in GEM 2000.This means that in the 29 GEM 2001 countries, at any point in time, approximately 150 millionpeople are involved in starting and growing new firms.
The overall level of entrepreneurial activityfor each country is presented in Figure 1. Thevalue depicted for each country shows the number per every 100 adult individuals who are trying to start a new firm or are the owner/managers of an active business less than 42
months old (i.e., the Total EntrepreneurialActivity Index).1 The vertical bars represent the precision of each estimate based on the size of the sample in each country at the 95 percent confidence interval.
As depicted in Figure 1, the range in prevalence rates represents a four-fold difference from a low of less than 5 percent inBelgium to approximately 18 percent in Mexico.Mexico and New Zealand appear to lead a group of five countries with generally higherprevalence rates than all other GEM 2001 countries. However, the rank order among the five is uncertain since the differences betweenthe countries are not statistically significant.
In Figure 2, the 29 countries are groupedaccording to global region. The 16 Europeancountries plus Israel form one rather homogenousgroup with an average prevalence rate of about 8 percent. The four Asian countries (India, Japan, Korea and Singapore) average about 9percent but with very substantial variation. Thetwo North American countries (Canada and the United States) have an average prevalencerate of approximately 11.3 percent. Three otherformer United Kingdom colonies (Australia, NewZealand and South Africa) average almost 14 percent, and the three Latin American countries(Argentina, Brazil and Mexico) have an averagerate of 14.5 percent. As evident in Figure 2, theNorth American region has the greatest stabilityin prevalence rates followed closely by Europe.Differences between developed and developingcountries appear significant as well.
Twenty-one of the 29 countries studied in2001 were also in the GEM 2000 assessment.Despite economic struggles in many of thesecountries during these two years, a comparison ofthe difference in the Total Entrepreneurial Activity(TEA) shows that the average for these countriesdid not significantly decrease. There was no statistically significant difference in the level ofactivity for 17 countries from 2000 to 2001.However, three countries — Brazil, Norway andthe United States — did experience a significantdecrease in the level of entrepreneurial activity.

7
Total Entrepreneurial Activity (TEA) by CountryTotal Entrepreneurial Activity (TEA) by Country
– Upper
– Average
– Lower
Figure 1Figure 1
Belg
ium
Jap
an
Sin
gapo
re
I
srae
l
The
Net
herla
nds
S
wed
en
Rus
sia
G
erm
any
Por
tuga
l
F
ranc
e
U
nite
d Ki
ngdo
m
Spa
in
De
nmar
k
Nor
way
Fin
land
Sou
th A
frica
Po
land
It
aly
Arge
ntin
a
Cana
da
Indi
a
Hun
gary
U
.S.
Ire
land
Bra
zil
Kore
a
Aus
tralia
N
ew Z
eala
nd
Mex
ico
A
ll Co
untri
es
25.00
20.00
15.00
10.00
5.00
0.00
Pers
ons
per 1
00 A
dults
, 18-
64 Y
rs o
ld (9
5% C
onfid
ence
Inte
rval
)
Total Entrepreneurial Activity (TEA) by Global RegionTotal Entrepreneurial Activity (TEA) by Global Region
Pers
ons
per 1
00 A
dults
, 18-
64 Y
rs o
ld (9
5% C
onfid
ence
Inte
rval
)
– Upper
– Average
– Lower
– Regional Average
Figure 2Figure 2
25.00
20.00
15.00
10.00
5.00
0.00
Belg
ium
Isra
el
The
Net
herla
nds
S
wed
en
Rus
sia
G
erm
any
Por
tuga
l
F
ranc
e
U
nite
d Ki
ngdo
m
Spa
in
De
nmar
k
N
orw
ay
Fi
nlan
d
Pola
nd
Ital
y
Hun
gary
Irel
and
Eur
opea
n Av
erag
e J
apan
S
inga
pore
In
dia
Ko
rea
Asi
an A
vera
ge
Cana
da
U.S
.
Nor
th A
mer
ican
Ave
rage
Sou
th A
frica
Au
stra
lia
New
Zea
land
O
ther
Ave
rage
Arg
entin
a
Br
azil
M
exic
o
Latin
Am
eric
an A
vera
ge

E n t r e p r e n e u r i a l A c t i v i t y
8
About 54 percent (i.e., 80 million people) of those involvedin creating and growing new firms claimed they were pursuing a business opportunity for personal interest, often at the sametime they were working in a regular job. These efforts arereferred to as “opportunity entrepreneurship,” reflecting the voluntary nature of participation. In contrast, about 43 percent(i.e., 63 million people) reported they were involved becausethey had “no better choices for work.” Such efforts are referredto as “necessity entrepreneurship,” reflecting to the individual’s perception that such actions presented the best option availablefor employment but not necessarily the preferred option.
The patterns of participation in opportunity and necessity entrepreneurship varied dramatically across the GEM 2001 countries. The remaining 3 percent (i.e., 4 million people)involved in new business activity reflect other motivations.
The cross-national comparisons for opportunity entrepreneurship are presented in Figure 3. The range of prevalence rates represents more than a six-fold difference,from 2 percent for Israel to 15 percent for New Zealand. There is no statistically significant difference among the top three countries — Australia, Mexico and New Zealand.
Opportunity-Based Entrepreneurial Activity by CountryOpportunity-Based Entrepreneurial Activity by Country
Pers
ons
per 1
00 A
dults
, 18-
64 Y
rs o
ld (9
5% C
onfid
ence
Inte
rval
)
Figure 3Figure 3
– Upper
– Average
– Lower
Isra
el J
apan
Belg
ium
Fran
ce
In
dia
S
inga
pore
Pol
and
Germ
any
R
ussi
a
U
nite
d Ki
ngdo
m
Th
e N
ethe
rland
s
Sp
ain
Swed
en
Po
rtuga
l
Arge
ntin
a
So
uth
Afric
a
Denm
ark
Nor
way
Ca
nada
F
inla
nd
Ital
y
Hun
gary
K
orea
Br
azil
I
rela
nd
U.S.
M
exic
o
Aus
tralia
N
ew Z
eala
nd
Al
l Cou
ntrie
s
18.00
16.00
14.00
12.00
10.00
8.00
6.00
4.00
2.00
0.00
9
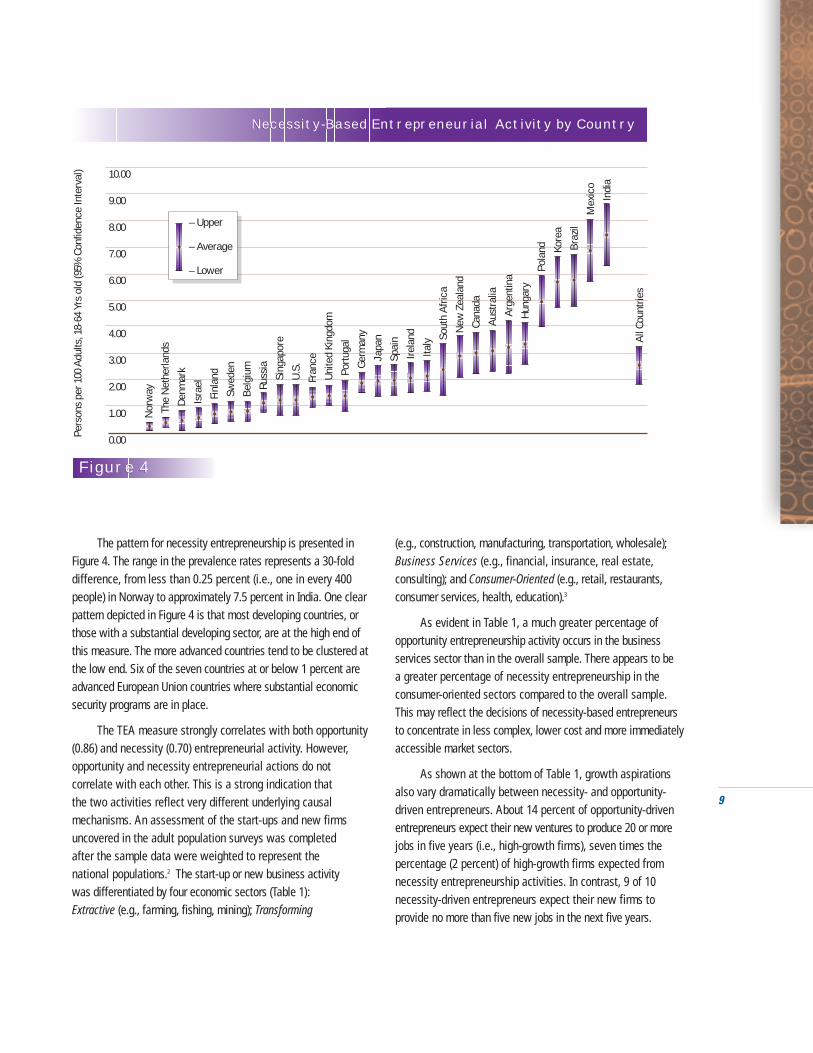
The pattern for necessity entrepreneurship is presented inFigure 4. The range in the prevalence rates represents a 30-folddifference, from less than 0.25 percent (i.e., one in every 400people) in Norway to approximately 7.5 percent in India. One clearpattern depicted in Figure 4 is that most developing countries, orthose with a substantial developing sector, are at the high end ofthis measure. The more advanced countries tend to be clustered atthe low end. Six of the seven countries at or below 1 percent areadvanced European Union countries where substantial economicsecurity programs are in place.
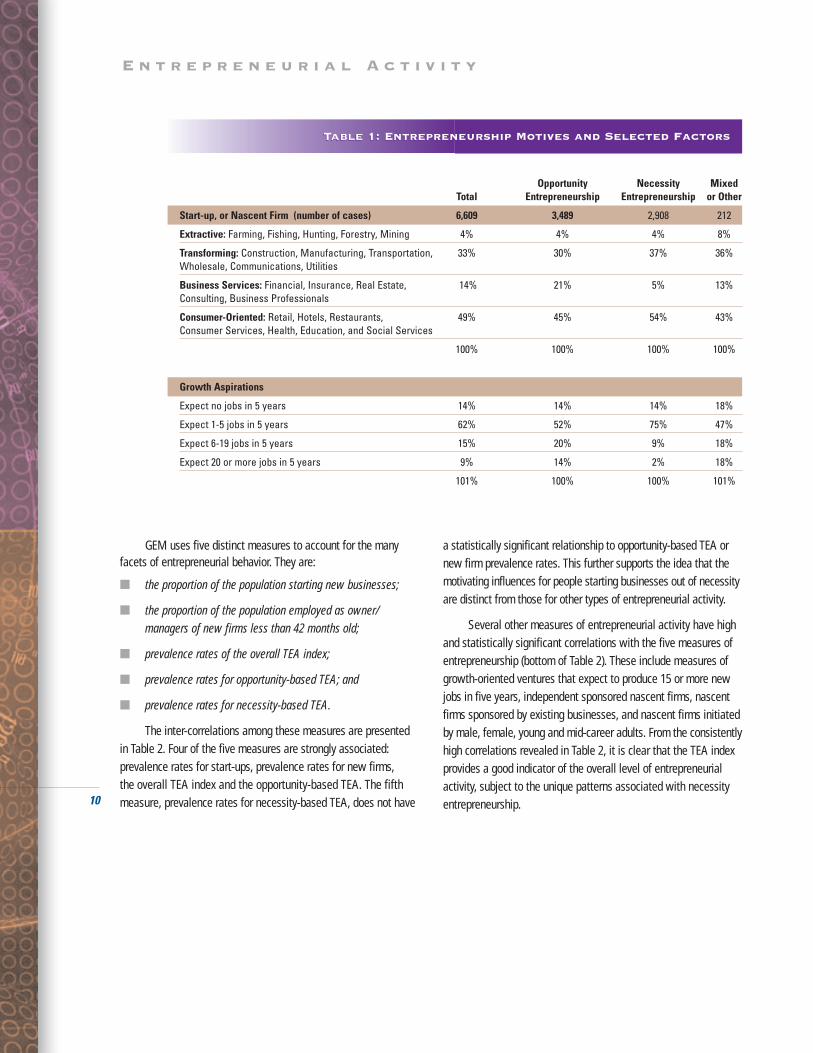
The TEA measure strongly correlates with both opportunity(0.86) and necessity (0.70) entrepreneurial activity. However,opportunity and necessity entrepreneurial actions do not correlate with each other. This is a strong indication that the two activities reflect very different underlying causal mechanisms. An assessment of the start-ups and new firmsuncovered in the adult population surveys was completed after the sample data were weighted to represent the national populations.2 The start-up or new business activity was differentiated by four economic sectors (Table 1): Extractive (e.g., farming, fishing, mining); Transforming
(e.g., construction, manufacturing, transportation, wholesale);Business Services (e.g., financial, insurance, real estate, consulting); and Consumer-Oriented (e.g., retail, restaurants, consumer services, health, education).3
As evident in Table 1, a much greater percentage of opportunity entrepreneurship activity occurs in the business services sector than in the overall sample. There appears to be a greater percentage of necessity entrepreneurship in the consumer-oriented sectors compared to the overall sample. This may reflect the decisions of necessity-based entrepreneurs to concentrate in less complex, lower cost and more immediatelyaccessible market sectors.
As shown at the bottom of Table 1, growth aspirations also vary dramatically between necessity- and opportunity-driven entrepreneurs. About 14 percent of opportunity-drivenentrepreneurs expect their new ventures to produce 20 or more jobs in five years (i.e., high-growth firms), seven times the percentage (2 percent) of high-growth firms expected fromnecessity entrepreneurship activities. In contrast, 9 of 10 necessity-driven entrepreneurs expect their new firms to provide no more than five new jobs in the next five years.
Necessity-Based Entrepreneurial Activity by CountryNecessity-Based Entrepreneurial Activity by Country
Pers
ons
per 1
00 A
dults
, 18-
64 Y
rs o
ld (9
5% C
onfid
ence
Inte
rval
)
Figure 4Figure 4
– Upper
– Average
– Lower
Nor
way
The
Net
herla
nds
D
enm
ark
Isra
el
F
inla
nd
Swed
en
Belg
ium
Russ
ia
Sin
gapo
re
U.S
.
Fran
ce
Uni
ted
King
dom
Portu
gal
Ge
rman
y
Ja
pan
Spai
n
Ir
elan
d
I
taly
So
uth
Afric
a
N
ew Z
eala
nd
C
anad
a
Aust
ralia
Arg
entin
a
Hu
ngar
y
P
olan
d
Kor
ea
Bra
zil
M
exic
o
I
ndia
All
Coun
tries
10.00
9.00
8.00
7.00
6.00
5.00
4.00
3.00
2.00
1.00
0.00
E n t r e p r e n e u r i a l A c t i v i t y
10
GEM uses five distinct measures to account for the manyfacets of entrepreneurial behavior. They are:
■ the proportion of the population starting new businesses;
■ the proportion of the population employed as owner/managers of new firms less than 42 months old;
■ prevalence rates of the overall TEA index;
■ prevalence rates for opportunity-based TEA; and
■ prevalence rates for necessity-based TEA.
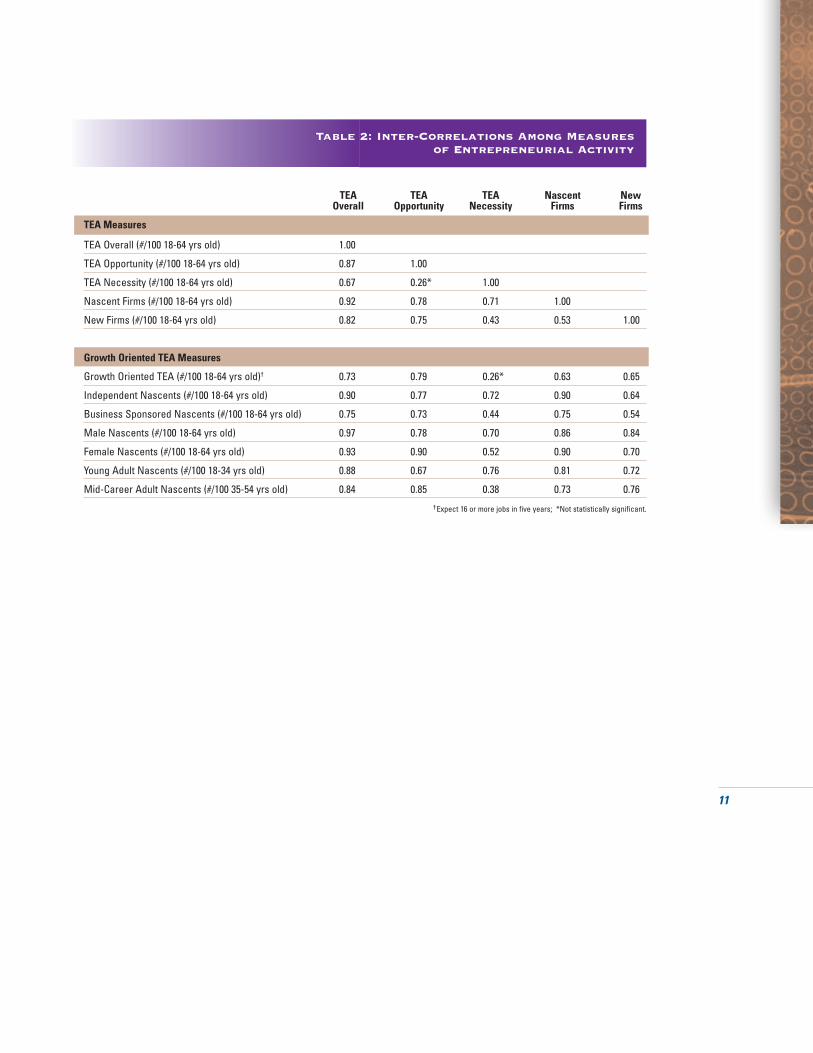
The inter-correlations among these measures are presentedin Table 2. Four of the five measures are strongly associated:prevalence rates for start-ups, prevalence rates for new firms, the overall TEA index and the opportunity-based TEA. The fifth measure, prevalence rates for necessity-based TEA, does not have
a statistically significant relationship to opportunity-based TEA ornew firm prevalence rates. This further supports the idea that themotivating influences for people starting businesses out of necessityare distinct from those for other types of entrepreneurial activity.
Several other measures of entrepreneurial activity have highand statistically significant correlations with the five measures ofentrepreneurship (bottom of Table 2). These include measures ofgrowth-oriented ventures that expect to produce 15 or more newjobs in five years, independent sponsored nascent firms, nascentfirms sponsored by existing businesses, and nascent firms initiatedby male, female, young and mid-career adults. From the consistentlyhigh correlations revealed in Table 2, it is clear that the TEA indexprovides a good indicator of the overall level of entrepreneurialactivity, subject to the unique patterns associated with necessityentrepreneurship.
Table 1: Entrepreneurship Motives and Selected FactorsTable 1: Entrepreneurship Motives and Selected Factors
Opportunity Necessity Mixed Total Entrepreneurship Entrepreneurship or Other
Start-up, or Nascent Firm (number of cases) 6,609 3,489 2,908 212
Extractive: Farming, Fishing, Hunting, Forestry, Mining 4% 4% 4% 8%
Transforming: Construction, Manufacturing, Transportation, 33% 30% 37% 36%Wholesale, Communications, Utilities
Business Services: Financial, Insurance, Real Estate, 14% 21% 5% 13%Consulting, Business Professionals
Consumer-Oriented: Retail, Hotels, Restaurants, 49% 45% 54% 43%Consumer Services, Health, Education, and Social Services
100% 100% 100% 100%
Growth Aspirations
Expect no jobs in 5 years 14% 14% 14% 18%
Expect 1-5 jobs in 5 years 62% 52% 75% 47%
Expect 6-19 jobs in 5 years 15% 20% 9% 18%
Expect 20 or more jobs in 5 years 9% 14% 2% 18%
101% 100% 100% 101%
11
Table 2: Inter-Correlations Among Measuresof Entrepreneurial Activity
Table 2: Inter-Correlations Among Measuresof Entrepreneurial Activity
TEA TEA TEA Nascent New Overall Opportunity Necessity Firms Firms
TEA Measures
TEA Overall (#/100 18-64 yrs old) 1.00
TEA Opportunity (#/100 18-64 yrs old) 0.87 1.00
TEA Necessity (#/100 18-64 yrs old) 0.67 0.26* 1.00
Nascent Firms (#/100 18-64 yrs old) 0.92 0.78 0.71 1.00
New Firms (#/100 18-64 yrs old) 0.82 0.75 0.43 0.53 1.00
Growth Oriented TEA Measures
Growth Oriented TEA (#/100 18-64 yrs old)† 0.73 0.79 0.26* 0.63 0.65
Independent Nascents (#/100 18-64 yrs old) 0.90 0.77 0.72 0.90 0.64
Business Sponsored Nascents (#/100 18-64 yrs old) 0.75 0.73 0.44 0.75 0.54
Male Nascents (#/100 18-64 yrs old) 0.97 0.78 0.70 0.86 0.84
Female Nascents (#/100 18-64 yrs old) 0.93 0.90 0.52 0.90 0.70
Young Adult Nascents (#/100 18-34 yrs old) 0.88 0.67 0.76 0.81 0.72
Mid-Career Adult Nascents (#/100 35-54 yrs old) 0.84 0.85 0.38 0.73 0.76
†Expect 16 or more jobs in five years; *Not statistically significant.
12
E n t r e p r e n e u r i a l A c t i v i t y a n d E c o n o m i c G r o w t hE n t r e p r e n e u r i a l A c t i v i t y a n d E c o n o m i c G r o w t h
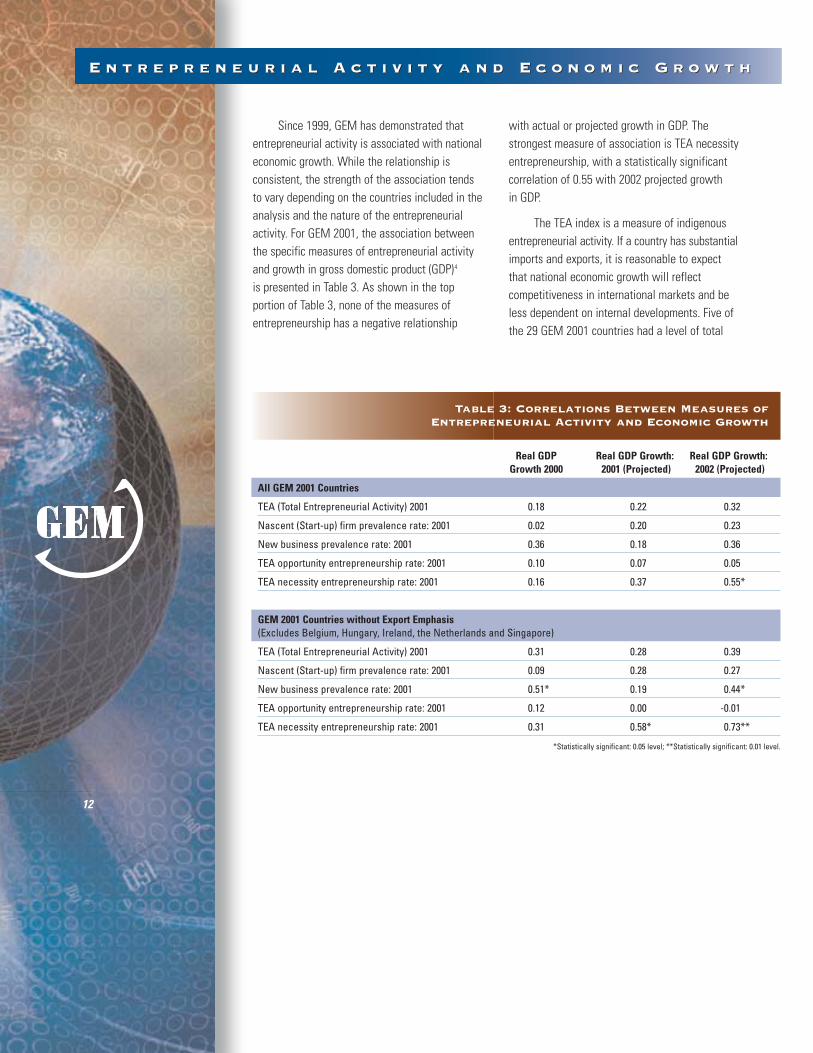
Since 1999, GEM has demonstrated thatentrepreneurial activity is associated with nationaleconomic growth. While the relationship is consistent, the strength of the association tendsto vary depending on the countries included in theanalysis and the nature of the entrepreneurialactivity. For GEM 2001, the association betweenthe specific measures of entrepreneurial activityand growth in gross domestic product (GDP)4
is presented in Table 3. As shown in the top portion of Table 3, none of the measures of entrepreneurship has a negative relationship
with actual or projected growth in GDP. Thestrongest measure of association is TEA necessityentrepreneurship, with a statistically significant correlation of 0.55 with 2002 projected growth in GDP.
The TEA index is a measure of indigenousentrepreneurial activity. If a country has substantialimports and exports, it is reasonable to expectthat national economic growth will reflect competitiveness in international markets and beless dependent on internal developments. Five ofthe 29 GEM 2001 countries had a level of total
Table 3: Correlations Between Measures ofEntrepreneurship and Economic Growth
Table 3: Correlations Between Measures ofEntrepreneurial Activity and Economic Growth
Real GDP Real GDP Growth: Real GDP Growth:Growth 2000 2001 (Projected) 2002 (Projected)
All GEM 2001 Countries
TEA (Total Entrepreneurial Activity) 2001 0.18 0.22 0.32
Nascent (Start-up) firm prevalence rate: 2001 0.02 0.20 0.23
New business prevalence rate: 2001 0.36 0.18 0.36
TEA opportunity entrepreneurship rate: 2001 0.10 0.07 0.05
TEA necessity entrepreneurship rate: 2001 0.16 0.37 0.55*
GEM 2001 Countries without Export Emphasis (Excludes Belgium, Hungary, Ireland, the Netherlands and Singapore)
TEA (Total Entrepreneurial Activity) 2001 0.31 0.28 0.39
Nascent (Start-up) firm prevalence rate: 2001 0.09 0.28 0.27
New business prevalence rate: 2001 0.51* 0.19 0.44*
TEA opportunity entrepreneurship rate: 2001 0.12 0.00 -0.01
TEA necessity entrepreneurship rate: 2001 0.31 0.58* 0.73**
*Statistically significant: 0.05 level; **Statistically significant: 0.01 level.
13
Mexico
Brazil
PolandArgentina
Korea
India
Sweden IsraelFinland
Russia
South Africa
AustraliaCanada New Zealand
Italy and GermanyFrance
U.S.
SpainPortugal and United Kingdom
DenmarkNorway
Japan
Necessity Entrepreneurship and 2002 Projected Growth in GDPNecessity Entrepreneurship and 2002 Projected Growth in GDP
Figure 5Figure 5
TEA
Nec
essi
ty E
ntre
pren
eurs
hip
8.00
7.00
6.00
5.00
4.00
3.00
2.00
1.00
0.00
1.50
1.80
2.10
2.40
2.70
3.00
3.30
3.60
3.90
4.20
4.50
4.80
5.10
5.40
5.70
6.00
2002 Projected Growth in GDP
Non Exportr=0.73 (0.0001)
Ireland
Hungary
Belgium
The Netherlands
Singapore
– Included in the correlationcomputation
– Not included in thecorrelation computation
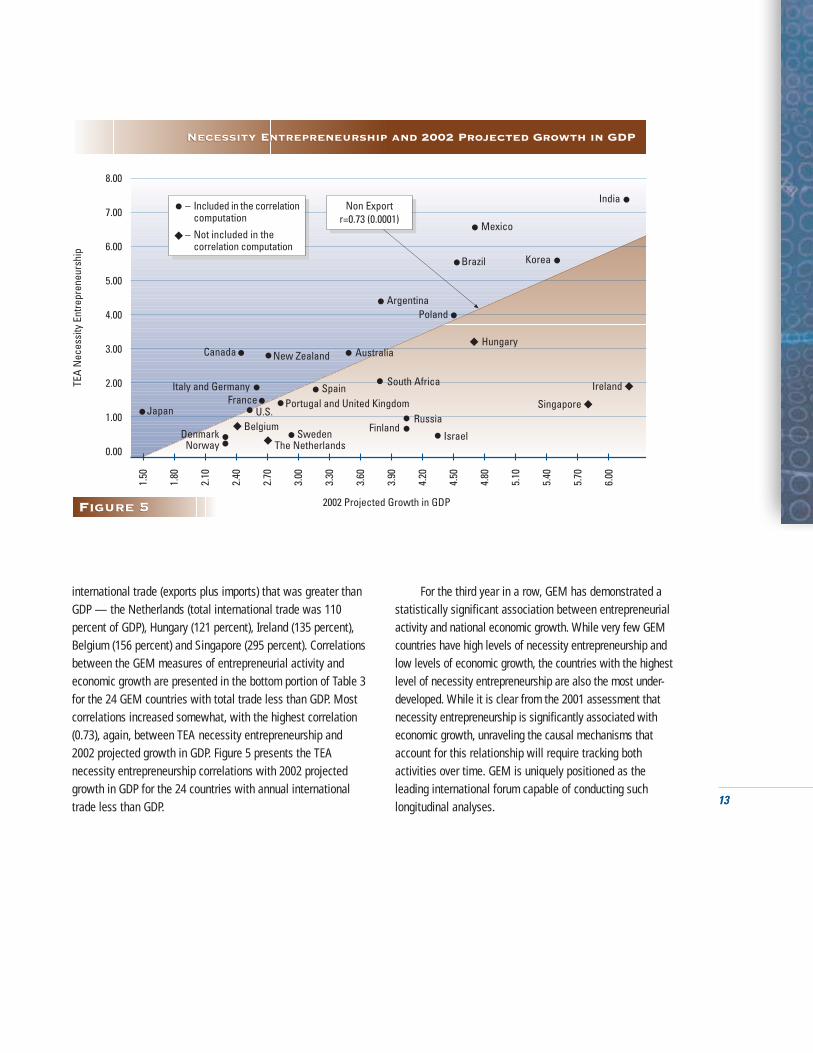
international trade (exports plus imports) that was greater thanGDP — the Netherlands (total international trade was 110 percent of GDP), Hungary (121 percent), Ireland (135 percent),Belgium (156 percent) and Singapore (295 percent). Correlationsbetween the GEM measures of entrepreneurial activity and economic growth are presented in the bottom portion of Table 3for the 24 GEM countries with total trade less than GDP. Mostcorrelations increased somewhat, with the highest correlation(0.73), again, between TEA necessity entrepreneurship and 2002 projected growth in GDP. Figure 5 presents the TEA necessity entrepreneurship correlations with 2002 projectedgrowth in GDP for the 24 countries with annual internationaltrade less than GDP.
For the third year in a row, GEM has demonstrated a statistically significant association between entrepreneurialactivity and national economic growth. While very few GEM countries have high levels of necessity entrepreneurship and low levels of economic growth, the countries with the highestlevel of necessity entrepreneurship are also the most under-developed. While it is clear from the 2001 assessment that necessity entrepreneurship is significantly associated with economic growth, unraveling the causal mechanisms that account for this relationship will require tracking both activities over time. GEM is uniquely positioned as the leading international forum capable of conducting such longitudinal analyses.
t a b l e o f c o n t e n t s
14
W h a t M a k e s a C o u n t r y E n t r e p r e n e u r i a l ?
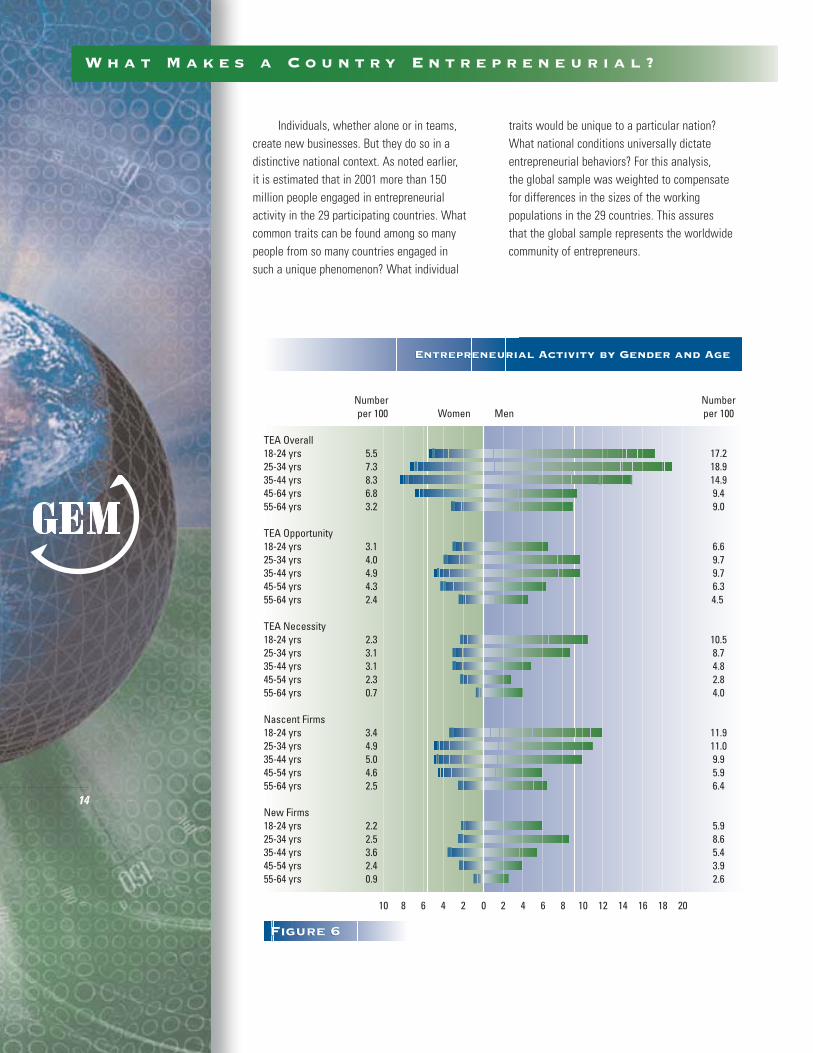
Entrepreneurial Activity by Gender and AgeEntrepreneurial Activity by Gender and Age
Figure 6Figure 6
Number Number per 100 Women Men per 100
TEA Overall18-24 yrs 5.5 17.225-34 yrs 7.3 18.935-44 yrs 8.3 14.945-64 yrs 6.8 9.455-64 yrs 3.2 9.0
TEA Opportunity18-24 yrs 3.1 6.625-34 yrs 4.0 9.735-44 yrs 4.9 9.745-54 yrs 4.3 6.355-64 yrs 2.4 4.5
TEA Necessity18-24 yrs 2.3 10.525-34 yrs 3.1 8.735-44 yrs 3.1 4.845-54 yrs 2.3 2.855-64 yrs 0.7 4.0
Nascent Firms18-24 yrs 3.4 11.925-34 yrs 4.9 11.035-44 yrs 5.0 9.945-54 yrs 4.6 5.955-64 yrs 2.5 6.4
New Firms18-24 yrs 2.2 5.925-34 yrs 2.5 8.635-44 yrs 3.6 5.445-54 yrs 2.4 3.955-64 yrs 0.9 2.6
10 8 6 4 2 0 2 4 6 8 10 12 14 16 18 20
Individuals, whether alone or in teams, create new businesses. But they do so in a distinctive national context. As noted earlier, it is estimated that in 2001 more than 150 million people engaged in entrepreneurial activity in the 29 participating countries. Whatcommon traits can be found among so many people from so many countries engaged in such a unique phenomenon? What individual
traits would be unique to a particular nation?What national conditions universally dictateentrepreneurial behaviors? For this analysis, the global sample was weighted to compensatefor differences in the sizes of the working populations in the 29 countries. This assures that the global sample represents the worldwidecommunity of entrepreneurs.
15
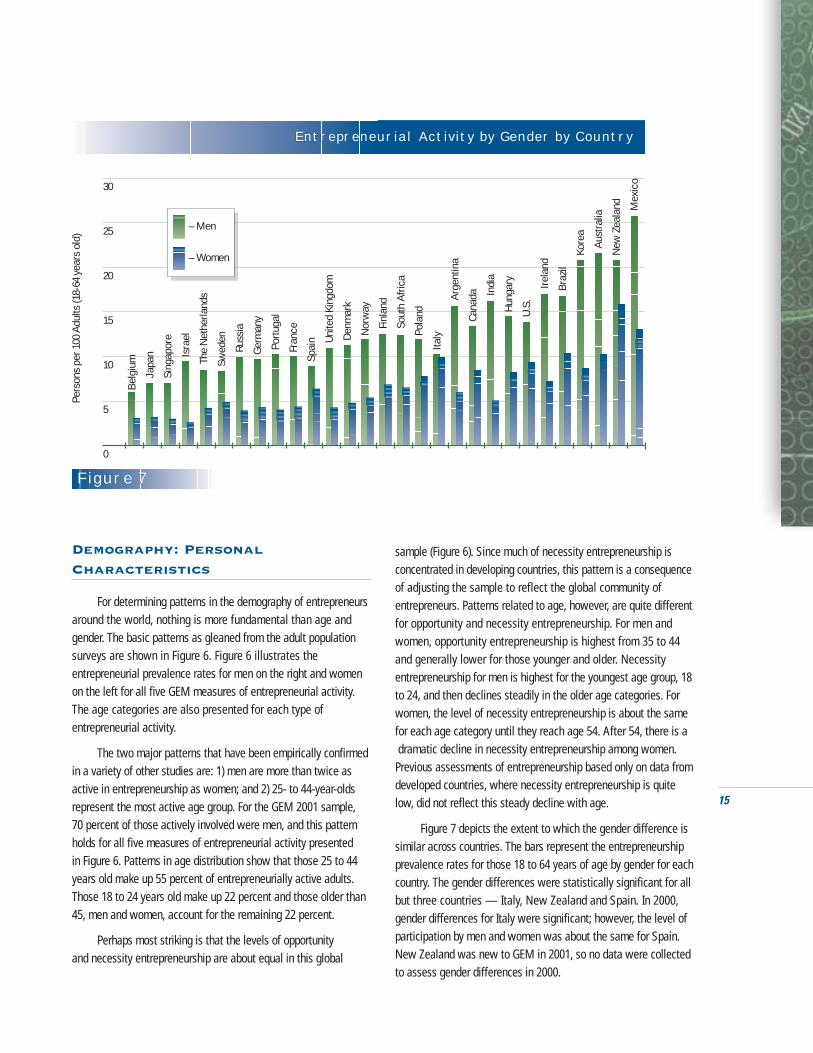
Entrepreneurial Activity by Gender by CountryEntrepreneurial Activity by Gender by Country
Figure 7Figure 7
Pers
ons
per 1
00 A
dults
(18-
64 y
ears
old
)
0
5
10
15
20
25
30
– Men
– Women
Belg
ium
J
apan
S
inga
pore
Isr
ael
T
he N
ethe
rland
s
S
wed
en
R
ussi
a
Ge
rman
y
P
ortu
gal
F
ranc
e
Spai
n
Uni
ted
King
dom
De
nmar
k
N
orw
ay
Fin
land
Sou
th A
frica
P
olan
d
I
taly
Arg
entin
a
C
anad
a
In
dia
Hu
ngar
y
U.S
.
Irel
and
Braz
il
Ko
rea
Aust
ralia
N
ew Z
eala
nd
M
exic
o
Demography: PersonalCharacteristics
For determining patterns in the demography of entrepreneursaround the world, nothing is more fundamental than age andgender. The basic patterns as gleaned from the adult populationsurveys are shown in Figure 6. Figure 6 illustrates theentrepreneurial prevalence rates for men on the right and womenon the left for all five GEM measures of entrepreneurial activity.The age categories are also presented for each type ofentrepreneurial activity.
The two major patterns that have been empirically confirmedin a variety of other studies are: 1) men are more than twice asactive in entrepreneurship as women; and 2) 25- to 44-year-oldsrepresent the most active age group. For the GEM 2001 sample, 70 percent of those actively involved were men, and this patternholds for all five measures of entrepreneurial activity presented in Figure 6. Patterns in age distribution show that those 25 to 44years old make up 55 percent of entrepreneurially active adults.Those 18 to 24 years old make up 22 percent and those older than45, men and women, account for the remaining 22 percent.
Perhaps most striking is that the levels of opportunity and necessity entrepreneurship are about equal in this global
sample (Figure 6). Since much of necessity entrepreneurship isconcentrated in developing countries, this pattern is a consequenceof adjusting the sample to reflect the global community ofentrepreneurs. Patterns related to age, however, are quite differentfor opportunity and necessity entrepreneurship. For men andwomen, opportunity entrepreneurship is highest from 35 to 44 and generally lower for those younger and older. Necessityentrepreneurship for men is highest for the youngest age group, 18to 24, and then declines steadily in the older age categories. Forwomen, the level of necessity entrepreneurship is about the samefor each age category until they reach age 54. After 54, there is adramatic decline in necessity entrepreneurship among women.
Previous assessments of entrepreneurship based only on data fromdeveloped countries, where necessity entrepreneurship is quitelow, did not reflect this steady decline with age.
Figure 7 depicts the extent to which the gender difference issimilar across countries. The bars represent the entrepreneurshipprevalence rates for those 18 to 64 years of age by gender for eachcountry. The gender differences were statistically significant for allbut three countries — Italy, New Zealand and Spain. In 2000,gender differences for Italy were significant; however, the level ofparticipation by men and women was about the same for Spain.New Zealand was new to GEM in 2001, so no data were collectedto assess gender differences in 2000.
W h a t M a k e s a C o u n t r y E n t r e p r e n e u r i a l ?
16
Entrepreneurial Activity by Gender and Educational AttainmentEntrepreneurial Activity by Gender and Educational Attainment
Number Numberper 100 Women Men per 100
TEA OverallGraduate Experience 10.5 11.7Post Secondary 9.5 15.8Secondary Degree 6.0 17.6No Secondary Degree 5.6 10.6
TEA OpportunityGraduate Experience 9.3 9.7Post Secondary 7.2 9.5Secondary Degree 3.6 9.8No Secondary Degree 2.2 3.0
TEA NecessityGraduate Experience 1.1 1.6Post Secondary 1.9 5.8Secondary Degree 2.0 7.3No Secondary Degree 3.3 7.4
Nascent FirmsGraduate Experience 6.3 4.9Post Secondary 4.9 10.0Secondary Degree 4.0 12.0No Secondary Degree 4.0 7.0
New FirmsGraduate Experience 4.2 7.6Post Secondary 5.1 6.2Secondary Degree 2.1 6.1No Secondary Degree 1.7 3.9
10 8 6 4 2 0 2 4 6 8 10 12 14 16 18
Figure 8Figure 8
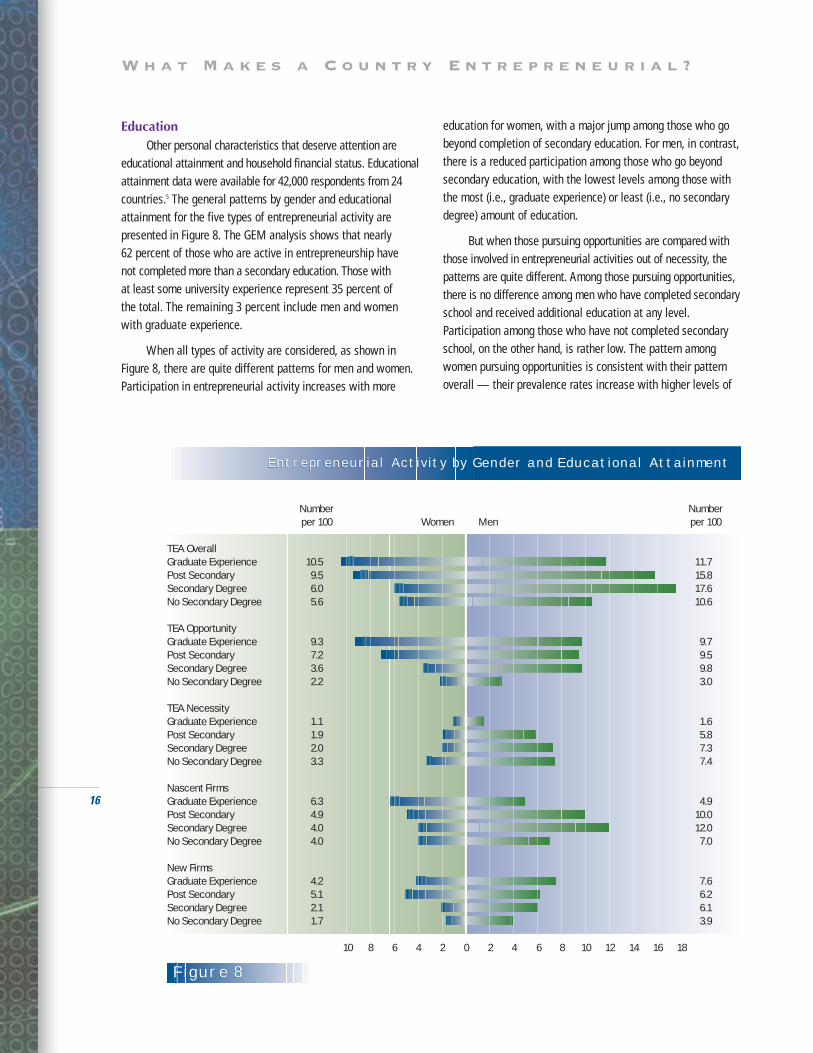
EducationOther personal characteristics that deserve attention are
educational attainment and household financial status. Educationalattainment data were available for 42,000 respondents from 24countries.5 The general patterns by gender and educationalattainment for the five types of entrepreneurial activity are presented in Figure 8. The GEM analysis shows that nearly 62 percent of those who are active in entrepreneurship have not completed more than a secondary education. Those with at least some university experience represent 35 percent of the total. The remaining 3 percent include men and womenwith graduate experience.
When all types of activity are considered, as shown inFigure 8, there are quite different patterns for men and women.Participation in entrepreneurial activity increases with more
education for women, with a major jump among those who gobeyond completion of secondary education. For men, in contrast,there is a reduced participation among those who go beyondsecondary education, with the lowest levels among those withthe most (i.e., graduate experience) or least (i.e., no secondarydegree) amount of education.
But when those pursuing opportunities are compared withthose involved in entrepreneurial activities out of necessity, thepatterns are quite different. Among those pursuing opportunities,there is no difference among men who have completed secondaryschool and received additional education at any level.Participation among those who have not completed secondaryschool, on the other hand, is rather low. The pattern amongwomen pursuing opportunities is consistent with their patternoverall — their prevalence rates increase with higher levels of
17
education. However, the pattern for necessity entrepreneurshipis reversed for both men and women, although the differencesare less dramatic for women (Figure 8).
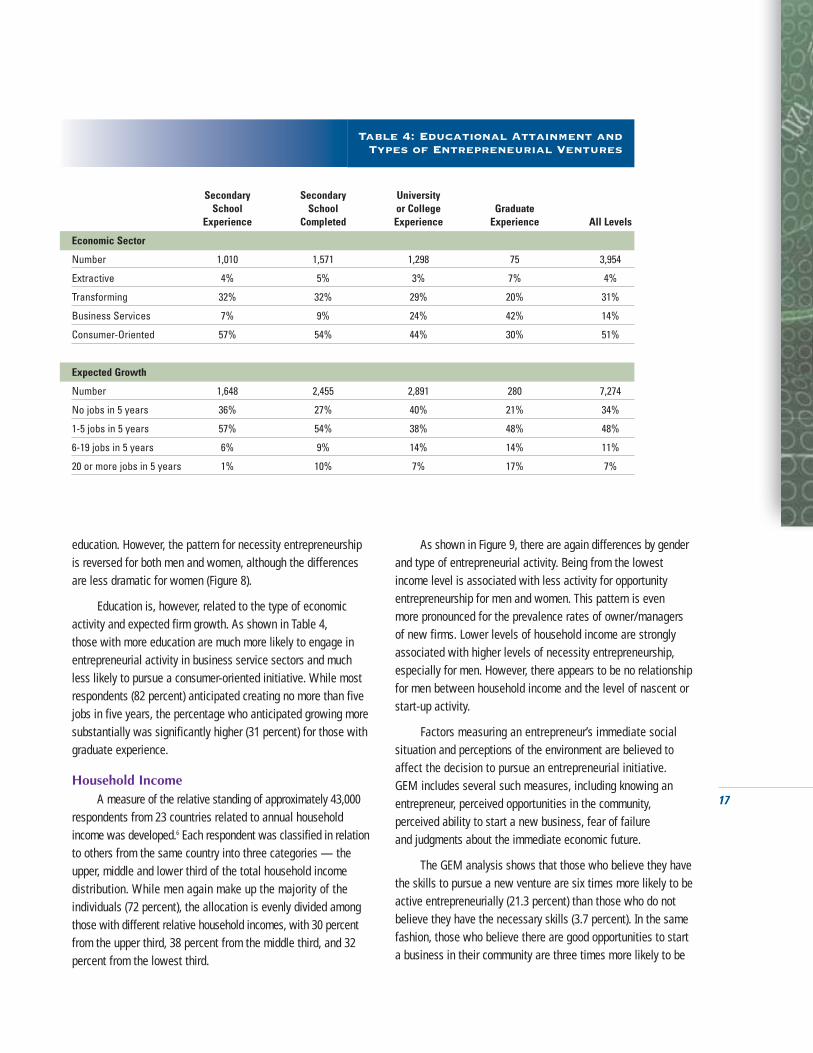
Education is, however, related to the type of economicactivity and expected firm growth. As shown in Table 4, those with more education are much more likely to engage inentrepreneurial activity in business service sectors and muchless likely to pursue a consumer-oriented initiative. While mostrespondents (82 percent) anticipated creating no more than fivejobs in five years, the percentage who anticipated growing moresubstantially was significantly higher (31 percent) for those withgraduate experience.
Household IncomeA measure of the relative standing of approximately 43,000
respondents from 23 countries related to annual householdincome was developed.6 Each respondent was classified in relationto others from the same country into three categories — theupper, middle and lower third of the total household income distribution. While men again make up the majority of theindividuals (72 percent), the allocation is evenly divided amongthose with different relative household incomes, with 30 percentfrom the upper third, 38 percent from the middle third, and 32percent from the lowest third.
As shown in Figure 9, there are again differences by genderand type of entrepreneurial activity. Being from the lowestincome level is associated with less activity for opportunityentrepreneurship for men and women. This pattern is even more pronounced for the prevalence rates of owner/managersof new firms. Lower levels of household income are stronglyassociated with higher levels of necessity entrepreneurship,especially for men. However, there appears to be no relationshipfor men between household income and the level of nascent orstart-up activity.
Factors measuring an entrepreneur’s immediate socialsituation and perceptions of the environment are believed toaffect the decision to pursue an entrepreneurial initiative. GEM includes several such measures, including knowing anentrepreneur, perceived opportunities in the community, perceived ability to start a new business, fear of failure and judgments about the immediate economic future.
The GEM analysis shows that those who believe they havethe skills to pursue a new venture are six times more likely to beactive entrepreneurially (21.3 percent) than those who do notbelieve they have the necessary skills (3.7 percent). In the samefashion, those who believe there are good opportunities to starta business in their community are three times more likely to be
Table 4: Educational Attainment and Types of Entrepreneurial Ventures
Secondary Secondary University School School or College Graduate
Experience Completed Experience Experience All Levels
Economic Sector
Number 1,010 1,571 1,298 75 3,954
Extractive 4% 5% 3% 7% 4%
Transforming 32% 32% 29% 20% 31%
Business Services 7% 9% 24% 42% 14%
Consumer-Oriented 57% 54% 44% 30% 51%
Expected Growth
Number 1,648 2,455 2,891 280 7,274
No jobs in 5 years 36% 27% 40% 21% 34%
1-5 jobs in 5 years 57% 54% 38% 48% 48%
6-19 jobs in 5 years 6% 9% 14% 14% 11%
20 or more jobs in 5 years 1% 10% 7% 17% 7%

W h a t M a k e s a C o u n t r y E n t r e p r e n e u r i a l ?
18
involved in entrepreneurship (21.4 percent) than those who do notbelieve such opportunities exist (7.0 percent). Those who personallyknow an entrepreneur are more than twice as likely to be involvedthemselves (18.7 percent) as those who have no entrepreneuracquaintances (7.7 percent). Those expecting their family’s economic situation to improve in the next year are three timesmore likely to be involved in entrepreneurship (15.0 percent) thanthose expecting their situation to decline (4.5 percent).
While a detailed analysis of the complex interactionsamong these various contextual and background factors isbeyond the scope of this presentation, the joint impact can be dramatic. For example, among those reporting that they have the skills to start a business and consider there to be good business opportunities and expect their family’s economicsituation to improve in the near future, 31 percent are activelyinvolved in entrepreneurship. These individuals represent only 13 percent of the total sample, but 38 percent of all those
entrepreneurially active. In contrast, among those reporting thatthey do not have the skills and do not see good opportunities andexpect their family’s economic situation to decline, 2 percent areinvolved in entrepreneurial activity. These individuals account for5 percent of the total sample, but less than 1 percent of all thoseengaged in any form of entrepreneurship.
GEM has demonstrated decisively that the level of entrepreneurship does vary from country to country. Every country, however, has some level of entrepreneurial activity, no matter how small; one in 20 mid-career adults are involved in the least-active countries. Given the apparent associationbetween entrepreneurship and national economic growth, it isobvious that any study of the entrepreneurial process wouldinclude a detailed look at the national context. Findings from the assessment of the national characteristics of the 29 GEM2001 countries are presented in the next section.
Entrepreneurial Activity by Gender and Household Income
Number Numberper 100 Women Men per 100
TEA OverallUpper third 12.3 17.6Middle third 5.0 17.1Lowest third 4.6 10.0
TEA OpportunityUpper third 8.8 12.5Middle third 3.4 8.6Lowest third 1.8 4.1
TEA NecessityUpper third 3.1 4.4Middle third 1.4 8.3Lowest third 2.7 6.8
Nascent FirmsUpper third 6.0 9.6Middle third 2.8 10.1Lowest third 3.6 8.9
New FirmsUpper third 6.8 8.8Middle third 2.4 7.5Lowest third 1.0 2.4
12 10 8 6 4 2 0 2 4 6 8 10 12 14 16 18
Figure 9Figure 9

19
National Characteristics
The focus of this assessment is to understand more fullyhow different national conditions affect entrepreneurs who create and maintain new businesses. An analysis of context, for simplicity’s sake, requires grouping several factors into threemajor categories delineated by the degree to which they can bemanipulated. The three categories are: 1) basic or backgroundnational conditions, which rarely change over time, 2) intermediateor framework conditions which change slowly over time and 3) the immediate or short-term conditions which can be moreeasily influenced. The assessment is complicated further by thecomplexity of entrepreneurial activity. While the overall TEAindex provides a useful summary measure of entrepreneurialactivity, GEM has demonstrated that opportunity and necessityentrepreneurship are disparate phenomena. Therefore, all
contextual analyses have utilized GEM’s three primary measuresof entrepreneurship. The analyses for each contextual domainare summarized below.
Background ConditionsThe social, cultural and political context of a national
economy usually develops very slowly, requiring a great deal of time for public consensus to emerge regarding acceptableforms of national structures, procedures and values. As a result,it can take decades, if not longer, to establish or change basicconditions. Table 5 presents a series of national features andtheir correlation with the three GEM measures of entrepreneurialactivity. The specific features under review are: the level of economic development; the degree of integration into worldmarkets; the relative emphasis on different economic sectors;the extent to which government programs attempt to insulate
Table 5: National Background Conditionsand Entrepreneurial Activity
Table 5: National Background Conditionsand Entrepreneurial Activity
TEA TEA TEAOverall Opportunity Necessity
Level of Development
GDP Per Capita: 2000 -0.26 0.08 -0.66**
Human Development Indicator: 2000 -0.24 0.10 -0.70**
Integration in World Markets
International Trade as percentage of GDP: 2000 -0.28 -0.15 -0.28
Globalization Index: 2000 -0.40* -0.03 -0.75**
Economic Structure
Agriculture: Percentage of workforce: 1998 0.53** 0.29 0.72**
Manufacturing: Percentage of workforce: 1998 -0.39* -0.42* -0.10
Services: Percentage of workforce: 1998 -0.21 0.00 -0.53**
Extent of Social Benefits/Security Program
Total Social Security Cost as percentage of GDP: 1996 (n=27) -0.43* -0.16 -0.67**
Unemployment benefits as percentage of work salary: 1995 (OECD only, n=16) -0.45 -0.37 -0.50*
Role of Women
Gender Empowerment Measure: Human Development Report 2000 -0.10 0.16 -0.52**
Female/Male Labor Force Participation Ratio: 1999 -0.24 0.00 -0.53**
*Statistically significant: 0.05 level; ** Statistically significant: 0.01 level.

W h a t M a k e s a C o u n t r y E n t r e p r e n e u r i a l ?
20
citizens from economic uncertainty; and the role of women in theeconomy. Because such features take long to establish withinany national context, they are also slow to change, which meansthe extent to which they influence the level of entrepreneurialactivity has significant implications for national public policy.
Measures of economic development include GDP per capitaand the Human Development Index. The Human DevelopmentIndex is a product of the United Nations and is based on acombination of measures related to the health status, educationand living standards in the population.7 As revealed in Table 5,these measures have a dramatic negative relationship with thelevel of necessity entrepreneurship. In other words, countrieswith higher levels of economic development generally have alower prevalence of necessity entrepreneurship.
A second important national feature is the extent to whichcountries are involved in international trade. Two indicators ofinternational trading activity are assessed: 1) total internationaltrade as a percent of GDP, which proved not to be significant(Table 5) and 2) the A.T. Kearny/Foreign Policy MagazineGlobalization Index™. The Globalization Index is computed by aweighted combination of measures of international trade, theinflow and outflow of capital, personal contacts with outsidersand the Internet capacity of the country.8 This index, which hasbeen reversed so that large numbers reflect higher levels ofglobalization, also has a consistent negative relationship withentrepreneurial activity. In other words, countries that are wellintegrated into the global trading economy have much lower levels of necessity entrepreneurship.
A third national feature of importance is the economicstructure of the host economy. One structural measure is thepercentage of the workforce employed in three economic sectors— agriculture, manufacturing and services.9 There is a clear pattern among the GEM 2001 countries in this regard, with asignificant positive relationship between the level of the work-force employed in agriculture and necessity entrepreneurship. In sharp contrast, there is a significant negative relationshipbetween the proportion of the workforce in manufacturing andall three measures of entrepreneurship. The proportion of thelabor force in the services sector is also negatively associatedwith the level of necessity entrepreneurship.
Most modern societies have developed a range of programsto provide economic security for their citizens. This includes publicprograms designed to provide retirement support, health care andunemployment benefits. The cost of such benefits, as a percentof GDP, provides one measure of the state’s willingness to reduceambiguity and uncertainty in the economic life of its citizens.Such a measure for 1996 is available for all but one of the GEM
2001 countries; the range is from 2 percent of GDP for India to 34 percent for Sweden.10 A measure of the munificence of unemployment payment schemes is available for 16 OCED countries from 1995.11 The “gross replacement rate” is an estimate of the percentage of full-time wages available to the unemployed and ranges from 21 percent for the UnitedKingdom to 77 percent for Sweden. As shown in Table 5, the higher the level of national spending on economic security and unemployment benefits, the lower the level of all forms ofentrepreneurial activity.
An additional important feature of the GEM 2001 countriesis the role of women in the national economy measured by (a) a Gender Empowerment Measure developed with the UnitedNations Human Development Report12 and (b) the female-to-maleratio in the labor force. The latter measure was provided for 1990and 1999 as part of the World Bank Development Indicators13.During the 1990s, only 10 of 29 GEM 2001 countries reflected anychange in the female-to-male ratio in the labor force, and noneincreased by more than 10 percent. Both measures reflect themore advantaged status of women in more developed countries,particularly northern Europe, where there are higher levels offemale participation in the labor force but less indigenous entrepreneurial activity. The significant negative correlationswith necessity entrepreneurship suggest that in countries wherewomen are more active in the labor force the level of necessityentrepreneurship is lower.
Intermediate ConditionsIntermediate conditions consist of several national
framework features that can be influenced to produce a more positive climate for entrepreneurship. General frameworkconditions organized for the annual Global CompetitivenessReport sponsored by the World Economic Forum include thenewly developed Current Competitive Index and the GrowthCompetitive Index14. Other more direct measures of intermediateconditions include the government’s presence in the nationaleconomy, the costs associated with registering a new business,measures of household income disparity (income inequality) andthe availability of venture financing. Correlations between theseindices and the prevalence rates for TEA Overall, TEA Opportunityand TEA Necessity are presented in Table 6.
The global competitiveness indices are complex multi-itemmeasures based on combinations of harmonized national data andresponses by business executives to standardized questionnaires.The indices are refined and adjusted to maximize the associationwith per capita income. Historically, correlations between theindices and measures of economic growth have been stronglynegative. This may well reflect the fact that less developed
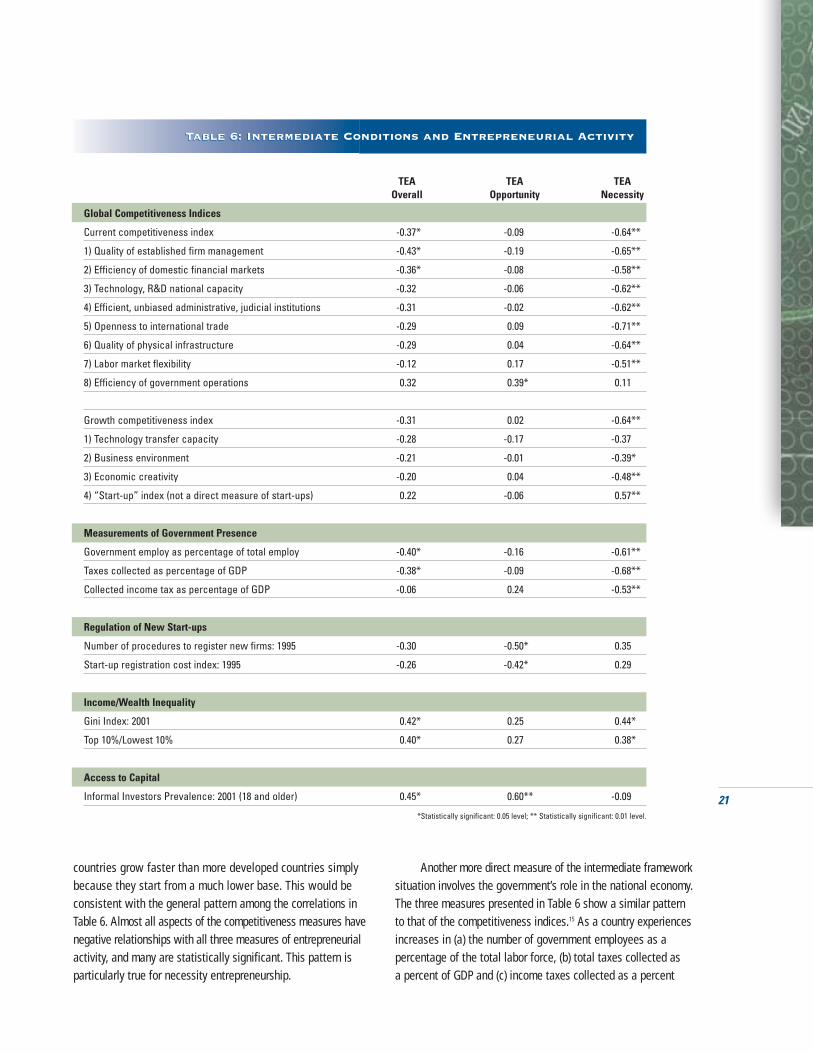
21
countries grow faster than more developed countries simplybecause they start from a much lower base. This would beconsistent with the general pattern among the correlations inTable 6. Almost all aspects of the competitiveness measures havenegative relationships with all three measures of entrepreneurialactivity, and many are statistically significant. This pattern isparticularly true for necessity entrepreneurship.
Another more direct measure of the intermediate frameworksituation involves the government’s role in the national economy.The three measures presented in Table 6 show a similar patternto that of the competitiveness indices.15 As a country experiencesincreases in (a) the number of government employees as a percentage of the total labor force, (b) total taxes collected as a percent of GDP and (c) income taxes collected as a percent
Table 6: Intermediate Conditions and Entrepreneurial ActivityTable 6: Intermediate Conditions and Entrepreneurial Activity
TEA TEA TEAOverall Opportunity Necessity
Global Competitiveness Indices
Current competitiveness index -0.37* -0.09 -0.64**
1) Quality of established firm management -0.43* -0.19 -0.65**
2) Efficiency of domestic financial markets -0.36* -0.08 -0.58**
3) Technology, R&D national capacity -0.32 -0.06 -0.62**
4) Efficient, unbiased administrative, judicial institutions -0.31 -0.02 -0.62**
5) Openness to international trade -0.29 0.09 -0.71**
6) Quality of physical infrastructure -0.29 0.04 -0.64**
7) Labor market flexibility -0.12 0.17 -0.51**
8) Efficiency of government operations 0.32 0.39* 0.11
Growth competitiveness index -0.31 0.02 -0.64**
1) Technology transfer capacity -0.28 -0.17 -0.37
2) Business environment -0.21 -0.01 -0.39*
3) Economic creativity -0.20 0.04 -0.48**
4) “Start-up” index (not a direct measure of start-ups) 0.22 -0.06 0.57**
Measurements of Government Presence
Government employ as percentage of total employ -0.40* -0.16 -0.61**
Taxes collected as percentage of GDP -0.38* -0.09 -0.68**
Collected income tax as percentage of GDP -0.06 0.24 -0.53**
Regulation of New Start-ups
Number of procedures to register new firms: 1995 -0.30 -0.50* 0.35
Start-up registration cost index: 1995 -0.26 -0.42* 0.29
Income/Wealth Inequality
Gini Index: 2001 0.42* 0.25 0.44*
Top 10%/Lowest 10% 0.40* 0.27 0.38*
Access to Capital
Informal Investors Prevalence: 2001 (18 and older) 0.45* 0.60** -0.09
*Statistically significant: 0.05 level; ** Statistically significant: 0.01 level.

W h a t M a k e s a C o u n t r y E n t r e p r e n e u r i a l ?
22
of GDP, the level of entrepreneurial activity declines. As the government’s role increases, the scope of economic activityavailable for private initiatives is reduced, and fewer individualswill have the skills or motivation to create new businesses.
Measures of the costs involved in formally registering anew business have a negative relationship with the level ofentrepreneurial activity.16 Whether a simple count of the numberof procedures or an index based on procedures, time requiredand financial costs is utilized, the negative association withopportunity entrepreneurship is statistically significant. Thisresult suggests that in countries where the time and costs toregister a new business are high, opportunity entrepreneurshipwill be lower.
Income disparity or inequality tends to be higher in lessdeveloped countries, where there are also higher levels ofnecessity entrepreneurship. Two measures of income inequality17
are presented in Table 6: 1) the Gini Index, which measuresdeviations from perfect equality of income distribution and 2) the
total income of the top 10 percent of the households as a ratio of the total income of the bottom 10 percent. Both reflect significantpositive relationships (0.40 and above) with entrepreneurial activity.In other words, the greater the income disparity in a country, thehigher the level of entrepreneurial activity.
Developing and implementing a new business requiresresources. Financial resources and the ability of the entrepreneurialcommunity to access them are particularly important. For purposesof understanding the influence of intermediate contextual conditions, this assessment examined the prevalence rates ofinformal financial contributions provided by the family, friendsand associates (i.e., business angels) of the individuals initiatingnew businesses. The association of these financial flows with the level of entrepreneurial activity is presented in Table 6. Theprevalence rate of informal investors has a statistically significantpositive association with the overall level of entrepreneurialactivity and a stronger relationship with the level of opportunityentrepreneurship. In other words, in countries where the general
TEA TEA TEAOverall Opportunity Necessity
Perception of Opportunity
Adult survey: % yes business opportunity: 1999 (n=10) 0.79** 0.74** 0.02
Adult survey: % yes business opportunity: 2000 (n=21) 0.21 0.40* -0.05
Adult survey: % yes business opportunity: 2001 (n=29) 0.25 0.48** -0.16
Potential for Entrepreneurial Activities
Adult survey: Skills for Start-up: % yes: 2001 (n=29) 0.65** 0.73** 0.27
Expert ratings index: Business mgt potential: 2001 (n=26) 0.32 0.38* 0.10
Adult survey: Know an entrepreneur: % yes 2000 (n=20) 0.35 0.57** -0.20
Adult survey: Know an entrepreneur: % yes 2001 (n=29) 0.34 0.59* -0.24
Motivation to be an Entrepreneur
Adult survey: Fear of failure: % no: 2000 (n=21) -0.16 -0.40* 0.22
Adult survey: Fear of failure: % no: 2001 (n=29) -0.01 -0.09 0.17
Expert ratings index: Acceptance of career turbulence: 2001 (n=26) 0.12 0.33 -0.30
Adult survey: Family economic future better: % 2001 (n=29) 0.44** 0.38* 0.31
Adult survey: Country economic future better: % 2001 (n=29) 0.24 0.12 0.39*
*Statistically significant: 0.05 level, **Statistically significant: 0.01 level.
Table 7: Short-Term Conditions and Entrepreneurial ActivityTable 7: Short-Term Conditions and Entrepreneurial Activity
23
population is investing more personal funds in new businessventures, the level of opportunity-driven entrepreneurial activityis significantly higher.
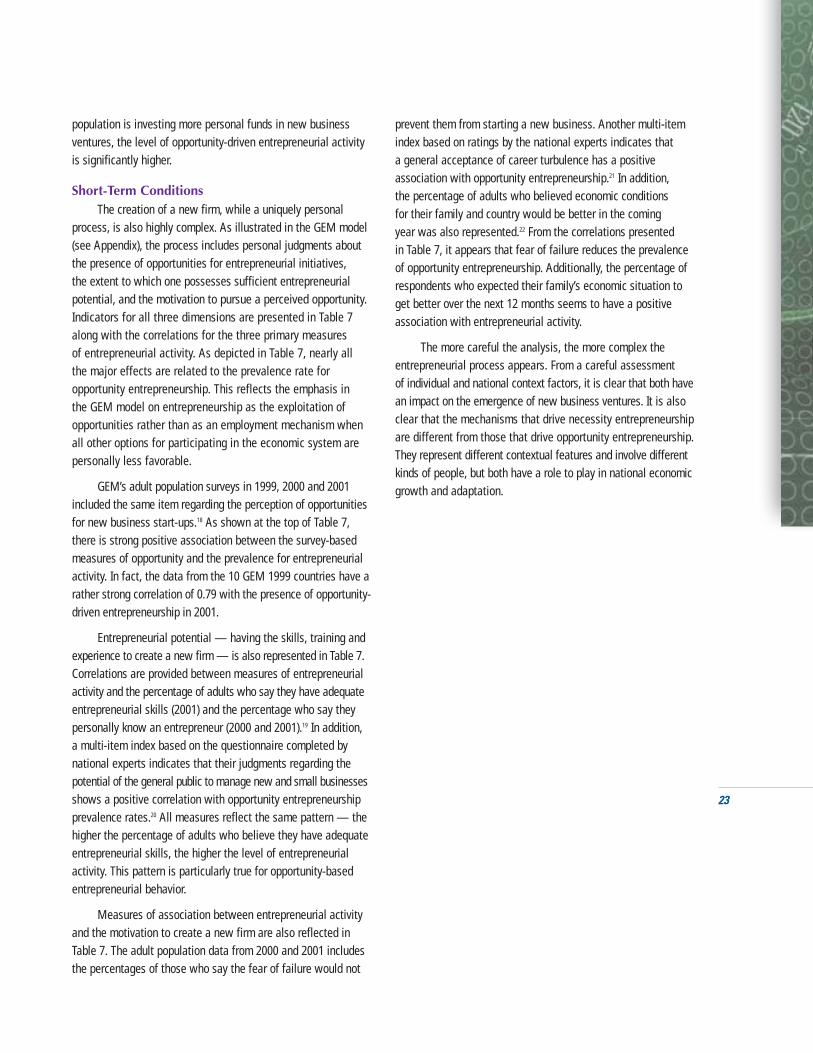
Short-Term ConditionsThe creation of a new firm, while a uniquely personal
process, is also highly complex. As illustrated in the GEM model(see Appendix), the process includes personal judgments aboutthe presence of opportunities for entrepreneurial initiatives, the extent to which one possesses sufficient entrepreneurialpotential, and the motivation to pursue a perceived opportunity.Indicators for all three dimensions are presented in Table 7along with the correlations for the three primary measures of entrepreneurial activity. As depicted in Table 7, nearly all the major effects are related to the prevalence rate for opportunity entrepreneurship. This reflects the emphasis in the GEM model on entrepreneurship as the exploitation ofopportunities rather than as an employment mechanism whenall other options for participating in the economic system arepersonally less favorable.
GEM’s adult population surveys in 1999, 2000 and 2001included the same item regarding the perception of opportunitiesfor new business start-ups.18 As shown at the top of Table 7,there is strong positive association between the survey-basedmeasures of opportunity and the prevalence for entrepreneurialactivity. In fact, the data from the 10 GEM 1999 countries have arather strong correlation of 0.79 with the presence of opportunity-driven entrepreneurship in 2001.
Entrepreneurial potential — having the skills, training andexperience to create a new firm — is also represented in Table 7.Correlations are provided between measures of entrepreneurialactivity and the percentage of adults who say they have adequateentrepreneurial skills (2001) and the percentage who say theypersonally know an entrepreneur (2000 and 2001).19 In addition, a multi-item index based on the questionnaire completed bynational experts indicates that their judgments regarding thepotential of the general public to manage new and small businessesshows a positive correlation with opportunity entrepreneurshipprevalence rates.20 All measures reflect the same pattern — thehigher the percentage of adults who believe they have adequateentrepreneurial skills, the higher the level of entrepreneurialactivity. This pattern is particularly true for opportunity-basedentrepreneurial behavior.
Measures of association between entrepreneurial activityand the motivation to create a new firm are also reflected inTable 7. The adult population data from 2000 and 2001 includesthe percentages of those who say the fear of failure would not
prevent them from starting a new business. Another multi-itemindex based on ratings by the national experts indicates that a general acceptance of career turbulence has a positive association with opportunity entrepreneurship.21 In addition, the percentage of adults who believed economic conditions for their family and country would be better in the coming year was also represented.22 From the correlations presented in Table 7, it appears that fear of failure reduces the prevalenceof opportunity entrepreneurship. Additionally, the percentage ofrespondents who expected their family’s economic situation toget better over the next 12 months seems to have a positiveassociation with entrepreneurial activity.
The more careful the analysis, the more complex theentrepreneurial process appears. From a careful assessment of individual and national context factors, it is clear that both havean impact on the emergence of new business ventures. It is alsoclear that the mechanisms that drive necessity entrepreneurshipare different from those that drive opportunity entrepreneurship.They represent different contextual features and involve differentkinds of people, but both have a role to play in national economicgrowth and adaptation.

24
I n f o r m a l F i n a n c e a n d V e n t u r e C a p i t a l : A C l o s e r L o o k
Some of the most striking findings from the GEM adult population surveys are the overalldegree to which people informally invest in entrepreneurship throughout the world and thehigh level of variation in this activity betweencountries. As depicted in Figure 10, the overallprevalence rate of informal investors 18 and olderamong GEM 2001 countries is 3.1 percent. Thepercentage ranges from 0.9 percent in Brazil to6.2 percent in New Zealand, more than a six-folddifference. Based on population counts, it is estimated that informal investors provide $196billion per year to start-up and growing companiesin the participating GEM countries. In the context ofnational economies, the total informal investmentwas 1.1 percent of the combined GDP for all GEMcountries. Korea had the highest level of informalinvestment as a percentage of GDP at 3.7 percent.Brazil had the lowest at 0.14 percent.
Clearly, when the amount of informal investment for start-up and growing businesses is as much as 1 to 2 percent of a nation’s GDP, itis a significant factor in that nation’s economy. In all GEM 2001 countries, informal investors allocated more money for start-ups and growingbusinesses than did professional venture capitalfirms. For every dollar of classic or traditional venture capital there was an average of $1.60 of informal capital invested. In New Zealand,Australia, Denmark and Korea, informal investorsprovided 90 percent or more of informal and classicventure capital. The lowest proportion was in Israel,the United States and Canada, where informalinvestment represents slightly less than 60 percentof the total investment pool.
Classic venture capital23 is a rare but extremelyimportant form of financing for entrepreneurialstart-ups. To illustrate how rare this form of venturefinancing is, consider that while an estimated 150
million adults are involved in start-ups or newbusinesses at any point in time in the 29 GEMcountries, fewer than 20,000 businesses receivedclassic venture capital in 2000.
Though venture capital-backed financingsare rare, their impact is significant. According to a recent study by the Wharton EconometricForecasting Associates which was supported by the National Venture Capital Association,24
venture capital-backed companies created 4.3 million new jobs in the United States. These samecompanies generated $736 billion in revenues in 2000. Put another way, the relatively smallnumber of venture capital-backed companiesaccount for 3.3 percent of the total jobs in theUnited States and 7.4 percent of GDP.
In 2000, the total amount of classic venturecapital invested by domestic firms in the 24 GEMcountries where such data were available was$123.9 billion, or 0.5 percent of the total GDP ofthose countries25. Of the total, $100.6 billion (81 percent) was invested in the United States and$23.3 billion (19 percent) in the other 23 countries.The proportion of classic venture capital that wasinvested in the United States increased from 76percent of the total for all the GEM countries in 1999.
As depicted in Figure 11, the year-to-yeargains in the amount of venture capital investedwere substantial. All but two of the countries forwhich 1999 data were available had an increasein the amount of classic venture capital investedin 2000. The single largest percentage increasewas in Israel at 179 percent. Sweden had thelowest increase at 18 percent over 1999 levels.The two countries where the amount of classicventure capital invested in 2000 was less thanthat invested in 1999 were Belgium (18 percentdecrease) and India (23 percent decrease).
William D. Bygrave
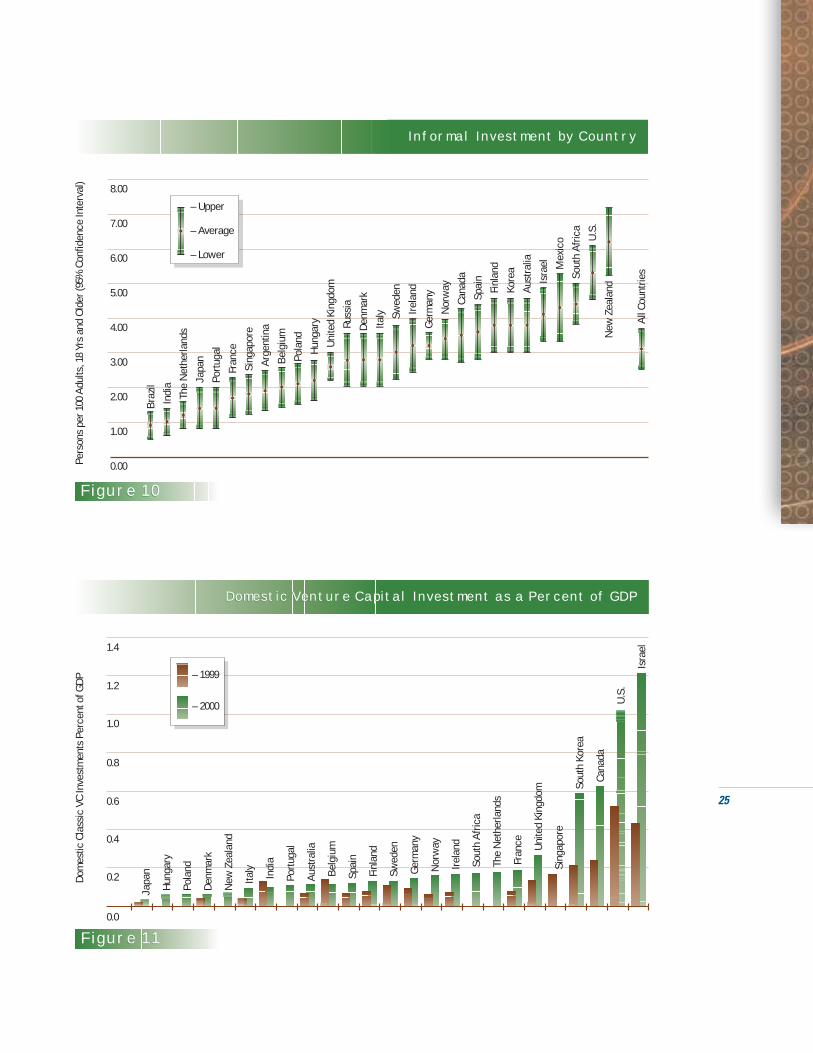
25
Domestic Venture Capital Investment as a Percent of GDPDomestic Venture Capital Investment as a Percent of GDP
Figure 11Figure 11
Dom
estic
Cla
ssic
VC
Inve
stm
ents
Per
cent
of G
DP
0.0
0.2
0.4
0.6
0.8
1.0
1.2
1.4
Japa
n
Hun
gary
Pol
and
Den
mar
k
New
Zea
land
I
taly
Indi
a
Portu
gal
Aust
ralia
Bel
gium
Spa
in
Fin
land
Sw
eden
Ge
rman
y
N
orw
ay
I
rela
nd
Sout
h Af
rica
The
Net
herla
nds
Fra
nce
Uni
ted
King
dom
S
inga
pore
So
uth
Kore
a
Cana
da
U.
S.
Isra
el
– 1999
– 2000
Informal Investment by CountryInformal Investment by Country
Pers
ons
per 1
00 A
dults
, 18
Yrs
and
Olde
r (95
% C
onfid
ence
Inte
rval
)
Figure 10Figure 10
– Upper
– Average
– Lower
Braz
il I
ndia
T
he N
ethe
rland
s
Jap
an
Por
tuga
l
Fran
ce
Sin
gapo
re
Ar
gent
ina
Bel
gium
Pol
and
H
unga
ry
U
nite
d Ki
ngdo
m
Rus
sia
De
nmar
k
Ital
y
S
wed
en
Irel
and
G
erm
any
N
orw
ay
C
anad
a
Spa
in
F
inla
nd
K
orea
Aus
tralia
I
srae
l
Mex
ico
Sou
th A
frica
U
.S.
New
Zea
land
All C
ount
ries
8.00
7.00
6.00
5.00
4.00
3.00
2.00
1.00
0.00

The number of companies receiving venture capital in eachcountry is shown in Figure 12. Except for Belgium, Ireland andSweden, all GEM 2001 countries for which both 1999 and 2000data were available had more companies receiving venture capital in 2000 than they did in 1999. The biggest increases in the number of companies occurred in the United States,Germany, Japan and France. Nearly 27 percent of the companiesreceiving venture capital as reflected in Figure 12 were locatedin the United States.
Although only 27 percent of the companies were in theUnited States, they accounted for 81 percent of the venture capi-tal invested in all the participating GEM countries. The averageamount invested per company in the United States was $19.2 million compared with an average of $1.7 million for all companies located outside the United States, more thanan 11-fold difference (Figure 13). Finland’s average per companyinvestment of $0.63 million was the lowest for all participatingGEM countries.
Estimates of (a) the total domestic venture capital supportfor start-ups and (b) the total informal funds were plotted in
Figure 14 for 14 GEM 2001 countries. Figure 14 portrays theamount invested for every adult citizen in each country for which data were available.26 About one-half of the total flow of informal funds goes to family members and relatives. Thirtypercent goes to co-workers, friends and neighbors, and theremainder to ”strangers with good ideas.” The total of bothforms of investment capital varies from less than US$50 per person in South Africa to US$1,400 per person in the UnitedStates. The U.S. figure is uniquely high due to the US$100 billion invested in telecommunications in 2000 — a level ofinvestment that has not been sustained in 2001.
It is clear that both forms of financial support — classic venture capital and informal funds from family and friends — are important sources of support for the wide range of new businesses being developed around the world. While venturecapital is well known to policy makers, the flow of informalinvestment — the source of the largest share of the new venture funds — should be examined more carefully.
I n f o r m a l F i n a n c e a n d V e n t u r e C a p i t a l : A C l o s e r L o o k
26
Number of Companies Receiving Venture Capital in 2000Number of Companies Receiving Venture Capital in 2000
Figure 12Figure 12
Num
ber o
f Com
pani
es
0
1000
2000
3000
4000
5000
6000
– 1999
– 2000N
ew Z
eala
nd
Hung
ary
Pol
and
Sin
gapo
re
Por
tuga
l
Sou
th A
frica
Ire
land
Den
mar
k
N
orw
ay
B
elgi
um
F
inla
nd
Spai
n
Aust
ralia
The
Net
herla
nds
Ital
y
Sw
eden
Is
rael
Un
ited
King
dom
Indi
a
Can
ada
Sou
th K
orea
F
ranc
e
Jap
an
Ger
man
y
U.
S.

27
Total Informal and Venture Capital Investment per PersonTotal Informal and Venture Capital Investment per Person
Figure 14Figure 14
Annu
al A
mou
nt p
er P
erso
n 18
-64
Year
s Ol
d
0
200
400
600
800
1000
1200
1400
1600
– Informal Funds
– Venture Capital Start-Up
Sout
h Af
rica
Fin
land
S
wed
en
Ge
rman
y
Den
mar
k
Ire
land
N
orw
ay
Can
ada
A
ustra
lia
Uni
ted
King
dom
Ko
rea
Is
rael
New
Zea
land
U.S.
Domestic Venture Capital Invested per Company [US$1,000]Domestic Venture Capital Invested per Company (US$1,000)
Figure 13Figure 13
US$1
,000
per
Com
pany
Finl
and
Indi
a
Swed
en
Den
mar
k
Jap
an
Sou
th K
orea
Por
tuga
l
Be
lgiu
m
Germ
any
Fr
ance
Ire
land
N
orw
ay
A
ustra
lia
N
ew Z
eala
nd
Sin
gapo
re
Sou
th A
frica
The
Net
herla
nds
Sp
ain
Isra
el
Ital
y
Cana
da
Uni
ted
King
dom
U.
S.
0
2000
4000
6000
8000
10000
12000
14000
16000
18000
20000
– 1999
– 2000

28
R e s e a r c h a n d T e c h n o l o g i c a l D e v e l o p m e n t a n d E n t r e p r e n e u r i a l A c t i v i t y : A C l o s e r L o o k
R e s e a r c h a n d T e c h n o l o g i c a l D e v e l o p m e n t a n d E n t r e p r e n e u r i a l A c t i v i t y : A C l o s e r L o o k
Erkko Autio and Riikka-Leena Leskelä
According to modern theory, economic growthis ultimately driven by the search for new ideas by profit-seeking innovators.27 Greater investmentsin research and technological development areassumed to increase the rate at which innovationsare produced. Innovations then translate into economic growth and well-being.
While economists agree on the causal role oftechnology in economic growth, they are generallysilent about the organizational forms through whichthese benefits materialize. Even though Schumpeter(1912) initially assigned this role to entrepreneurswho start new firms, he later revised his theory and assumed these contributions were provided by large, established firms who could afford long-term R&D projects.28 This change of mind coincidedwith the invention of the industrial R&D departmentin large institutions in the 1940s.
The empirical evidence on the relationshipbetween technological development and entrepreneurship appears mixed. The availabledata and analyses suggest that some economic sectors may be more conducive to the creation oftechnology-based new firms than others (e.g., Acsand Audretsch, 1988).29 For example, many informationtechnology sectors, such as packaged computersoftware, tend to be populated by new and smallerfirms. Typically these firms are able to respond tothe rapid pace of development with speed andflexibility. The pharmaceutical industry, on the otherhand, requires massive investments in R&D withwhich only the largest and financially resourcefulcompanies are able to keep pace.
We explored the GEM data for relationshipsbetween various aspects of national research andtechnological development and entrepreneurialactivity. Consistent with recent theorizing onnational innovation systems,30 which emphasize theinteractive nature of the technological innovationprocess, we classified national research and technological development (RTD) indicators intothree categories: Input, Process and Output. Inputindicators comprise various resource and knowledgeinputs for basic and applied research. Process indicators relate to interactions between
various institutions within the national innovationsystem. Output indicators describe the results ofinnovative processes. In addition, we also analyzedrelationships between various aspects of thenational technological development infrastructureand entrepreneurial activity.
Insights
Differences in national RTD systems reflectthe increased variety of culture and social systemsof the 29 countries in the GEM 2001 consortium.The total national expenditure on R&D, as a percentage of 1999 GDP, ranged from 0.5 percent inArgentina to 3.9 percent in Israel. The average levelof national expenditure on R&D was 1.9 percent forall GEM countries. After Israel, the next threehighest percentages were Sweden (3.8 percent),Finland (3.3 percent) and Japan (3.1 percent).
Additionally, the total national income fromroyalties and license fees, as a percent of 1999GDP, varied greatly, suggesting a high level of disparity in the ability of countries to benefit commercially from their investment in RTD.Royalties and license fees ranged from 0.1 percentage of GDP in Argentina and India to 0.6percent in the Netherlands, the United Kingdom and Sweden. The average for all GEM countrieswas 0.2 percent.
The outputs of national RTD processes variedsignificantly across the 29 GEM countries, as didthe sophistication of the national technologyinfrastructure. The number of scientific and technical journal articles per 100,000 people rangedfrom 0.87 in India to 96.0 in Israel. The average forthe 29 GEM countries was 42 articles per 100,000people. The per capita computing power availablefor R&D, as measured by millions of instructions persecond per 1,000 people in 1998, ranged from a lowof 513 in India to a high of 96,000 in Sweden.
The great diversity among the GEM countriesmade it necessary to run several correlations, onefor each facet of entrepreneurial activity. Four of theGEM measures of entrepreneurial activity were
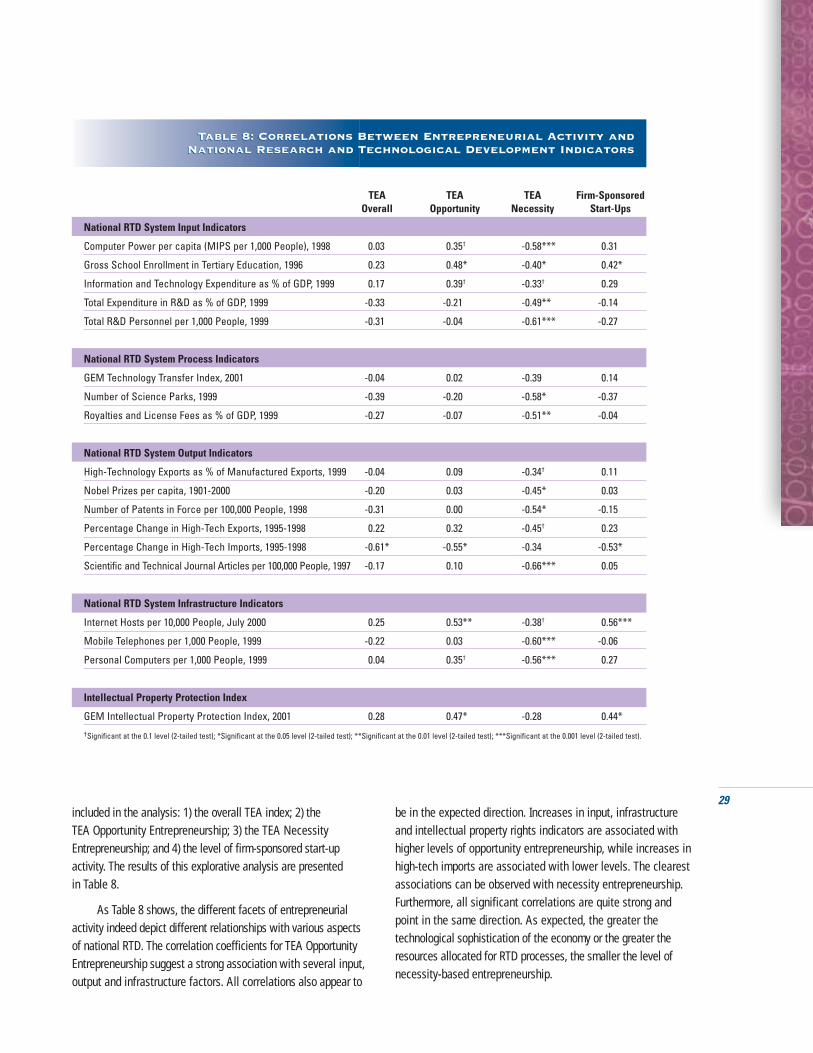
29included in the analysis: 1) the overall TEA index; 2) the TEA Opportunity Entrepreneurship; 3) the TEA NecessityEntrepreneurship; and 4) the level of firm-sponsored start-up activity. The results of this explorative analysis are presented in Table 8.
As Table 8 shows, the different facets of entrepreneurialactivity indeed depict different relationships with various aspectsof national RTD. The correlation coefficients for TEA OpportunityEntrepreneurship suggest a strong association with several input,output and infrastructure factors. All correlations also appear to
be in the expected direction. Increases in input, infrastructureand intellectual property rights indicators are associated withhigher levels of opportunity entrepreneurship, while increases inhigh-tech imports are associated with lower levels. The clearestassociations can be observed with necessity entrepreneurship.Furthermore, all significant correlations are quite strong andpoint in the same direction. As expected, the greater the technological sophistication of the economy or the greater theresources allocated for RTD processes, the smaller the level ofnecessity-based entrepreneurship.
Table 8: Correlations Between Entrepreneurial Activity andNational Research and Technological Development Indicators
Table 8: Correlations Between Entrepreneurial Activity andNational Research and Technological Development Indicators
TEA TEA TEA Firm-SponsoredOverall Opportunity Necessity Start-Ups
National RTD System Input Indicators
Computer Power per capita (MIPS per 1,000 People), 1998 0.03 0.35† -0.58*** 0.31
Gross School Enrollment in Tertiary Education, 1996 0.23 0.48* -0.40* 0.42*
Information and Technology Expenditure as % of GDP, 1999 0.17 0.39† -0.33† 0.29
Total Expenditure in R&D as % of GDP, 1999 -0.33 -0.21 -0.49** -0.14
Total R&D Personnel per 1,000 People, 1999 -0.31 -0.04 -0.61*** -0.27
National RTD System Process Indicators
GEM Technology Transfer Index, 2001 -0.04 0.02 -0.39 0.14
Number of Science Parks, 1999 -0.39 -0.20 -0.58* -0.37
Royalties and License Fees as % of GDP, 1999 -0.27 -0.07 -0.51** -0.04
National RTD System Output Indicators
High-Technology Exports as % of Manufactured Exports, 1999 -0.04 0.09 -0.34† 0.11
Nobel Prizes per capita, 1901-2000 -0.20 0.03 -0.45* 0.03
Number of Patents in Force per 100,000 People, 1998 -0.31 0.00 -0.54* -0.15
Percentage Change in High-Tech Exports, 1995-1998 0.22 0.32 -0.45† 0.23
Percentage Change in High-Tech Imports, 1995-1998 -0.61* -0.55* -0.34 -0.53*
Scientific and Technical Journal Articles per 100,000 People, 1997 -0.17 0.10 -0.66*** 0.05
National RTD System Infrastructure Indicators
Internet Hosts per 10,000 People, July 2000 0.25 0.53** -0.38† 0.56***
Mobile Telephones per 1,000 People, 1999 -0.22 0.03 -0.60*** -0.06
Personal Computers per 1,000 People, 1999 0.04 0.35† -0.56*** 0.27
Intellectual Property Protection Index
GEM Intellectual Property Protection Index, 2001 0.28 0.47* -0.28 0.44*
†Significant at the 0.1 level (2-tailed test); *Significant at the 0.05 level (2-tailed test); **Significant at the 0.01 level (2-tailed test); ***Significant at the 0.001 level (2-tailed test).

R e s e a r c h a n d T e c h n o l o g i c a l D e v e l o p m e n t a n d E n t r e p r e n e u r i a l A c t i v i t y : A C l o s e r L o o k
30
Conclusions
These observations are consistent with the overall GEMmodel: an increased investment in RTD appears to be associatedwith higher levels of opportunity entrepreneurial activity andlower levels of necessity entrepreneurial activity. From Table 8we can also observe that a part of the effect is channeledthrough the corporate sector. The effects of the national RTD system on firm-sponsored start-up activity appear quite similar to those for independent opportunity entrepreneurial activity.
The findings are also consistent with theories on endogenous economic growth and with previous empirical assessments of the relationship between RTD and entrepreneurialactivity in different industry sectors. The numerous significantnegative relationships between national RTD indicators andnecessity entrepreneurship suggest a clear wealth-creationeffect for technological development activity. Apparently, thegreater a nation’s investment in RTD, the smaller the number offorced new firm start-ups. Investment in technology developmentthus appears not only to create new wealth, but it may createenough new quality jobs to lower the level of necessity entrepreneurship in the more technologically sophisticated GEM 2001 countries.
The apparently weaker effects on opportunity entrepreneurshipare consistent with the findings from earlier studies of small firminnovation in different industry sectors. In some industries, R&Dinvestments are predominantly channeled through large establishedfirms, whereas other sectors may be populated by high-tech start-ups. It is possible that at the national level, differences betweenindustry sectors mask the complex relationships between nationalRTD and opportunity entrepreneurship.
One of the most important findings from this exploratoryanalysis is that the relationships between national RTD investmentand various facets of entrepreneurial activity appear highly complex.It is clear that more data and more sophisticated analyses arerequired to uncover these effects. For now, we have only scratchedthe surface of the multi-faceted and complex processes throughwhich national RTD feeds entrepreneurial activity and throughwhich entrepreneurial activity, in turn, converts national RTDinvestment into economic growth and well-being.

N a t i o n a l A s s e s s m e n t s : E x p e r t I n s i g h t sN a t i o n a l A s s e s s m e n t s : E x p e r t I n s i g h t s
The creation and growth of new firms,whether out of necessity or opportunity, is theessence of entrepreneurship. However, as GEM hasrevealed, there are considerable differences fromcountry to country in the levels of entrepreneurshipand the context in which entrepreneurship flourishes. Many countries struggle with increasingthe level of entrepreneurial activity due to deeplyrooted cultural issues that may take decades toresolve through standard policies, programs andpractices. Some of the struggle, however, is due to a lack of understanding regarding what makes a country entrepreneurial.
As in previous years, the GEM 2001 assessmentincluded semi-structured face-to-face interviewswith experts on entrepreneurship within eachcountry. This year, more than 950 such informantsfrom 26 countries were interviewed for their uniqueexpertise in one or more of the nine entrepreneurialframework conditions outlined in the GEM model.31
The interviews constitute a rich data source foridentifying and assessing the major entrepreneurialissues in each country and a unique basis for cross-national comparisons. The observations providean in-depth perspective only available through aqualitative research protocol that offers a systematicassessment of patterns across countries.32
Defining the GlobalLandscape
The first phase of the analysis consisted of a count of the three most important issues raisedin each country. This gives a basis of comparisonwith data obtained through interviews in GEM2000 and defines the common global landscapefor entrepreneurship. This analysis revealed thethree most important issues for 2001 as (a) culturaland social norms, (b) financial support and (c) government policies. Interestingly, these issueswere also ranked highest in the GEM 2000 analysis,making it clear that issues in these domains dominate the international scene.
Culture and Social NormsAcross the GEM 2001 countries, the most
pressing issue with respect to cultural and social
norms is the public’s general attitude towardentrepreneurship. This includes the public's attitudetoward, support for and understanding of theimportance of entrepreneurship in society. In nearlyevery country, this attitude was mentioned as oneof the greatest inhibitors to, or enhancements of,entrepreneurship. The specific issues include thesocial legitimacy of entrepreneurship, the valuesociety places on self-employment and the rewardfor individualism and self-reliance. Experts alsoexpressed a concern over the idea of creatingwealth. Even those from countries with higher levels of entrepreneurial activity agreed that whensome within society earn substantially more thanothers earn, perceived inequities are created.
The experts consistently expressed additionalconcern for the way in which societal normsimpacted entrepreneurial behavior. In severalEuropean countries, for instance, the experts wereclear that a society's negative posture with respectto creativity, innovation and change significantlyreduces the number of people engaged in startingnew firms. For many such countries where societalnorms mitigate against entrepreneurship, there islittle regard for personal characteristics that definethe entrepreneurial mindset, such as self-confidence,self-reliance, personal drive and a strong internallocus of control.
There were some additional concerns aboutattitudes toward failure. While experts agree thereis little understanding of what actually motivatesindividuals to take risks, it is clear a culture thatrewards risk taking is more inclined to support higherlevels of entrepreneurial activity. A willingness toaccept failure also tends to be associated withhigher levels of risk taking. Countries where thepeople understand and value innovation and risk taking have learned that benefiting from entrepreneurship means being willing to acceptsome failures along the way.
Financial SupportThe overriding issue that dominated the
global landscape concerning financial support for entrepreneurial efforts is the perception of an inadequate supply of risk capital. This includesissues associated with too little capital (i.e., thefunding gap), access systems difficult to navigate,
31
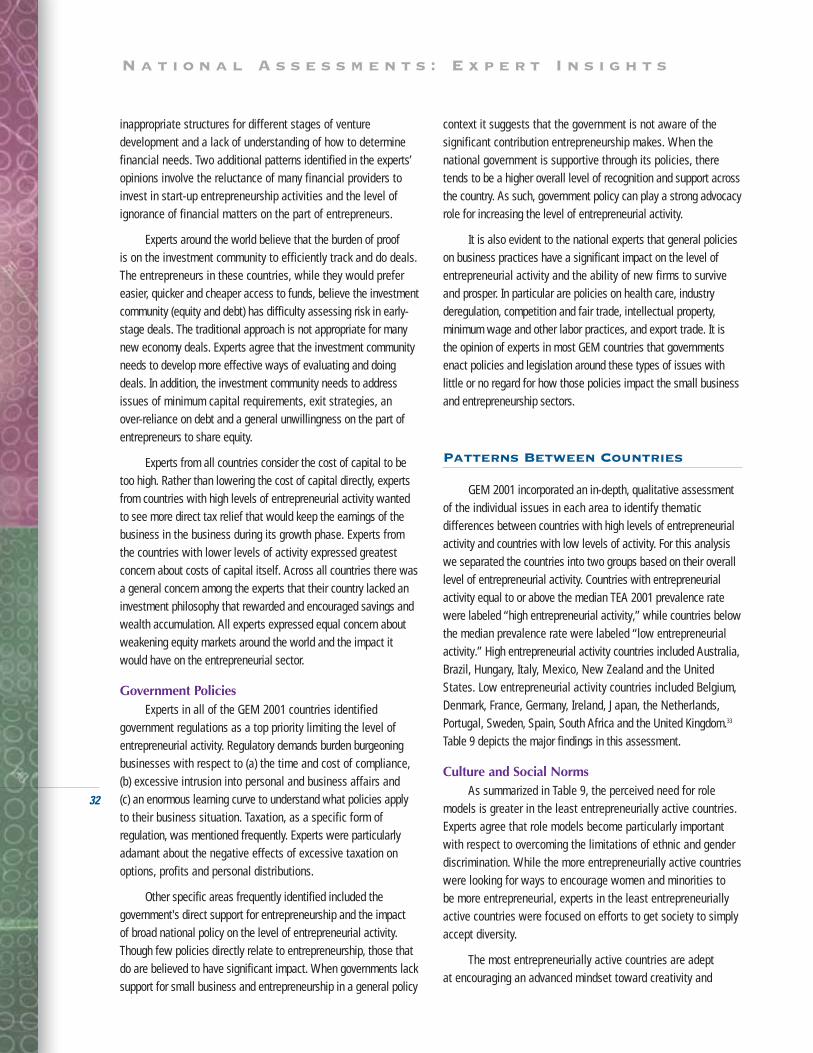
N a t i o n a l A s s e s s m e n t s : E x p e r t I n s i g h t s
32
inappropriate structures for different stages of venture development and a lack of understanding of how to determinefinancial needs. Two additional patterns identified in the experts’opinions involve the reluctance of many financial providers toinvest in start-up entrepreneurship activities and the level of ignorance of financial matters on the part of entrepreneurs.
Experts around the world believe that the burden of proof is on the investment community to efficiently track and do deals.The entrepreneurs in these countries, while they would prefer easier, quicker and cheaper access to funds, believe the investmentcommunity (equity and debt) has difficulty assessing risk in early-stage deals. The traditional approach is not appropriate for manynew economy deals. Experts agree that the investment communityneeds to develop more effective ways of evaluating and doingdeals. In addition, the investment community needs to addressissues of minimum capital requirements, exit strategies, an over-reliance on debt and a general unwillingness on the part ofentrepreneurs to share equity.
Experts from all countries consider the cost of capital to betoo high. Rather than lowering the cost of capital directly, expertsfrom countries with high levels of entrepreneurial activity wantedto see more direct tax relief that would keep the earnings of thebusiness in the business during its growth phase. Experts fromthe countries with lower levels of activity expressed greatestconcern about costs of capital itself. Across all countries there wasa general concern among the experts that their country lacked aninvestment philosophy that rewarded and encouraged savings andwealth accumulation. All experts expressed equal concern aboutweakening equity markets around the world and the impact itwould have on the entrepreneurial sector.
Government PoliciesExperts in all of the GEM 2001 countries identified
government regulations as a top priority limiting the level ofentrepreneurial activity. Regulatory demands burden burgeoningbusinesses with respect to (a) the time and cost of compliance,(b) excessive intrusion into personal and business affairs and (c) an enormous learning curve to understand what policies applyto their business situation. Taxation, as a specific form of regulation, was mentioned frequently. Experts were particularlyadamant about the negative effects of excessive taxation onoptions, profits and personal distributions.
Other specific areas frequently identified included the government's direct support for entrepreneurship and the impact of broad national policy on the level of entrepreneurial activity.Though few policies directly relate to entrepreneurship, those thatdo are believed to have significant impact. When governments lacksupport for small business and entrepreneurship in a general policy
context it suggests that the government is not aware of the significant contribution entrepreneurship makes. When thenational government is supportive through its policies, theretends to be a higher overall level of recognition and support acrossthe country. As such, government policy can play a strong advocacyrole for increasing the level of entrepreneurial activity.
It is also evident to the national experts that general policieson business practices have a significant impact on the level ofentrepreneurial activity and the ability of new firms to surviveand prosper. In particular are policies on health care, industryderegulation, competition and fair trade, intellectual property, minimum wage and other labor practices, and export trade. It is the opinion of experts in most GEM countries that governmentsenact policies and legislation around these types of issues with little or no regard for how those policies impact the small businessand entrepreneurship sectors.
Patterns Between Countries
GEM 2001 incorporated an in-depth, qualitative assessmentof the individual issues in each area to identify thematic differences between countries with high levels of entrepreneurialactivity and countries with low levels of activity. For this analysiswe separated the countries into two groups based on their overalllevel of entrepreneurial activity. Countries with entrepreneurialactivity equal to or above the median TEA 2001 prevalence ratewere labeled “high entrepreneurial activity,” while countries belowthe median prevalence rate were labeled “low entrepreneurialactivity.” High entrepreneurial activity countries included Australia,Brazil, Hungary, Italy, Mexico, New Zealand and the UnitedStates. Low entrepreneurial activity countries included Belgium,Denmark, France, Germany, Ireland, Japan, the Netherlands,Portugal, Sweden, Spain, South Africa and the United Kingdom.33
Table 9 depicts the major findings in this assessment.
Culture and Social NormsAs summarized in Table 9, the perceived need for role
models is greater in the least entrepreneurially active countries.Experts agree that role models become particularly importantwith respect to overcoming the limitations of ethnic and genderdiscrimination. While the more entrepreneurially active countrieswere looking for ways to encourage women and minorities to be more entrepreneurial, experts in the least entrepreneuriallyactive countries were focused on efforts to get society to simplyaccept diversity.
The most entrepreneurially active countries are adept at encouraging an advanced mindset toward creativity and

33
innovation. Those less active have to struggle to even instill themore elementary principles, such as overcoming a social systemthat breeds dependence and disrespect for self-reliance. Thoseliving in societies with generous welfare benefits may becomedependent and lack personal initiative and reduce the level ofentrepreneurial activity. More entrepreneurially active countries,on the other hand, encourage people to act independently andto pursue opportunities for personal gain.
Financial SupportExperts in countries with lower levels of entrepreneurial
activity argued that banking and access to debt capital were ofspecial concern. This concern included the impersonal nature withwhich the banking industry evaluates investments in new start-ups, the strong reliance on asset-based lending, and the widelyshared, risk-averse investment philosophy. Of particular concernwas the inability of banks to appropriately evaluate businessdeals. In one country this was viewed as the most significant issuecontributing to the capital gap for new and promising start-ups,
particularly in combination with the “zero tolerance rule” underwhich any terminated business was viewed as a major bankingfailure. In less entrepreneurial countries, the experts were alsonegative about the ability of entrepreneurs to assess capitalneeds, to identify potential sources of funds and to negotiatedeals. Entrepreneurs are, by necessity, more sophisticated in countries with more active entrepreneurial sectors.
Another key difference is the role that new venture performance plays in creating the investment culture of a country. Experts from the countries with high levels of entrepreneurial activity were clearly concerned with the ability to provide investors exit mechanisms and the ability to earn money on investments even when the deals are initiallyover valued. The experts from the least entrepreneurially activecountries argue that there should be more formal controls overthe entrepreneurial firms to improve performance. The investmentcommunities in the countries with low levels of entrepreneurshipappear to place unreasonable expectations on new firm
Table 9: Expert Evaluations: Culture, Financial Support and Government Policy
Culture and Social Norms
More entrepreneurial activity
Less entrepreneurial activity
Financial Support
More entrepreneurial activity
Less entrepreneurial activity
Government Policy
More entrepreneurial activity
Less entrepreneurial activity
• Encourage women and minorities to bemore entrepreneurial
• Create mindset of creativity and innovation
• Need for role models
• Instill elementary aspects ofentrepreneurial mindset
• Improving risk investment culture in thefinancial community
• Improving banking and access to debt capital
• Improving entrepreneurs’ ability to assesscapital needs
• Increase long-term focus in governmentsupport of entrepreneurship
• Deepen government understanding of entrepreneurship
• Increase coordination in governmentalsupport initiatives
• Change government negative perception ofentrepreneurship
• Increase respect for entrepreneurs
• Lower fear of failure
• Modify perception of wealth creation
• Improving ability of lending institutions andequity investors to assess entrepreneurialopportunities
• Lower cost of capital for entrepreneurs
• Modify inadequate regulation bygovernment of the supply of capital
• Reduce administrative burden ofregulatory compliance
• Increase fiscal incentives to stimulateentrepreneurial initiatives
Differences Common Themes
N a t i o n a l A s s e s s m e n t s : E x p e r t I n s i g h t s
34
performance, even while these investors are unwilling or unableto provide the level of management expertise that investors inthe highly entrepreneurial countries typically provide.
Government PoliciesIn countries with more entrepreneurial activity, the experts
contend that government lacks a long-term focus and could benefitfrom a more strategic approach to policy planning (Table 9). The experts from less entrepreneurial countries contend thatgovernment policies need to be more closely aligned to theimmediate situation and that there needs to be better coordinationbetween programs. The focus for experts from countries with lowlevels of activity was on what government is doing, while thefocus of those from high activity countries was on the underlyingphilosophy or strategic approach to government's role in creatingthe best climate for entrepreneurship. Experts in the more entrepreneurially active countries expressed concern about thepermanence of government political power, economic stabilityand the lack of economic and business skills in the governmentranks. Experts from the less entrepreneurial countries worriedabout better coordination between various regions and programs.
While experts in both types of countries agreed that government needed to deepen and extend its understanding ofentrepreneurship and its impact on the economy, they differedas to how such an understanding would be beneficial. Expertsfrom less entrepreneurial countries argued governments need to deepen their understanding of entrepreneurship in order tochange the attitudes toward the entrepreneurial sector for a morepositive image. Experts from the highly entrepreneurial countrieswere much more concerned the government understands theimpact of its policies on entrepreneurial activity. For experts in theless entrepreneurial countries the issue is image and awareness,attempting to overcome the general sense of distrust and disrespect policy makers have for entrepreneurs. For experts in the more entrepreneurial settings, the issue is more aboutpolicy effectiveness, including policies that reduce the barriersto growth for young emerging entrepreneurial companies.
Variation in the national context, then, is well captured by the systematic personal interviews with national experts. Whileexperts from all countries seem to agree on many topics, theproblems identified in countries with high levels of entrepreneurialactivity are somewhat different compared to those with lowerlevels of entrepreneurial activity. While this should not be a surprise, it certainly suggests that universal “one-size-fits-all” or “best practice” solutions may not be an optimum strategy forpolicy development. The following country summaries reinforce the image of substantial diversity among the GEM 2001 countries.

T h e S t a t e o f E n t r e p r e n e u r s h i p : C o u n t r y S u m m a r i e s
T h e S t a t e o f E n t r e p r e n e u r s h i p : C o u n t r y S u m m a r i e s
Despite similarities in the level ofentrepreneurial activity, the climate forentrepreneurship is quite different from country tocountry. GEM provides a brief summary of the Stateof Entrepreneurship for most of the countriesparticipating in the 2001 assessment. Each country summary (presented in alphabetical order) providesan excellent overview of (a) the level ofentrepreneurial activity, (b) the unique nationalfeatures that influence the overall business climate,and (c) the key issues challenging the effort to buildan entrepreneurial support infrastructure.
ARGENTINA
Level of Entrepreneurial Activity
■ The level of entrepreneurial activity inArgentina is just above the average for theGEM 2001 countries and is slightly higher in2001 than in 2000. A significant minority (42.8percent) of entrepreneurs is motivated bynecessity — one of the highest proportionsamong the 29 GEM countries.
■ The prevalence of informal angel investors,at 1.9 percent of the adult population, issubstantially below the GEM 2001 averageof 3.1 percent.
■ The ratio of female to male entrepreneurs inArgentina is below the GEM 2001 averagewith just more than 1 woman to every 3 meninvolved in some form of entrepreneurialactivity.
Unique National Features
■ Argentina, as Latin America’s second largesteconomy, has experienced a period of recession and slow growth during recentyears. This has raised particular concern aboutthe ability of the country to service its hardcurrency debt.
■ The government is trying to restore confidenceby means of drastic cuts to public spending.Reform of the tax system and continuedderegulation of the labor market are alsodesigned to further ease structural constraintson competitiveness.
■ The volume of venture capital, especially forInternet and technology businesses, rosesharply in 1999 and 2000. Since the summerof 2000, however, it has all but disappeared.
Key Issues
■ Government policy is the most important issuefacing entrepreneurship. Employmentregulation, the tax structure and the lack of a supportive environment for new businessesare all identified as main impediments toentrepreneurial activity. Government policiestoward entrepreneurship should reduce thehigh level of tax evasion and lower the tax,legal and administrative burden on start-ups.
■ Financing remains a major obstacle. Thisincludes a shortage of risk capital availablefor new ventures, its high cost and the lack ofexpertise of entrepreneurs in raising externalcapital and of investors in evaluating newventures.
■ Education and training specifically related toentrepreneurship is critical. Substantial changeis required throughout the education systemto improve understanding of entrepreneurshipand to inspire and guide future entrepreneurs.There are a number of private initiatives in thisdirection, at the high school and university level,in response to growing interest among youngerpeople in starting their own businesses.
AUSTRALIA
Level of Entrepreneurial Activity
■ In 2001, Australia maintained its positionamong countries with the highest levels of entrepreneurial activity, ranking secondwith New Zealand, both coming after only Mexico. There was an increase inentrepreneurial activity between 2000 and 2001. Opportunity rather than necessitymotivates a very high proportion ofAustralian entrepreneurs (77 percent).
■ Australia also has a high level of informalangel investment activity, with 3.8 percent ofthe adult population investing in start-ups.
35
T h e S t a t e o f E n t r e p r e n e u r s h i p : C o u n t r y S u m m a r i e s
36
■ Australia ranks higher in terms of entrepreneurial activityamong men than it does among women.
Unique National Features
■ Following financial deregulation in the 1980s, the Australianeconomy has opened to international capital markets. In2001, the Australian dollar fell to the lowest value everagainst the U.S. dollar. In this climate of global exposure, the pressure to develop world-class entrepreneurial venturesis greater than ever.
■ Cultural attitudes are viewed as the biggest impediment toentrepreneurship in Australia. These include the sociallegitimacy of entrepreneurship and aversion to risk. Negativeperceptions are becoming less prevalent, but positive perceptions are slow to emerge. A career as an employee ina large corporation or professional firm is still more valuedthan starting a business. The consequences of failure remaina major disincentive. Success, rather than meeting withsocial approval, often attracts envy.
Key Issues
■ Culture, education and government support are regarded asbeing the most important impediments to entrepreneurialactivity in Australia.
■ There is concern about a decline in the quality of educationgenerally and about the lack of skills needed to turn an ideainto a viable business in particular. Education is consideredimportant in developing these skills, particularly through specialized skills training, celebration of positive role modelsand involving more successful entrepreneurs in mentoring.
■ Government awareness of the importance ofentrepreneurship has increased dramatically. The questionremains as to whether this is permanent and whethergovernments really understand the entrepreneurial process.
■ Following a record year for venture capital investment and further government programs to stimulate investment,shortage of capital is considered less of an impediment in2001. However, access to early-stage capital remains aconcern, especially in light of the recent problems in thetechnology sector.
BELGIUM
Level of Entrepreneurial Activity
■ Entrepreneurial activity in Belgium remains low (4.6 percent)compared with other GEM 2001 countries. Only 1 out ofevery 125 adults in Belgium starts a business out of necessity,partly due to the country’s extensive welfare system.
■ Only 2 percent of Belgian adults invest personal funds in newbusiness start-ups. This is significantly higher than in 2000but below the GEM 2001 average of 3.1 percent.
■ The entrepreneurial activity rate in Belgium is low for bothmen and women, with the ratio of women to men similar tothe 1:3 average for the GEM 2001 countries.
Unique National Features
■ Belgium is a country with an open economy, characterized by high levels of international trade and foreign directinvestment. Experts agree that this contributes to the lowlevel of entrepreneurial activity.
■ Belgium has a complex federal political system. Both regionaland national governments have responsibility for parts of theentrepreneurial process. This can lead to inconsistenciesbetween regulations at the different levels.
■ Belgium’s generous welfare system has suppressed entrepreneurial activity among those who benefit from it byraising the cost of moving outside the social security system.
Key Issues
■ Lack of financial support is regarded as the main impedimentto entrepreneurship in Belgium. This includes both equity anddebt financing and applies to technology and non-technologybusinesses. There also appears to be reluctance amongentrepreneurs to raise equity from third parties.
■ Lack of coherent government policies is also considered animportant barrier. Starting a business also remains complex,time consuming and expensive despite efforts from local government to decrease the administrative burden.
■ Cultural norms are not conducive to entrepreneurship. Failureas an entrepreneur continues to be stigmatized in Belgiumdespite recent reforms to the bankruptcy laws. Starting anew business after a previous failure is not only difficult butis also regarded as suspicious.
37
■ Entrepreneurship training programs are emerging at theundergraduate and graduate levels, but pre-university education lags behind. Primary and secondary educationdoes not stimulate attitudes that are conducive to anentrepreneurial mindset and fails to address specific entrepreneurship issues.
BRAZIL
Level of Entrepreneurial Activity
■ Brazil has a relatively high level of entrepreneurial activity. At 14.2 percent, Brazil’s rate is equal to that of the United States. However, a higher proportion ofentrepreneurs (41 percent) are involved through necessityrather than opportunity.
■ Investment by individuals in start-ups is very low. Brazil’sbusiness angel rate of 0.9 percent is the lowest of all theGEM 2001 countries.
■ Women are relatively active as entrepreneurs in Brazil. Theproportion of women among entrepreneurs, at 38 percent, is among the highest among the 29 countries.
Unique National Features
■ A high level of government intervention in Brazil is regardedas a double-edged sword. The overarching presence of government has diminished in recent decades, but government intervention manifests itself in burdensomebureaucratic procedures.
■ The availability of capital in Brazil has improved. But many Brazilian entrepreneurs still view capital as costlyand cumbersome to obtain. In addition, funding programsare not well publicized.
■ The country’s extensive and diverse geography calls for decentralized and locally designed programs. Regional differences in culture and infrastructure also necessitate alocalized approach to venture capital provision and education.
Key Issues
■ Lack of a tradition in venture capital and overall access to capital continue to be the main impediments to entrepreneurial activity in Brazil. There is an urgent needto nurture a local venture capital culture and practice.
■ Inadequate physical infrastructure and an insufficient pool of professional workers have hampered programs designedto foster new businesses outside the main urban areas.
■ The economic and political environment has raised the level of risk and uncertainty about future stability and growth.
■ There is a need for further improvements to the general education system that foster an entrepreneurial cultureamong younger adults. Existing programs are seen asdetached from reality, with little integration with graduateand undergraduate study.
■ Inadequate legal protection of intellectual property rights,high costs of patent registration at home and abroad and poortechnology transfer mechanisms add to a dependence onimported technology and impede indigenous efforts. Universitiesremain isolated from the entrepreneurial community andengage in projects of little commercial relevance.
DENMARK
Level of Entrepreneurial Activity
■ Entrepreneurial activity in Denmark, at 8.1 percent, is belowthe most active GEM 2001 countries. However, it is abovethe average for European countries.
■ A relatively high proportion of those engaged in entrepreneurialactivity in Denmark (83 percent) do so because of perceivedbusiness opportunities. Only 5 percent are involved for reasonsof necessity.
■ Denmark ranks higher among the GEM 2001 countries interms of involvement in entrepreneurial activity by men thanit does for its level of female participation. More than twiceas many men are involved than women in this country.
Unique National Features
■ There are signs of changing social values among youngDanes in particular. Entrepreneurship is accorded a higherstatus than has traditionally been the case. A desire forautonomy and lower levels of concern about incomedifferentials are leading to changes in both employmentconditions and interest in entrepreneurial activity.
■ Danes generally have a desire to retain control of ideas theyperceive as their own. There is a reluctance to raise financesfrom professional investors who may have an interest ininfluencing the start-up process.
■ Denmark has suffered a “brain drain.” As a small countrywith a high level of general education, many people go

T h e S t a t e o f E n t r e p r e n e u r s h i p : C o u n t r y S u m m a r i e s
38
abroad to pursue greater opportunities and gain wider experience.This has reduced the pool of potential entrepreneurs.
Key Issues
■ The venture capital market in Denmark has become morecautious. A string of failed investments has reduced the levelof financial support for start-ups. Proposals at all stages arenow subject to more stringent assessment by investors.
■ A high administrative burden and high levels of taxation continue to act as disincentives to new business creation.
■ The Danish education system prepares people for employmentrather than entrepreneurship and is often criticized for a number of shortcomings. These include (a) a lack of focus on entrepreneurship, (b) a concentration on large firms and (c) a tendency to teach discrete subject areas rather than taking a more integrated approach. However, there havebeen recent improvements in these areas.
FINLAND
Level of Entrepreneurial Activity
■ The entrepreneurial activity rate in Finland is 9.3 percent, just above the average of all GEM 2001 countries. The raterecorded in 2001 is lower than that for 2000, indicating a fallin entrepreneurial activity.
■ As in other Scandinavian countries, opportunity rather thannecessity is the motive for the vast majority of entrepreneursin Finland. Only 8 percent of those involved in entrepreneurialactivities do so out of necessity.
■ Investment by individuals in new start-up businesses ismore prevalent in Finland than in the other European GEM2001 countries.
Unique National Features
■ World Economic Forum ranked Finland as the most competitiveeconomy globally in 2001 for both “current” and “growth”competitiveness. With its advanced technological infrastructureand its sophisticated telecommunications and infocomindustries, Finland is well positioned to take advantage ofdevelopments toward the Information Society.
■ The Finnish Government has made the promotion of entrepreneurship a top priority. In an effort to raise the levelof awareness, it launched an “Entrepreneurship Initiative” in 2000. This has brought together nine ministries and otherinterest groups to promote entrepreneurship through various
policy programs ranging from financial packages to help-linesand promotional courses.
■ High tax rates and an extensive social security system continue to hinder the overall level of new business creation.
Key Issues
■ A lack of experienced entrepreneurial teams is emerging as a key bottleneck for growth in the entrepreneurial sector inFinland. Teams with experience in managing internationalgrowth are in short supply.
■ With a relatively small home market, technology start-ups inFinland tend to expand internationally quite rapidly. This requiresexpertise and strong international networks. It represents ademanding challenge for the Finnish support system.
■ Strengthening the entrepreneurial culture remains a keychallenge for the more peripheral regions in Finland. Thetask is made harder by the fact that different municipalitiesand regions often compete for European Union and government funds.
■ Fostering an entrepreneurial mindset and culture remains akey challenge for the Finnish educational system at all levels.
FRANCE
Level of Entrepreneurial Activity
■ At 7.2 percent of the adult population, entrepreneurialactivity in France is below the average for the 29 GEM 2001countries. An increase of 2 percentage points over 2000indicates a rise in entrepreneurial activity.
■ Only 1 in 60 individuals in France invests personal funds innew start-ups. Although a higher proportion than in 2000,this remains among the lowest of the GEM 2001 countries.
■ France was typical among GEM 2001 countries in terms ofentrepreneurial activity of men and women. While low, thisrepresents an improvement in the involvement of womensince 2000.
Unique National Features
■ In 2001, the French government instituted a number ofmeasures to facilitate entrepreneurship. These included newlegislation to ease the capital requirements for new businessformation, reductions in the top rate of income tax and therate of corporation tax for small and medium-sized enterprises.These broad initiatives testify that entrepreneurship is highon the political agenda.

39
■ France is nevertheless also characterized by a strong regulatory framework, particularly in areas such as labor.This tends to impede the growth of new businesses.
Key Issues
■ Socio-cultural norms continue to act as a barrier to entrepreneurship in France. There have been improvementsrecently, in part due to the New Economy boom. The imageof the entrepreneur has improved, and entrepreneurship hasbecome a popular topic among politicians, commentators,students and academics. Negative attitudes toward businessfailure persist. Starting a business is still considered anunusual career choice.
■ There is an abundant supply of funds seeking good investmentopportunities and interest rates are low. Venture capitalinvestors still have large funds at their disposal but are morecautious in selecting investments, particularly in technologysectors.
■ The education system does not promote entrepreneurialvalues such as creativity, risk taking and personal responsibility. There is a need to heighten youth awareness of entrepreneurship, especially at primary and secondary school levels.
GERMANY
Level of Entrepreneurial Activity
■ Entrepreneurial activity in Germany, at 7.0 percent, isbelow the GEM 2001 average and significantly below comparable countries such as the United States, Canadaand Italy. Germany does have a higher proportion of opportunity-based entrepreneurship than it does of necessity-based entrepreneurship.
■ At 3.6 percent of the population, business angel activity inGermany is above the average of 3.1 for the GEM 2001 countries. It is among the highest in Europe.
■ Entrepreneurial activity among women in Germany isbelow that of men but is broadly in line with the GEM2001 average.
Unique National Features
■ Germany is generally regarded as a highly regulated country.However, opinion is divided as to the extent to which thisapplies to business start-ups. Some regard regulations as amajor barrier to new business creation. Others consider the
perception of the effect of regulations to be greater thantheir actual impact.
■ Germany is unique among the 29 GEM 2001 countries inhaving a relatively comprehensive and effective network ofsupport agencies for start-ups. Professional support servicesof a high quality are available, but market transparency islow. Many entrepreneurs are unwilling to spend time andresources on these services.
■ Although the financing available for start-ups has improved,venture capital companies and banks are now more cautious.Financing is particularly difficult for smaller businessesbecause banks are reluctant to make small loans.
Key Issues
■ The framework conditions for entrepreneurship in Germanyhave generally improved in recent years. However, attitudestoward entrepreneurship are more realistic in 2001 than in2000. Both investors and entrepreneurs are now more cautious. There are concerns that the decline in the NewEconomy may adversely affect entrepreneurship in general.
■ Federal and state government could do more to supportentrepreneurship. Although small business support is on theagenda of every political party, there is no coherent approachto entrepreneurship, and some recent political changes areperceived as negative for entrepreneurship.
HUNGARY
Level of Entrepreneurial Activity
■ The entrepreneurial activity rate in Hungary, at 11.6 percent,is higher than the average of the GEM 2001 countries andthe highest of all European countries. At 29 percent,necessity entrepreneurship is higher in Hungary than allother European GEM 2001 countries except Poland.
■ Approximately 2.2 percent of the adult population invests in new businesses. This is below the GEM 2001average but not significantly different from that of otherEuropean countries.
■ The participation of men in entrepreneurial activity is higherthan that of women, but the female participation rate ishigher than the GEM 2001 average.
Unique National Features
■ From 1948 to 1989, Hungary had a centrally planned economy, which favored large firms and public forms
T h e S t a t e o f E n t r e p r e n e u r s h i p : C o u n t r y S u m m a r i e s
40
of ownership. Reforms following the New EconomicMechanism of 1968 provided the basis for the transitiontoward a market economy. This began in earnest after 1989,and since then, the small business sector has flourished.
■ Hungary has created a business environment that is supportive of inward investment in manufacturing, bankingand retailing. Exports from these companies fuel Hungary’seconomic growth.
■ Hungary has an industrious, educated population. Businessculture and management skills are less developed amongsmall businesses, hindering entrepreneurship.
■ The small business sector is characterized by a large numberof firms that have neither the desire nor the capacity tobecome entrepreneurial, high-growth businesses.
Key Issues
■ Despite private sector growth, Hungarian culture still doesnot fully support entrepreneurship. However, respect forentrepreneurs is improving.
■ There is a shortage of capital available to entrepreneurialbusinesses in Hungary, with limited access to equity capitalfrom venture capital firms and business angels. Banks supplyloans to the business sector, but most new businesses areeither ineligible or unable to afford them.
■ Over the last few years, numerous government programshave been created with the objective of supportingentrepreneurship. However, these programs have had limited success and have not successfully promoted newbusiness creation.
■ Because of the lack of business skills and experience, thereis a need to develop entrepreneurship education at all levelsof society.
INDIA
Level of Entrepreneurial Activity
■ The level of total entrepreneurial activity in India, at 11.2 percent, is high relative to other GEM 2001 countries.Approximately two-thirds of this activity is driven by necessity.
■ Less than 1 percent of the adult population invests in start-up businesses. This is among the lowest of the GEM2001 countries.
■ Entrepreneurial activity in 2001 among men is more thantwice that of women, a similar pattern to that observed in2000 and similar to the average for all GEM 2001 countries.
Unique National Features
■ The economic reform process set in motion a decade agocontinues, and small firms are still adjusting to changes inthe business environment. Government support for the smallfirm sector — funding, infrastructure and protection fromcompetition — has been withdrawn.
■ An unwieldy and inefficient administrative machinery andpoor regulatory enforcement further compound the problemsfacing the entrepreneur.
■ Social and cultural norms in India favor stability and security.Risk taking in general is not encouraged. However, there isconsiderable regional variation in this respect.
■ India, well endowed in human capital, is competitive inknowledge-intensive industries such as software and information technology despite an inadequate infrastructure,high cost of equipment, restricted access to foreign resourcesand limited domestic demand.
Key Issues
■ Access to capital, particularly for early-stage development, is a major hurdle faced by entrepreneurs in India. Growth is hampered due to the scarcity and high cost of working capital. Financial institutions do not appreciate the specificnature of entrepreneurs’ needs.
■ Government is beginning to play a more supportive role butis doing so slowly. There is a lack of coordination betweenthe various arms of central and regional government, and often the administration hinders rather than helps the entrepreneurial process.
■ The physical infrastructure in the country is inadequate, as isthe supply of professional and commercial services. This hasimproved in some regions, but the pattern is uneven.
■ There is a need to incorporate skill-based learning and theprinciples of the market economy early in the educationcycle. While government agencies and educationalinstitutions carry out quality research and development, thereis little focus on the commercial aspects of business. Industryinvestment in research and development is low.

41
ISRAEL
Level of Entrepreneurial Activity
■ The entrepreneurial activity rate in Israel in 2001 (6.0 percent) is below the average for GEM 2001 countries. It is slightly lower than the rate in 2000.
■ The proportion of individuals investing in new businesses isamong the highest of the GEM 2001 countries and is similarto the proportion in the United States.
■ Entrepreneurial activity in Israel among men is twice the rateamong women, which is broadly consistent with the GEM2001 average.
Unique National Features
■ Israel’s competitive advantage lies in its technology sector,which has experienced rapid growth characterized by manytechnology start-ups and new venture capital funds.
■ Increasingly violent conflict with the Palestinian NationalAuthority (PNA) has destabilized the region. This hasincreased the perceived risk and reduced feelings of personal security. Tourism, foreign trade and overall economic performance have suffered.
■ The marked downturn in information and communicationtechnology markets and share prices has had an impact onIsrael’s technology sector. A large number of start-ups havebeen unable to raise additional capital and have been forcedto close down or lay off staff.
Key Issues
■ The ongoing conflict in the region causes continued feelingsof personal threat and uncertainty in starting new businesses.It also diverts government attention to defense and to socialand economic issues outside the entrepreneurial process.The Israeli government is criticized for a focus on short-terminterventions rather than long-term solutions.
■ Rising public expenditure, the growing fragmentation of thepublic administration and its heavily bureaucratic nature arebelieved to discourage entrepreneurship. These factors arealso likely to delay reforms that are needed to the taxationsystem.
■ Adverse movements in financial markets in 2000 and 2001are unfavorable for entrepreneurship. The volume of capitalflowing into Israel’s technology sector has fallen dramaticallyfrom the record levels in 2000. Venture capital funds in Israelare concentrating on supporting existing portfolio companiesor less risky later-stage ventures.
■ Education continues to be an important issue, although it isfelt unlikely that real reform will materialize given currentgovernment priorities. However, the government continues toinvest in R&D as a long-term investment policy.
ITALY
Level of Entrepreneurial Activity
■ An entrepreneurial activity rate of 10.2 percent places Italytwelfth among the 29 GEM 2001 countries, well ahead of allother European countries except Ireland and Hungary. It alsorepresents a significant increase over 2000.
■ Italy’s business angel rate, at 2.8 percent, is below the GEM2001 average (3.1 percent).
■ Women are particularly active as entrepreneurs in Italy. Thecountry has the highest proportion of women entrepreneursamong the GEM 2001 countries and is unique in having asmany women entrepreneurs as men.
Unique National Features
■ Italy has a well-rooted entrepreneurial tradition, especially inthose sectors, such as textiles, telecommunications and theautomotive sector, where it has been competitive on aninternational scale.
■ Geographical discrepancies continue to characterize Italy’sentrepreneurial landscape. However, there is increasingacceptance of entrepreneurship as a respectable, evendesirable, occupation in all regions.
■ A greater sense of creativity and entrepreneurial spiritamong younger Italians is a notable example of this moresupportive social environment. A further example is providedby the re-election of Silvio Berlusconi, a well-known entrepreneur, as Prime Minister in May 2001.
Key Issues
■ Insufficient mechanisms to promote technology transfers tonew firms and poor commercialization of research are keyfactors hindering the development of technology businessesin particular.
■ Shortage of capital, from early stages through to an initialpublic offering (IPO), is an important constraint, especiallyfor businesses in technology sectors. It is blamed forencouraging many Italian start-ups to achieve financial self-sufficiency rather than maximize potential growth.

T h e S t a t e o f E n t r e p r e n e u r s h i p : C o u n t r y S u m m a r i e s
42
■ Inflexibility in the labor market and the high cost of full-timelabor act as further constraints. This problem has been exacerbated by labor shortages in the north of the country.
■ There is growing concern about the lack of emphasis on creativity and independence in Italy’s primary and secondaryeducation system.
JAPAN
Level of Entrepreneurial Activity
■ Japan has the second lowest rate of entrepreneurial activity(5.1 percent) among the GEM 2001 countries. There is arelatively low proportion of opportunity-based entrepreneursand a correspondingly higher proportion of entrepreneursdriven by necessity.
■ Consistent with the relatively low level of entrepreneurialactivity, there are few business angels in Japan. Only 1.4 percent of the adult population invests in new businessstart-ups, compared with the GEM 2001 average of 3.1 percent.
■ The involvement of Japanese women in entrepreneurialactivities is also low. The ratio of 1 woman to every 2.4 men is lower than the GEM 2001 average.
Unique National Features
■ Japanese culture is generally not supportive of entrepreneurship.Recently, however, young people have been more motivatedto start new businesses rather than opting to work in largeestablished companies or in the public sector.
■ Adverse market and share price developments in 2000 and 2001 have increased the level of risk for many young companies as a result of lower sales growth andstronger competition.
Key Issues
■ Because of significant structural changes in the financialsector in Japan, many banks are reluctant to lend to entrepreneurs. In addition, banks often lack the capability to assess new business ventures.
■ Japan’s tax system and regulatory structure tend to discourageentrepreneurship. A high rate of taxation on capital gains andstock options penalizes entrepreneurial success.
■ Continued active involvement by government agencies in several business sectors, such as postal services, limits theopportunities for new business ventures in those sectors.
KOREA
Level of Entrepreneurial Activity
■ Korea has the fourth-highest level of entrepreneurial activityamong the GEM 2001 countries. An entrepreneurial activityrate of 15 percent places Korea behind Mexico, Australiaand New Zealand. There is a modest reduction from theprevalence rate in 2000. A relatively high proportion (38.7percent) of entrepreneurial activity is motivated by necessity.
■ Consistent with the high level of entrepreneurship, businessangel activity is also prevalent in Korea, with 3.8 percent ofindividuals investing in start-ups.
■ Entrepreneurial activity is particularly high among men. The proportion of women entrepreneurs remains below the GEM 2001 average.
Unique National Features
■ The Asian financial crisis of 1997 led to concerted efforts bythe Korean government to overcome the country’s foreignexchange problems and restructure the economy. It initiatedreforms designed to instill market mechanisms throughoutthe economy and reduce reliance on the small number oflarge conglomerates. These included specific measures topromote new businesses and touched many areas fromresearch and development to direct support for new businesses and tax concessions to investors.
■ However, the Korean economy is currently experiencing aslowdown due to the global downturn and uncertainties withongoing economic restructuring.
■ The information technology sector, including semiconductors,was instrumental in the export-driven recovery that tookplace after 1997. However, the sector recorded a 7.2 percentdecline in the first quarter of 2001.
Key Issues
■ Falling interest rates have not improved the financial constraints faced by start-up businesses. Venture capitalinvestment in new ventures fell sharply in 2001. In thecurrent climate, banks are also showing a strong preferencefor lending to low-risk clients. Businesses with low credit ratings are expected to have difficulties in obtaining bankfinancing.
■ In the face of slower growth and declining exports, the government is being urged to come up with comprehensivemonetary and fiscal policy measures to boost exports, whilestepping up efforts to continue corporate and financialrestructuring.

43
■ A strong university education system has left little room forentrepreneurship. The growing popularity of entrepreneurshipamong students has faltered, with employment in largercorporations or financial institutions now being preferred tonew ventures as uncertainty continues and conditions in thelabor market weaken.
MEXICO
Level of Entrepreneurial Activity
■ The level of entrepreneurship in Mexico (18.7 percent) isthe highest of the GEM 2001 countries. Almost 1 in every 5adults is involved in entrepreneurial activity. Levels of bothopportunity and necessity entrepreneurship are high; however the proportion of necessity entrepreneurs is lower than in other developing countries.
■ The proportion of adults who invest in start-up businesses is also high. Mexico’s business angel rate of 4.3 percent compares favorably with the GEM 2001 average of 3.1 percent.
■ Involvement in entrepreneurship is particularly prevalentamong Mexican men. Just less than 1 in every 3 men isinvolved in some way, compared with 1 in every 7 women.
Unique National Features
■ During the last 50 years, the Mexican economy has shiftedaway from the once dominant sectors of agriculture and mining toward more industrial activities, especially in the major urban centers of Mexico City, Monterrey andGuadalajara where entrepreneurs have concentrated. With this shift, a new class of entrepreneurs arose with the support of the government.
■ Government support took the form of financial incentives,protectionist economic policies and a rigid legislativeframework. Government, however, expected support from entrepreneurs in return, which led to a growing level of distrust.
■ The Mexican economy has been open to internationalcompetition since 1986. Public and private monopolies,however, remain in sectors such as steel, glass,telecommunications and construction. These monopoliessubcontract much of their work to small independentbusinesses.
Key Issues
■ The education system in Mexico has prepared students for employment rather than encouraging creativity andentrepreneurship. Research and development has been thepreserve of larger corporations and most technology isimported. As a result, Mexican firms largely depend on othercountries for new technology.
■ The large and complex bureaucracy facing those starting abusiness is a challenge even for those with ample motivationand financial resources. Several governmental programs tosupport start-ups exist but were poorly designed. They aregenerally regarded as wasting resources and offering littlereal support.
■ However, there is a common perception that the new federalgovernment will bring the changes needed for a renewedentrepreneurial environment.
THE NETHERLANDS
Level of Entrepreneurial Activity
■ Approximately 1 in 16 adults in the Netherlands (6.4 percent)is involved in entrepreneurial activity. This is below the GEM2001 average but is comparable to most other Europeancountries. The Netherlands has a high proportion of entrepreneurs motivated by the pursuit of opportunity.
■ Angel investment activity in the Netherlands is the lowest ofthe European GEM 2001 countries. Only 1 in every 83 adultsinvests funds in someone else’s new business.
■ With a ratio of women to men involved in entrepreneurialactivity of around 1 to 2, the level of participation ofwomen in the Netherlands is broadly in line with the GEM 2001 average.
Unique National Features
■ In the last decade, the Netherlands has successfully workedon improving its business environment. Attitudes towardentrepreneurship are also more positive than 10 years ago.During this period, the number of enterprises has grown bynearly 50 percent.
■ The shift from traditional toward more advanced technologysectors and the high rate of economic growth from 1995 to2000 has led to a widespread shortage of skilled labor.

T h e S t a t e o f E n t r e p r e n e u r s h i p : C o u n t r y S u m m a r i e s
44
■ The Netherlands is characterized by a strong, generoussocial security system and a highly protected employee status. This may provide an additional explanation for the relatively low number of nascent, necessity-basedentrepreneurs in the Netherlands.
■ Venture capital investment at the early and expansion stagesas a percentage of GDP was third highest among OECDcountries between 1995 and 1999. However, the Dutch venture capital market needs to become more transparent,particularly with respect to start-ups.
Key Issues
■ Dutch economic policy during the last decade has beengenerally successful in increasing competition and loweringbarriers to entrepreneurship. Crucial points of attention arenow to (a) evaluate existing programs and make them morefocused, transparent and consistent, (b) lower the legal andadministrative barriers for start-ups and (c) improve knowledgetransfer from universities to new and small businesses.
■ Education still pays little attention to entrepreneurship at most stages and lacks practical application. In 2000, the Ministry of Economic Affairs and the Ministry ofEducation, Culture and Science launched a Commission on Entrepreneurship and Education. Education is now a major part of the government’s entrepreneurship policy.
■ There is a lack of good locations for new enterprises in someareas, particularly in the western part of the Netherlands.
NEW ZEALAND
Level of Entrepreneurial Activity
■ New Zealand has the second highest rate of entrepreneurialactivity of the GEM 2001 countries. More than 1 in every 6 adults (15.6 percent) is engaged in some form of entrepreneurial activity, and the country has the highestproportion of opportunity entrepreneurs.
■ New Zealand also has the highest level of business angelactivity among the GEM 2001 countries. About 1 person in 16 invests in the start-up businesses of other people.
■ New Zealand also ranks high in terms of women entrepreneurs and the intensity of corporate venturing.
Unique National Features
■ New Zealand’s high entrepreneurship rate may be due to thecountry’s isolation and a resulting “can-do” attitude as wellas selective immigration of highly entrepreneurial Maoris and Europeans.
■ Fifteen years of reform have led to a high degree of privatization, liberalization and deregulation of the economy. The commercial and professional infrastructure and the physical resources that entrepreneurs require areabundant and inexpensive.
■ There is a high level of government awareness of the needsof entrepreneurs, and there is a growing interaction betweengovernment and entrepreneurial leaders.
■ Due to New Zealand’s extreme geography, there are regionaldisparities in access to capital, R&D transfer, commercial andprofessional services, and physical infrastructure.
Key Issues
■ Widespread cultural and social attitudes hinder the growth ofentrepreneurship in New Zealand. The media and the publicregard entrepreneurs as dishonest and opportunistic. For sucha large minority, New Zealand’s entrepreneurs and theirneeds are largely invisible. New Zealanders have no regardfor failed entrepreneurs. Fear of failure is listed as a majorreason for not becoming an entrepreneur.
■ Although New Zealand has a conservative financial sector,there has been considerable growth in the amount of venturecapital available. At issue is not the availability of capital somuch as the paucity of investment-ready companies.
■ New Zealanders generally undervalue education.Entrepreneurship is not part of the compulsory curriculum,while standard tertiary business education focuses more on employees and managers than on employers and job creators. Universities are generally not entrepreneurial anddo not focus on the needs of entrepreneurs.

45
NORWAY
Level of Entrepreneurial Activity
■ The proportion of the adult population involved in entrepreneurial activity in Norway (8.7 percent) remainsrelatively high compared with other European countries but is below the GEM 2001 average. It is also lower in2001 than it was in 2000.
■ Entrepreneurship in Norway is almost entirely opportunitydriven. The country has the lowest rate of necessity entrepreneurship among the GEM 2001 countries. Businessangel activity is close to the average of all 29 countries.
■ The involvement of women in entrepreneurship is relativelylow in Norway, with the proportion of women slightly belowthe GEM 2001 average.
Unique National Features
■ Norway has experienced considerable improvement in livingstandards in recent years. By 2001, the country had risen tothe top of the United Nations' rankings of standards of living.
■ Norway’s increased wealth is, to a large extent, due to NorthSea oil activities. Non-resident multinational oil companiesaccount for a large proportion of the revenue from the oilindustry in Norway. Whether or not a greater proportion ofthis income should be spent domestically is a subject ofintense political debate in Norway.
■ Attitude surveys have revealed a marked aversion to self-employment in Norway. While the proportion of self-employed in the work force has increased slightly since 1996, Norway still has the lowest proportion of self-employed workers among OECD counties.
Key Issues
■ Norway shares the problems that have affected informationand communication technologies with accompanyingdeclines in share prices and company valuations.
■ There now seems to be a political willingness to change the taxation regime that has disadvantaged those who ownmore than two-thirds of their businesses. However, stockoptions are still heavily taxed and there are few incentivesfor private investors.
■ Norway’s rate of unemployment (2.6 percent) is very low byinternational standards. There is a shortage of skilled labor in many professions. At the same time, entrepreneurship andthe principles of the market economy receive little attentionin the education system.
■ The partial privatization of large government controlledcompanies such as Telenord and Statoil and the increasedwillingness to purchase welfare and others services from the private sector is likely to create new entrepreneurialopportunities, as is the increased emphasis on aqua-cultural research.
PORTUGAL
Level of Entrepreneurial Activity
■ In Portugal, 7.1 percent of the adult population is involved in entrepreneurial activity, placing the country among theleast active of the GEM 2001 countries. The rate, however, is relatively close to those of Portugal’s nearest Europeanneighbors.
■ Portugal has relatively few business angels. Only 1.4 percentof the adult population invests in new ventures, a rate that,among European GEM countries, is only higher than theNetherlands.
■ Less than 5 percent of women in the adult population areinvolved in the creation of new businesses, in comparison tomore than 10 percent of men. The ratio of women to men islower in Portugal than in most GEM 2001 countries.
Unique National Features
■ Portugal’s accession to the European Union has brought theparticipation of external interests in the country’s economicstability and development. This is a positive step towardestablishing consistency in public and economic policy.
■ Although isolationist policies came to an end in the 1970s,some of the same cultural mindset persists. The ability tocompete and innovate in a global business environment is still lacking. The problem is aggravated by the country’speripheral position in Western Europe and its smalldomestic market.
Key Issues
■ The prevailing social attitude in Portugal is one of dependenceupon established corporations and the public sector for jobsand security. Entrepreneurship is neither an expected norrespected career choice, and failure is deemed unacceptable.
■ A financial system that can provide sufficient support forentrepreneurship continues to develop, but further progressis needed. Risk aversion still dominates the banking industry,which has traditionally controlled the supply of venture

T h e S t a t e o f E n t r e p r e n e u r s h i p : C o u n t r y S u m m a r i e s
46
capital in Portugal. The financial sector is generally not anaccessible source of seed capital for entrepreneurs.
■ The educational system is widely regarded as key to shiftingcultural attitudes in Portugal. It is believed that improvededucation will remove many of the social, political andstructural obstacles to new business creation.
SINGAPORE
Level of Entrepreneurial Activity
■ Singapore had one of the lowest rates of entrepreneurialactivity among the GEM 2001 countries (5.2 percent). Rateswere lower only in Belgium and Japan. The country rankedsignificantly higher, however, in terms of the proportion ofentrepreneurs motivated by opportunity.
■ Business angel activity among the adult population, at 1.8percent, is significantly below the GEM 2001 average of3.1 percent.
■ The balance between men and women involved inentrepreneurial activities is very similar to the average for theGEM 2001 countries.
Unique National Features
■ Singapore’s economy experienced recession in the first half of 2001, due to a sharp fall in manufacturing exports,especially electronics exports to the United States. As aresult, unemployment among the less skilled has increased.
■ In 2001, the Singapore government continued to promotetechnology entrepreneurship through the Technopreneurship21 initiative, launched in 2000, and a new Life Science program aimed at promoting the development of the lifesciences sector.
■ Falling share prices and sluggish growth in the UnitedStates and world economy have dampened enthusiasm intechnology start-ups. Although a significant amount of venture capital was raised in 2000 and 2001, venture capitalfunding to new start-ups has fallen sharply.
■ The small size of Singapore’s domestic market and the general weakness in the economies of the region has madeit more difficult for start-ups to grow without exporting.Those seeking funding therefore have to demonstrate an ability to penetrate global markets.
Key Issues
■ The business angel prevalence rate in Singapore remainslow despite the high household savings rate and availabilityof venture capital. Government policy has promoted thedevelopment of formal venture capital and should now focuson informal investments.
■ The bursting of the Internet bubble has highlighted the need forSingapore not only to encourage entrepreneurship in generalbut entrepreneurship based on real technological innovation.The ratio of R&D expenditure to GDP has increased steadily tomore than 1.8 percent. However, a large proportion is dedicatedto incremental development rather than basic research and thedevelopment of intellectual property.
■ At the same time, management and global marketing capabilities of start-ups need to be strengthened to enablestart-ups from Singapore to compete globally.
SOUTH AFRICA
Level of Entrepreneurial Activity
■ In terms of the proportion of adults engaged in entrepreneurship, South Africa ranks in the middle (9.4 percent) among GEM 2001 countries. A relatively high proportion of entrepreneurship (31 percent) is motivated by necessity.
■ More than 1 person in 25 has invested in a start-up businessin South Africa. This is a relatively high proportion and ranksthird among the GEM 2001 countries.
■ The ratio of women to men involved in entrepreneurial activityin South Africa is very similar to the GEM 2001 average.
Unique National Features
■ South Africa’s economy has been dramatically liberalized following several decades of isolation and protection.Although the economy is stable, growth remains weak.
■ Historically, the economy has been highly concentrated, dominated by a handful of large state-owned enterprises and corporations, and relying heavily on commodities in mining and agriculture. Until the 1990s, policy makers largely neglected smaller entrepreneurial enterprises.
■ South Africa is a country of stark contrasts, socially, economically and geographically. In urban areas, sophisticatedindustrial centers contrast with informal settlements. In ruralareas, commercial agriculture contrasts with communities

47
lacking the most basic services and relying on remittancesfrom migrant workers. A highly educated, globally mobileminority contrasts with the majority who faces poverty andhigh unemployment.
Key Issues
■ Previous apartheid policies prevented black people fromowning and running businesses, and many black SouthAfricans have little business experience. Despite a recentexplosion of entrepreneurial activity, successful entrepreneursdo not receive wide recognition. Professional or corporatecareers are held in greater esteem than business ownership.
■ In the past, the education system and an authoritarian societyactively discouraged creativity and independence, leadingmany South Africans to have a negative view of their abilityto succeed on their own. The new school curriculum has astrong focus on entrepreneurship and management skills.However, lack of basic literacy and numeracy, as well asmore technical skills, continues to exert a serious constraint.
■ Access to micro-enterprise finance is limited. Poverty, a lackof resources and a lack of business skills and experiencemake it difficult for many potential entrepreneurs to accessfinancial resources.
■ The administrative burden placed on small firms by therequirements of legislation is substantial and discouragesmany entrepreneurs from formalizing their businesses.
SPAIN
Level of Entrepreneurial Activity
■ The level of entrepreneurial activity in Spain (7.8 percent) isaround the average of all European GEM 2001 countries.There is a greater prevalence in Spain than in most otherEuropean countries of entrepreneurs who are involvedthrough necessity.
■ A relatively high and growing proportion of individuals inSpain (3.6 percent) invest in new start-up businesses.
■ Entrepreneurship among women is high in Spain relative tothat of men. Whereas, on average, twice as many men areinvolved in entrepreneurial activities, in Spain there is almostgender equality.
Unique National Features
■ It was not until the late 1990s that an entrepreneurial culture really began to take root in Spain, especiallyamong young adults. However, there continues to be ahigh level of risk aversion and a preference for a stableincome in a state-owned company or in the public sector.
■ Social and cultural norms continue to hinder entrepreneurship.There is still little acceptance of entrepreneurial success.
■ Government policies in Spain are becoming more consciousof the importance of entrepreneurship. But short-term attitudes within both government and the financial systemstill hinder the development of an entrepreneurial culture.
Key Issues
■ Access to financing continues to act as a restraint onentrepreneurial activity in Spain. Retail and savings banks,in particular, are criticized in this respect.
■ Government policies still concentrate on the short term,often neglecting longer-term issues such as the fostering of entrepreneurship. There has been a recent improvement in the degree of support for entrepreneurship, but anexcessive regulatory burden and differences betweenregional governments persist.
■ University education in Spain is criticized for its failure toaddress real business issues in general and for its lack offocus on entrepreneurship in particular.
SWEDEN
Level of Entrepreneurial Activity
■ Approximately 1 in 14 adults (6.7 percent) is engaged inentrepreneurial activities in Sweden, somewhat below the GEM 2001 average. About 82 percent of Swedishentrepreneurs are opportunity driven.
■ Sweden’s business angel rate of 3 percent is close to theGEM 2001 average and similar to the levels seen in the otherScandinavian countries of Denmark, Finland and Norway.
■ The level at which women are involved in entrepreneurialactivities relative to that of men is higher in Sweden than the majority of GEM 2001 countries.

T h e S t a t e o f E n t r e p r e n e u r s h i p : C o u n t r y S u m m a r i e s
48
Unique National Features
■ The Swedish economy continues to depend strongly onexports. It is very open and influenced by changes in globaleconomic conditions. The slowdown in the world economyand the adverse movement in share prices, especially ininformation and communications technologies, have putpressure on the Swedish currency.
■ The public sector in Sweden accounts for a significant proportion of GDP. This can act as a barrier to entrepreneurialactivity, especially among women who are more highlyrepresented in the public sector workforce than in the private sector.
■ Sweden’s business environment is generally favorable.However, the climate for entrepreneurs is less positive due tofactors such as the high level of personal income tax.
Key Issues
■ There are a number of historical impediments toentrepreneurship in Sweden. Notable among them are (a)owner-managers’ reluctance to share equity, (b) the lack ofattention given to entrepreneurship in education, (c) negativeattitudes toward entrepreneurial failure and a lack of positiverole models and (d) an egalitarian bias reflected in sustainedefforts to narrow income differentials.
■ Structural constraints include high income tax rates and highwage costs, excessive regulation and the existence of astrong social security system that provides better supportfor employees than it does for entrepreneurs.
■ Entrepreneurship education has become more common at all levels in the Swedish education system. Many initiativeshave been launched in recent years at both high school andcollege levels. However, many students still do not have theopportunity to take any entrepreneurship courses.
UNITED KINGDOM
Level of Entrepreneurial Activity
■ The United Kingdom has a level of entrepreneurial activity (7.7 percent) that is slightly below the average for the 29 GEM 2001 countries and little changed from the level in 2000.
■ In the United Kingdom, 2.6 percent of the adult populationinvests in start-up businesses. This is below the GEM 2001average of 3.1 percent.
■ The participation of women in entrepreneurial activitiesrelative to that of men is low in the United Kingdom. The rate for women is less than one-third that for men.
Unique National Features
■ In terms of the general business and regulatory environment,conditions in the United Kingdom are conducive to entrepreneurship. The United Kingdom ranks lowest in the OECD index of barriers to entrepreneurship, which measures factors such as permits, licenses, the complexityof rules and administrative burdens.
■ The United Kingdom has the most highly developed venturecapital market in Europe, representing 37 percent of totalfunds raised in Europe.
■ The government has put entrepreneurship at the heart of itsbusiness policy agenda with a focus on reducing regionaldisparities in start-up rates and removing barriers so thatopportunities are available to all regardless of background.Policy proposals include reform of bankruptcy and insolvencylaws, changes to capital gains tax and the encouragement ofentrepreneurship through education.
■ There remain relatively wide regional variations in entrepreneurial activity throughout the United Kingdom.
Key Issues
■ The main issue of concern expressed by industry experts isthat of cultural and social attitudes to entrepreneurship.Despite an improvement over recent years, partly due to the“dot-com” phenomenon and positive government rhetoric,prevailing attitudes remain negative toward wealth creation,self-employment and business failure.
■ Other barriers to entrepreneurship are the availability offinancing, particularly for certain groups in society, individualrisk aversion and government regulation. There is also concern about a lack of skills and growth aspirations amongentrepreneurs, a non-supportive education system and lowlevels of basic education.
■ Areas in which the United Kingdom is seen as successfullysupporting entrepreneurship are the development of theventure capital industry, macroeconomic stability andincreased levels of technology transfer from universities.

49
UNITED STATES
Level of Entrepreneurial Activity
■ In the United States, 11.7 percent of the adult population isinvolved in the creation and growth of start-up businesses,lower than the rate in 2000, but still among the highest ofthe GEM 2001 countries. The United States has the highestproportion (89 percent) of opportunity-based entrepreneurs.
■ Business angel activity is high in the United States, with 5.3percent of adults investing informally in start-ups.
■ Entrepreneurial activity among women in the United States is among the highest of the GEM 2001 countries.
Unique National Features
■ American culture embraces change and opportunity seeking.Entrepreneurship is an accepted occupation. Failure isaccepted as a learning experience, and entrepreneurs oftenrepeat their efforts to launch new businesses.
■ The sudden and sharp decline in information and communications technology sectors is having a severely negative effect on entrepreneurs seeking venture capital inthose sectors.
■ Venture capital funding, particularly in technology sectors,declined dramatically between 2000 and 2001. Total venturecapital investment through the second quarter of 2001 was$22.8 billion, 58 percent below the same period in 2000.
■ Women are increasingly active in entrepreneurship in theUnited States, and there are a variety of initiatives under way to enhance the managerial and leadership skills offemale entrepreneurs.
Key Issues
■ There is growing concern over gaps in the range of fundingavailable for start-ups. Experts indicate that it is becomingincreasingly difficult to fund projects between $500,000 and$5 million. Therefore, there may be just cause for expandingthe business angel network to fill the gap. Given the recentslowdown in the economy, equity resources have tightened,exacerbating the seed capital gap.
■ Women and minorities continue to have difficulty in raisingcapital. This is most prevalent in many “non-traditional” andservice industries. Women create 70 percent of jobs and own26 percent of privately-held companies, but they receive only4.4 percent of venture capital.
■ There may exist an underlying distrust between the scientific and business communities to the detriment of the technology transfer process.
■ Rural areas need improvements in the communicationsinfrastructure. The divide between urban and rural entrepreneurship will increase without such an infrastructure.

50
It is clear that entrepreneurial activity, throughits contributions to growth and adaptation, is animportant feature of modern economic life. Theevidence that new and growing firms are a majorsource of net job creation in developing countriesassures us that the entrepreneurial process makes asignificant and systematic difference. But givenwhat we know, what can national governments doto accelerate the entrepreneurial process?
Determining the priority issues and developingrecommendations for national policy is complicatedby several of the leading findings from GEM 2001.First, many of the factors associated with higherlevels of entrepreneurial activity, like the agedistribution of the adult population, are difficult toaffect. Second, factors associated with higherlevels of opportunity and necessity entrepreneurshipform a complicated set of inter-relationships. Somefactors, such as the level of high-tech imports, havethe same association with both opportunity andnecessity entrepreneurship. Many factors affect oneform of activity but not the other, and a few affectone form in the opposite way they affect the other.Lastly, any resulting policy implications, if they areto be effective, will be different for countries atdifferent levels of economic development. This scenario is particularly complicated for developing countries where a number of factorsassociated with national economic developmentalso have a negative association with necessityentrepreneurship.
Despite these limitations, the GEM initiativehas added tremendous insights to ourunderstanding of the role of entrepreneurship andthe contextual and personal factors that lead tohigher levels of entrepreneurial activity. Obviously,more work is needed. However, clear and directpolicy implications are evident in the findings. Thefollowing propositions seem to apply to allcountries regardless of their level of economicdevelopment.
■ Enhance education — general andentrepreneurship-specific. A strongcommitment to education, both general andentrepreneurship-specific, is clearly justifiedacross all national contexts. Not only arethose with limited education less likely toparticipate in entrepreneurial initiatives, those
that do tend to match their businessaspirations to their skills and knowledge. As a consequence, those with less educationtend to emphasize less ambitious business-formation activities. The resulting businessesoften make relatively little economiccontribution beyond employing theentrepreneur. There has consistently been ahigh level of association between educationalattainment, confidence in one’s skills toimplement a start-up business andparticipation in entrepreneurial initiatives.
■ Simplify government regulations. The GEM 2001 assessment clearly identifiedgovernment regulatory burdens as a majordeterrent to higher levels of entrepreneurialactivity. When national policies are developedin consideration of only large established firms,those policies can become disproportionatelyexpensive for entrepreneurial firms tounderstand and follow. Despite theentrepreneurial community’s perception ofmany government policies as overly intrusive,successful entrepreneurs are concerned aboutthe difficulty in understanding how a specificpolicy applies to their business. Given theGEM 2001 findings, the greatest negativeimpact of a burdensome regulatory systemmay be the time and cost these regulationsplace on starting new businesses, a criticalelement in any healthy economy.
■ Strike a balance between economicsecurity and self-sufficiency. GEM 2001revealed a strong negative association betweenthe level and duration of unemploymentbenefits and the prevalence of necessityentrepreneurship. National policy should strive to balance the need to protect theunemployed with the need to encouragehigher levels of individual self-sufficiency. If a country is to fully realize its potential forentrepreneurial activity, its government shouldavoid creating a welfare state where everyoneis provided for regardless of personalinitiative. However, policy makers should beequally aware of the fact that not everyone can,will or should choose to be an entrepreneur.Thus, the goal of any social security initiative
I m p l i c a t i o n s f o r P u b l i c P o l i c yI m p l i c a t i o n s f o r P u b l i c P o l i c y
51
should be to provide the context in which individual citizensare motivated to recognize and pursue entrepreneurialopportunities.
■ Compensate for gaps in the population age structure.Across the 29 GEM 2001 countries, participation of adults in entrepreneurship is highest between the ages of 25 and 44. For men, the level of participation overall drops off rapidly after age 44. For necessity entrepreneurship,however, the drop in male participation begins as early as 25 years of age. Countries with a relative shortage ofthese mid-career adults or a projected decline in adults in these age ranges, particularly males, should exploreways to encourage their older citizens to become moreactive in entrepreneurial efforts.
■ Facilitate greater levels of female participation. Womenparticipate in entrepreneurship at about one-half the rate of men across all GEM 2001 countries. As such, there is perhaps no greater initiative a country can take to realizehigher levels of entrepreneurial activity than to encouragemore of its women to participate. However, the solutions arenot that simple. Why women don’t currently participate athigher levels most likely involves their career pursuits as wellas cultural norms and beliefs about the appropriate role ofwomen in society. Changing a country’s core value system is not easy. Such efforts would likely need to begin duringyounger years when the factors that ultimately influencecareer choices are molded. For those women alreadypredisposed to entrepreneurship but in sectors (e.g.,education and social service) where opportunities forentrepreneurship are limited, proper training, strongincentives and celebrated role models may also be effective.
■ Encourage technology commercialization.Entrepreneurship is the means by which societies extractvalue from innovations. As such, an increased investment intechnology development is positively associated with higherlevels of opportunity entrepreneurship. In addition, the manyconnections between technology development and the levelof necessity entrepreneurship suggest a clear wealth creationeffect. The greater a country’s technology investment, thesmaller the number of necessity start-ups. Investments intechnology development appear not only to create newwealth, but also to provide the job creation effect that cutsthe level of necessity entrepreneurship in the moretechnologically sophisticated GEM countries.
A more difficult but equally important task involvesincreasing the social acceptance of entrepreneurship. This isespecially challenging in those societies where individuals are not
encouraged to think and act independently in the pursuit ofpersonal economic gain. Some of the more challengingpropositions include:
■ Emphasize economic adaptation as a collectiveresponsibility. Governments at all levels can promote the view that all citizens share responsibility for change inthe economic system. Modern societies are too complex and change too rapidly for any centralized coordinationmechanism to provide timely adaptation. The role ofgovernment may be to supervise the adaptive process carriedout by private initiatives and to provide incentives for allmembers of society to get involved.
■ Encourage toleration of diversity in personal incomeand wealth. As GEM has indicated, greater diversity inhousehold and personal income is consistently associatedwith higher levels of entrepreneurial activity. As long as thisdiversity reflects appropriate contributions to national economic growth, it should be recognized and accepted. Envyof success and resentment of wealth should not be so strongas to discourage those who may choose to contribute tonational economic adaptation by implementing a new firm forpersonal gain. Governments can ensure that policies reflect arecognition and acceptance of diversity in wealth (e.g., a taxstructure that does not penalize successful firms.)
■ Accept the inevitability of business failures. A key feature of such a shift in social norms is the acceptance ofbusiness termination as a normal, appropriate feature ofmodern societies. Business failure should never be confusedwith personal failure. At the macro-level, business failuresare necessary for the efficient operation and adaptation ofthe economy. When one firm goes out of business, itsresources are acquired and reallocated to productive uses inother businesses. Thus, the constant births and deaths ofbusiness entities has a positive net influence on the nationaleconomy, ensuring an efficient market for moving resourcesto the most productive and beneficial entrepreneurial activity.
The GEM 2001 assessment, involving 29 countries and anenhanced methodology to explore different rationale for pursuingentrepreneurial activity, has clearly led to dramatic newinformation regarding entrepreneurial phenomena — who getsinvolved, why and under what conditions. Also, many newquestions have surfaced. As the GEM program expands the rangeof participating countries in the coming years and builds up alongitudinal portrayal of entrepreneurship and its relationship toeconomic growth, more precise answers will be forthcoming.

52
Global EntrepreneurshipMonitor: The Model andMethodology
GEM is one of the leading internationalresearch programs intended to enhanceunderstanding of the role of entrepreneurship innational economic growth. The GEM researchprogram was derived from an underlying conceptualmodel summarizing the major causal mechanismsaffecting national economies. The model has three primary features. First, it is entirely focused onexplaining why some national economies arestronger and growing more rapidly than others.Second, it assumes that all economic processestake place in a relatively stable political, social andhistorical context. Finally, and perhaps most uniqueto GEM, two distinct but complementarymechanisms are considered to be the primarysources of national economic progress (Figure 15).
The first major mechanism, as illustrated in the top portion of Figure 15, reflects the role of large established firms that provide nationalrepresentation in international trade. It is assumedthat as the general national conditions areappropriately developed, the internationalcompetitive posture of large firms is enhanced. As these firms mature and expand, they createsignificant demand for goods and services in theirhost national economies. This increase in demand signifies market opportunities for many micro, small and medium-sized firms. This scenario isparticularly robust when international exchangesare restricted to stable commodities with littlechange in markets or production technology.
The second primary mechanism driving economic growth, as illustrated in the lower portion of Figure 15, emphasizes the role ofentrepreneurship as the creation and growth of new firms. In this process, another set of contextualfactors, referred to as “Entrepreneurial FrameworkConditions,” intervenes between the social/culturalcontext and the emergence and expansion of new firms. In addition, two critical features in theentrepreneurial process are specified: 1) theemergence or presence of market opportunities and 2) the capacity (i.e., motivation and skill) of the
people to initiate new firms in pursuit of thoseopportunities. The entrepreneurial process isparticularly robust in dynamic market settingswhere success is dictated by higher levels ofcreativity, innovation and speed to market.
Perhaps the greatest value in the GEM modelis the focus on the complementary nature of theunderlying mechanisms, both of which have beenempirically linked to national economic growth.Indeed, large established firms, through technologyspillovers, spin offs and increasing demand forgoods and services, often provide opportunities fornew business initiatives. Entrepreneurial firms,through lower costs and accelerated technologydevelopment, can provide a competitive advantagefor established firms in global competitive arenas.Though previous GEM findings have supported thiscomplementary perspective, it is also clear thatthese processes are extremely complex. The GEMmodel will continue to be adjusted to reflect futureinsights derived from the research effort tounderstand the impact of these mechanisms oneconomic growth.
Methodology
Four types of data have been assembled forthe GEM 2001 assessment: 1) representativepopulation surveys of adults in each GEM 2001country; 2) detailed personal interviews withnational experts on entrepreneurship; 3)standardized questionnaires completed by theexperts in each country; and 4) standardized dataassembled on each country. Professional surveyresearch firms in each country administered theadult population surveys. The firms and the size of each sample are presented in Table 10. Fourinternational survey research firms supervised anumber of countries; about half involved directsupervision by the GEM coordination team.
Sampling procedures varied somewhat, but all of the research firms were able to providesamples that were, when properly weighted,representative of the adult population in eachcountry — urban and rural. Telephone interviewswere utilized in the more developed countrieswhere most households have a telephone. Face-to-face interviews were employed in the
A p p e n d i x

53
more developing countries to minimize any bias toward higherincome households.
The actual GEM interview is conducted in the nativelanguage of each country and the average time is less than twominutes. The completion time ranges from a low of 60 seconds toa high of 15 minutes, depending on the extent of the respondent’sinvolvement in entrepreneurial activity. The first four items arerelated to participation in entrepreneurial activities — starting anew firm, owning and managing a new firm and informallyinvesting in another’s new firm. Anyone engaged in any of theseactivities is asked for additional selected details about that activity.The last six items are for assessing attitudes toward andknowledge of the entrepreneurial climate.
Expert informants were chosen by reputation and referrals torepresent the nine entrepreneurial framework dimensions in theGEM model. The framework dimensions are: financial support, government policies, government programs, education and training,R&D transfer, commercial and legal infrastructure, internal marketopenness, and access to physical infrastructure. Countries thatwere new to GEM in 2001 were asked to complete four interviewsin each of the nine dimensions, while countries that have been in
the GEM consortium for more than one year were asked to complete at least two interviews for each dimension.
More than 950 interviews were completed around the globeto ascertain the perspective of national experts on the factors thathave been shown to influence the level of entrepreneurial activity.The expert questionnaire, like the adult population survey, wastranslated into each country’s native language. The interview guideincluded the adult population survey items, 69 five-point scaleitems covering 13 topics and several socio-demographic items.Sixteen multi-item scales were developed from the 69 fixedresponse items, all with acceptable levels of reliability.
Standardized cross-national data on a variety of nationalcharacteristics and attributes (e.g., growth in GDP) were assembledfrom a wide range of harmonized international sources. Sourcesincluded the United Nations, Eurostat, ILO, U.S. CensusInternational Data Base, World Bank, and International MonetaryFund, among others. The GEM coordination team consolidated theadult population survey data and the final total data set. The data were then distributed to the national teams for their use inpreparing individual national reports.
GEM Conceptual Model
Figure 15Figure 15
Social, Cultural,Political Context
General NationalFrameworkConditions
EntrepreneurialFrameworkConditions
MajorEstablished
Firms
EntrepreneurialOpportunities
Micro,Small and
Medium Firms
EntrepreneurialCapacity
BusinessChurning
NationalEconomic
Growth

A p p e n d i x
54
Table 10: Survey Research Firms and Sample SizesTable 10: Survey Research Firms and Sample Sizes
Country Data Collection Organization Coordinated by Sample Size
Argentina MORI Argentina GEM Coordination Team 2,000
Australia AC Nielsen AC Nielsen, International 2,072
Belgium Taylor Nelson Sofres Taylor Nelson Sofres 2,038
Brazil Instituto Bohilha GEM Coordination Team 2,000
Canada Market Facts, Canada TeleNations Global 2,016
Denmark GfK Danmark A/S TeleNations Global 2,022
Finland Taylor Nelson Sofres-MDC Taylor Nelson Sofres 2,001
France AC Nielsen AC Nielsen, International 1,992
Germany Taylor Nelson Sofres EMNID Taylor Nelson Sofres 7,058
Hungary MEMRB, Hungary MEMRB Worldwide 2,000
India AC Nielsen AC Nielsen, International 2,011
Ireland (1/2) Taylor Nelson Sofres: GEM Coordination Team 1,000
Ireland (2/2) Irish Marketing Surveys GEM Coordination Team 1,000
Israel Bandman GEM Coordination Team 2,055
Italy Nomesis GEM Coordination Team 2,002
Japan Nippon Research Ctre GEM Coordination Team 2,000
Korea Hankook Research GEM Coordination Team 2,008
Mexico ORC International GEM Coordination Team 2,014
The Netherlands Survey@ GEM Coordination Team 2,013
New Zealand DigiPoll GEM Coordination Team 2,000
Norway TeleNations Global TeleNations Global 2,874
Poland MEMRB, Poland MEMRB Worldwide 2,000
Portugal Metris GEM Coordination Team 2,000
Russia MEMRB, Russia MEMRB Worldwide 2,012
Singapore Joshua Research Consultants GEM Coordination Team 2,004
South Africa (1/2) Markinor GEM Coordination Team 1,999
South Africa (2/2) AC Nielson, SA AC Nielsen, International 3,284
Spain Dympanel Taylor Nelson Sofres 2,016
Sweden SKOP GEM Coordination Team 2,056
United Kingdom Taylor Nelson Sofres Taylor Nelson Sofres 5,528
United States Market Facts TeleNations Global 3,012
Total interviews 72,087

1 The procedures for calculating the total TEAIndex have been revised since the GEM 2000report was released. Adjustments were madeto (a) compensate for failure to properlyreclassify nascent firms as new firms and new firms as nascent firms and (b) account forvariation among countries in the proportion ofrespondents that provided “don’t know” or“refusal” responses to the screening itemsrelated to entrepreneurial activity. The resulthas been an increase in prevalence rates for anumber of countries, although the rank orderof countries has not been dramaticallyaffected. TEA prevalence rates for 2000 wererecalculated to allow a precise comparisonwith 2001 TEA rates. Recalculation of 2000data for Ireland was not possible.
2 The sample weight for each respondent was adjusted by multiplying the weight by the ratio of total population 20 to 64 yearsof age by the size of the sample. This was done individually for each country.Following this, the sum of the populationweight variable was standardized to equal thesum of the cases. The actual weights thenvaried from 0.02 to 12.00, reflecting the wide range in population sizes foundamong the GEM 2001 countries.
3 All start-up businesses, new businesses and businesses receiving informal fundingwere coded by the GEM coordination teamusing the International Standard IndustrialClassification [ISIC], Third Revision, asdescribed in United Nations’, InternationalStandard Industrial Classification of allEconomic Activities, Third Revision, New York:United Nations’ Statistical Papers, Series M,No. 4, Rev 3, 1990.
4 All measures of national economic growth are taken from the InternationalMonetary Fund World Economic OutlookDatabase, May 2001, found athttp://www.imf.org/extyernal/pubs/ft/weo/2001/01/data/index.htm.
5 Data on educational attainment was availablefor all countries except Australia, Brazil,Ireland, Mexico and Spain. The fourclassifications were designed to emulatethose used by OECD in classifying educational programs. A small number of respondents,less than 1 percent, with no education were placed in the not completed secondaryeducation category.
6 Data on household or personal income wasavailable for all GEM 2001 countries exceptBelgium, Ireland, the Netherlands, Spain andthe United Kingdom. Distributions had fromtwo to a dozen categories so the allocationinto thirds was approximate for mostcountries.
7 GDP per Capita is based on measures from theWorld Economic Outlook Data Base (see EndNote 4). Human development index taken fromthe United Nations Development Program,Human Development Report 2000; NYC,United Nations, 2000.
8 See “Measuring Globalization”, Foreign Policy,January/February 2001, pg. 56-65.
9 Data are taken from the World Bank, WorldDevelopment Indicators, Washington, D.C.,2001, Table 2.3.
10 Data are from the International LaborOrganization, World Labor Report 2000:Income Security and Social Protection in aChanging World, Geneva, International LaborOrganization, 2000, Table 14.
11 Data are from Organization for Economic Co-operation and Development, Making WorkPay, Paris, France: OECD, 1997, Table 2, pg.20; single and couple gross replacement ratesfor 1994/1995 were averaged for this analysis.
12 United Nations Development Program, HumanDevelopment Report 2000; NYC, UnitedNations, 2000.
13 Data are taken from the World Bank, WorldDevelopment Indicators, Washington, D.C.,2001, Table 1.3.
14 See the World Economic Forum’s, The GlobalCompetitiveness Report 2000, N.Y. Oxford U.Press, 2000.
15 Data are taken from Institute for ManagementDevelopment, World CompetitivenessYearbook: 2001, Laussane, Switzerland; IMD,2001: Employment, total and government,Table 1.4.01 and 1.4.06; total taxes collectedas percent of GDP, Table 2.2.01, and personalincome tax collected as a percent of GDP,Table 2.2.03.
16 Discussion and data taken from Djankov,Simeon, Rafael La Porta, Florencio Lopez-Silanes, and Andrei Schleifer. “The Regulationof Entry,” National Bureau of EconomicResearch Working paper 7892, September2000.
E N D N O T E SE N D N O T E S
55

E n d N o t e s
56
17 Data are from World Development Indicators: 2001, Table 2.8.
18 The specific item, to be answered “yes” or “no,” was “In thenext six months, there will be good opportunities for startinga business in the area where you live?”
19 The specific item on skills used in GEM 2001 was “You havethe knowledge, skill, and experience required to start a newbusiness?” The item on knowing an entrepreneur used inGEM 2000 and GEM 2001 was “You know someonepersonally who has started a business in the past 2 years?”Both required a yes or no response.
20 The items in both the GEM 2000 and 2001 expertquestionnaires included: “In my country … many people knowhow to manage a small business,”… “Many people can reactquickly to good opportunities for starting a new business,” and… “Many people have the ability to organize the resourcesrequired for a new business.” The reliability, Chronbach’sAlpha, was 0.79 for both GEM 2000 and GEM 2001 data.
21 Two items are in this index. “In my country, most youngerpeople believe they should not rely too heavily on the government,” and “In my country, younger people expect tochange jobs and occupations many times before they retire.”Reliability, measured by Chronbach’s Alpha, is 0.49 for theGEM 2000 data and 0.52 for GEM 2001.
22 The items, taken from the ongoing Survey of ConsumerAttitudes at the University of Michigan that is the basis for theconsumer confidence index, were as follows: “Looking ahead,do you think that a year from now you and your family withyou will be better off financially, or worse off, or about thesame as now?” and “In a year from now, do you expect that inthe country as a whole business conditions will be better orworse than they are at present, or just about the same?”
23 Data on venture capital were obtained from industry sources,government sources, the National Venture CapitalAssociation, the European Venture Capital Association, the Australian Venture Capital Journal and the VentureCapital Journal.
24 www.nvca.com/nvca05_02_01.html
25 The 23 nations listed here were Australia, Belgium, Canada,Denmark, Finland, France, Germany, Hungary, India, Ireland,Italy, Japan, New Zealand, the Netherlands, Norway, Poland,Portugal, South Africa, Korea, Spain, Sweden, the UnitedKingdom and the United States. Venture capital data forArgentina, Brazil, Mexico, Russia and Singapore were notavailable for 2000 when this report was written.
26 Creating a standardized estimate of the total amount ofannual informal investments involves several steps. Theprocedure starts with the respondents that said “yes“ to thefollowing item: “You have, in the past three years, personallyprovided funds for a new business started by someone else.This would not include buying publicly traded shares ormutual funds.” They were then asked “Approximately how
much, in total, have your personally provided to thesebusiness start-ups in the past three years?” This total amountwas converted to US dollars (using the exchange rate on 31May 2001) and then divided by three to get an annual figure.The prevalence rate of those that indicate a contribution ismultiplied by the number in the country 18 years and older,including those over 64 who are often a major source of suchfunding. This count of the total of informal investors ismultiplied by the average amount of annual funds provided byall investors. The major problem with these estimates is thehighly skewed nature of the amount invested, which rangesfrom a few dollars to millions. In order to minimize the effectsof extreme outliers, only countries where at least 40individuals provided total financial support estimates fromeither the 2000 or 2001 surveys were included. The result isthat some total estimates are not available for lowprevalence rate countries.
27 Romer, P. (1990). “Endogenous Technological Change.”Journalof Political Economy, 98: 71-102.
28 Schumpeter, J. A. (1996). The Theory of EconomicDevelopment. London, United Kingdom, Transaction Publishers.
29 Acs, Z. J. and D. B. Audretsch (1988). “Innovation in Largeand Small Firms — an Empirical Analysis.”AmericanEconomic Review, 78(4): 678-690.
30 Lundvall, B.A. (ed.) (1992). National Systems of Innovation:Toward a Theory of Innovation and Interactive Learning.London: Pinter Publishers.
31 The nine entrepreneurial framework conditions outlined in theGEM model are financial support, government policies,government programs, education and training, research anddevelopment transfer, commercial and legal infrastructure,internal market openness, access to physical infrastructure,and cultural and social norms (see Figure 15).
32 The GEM national research teams provided summaries of allface-to-face interviews. These summaries identified theexperts’ selection of the primary issues facing their countryand the three most significant problems challenging the levelof entrepreneurship. The summary sheets were coded by theGEM coordinating team and content analyzed to determine (a)how frequently a particular issue was mentioned and (b) howimportant each issue was for each of the nine frameworkfactors. This systematic approach provided an opportunity tosee patterns common to all countries as well as the individualconditions that make a country unique. This rich perspectiveis unprecedented and one of the many features that makesGEM the premier global platform for debating global policyconditions and practices.
33 Although all countries are included in the TEA index, somecountries were not able to compile their data in time for thisphase of the research, and, as such, were not included in thiscomparative analysis.

57
For more information on the Global Entrepreneurship Monitor contact:
Paul D. ReynoldsBabson College/London Business [email protected] or [email protected]/entrep or www.london.edu
S. Michael CampKauffman Center for Entrepreneurial Leadership at the Ewing Marion Kauffman [email protected]
William D. BygraveBabson [email protected]/entrep
Erkko AutioHelsinki University of [email protected]/isib
Michael HayLondon Business [email protected]
For additional copies of this Executive Report, contact:www.entreworld.org888-777-GROW (4769)
The tables and figures presented in this report are available at www.entreworld.org/gem2001.
National reports are available at www.entreworld.org/gem2001 and www.gemconsortium.org.

G l o b a l E n t r e p r e n e u r s h i p M o n i t o r S p o n s o r s
58
Babson College in Wellesley, Mass., recognized internationally as a leader in entrepreneurial management education, grants BS, MBA and custom MS degreesthrough its Undergraduate Program and the F.W. Olin Graduate School of Businessat Babson College, and offers executive development programs to experiencedmanagers worldwide through the Babson School of Executive Education. TheCollege’s for-profit venture, Babson Interactive LLC, develops distance learning programs and business simulations for executives and graduate students. More information about Babson is available at www.babson.edu.
IBM is the world’s largest information technology company, a leader in e-business, with 80 years of leadership in helping companies innovate. IBM’sNetGen division is focused on delivering customized, flexible and scalable Internetsolutions for companies of all sizes. Under the Blue Velocity initiative, IBM’s GlobalNet Generation Business helps service providers as well as emerging technologyand Web-based companies establish their businesses and become profitable inInternet time. For more information visit www.ibm.com/bluevelocity/.
London Business School is the graduate school of business at London University.Founded in 1965, the School this year graduated 600 MBAs, MScs, Masters inFinance and PhDs from 57 countries. With 80 percent of the students and 70 percent of the faculty being non-British, London Business School is the most international institution of higher education in the United Kingdom. In 2001, London Business School served 5,000 executives on short programmes. TheFinancial Times ranked London Business School eighth in the world each of the past three years. You can find out more about London Business School from our Web site www.london.edu.
The Kauffman Center for Entrepreneurial Leadership in Kansas City, Mo., is taking an innovative approach to accelerating entrepreneurship through educational programming and research. Inspired by his passion to provide opportunity for other entrepreneurs, Ewing Marion Kauffman launched theKauffman Center, the largest organization solely focused on entrepreneurial success at all levels – from elementary students to high-growth entrepreneurs. The Kauffman Center is funded by the Ewing Marion Kauffman Foundation. For more information visit our Web site at www.entreworld.org.

11/01 15M