Global economy and aviation do we have room to grow? - · PDF fileGlobal economy and aviation...
24
Airline Industry Economics Advisory Workshop 2016 1 Global economy and aviation – do we have room to grow? 18 January 2017 Brian Pearce Chief Economist, IATA
Transcript of Global economy and aviation do we have room to grow? - · PDF fileGlobal economy and aviation...

Airline Industry Economics Advisory Workshop 2016 1
Global economy and
aviation – do we have
room to grow? 18 January 2017
Brian Pearce
Chief Economist, IATA

Airline Industry Economics Advisory Workshop 2016 2
Room to grow?
• Looking through the cycle
• Potential constraints
• The cycle
Airline Industry Economics Advisory Workshop 2016 3
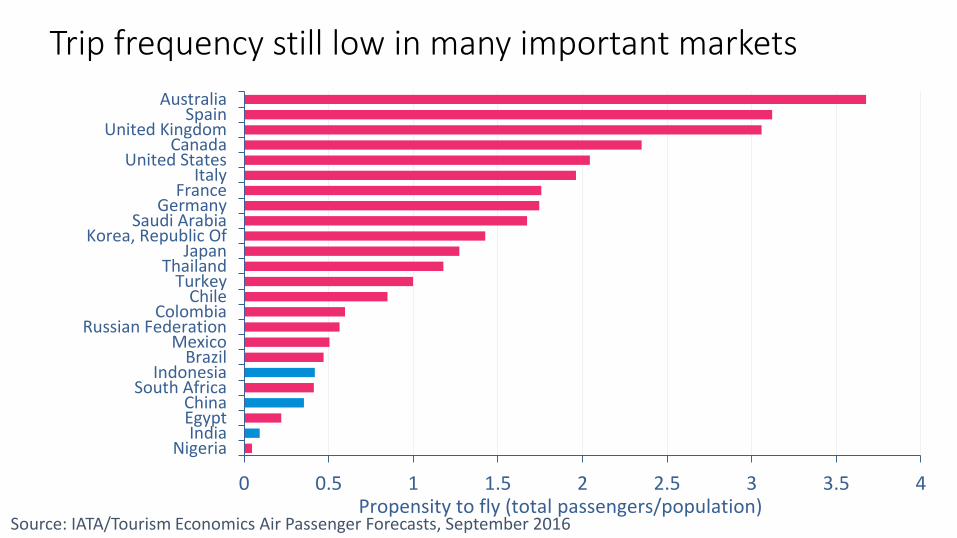
Trip frequency still low in many important markets
0 0.5 1 1.5 2 2.5 3 3.5 4
NigeriaIndia
EgyptChina
South AfricaIndonesia
BrazilMexico
Russian FederationColombia
ChileTurkey
ThailandJapan
Korea, Republic OfSaudi Arabia
GermanyFrance
ItalyUnited States
CanadaUnited Kingdom
SpainAustralia
Propensity to fly (total passengers/population)Source: IATA/Tourism Economics Air Passenger Forecasts, September 2016

Airline Industry Economics Advisory Workshop 2016 4
Living standards still have much room for catch-up
4.8% 4.7%
3.9%
2.5%
1.5% 1.4% 1.3% 1.2%0.9% 0.8% 0.8% 0.8% 0.7% 0.7%
0.0%0.5%
1.0%1.5%2.0%
2.5%3.0%
3.5%4.0%
4.5%5.0%5.5%% CAGR (2015-2035) Growth in per capita incomes over the long run
Source: IATA/Tourism Economics Air Passenger Forecasts, September 2016

Airline Industry Economics Advisory Workshop 2016 5
Multiplier effect of development on some key travel markets
Source: IATA/Tourism Economics Air Passenger Forecasts, September 2016

Airline Industry Economics Advisory Workshop 2016 6
Demographics strong in some key markets, adverse in others
-25%
-20%
-15%
-10%
-5%
0%
5%
10%
15%
20%
25%
30%
35%% change
The UN's projected change in population (2015-2035,%)
UN projections adjusted for demographic factors
Source: IATA/Tourism Economics Air Passenger Forecasts, September 2016

Airline Industry Economics Advisory Workshop 2016 7
Long-term travel growth even in gloomy macro scenario
2
3
4
5
6
7
8
9
2014 2016 2018 2020 2022 2024 2026 2028 2030 2032 2034
Global O-D passenger journeys (billion)
Constant policies scenario
Reflation/open borders scenario
Pick-up in Protectionism scenario
Source: IATA/Tourism Economics Air Passenger Forecasts, September 2016

Airline Industry Economics Advisory Workshop 2016 8
Centre of gravity for aviation moving rapidly East
1914 2004 2015 2035
Source: IATA/Tourism Economics Air Passenger Forecasts, September 2016
Airline Industry Economics Advisory Workshop 2016 9
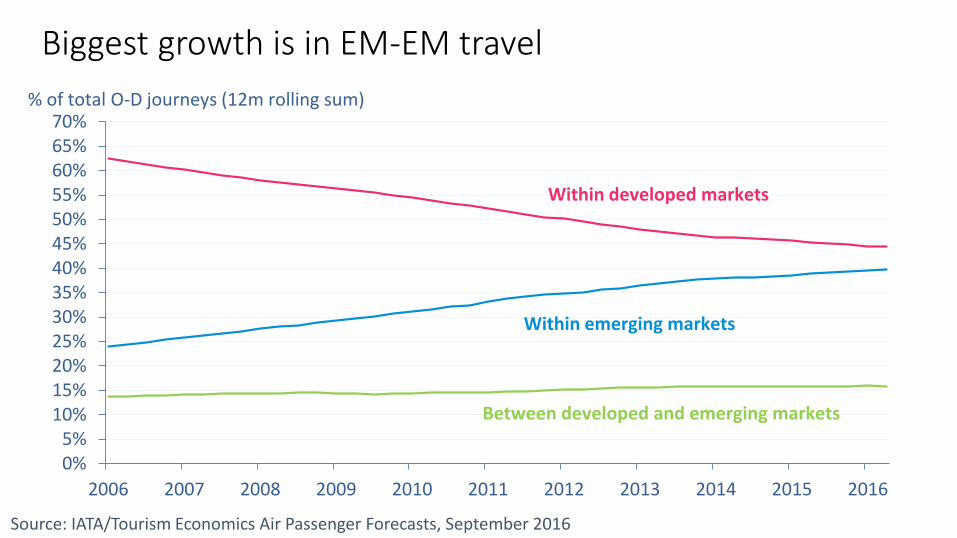
Biggest growth is in EM-EM travel
0%5%
10%15%20%25%30%35%40%45%50%55%60%65%70%
2006 2007 2008 2009 2010 2011 2012 2013 2014 2015 2016
Within emerging markets
Within developed markets
% of total O-D journeys (12m rolling sum)
Between developed and emerging markets
Source: IATA/Tourism Economics Air Passenger Forecasts, September 2016
Airline Industry Economics Advisory Workshop 2016 10
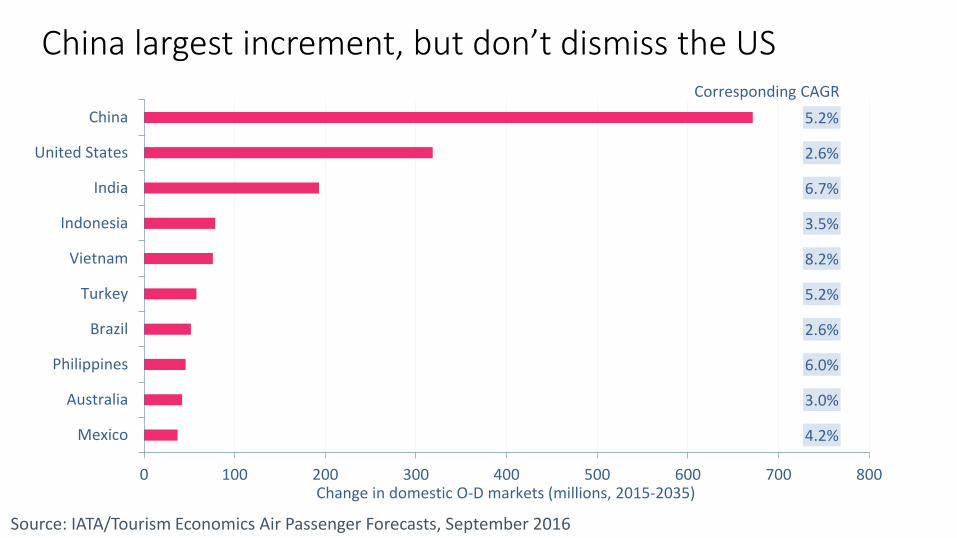
China largest increment, but don’t dismiss the US
4.2%
3.0%
6.0%
2.6%
5.2%
8.2%
3.5%
6.7%
2.6%
5.2%
0 100 200 300 400 500 600 700 800
Mexico
Australia
Philippines
Brazil
Turkey
Vietnam
Indonesia
India
United States
China
Change in domestic O-D markets (millions, 2015-2035)
Corresponding CAGR
Source: IATA/Tourism Economics Air Passenger Forecasts, September 2016
Airline Industry Economics Advisory Workshop 2016 11
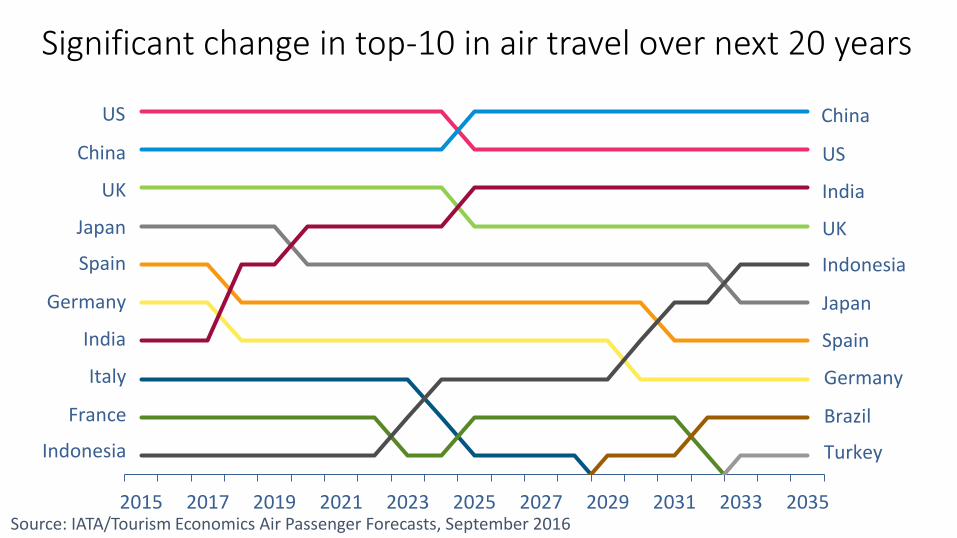
Significant change in top-10 in air travel over next 20 years
2015 2017 2019 2021 2023 2025 2027 2029 2031 2033 2035
US
China
UK
Japan
Spain
Germany
India
Italy
France
Indonesia
China
US
India
UK
Indonesia
Japan
Spain
Germany
Brazil
Turkey
Source: IATA/Tourism Economics Air Passenger Forecasts, September 2016

Airline Industry Economics Advisory Workshop 2016 12
Surely infrastructure will not be a long-run constraint
-2
0
2
4
6
8
10
12
14
16
1982 1986 1990 1994 1998 2002 2006 2010 2014
%
US 10 year Treasury yield and 10 year TIPS real yield
10-year Treasury yield
10-year TIPS real yield
Source: Haver
Airline Industry Economics Advisory Workshop 2016 13
Climate change policy more of a potential constraint
• ICAO agreement for cap on ‘net’ CO2 is good progress
• Longer-term low carbon fuels need to succeed

Airline Industry Economics Advisory Workshop 2016 14
Airlines financial health less of a constraint
0.0
1.0
2.0
3.0
4.0
5.0
6.0
7.0
8.0
9.0
10.0
1994 1996 1998 2000 2002 2004 2006 2008 2010 2012 2014 2016
% o
f in
vest
ed c
apit
al
Return on capital invested in airlines
Cost of capital (WACC)
Return on capital (ROIC)
Source: IATA Economic Performance of the Airline Industry – end year 2016 report

Airline Industry Economics Advisory Workshop 2016 15
Structural change in approach to asset utilization
58
59
60
61
62
63
64
65
66
67
68
2000 2002 2004 2006 2008 2010 2012 2014 2016
% A
TKs
Breakeven and achieved weight load factor
Achieved LF
Breakeven LF
Source: IATA Economic Performance of the Airline Industry – end year 2016 report

Airline Industry Economics Advisory Workshop 2016 16
Solid improvement in capital productivity
0.8
0.9
1.0
1.1
1.2
1.3
1.4
-6
-4
-2
0
2
4
6
8
10
2000 2002 2004 2006 2008 2010 2012 2014 2016
Cap
ital
pro
du
ctiv
ity,
rev
enu
e/in
vest
ed
cap
ital
, US$
Op
erat
ing
mar
gin
, % r
even
ue
Airlines' operating or EBIT margin and capital productivity
Capital productivity
Operating margin
Source: IATA Economic Performance of the Airline Industry – end year 2016 report
Airline Industry Economics Advisory Workshop 2016 17
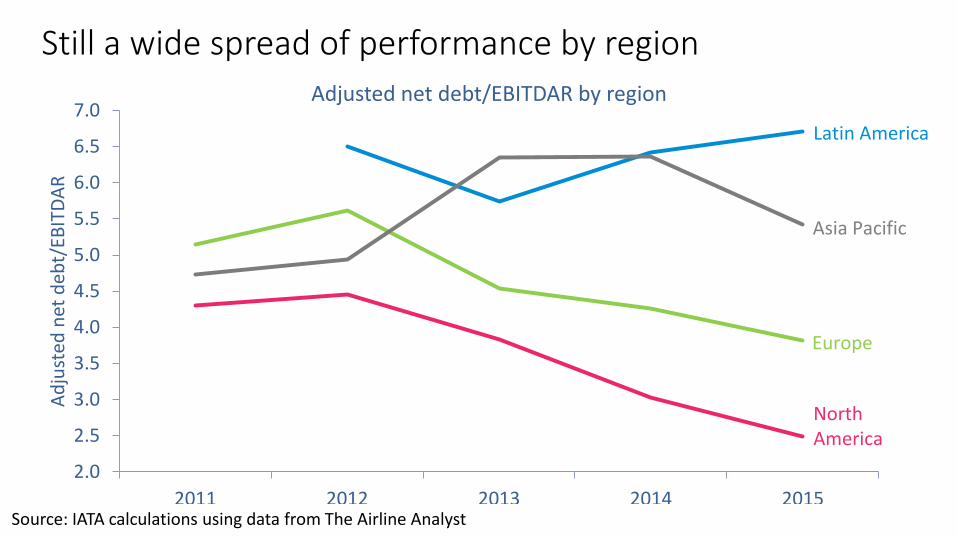
Still a wide spread of performance by region
2.0
2.5
3.0
3.5
4.0
4.5
5.0
5.5
6.0
6.5
7.0
2011 2012 2013 2014 2015
Ad
just
ed n
et d
ebt/
EBIT
DA
R
Adjusted net debt/EBITDAR by region
North America
Europe
Asia Pacific
Latin America
Source: IATA calculations using data from The Airline Analyst
Airline Industry Economics Advisory Workshop 2016 18
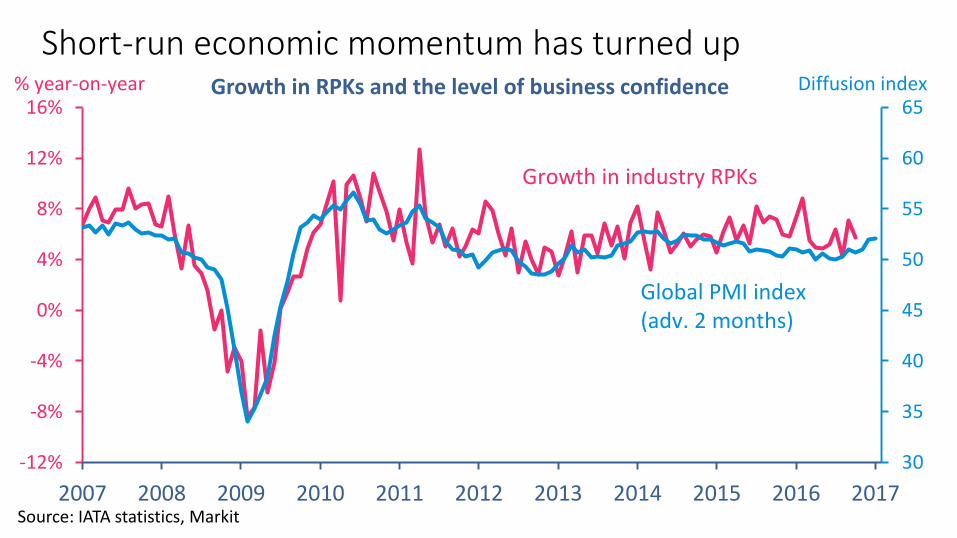
Short-run economic momentum has turned up
30
35
40
45
50
55
60
65
-12%
-8%
-4%
0%
4%
8%
12%
16%
2007 2008 2009 2010 2011 2012 2013 2014 2015 2016 2017
Growth in RPKs and the level of business confidence% year-on-year Diffusion index
Growth in industry RPKs
Global PMI index (adv. 2 months)
Source: IATA statistics, Markit
Airline Industry Economics Advisory Workshop 2016 19
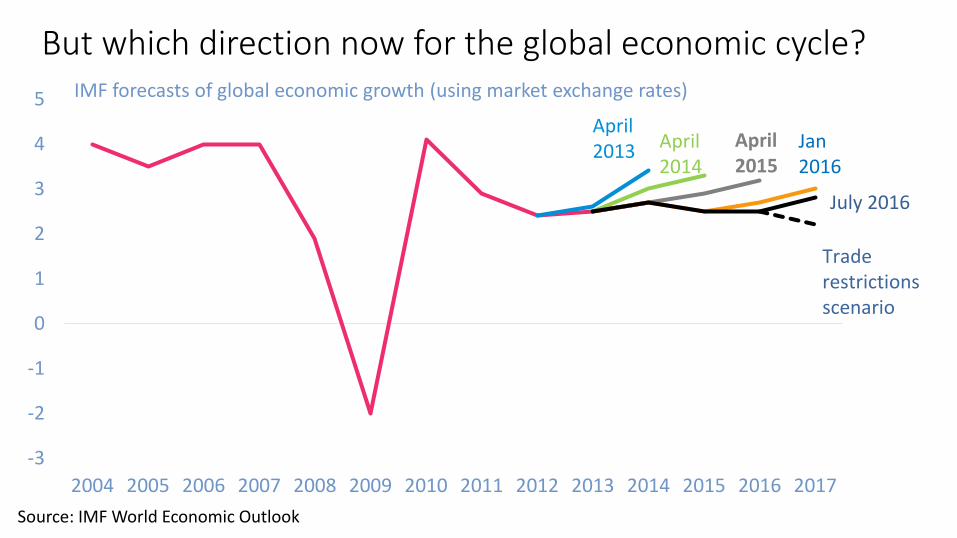
But which direction now for the global economic cycle?
-3
-2
-1
0
1
2
3
4
5
2004 2005 2006 2007 2008 2009 2010 2011 2012 2013 2014 2015 2016 2017
IMF forecasts of global economic growth (using market exchange rates)
April 2013 April
2014April 2015
Jan2016
July 2016
Traderestrictions scenario
Source: IMF World Economic Outlook

Airline Industry Economics Advisory Workshop 2016 20
How strong will up-trend in oil prices be?
50
52
54
56
58
60
62
64
66
68
1
1.5
2
2.5
3
3.5
2011 2012 2013 2014 2015 2016
Day
s o
f su
pp
ly
Mill
ion
bar
rels
pro
du
ctio
n p
er d
ay
OPEC spare capacity and OECD crude oil inventories
OECD crude oil inventories(right scale)
OPEC spare capacity(left scale)
Source: Haver

Airline Industry Economics Advisory Workshop 2016 21
High fuel prices not always bad for airlines
0.0
20.0
40.0
60.0
80.0
100.0
120.0
140.0
160.0
0.0
1.0
2.0
3.0
4.0
5.0
6.0
7.0
8.0
9.0
10.0
2000 2002 2004 2006 2008 2010 2012 2014 2016
Jet
fuel
pri
ce, U
S$/b
arre
l
RO
IC, %
of
inve
sted
cap
ital
Airline industry ROIC and jet fuel prices
ROIC
Jet fuel price
Source: IATA, Platts

Airline Industry Economics Advisory Workshop 2016 22
To sum up
• A look through the cycle is positive, even with gloomy macro
• Potential for multiplier on trip frequency, for some
• Good demographics, for some
• Centre of gravity moving rapidly East
• Some potential constraints to overcome
• Airline financial health better overall but patchy
• Near-term turbulence from the economic cycle and oil prices

Airline Industry Economics Advisory Workshop 2016 23

Airline Industry Economics Advisory Workshop 2016 24
Global Report Country Reports Online database/webtoolAir Passenger Forecasts
October 2014
United States - Passenger Market Overview
Decomposition of growth, 2014-2034
Change in passenger numbers, 2014-2034
Foreign passengers will contribute less to overall growth, representing 31.4% of total growth, equal to 175 million addittional
passengers.
Domestic passengers will represent 68.6% of total growth over this period, accounting for 384 million addittional passengers.
The United States air passenger market is forecast to grow at an average annual growth rate of 3.2% per annum over the next 20
years.
This puts the United States in the 28th percentile of fastest growing markets in our forecast during the period 2014-2034.
Improvements in livings standards contribute 1.4 percentage points to annual growth.
Favourable population and demographic factors are forecast to contribute 0.8 percentage points to annual growth.
Other factors, mainly future technological gains, will contribute 0.8 percentage points per year.
Whilst the United States is in the 28th percentile in terms of fastest growing markets over the next 20 years, it is forecast to be
ranked as the 2nd largest markest based on the total number of passengers in 2034.
The United States is forecast to gain an additional 559 million passengers by 2034, compared to 2014.
3.2%
1.4%
0.8%
0.2%
0.8%
0.0%
0.5%
1.0%
1.5%
2.0%
2.5%
3.0%
3.5%
Total passenger market growth Main drivers
%CAGR
Living standards Population & Demographics Trade Price & Liberalisation
559
68.6%
31.4%
0
100
200
300
400
500
600
Total passenger absolute growth(millions)
Absolute growth by foreign anddomestic
Passenger flowsto and from
(Millions)
Domestic Foreign
Explanation of the main drivers of growth (for more details, see the Global Report)
Living standards: We proxy a country’s standard of living by its level of Gross Domestic Product per capita (ie, the total amount of output produced in an economy each year divided by its population). The living standards channel captures the clear relationship between the number of trips taken on average by inhabitants of a country each year and that country’s standard of living.
Population and demographics: Forecasting air passenger markets requires a further understanding of how many people there will be to demand air travel in the future. This will depend on changes in total population sizes over time as well as changes in demographic structures ; given that older people tend to fly less often than people in working-age groups, air market growth in countries whose populations are projected to age considerably over the coming 20 years is likely to face headwinds.
Trade flows: A high correlation is observed between a country’s trade openness – measured by exports and imports as a proportion ofan economy’s total output – and its propensity to travel. We therefore include Oxford Economics’ forecasts of trade intensity over time into our modelling.
Price and liberalisation: The decline in the price of air travel – that is the cost of air travel in both monetary terms and the time saved by more direct routes – has been a notable feature of the industry over the past 60 years or so. We expect the downward trend in the unit cost of air travel to resume in the future, mainly reflecting new technologies and efficiencies being realized. The introduction of new longer-range mid-size aircraft will connect many more city and country pairs too and lead to considerable time savings for passengers. Future potential for reductions in travel times will also be driven by changes in regulatory regimes.
Air Passenger Forecasts
United States - Top Country Pairs October 2014
Top US country pairs ranked by passenger numbers, 2014-20345 year 10 year 20 year
2014 2019 2024 2034 2014-2019 2014-2024 2014-2034
Rank
(2014)Country
1 US Domestic 438,252 554,280 636,662 822,051 4.8% 3.8% 3.2%
2 Canada 23,733 27,166 30,809 39,084 2.7% 2.6% 2.5%
3 Mexico 21,011 24,531 28,762 41,011 3.1% 3.2% 3.4%
4 UK 13,946 18,283 20,628 26,145 5.6% 4.0% 3.2%
5 Japan 9,557 10,214 10,550 11,485 1.3% 1.0% 0.9%
6 Germany 8,369 9,726 10,997 13,975 3.1% 2.8% 2.6%
7 China 6,334 7,004 8,423 12,358 2.0% 2.9% 3.4%
8 France 6,026 7,166 8,284 11,005 3.5% 3.2% 3.1%
9 Dominican Republic 5,836 6,698 8,171 12,288 2.8% 3.4% 3.8%
10 Brazil 5,659 6,071 7,542 11,739 1.4% 2.9% 3.7%
11 India 4,516 6,035 8,070 13,565 6.0% 6.0% 5.7%
12 Korea 4,512 5,729 6,982 9,289 4.9% 4.5% 3.7%
13 Italy 4,344 4,865 5,537 7,103 2.3% 2.5% 2.5%
14 Colombia 3,195 3,769 4,785 7,539 3.4% 4.1% 4.4%
15 Jamaica 3,053 3,838 4,662 6,782 4.7% 4.3% 4.1%
16 Australia 2,813 3,125 3,423 4,106 2.1% 2.0% 1.9%
17 Spain 2,580 3,243 3,912 5,197 4.7% 4.2% 3.6%
18 Bahamas 2,536 3,265 3,930 5,513 5.2% 4.5% 4.0%
19 Ireland 2,298 2,678 3,315 4,350 3.1% 3.7% 3.2%
20 Switzerland 2,233 2,572 2,930 3,796 2.9% 2.8% 2.7%
Passenger numbers ('000s) CAGR %
The United States domestic market is ranked 1st in 2014, and is forecast to remain as the largest market in 2034; taking 70.6% of the total market in 2034, down from 76.5% in 2014.
Whilst the United States domestic market is the largest market in 2014; the 2nd largest market is Canada, accounting for 3% of total passengers which is forecast to rise marginally to
3.4% by 2034.
The biggest three markets in 2014 are the US Domestic, Canada and Mexico, while in 2034 they are forecast to become the US Domestic, Mexico and Canada respectively.
The largest riser in the 20 year period is forecast to be India rising 5 places to be ranked 6th largest market in 2034.
Whilst the biggest faller in the period 2014-2034 is forecast to be Australia falling 6 places to be ranked 22nd largest market in 2034.
1
2
3
4
5
6
7
8
9
10
11
12
13
14
15
16
17
18
19
20
2014 2015 2016 2017 2018 2019 2020 2021 2022 2023 2024 2025 2026 2027 2028 2029 2030 2031 2032 2033 2034
US Domestic
Canada
Mexico
UK
Japan
Germany
China
France
Dominican Republic
Brazil
India
Korea
Italy
Colombia
Jamaica
Australia
Spain
Bahamas
Ireland
Switzerland
US Domestic
Mexico
Canada
UK
Germany
India
China
Dominican Republic
Brazil
Japan
France
Korea
Colombia
Italy
Jamaica
Bahamas
Spain
Costa Rica
Netherlands
Ireland
www.iata.org/pax-forecast