
Global Economic, Market and Insurance Outlook - iumi.com · ab Page 3 Overview A global growth...
28
ab Global Economic, Market and Insurance Outlook Kurt Karl IUMI 2008 Conference Vancouver, Canada Sept. 2008
Transcript of Global Economic, Market and Insurance Outlook - iumi.com · ab Page 3 Overview A global growth...

abGlobal Economic, Market and Insurance Outlook
Kurt Karl
IUMI
2008 Conference
Vancouver, Canada
Sept. 2008

ab
Page 2
Agenda
Global economic outlook
Outlook for major asset classes
Global P&C outlook

ab
Page 3
Overview
A global growth slowdown is underway, with US basically in a recession.
Inflation remains a problem for Central banks, so monetary easing will be cautious
Market volatility likely to continue. Spreads will remain wide. Equity markets weak at least until end-2008.
Despite impact on asset valuations, P&C market shows few signs of hardening.

ab
Page 4
What is a recession?
Common definition: Two quarters in a row of negative “real” GDP growth (real GDP = after-inflation Gross Domestic Product)
Growth in output of goods and services becomes negative (real income falls), unemployment rises, manufacturing down, sales down
Definition of recession
Expansionary Phase
Slowdown in economy
Recession is certain
Recovery is uncertain
Phases of the business cycle
We’re close to here, right now
Credit spreads become tighter & robust investment opportunities diminish.
Eventually, asset prices are too high, relative to the risk
Markets are volatile and the forecasts for recessions are mixed.
Most indicators imply that a recession is underway.
Market sentiment turns very pessimistic.
There are indications of an economic recovery, but these are inconclusive, so uncertainty is high.
Sources: Swiss Re Economic Research & Consulting
ab
Page 5
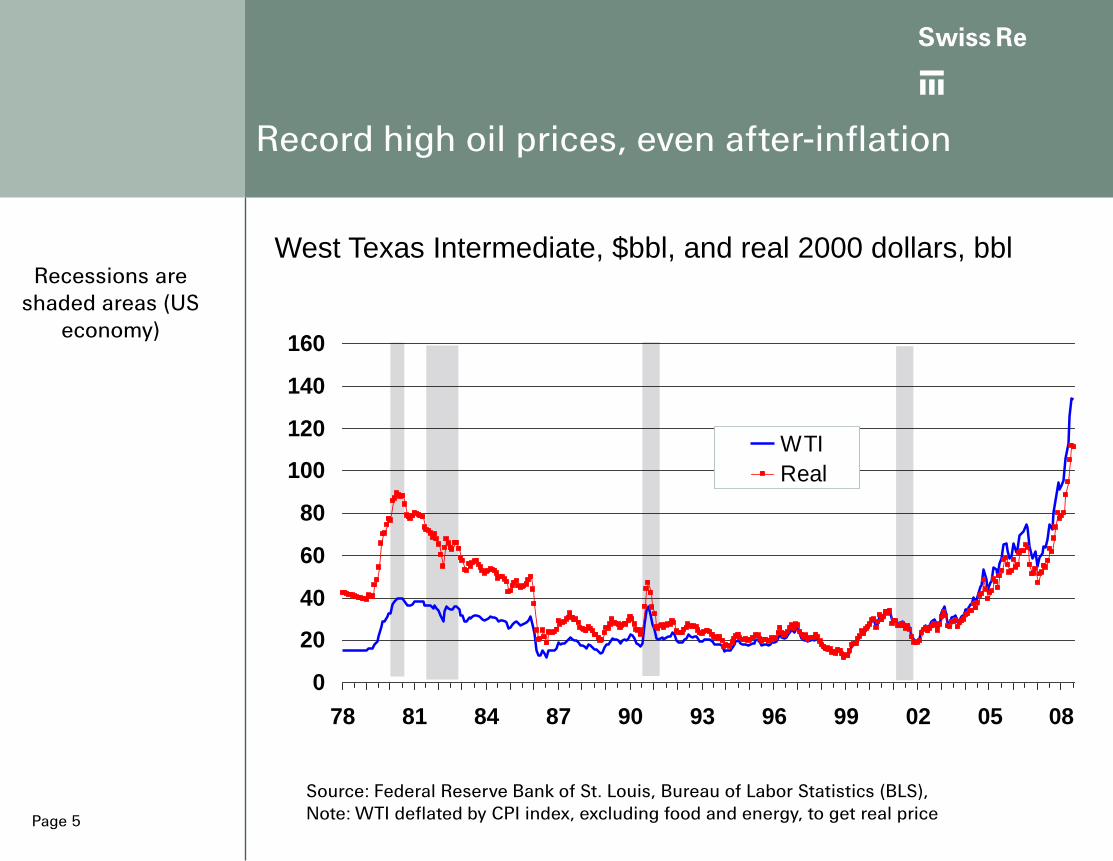
Source: Federal Reserve Bank of St. Louis, Bureau of Labor Statistics (BLS), Note: WTI deflated by CPI index, excluding food and energy, to get real price
West Texas Intermediate, $bbl, and real 2000 dollars, bbl
Record high oil prices, even after-inflation
0
20
40
60
80
100
120
140
160
78 81 84 87 90 93 96 99 02 05 08
WTI
Real
Recessions are shaded areas (US
economy)

ab
Page 6
Sources: World Bank, Swiss Re Economic Research & Consulting
World GDP Growth
0
1
2
3
4
5
6
7
8
61 65 69 73 77 81 85 89 93 97 01 05
GDP growth
Recessions are shaded areas
(Global economy)
Recessions

ab
Page 7
Global Marine Insurance:
Gross Premium Hull vs. World
Gross Tonnage: Uncorrelated
0
1
2
3
4
5
6
94 95 96 97 98 99 00 01 02 03 04 05 06e 07e
0
100
200
300
400
500
600
700
800
900
Gross premiums GT in m
World Hull PremiumIn USD bn
World Fleet Tonnage m
Source: Lloyd’s Register World Fleet Stats / IUMI / Cefor / Swiss Re estimate

ab
Page 8
Global Marine Insurance:
Gross Premium Cargo vs.
International Trade Volume
0
1
2
3
4
56
7
8
9
10
11
12
94 95 96 97 98 99 00 01 02 03 04 05 06 07e
0
2000
4000
6000
8000
10000
12000
14000
16000
Gross Premiums Int.Trade Volume
WorldwideCargo PremiumIn USD bn
WorldwideTrade Volume
in USD bn
Source: Aon Ren Rep / IUMI / Cefor / SR est./World Bank

ab
Page 9
The US-dollar has depreciated, but
appears to be stabilizing
Source: Bloomberg
USD nominal effective exchange rate
70
80
90
100
110
120
130
1995 1997 1999 2001 2003 2005 2007

ab
Page 10
Percent
Source: Bureau of Labor Statistics, NBER, SR Economic Research & Consulting
Inflation rises into a recession, then falls
Inflation is
year-over-year
rate
US All-items CPI and yield on 10-yrTreasury note, 1959 – 2008Q1
0
2
4
6
8
10
12
14
16
59 62 65 68 71 74 77 80 83 86 89 92 95 98 01 04 07
T-note CPI

ab
Page 11
0
1
2
3
4
59 62 65 68 71 74 77 80 83 86 89 92 95 98 01 04 07
Spread, %
Spread of Baa to 20-year T-bondPercent
Credit spreads rise into, then fall after
a recession
Source: Moody’s, Federal Reserve Board, NBER, SR Economic Research & Consulting

ab
Page 12
-30
-20
-10
0
10
20
30
40
50
59 62 65 68 71 74 77 80 83 86 89 92 95 98 01 04 07
Core CPI
Year-over-year
growth, %S&P 500 index
Stock markets tend to decline in
recessions
Source: Standard & Poor’s, NBER, SR Economic Research & Consulting
Stock markets tend to
recover before the end
of recessions. They do
not forecast
recessions
consistently.
ab
Page 13
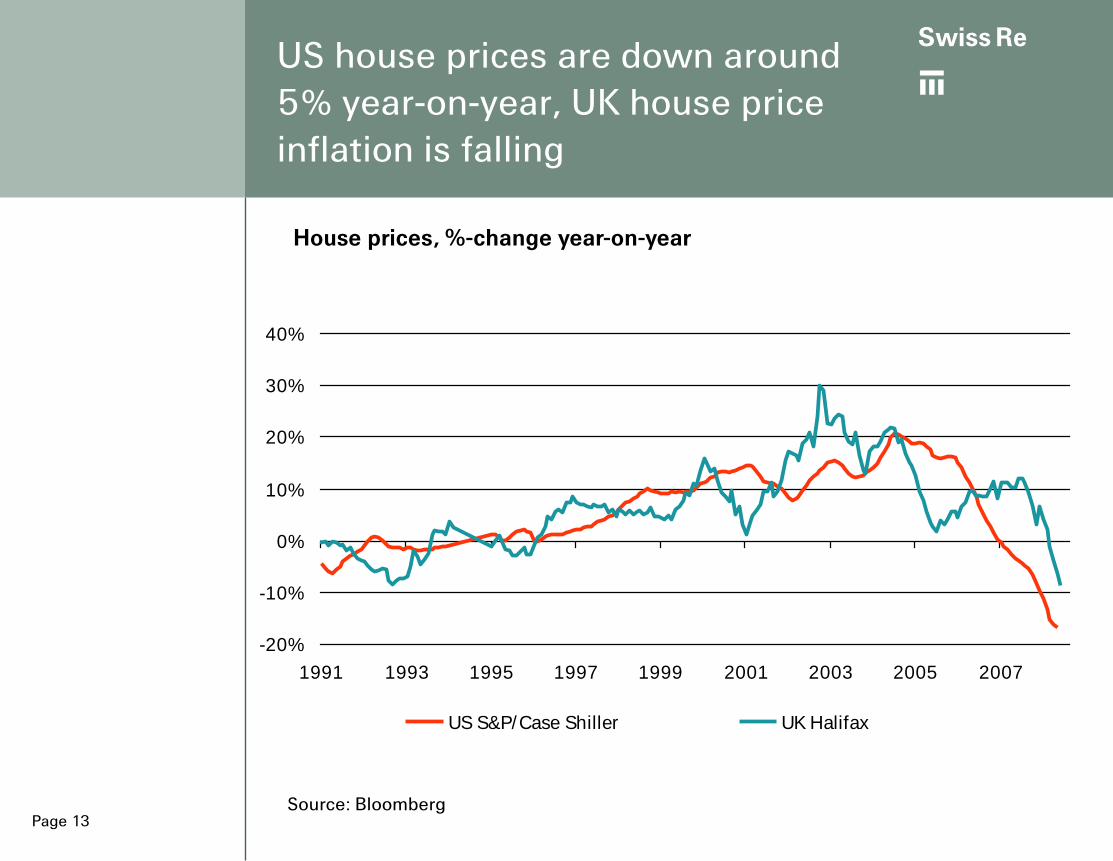
US house prices are down around
5% year-on-year, UK house price
inflation is falling
Source: Bloomberg
House prices, %-change year-on-year
-20%
-10%
0%
10%
20%
30%
40%
1991 1993 1995 1997 1999 2001 2003 2005 2007
US S&P/Case Shiller UK Halifax

ab
Page 14
% change year ago,3-month mov. avg.
Source: National Association of Realtors
-15
-10
-5
0
5
10
15
20
91 92 93 94 95 96 97 98 99 00 01 02 03 04 05 06 07 08
Home prices
Housing prices: signs of a floor?
Single-Family Existing homes sold, median price

ab
Page 15
0
2
4
6
8
10
12
14
16
18
70 73 76 79 82 85 88 91 94 97 00 03 06
UK US Japan Germany
Source: Reuters EcoWin
Long-term bond yields remain low
10-year government bond yields, percent
Government bonds

ab
Page 16
Corporate bond credit spreads
have surged
Source: Lehman Brothers
Corporate bond spreads (Investment grade, basis points, since 1989)
0
50
100
150
200
250
300
90 91 92 93 94 95 96 97 98 99 00 01 02 03 04 05 06 07 08
US Euroland

ab
Page 17
P/E Ratios remain relatively low
Source: Bloomberg
P/E Ratios
Equity marketvaluation
0
10
20
30
40
50
60
70
1990 1992 1994 1996 1998 2000 2002 2004 2006 2008
US S&P 500 EU FTSE Eurotop 100
ab
Page 18
Low cat years 2006 and 2007; strong earnings
Rapid surplus growth, creating overcapacity
Weak pricing across all lines
Declining profitability; underwriting and investment results
Reserves releases support earnings; when is the inflexion point?
Negative premium growth
Investment volatility, subprime crisis
Active regulatory environment in Europe (Solvency II), and in US (election year)
The P&C insurance industry
posted solid results again in 2007

ab
Page 19
Property and business interruption losses(USD billion, at 2006 prices)
$0
$20
$40
$60
$80
$100
19
70
19
72
19
74
19
76
19
78
19
80
19
82
19
84
19
86
19
88
19
90
19
92
19
94
19
96
19
98
20
00
20
02
20
04
20
06
Weather-related Nat Cats Man-made disasters Earthquake/ tsunami
Cat losses were relatively low in
2007/06, but long-term trend is up
Note: NFIP flood losses in US included (since 1970). Source: Swiss Re, sigma No 1/2008
Katrina Rita Wilma (2005)
Ivan Charley Frances (2004)
Sept. 11
Andrew (1992) Lothar (1999)
US cat losses for first and second quarter 2008 are above average

ab
Page 20
2004 2005 2006
98% 98% 95%
4.2% 4.6% 4.1%
11% 11% 12%
Global P&C industry profitability
peaked in 2006
Combined ratio
Investment yield [2]
ROE
[1] Sample of major non-life insurance markets consists of Canada, Germany, France, UK, USA, and Japan [2] including realized capital gains,Sources: A.M. Best, forecasts by Swiss Re Economic Research & Consulting
2007E
97%
3.7%
10%
Key performance indicators for major non-life insurance markets[1]

ab
Page 21
US price trends are down and have
converged between businesses, similar
globally
-20%
-15%
-10%
-5%
0%
5%
10%
15%
3Q05 1Q06 3Q06 1Q07 3Q07 1Q08
Manufacturing Contracting
Service Habitational
Public Entity Transportation
Energy
-20%
-15%
-10%
-5%
0%
3Q05 1Q06 3Q06 1Q07 3Q07 1Q08
Small Medium
Large Jumbo
Source: MarketScout, Economic Research & Consulting
Commercial rate trendsby industry group
Commercial rate trendsby client size
ab
Page 22
90
95
100
105
110
115
120
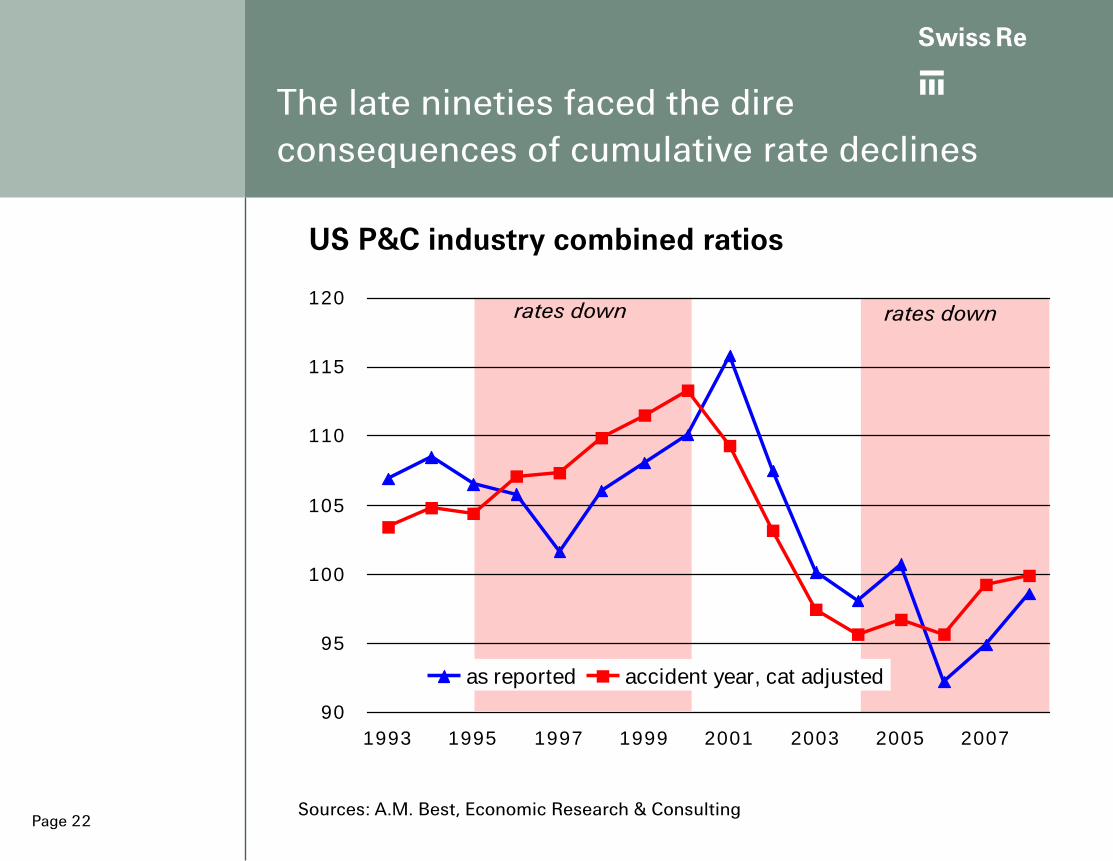
1993 1995 1997 1999 2001 2003 2005 2007
as reported accident year, cat adjusted
The late nineties faced the dire
consequences of cumulative rate declines
Sources: A.M. Best, Economic Research & Consulting
US P&C industry combined ratios
rates down rates down

ab
Page 23
Effects of the credit crisis on
insurers
Effects on insurance companies as investors
– Subprime exposure, but this is manageable
– Equity market volatility, spreads widen
– Government bond yields remain low
Effects on insurance companies as providers of insurance coverage
– D&O/E&O insurance policies
– Mortgage guaranty / Monoline financial guarantors
Insurers face higher costs of capital
– Prices for equity and hybrid capital have declined
– Credit spreads widened
– Leveraged capital is withdrawing from the insurance space

ab
Page 24
Inflation risks and insurers
Inflation rising globally
Risk
Oil, food and commodity prices rising
Steel prices up 200% since 2001
Weak USD boosts inflation in US and EMs with dollar-pegs
Expectation: Inflation will moderate with global growth
Insurers long-tail lines could fare well under this scenario
Risk: Severe recession scenario: elevated inflation, substantially higher short term rates (even Fed needs to raise rates), higher long-term rates and substantially lower stock markets and more defaults
Insurers’ long-tail lines – not so well!
Insurers’ assets – not so well either!
Risk: Severe recession from worsening credit crisis

ab
Page 25
Industry trends require
maintaining underwriting discipline
Slow growth environment ahead
Rates will be falling through 2008-09 resulting in deteriorating accident year loss ratios
Frequency and severity of weather catastrophes will likely increase, compared to 2006 and 2007
Favorable loss reserve contributions from prior years will shrink
High volatity, low expected investment returns in all asset classes in the medium-term
M&A can be expected to continue and possibly accelerate in 2008-09
Disciplined underwriting, protecting earnings, and capital management are crucial, particularly with the low investment yields
ab
Page 26
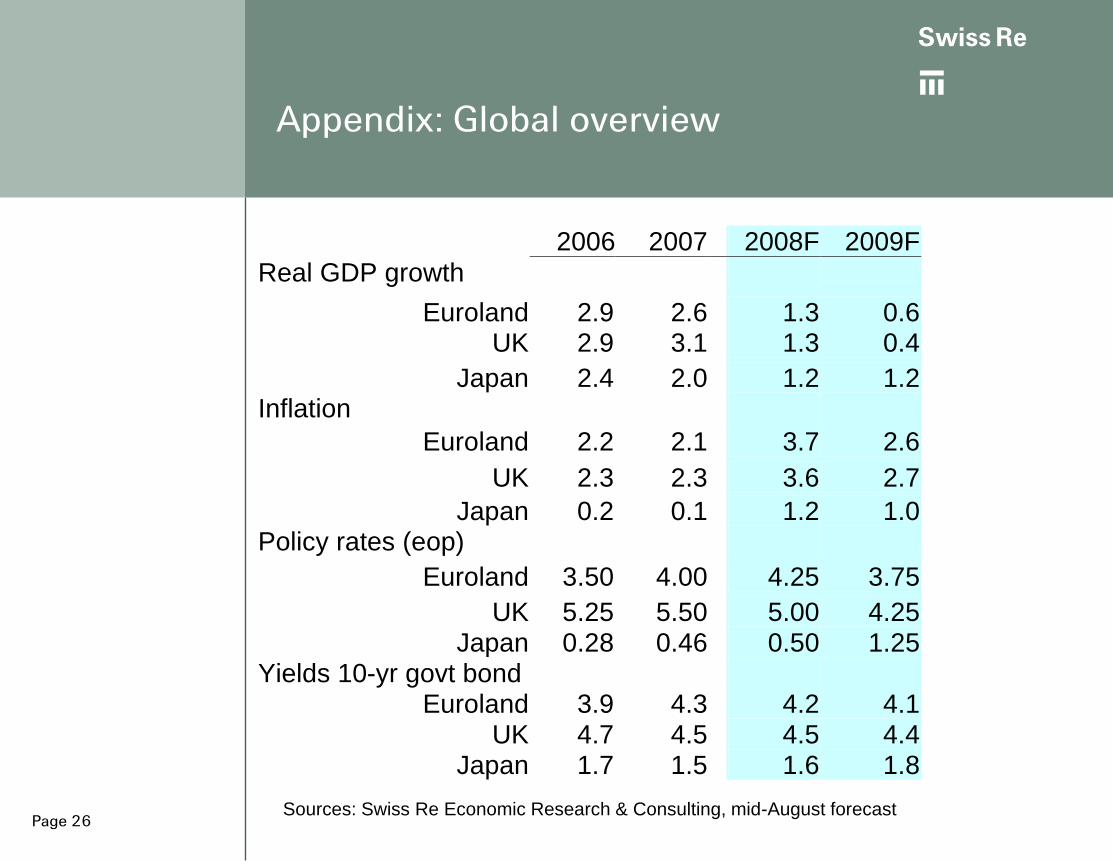
2006 2007 2008F 2009F
Real GDP growth
Euroland 2.9 2.6 1.3 0.6 UK 2.9 3.1 1.3 0.4
Japan 2.4 2.0 1.2 1.2 Inflation
Euroland 2.2 2.1 3.7 2.6
UK 2.3 2.3 3.6 2.7
Japan 0.2 0.1 1.2 1.0 Policy rates (eop)
Euroland 3.50 4.00 4.25 3.75
UK 5.25 5.50 5.00 4.25 Japan 0.28 0.46 0.50 1.25
Yields 10-yr govt bond Euroland 3.9 4.3 4.2 4.1
UK 4.7 4.5 4.5 4.4 Japan 1.7 1.5 1.6 1.8
Sources: Swiss Re Economic Research & Consulting, mid-August forecast
Appendix: Global overview

ab
Page 27
2005 2006 2007 2008F 2009F
Annual Averages:
Real GDP 3.1 2.9 2.2 1.3 1.0 CPI 3.4 3.2 2.9 4.7 2.4
End-of-Period:
Fed Funds 4.25 5.25 4.25 2.00 3.5
10-yr T-note 4.4 4.7 4.0 3.8 4.2
Appendix: U.S. economic outlook
Sources: Federal Reserve Board, Swiss Re Economic Research & Consulting

ab
Page 28
Questions?
To be put on the e-mail distribution list for Swiss Re’s US Economic Outlook, or other country outlooks contact:
This presentation, prepared by Swiss Re’s Economic Research & Consulting, is for information purposes only. It is not intended as an offer or solicitation for the
purchase or sale of any financial instrument. The information contained in this document has been obtained from sources believed to be reliable; however, its
accuracy and completeness cannot be guaranteed. The views reflected herein are subject to change without notice. They are the views of Swiss Re Economic
Research & Consulting and may differ from Swiss Re Asset Management and Conning Asset Management.


