Sample Report: Asia-Pacific Cross-Border B2C E-Commerce 2017
Upload
hoanghuongCategory
view
231download
0
1
GLOBAL CROSS-BORDER B2C E-COMMERCE 2015 PUBLICATION DATE: AUGUST 2015
PAGE 2 GENERAL INFORMATION I PAGE 3 KEY FINDINGS I PAGE 4-8 TABLE OF CONTENTS I PAGE 9 REPORT-SPECIFIC SAMPLE
CHARTS I PAGE 10 METHODOLOGY I PAGE 11 RELATED REPORTS I PAGE 12 CLIENTS I PAGE 13-14 FREQUENTLY ASKED QUESTIONS
PAGE 15 ORDER FORM I PAGE 16 TERMS AND CONDITIONS
2
2
PRODUCT DETAILS Title:
Type of Product:
Category:
Covered Regions:
Covered Countries:
Language:
Formats:
Number of Charts:
Global Cross-Border B2C E-Commerce 2015
Market Report
Cross-Border
Global, Asia-Pacific, North America, Europe, Western Europe, Eastern
Europe, Scandinavia, Latin America, Middle East & Africa
China, Japan, South Korea, Australia, India, USA, Canada, UK,
Germany, France, Spain, Italy, Netherlands, Russia, Turkey, Poland,
Brazil, Mexico, UAE, Nigeria, Israel
English
PDF & PowerPoint
115
PRICES* Single User License:
Site License:
Global Site License:
€ 2,950 (exc. VAT)
€ 4,425 (exc. VAT)
€ 5,900 (exc. VAT)
QUESTIONS
ANSWERED
IN THIS REPORT
How is cross-border B2C E-Commerce developing around the world?
Which countries are most targeted by cross-border online shoppers?
How high is cross-border online shopper penetration in various countries?
What product categories are most purchased in cross-border B2C E-Commerce?
Which cross-border strategies are employed by the major online retailers?
SECONDARY MARKET
RESEARCH
Our reports are exclusively based on secondary market research. Our researchers derive
information and data from a variety of reliable published sources and compile the data into
understandable and easy-to-use formats.
ADVANTAGES Maximum Objectivity
Reliable Sources
Up-To-Date Analysis
Boardroom-Ready PowerPoint Presentations
Guidance For Strategic Company Decisions
GLOBAL CROSS-BORDER B2C E-COMMERCE 2015
3
GLOBAL CROSS-BORDER B2C E-COMMERCE GROWING AT DOUBLE-DIGIT RATES
Cross-border B2C E-Commerce is expanding worldwide. It is projected to see accelerating growth
rates until 2017 and then decline slightly, while still maintaining double-digit growth figures. Global online
shoppers are motivated to buy directly from foreign online merchants due to better product availability
and prices, while among the major hindrances to cross-border purchases are customs charges, higher
shipping costs and longer delivery times. Clothing and footwear succeeded as the product category most
purchased by cross-border online shoppers across all global regions last year.
Asia-Pacific is predicted to become the largest region in global cross-border online retail, reaching a
share of approximately 40% of all cross-border sales in the next years. China is an important country for
both cross-border online imports and exports. Close to a third of active online shoppers in China have
made purchases across borders, and China-based E-Commerce marketplace AliExpress of Alibaba Group is
a popular destination for online shoppers in countries such as Brazil, Russia and others. Alibaba’s
competitor JD.com also strives to participate in the cross-border boom, having opened a global
marketplace for overseas merchants to sell to China and having launched a website targeting Russian
online shoppers.
Cross-border online shoppers in Canada and Latin America last year primarily targeted US online
retailers. The most popular way of engaging in cross-border trade for the companies from the USA was
through marketplaces such as Amazon. Amazon reported that, in 2014, cross-border sales volume of
sellers on its marketplace nearly doubled. Online merchants from the UK are popular targets for cross-
border online shoppers worldwide as well, with cross-border shipping accounting for nearly a quarter of
online orders dispatched from the UK at the end of 2014. Generally, cross-border online shopping was
more intense between the EU member states than between the EU countries and non-EU countries, but EU
authorities are undertaking efforts to further spur cross-border online shopping, seeing the benefits both
for consumers and the businesses.
GLOBAL CROSS-BORDER B2C E-COMMERCE 2015
4
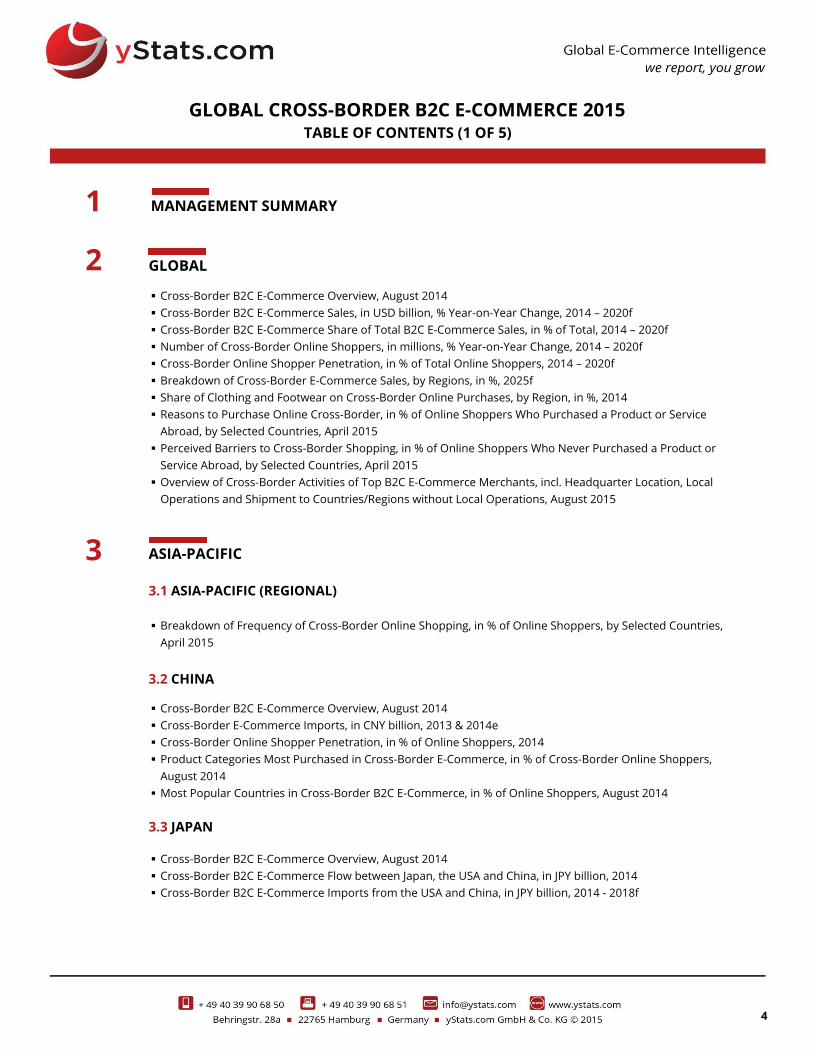
MANAGEMENT SUMMARY
GLOBAL
Cross-Border B2C E-Commerce Overview, August 2014
Cross-Border B2C E-Commerce Sales, in USD billion, % Year-on-Year Change, 2014 – 2020f
Cross-Border B2C E-Commerce Share of Total B2C E-Commerce Sales, in % of Total, 2014 – 2020f
Number of Cross-Border Online Shoppers, in millions, % Year-on-Year Change, 2014 – 2020f
Cross-Border Online Shopper Penetration, in % of Total Online Shoppers, 2014 – 2020f
Breakdown of Cross-Border E-Commerce Sales, by Regions, in %, 2025f
Share of Clothing and Footwear on Cross-Border Online Purchases, by Region, in %, 2014
Reasons to Purchase Online Cross-Border, in % of Online Shoppers Who Purchased a Product or Service
Abroad, by Selected Countries, April 2015
Perceived Barriers to Cross-Border Shopping, in % of Online Shoppers Who Never Purchased a Product or
Service Abroad, by Selected Countries, April 2015
Overview of Cross-Border Activities of Top B2C E-Commerce Merchants, incl. Headquarter Location, Local
Operations and Shipment to Countries/Regions without Local Operations, August 2015
ASIA-PACIFIC
3.1 ASIA-PACIFIC (REGIONAL)
Breakdown of Frequency of Cross-Border Online Shopping, in % of Online Shoppers, by Selected Countries,
April 2015
3.2 CHINA
Cross-Border B2C E-Commerce Overview, August 2014
Cross-Border E-Commerce Imports, in CNY billion, 2013 & 2014e
Cross-Border Online Shopper Penetration, in % of Online Shoppers, 2014
Product Categories Most Purchased in Cross-Border E-Commerce, in % of Cross-Border Online Shoppers,
August 2014
Most Popular Countries in Cross-Border B2C E-Commerce, in % of Online Shoppers, August 2014
3.3 JAPAN
Cross-Border B2C E-Commerce Overview, August 2014
Cross-Border B2C E-Commerce Flow between Japan, the USA and China, in JPY billion, 2014
Cross-Border B2C E-Commerce Imports from the USA and China, in JPY billion, 2014 - 2018f
GLOBAL CROSS-BORDER B2C E-COMMERCE 2015
1
2
3
TABLE OF CONTENTS (1 OF 5)
5
5
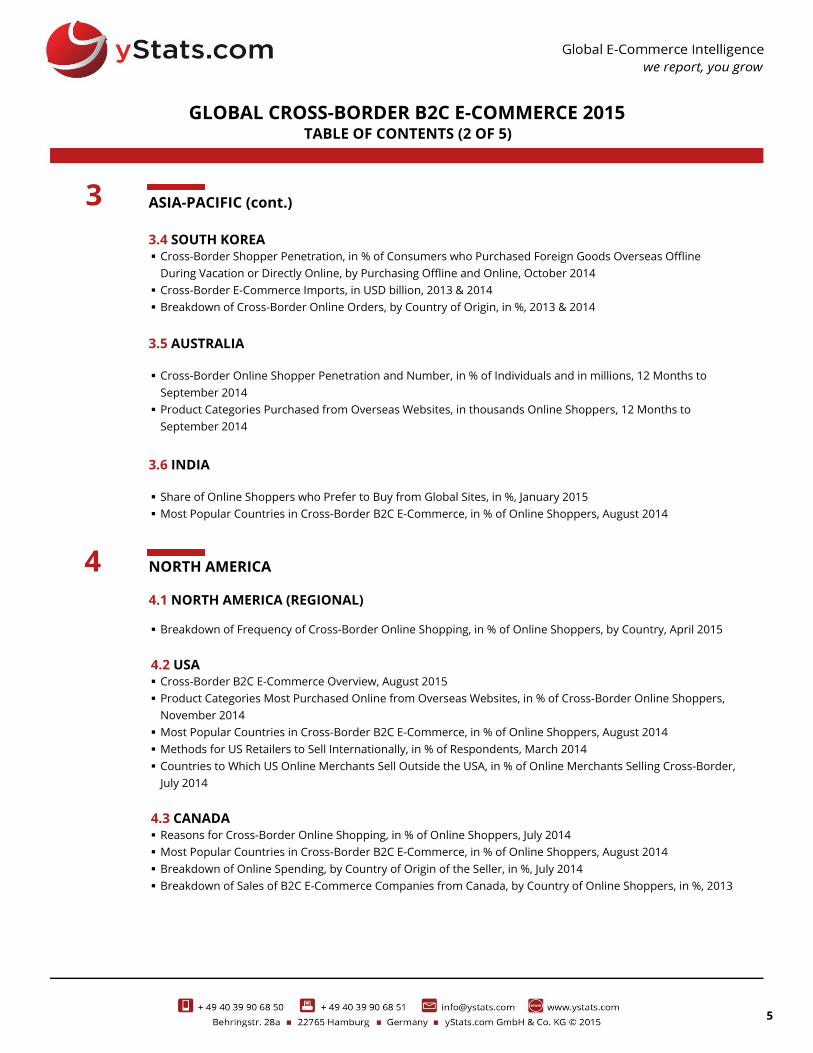
ASIA-PACIFIC (cont.)
3.4 SOUTH KOREA Cross-Border Shopper Penetration, in % of Consumers who Purchased Foreign Goods Overseas Offline
During Vacation or Directly Online, by Purchasing Offline and Online, October 2014
Cross-Border E-Commerce Imports, in USD billion, 2013 & 2014
Breakdown of Cross-Border Online Orders, by Country of Origin, in %, 2013 & 2014
3.5 AUSTRALIA
Cross-Border Online Shopper Penetration and Number, in % of Individuals and in millions, 12 Months to
September 2014
Product Categories Purchased from Overseas Websites, in thousands Online Shoppers, 12 Months to
September 2014
3.6 INDIA
Share of Online Shoppers who Prefer to Buy from Global Sites, in %, January 2015
Most Popular Countries in Cross-Border B2C E-Commerce, in % of Online Shoppers, August 2014
NORTH AMERICA
4.1 NORTH AMERICA (REGIONAL)
Breakdown of Frequency of Cross-Border Online Shopping, in % of Online Shoppers, by Country, April 2015
4.2 USA Cross-Border B2C E-Commerce Overview, August 2015
Product Categories Most Purchased Online from Overseas Websites, in % of Cross-Border Online Shoppers,
November 2014
Most Popular Countries in Cross-Border B2C E-Commerce, in % of Online Shoppers, August 2014
Methods for US Retailers to Sell Internationally, in % of Respondents, March 2014
Countries to Which US Online Merchants Sell Outside the USA, in % of Online Merchants Selling Cross-Border,
July 2014
4.3 CANADA Reasons for Cross-Border Online Shopping, in % of Online Shoppers, July 2014
Most Popular Countries in Cross-Border B2C E-Commerce, in % of Online Shoppers, August 2014
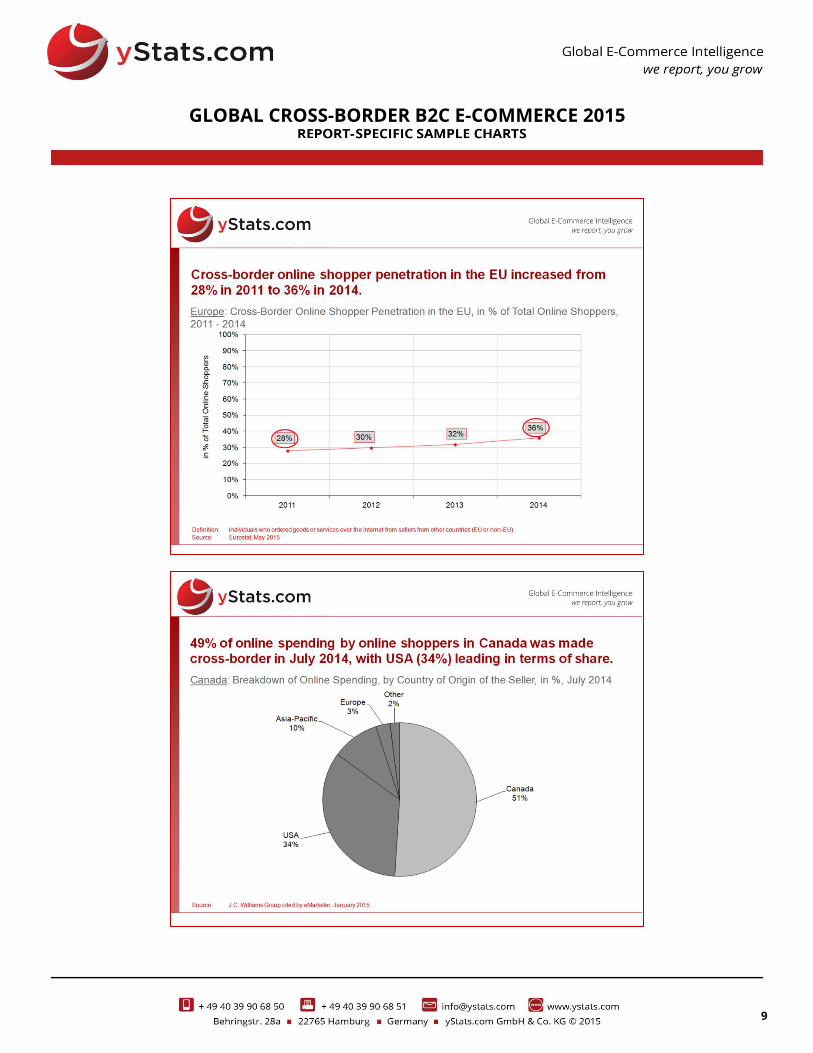
Breakdown of Online Spending, by Country of Origin of the Seller, in %, July 2014
Breakdown of Sales of B2C E-Commerce Companies from Canada, by Country of Online Shoppers, in %, 2013
4
GLOBAL CROSS-BORDER B2C E-COMMERCE 2015 TABLE OF CONTENTS (2 OF 5)
3
6
6
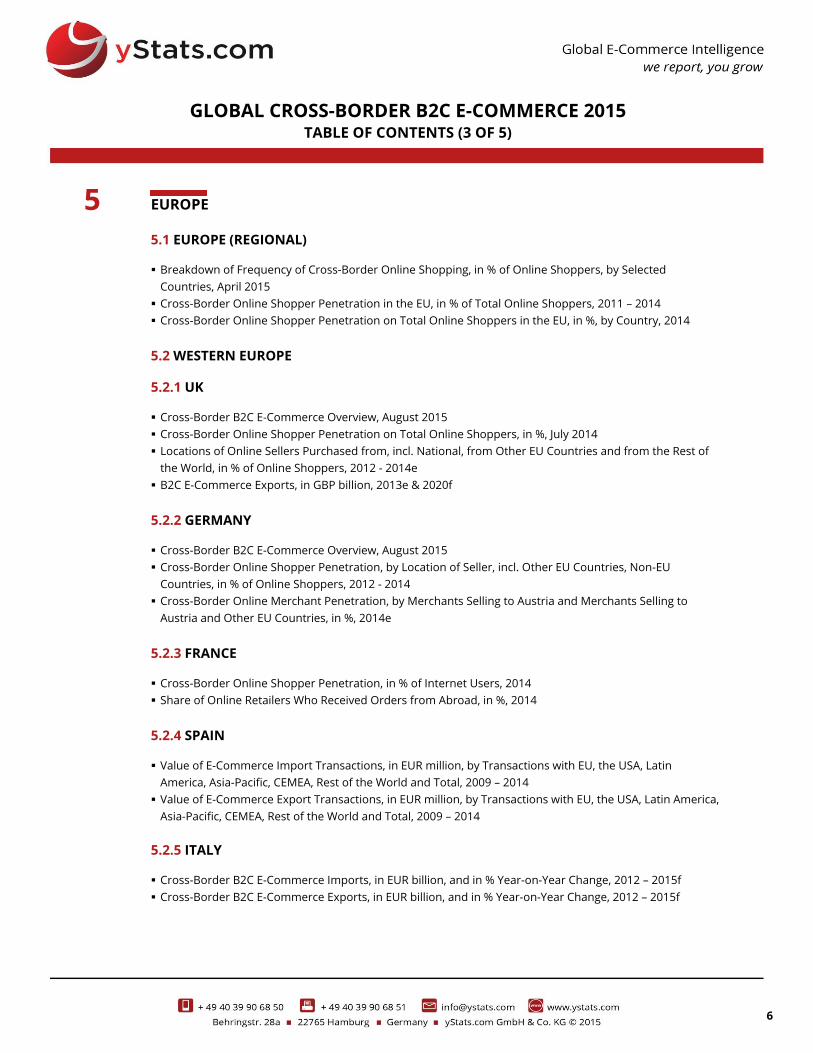
EUROPE
5.1 EUROPE (REGIONAL)
Breakdown of Frequency of Cross-Border Online Shopping, in % of Online Shoppers, by Selected
Countries, April 2015
Cross-Border Online Shopper Penetration in the EU, in % of Total Online Shoppers, 2011 – 2014
Cross-Border Online Shopper Penetration on Total Online Shoppers in the EU, in %, by Country, 2014
5.2 WESTERN EUROPE
5.2.1 UK
Cross-Border B2C E-Commerce Overview, August 2015
Cross-Border Online Shopper Penetration on Total Online Shoppers, in %, July 2014
Locations of Online Sellers Purchased from, incl. National, from Other EU Countries and from the Rest of
the World, in % of Online Shoppers, 2012 - 2014e
B2C E-Commerce Exports, in GBP billion, 2013e & 2020f
5.2.2 GERMANY
Cross-Border B2C E-Commerce Overview, August 2015
Cross-Border Online Shopper Penetration, by Location of Seller, incl. Other EU Countries, Non-EU
Countries, in % of Online Shoppers, 2012 - 2014
Cross-Border Online Merchant Penetration, by Merchants Selling to Austria and Merchants Selling to
Austria and Other EU Countries, in %, 2014e
5.2.3 FRANCE
Cross-Border Online Shopper Penetration, in % of Internet Users, 2014
Share of Online Retailers Who Received Orders from Abroad, in %, 2014
5.2.4 SPAIN
Value of E-Commerce Import Transactions, in EUR million, by Transactions with EU, the USA, Latin
America, Asia-Pacific, CEMEA, Rest of the World and Total, 2009 – 2014
Value of E-Commerce Export Transactions, in EUR million, by Transactions with EU, the USA, Latin America,
Asia-Pacific, CEMEA, Rest of the World and Total, 2009 – 2014
5.2.5 ITALY
Cross-Border B2C E-Commerce Imports, in EUR billion, and in % Year-on-Year Change, 2012 – 2015f
Cross-Border B2C E-Commerce Exports, in EUR billion, and in % Year-on-Year Change, 2012 – 2015f
GLOBAL CROSS-BORDER B2C E-COMMERCE 2015 TABLE OF CONTENTS (3 OF 5)
5
7
7
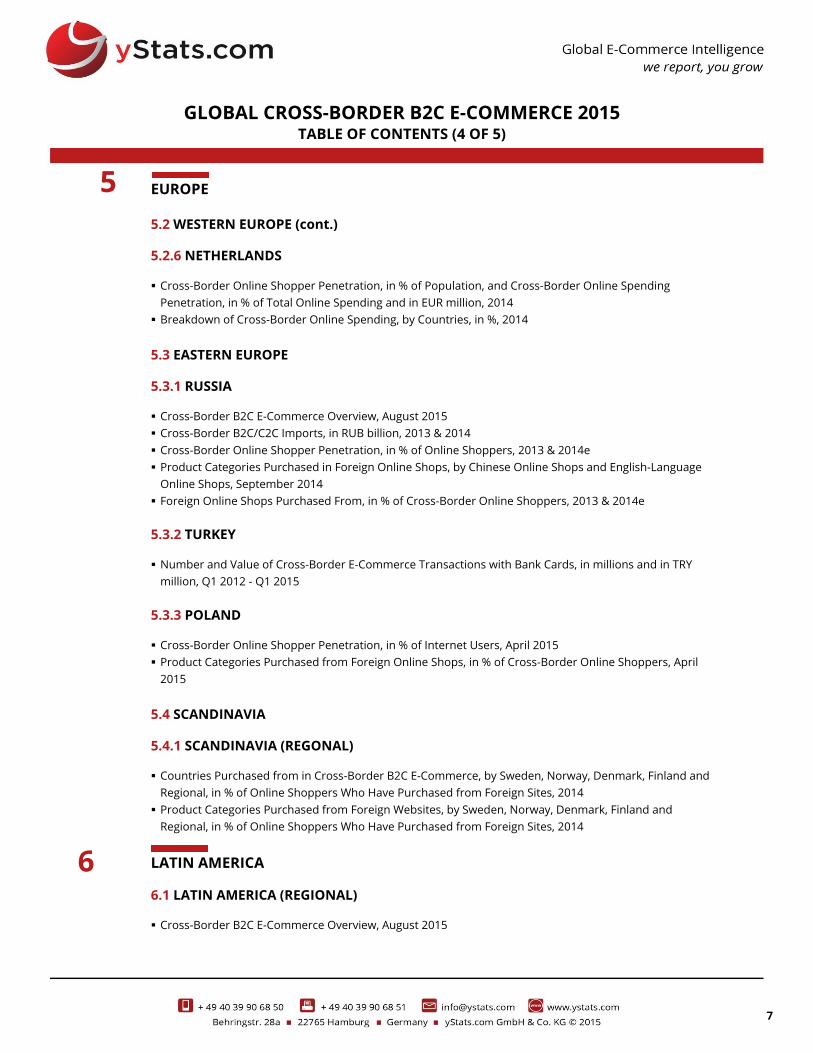
EUROPE
5.2 WESTERN EUROPE (cont.)
5.2.6 NETHERLANDS
Cross-Border Online Shopper Penetration, in % of Population, and Cross-Border Online Spending
Penetration, in % of Total Online Spending and in EUR million, 2014
Breakdown of Cross-Border Online Spending, by Countries, in %, 2014
5.3 EASTERN EUROPE
5.3.1 RUSSIA
Cross-Border B2C E-Commerce Overview, August 2015
Cross-Border B2C/C2C Imports, in RUB billion, 2013 & 2014
Cross-Border Online Shopper Penetration, in % of Online Shoppers, 2013 & 2014e
Product Categories Purchased in Foreign Online Shops, by Chinese Online Shops and English-Language
Online Shops, September 2014
Foreign Online Shops Purchased From, in % of Cross-Border Online Shoppers, 2013 & 2014e
5.3.2 TURKEY
Number and Value of Cross-Border E-Commerce Transactions with Bank Cards, in millions and in TRY
million, Q1 2012 - Q1 2015
5.3.3 POLAND
Cross-Border Online Shopper Penetration, in % of Internet Users, April 2015
Product Categories Purchased from Foreign Online Shops, in % of Cross-Border Online Shoppers, April
2015
5.4 SCANDINAVIA
5.4.1 SCANDINAVIA (REGONAL)
Countries Purchased from in Cross-Border B2C E-Commerce, by Sweden, Norway, Denmark, Finland and
Regional, in % of Online Shoppers Who Have Purchased from Foreign Sites, 2014
Product Categories Purchased from Foreign Websites, by Sweden, Norway, Denmark, Finland and
Regional, in % of Online Shoppers Who Have Purchased from Foreign Sites, 2014
LATIN AMERICA
6.1 LATIN AMERICA (REGIONAL)
Cross-Border B2C E-Commerce Overview, August 2015
GLOBAL CROSS-BORDER B2C E-COMMERCE 2015 TABLE OF CONTENTS (4 OF 5)
5
6
8
8
LATIN AMERICA (cont.)
6.1 LATIN AMERICA (REGIONAL) (cont.)
Breakdown of Frequency of Cross-Border Online Shopping, in % of Online Shoppers, by Argentina, Brazil
and Mexico, April 2015
Share of Online Shoppers Buying Physical Goods Online from the USA, September 2014
6.2 BRAZIL
Cross-Border Online Shopper Penetration, in %, January 2014 & December 2014
Cross-Border E-Commerce Imports Share of Total E-Commerce Transactions, in %, 2014
Breakdown of Cross-Border E-Commerce Import Transactions, by Product Categories, in %, 2014
Breakdown of Payment Methods Used in Cross-Border E-Commerce Transactions, in %, 2014
Most Popular Product Categories in Cross-Border B2C E-Commerce, in % of Online Shoppers, August 2014
Most Used Cross-Border Online Shopping Websites, in % of Online Shoppers, January 2014 & December
2014
6.3 MEXICO
Cross-Border Online Shopper Penetration, in % of Online Shoppers, 2014
Share of Online Shoppers Planning to Start Making/Increase Cross-Border Online Purchases, November
2014
Countries Most Purchased from in Cross-Border E-Commerce, in % of Cross-Border Online Shoppers,
2014
MIDDLE EAST & AFRICA
7.1 MIDDLE EAST & AFRICA (REGIONAL)
Breakdown of Frequency of Cross-Border Online Shopping in the Middle East & Africa, in % of Online
Shoppers by Country, April 2015
Share of Cross-Border E-Commerce Transactions on Total E-Commerce Spending in MENA, in %, 2014
Share of Online Cross-Border Purchases in the Middle East, by Selected Countries, in %, 2012 – 2014
7.2 UAE
Share of Cross-Border Online Shoppers, in % of Online Shoppers, November 2014
Product Categories Most Purchased from from Overseas Websites, in % of Cross-Border Online Shoppers,
November 2014
Countries Most Purchased from in Cross-Border E-Commerce, in % of Cross-Border Online Shoppers,
November 2014
7.3 NIGERIA
Other African Countries Purchased from Online, in % of Cross-Border Online Shoppers, November 2014
7.4 ISRAEL
Share of Cross-Border Online Shoppers, in % of Online Shoppers, November 2014
6
7
GLOBAL CROSS-BORDER B2C E-COMMERCE 2015 TABLE OF CONTENTS (5 OF 5)
9
GLOBAL CROSS-BORDER B2C E-COMMERCE 2015
10
GENERAL METHODOLOGY OF OUR MARKET REPORTS
Our reports are compiled based on secondary market
research. Secondary research is information gathered from
previously published sources. Our reports are solely based on
information and data acquired from national and international
statistical offices, industry and trade associations, business
reports, business and company databases, journals, company
registries, news portals and many other reliable sources. By using
various sources we ensure maximum objectivity for all obtained
data. As a result, companies gain a precise and unbiased
impression of the market situation.
Cross referencing of data is conducted in order to
ensure validity and reliability.
The source of information and its release date are
provided on every chart. It is possible that the information
contained in one chart is derived from several sources. If this is
the case, all sources are mentioned on the chart.
Our reports include text charts, pie charts, bar charts,
rankings, line graphs and tables. Every chart contains an Action
Title, which summarizes the main idea/finding of the chart and a
Sub Title, which provides necessary information about the
country, the topic, units or measures of currency, and the
applicable time period(s) to which the data refers. With respect to
rankings, it is possible that the summation of all categories
amounts to more than 100%. In this case, multiple answers were
possible, which is noted at the bottom of the chart.
Reports are comprised of the following elements, in the
following order: Cover page, preface, legal notice, methodology,
definitions, table of contents, management summary
(summarizing main information contained in each section of
report) and report content (divided into sections and chapters).
When available, we also include forecasts in our report content.
These forecasts are not our own; they are published by reliable
sources. Within Global and Regional reports, we include all major
developed and emerging markets, ranked in order of importance
by using evaluative criteria such as sales figures.
If available, additional information about the data
collection, for example the time of survey and number of people
surveyed, is provided in the form of a note. In some cases, the
note (also) contains additional information needed to fully
understand the contents of the respective data.
When providing information about amounts of money,
local currencies are most often used. When referencing currency
values in the Action Title, the EUR values are also provided in
brackets. The conversions are always made using the average
currency exchange rate for the respective time period. Should the
currency figure be in the future, the average exchange rate of the
past 12 months is used.
The reports include mainly data from the last 12 months
prior to the date of report publication. Exact publication dates are
mentioned in every chart.
METHODOLOGY OF OUR GLOBAL CROSS-BORDER B2C E-COMMERCE 2015 REPORT
This report covers the global cross-border B2C E-
Commerce market, focusing both on cross-border imports and
exports.
All major countries are covered, though data availability
varied across the markets.
Countries are grouped by regions, with regions
presented in the descending order of B2C E-Commerce sales.
Within each region, the countries are also ranked by B2C E-
Commerce sales. Regional information is presented first, where
available. Besides country and regional data, information about
global development is also included.
Depending on data availability, the following types of
market information are included: cross-border online shopper
penetration, cross-border B2C E-Commerce sales (export and/or
import), countries most purchased from, countries most sold to,
most visited international E-Commerce websites, most purchased
product categories, reasons for and barriers to buying cross-
border. Not all the mentioned types of information are available
for each of the countries covered. For the leading country or
countries in each region, also a text chart with a qualitative
overview of cross-border B2C E-Commerce is presented.
GLOBAL CROSS-BORDER B2C E-COMMERCE 2015
11
UPCOMING RELATED REPORTS
Global Online Payment Methods: First Half 2015 August 2015 € 1,950
Europe Online Payment Methods: First Half 2015 August 2015 € 750
Asia-Pacific Online Payment Methods: First Half 2015 August 2015 € 750
Global Alternative Online Payment Methods: First Half 2015 August 2015 € 950
Omnichannel Trend in Global B2C E-Commerce and General Retail 2015 March 2015 € 950
Top 8 Global B2C E-Commerce Country Sales Forecasts: 2015 to 2018 July 2015 € 2,950
China B2C E-Commerce Sales Forecasts: 2015 to 2018 July 2015 € 450
Russia B2C E-Commerce Sales Forecasts: 2015 to 2018 July 2015 € 450
USA B2C E-Commerce Sales Forecasts: 2015 to 2018 July 2015 € 450
UK B2C E-Commerce Sales Forecasts: 2015 to 2018 July 2015 € 450
Germany B2C E-Commerce Sales Forecasts: 2015 to 2018 July 2015 € 450
France B2C E-Commerce Sales Forecasts: 2015 to 2018 July 2015 € 450
Japan B2C E-Commerce Sales Forecasts: 2015 to 2018 July 2015 € 450
South Korea B2C E-Commerce Sales Forecasts: 2015 to 2018 July 2015 € 450
Global B2C E-Commerce Market 2014 October 2014 € 4,950**
Asia-Pacific B2C E-Commerce Market 2014 August 2014 € 3,950**
Eastern Europe B2C E-Commerce Market 2014 October 2014 € 1,950**
Latin America B2C E-Commerce Market 2014 December 2014 € 2,450
BRIC B2C E-Commerce Markets 2014 January 2015 € 2,450
Middle East B2C E-Commerce Market 2015 March 2015 € 1,950
Africa B2C E-Commerce Market 2015 February 2015 € 1,750
REPORT
PUBLICATION
DATE
PRICE*
Europe Cross-Border B2C E-Commerce 2015 August 2015 €1,950
Asia-Pacific Cross-Border B2C E-Commerce 2015 August 2015 € 950
GLOBAL CROSS-BORDER B2C E-COMMERCE 2015
**Reflects Discounted Price
12
13
14
15
16