
Overview of anti-malaria commodity issues based on preliminary gap analysis
Global Contraceptive Commodity Gap Analysis2016

Copyright © 2017 Reproductive Health Supplies Coalition Brussels: Reproductive Health Supplies Coalition. May 2017. Global Contraceptive Commodity Gap Analysis 2016

Table of contents
1. INTRODUCTION TO THE GLOBAL CONTRACEPTIVE COMMODITY GAP ANALYSIS 2016 3
Topline Findings for 135 Low- and Middle-Income Countries 5
Topline Findings for 69 FP2020 Focus Countries 6
The Development of the CGA Project 7
Findings from the Stakeholder Consultation 9
2. FOUR KEY QUESTIONS AND FINDINGS 12
How much is spent on contraceptive supplies, and what are the relative contributions of donors, governments, and individuals? 13
How many women will use each method of contraception in 2020, and what quantities of supplies will they consume? 15
How much do the supplies consumed by all users of contraception currently cost, and how much greater will the cost be in the year 2020? 21
What funding gaps can we anticipate in the year 2020? If donor and government funding does not increase, what burden will shift to out-of-pocket expenditures? 23
3. ANALYSIS OF PROCUREMENT COSTS AND FUNDING GAPS 31
4. DETAILED FINDINGS FOR 135 LMI COUNTRIES 35
5. DETAILED FINDINGS FOR 69 FP2020 FOCUS COUNTRIES 56
6. CONCLUSION 77
7. NOTES ON METHODOLOGIES AND DATA SOURCES 80
LIST OF 135 LMI COUNTRIES 89
ENDNOTES 90

1GLOBAL CONTRACEPTIVE COMMODITY GAP ANALYSIS 2016
AcknowledgementsThe Reproductive Health Supplies Coalition extends its thanks to the authors of the 2016 Global Contraceptive Commodity Gap Analysis: Nina Miller, Michelle Weinberger, John Stover, John Ross, Emily Sonneveldt, Mindy Scibilia, Maggie Murphy, and Alexis Heaton. We also express our gratitude to the CGA Project Advisory Group and the many partners and stakeholders, listed on pages 7 and 8, who contributed their time, opinions, and data to shape the contents of this report. Of special note are Jacqui Darroch of the Guttmacher Institute, who contributed to the CGA cost analysis; Jennie Greaney, Kabir Ahmed, and Sandra Novo of UNFPA, who contributed data on donor spending; NIDI, which contributed data on spending by corporations; and FP2020, which generously shared the 2016 Core Indicator estimates in advance of the publication of their 2016 Annual Report. Finally, we thank RHSC Secretariat member Lucian Alexe for his skillful design and layout of this publication.
2GLOBAL CONTRACEPTIVE COMMODITY GAP ANALYSIS 2016
Acronyms
AW All women
CHAI Clinton Health Access Initiative
CIFF Children’s Investment Fund Foundation
CPR Contraceptive prevalence rate
CSO Civil society organization
CYP Couple year of protection
DFID UK Department for International Development
DHS Demographic and Health Surveys
EC Emergency contraception
FP2020 Family Planning 2020
FPET Family Planning Estimation Tool
INGO International non-governmental organization
IPPF International Planned Parenthood Federation
IUD Intrauterine device
JSI John Snow, Inc.
LAM Lactational amenorrhea method
LAPM Long-acting and permanent methods (of contraception)
LMI Low- and middle-income (country/countries)
mCPR Contraceptive Prevalence Rate, modern methods
MICs Multiple Indicator Cluster surveys
MSI Marie Stopes International
NGO Non-governmental organization
NIDI Netherlands Interdisciplinary Demographics Institute
OOP Out-of-pocket
PSI Population Services International
RHSC Reproductive Health Supplies Coalition
SDM Standard days method
SSA Sub-Saharan Africa
UNFPA United Nations Population Fund
UNPD United Nations Population Division
USAID US Agency for International Development
WRA Women of reproductive age

3GLOBAL CONTRACEPTIVE COMMODITY GAP ANALYSIS 2016
Introduction to the Global Contraceptive Commodity Gap Analysis 2016
SECTION 1

4GLOBAL CONTRACEPTIVE COMMODITY GAP ANALYSIS 2016
1. How much is spent on contraceptive supplies, and what are the relative contributions of donors, governments of low- and middle-income countries, and individuals?
2. How many women will use each method of contraception in 2020, and what volume of supplies will they consume?
3. How much do the supplies consumed by all users of contraception currently cost, and how much greater will the cost be in the year 2020?
4. What funding gaps can we anticipate in the year 2020? If donor and government funding does not increase, what burden will shift to out-of-pocket expenditures by individuals?
Political commitment to expanding access to family planning has been unusually strong and widespread for most of the past decade. Universal access to sexual and reproductive health care services, including for family planning, is one of the targets of the Sustainable Development Goals. Ninety-three governments, donors, civil society organizations, and other partners have made formal commitments to the FP2020 initiative.1
Expanding access to family planning requires the production and provision of increasing volumes of high-quality contraceptive supplies that will meet women’s diverse needs and preferences. Therefore it is imperative that we address the questions listed above.
None of the questions listed above lend themselves to simple answers. Fortunately, our community has developed a rich array of methodologies and data sources. Unfortunately, they can lead to a proliferation of seemingly conflicting findings and confusing, or even contradictory, messages.
Therefore, in taking up the challenge of projecting and quantifying the growing demand for contraceptive supplies, we turned to the convening power of the Reproductive Health Supplies Coalition to ask our partners to think strategically about the value these methodologies offer and the ways they may be sequenced or juxtaposed to provide greater insights. We engaged in wide ranging consultations
with 43 donors, manufacturers, advocates, and technical experts, representing 24 agencies and organizations. The result is RHSC’s groundbreaking Global Contraceptive Commodity Gap Analysis (CGA).
Our analysis brings together Track20’s2 innovative approach to measuring the number of contraceptive users3 and modeling changes in method mix; contraceptive prevalence projections from the United Nations Population Division4; public sector product price research by the Guttmacher institute5; donor spending data collected by UNFPA6 and NIDI7; Avenir Health’s8 approach to measuring total spending on contraceptive supplies; and insights from an analysis of country-produced quantification reports provided by CHAI9 and JSI10.
The findings we present comprise individual estimates11 for 135 low- and middle-income countries.12 In addition, we highlight important findings for the subset of 69 FP2020 focus countries.13 We also present findings from a procurement analysis of 20 countries.14
The wealth of expertise in the global family planning community, the prospect of new analyses and data that will become available in the coming months, the limitations of what we were able to include in this report, and, most importantly, the urgent need to ensure contraceptive commodity security, all point to the importance of the CGA as an annual exercise.

5GLOBAL CONTRACEPTIVE COMMODITY GAP ANALYSIS 2016
KEY QUESTIONS & FINDINGS: 135 LMI COUNTRIES
How many users of contraception are there now? How many will there be in 2020?2
452.7 MILLION
Users of Contraception
2016 ESTIMATE If current trajectories of growth in contraceptive use continue, by 2020 there will be more than 490 million users of contraception living in the 135 LMI countries. This is more than 37 million additional users compared to 2016.
If the FP2020 goal is achieved and contraceptive use accelerates in all 135 LMI countries, by 2020 there will be nearly 550 million users of contraception. This is more than 97 million additional users compared to 2016.
490 MILLION
2020 ESTIMATE
550 MILLION
2020 ESTIMATE
What is the cost of the supplies currently consumed by all users of contraception? How much greater will the cost be in 2020? 3
$ 1.352 BILLION
Cost of Supplies
2016 ESTIMATE If current trajectories of growth in contraceptive use continue in 135 LMI countries, by 2020 users will consume a volume of supplies worth $1.525 billion at current prices. The greater volume adds $173.2 million in cost compared to 2016.
If the FP2020 goal is achieved and contraceptive use accelerates in all 135 LMI countries, by 2020 users will consume a volume of supplies worth $1.744 billion at current prices. The greater volume adds $392.4 million in cost compared to 2016.
$ 1.525 BILLION
2020 ESTIMATE
$ 1.744 BILLION
2020 ESTIMATE
How much is spent on contraceptive supplies? How much spending can we attribute to donors, governments, and individuals?1
$ 1.203 BILLION
Spent on Supplies
2014 ESTIMATE In 2014, $1.203 billion was spent on contraceptive supplies in the 135 LMI countries.
› 25% represents spending from all donor sources,
› 17% represents spending by governments using non-donor funds, and
› 58% represents individuals purchasing supplies from the private sector.
Note 2014 is the most recent year with sufficient data for this analysis.
Funding Gap
Scenario A | Current growth trajectories of contraceptive use continue in each country.
Scenario B | The FP2020 goal is achieved in the 69 focus countries, and a demonstration effect accelerates the increase of contraceptive use in the remaining 66 LMI countries.
What contraceptive supplies funding gaps can we anticipate for the year 2020?4
If current trajectories of growth in contraceptive use continue in the 135 LMI countries, the gap between the amount spent on supplies in 2014 and the cost of the volume of supplies users will require in 2020 will be $322 million.
If the FP2020 goal is achieved and contraceptive use accelerates in all 135 LMI countries, the gap between the amount spent on supplies in 2014 and the cost of the volume of supplies users will require in 2020 will be $541 million.
$ 322 MILLION
$ 541 MILLION
2020 ESTIMATE
2020 ESTIMATE
Funding Gap
Funding Gap
6GLOBAL CONTRACEPTIVE COMMODITY GAP ANALYSIS 2016
KEY QUESTIONS & FINDINGS: 69 FP2020 FOCUS COUNTRIES
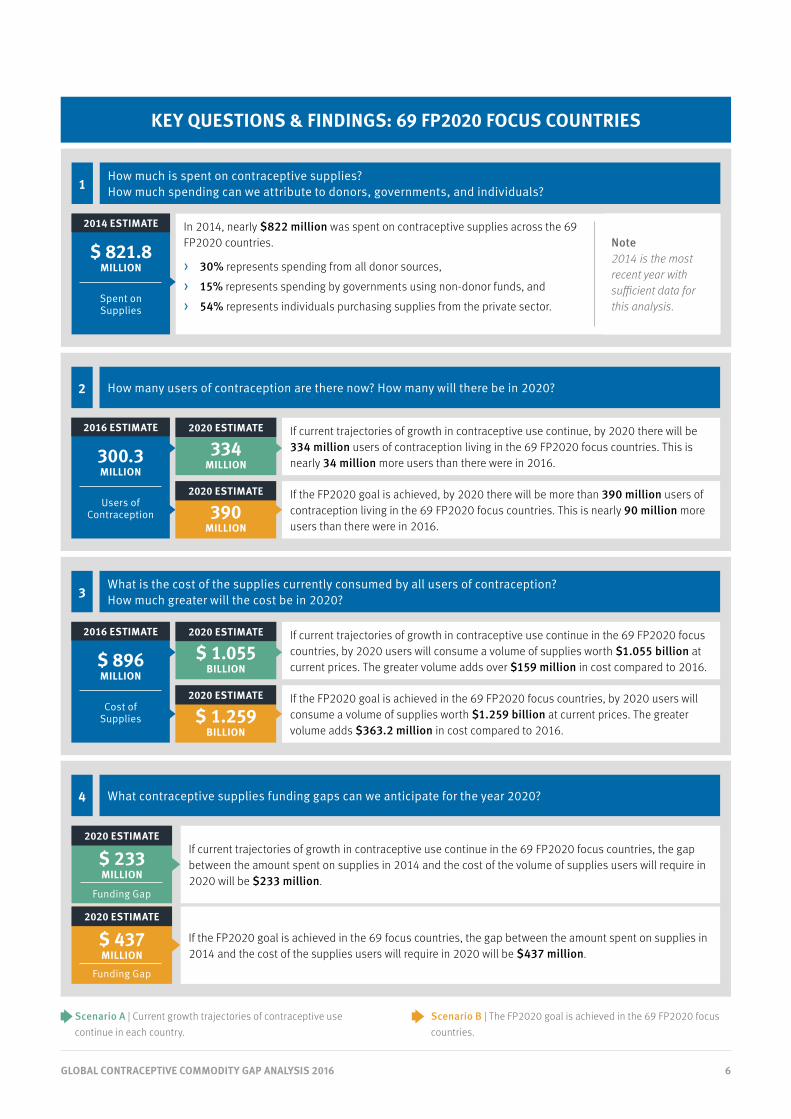
How much is spent on contraceptive supplies? How much spending can we attribute to donors, governments, and individuals?1
$ 821.8 MILLION
Spent on Supplies
2014 ESTIMATE In 2014, nearly $822 million was spent on contraceptive supplies across the 69 FP2020 countries.
› 30% represents spending from all donor sources,
› 15% represents spending by governments using non-donor funds, and
› 54% represents individuals purchasing supplies from the private sector.
Note 2014 is the most recent year with sufficient data for this analysis.
How many users of contraception are there now? How many will there be in 2020?2
300.3 MILLION
Users of Contraception
2016 ESTIMATE If current trajectories of growth in contraceptive use continue, by 2020 there will be 334 million users of contraception living in the 69 FP2020 focus countries. This is nearly 34 million more users than there were in 2016.
If the FP2020 goal is achieved, by 2020 there will be more than 390 million users of contraception living in the 69 FP2020 focus countries. This is nearly 90 million more users than there were in 2016.
334 MILLION
2020 ESTIMATE
390 MILLION
2020 ESTIMATE
What is the cost of the supplies currently consumed by all users of contraception? How much greater will the cost be in 2020? 3
$ 896 MILLION
Cost of Supplies
2016 ESTIMATE If current trajectories of growth in contraceptive use continue in the 69 FP2020 focus countries, by 2020 users will consume a volume of supplies worth $1.055 billion at current prices. The greater volume adds over $159 million in cost compared to 2016.
If the FP2020 goal is achieved in the 69 FP2020 focus countries, by 2020 users will consume a volume of supplies worth $1.259 billion at current prices. The greater volume adds $363.2 million in cost compared to 2016.
$ 1.055 BILLION
2020 ESTIMATE
$ 1.259 BILLION
2020 ESTIMATE
What contraceptive supplies funding gaps can we anticipate for the year 2020?4
If current trajectories of growth in contraceptive use continue in the 69 FP2020 focus countries, the gap between the amount spent on supplies in 2014 and the cost of the volume of supplies users will require in 2020 will be $233 million.
If the FP2020 goal is achieved in the 69 focus countries, the gap between the amount spent on supplies in 2014 and the cost of the supplies users will require in 2020 will be $437 million.
$ 233 MILLION
$ 437 MILLION
2020 ESTIMATE
2020 ESTIMATE
Funding Gap
Scenario A | Current growth trajectories of contraceptive use continue in each country.
Scenario B | The FP2020 goal is achieved in the 69 FP2020 focus countries.
Funding Gap

7GLOBAL CONTRACEPTIVE COMMODITY GAP ANALYSIS 2016
The Development of the CGA Project
The Reproductive Health Supplies Coalition envisioned the CGA project as a means of bringing together diverse data sources and methodologies for the purpose of producing actionable information for a broad range of stakeholders. To determine which data sources and methodologies to draw from, and which stakeholders to consult about their information needs, RHSC convened a small group of advisors to provide formative guidance.
A stakeholder consultation for the CGA project was conducted in March and April of 2016. It comprised interviews with 30 individuals from 19 agencies and organizations. Following the stakeholder consultation, RHSC convened a group of technical experts to discuss the range of available data sources and methodologies that might contribute to the CGA project.
CGA PROJECT ADVISORY GROUP
Ian Askew, World Health Organization Erik Beekink, NIDI
John Bongaarts, Population Council Win Brown, Bill & Melinda Gates Foundation
Jacqui Darroch, Guttmacher Institute John Stover, Avenir Health
CGA PROJECT STAKEHOLDER CONSULTATION: MANUFACTURERS, DONORS, ADVOCATES, AND TECHNICAL EXPERTS
Advance Family Planning Beth Frederick
Avenir Health -Track20 Emily Sonneveldt, Michelle Weinberger
Bayer Klaus Brill
CIFF Steven Chapman
CHAI Ryan Fu, Mindy Scibilia, Ashley Nguyen
Guttmacher Institute Gustavo Suarez
Helm-Fresenius Ed Oosterman
International Consortium for EC Elizabeth Westley
John Snow, Inc. Alexis Heaton, Laila Akhlaghi, Sara Laaff
Marie Stopes International Aisha Dasgupta
Merck/MSD Maggie Kohn
Mylan Venkatesh Iyer
Norad Nina Strom
Pfizer Eleanor Levine
RHSC Secretariat Anita Deshpande, Ellen Tompsett
DFID Meena Gandhi
United Nations Population Division Vladimira Kantorova
UNFPA Renee van de Weerdt, Jennie Greaney
USAID Mark Rilling, Denise Harrison, Coite Manuel, Kevin Pilz

8GLOBAL CONTRACEPTIVE COMMODITY GAP ANALYSIS 2016
CGA PROJECT TECHNICAL EXPERTS MEETING
Avenir Health John Stover, Michelle Weinberger
CHAI Mindy Scibilia, Ryan Fu, Ashley Nguyen
Engender Health Leah Jarvis
Guttmacher Institute Jacqui Darroch
John Snow, Inc. Alexis Heaton, Emma Stewart
Netherlands Interdisciplinary Demographics Institute Erik Beekink, Patricia Hernandez, Karen Vrijberg
Population Council Saumya Ramarao
RHSC John Skibiak, Nina Miller (consultant)
UNFPA Jennie Greaney
United Nations Population Division Vladimia Kantorova
USAID | Deliver Project Jim Rosen
Several individuals who did not participate in the stakeholder consultation or technical experts meeting provided data and expertise during the implementation of this project. They include: Maggie Murphy of John Snow, Inc., John Ross of Avenir Health, Eleni Han of CHAI, and Kabir Ahmed and Sandra Novo of UNFPA.
9GLOBAL CONTRACEPTIVE COMMODITY GAP ANALYSIS 2016
Findings from the Stakeholder Consultation
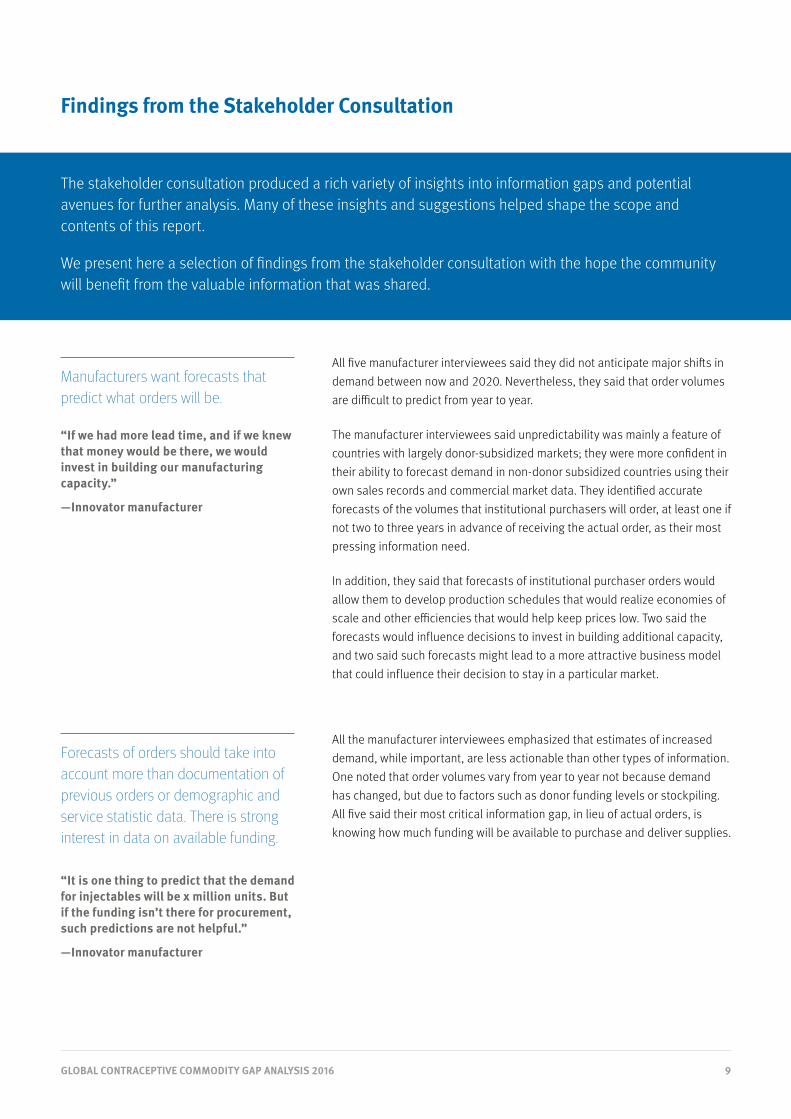
Manufacturers want forecasts that predict what orders will be.
Forecasts of orders should take into account more than documentation of previous orders or demographic and service statistic data. There is strong interest in data on available funding.
All five manufacturer interviewees said they did not anticipate major shifts in demand between now and 2020. Nevertheless, they said that order volumes are difficult to predict from year to year.
The manufacturer interviewees said unpredictability was mainly a feature of countries with largely donor-subsidized markets; they were more confident in their ability to forecast demand in non-donor subsidized countries using their own sales records and commercial market data. They identified accurate forecasts of the volumes that institutional purchasers will order, at least one if not two to three years in advance of receiving the actual order, as their most pressing information need.
In addition, they said that forecasts of institutional purchaser orders would allow them to develop production schedules that would realize economies of scale and other efficiencies that would help keep prices low. Two said the forecasts would influence decisions to invest in building additional capacity, and two said such forecasts might lead to a more attractive business model that could influence their decision to stay in a particular market.
All the manufacturer interviewees emphasized that estimates of increased demand, while important, are less actionable than other types of information. One noted that order volumes vary from year to year not because demand has changed, but due to factors such as donor funding levels or stockpiling. All five said their most critical information gap, in lieu of actual orders, is knowing how much funding will be available to purchase and deliver supplies.
“If we had more lead time, and if we knew that money would be there, we would invest in building our manufacturing capacity.”
—Innovator manufacturer
“It is one thing to predict that the demand for injectables will be x million units. But if the funding isn’t there for procurement, such predictions are not helpful.”
—Innovator manufacturer
The stakeholder consultation produced a rich variety of insights into information gaps and potential avenues for further analysis. Many of these insights and suggestions helped shape the scope and contents of this report.
We present here a selection of findings from the stakeholder consultation with the hope the community will benefit from the valuable information that was shared.

10GLOBAL CONTRACEPTIVE COMMODITY GAP ANALYSIS 2016
Manufacturers currently underutilize demographic data. They are interested in learning more about the potential for demographic data to inform their forecasts.
Donors have different perspectives on the acceleration of demand for contraceptives.
Donors identified several priority information gaps, and decisions that would be affected if these gaps were filled.
Advocates identified several information gaps that, if filled, would strengthen or refine their strategies.
While manufacturers’ priority information needs are (1) advance knowledge of order volumes and (2) greater insight into donor funding, most interviewees expressed an interest in learning more about changes in demand from analyses of demographic data. There was also interest in using demographic data to identify major shifts in demand far enough in advance to take corrective action.
Donors offered differing predictions about the acceleration of demand during the coming years: some said family planning program expansion will lead to the achievement of the FP2020 goal in the year 2020, while others expected countries to continue in their current growth patterns (with modest shifts in method mix). Regardless of growth in future years, donors agreed it is essential that the family planning community clarify and agree on the true levels of funding, supplies, and other resources needed to meet the current demand for contraceptives.
Donors said that a thorough quantification of the full costs of meeting the demand for contraceptives was critical. Donors also prioritized the need for better data on particular market dynamics (product diffusion rates, and consumption / wastage, respectively), and data and analysis to help them detect large shifts in method mix or demand. Additional information needs pertained to funding decisions and price and volume negotiations. Filling these gaps would help them make decisions about the provision of technical assistance to countries, as well as improvements in planning at the global and country levels.
Advocates identified a number of topics warranting greater investigation, such as the relationship between contraceptive prevalence and the availability of contraceptive supplies, with attention to the role of community norms and concerns over side effects vs. stock constraints and affordability. Another topic mentioned was the influence of financial subsidies and incentives on uptake of a particular method and overall method mix.
“We need demographic data that will help us detect large shifts in demand far enough in advance to adjust our plans.”
—Generics manufacturer
“Tracking supplies of emergency contraception would mean collecting data from roughly 200 different manufacturers.”
—Technical expert/advocate
11GLOBAL CONTRACEPTIVE COMMODITY GAP ANALYSIS 2016
Technical experts say there are significant and persistent visibility gaps in the most frequently used data sources.
Technical experts noted that even the data sources and reports they regularly use have significant visibility gaps. Examples of “blind spots” include:
› Greater understanding is needed of the degree to which increasing use of one method (for example, implants) represents new users of contraception versus existing users who are shifting between contraceptive methods.
› There is strong insight into the contraceptive supply needs of some countries, especially those that have robust national quantification processes, but almost no insight into others.
No regularly published report provides a “big picture” overview of the contraceptive supplies security landscape.
Advocates and technical experts noted that different methodologies have led to the publication of seemingly conflicting estimates, and this lack of alignment can present decision-makers with a confusing, sometimes contradictory array of messages.
“The publishing of multiple, contradictory data analyses can be worse than having no data at all.”
—Advocate

12GLOBAL CONTRACEPTIVE COMMODITY GAP ANALYSIS 2016
Four Key Questions and Findings
In this section we address a selection of questions that emerged from our consultation with stakeholders. Our responses demonstrate the blending of expertise that took place among the participants in this project as we explored the parameters of the available data and determined what factors we could, and could not, quantify.
The data we present here refer mainly to aggregate totals and changes between now and 2020. In subsequent sections we present detailed analyses of changes year-by-year and method-by-method for the set of 135 LMI countries and subset of 69 FP2020 focus countries. Additional information about the methodologies and data sources used to produce the analyses can be found in Section 7.
SECTION 2

13GLOBAL CONTRACEPTIVE COMMODITY GAP ANALYSIS 2016
How much is spent on contraceptive supplies, and what are the relative contributions of donors, governments of low- and middle-income countries, and individuals?
To address this question, we produced an analysis of total spending on contraceptive supplies across the 135 LMI countries, and within that, spending amongst the subset of 69 FP2020 countries. Our analysis comprises all spending on contraceptive supplies that transpired in the year 2014, which is the most recent year for which there is sufficient data for all the countries in the CGA’s scope.15 The next iteration of the CGA will present updated estimates reflecting spending on contraceptive supplies in 2015.
Total spending on supplies in 2014 includes expenditures by institutional purchasers who may have procured supplies at levels above or below the quantities needed for individual user consumption in a single year. The distinctions between the quantities of supplies required for user consumption and the quantities procured in the public sector are discussed later in this section and in Section 3.
Donors | public sector
This category captures direct spending on supplies, monetary contributions used to underwrite supply procurement, the value of in–kind contributions of supplies, basket funds provided by donors and used by governments to procure supplies, and World Bank loan funds used to procure supplies.
Donor entities in this category include: aid agencies such as DFID and USAID; international institutions such as UNFPA and the World Bank; social marketing groups and INGOs such as IPPF, MSI, and PSI, most of whose procurement is subsidized by donor funding; and philanthropic entities.
Data collected annually by UNFPA and NIDI to produce UNFPA’s annual External Support for Procurement report was the predominant source of information for this category.
Governments | public sector
This category consists of spending by the governments of the 135 LMI countries (including the subset of 69 FP2020 focus countries) using internally generated (non-donor, non-basket fund, and non-World Bank loan) revenue.
Data collected by NIDI in country surveys and records in the CS Indicators database informed this category.
Individuals | private sector
This category consists mainly of out-of-pocket (OOP) spending by individuals purchasing their own supplies from private sector entities, and a much smaller amount representing employer-provided health services.
Data from NIDI informed this category, and where gaps in data were present, we inferred individual OOP spending by extracting from the DHS and other household surveys the number of users of each method of contraception who indicated they received services and supplies from a private sector provider. The quantity of supplies these users would consume in a year was then costed using commodity prices appropriate to each method in each country (provided by the Guttmacher Institute).
Our analysis disaggregates the total amount spent by three categories of spender, which are described below.

14GLOBAL CONTRACEPTIVE COMMODITY GAP ANALYSIS 2016
TABLE 1. TOTAL SPENDING ON CONTRACEPTIVE SUPPLIES IN 2014
135 LOW- AND MIDDLE-INCOME COUNTRIES
Total spending on supplies $ 1,203,000,000
Combined Public Sector $ 508,400,000 42%Donors only $ 305,500,000 25%
Governments only $ 202.900.000 17%
Individuals/Private Sector $ 694,900,000 58%
TABLE 2. TOTAL SPENDING ON CONTRACEPTIVE SUPPLIES IN 2014
69 FP2020 FOCUS COUNTRIES
Total spending on supplies $ 821,800,000
Combined Public Sector $ 374,700,000 46%Donors only $ 248,400,000 30%
Governments only $ 126,300,000 15%
Individuals/Private Sector $ 447,100,000 54%
Total spending on contraceptive supplies: 135 LMI countries
In total, more than $1.203 billion was spent on contraceptive supplies across the 135 LMI countries in 2014 (Table 1). Individuals who paid for their own contraceptive supplies comprised a much larger percentage of total
spending (58%) than the public sector (42%), which included all donor funding and governments that spent domestically generated resources on supplies (25% and 17%, respectively).
Total spending on contraceptive supplies: 69 FP2020 focus countries
In the subset of 69 FP2020 focus countries, nearly $822 million was spent on contraceptive supplies in 2014 (Table 2). Of this total, individuals were responsible for a much larger percentage (54%) of the total amount spent than either donors (30%) or governments (15%). Unsurprisingly, the governments of the subset of 69 FP2020 focus countries – the lowest-income countries – spent relatively less than governments in the full set of 135 LMI countries (15% vs. 17%).
It is noteworthy that spending by individuals who obtained their contraceptive supplies through the private sector still comprised a majority of total spending. While the global family planning community has understandably focused most of its attention on public sector funding for contraceptive supplies, the role of individual spending deserves greater investigation.

15GLOBAL CONTRACEPTIVE COMMODITY GAP ANALYSIS 2016
How many women will use each method of contraception in 2020, and what volume of supplies will they consume?
To answer this question, we calculated the number of women using modern methods of contraception, changes in method mix over time, and the quantities of supplies these users would consume under the two different scenarios.
Number of users of contraception
Our analysis begins with the number of women using contraceptives (Figure 1). In 2016, there were 452.7 million users of contraception living in the 135 LMI countries. 300.3 million of them lived in the 69 FP2020 focus countries. They included both married and unmarried women, served by both the public and the private sectors.
Interviews with individual women generate the data on contraceptive use collected by DHS16, MICs17, PMA202018, and national and subnational health, socio-economic, and fertility surveys. All of these sources, along with high-quality service statistics, contributed to our estimates of the number of users of each method. Our analysis comprises individual estimates for each of the 135 LMI countries, including the subset of 69 FP2020 countries.
To project the number of users of each contraceptive method in the year 2020, one must make assumptions about future changes in the number of users of contraception and shifts in method mix between now and then. For the CGA-2016 analysis, we posited two scenarios:
Envisions the achievement of FP2020’s goal for its 69 FP2020 focus countries, namely 120 million additional users of contraception by the year 2020.19 For our analysis of the full set of 135 LMI countries, Scenario B assumes that increased contraceptive use in the 69 countries would generate a demonstration effect resulting in accelerated demand for contraception across the other 66 LMI countries.20 Throughout this report estimates related to Scenario B are color-coded orange.
Assumes that each country will continue in its current pattern of change in the number of users and shifts in method mix. Throughout this report, estimates related to Scenario A are color-coded green.
SCENARIO A SCENARIO B

16GLOBAL CONTRACEPTIVE COMMODITY GAP ANALYSIS 2016
NUMBER OF USERS OF CONTRACEPTION | 135 LMI COUNTRIES
452.7 MILLION
Users of Contraception
2016 ESTIMATE If current trajectories of growth in contraceptive use continue, by 2020 there will be more than 490 million users of contraception living in the 135 LMI countries. This is more than 37 million additional users compared to 2016.
If the FP2020 goal is achieved and contraceptive use accelerates in all 135 LMI countries, by 2020 there will be nearly 550 million users of contraception. This is more than 97 million additional users compared to 2016.
490 MILLION
2020 ESTIMATE
550 MILLION
2020 ESTIMATE
300.3 MILLION
Users of Contraception
2016 ESTIMATE If current trajectories of growth in contraceptive use continue, by 2020 there will be 334 million users of contraception living in the 69 FP2020 focus countries. This is nearly 34 million more users than there were in 2016.
If the FP2020 goal is achieved, by 2020 there will be more than 390 million users of contraception living in the 69 FP2020 focus countries. This is nearly 90 million more users than there were in 2016.
334 MILLION
2020 ESTIMATE
390 MILLION
2020 ESTIMATE
NUMBER OF USERS OF CONTRACEPTION | 69 FP2020 FOCUS COUNTRIES
FIGURE 1. NUMBER OF USERS OF CONTRACEPTION
Scenario A | Current growth trajectories of contraceptive use continue in each country.
Scenario B | The FP2020 goal is achieved in the 69 focus countries, and a demonstration effect accelerates the increase of contraceptive use in the remaining 66 LMI countries.
17GLOBAL CONTRACEPTIVE COMMODITY GAP ANALYSIS 2016
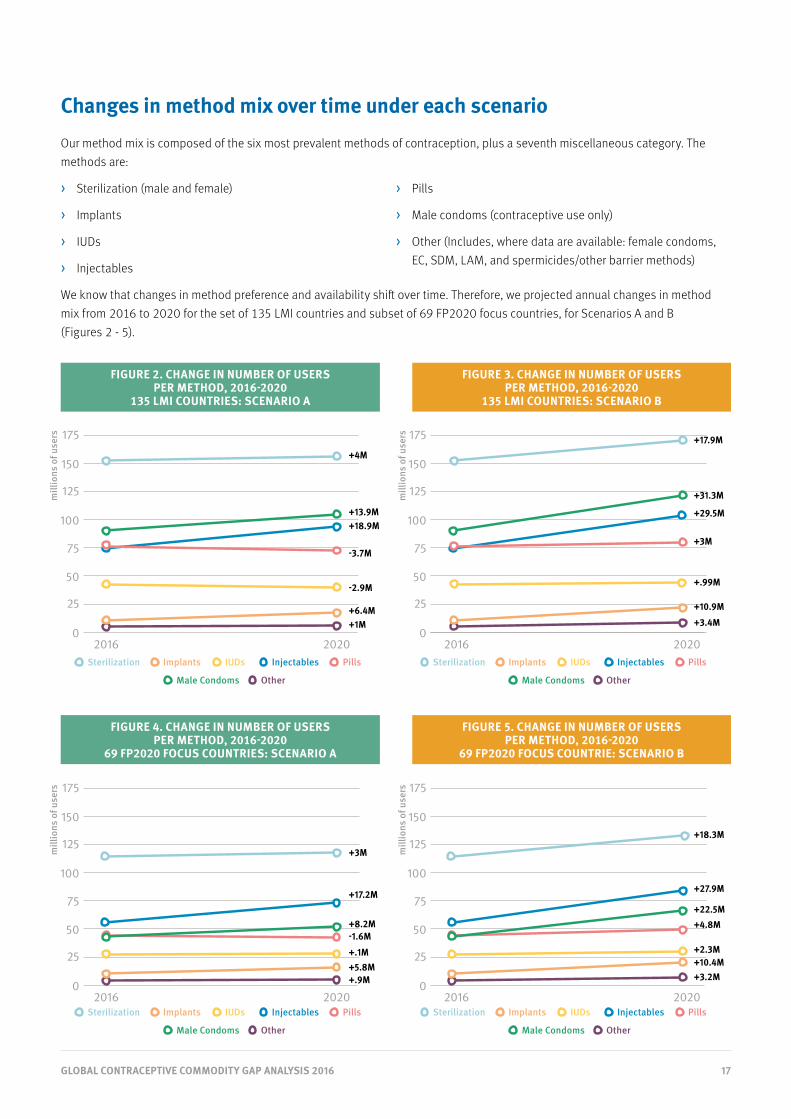
Changes in method mix over time under each scenario
Our method mix is composed of the six most prevalent methods of contraception, plus a seventh miscellaneous category. The methods are:
› Sterilization (male and female)
› Implants
› IUDs
› Injectables
› Pills
› Male condoms (contraceptive use only)
› Other (Includes, where data are available: female condoms, EC, SDM, LAM, and spermicides/other barrier methods)
We know that changes in method preference and availability shift over time. Therefore, we projected annual changes in method mix from 2016 to 2020 for the set of 135 LMI countries and subset of 69 FP2020 focus countries, for Scenarios A and B (Figures 2 - 5).
0
50
25
75
125
100
150
175
0
50
25
75
125
100
150
175
0
50
25
75
125
100
150
175
0
50
25
75
125
100
150
175
2016 2020 2016 2020
2016 2020 2016 2020
Sterilization Implants IUDs Injectables Pills
Male Condoms Other
Sterilization Implants IUDs Injectables Pills
Male Condoms Other
Sterilization Implants IUDs Injectables Pills
Male Condoms Other
Sterilization Implants IUDs Injectables Pills
Male Condoms Other
mill
ions
of u
sers
mill
ions
of u
sers
mill
ions
of u
sers
mill
ions
of u
sers
+4M+17.9M
+31.3M
+29.5M
+3M
+.99M
+10.9M
+3.4M
+18.3M
+27.9M
+22.5M+4.8M
+2.3M+10.4M+3.2M
+13.9M+18.9M
-3.7M
-2.9M
+6.4M+1M
+3M
+17.2M
+8.2M-1.6M
+.1M+5.8M+.9M
FIGURE 2. CHANGE IN NUMBER OF USERS PER METHOD, 2016-2020
135 LMI COUNTRIES: SCENARIO A
FIGURE 4. CHANGE IN NUMBER OF USERS PER METHOD, 2016-2020
69 FP2020 FOCUS COUNTRIES: SCENARIO A
FIGURE 3. CHANGE IN NUMBER OF USERS PER METHOD, 2016-2020
135 LMI COUNTRIES: SCENARIO B
FIGURE 5. CHANGE IN NUMBER OF USERS PER METHOD, 2016-2020
69 FP2020 FOCUS COUNTRIE: SCENARIO B
18GLOBAL CONTRACEPTIVE COMMODITY GAP ANALYSIS 2016
Quantities of supplies consumed by users of contraception
In this report, we refer to the volume of contraceptive commodities and associated clinical supplies that users of contraception will personally consume over the course of a year as “consumption quantities.”
Consumption quantities are different from the volumes of contraceptive commodities bought by institutional purchasers; to note this distinction, we refer to the latter as “procurement quantities.”
We used established methodologies to calculate the quantity of supplies that the users of each method of contraception will consume on an annual basis.
Different approaches were used to estimate consumption quantities for short-term versus long-acting and permanent methods (LAPM). Users of short-term methods must consume multiple commodities each year to obtain a full year of coverage. By contrast, a fraction of LAPM users will rely on implants or IUDs inserted or sterilizations performed in a prior year, and thus have no need to consume any commodities during the subsequent year(s).
Procurement quantities may reflect a number of factors in addition to user consumption, such as the volume necessary to fill supply pipelines and maintain adequate inventory levels from central warehouses to individual service delivery points.
Procurement quantities may take into account the volume of supplies already present or on order, inventory holding policies along the supply chain, and wastage or “leakage” of supplies at various levels. Constraints on funding, price incentives, plans to expand programs in the future, and preferences by donors or the government itself for particular methods or products may also influence what type and what volume of supplies to procure.
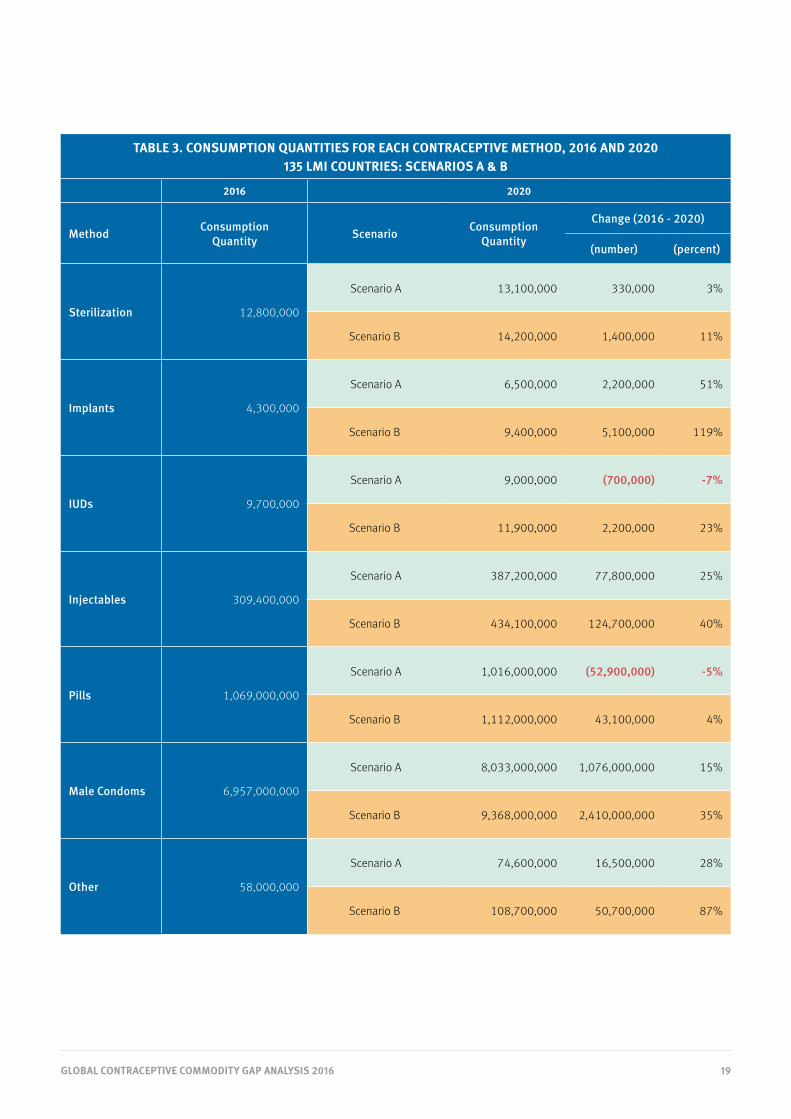
Our 2016 to 2020 consumption quantity estimates for the set of 135 LMI countries (Table 3) and subset of 69 FP2020 focus countries (Table 4) reflect our assumptions under Scenarios A and B regarding each country’s patterns of change in the number of users of each method.
19GLOBAL CONTRACEPTIVE COMMODITY GAP ANALYSIS 2016
TABLE 3. CONSUMPTION QUANTITIES FOR EACH CONTRACEPTIVE METHOD, 2016 AND 2020135 LMI COUNTRIES: SCENARIOS A & B
2016 2020
Method Consumption Quantity Scenario Consumption
Quantity
Change (2016 - 2020)
(number) (percent)
Sterilization 12,800,000
Scenario A 13,100,000 330,000 3%
Scenario B 14,200,000 1,400,000 11%
Implants 4,300,000
Scenario A 6,500,000 2,200,000 51%
Scenario B 9,400,000 5,100,000 119%
IUDs 9,700,000
Scenario A 9,000,000 (700,000) -7%
Scenario B 11,900,000 2,200,000 23%
Injectables 309,400,000
Scenario A 387,200,000 77,800,000 25%
Scenario B 434,100,000 124,700,000 40%
Pills 1,069,000,000
Scenario A 1,016,000,000 (52,900,000) -5%
Scenario B 1,112,000,000 43,100,000 4%
Male Condoms 6,957,000,000
Scenario A 8,033,000,000 1,076,000,000 15%
Scenario B 9,368,000,000 2,410,000,000 35%
Other 58,000,000
Scenario A 74,600,000 16,500,000 28%
Scenario B 108,700,000 50,700,000 87%

20GLOBAL CONTRACEPTIVE COMMODITY GAP ANALYSIS 2016
TABLE 4. CONSUMPTION QUANTITIES FOR EACH CONTRACEPTIVE METHOD, 2016 AND 2020 69 FP2020 FOCUS COUNTRIES: SCENARIOS A & B
2016 2020
Method Consumption Quantity Scenario Consumption
Quantity
Change (2016 - 2020)
(number) (percent)
Sterilization 9,000,000
Scenario A 9,200,000 230,000 3%
Scenario B 10,400,000 1,400,000 16%
Implants 3,900,000
Scenario A 5,900,000 2,000,000 51%
Scenario B 8,800,000 4,900,000 124%
IUDs 6,200,000
Scenario A 6,300,000 30,000 1%
Scenario B 8,200,000 1,900,000 31%
Injectables 228,700,000
Scenario A 299,100,000 70,400,000 31%
Scenario B 346,300,000 117,600,000 51%
Pills 623,400,000
Scenario A 599,700,000 (23,700,000) -4%
Scenario B 691,500,000 68,000,000 11%
Male Condoms 3,361,000,000
Scenario A 3,993,000,000 631,700,000 19%
Scenario B 5,096,000,000 1,734,000,000 52%
Other 45,000,000
Scenario A 62,300,000 17,200,000 38%
Scenario B 94,400,000 49,300,000 109%

21GLOBAL CONTRACEPTIVE COMMODITY GAP ANALYSIS 2016
How much do the supplies consumed by all users of contraception currently cost, and how much greater will the cost be in the year 2020?
Our estimates of the total cost of the supplies consumed by all users of contraception – which we refer to as consumption costs – build on our estimates of consumption quantities for each method (Figure 6). Simply put, the consumption cost reflects the consumption quantity for each method multiplied by the price of the requisite commodity or clinical supply.
To produce our consumption cost estimates, we used the country-specific analysis of commodity and associated clinical supply prices produced by the Guttmacher Institute for their annual Adding It Up21 report. The Guttmacher analysis takes into account variations in the price paid for each contraceptive commodity and associated clinical supply in a country, as well as the mix of different products (e.g. types of implants) used, to produce an average cost per method for each country.
Given the diversity of supply sources, profit margins, and retail mark-ups, estimating the typical commodity and supply prices in the private sector is problematic. Thus, commodities and supplies that flow through the private sector were valued at public sector prices. For this reason, the estimated cost of commodities and supplies within the private sector may underestimate actual prices and costs.
FIGURE 6: CONSUMPTION COST OF CONTRACEPTIVE SUPPLIES
$ 1.352 BILLION
Cost of Supplies
2016 ESTIMATE If current trajectories of growth in contraceptive use continue in 135 LMI countries, by 2020 users will consume a volume of supplies worth $1.525 billion at current prices. The greater volume adds $173.2 million in cost compared to 2016.
If the FP2020 goal is achieved and contraceptive use accelerates in all 135 LMI countries, by 2020 users will consume a volume of supplies worth $1.744 billion at current prices. The greater volume adds $392.4 million in cost compared to 2016.
$ 1.525 BILLION
2020 ESTIMATE
$ 1.744 BILLION
2020 ESTIMATE
CONSUMPTION COST OF SUPPLIES | 135 LOW- AND MIDDLE-INCOME COUNTRIES
$ 896 MILLION
Cost of Supplies
2016 ESTIMATE If current trajectories of growth in contraceptive use continue in the 69 FP2020 focus countries, by 2020 users will consume a volume of supplies worth $1.055 billion at current prices. The greater volume adds $159 million in cost compared to 2016.
If the FP2020 goal is achieved in the 69 FP2020 focus countries, by 2020 users will consume a volume of supplies worth $1.259 billion at current prices. The greater volume adds $363.2 million in cost compared to 2016.
$ 1.055 BILLION
2020 ESTIMATE
$ 1.259 BILLION
2020 ESTIMATE
CONSUMPTION COST OF SUPPLIES | 69 FP2020 FOCUS COUNTRIES
Scenario A | Current growth trajectories of contraceptive use continue in each country.
Scenario B | The FP2020 goal is achieved in the 69 focus countries, and a demonstration effect accelerates the increase of contraceptive use in the remaining 66 LMI countries.

22GLOBAL CONTRACEPTIVE COMMODITY GAP ANALYSIS 2016
Method mix: use versus cost
Method mix that reflects the number of users of each contraceptive method looks quite different from method mix that represents the consumption cost of supplies. The differences are due to several factors, including the cost variation among methods and the duration of protection offered by each method.
In 2016, injectables represented 16% of all method use across the 135 LMI countries (Figure 7). It was, however, the most costly method in both absolute and relative terms in 2016: at $545 million, it represented 40% of the $1.352 billion total consumption cost.
In the subset of 69 FP2020 focus countries, sterilization represented 38% of method use but only 3% of the method consumption cost (Figure 8). Together, pills and injectables represented just 34% of method use but 80% of method consumption cost.
34%
2%
9%
16%
17%
20%
1% 1% 1%9%
36%
44%
1%5%3%
15%
15%
19%
9%
3%
38%
1%
12%
38%
40%
2%3%3%
Sterilization Implants IUDs Injectables Pills
Male Condoms Other
Sterilization Implants IUDs Injectables Pills
Male Condoms Other
0%
20%
40%
60%
80%
100%
0%
20%
40%
60%
80%
100%
METHOD USE METHOD COST METHOD USE METHOD COST
FIGURE 7. METHOD USE VS METHOD COST IN 2016 135 LMI COUNTRIES
FIGURE 8. METHOD USE VS METHOD COST IN 2016 69 FP2020 FOCUS COUNTRIES

23GLOBAL CONTRACEPTIVE COMMODITY GAP ANALYSIS 2016
What contraceptive supplies funding gaps can we anticipate in the year 2020? If donor and government spending does not increase, what cost burden will shift to out-of-pocket expenditures by individuals?
Projected need for additional funds
To estimate the size of potential funding gaps, we drew on the analyses discussed in this report thus far:
› The level of total spending on contraceptive supplies in 2014, and the relative percentages of total spending contributed by donors, governments, and individuals (page 14),
› The current number of users of each contraceptive method, projected annually to 2020 under Scenarios A & B (page 15),
› The quantity of supplies consumed by the users of each contraceptive method (the consumption quantity), projected annually to 2020 under Scenarios A & B (page 18), and
› The cost of the supplies consumed by users of contraception (the consumption cost), based on the consumption quantities for each method projected annually to 2020 under Scenarios A & B (page 21).
This report does not include projections of anticipated spending levels in the years 2016 - 2020. There are too many factors that may influence the amounts allocated and disbursed by donors and governments in any given year to make data-driven predictions about funding.
However, because estimating potential funding gaps requires a baseline of spending against which future costs can be compared, we chose to use and hold constant the most recent estimate of spending. This estimate reflects spending that transpired in 2014, which is the most recent year for which sufficient data exist for the countries included in the scope of the CGA.
Therefore, the estimates of potential funding gaps should be understood as the annual difference between the total amount of actual spending on supplies in 2014 and the projected consumption cost of supplies under each scenario.
Our estimates may understate the size of potential funding gaps for several reasons. First, current prices for contraceptive supplies are used throughout our analysis; costs are not adjusted for future inflation. Second, as we explore elsewhere in this report, the quantities of supplies required for procurement may be larger than the quantities users will consume in a single year; our spending analysis includes all expenditures on public sector procurement as well as out-of-pocket spending. Third, individuals who buy their own supplies from the private sector may pay higher prices than public sector entities that often buy in bulk and/or maximize economies of scale.
If the current patterns of change in the 135 LMI countries continue, we anticipate a contraceptive supplies funding gap of $322 million in the year 2020 (Figure 9). In other words, under Scenario A, the projected consumption cost of supplies in 2020 ($1.525 billion) exceeds the total amount spent on supplies in 2014 ($1.203 billion) by $322 million. Under Scenario B, the supplies funding gap for the 135 LMI countries in the year 2020 is much larger: $541 million.
For the subset of 69 FP2020 countries, the continuation of current patterns of change will result in a supplies funding gap of $233 million by the year 2020. If the FP2020 goal were achieved, the supplies funding gap in 2020 would be $437 million.22

24GLOBAL CONTRACEPTIVE COMMODITY GAP ANALYSIS 2016
Scenario A | Current growth trajectories of contraceptive use continue in each country.
Scenario B | The FP2020 goal is achieved in the 69 focus countries, and a demonstration effect accelerates the increase of contraceptive use in the remaining 66 LMI countries.
If current trajectories of growth in contraceptive use continue in the 135 LMI countries, the gap between the amount spent on supplies in 2014 and the cost of the volume of supplies users will require in 2020 will be $322 million.
If the FP2020 goal is achieved and contraceptive use accelerates in all 135 LMI countries, the gap between the amount spent on supplies in 2014 and the cost of the volume of supplies users will require in 2020 will be $541 million.
$ 541 MILLION
$ 322 MILLION
FUNDING GAP
FUNDING GAP
in 2020
in 2020
$ 1.744 BILLION
COST OF SUPPLIES
in 2020
$ 1.525 BILLION
COST OF SUPPLIES
in 2020
PROJECTED FUNDING GAPS | 135 LOW- AND MIDDLE-INCOME COUNTRIES
$ 1.203 BILLION
in 2014
SPENT ON SUPPLIES
If current trajectories of growth in contraceptive use continue in the 69 FP2020 focus countries, the gap between the amount spent on supplies in 2014 and the cost of the supplies users will require in 2020 will be $233 million.
If the FP2020 goal is achieved in the 69 focus countries, the gap between the amount spent on supplies in 2014 and the cost of the supplies users will require in 2020 will be $437 million.
$ 437 MILLION
$ 233 MILLION
FUNDING GAP
FUNDING GAP
in 2020
in 2020
$ 1.259 BILLION
COST OF SUPPLIES
in 2020
$ 1.055 BILLION
COST OF SUPPLIES
in 2020
PROJECTED FUNDING GAPS | 69 FP2020 FOCUS COUNTRIES
$ 821.8 MILLION
in 2014
SPENT ON SUPPLIES
FIGURE 9: PROJECTED SUPPLIES FUNDING GAPS IN 2020
The funding gap should be understood as the annual difference between the total amount of actual spending on supplies in 2014 and the projected cost, at current prices, of the supplies users will consume under each scenario. 2014 is the most recent year with sufficient data for this analysis.
25GLOBAL CONTRACEPTIVE COMMODITY GAP ANALYSIS 2016
$1.2bntotal spending
in 2014
58%
58%
58%
17%
17%
17%
25%
25%
25%
in 2020$1.52bn
in 2020$1.74bn
Donors$305.5m (25%)
Governments$202.9m (17%)
Individuals/Private Sector$694.9m (58%)
Donors$387.2m (25%)
Governments$257.2m (17%)
Individuals/Private Sector$880.9m (58%)
Donors$442.8m (25%)
Governments$294.1m (17%)
Individuals/Private Sector$1bn (58%) B
A
Combined Public Sector | 42%
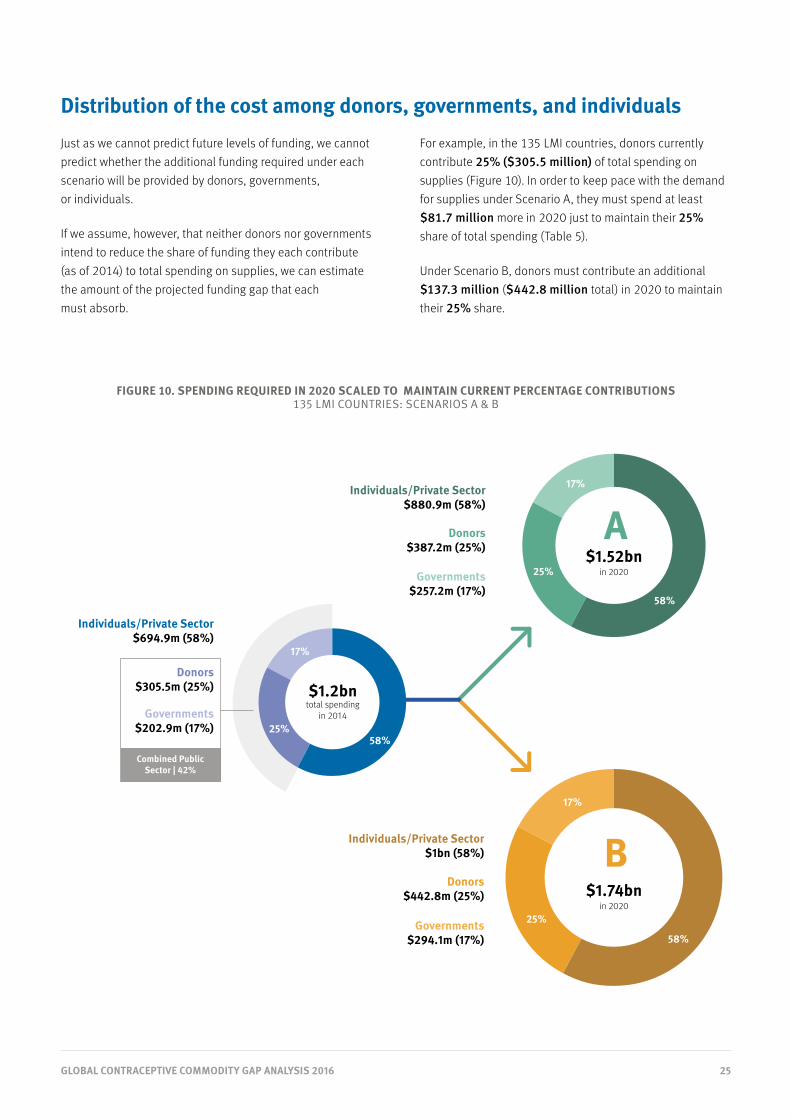
Distribution of the cost among donors, governments, and individuals
Just as we cannot predict future levels of funding, we cannot predict whether the additional funding required under each scenario will be provided by donors, governments, or individuals.
If we assume, however, that neither donors nor governments intend to reduce the share of funding they each contribute (as of 2014) to total spending on supplies, we can estimate the amount of the projected funding gap that each must absorb.
For example, in the 135 LMI countries, donors currently contribute 25% ($305.5 million) of total spending on supplies (Figure 10). In order to keep pace with the demand for supplies under Scenario A, they must spend at least $81.7 million more in 2020 just to maintain their 25% share of total spending (Table 5).
Under Scenario B, donors must contribute an additional $137.3 million ($442.8 million total) in 2020 to maintain their 25% share.
FIGURE 10. SPENDING REQUIRED IN 2020 SCALED TO MAINTAIN CURRENT PERCENTAGE CONTRIBUTIONS 135 LMI COUNTRIES: SCENARIOS A & B
26GLOBAL CONTRACEPTIVE COMMODITY GAP ANALYSIS 2016
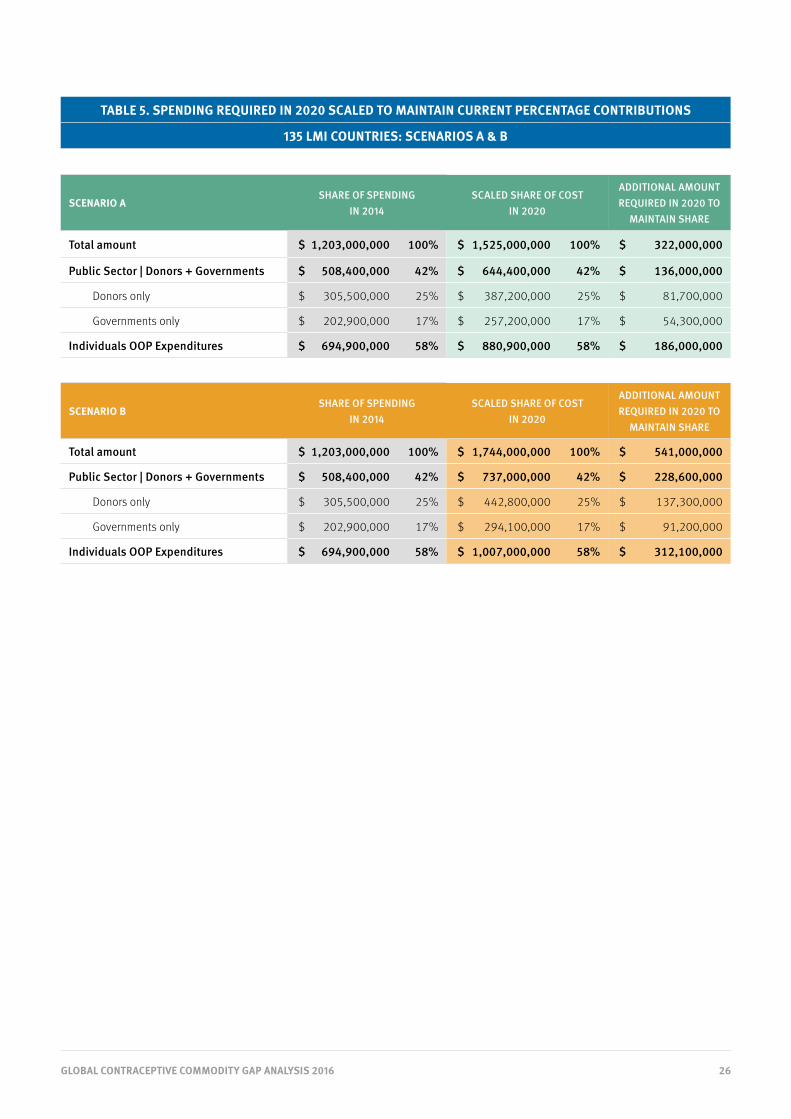
TABLE 5. SPENDING REQUIRED IN 2020 SCALED TO MAINTAIN CURRENT PERCENTAGE CONTRIBUTIONS
135 LMI COUNTRIES: SCENARIOS A & B
SCENARIO ASHARE OF SPENDING
IN 2014SCALED SHARE OF COST
IN 2020
ADDITIONAL AMOUNT REQUIRED IN 2020 TO
MAINTAIN SHARE
Total amount $ 1,203,000,000 100% $ 1,525,000,000 100% $ 322,000,000
Public Sector | Donors + Governments $ 508,400,000 42% $ 644,400,000 42% $ 136,000,000
Donors only $ 305,500,000 25% $ 387,200,000 25% $ 81,700,000
Governments only $ 202,900,000 17% $ 257,200,000 17% $ 54,300,000
Individuals OOP Expenditures $ 694,900,000 58% $ 880,900,000 58% $ 186,000,000
SCENARIO BSHARE OF SPENDING
IN 2014SCALED SHARE OF COST
IN 2020
ADDITIONAL AMOUNT REQUIRED IN 2020 TO
MAINTAIN SHARE
Total amount $ 1,203,000,000 100% $ 1,744,000,000 100% $ 541,000,000
Public Sector | Donors + Governments $ 508,400,000 42% $ 737,000,000 42% $ 228,600,000
Donors only $ 305,500,000 25% $ 442,800,000 25% $ 137,300,000
Governments only $ 202,900,000 17% $ 294,100,000 17% $ 91,200,000
Individuals OOP Expenditures $ 694,900,000 58% $ 1,007,000,000 58% $ 312,100,000

27GLOBAL CONTRACEPTIVE COMMODITY GAP ANALYSIS 2016
Across the 69 FP2020 focus countries, spending by donors amounted to $248.4 million in 2014. This was 30% of total spending; we attribute the remainder to governments using non-donor funds (15%) and out-of-pocket spending by individuals who purchased supplies through the private sector (54%).
Under Scenario A, the supplies that would be consumed by all users of contraception in the year 2020 cost $1.055 billion. Scaling up donor funding to maintain a 30% share of the total cost calls for $318.9 million – $70.5 million more than donors spent on supplies in 2014.
If the FP2020 goal were achieved (Scenario B), the supplies consumption cost in 2020 would be $1.259 billion (Figure 11). For donors to provide a 30% share of this cost, they would have to spend $380.6 million – $132.2 million more than they spent on supplies in 2014 (Table 6).
$822mtotal spending
in 2014
54%
54%
54%
15%
15%
15%
30%
30%
30%
Donors$248.4m (30%)
Governments$126.3m (15%)
Individuals/Private Sector$447.1m (54%)
Combined Public Sector | 46%
Donors$318.9m (30%)
Governments$162.1m (15%)
Individuals/Private Sector$574m (54%)
Donors$380.6m (30%)
Governments$193.5m (15%)
Individuals/Private Sector$685.1m (54%)
in 2020$1.05bn
in 2020$1.25bn
B
A
FIGURE 11. SPENDING REQUIRED IN 2020 SCALED TO MAINTAIN CURRENT PERCENTAGE CONTRIBUTIONS 69 FP2020 FOCUS COUNTRIES: SCENARIOS A & B

28GLOBAL CONTRACEPTIVE COMMODITY GAP ANALYSIS 2016
TABLE 6. SPENDING REQUIRED IN 2020 SCALED TO MAINTAIN CURRENT PERCENTAGE CONTRIBUTIONS
69 FP2020 FOCUS COUNTRIES: SCENARIOS A & B
SCENARIO ASHARE OF SPENDING
IN 2014SCALED SHARE OF COST
IN 2020
ADDITIONAL AMOUNT REQUIRED IN 2020 TO
MAINTAIN SHARE
Total amount $ 821,800,000 100% $ 1,055,000,000 100% $ 233,200,000
Public Sector | Donors + Governments $ 374,700,000 46% $ 481,000,000 46% $ 106,300,000
Donors only $ 248,400,000 30% $ 318,900,000 30% $ 70,500,000
Governments only $ 126,300,000 15% $ 162,100,000 15% $ 35,800,000
Individuals OOP Expenditures $ 447,100,000 54% $ 574,000,000 54% $ 126,900,000
SCENARIO ASHARE OF SPENDING
IN 2014SCALED SHARE OF COST
IN 2020
ADDITIONAL AMOUNT REQUIRED IN 2020 TO
MAINTAIN SHARE
Total amount $ 821,800,000 100% $ 1,259,000,000 100% $ 437,200,000
Public Sector | Donors + Governments $ 374,700,000 46% $ 574,100,000 46% $ 199,400,000
Donors only $ 248,400,000 30% $ 380,600,000 30% $ 132,200,000
Governments only $ 126,300,000 15% $ 193,500,000 15% $ 67,200,000
Individuals OOP Expenditures $ 447,100,000 54% $ 685,100,000 54% $ 238,000,000
29GLOBAL CONTRACEPTIVE COMMODITY GAP ANALYSIS 2016
Total Cost in 2020: $ 1,525,000,000Scaled distribution of total cost based on 2014 spending pattern
Total Cost in 2020: $ 1,525,000.000Public sector funding frozen at 2014 level
All costs above that amount shi� to OOP spending by individuals
Public sectorContribution in 2014 $ 508.4m
Scaling up publicsector spendingto meet 2020 costs requires an additional $ 136m
IndividualsContribution
in 2014$ 694.9m
IndividualsRemainder of total
cost in 2020$ 1.017bn
Scaling up individuals’OOP spending to meet
2020 costs requiresan additional $ 186m
Public sectorContribution in 2014 $ 508.4m
42%58%
33%
67%
Total Cost in 2020: $ 1,744,000,000 Scaled distribution of total cost based on 2014 spending pattern
Total Cost in 2020: $ 1,744,000,000 Public sector funding frozen at 2014 level
All costs above that amount shi� to OOP spending by individuals
Public sectorContribution in 2014 $ 508.4m
Scaling up publicsector spendingto meet 2020 costs requires an additional $ 228.6m
IndividualsContribution
in 2014$ 694.9m
IndividualsRemainder of total
cost in 2020$ 1.235bn
Scaling up individuals’OOP spending to meet
2020 costs requiresan additional $ 312.1m
Public sectorContribution in 2014 $ 508.4m
42%
58%
29%
71%
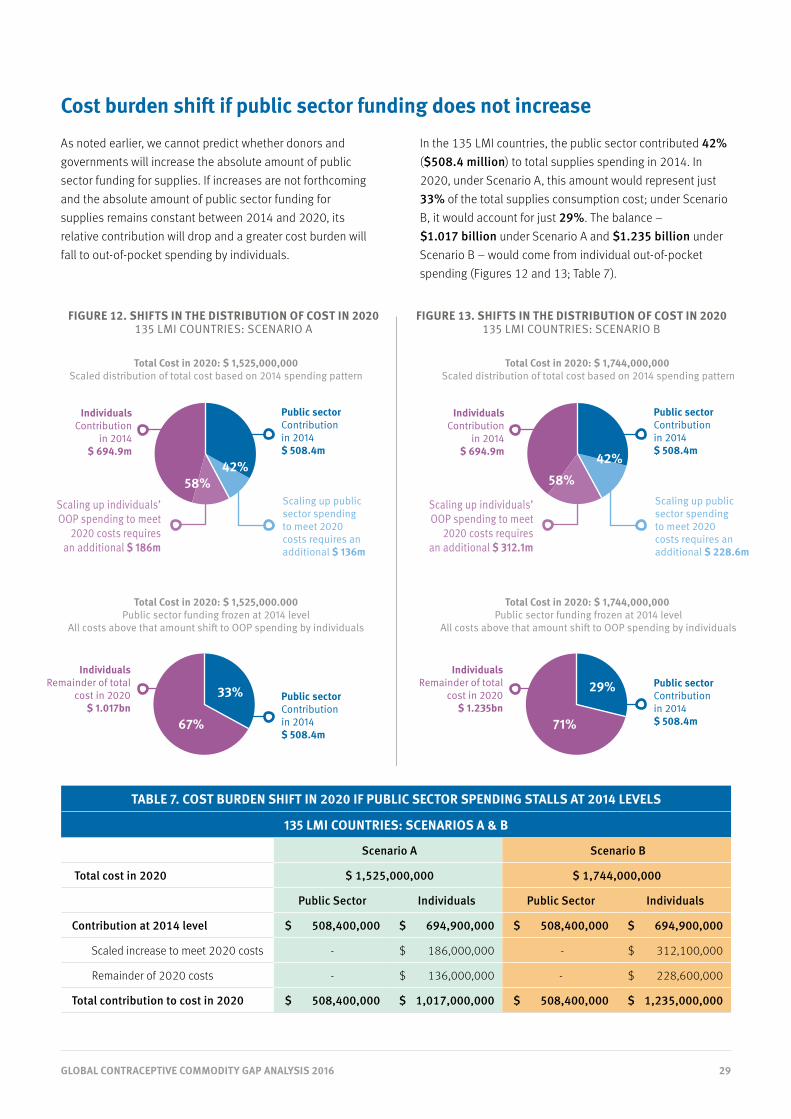
Cost burden shift if public sector funding does not increase
As noted earlier, we cannot predict whether donors and governments will increase the absolute amount of public sector funding for supplies. If increases are not forthcoming and the absolute amount of public sector funding for supplies remains constant between 2014 and 2020, its relative contribution will drop and a greater cost burden will fall to out-of-pocket spending by individuals.
In the 135 LMI countries, the public sector contributed 42% ($508.4 million) to total supplies spending in 2014. In 2020, under Scenario A, this amount would represent just 33% of the total supplies consumption cost; under Scenario B, it would account for just 29%. The balance – $1.017 billion under Scenario A and $1.235 billion under Scenario B – would come from individual out-of-pocket spending (Figures 12 and 13; Table 7).
TABLE 7. COST BURDEN SHIFT IN 2020 IF PUBLIC SECTOR SPENDING STALLS AT 2014 LEVELS
135 LMI COUNTRIES: SCENARIOS A & B
Scenario A Scenario B
Total cost in 2020 $ 1,525,000,000 $ 1,744,000,000
Public Sector Individuals Public Sector Individuals
Contribution at 2014 level $ 508,400,000 $ 694,900,000 $ 508,400,000 $ 694,900,000
Scaled increase to meet 2020 costs - $ 186,000,000 - $ 312,100,000
Remainder of 2020 costs - $ 136,000,000 - $ 228,600,000
Total contribution to cost in 2020 $ 508,400,000 $ 1,017,000,000 $ 508,400,000 $ 1,235,000,000
FIGURE 12. SHIFTS IN THE DISTRIBUTION OF COST IN 2020 135 LMI COUNTRIES: SCENARIO A
FIGURE 13. SHIFTS IN THE DISTRIBUTION OF COST IN 2020 135 LMI COUNTRIES: SCENARIO B

30GLOBAL CONTRACEPTIVE COMMODITY GAP ANALYSIS 2016
Total Cost in 2020: $ 1,525,000,000Scaled distribution of total cost based on 2014 spending pattern
Total Cost in 2020: $ 1,525,000.000Public sector funding frozen at 2014 level
All costs above that amount shi� to OOP spending by individuals
Public sectorContribution in 2014 $ 508.4m
Scaling up publicsector spendingto meet 2020 costs requires an additional $ 136m
IndividualsContribution
in 2014$ 694.9m
IndividualsRemainder of total
cost in 2020$ 1.017bn
Scaling up individuals’OOP spending to meet
2020 costs requiresan additional $ 186m
Public sectorContribution in 2014 $ 508.4m
42%58%
33%
67%
Total Cost in 2020: $ 1,744,000,000 Scaled distribution of total cost based on 2014 spending pattern
Total Cost in 2020: $ 1,744,000,000 Public sector funding frozen at 2014 level
All costs above that amount shi� to OOP spending by individuals
Public sectorContribution in 2014 $ 508.4m
Scaling up publicsector spendingto meet 2020 costs requires an additional $ 228.6m
IndividualsContribution
in 2014$ 694.9m
IndividualsRemainder of total
cost in 2020$ 1.235bn
Scaling up individuals’OOP spending to meet
2020 costs requiresan additional $ 312.1m
Public sectorContribution in 2014 $ 508.4m
42%
58%
29%
71%
Total Cost in 2020: $ 1,055,000,000 Scaled distribution of total cost based on 2014 spending pattern
Total Cost in 2020: $ 1,055,000,000 Public sector funding frozen at 2014 level
All costs above that amount shi� to OOP spending by individuals
Public sectorContribution in 2014 $ 374.7m
Scaling up publicsector spendingto meet 2020 costs requires an additional $ 106.3m
IndividualsContribution
in 2014$ 447.1m
IndividualsRemainder of total
cost in 2020$ 680.3m
Scaling up individuals’OOP spending to meet
2020 costs requiresan additional $ 126.9m
Public sectorContribution in 2014 $ 374.7m
Total Cost in 2020: $ 1,259,000,000 Scaled distribution of total cost based on 2014 spending pattern
Total Cost in 2020: $ 1,259,000,000 Public sector funding frozen at 2014 level
All costs above that amount shi� to OOP spending by individuals
Public sectorContribution in 2014 $ 374.7m
Scaling up publicsector spendingto meet 2020 costs requires an additional $ 199.4m
IndividualsContribution
in 2014$ 447.1m
IndividualsRemainder of total
cost in 2020$ 884.5m
Scaling up individuals’OOP spending to meet
2020 costs requiresan additional $ 238m
Public sectorContribution in 2014 $ 374.7m
46%54%
36%
64%
30%
70%
46%54%
TABLE 8. COST BURDEN SHIFT IN 2020 IF PUBLIC SECTOR SPENDING STALLS AT 2014 LEVELS
69 FP2020 FOCUS COUNTRIES: SCENARIOS A & B
Scenario A Scenario B
Total cost in 2020 $ 1,055,000,000 $ 1,259,000,000
Public Sector Individuals Public Sector Individuals
Contribution at 2014 level $ 374,700,000 $ 447,100,000 $ 374,700,000 $ 447,100,000
Scaled increase to meet 2020 costs - $ 126,900,000 - $ 238,000,000
Remainder of 2020 costs - $ 106,300,000 - $ 199,400,000
Total contribution to cost in 2020 $ 374,700,000 $ 680,300,000 $ 374,700,000 $ 884,500,000
Across the 69 FP2020 focus countries, the public sector’s $374.7 million contribution – which represents 46% of total spending on supplies in 2014 – would in 2020 cover only 36% of the supplies consumption cost under Scenario A. The balance – $680.3 million – would be borne by individuals spending out-of-pocket for supplies. Under Scenario B, the public sector contribution at 2014 levels would amount to just 30% of the total cost in 2020; the burden on individual out-of-pocket spending would be nearly $885 million (Figures 14 and 15; Table 8).
It is often assumed that funding shortfalls in the public sector will ultimately be compensated for by out-of-pocket spending. While this may be true to a certain extent, the potential magnitude of the shortfall under Scenario B calls into question the feasibility of this solution. Without funding increases from the public sector, achieving the FP2020 goal would require individual out-of-pocket spending on supplies in the world’s lowest-income countries to nearly double over six years; an additional $437 million in out-of-pocket spending would be needed in the year 2020 alone.
FIGURE 14. SHIFTS IN THE DISTRIBUTION OF COST IN 2020 69 FP2020 FOCUS COUNTRIES: SCENARIO A
FIGURE 15. SHIFTS IN THE DISTRIBUTION OF COST IN 2020 69 FP2020 FOCUS COUNTRIES: SCENARIO B

31GLOBAL CONTRACEPTIVE COMMODITY GAP ANALYSIS 2016
Analysis of Procurement Costs and Funding Gaps
In this section, we explore a different kind of analysis; one that looks at procurement needs and how many products to order, when they are scheduled to arrive, and where they must go. The procurement analysis takes into account both the consumption needs of individual clients and the presence of inventory held at stock points throughout the supply chain. This inventory helps buffer against demand uncertainty to ensure uninterrupted supply and continuous availability at all SDPs.
SECTION 3

32GLOBAL CONTRACEPTIVE COMMODITY GAP ANALYSIS 2016
The Reproductive Health Supplies Coalition is committed to ensuring that all women have access to high-quality contraceptive supplies whenever and wherever they seek family planning services. Meeting this commitment requires both long range and short term planning to guarantee there are sufficient commodities at each level of the supply chain so that service delivery points (SDPs) can offer users the method of their choice.
Elsewhere in this report we present estimates of consumption quantities based on country data from a variety of sources (including DHS, MICS, PMA2020, and services statistics from HMIS systems) collected over many years up to and including 2015. The data allow us to identify trends in contraceptive use, and these trends are the basis of our consumption quantity and cost projections to the year 2020. This information is critical to evaluating our progress-to-date, and to making longer term programmatic, manufacturing, and funding decisions.
In this section, we explore a different kind of analysis; one that looks at procurement needs and how many products to order, when they are scheduled to arrive, and where they must go. The procurement analysis takes into account both the consumption needs of individual clients and the presence of inventory held at stock points throughout the supply chain. This inventory helps buffer against demand uncertainty to ensure uninterrupted supply and continuous availability at all SDPs.
The analysis presented in this section was prepared by a group of experts from CHAI and JSI. It examines the public sector procurement needs of twenty countries and projects the amount of public sector funding required to meet future procurement requests. The analysis is based on information contained in governments’ public sector quantification reports and supply plans.
Insights from country quantification reports
Government quantification reports provide a record of the process through which Ministries of Health determine the volume of products they want to procure for specific programs or services, when the products must arrive, and how much the procurement will cost. Quantification reports are rich sources of information that can be used to inform predictions of a government’s future procurement requests and funding needs. Such analyses are highly country-specific, as factors like the number of stock-points, the length of the supply pipeline, the quantities of stock on hand, and the products and methods included in the public sector method mix vary by country. Quantification exercises and reports are not standardized across countries; they vary by the types of data and forecast methodologies used, the periods of time covered, and the frequency with which new data are introduced and estimates are revised. In some cases, new data are introduced and estimates are revised every six months.
The results of quantification exercises represent each government’s own assessment of what it needs to procure based on agreed-upon rates of growth and scale-up in provision of family planning in the public sector. Despite the specificity and time-sensitive nature of quantification
reports and supply plans, the CHAI-JSI team developed a standardized approach that extrapolates procurement needs over an extended period of time (in this case, 2016 to 2020). A description of their methodology can be found in Section 7, Notes on Methodologies and Data Sources, page 86.
While the practical advantages of the country- and time-specific nature of quantification exercises are clear, visibility is limited, and confidentiality agreements prevent the disclosure of estimates for individual countries. Therefore, this report presents aggregate totals for twenty countries from which the CHAI-JSI team could obtain quantification reports that met inclusion requirements. The quality of individual quantification reports was not assessed as part of this analysis to validate the results.

33GLOBAL CONTRACEPTIVE COMMODITY GAP ANALYSIS 2016
Findings: public sector procurement funding for 20 countries
The twenty countries included in the CHAI-JSI procurement analysis are Bangladesh, Burkina Faso, Cameroon, DR Congo, Côte d’Ivoire, Ethiopia, Ghana, Kenya, Lao PDR, Liberia, Malawi, Mauritania, Mozambique, Niger, Nigeria, Rwanda, Senegal, Tanzania, Togo, and Uganda. For each country except Nigeria, two consecutive years of forecast data were available, one of which was 2016 (Nigeria only conducts one-year forecasts, so supplemental data sources were used).
All 20 countries are FP2020 focus countries, and all included five of the six most prevalent contraceptive methods in their procurement estimates (implants, injectables, IUDs, pills, and male condoms were included; male and female sterilization was excluded). In addition, 17 countries included female condoms, 14 included EC, and 11 included SDM. Some of the countries included male condoms needed both for family planning and HIV programs; others included male condoms for family planning programs only.
CHAI-JSI estimated that the total funding needed for public sector procurement in all 20 countries was $210 million in 2016 (Figure 16). In 2020, they estimate that the total public
sector procurement funding need will be $337 million. Cumulatively, for the years 2016 – 2020, the funding needed for public sector procurement across the twenty countries is $1.397 billion.
To anticipate potential funding gaps, we compared these estimates to the amount the public sector (donors plus the governments of the twenty countries combined) spent on supplies in 2014, which was nearly $166 million (it is important to note, however, that public sector funding represents only about half of total spending on contraceptives across the 20 countries).
The comparison of the amount of public sector spending on supplies across the twenty countries in 2014 ($166 million) to the public sector procurement cost estimates calculated by the CHAI-JSI team points to a funding gap of $45 million in 2016.
By 2020, the public sector funding gap nearly quadruples in size at $171 million for that year alone. Cumulatively, the public sector procurement funding gap for the twenty countries over five years is $568 million.
0
50
100
150
200
250
300
350
$166 $166
$45
$210
$269
$307
$274
$337
$166 $166 $166 $166
$103
$141
$108
$171
Potential ProcurementFunding Gaps*
Public Sector Spending in 2014
* Includes commodities and freight. All estimates are in millions
2014 2016 2017 2018 2019 2020
FIGURE 16. ESTIMATED PUBLIC SECTOR PROCUREMENT FUNDING GAPS FOR 20 COUNTRIES

34GLOBAL CONTRACEPTIVE COMMODITY GAP ANALYSIS 2016
Consumption versus procurement quantities
Procurement quantities differ from consumption quantities insofar as they account not only for the products that will be consumed by individuals but also for inventory required at stock points throughout the supply chain. This inventory helps buffer against demand uncertainty and ensures uninterrupted supply and continuous availability and user choice at SDPs. There is no average factor or percentage to apply across countries as procurement quantities depend on the length of the supply pipeline in each country, inventory management policies, and stock on hand or orders in progress, which in some instances may mean
that procurement quantities are lower than forecast consumption.
Research conducted by JSI as part of the InSupply project23 on the relationship between implant procurement and insertion rates has found that high quantities of inventory / procurements are necessary to fill the supply pipelines, both when a product is first introduced, and as consumption grows rapidly. This does not, in the views of the project, represent excess stock compared to the number of insertions:
For inventory to be available for a given insertion, the entire pipeline must be filled ahead of time. For Ethiopia, this means that 18 months of inventory must be available throughout the supply chain nodes on the day of insertion, to account for demand volatility at each point in the supply chain and ensure inventory is available at all SDPs.
For example, in order to meet 26,315 clients’ needs in June 2012, 473,677 units need to be in the pipeline. Since the pipeline is 18 months long, all relevant procurements must have been completed in January 2011 to flow through the supply chain and be available at the SDP in June 2012.
Higher levels of procurement are needed to fill the pipeline as consumption is increasing. Eventually, as consumption stabilizes, and if the pipeline is filled, insertion levels will start to equal procurement figures.
The number of stocking points can change dramatically over several years, which would also affect the volumes required to fill the pipeline to each point. In Ethiopia, there were 2,500 SDPs in 2003; by 2015, the number had grown to more than 19,400 – each of which requires sufficient inventory.

35GLOBAL CONTRACEPTIVE COMMODITY GAP ANALYSIS 2016
Findings for 135 low- and middle-income countries
SECTION 4
SCENARIO A SCENARIO B135 LMI COUNTRIES

36GLOBAL CONTRACEPTIVE COMMODITY GAP ANALYSIS 2016
SCENARIO A135 LMI COUNTRIES
The path to 2020 | Scenario A
Scenario A uses countries’ current growth patterns to calculate median estimates of the number of contraceptive users in future years. This is a conservative approach that assumes there will be no appreciable deviation from current country trajectories with respect to growth in numbers of new users.
Our starting point is the total number of women using modern methods of contraception who were living in the 135 LMI countries in 2016: 452.7 million.
Under Scenario A, this number will grow to 490.3 million in 2020, an increase of 37.6 million users of contraception (Table 9).
While the total number of users increases each year, shifts in method mix result in a greater number of users of some methods and fewer users of others.
TABLE 9. NUMBER OF USERS OF EACH CONTRACEPTIVE METHOD, 2016 - 2020135 LMI COUNTRIES: SCENARIO A
* Estimates in millions 2016 2017 2018 2019 2020 CHANGE (2016 - 2020)
All Methods 452.7 461.7 471.6 480.9 490.3 37.6 8%
Sterilization 152.4 153.4 154.7 155.6 156.4 4.0 3%
Implants 10.9 12.4 14.0 15.6 17.3 6.4 58%
IUDs 42.8 42.1 41.3 40.6 39.8 (2.9) -7%
Injectables 74.6 79.2 84.0 88.7 93.6 18.9 25%
Pills 76.3 75.5 74.6 73.6 72.6 (3.7) -5%
Male Condoms 90.3 93.6 97.1 100.7 104.3 13.9 15%
Other 5.0 5.2 5.5 5.8 6.0 1.0 20%

37GLOBAL CONTRACEPTIVE COMMODITY GAP ANALYSIS 2016
Under Scenario A, the number of users of implants will grow by 58%, from 10.9 million in 2016 to 17.3 million in 2020, while the number of users of IUDs and pills will decrease by -7% and -5% respectively. This is a net reduction of 2.9 million IUD users and 3.7 million pill users by the year 2020 (Figure 17).
The decrease in the number of users of IUDs and pills mirrors patterns seen from survey data in many countries, suggesting that growth in some methods (notably implants and injectables) will be driven both by increases in overall users as well as existing users switching away from other methods.
As shown in Table 10, the share of method mix represented by sterilization will decrease by two percentage points between 2016 and 2020, but it will still be the most prevalent method: roughly one out of three users of contraception will still be women who rely on sterilization.
Mirroring the absolute increases in the number of users of both injectables and implants, these methods will also see the largest increases in their shares of the method mix. Injectables will increase by three percentage points, and implants will increase by two percentage points between 2016 and 2020.
“Other” methods of contraception represent just 1% of method mix. Aggregated across 135 countries, however, this 1% equates to 5 million users in 2016 and 6 million users in 2020.
SCENARIO A135 LMI COUNTRIES
0
50
25
75
125
100
150
175
0
50
25
75
125
100
150
175
0
50
25
75
125
100
150
175
0
50
25
75
125
100
150
175
2016 2020 2016 2020
2016 2020 2016 2020
Sterilization Implants IUDs Injectables Pills
Male Condoms Other
Sterilization Implants IUDs Injectables Pills
Male Condoms Other
Sterilization Implants IUDs Injectables Pills
Male Condoms Other
Sterilization Implants IUDs Injectables Pills
Male Condoms Other
mill
ions
of u
sers
mill
ions
of u
sers
mill
ions
of u
sers
mill
ions
of u
sers
+4M+17.9M
+31.3M
+29.5M
+3M
+.99M
+10.9M
+3.4M
+18.3M
+27.9M
+22.5M+4.8M
+2.3M+10.4M+3.2M
+13.9M+18.9M
-3.7M
-2.9M
+6.4M+1M
+3M
+17.2M
+8.2M-1.6M
+.1M+5.8M+.9M
FIGURE 17. CHANGE IN NUMBER OF USERS PER METHOD, 2016-2020
135 LMI COUNTRIES: SCENARIO A
TABLE 10. METHOD MIX, 2016 - 2020 135 LMI COUNTRIES: SCENARIO A
2016 2017 2018 2019 2020
Sterilization 34% 33% 33% 32% 32%
Implants 2% 3% 3% 3% 4%
IUDs 9% 9% 9% 8% 8%
Injectables 16% 17% 18% 18% 19%
Pills 17% 16% 16% 15% 15%
Male Condoms 20% 20% 21% 21% 21%
Other 1% 1% 1% 1% 1%
38GLOBAL CONTRACEPTIVE COMMODITY GAP ANALYSIS 2016
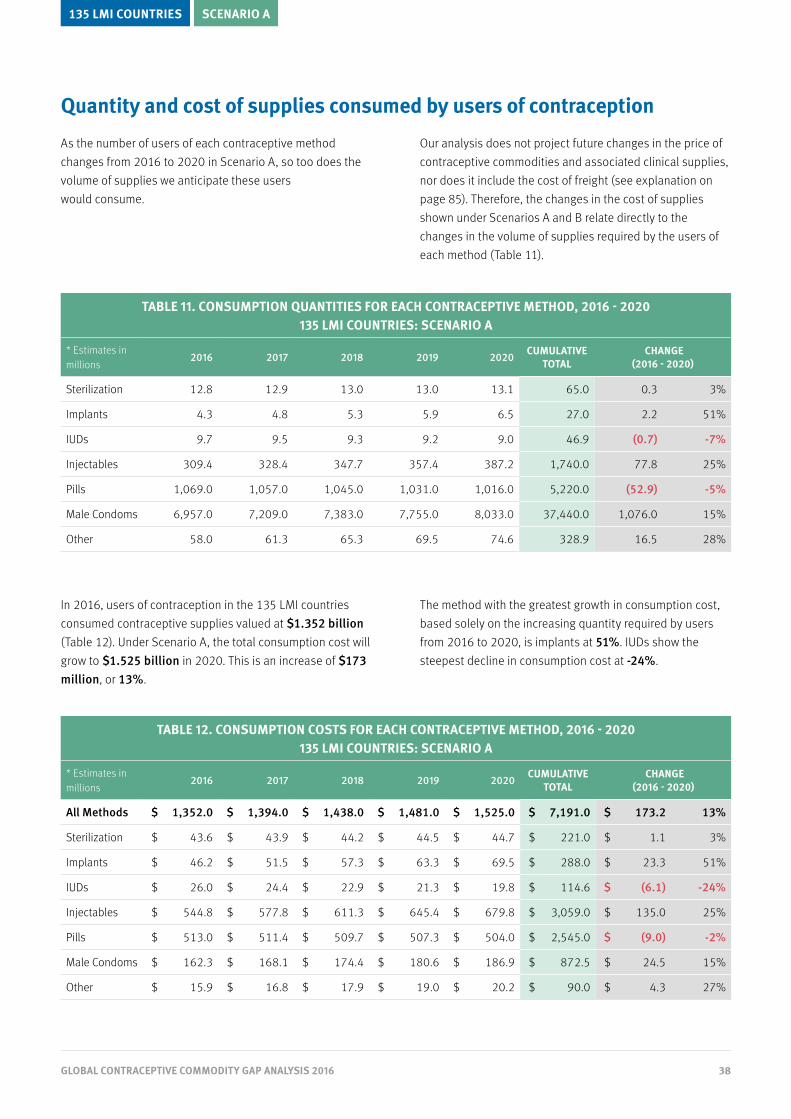
In 2016, users of contraception in the 135 LMI countries consumed contraceptive supplies valued at $1.352 billion (Table 12). Under Scenario A, the total consumption cost will grow to $1.525 billion in 2020. This is an increase of $173 million, or 13%.
The method with the greatest growth in consumption cost, based solely on the increasing quantity required by users from 2016 to 2020, is implants at 51%. IUDs show the steepest decline in consumption cost at -24%.
SCENARIO A135 LMI COUNTRIES
Quantity and cost of supplies consumed by users of contraception
As the number of users of each contraceptive method changes from 2016 to 2020 in Scenario A, so too does the volume of supplies we anticipate these users would consume.
Our analysis does not project future changes in the price of contraceptive commodities and associated clinical supplies, nor does it include the cost of freight (see explanation on page 85). Therefore, the changes in the cost of supplies shown under Scenarios A and B relate directly to the changes in the volume of supplies required by the users of each method (Table 11).
TABLE 11. CONSUMPTION QUANTITIES FOR EACH CONTRACEPTIVE METHOD, 2016 - 2020135 LMI COUNTRIES: SCENARIO A
* Estimates in millions
2016 2017 2018 2019 2020 CUMULATIVE TOTAL
CHANGE (2016 - 2020)
Sterilization 12.8 12.9 13.0 13.0 13.1 65.0 0.3 3%
Implants 4.3 4.8 5.3 5.9 6.5 27.0 2.2 51%
IUDs 9.7 9.5 9.3 9.2 9.0 46.9 (0.7) -7%
Injectables 309.4 328.4 347.7 357.4 387.2 1,740.0 77.8 25%
Pills 1,069.0 1,057.0 1,045.0 1,031.0 1,016.0 5,220.0 (52.9) -5%
Male Condoms 6,957.0 7,209.0 7,383.0 7,755.0 8,033.0 37,440.0 1,076.0 15%
Other 58.0 61.3 65.3 69.5 74.6 328.9 16.5 28%
TABLE 12. CONSUMPTION COSTS FOR EACH CONTRACEPTIVE METHOD, 2016 - 2020 135 LMI COUNTRIES: SCENARIO A
* Estimates in millions
2016 2017 2018 2019 2020 CUMULATIVE TOTAL
CHANGE (2016 - 2020)
All Methods $ 1,352.0 $ 1,394.0 $ 1,438.0 $ 1,481.0 $ 1,525.0 $ 7,191.0 $ 173.2 13%
Sterilization $ 43.6 $ 43.9 $ 44.2 $ 44.5 $ 44.7 $ 221.0 $ 1.1 3%
Implants $ 46.2 $ 51.5 $ 57.3 $ 63.3 $ 69.5 $ 288.0 $ 23.3 51%
IUDs $ 26.0 $ 24.4 $ 22.9 $ 21.3 $ 19.8 $ 114.6 $ (6.1) -24%
Injectables $ 544.8 $ 577.8 $ 611.3 $ 645.4 $ 679.8 $ 3,059.0 $ 135.0 25%
Pills $ 513.0 $ 511.4 $ 509.7 $ 507.3 $ 504.0 $ 2,545.0 $ (9.0) -2%
Male Condoms $ 162.3 $ 168.1 $ 174.4 $ 180.6 $ 186.9 $ 872.5 $ 24.5 15%
Other $ 15.9 $ 16.8 $ 17.9 $ 19.0 $ 20.2 $ 90.0 $ 4.3 27%
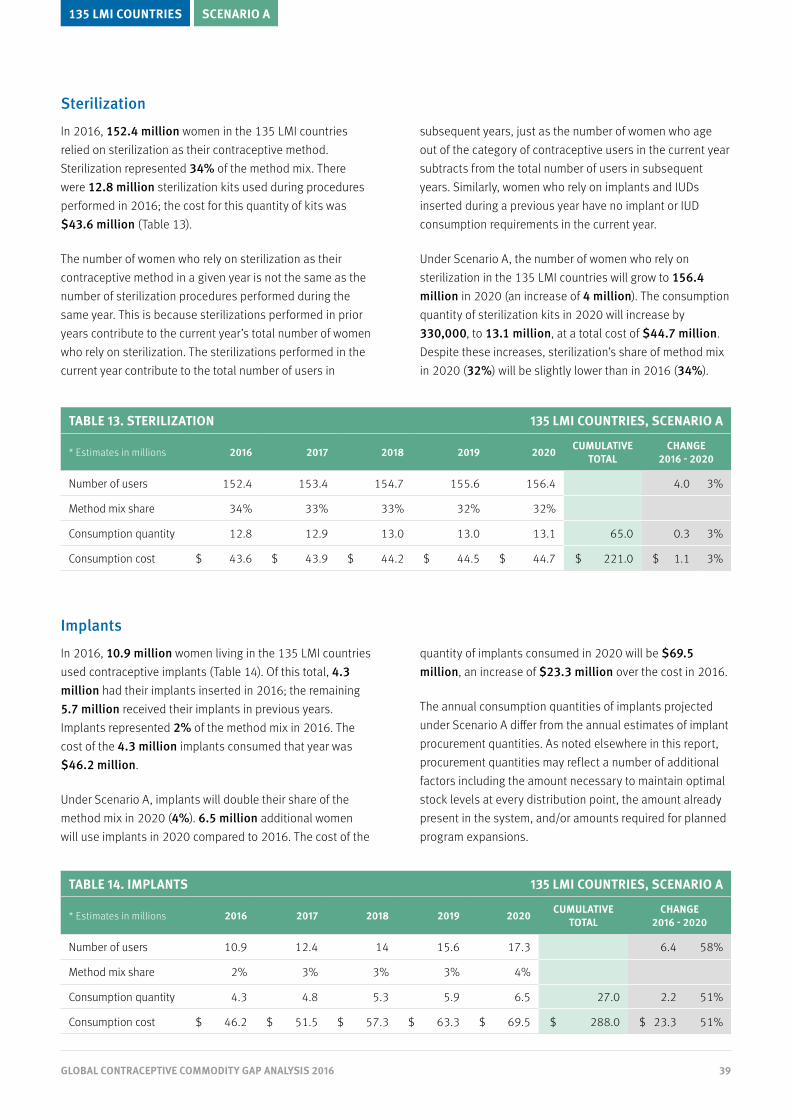
39GLOBAL CONTRACEPTIVE COMMODITY GAP ANALYSIS 2016
SCENARIO A135 LMI COUNTRIES
Sterilization
In 2016, 152.4 million women in the 135 LMI countries relied on sterilization as their contraceptive method. Sterilization represented 34% of the method mix. There were 12.8 million sterilization kits used during procedures performed in 2016; the cost for this quantity of kits was $43.6 million (Table 13).
The number of women who rely on sterilization as their contraceptive method in a given year is not the same as the number of sterilization procedures performed during the same year. This is because sterilizations performed in prior years contribute to the current year’s total number of women who rely on sterilization. The sterilizations performed in the current year contribute to the total number of users in
subsequent years, just as the number of women who age out of the category of contraceptive users in the current year subtracts from the total number of users in subsequent years. Similarly, women who rely on implants and IUDs inserted during a previous year have no implant or IUD consumption requirements in the current year.
Under Scenario A, the number of women who rely on sterilization in the 135 LMI countries will grow to 156.4 million in 2020 (an increase of 4 million). The consumption quantity of sterilization kits in 2020 will increase by 330,000, to 13.1 million, at a total cost of $44.7 million. Despite these increases, sterilization’s share of method mix in 2020 (32%) will be slightly lower than in 2016 (34%).
Implants
In 2016, 10.9 million women living in the 135 LMI countries used contraceptive implants (Table 14). Of this total, 4.3 million had their implants inserted in 2016; the remaining 5.7 million received their implants in previous years. Implants represented 2% of the method mix in 2016. The cost of the 4.3 million implants consumed that year was $46.2 million.
Under Scenario A, implants will double their share of the method mix in 2020 (4%). 6.5 million additional women will use implants in 2020 compared to 2016. The cost of the
quantity of implants consumed in 2020 will be $69.5 million, an increase of $23.3 million over the cost in 2016.
The annual consumption quantities of implants projected under Scenario A differ from the annual estimates of implant procurement quantities. As noted elsewhere in this report, procurement quantities may reflect a number of additional factors including the amount necessary to maintain optimal stock levels at every distribution point, the amount already present in the system, and/or amounts required for planned program expansions.
TABLE 13. STERILIZATION 135 LMI COUNTRIES, SCENARIO A
* Estimates in millions 2016 2017 2018 2019 2020 CUMULATIVE TOTAL
CHANGE 2016 - 2020
Number of users 152.4 153.4 154.7 155.6 156.4 4.0 3%
Method mix share 34% 33% 33% 32% 32%
Consumption quantity 12.8 12.9 13.0 13.0 13.1 65.0 0.3 3%
Consumption cost $ 43.6 $ 43.9 $ 44.2 $ 44.5 $ 44.7 $ 221.0 $ 1.1 3%
TABLE 14. IMPLANTS 135 LMI COUNTRIES, SCENARIO A
* Estimates in millions 2016 2017 2018 2019 2020 CUMULATIVE TOTAL
CHANGE 2016 - 2020
Number of users 10.9 12.4 14 15.6 17.3 6.4 58%
Method mix share 2% 3% 3% 3% 4%
Consumption quantity 4.3 4.8 5.3 5.9 6.5 27.0 2.2 51%
Consumption cost $ 46.2 $ 51.5 $ 57.3 $ 63.3 $ 69.5 $ 288.0 $ 23.3 51%

40GLOBAL CONTRACEPTIVE COMMODITY GAP ANALYSIS 2016
IUDs
In 2016, there were 42.8 million women living in the 135 LMI countries who used IUDs as their method of contraception (Table 15). IUDs represented 9% of the method mix. Insertions performed in 2016 required 9.7 million IUDs at a cost of $26 million.
In 2020, in Scenario A, the number of users of IUDs will decline by 7% to 39.8 million. IUDs will represent a slightly smaller share of method mix (8%). The number of insertions will decline as well; in 2020, users will consume 9 million IUDs, at a cost of $19.8 million (24% less than the cost in 2016).
Injectables
In 2016, there were 74.6 million women living in the 135 LMI countries who relied on injectables as their method of contraception (Table 16). Injectables represented 16% of the method mix. Women consumed 309.4 million injectables at a cost of $544.8 million. This was 40% of the total cost of all contraceptive supplies consumed by the users of all methods in 2016.
Under Scenario A, the number of users of injectables will grow to 93.6 million in 2020, an increase of 25% over 2016. Injectables will represent 19% of the method mix in 2020. Women will consume 387.2 million injectables, which is 77.8 million more than were consumed in 2016. The cost of these injectables is nearly $680 million (an increase of $135 million over the 2016 consumption cost). This amounts to 45% of the total cost of all contraceptive supplies consumed by the users of all methods in 2020.
SCENARIO A135 LMI COUNTRIES
TABLE 15. IUDS 135 LMI COUNTRIES, SCENARIO A
* Estimates in millions 2016 2017 2018 2019 2020 CUMULATIVE TOTAL
CHANGE 2016 - 2020
Number of users 42.8 42.1 41.3 40.6 39.8 (2.9) -7%
Method mix share 9% 9% 9% 8% 8%
Consumption quantity 9.7 9.5 9.3 9.2 9.0 46.9 (0.7) -7%
Consumption cost $ 26.0 $ 24.4 $ 22.9 $ 21.3 $ 19.8 $ 114.6 $ (6.1) -24%
TABLE 16. INJECTABLES 135 LMI COUNTRIES, SCENARIO A
* Estimates in millions 2016 2017 2018 2019 2020 CUMULATIVE TOTAL
CHANGE 2016 - 2020
Number of users 74.6 79.2 84.0 88.7 93.6 18.9 25%
Method mix share 16% 17% 18% 18% 19%
Consumption quantity 309.4 328.4 347.7 367.4 387.2 1,740.0 77.8 25%
Consumption cost $ 544.8 $ 577.8 $ 611.3 $ 645.4 $ 679.8 $ 3,059.0 $ 135.0 25%

41GLOBAL CONTRACEPTIVE COMMODITY GAP ANALYSIS 2016
SCENARIO A135 LMI COUNTRIES
Pills
In 2016, there were 76.3 million users of contraceptive pills living in the 135 LMI countries (Table 17). Pills represented 17% of the method mix. Women consumed nearly 1.07 billion cycles of pills in 2016, at a cost of $513 million.
Under Scenario A, the number of users of contraceptive pills in 2020 will be 72.6 million; this is 3.7 million less than in 2016. The share of method mix represented by pills will decline slightly, to 15%. Women will still consume more than 1 billion pill cycles in 2020, but the consumption cost declines to $504 million ($9 million less than in 2016).
Male condoms
In 2016, 90.3 million women living in 135 LMI countries relied on their partners’ use of male condoms as their method of contraception (Table 18). Male condoms used for contraception represented 20% of the method mix. Nearly 7 billion male condoms were used for contraceptive purposes in 2016, at a cost of $162.3 million.
Under Scenario A, the number of women relying on male condoms for contraception will grow to 104.3 million in 2020, an increase of 15% compared to 2016. Male condoms used for contraception will represent 21% of the method mix. More than 8 billion male condoms will be required for contraceptive purposes in 2020, at a cost of nearly $187 million.
TABLE 17. PILLS 135 LMI COUNTRIES, SCENARIO A
* Estimates in millions 2016 2017 2018 2019 2020 CUMULATIVE TOTAL
CHANGE 2016 - 2020
Number of users 76.3 75.5 74.6 73.6 72.6 (3.7) -5%
Method mix share 17% 16% 16% 15% 15%
Consumption quantity 1,069.0 1,057.0 1,045.0 1,031.0 1,016.0 5,220.0 (52.9) -5%
Consumption cost $ 513.0 $ 511.4 $ 509.7 $ 507.3 $ 504.0 $ 2,545.0 $ (9.0) -2%
TABLE 18. MALE CONDOMS 135 LMI COUNTRIES, SCENARIO A
* Estimates in millions 2016 2017 2018 2019 2020 CUMULATIVE TOTAL
CHANGE 2016 - 2020
Number of users 90.3 93.6 97.1 100.7 104.3 13.9 15%
Method mix share 20% 20% 21% 21% 21%
Consumption quantity 6,957.0 7,209.0 7,483.0 7,755.0 8,033.0 37,440.0 1,076.0 15%
Consumption cost $ 162.3 $ 168.1 $ 174.4 $ 180.6 $ 186.9 $ 872.5 $ 24.5 15%
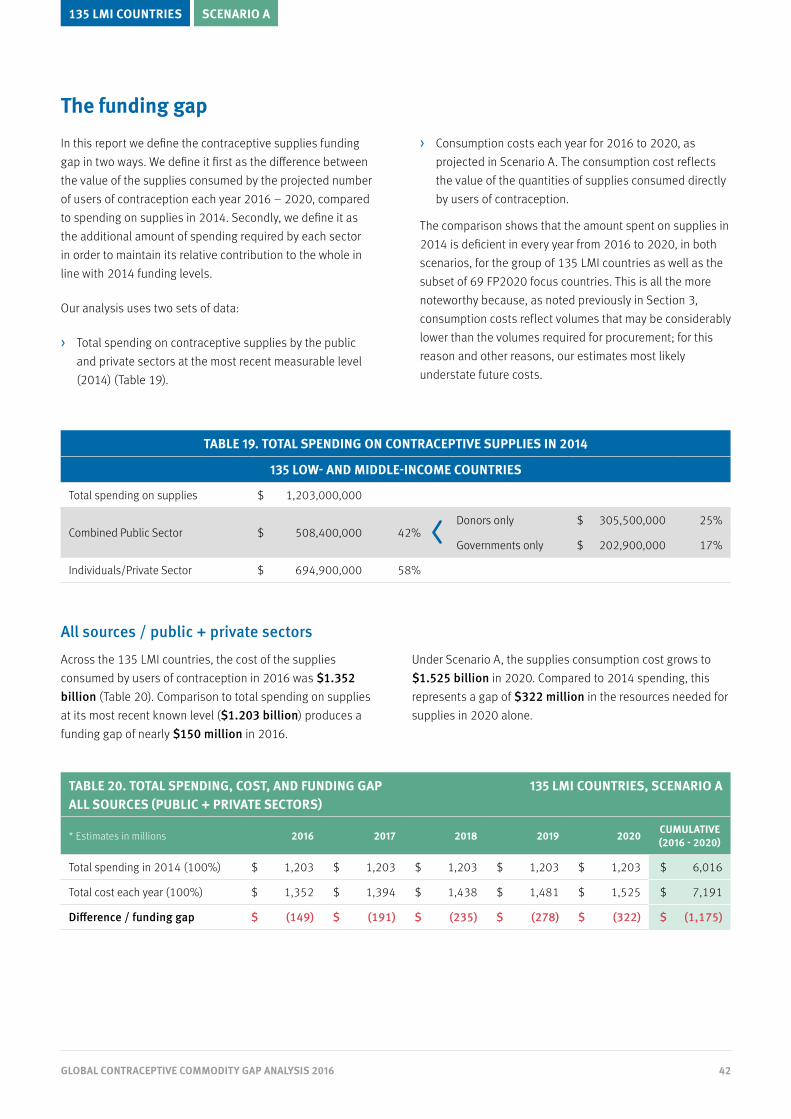
42GLOBAL CONTRACEPTIVE COMMODITY GAP ANALYSIS 2016
SCENARIO A135 LMI COUNTRIES
TABLE 20. TOTAL SPENDING, COST, AND FUNDING GAPALL SOURCES (PUBLIC + PRIVATE SECTORS)
135 LMI COUNTRIES, SCENARIO A
* Estimates in millions 2016 2017 2018 2019 2020 CUMULATIVE (2016 - 2020)
Total spending in 2014 (100%) $ 1,203 $ 1,203 $ 1,203 $ 1,203 $ 1,203 $ 6,016
Total cost each year (100%) $ 1,352 $ 1,394 $ 1,438 $ 1,481 $ 1,525 $ 7,191
Difference / funding gap $ (149) $ (191) $ (235) $ (278) $ (322) $ (1,175)
The funding gap
In this report we define the contraceptive supplies funding gap in two ways. We define it first as the difference between the value of the supplies consumed by the projected number of users of contraception each year 2016 – 2020, compared to spending on supplies in 2014. Secondly, we define it as the additional amount of spending required by each sector in order to maintain its relative contribution to the whole in line with 2014 funding levels.
Our analysis uses two sets of data:
› Total spending on contraceptive supplies by the public and private sectors at the most recent measurable level (2014) (Table 19).
› Consumption costs each year for 2016 to 2020, as projected in Scenario A. The consumption cost reflects the value of the quantities of supplies consumed directly by users of contraception.
The comparison shows that the amount spent on supplies in 2014 is deficient in every year from 2016 to 2020, in both scenarios, for the group of 135 LMI countries as well as the subset of 69 FP2020 focus countries. This is all the more noteworthy because, as noted previously in Section 3, consumption costs reflect volumes that may be considerably lower than the volumes required for procurement; for this reason and other reasons, our estimates most likely understate future costs.
All sources / public + private sectors
Across the 135 LMI countries, the cost of the supplies consumed by users of contraception in 2016 was $1.352 billion (Table 20). Comparison to total spending on supplies at its most recent known level ($1.203 billion) produces a funding gap of nearly $150 million in 2016.
Under Scenario A, the supplies consumption cost grows to $1.525 billion in 2020. Compared to 2014 spending, this represents a gap of $322 million in the resources needed for supplies in 2020 alone.
TABLE 19. TOTAL SPENDING ON CONTRACEPTIVE SUPPLIES IN 2014
135 LOW- AND MIDDLE-INCOME COUNTRIES
Total spending on supplies $ 1,203,000,000
Combined Public Sector $ 508,400,000 42%Donors only $ 305,500,000 25%
Governments only $ 202,900,000 17%
Individuals/Private Sector $ 694,900,000 58%
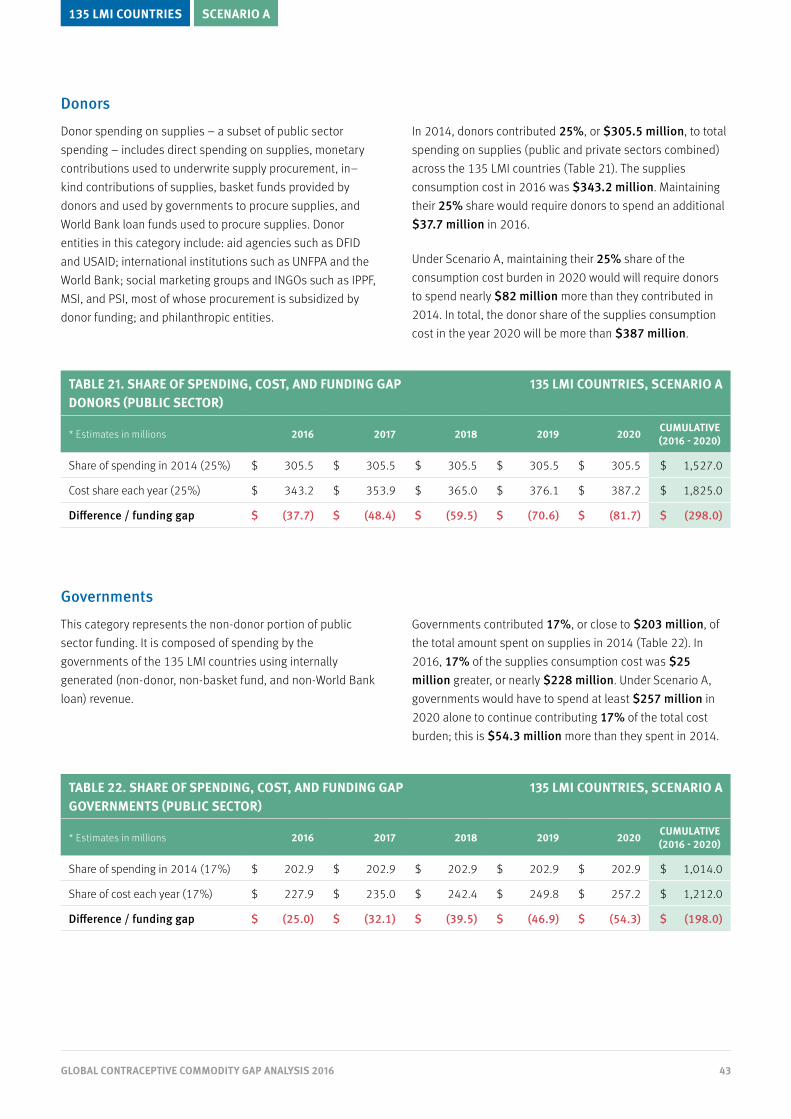
43GLOBAL CONTRACEPTIVE COMMODITY GAP ANALYSIS 2016
TABLE 21. SHARE OF SPENDING, COST, AND FUNDING GAPDONORS (PUBLIC SECTOR)
135 LMI COUNTRIES, SCENARIO A
* Estimates in millions 2016 2017 2018 2019 2020 CUMULATIVE (2016 - 2020)
Share of spending in 2014 (25%) $ 305.5 $ 305.5 $ 305.5 $ 305.5 $ 305.5 $ 1,527.0
Cost share each year (25%) $ 343.2 $ 353.9 $ 365.0 $ 376.1 $ 387.2 $ 1,825.0
Difference / funding gap $ (37.7) $ (48.4) $ (59.5) $ (70.6) $ (81.7) $ (298.0)
TABLE 22. SHARE OF SPENDING, COST, AND FUNDING GAPGOVERNMENTS (PUBLIC SECTOR)
135 LMI COUNTRIES, SCENARIO A
* Estimates in millions 2016 2017 2018 2019 2020 CUMULATIVE (2016 - 2020)
Share of spending in 2014 (17%) $ 202.9 $ 202.9 $ 202.9 $ 202.9 $ 202.9 $ 1,014.0
Share of cost each year (17%) $ 227.9 $ 235.0 $ 242.4 $ 249.8 $ 257.2 $ 1,212.0
Difference / funding gap $ (25.0) $ (32.1) $ (39.5) $ (46.9) $ (54.3) $ (198.0)
Donors
Donor spending on supplies – a subset of public sector spending – includes direct spending on supplies, monetary contributions used to underwrite supply procurement, in–kind contributions of supplies, basket funds provided by donors and used by governments to procure supplies, and World Bank loan funds used to procure supplies. Donor entities in this category include: aid agencies such as DFID and USAID; international institutions such as UNFPA and the World Bank; social marketing groups and INGOs such as IPPF, MSI, and PSI, most of whose procurement is subsidized by donor funding; and philanthropic entities.
In 2014, donors contributed 25%, or $305.5 million, to total spending on supplies (public and private sectors combined) across the 135 LMI countries (Table 21). The supplies consumption cost in 2016 was $343.2 million. Maintaining their 25% share would require donors to spend an additional $37.7 million in 2016.
Under Scenario A, maintaining their 25% share of the consumption cost burden in 2020 would will require donors to spend nearly $82 million more than they contributed in 2014. In total, the donor share of the supplies consumption cost in the year 2020 will be more than $387 million.
Governments
This category represents the non-donor portion of public sector funding. It is composed of spending by the governments of the 135 LMI countries using internally generated (non-donor, non-basket fund, and non-World Bank loan) revenue.
Governments contributed 17%, or close to $203 million, of the total amount spent on supplies in 2014 (Table 22). In 2016, 17% of the supplies consumption cost was $25 million greater, or nearly $228 million. Under Scenario A, governments would have to spend at least $257 million in 2020 alone to continue contributing 17% of the total cost burden; this is $54.3 million more than they spent in 2014.
SCENARIO A135 LMI COUNTRIES

44GLOBAL CONTRACEPTIVE COMMODITY GAP ANALYSIS 2016
TABLE 23. SHARE OF SPENDING, COST, AND FUNDING GAPINDIVIDUALS (PRIVATE SECTOR)
135 LMI COUNTRIES, SCENARIO A
* Estimates in millions 2016 2017 2018 2019 2020 CUMULATIVE (2016 - 2020)
Share of spending in 2014 (58%) $ 694.9 $ 694.9 $ 694.9 $ 694.9 $ 694.9 $ 3,474.0
Share of cost each year (58%) $ 780.8 $ 805.1 $ 830.4 $ 855.7 $ 880.9 $ 4,153.0
Difference / funding gap $ (85.9) $ (110.2) $ (135.5) $ (160.8) $ (186.0) $ (679.0)
TABLE 24. SHARE OF SPENDING, COST, AND FUNDING GAPPUBLIC SECTOR (DONORS + GOVERNMENTS)
135 LMI COUNTRIES, SCENARIO A
* Estimates in millions 2016 2017 2018 2019 2020 CUMULATIVE (2016 - 2020)
Share of spending in 2014 (42%) $ 508.4 $ 508.4 $ 508.4 $ 508.4 $ 508.4 $ 2,541.0
Share of cost each year (42%) $ 571.2 $ 589.0 $ 607.5 $ 626.0 $ 644.4 $ 3,038.0
Difference / funding gap $ (62.8) $ (80.6) $ (99.1) $ (117.6) $ (136.0) $ (497.0)
Individuals / private sector
This category consists mainly of out-of-pocket (OOP) spending by individuals purchasing their own supplies, and a much smaller amount representing employer-provided health services. In the 135 LMI countries, individuals and the private sector contributed 58% (nearly $695 million) of the total amount spent on contraceptives in 2014 (Table 23).
In 2016, 58% of the supplies consumption cost in the 135 LMI countries amounted to more than $780 million. This is nearly $86 million more than we attribute to individual OOP spending in 2014. Under Scenario A, in the year 2020, 58% of the supplies consumption cost will be more than $880 million; this is an increase of $186 million compared to the amount spent in 2014.
Public sector / donors + governments
In 2014, the public sector (donor and country government resources combined) contributed 42% ($508.4 million) of the total amount spent on contraceptive supplies across the 135 LMI countries.
If the public sector is committed to maintaining its 42% share of total spending as the number of users of contraception
(and thus the quantity and cost of the supplies they consume) grows, it would need to spend at least $62.8 million more on supplies in 2016 than it did in 2014 (or $571.2 million total) (Table 24). In 2020, under Scenario A, the public sector share of the supplies consumption cost is $644.4 million. It would require spending an additional $136 million just to maintain a 42% share of the supplies cost burden.
SCENARIO A135 LMI COUNTRIES

45GLOBAL CONTRACEPTIVE COMMODITY GAP ANALYSIS 2016
Cost burden shift if public sector funding does not increase
If increases in the absolute amount of public sector (donors and governments combined) spending are not forthcoming and the amount it spent on supplies in 2014 remains constant through 2020, the relative contribution of the public sector to the total supplies consumption cost will drop, and a greater cost burden will fall to OOP spending by individuals (Figure 18; Table 25).
As noted earlier, the public sector contributed 42% ($508.4 million) of the total amount spent on supplies in 2014 across the 135 LMI countries; we attribute the remaining 58% (nearly $695 million) to OOP spending by individuals.
Under Scenario A, if the public sector continues to contribute $508.4 million each year, by 2020 this funding will account for just 33% of the total supplies consumption cost. The balance – 67% or $1.017 million – will fall to individuals.
Of course, we don’t know how many people will have the resources to buy their own contraceptive supplies at unsubsidized prices. Therefore, the cost burden shift is just one potential outcome if the level of public sector spending on contraceptive supplies remains static. Another outcome may be that these women will go without supplies because they cannot afford them. A third possibility is that women will choose a method based on price rather than personal preference, which may lead to inconsistent use or discontinuation.
FIGURE 18. SHIFTS IN THE DISTRIBUTION OF COST IN 2020 135 LMI COUNTRIES: SCENARIO A
SCENARIO A135 LMI COUNTRIES
Total Cost in 2020: $ 1,525,000,000Scaled distribution of total cost based on 2014 spending pattern
Total Cost in 2020: $ 1,525,000.000Public sector funding frozen at 2014 level
All costs above that amount shi� to OOP spending by individuals
Public sectorContribution in 2014 $ 508.4m
Scaling up publicsector spendingto meet 2020 costs requires an additional $ 136m
IndividualsContribution
in 2014$ 694.9m
IndividualsRemainder of total
cost in 2020$ 1.017bn
Scaling up individuals’OOP spending to meet
2020 costs requiresan additional $ 186m
Public sectorContribution in 2014 $ 508.4m
42%58%
33%
67%
Total Cost in 2020: $ 1,744,000,000 Scaled distribution of total cost based on 2014 spending pattern
Total Cost in 2020: $ 1,744,000,000 Public sector funding frozen at 2014 level
All costs above that amount shi� to OOP spending by individuals
Public sectorContribution in 2014 $ 508.4m
Scaling up publicsector spendingto meet 2020 costs requires an additional $ 228.6m
IndividualsContribution
in 2014$ 694.9m
IndividualsRemainder of total
cost in 2020$ 1.235bn
Scaling up individuals’OOP spending to meet
2020 costs requiresan additional $ 312.1m
Public sectorContribution in 2014 $ 508.4m
42%
58%
29%
71%
TABLE 25. COST BURDEN SHIFT IN 2020 IF PUBLIC SECTOR SPENDING STALLS AT 2014 LEVELS
135 LMI COUNTRIES: SCENARIO A
Scenario A
Total cost in 2020 $ 1,525,000,000
Public Sector Individuals
Contribution at 2014 level $ 508,400,000 $ 694,900,000
Scaled increase to meet 2020 costs - $ 186,000,000
Remainder of 2020 costs - $ 136,000,000
Total contribution to cost in 2020 $ 508,400,000 $ 1,017,000,000

46GLOBAL CONTRACEPTIVE COMMODITY GAP ANALYSIS 2016
The path to 2020 | Scenario B
Scenario B envisions the achievement of the FP2020 goal: 120 million additional users of contraception in the 69 lowest income countries by 2020.24 In Scenario B, the demonstration effect of accelerated contraceptive uptake in the 69 focus countries causes a ripple of increased demand across the other 66 LMI countries.
Scenario B attempts to quantify critical dimensions of this success by projecting the volume and cost of the supplies that would be consumed by the users of each method of contraception each year from 2016 to 2020 across all 135 LMI countries. The costs are then compared to historical spending on contraceptive supplies, disaggregated by three types of spender: donors, governments, and individuals who obtain their supplies from the private sector.
Under Scenario B, the number of women in the 135 LMI countries using contraception in 2016 will grow from 452.7 million to nearly 550 million in 2020 (Table 26). This is an increase of more than 97 million women.
The method with the greatest percentage growth in number of users between 2016 and 2020 is implants. The number of women using implants increases by 100% over four years, from 10.9 million in 2016 to 21.9 million in 2020.
TABLE 26. NUMBER OF USERS OF EACH CONTRACEPTIVE METHOD, 2016 - 2020135 LMI COUNTRIES: SCENARIO B
* Estimates in millions
2016 2017 2018 2019 2020 CHANGE (2016 - 2020)
All Methods 452.7 477.0 501.3 525.6 549.9 97.1 21%
Sterilization 152.4 159.4 163.1 166.7 170.3 17.9 12%
Implants 10.9 13.2 15.9 18.8 21.9 10.9 100%
IUDs 42.8 42.6 43.1 43.4 43.8 0.9 2%
Injectables 74.6 80.6 88.2 96.0 104.1 29.5 40%
Pills 76.3 77.1 78.2 78.9 79.4 3.0 4%
Male Condoms 90.3 97.9 105.9 113.8 121.6 31.3 35%
Other 5.0 5.9 6.7 7.6 8.5 3.4 67%
SCENARIO B135 LMI COUNTRIES

47GLOBAL CONTRACEPTIVE COMMODITY GAP ANALYSIS 2016
Under Scenario B, the methods that show the largest increases in the numbers of users between 2016 and 2020 are for male condoms and injectables. Across the 135 LMI countries, the number of women relying on male condoms for contraception will grow by 31.3 million, to over 121 million in 2020. The number of women using injectables will increase by 29.5 million, to more than 104 million in 2020 (Figure 19).
While no method shows a decrease in the absolute number of users between 2016 and 2020, several represent slightly diminishing shares of method mix (Table 27). Sterilization drops from 34% to 31% of the method mix, contraceptive pills drop from 17% to 14%, and IUDs shift slightly from 9% to 8%.
0
50
25
75
125
100
150
175
0
50
25
75
125
100
150
175
0
50
25
75
125
100
150
175
0
50
25
75
125
100
150
175
2016 2020 2016 2020
2016 2020 2016 2020
Sterilization Implants IUDs Injectables Pills
Male Condoms Other
Sterilization Implants IUDs Injectables Pills
Male Condoms Other
Sterilization Implants IUDs Injectables Pills
Male Condoms Other
Sterilization Implants IUDs Injectables Pills
Male Condoms Other
mill
ions
of u
sers
mill
ions
of u
sers
mill
ions
of u
sers
mill
ions
of u
sers
+4M+17.9M
+31.3M
+29.5M
+3M
+.99M
+10.9M
+3.4M
+18.3M
+27.9M
+22.5M+4.8M
+2.3M+10.4M+3.2M
+13.9M+18.9M
-3.7M
-2.9M
+6.4M+1M
+3M
+17.2M
+8.2M-1.6M
+.1M+5.8M+.9M
FIGURE 19. CHANGE IN NUMBER OF USERS PER METHOD, 2016-2020
135 LMI COUNTRIES: SCENARIO B
TABLE 27. METHOD MIX, 2016 - 2020 135 LMI COUNTRIES: SCENARIO B
2016 2017 2018 2019 2020
Sterilization 34% 33% 33% 32% 31%
Implants 2% 3% 3% 4% 4%
IUDs 9% 9% 9% 8% 8%
Injectables 16% 17% 18% 18% 19%
Pills 17% 16% 16% 15% 14%
Male Condoms 20% 21% 21% 22% 22%
Other 1% 1% 1% 1% 2%
SCENARIO B135 LMI COUNTRIES

48GLOBAL CONTRACEPTIVE COMMODITY GAP ANALYSIS 2016
Our estimates of the annual cost of these supplies, which are shown in Table 29, are based on current commodity prices multiplied by the consumption quantity required each year. The cost estimates have not been adjusted for potential future changes in price (see explanation in Section 7).
Under Scenario B, the consumption cost of supplies in 2020 is $1.744 billion; this is approximately $200 million higher than the cost in 2020 under Scenario A. The consumption cost for 2020 in Scenario B is $392 million greater than the consumption cost in in 2016. The single method with the greatest cost difference between 2016 and 2020 is injectables: in Scenario B, the cost of the supplies consumed by users of injectables in 2020 is over $226 million greater than the cost in 2016.
Quantity and cost of supplies consumed by users of contraception
Just as it did under Scenario A, growth in the number of users of contraception under Scenario B serves as the basis for our estimated increases in the amount of supplies required annually by the users of each method, as shown in the table below (Table 28).
The method that shows the greatest percentage increase in the quantity of supplies consumed annually is implants, which increases by 119%; the quantity of implants consumed in 2020 (9.4 million) is more than double the amount consumed in 2016 (4.3 million).
TABLE 28. CONSUMPTION QUANTITIES FOR EACH CONTRACEPTIVE METHOD, 2016 - 2020135 LMI COUNTRIES: SCENARIO B
* Estimates in millions
2016 2017 2018 2019 2020 CUMULATIVE TOTAL
CHANGE (2016 - 2020)
Sterilization 12.8 13.3 13.6 13.9 14.2 68.0 1.4 11%
Implants 4.3 6.2 7.2 8.3 9.4 35.6 5.1 119%
IUDs 9.7 12.2 12.1 12.0 11.9 58.1 2.2 23%
Injectables 309.4 335.2 367.1 400.2 434.1 1,846.0 124.7 40%
Pills 1,069.0 1,079.0 1,094.0 1,105.0 1,112.0 5,462.0 43.1 4%
Male Condoms 6,957.0 7,538.0 8,154.0 8,763.0 9,368.0 40,782.0 2,410.0 35%
Other 58.0 70.3 82.4 95.1 108.7 414.7 50.7 87%
TABLE 29. CONSUMPTION COSTS FOR EACH CONTRACEPTIVE METHOD, 2016 - 2020 135 LMI COUNTRIES: SCENARIO B
* Estimates in millions
2016 2017 2018 2019 2020 CUMULATIVE TOTAL
CHANGE (2016 - 2020)
All Methods $ 1,352.0 $ 1,450.0 $ 1,548.0 $ 1,646.0 $ 1,744.0 $ 7,741.0 $ 392.4 29%
Sterilization $ 43.6 $ 45.4 $ 46.4 $ 47.4 $ 48.3 $ 231.3 $ 4.7 11%
Implants $ 46.2 $ 66.3 $ 76.9 $ 88.2 $ 100.0 $ 377.8 $ 53.8 117%
IUDs $ 26.0 $ 28.0 $ 27.0 $ 25.6 $ 24.4 $ 131.2 $ (1.5) -6%
Injectables $ 544.8 $ 592.3 $ 650.3 $ 710.1 $ 771.5 $ 3,269.0 $ 226.6 42%
Pills $ 513.0 $ 524.2 $ 537.1 $ 548.2 $ 557.5 $ 2,680.0 $ 44.4 9%
Male Condoms $ 162.3 $ 175.2 $ 188.4 $ 201.4 $ 214.4 $ 942.0 $ 52.0 32%
Other $ 15.9 $ 18.8 $ 21.8 $ 24.8 $ 28.1 $ 109.6 $ 12.1 76%
SCENARIO B135 LMI COUNTRIES
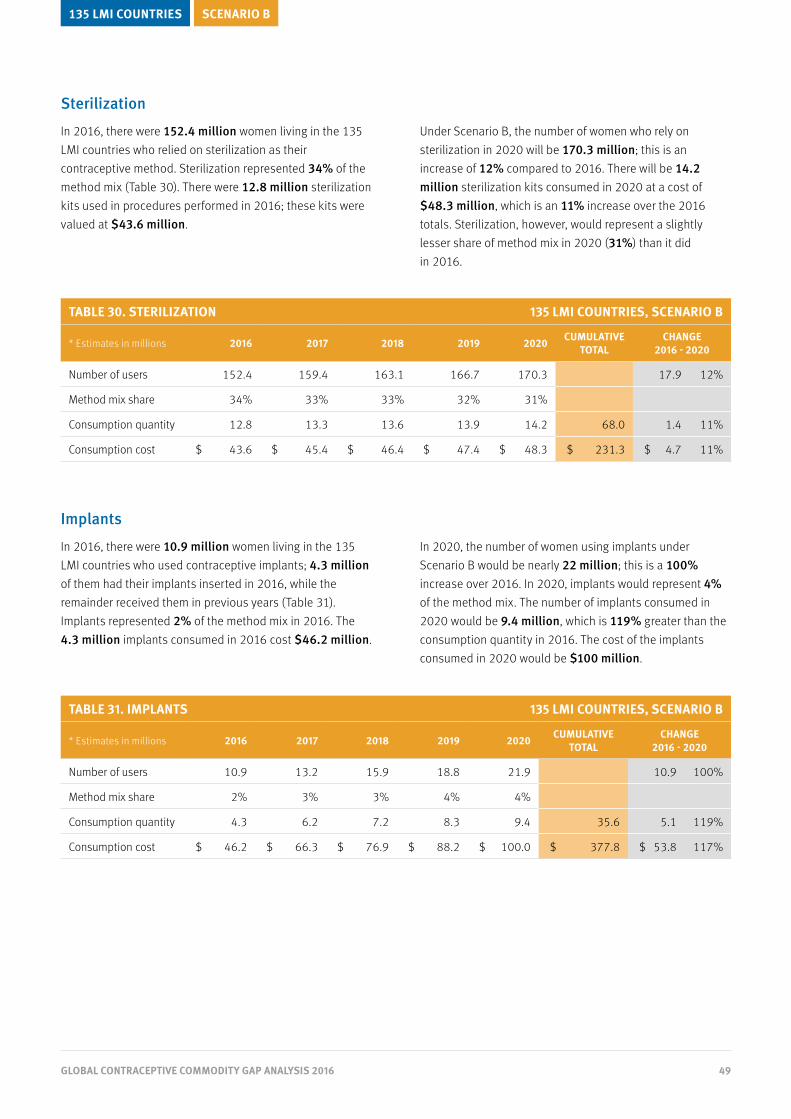
49GLOBAL CONTRACEPTIVE COMMODITY GAP ANALYSIS 2016
Sterilization
In 2016, there were 152.4 million women living in the 135 LMI countries who relied on sterilization as their contraceptive method. Sterilization represented 34% of the method mix (Table 30). There were 12.8 million sterilization kits used in procedures performed in 2016; these kits were valued at $43.6 million.
Under Scenario B, the number of women who rely on sterilization in 2020 will be 170.3 million; this is an increase of 12% compared to 2016. There will be 14.2 million sterilization kits consumed in 2020 at a cost of $48.3 million, which is an 11% increase over the 2016 totals. Sterilization, however, would represent a slightly lesser share of method mix in 2020 (31%) than it did in 2016.
Implants
In 2016, there were 10.9 million women living in the 135 LMI countries who used contraceptive implants; 4.3 million of them had their implants inserted in 2016, while the remainder received them in previous years (Table 31). Implants represented 2% of the method mix in 2016. The 4.3 million implants consumed in 2016 cost $46.2 million.
In 2020, the number of women using implants under Scenario B would be nearly 22 million; this is a 100% increase over 2016. In 2020, implants would represent 4% of the method mix. The number of implants consumed in 2020 would be 9.4 million, which is 119% greater than the consumption quantity in 2016. The cost of the implants consumed in 2020 would be $100 million.
TABLE 30. STERILIZATION 135 LMI COUNTRIES, SCENARIO B
* Estimates in millions 2016 2017 2018 2019 2020 CUMULATIVE TOTAL
CHANGE 2016 - 2020
Number of users 152.4 159.4 163.1 166.7 170.3 17.9 12%
Method mix share 34% 33% 33% 32% 31%
Consumption quantity 12.8 13.3 13.6 13.9 14.2 68.0 1.4 11%
Consumption cost $ 43.6 $ 45.4 $ 46.4 $ 47.4 $ 48.3 $ 231.3 $ 4.7 11%
TABLE 31. IMPLANTS 135 LMI COUNTRIES, SCENARIO B
* Estimates in millions 2016 2017 2018 2019 2020 CUMULATIVE TOTAL
CHANGE 2016 - 2020
Number of users 10.9 13.2 15.9 18.8 21.9 10.9 100%
Method mix share 2% 3% 3% 4% 4%
Consumption quantity 4.3 6.2 7.2 8.3 9.4 35.6 5.1 119%
Consumption cost $ 46.2 $ 66.3 $ 76.9 $ 88.2 $ 100.0 $ 377.8 $ 53.8 117%
SCENARIO B135 LMI COUNTRIES

50GLOBAL CONTRACEPTIVE COMMODITY GAP ANALYSIS 2016
IUDs
In 2016, there were 42.8 million users of IUDs living in the 135 LMI countries (Table 32). IUDs represented 9% of the method mix. Insertions performed in 2016 required 9.7 million IUDs, at a cost of $26 million.
Under Scenario B, the number of users of IUDs in 2020 is nearly one million greater: 43.8 million. Nonetheless, IUDs represent a slightly smaller share (8%) of method mix due to changes in the rate of consumption relative to other methods.
In 2020, nearly 12 million IUDs will be inserted at a cost of $24.4 million. The consumption quantity of IUDs is 23% higher in 2020 than it was in 2016, but the consumption cost is 6% lower, due to geographical shifts in consumption and differences among countries in average IUD unit prices.
Injectables
In 2016, there were 74.6 million women living in the 135 LMI countries who relied on injectables as their method of contraception (Table 33). Injectables represented 16% of the method mix. Women consumed 309.4 million injectables at a cost of $544.8 million; this was 40% of the total cost of the supplies consumed by the users of all methods in 2016.
Under Scenario B, in the year 2020 the number of users of injectables increases to slightly more than 104 million. Injectables represent 19% of the method mix in 2020. Slightly more than 434 million units of injectables consumed by women in 2020, this is 40% more than were consumed in 2016. The consumption cost of injectables in 2020 is more than $771 million; this is $226.6 million greater than the cost in 2016.
TABLE 32. IUDS 135 LMI COUNTRIES, SCENARIO B
* Estimates in millions 2016 2017 2018 2019 2020 CUMULATIVE TOTAL
CHANGE 2016 - 2020
Number of users 42.8 42.6 43.1 43.4 43.8 0.9 2%
Method mix share 9% 9% 9% 8% 8%
Consumption quantity 9.7 12.2 12.1 12.0 11.9 58.1 2.2 23%
Consumption cost $ 26.0 $ 28.0 $ 27.0 $ 25.6 $ 24.4 $ 131.2 $ (1.5) -6%
TABLE 33. INJECTABLES 135 LMI COUNTRIES, SCENARIO B
* Estimates in millions 2016 2017 2018 2019 2020 CUMULATIVE TOTAL
CHANGE 2016 - 2020
Number of users 74.6 80.6 88.2 96.0 104.1 29.5 40%
Method mix share 16% 17% 18% 18% 19%
Consumption quantity 309.4 335.2 367.1 400.2 434.1 1,846.0 124.7 40%
Consumption cost $ 544.8 $ 592.3 $ 650.3 $ 710.1 $ 771.5 $ 3,269.0 $ 226.6 42%
SCENARIO B135 LMI COUNTRIES

51GLOBAL CONTRACEPTIVE COMMODITY GAP ANALYSIS 2016
Pills
In 2016, there were 76.3 million users of contraceptive pills living in the 135 LMI countries (Table 34). Pills represented 17% of the method mix. Women consumed 1.069 billion pill cycles in 2016 at a cost of $513 million.
Under Scenario B, the number of pill users in the year 2020 is nearly 80 million—4% higher than in 2016. Despite this increase, pills represent a smaller share of method mix in 2020 (14%) than in 2016 (17%). The quantity of pill cycles consumed in 2020 is 1.112 billion, and the consumption cost is $557.5 million (an increase of $44.4 million).
Male condoms
In 2016, 90.3 million women living in 135 LMI countries relied on their partners’ use of male condoms as their method of contraception (Table 35). Male condoms used for contraception represented 20% of the method mix. Nearly 7 billion male condoms were used for contraceptive purposes in 2016, at a cost of $162.3 million.
Under Scenario B, the number of women relying on male condoms in 2020 grows to 121.6 million; this is 35% more than in 2016. Male condoms represent 22% of the method mix in 2020. The number of condoms used for contraception in 2020 is 9.368 billion, which is an increase of 2.41 billion over the quantity in 2016. The consumption cost in 2020 is 32% higher at more than $214.4 million.
TABLE 34. PILLS 135 LMI COUNTRIES, SCENARIO B
* Estimates in millions 2016 2017 2018 2019 2020 CUMULATIVE TOTAL
CHANGE 2016 - 2020
Number of users 76.3 77.1 78.2 78.9 79.4 3.0 4%
Method mix share 17% 16% 16% 15% 14%
Consumption quantity 1,069.0 1,079.0 1,094.0 1,105.0 1,112.0 5,462.0 43.1 4%
Consumption cost $ 513.0 $ 524.2 $ 537.1 $ 548.2 $ 557.5 $ 2,680.0 $ 44.4 9%
TABLE 35. MALE CONDOMS 135 LMI COUNTRIES, SCENARIO B
* Estimates in millions 2016 2017 2018 2019 2020 CUMULATIVE TOTAL
CHANGE 2016 - 2020
Number of users 90.3 97.9 105.9 113.8 121.6 31.3 35%
Method mix share 20% 21% 21% 22% 22%
Consumption quantity 6,957.0 7,538.0 8,154.0 8,763.0 9,368.0 40,782.0 2,410.0 35%
Consumption cost $ 162.3 $ 175.2 $ 188.4 $ 201.4 $ 214.4 $ 942.0 $ 52.0 32%
SCENARIO B135 LMI COUNTRIES

52GLOBAL CONTRACEPTIVE COMMODITY GAP ANALYSIS 2016
TABLE 37. TOTAL SPENDING, COST, AND FUNDING GAPALL SOURCES (PUBLIC + PRIVATE SECTORS)
135 LMI COUNTRIES, SCENARIO B
* Estimates in millions 2016 2017 2018 2019 2020 CUMULATIVE (2016 - 2020)
Spending in 2014 (100%) $ 1,203 $ 1,203 $ 1,203 $ 1,203 $ 1,203 $ 6,016
Cost each year (100%) $ 1,352 $ 1,450 $ 1,548 $ 1,646 $ 1,744 $ 7,741
Difference / funding gap $ (149) $ (247) $ (345) $ (443) $ (541) $ (1,725)
The funding gap
Our analysis of potential funding gaps in Scenario B begins at the same place as our analysis of Scenario A, with the total amount spent on contraceptive supplies in 2014.
As noted earlier, 2014 spending amounted to $1.203 billion (Table 36). We attributed this to three types of spender: donors (25%); governments of the 135 LMI
countries using non-donor revenue (17%); and individuals who obtained their supplies from the private sector (58%). Donor and government spending added together represents all public sector expenditures in 2014 (42%).
All sources / public + private sectors
As previously noted, there was already a supplies funding deficit in 2016: the cost of supplies consumed in that year ($1.352 billion) was nearly $150 million greater than the total amount spent on supplies in 2014 ($1.203 billion) (Table 37).
Under Scenario B, the supplies consumption cost in 2020 is roughly a quarter-billion dollars higher than it is in Scenario A. Compared to the amount spent in 2014, the 2020 consumption cost of $1.744 billion indicates an additional $541 million in spending would be required just to meet contraceptive users’ supply needs.
SCENARIO B135 LMI COUNTRIES
TABLE 36. TOTAL SPENDING ON CONTRACEPTIVE SUPPLIES IN 2014
135 LOW- AND MIDDLE-INCOME COUNTRIES
Total spending on supplies $ 1,203,000,000
Combined Public Sector $ 508,400,000 42%Donors only $ 305,500,000 25%
Governments only $ 202,900,000 17%
Individuals/Private Sector $ 694,900,000 58%
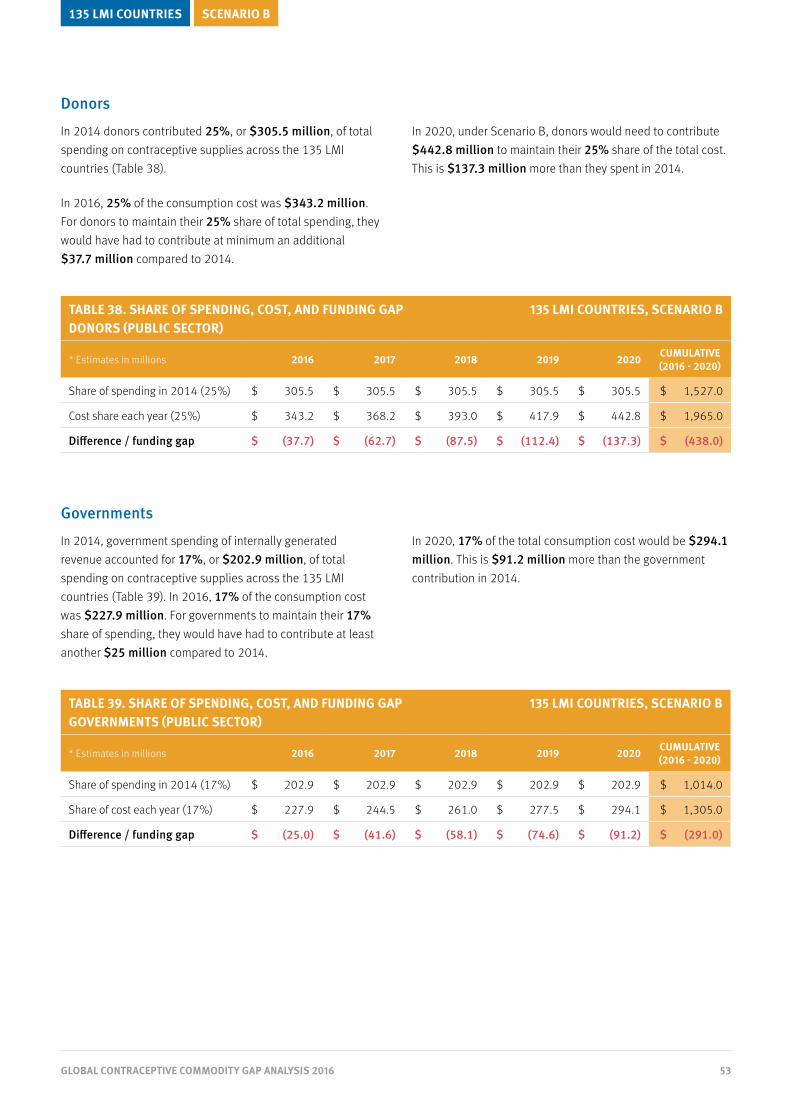
53GLOBAL CONTRACEPTIVE COMMODITY GAP ANALYSIS 2016
SCENARIO B135 LMI COUNTRIES
TABLE 38. SHARE OF SPENDING, COST, AND FUNDING GAPDONORS (PUBLIC SECTOR)
135 LMI COUNTRIES, SCENARIO B
* Estimates in millions 2016 2017 2018 2019 2020 CUMULATIVE (2016 - 2020)
Share of spending in 2014 (25%) $ 305.5 $ 305.5 $ 305.5 $ 305.5 $ 305.5 $ 1,527.0
Cost share each year (25%) $ 343.2 $ 368.2 $ 393.0 $ 417.9 $ 442.8 $ 1,965.0
Difference / funding gap $ (37.7) $ (62.7) $ (87.5) $ (112.4) $ (137.3) $ (438.0)
TABLE 39. SHARE OF SPENDING, COST, AND FUNDING GAPGOVERNMENTS (PUBLIC SECTOR)
135 LMI COUNTRIES, SCENARIO B
* Estimates in millions 2016 2017 2018 2019 2020 CUMULATIVE (2016 - 2020)
Share of spending in 2014 (17%) $ 202.9 $ 202.9 $ 202.9 $ 202.9 $ 202.9 $ 1,014.0
Share of cost each year (17%) $ 227.9 $ 244.5 $ 261.0 $ 277.5 $ 294.1 $ 1,305.0
Difference / funding gap $ (25.0) $ (41.6) $ (58.1) $ (74.6) $ (91.2) $ (291.0)
Donors
In 2014 donors contributed 25%, or $305.5 million, of total spending on contraceptive supplies across the 135 LMI countries (Table 38).
In 2016, 25% of the consumption cost was $343.2 million. For donors to maintain their 25% share of total spending, they would have had to contribute at minimum an additional $37.7 million compared to 2014.
In 2020, under Scenario B, donors would need to contribute $442.8 million to maintain their 25% share of the total cost. This is $137.3 million more than they spent in 2014.
Governments
In 2014, government spending of internally generated revenue accounted for 17%, or $202.9 million, of total spending on contraceptive supplies across the 135 LMI countries (Table 39). In 2016, 17% of the consumption cost was $227.9 million. For governments to maintain their 17% share of spending, they would have had to contribute at least another $25 million compared to 2014.
In 2020, 17% of the total consumption cost would be $294.1 million. This is $91.2 million more than the government contribution in 2014.

54GLOBAL CONTRACEPTIVE COMMODITY GAP ANALYSIS 2016
SCENARIO B135 LMI COUNTRIES
TABLE 40. SHARE OF SPENDING, COST, AND FUNDING GAPINDIVIDUALS (PRIVATE SECTOR)
135 LMI COUNTRIES, SCENARIO B
* Estimates in millions 2016 2017 2018 2019 2020 CUMULATIVE (2016 - 2020)
Share of spending in 2014 (58%) $ 694.9 $ 694.9 $ 694.9 $ 694.9 $ 694.9 $ 3,474.0
Share of cost each year (58%) $ 780.8 $ 837.7 $ 894.0 $ 950.6 $ 1,007.0 $ 4,470.0
Difference / funding gap $ (85.9) $ (142.8) $ (199.1) $ (255.7) $ (312.1) $ (996.0)
TABLE 41. SHARE OF SPENDING, COST, AND FUNDING GAPPUBLIC SECTOR (DONORS + GOVERNMENTS)
135 LMI COUNTRIES, SCENARIO B
* Estimates in millions 2016 2017 2018 2019 2020 CUMULATIVE (2016 - 2020)
Share of spending in 2014 (42%) $ 508.4 $ 508.4 $ 508.4 $ 508.4 $ 508.4 $ 2,541.0
Share of cost each year (42%) $ 571.2 $ 612.8 $ 654.0 $ 695.4 $ 737.0 $ 3,270.0
Difference / funding gap $ (62.8) $ (104.4) $ (145.6) $ (187.0) $ (228.6) $ (729.0)
Individuals / private sector
As of 2014, spending by individuals who obtain their supplies from the private sector accounts for 58%, or nearly $695 million, of total spending on contraceptive supplies across the 135 LMI countries (Table 40). In 2016, 58% of the consumption cost was $780.8 million. If spending by individuals were to remain at 58%, it would have required an additional $85.9 million.
Under Scenario B, 58% of the consumption cost of supplies in 2020 is $1.007 billion. This is $312.1 million more than individuals spent on supplies in 2014.
Public sector / donors + governments
In 2014, the public sector (donors and country government resources combined) contributed 42%, or $508.4 million, of total spending on contraceptive supplies across the 135 LMI countries (Table 41). In 2016, 42% of the total cost of consumption was $571.2 million. For the public sector to continue contributing a 42% share of total spending, it would have needed to spend at least $62.8 million more than it spent in 2014.
Under Scenario B, in 2020, maintaining the public sector’s 42% contribution to total spending on contraceptive supplies requires at least $737 million. This is $228.6 million more than the public sector spent on supplies in 2014.

55GLOBAL CONTRACEPTIVE COMMODITY GAP ANALYSIS 2016
Cost burden shift if public sector funding does not increase
If increases in public sector (donors and governments combined) spending are not forthcoming and the level of funding for supplies remains constant between 2014 and 2020, the relative contribution of the public sector to total costs would drop and a greater cost burden would fall to out-of-pocket spending by individuals.
In the 135 LMI countries, the public sector contributed 42% ($508.4 million) to total supplies spending in 2014. In 2020, under Scenario A, this amount would represent just 29% of the total supplies consumption cost. The balance – $1.235 billion under Scenario B – would shift to individual out-of-pocket spending (Figure 20; Table 42).
FIGURE 20. SHIFTS IN THE DISTRIBUTION OF COST IN 2020 135 LMI COUNTRIES: SCENARIO B
SCENARIO B135 LMI COUNTRIES
Total Cost in 2020: $ 1,525,000,000Scaled distribution of total cost based on 2014 spending pattern
Total Cost in 2020: $ 1,525,000.000Public sector funding frozen at 2014 level
All costs above that amount shi� to OOP spending by individuals
Public sectorContribution in 2014 $ 508.4m
Scaling up publicsector spendingto meet 2020 costs requires an additional $ 136m
IndividualsContribution
in 2014$ 694.9m
IndividualsRemainder of total
cost in 2020$ 1.017bn
Scaling up individuals’OOP spending to meet
2020 costs requiresan additional $ 186m
Public sectorContribution in 2014 $ 508.4m
42%58%
33%
67%
Total Cost in 2020: $ 1,744,000,000 Scaled distribution of total cost based on 2014 spending pattern
Total Cost in 2020: $ 1,744,000,000 Public sector funding frozen at 2014 level
All costs above that amount shi� to OOP spending by individuals
Public sectorContribution in 2014 $ 508.4m
Scaling up publicsector spendingto meet 2020 costs requires an additional $ 228.6m
IndividualsContribution
in 2014$ 694.9m
IndividualsRemainder of total
cost in 2020$ 1.235bn
Scaling up individuals’OOP spending to meet
2020 costs requiresan additional $ 312.1m
Public sectorContribution in 2014 $ 508.4m
42%
58%
29%
71%
TABLE 42. COST BURDEN SHIFT IN 2020 IF PUBLIC SECTOR SPENDING STALLS AT 2014 LEVELS
135 LMI COUNTRIES: SCENARIO B
Scenario B
Total cost in 2020 $ 1,744,000,000
Public Sector Individuals
Contribution at 2014 level $ 508,400,000 $ 694,900,000
Scaled increase to meet 2020 costs - $ 312,100,000
Remainder of 2020 costs - $ 228,600,000
Total contribution to cost in 2020 $ 508,400,000 $ 1,235,000,000

56GLOBAL CONTRACEPTIVE COMMODITY GAP ANALYSIS 2016
Findings for the 69 FP2020 focus countries
SECTION 5
SCENARIO A SCENARIO B69 FP2020 FOCUS COUNTRIES

57GLOBAL CONTRACEPTIVE COMMODITY GAP ANALYSIS 2016
The path to 2020 | Scenario A
Under Scenario A, each FP2020 focus country’s current trajectory of change in the number of users of each contraceptive method is extended to the year 2020. This approach assumes there will be no appreciable deviation from current growth trends.
In 2016, there were more than 300 million users of contraception living in these 69 countries (Table 43). Under Scenario A, this number will grow to 334 million in the year
2020. This is an increase of 11% over 4 years, which is greater than the increase for the full set of 135 LMI countries (8%) over the same time period. This is likely due to a number of factors, possibly including lower rates of contraceptive prevalence at the outset and a concentration of effort on expanding family planning programs following the London Summit on Family Planning in 2012.
TABLE 43. NUMBER OF USERS OF EACH CONTRACEPTIVE METHOD, 2016 - 202069 FP2020 FOCUS COUNTRIES: SCENARIO A
* Estimates in millions 2016 2017 2018 2019 2020 CHANGE (2016 - 2020)
All Methods 300.3 308.4 317.2 325.5 334.0 33.7 11%
Sterilization 114.4 115.1 116.2 116.8 117.4 3.0 3%
Implants 10.0 11.4 12.8 14.3 15.9 5.8 58%
IUDs 27.6 27.7 27.8 27.8 27.8 0.1 0%
Injectables 55.8 60.0 64.3 68.7 73.1 17.2 31%
Pills 44.5 44.2 43.8 43.3 42.8 (1.6) -4%
Male Condoms 43.6 45.5 47.6 49.6 51.8 8.2 19%
Other 4.0 4.2 4.5 4.7 5.0 0.9 23%
SCENARIO A69 FP2020 FOCUS COUNTRIES

58GLOBAL CONTRACEPTIVE COMMODITY GAP ANALYSIS 2016
As shown in the charts below, a large percentage growth rate in the number of users does not necessarily correlate with a large increase in the absolute number of users or a big shift in method mix.
Under Scenario A, the number of users of implants grows by 58%, from 10 million in 2016 to 15.9 million in 2020 (Figure 21). Despite this growth, implants represent a small percentage of the total method mix: 3% in 2016 and 5% in 2020 (Table 44).
By contrast, injectables show a lower growth rate (31%), but add the largest absolute number of users. Under Scenario A, 17.2 million users of injectables are added by the year 2020. This is reflected in a slight uptick in injectables’ share of the method mix: it rises from 19% in 2016 to 22% in 2020.
Under Scenario A, the only method to show a net loss in the number of users is contraceptive pills: there would be 1.6 million fewer women using pills in 2020 than there were in 2016. The impact on the total method mix is minimal, however; pills represent 15% of the method in 2016 and 13% in 2020.
A similarly slight decline in share of method mix is observed for sterilization (from 38% in 2016 to 35% in 2020) and IUDs (from 9% to 8%) though neither method shows a decrease in the absolute number of users.
0
50
25
75
125
100
150
175
0
50
25
75
125
100
150
175
0
50
25
75
125
100
150
175
0
50
25
75
125
100
150
175
2016 2020 2016 2020
2016 2020 2016 2020
Sterilization Implants IUDs Injectables Pills
Male Condoms Other
Sterilization Implants IUDs Injectables Pills
Male Condoms Other
Sterilization Implants IUDs Injectables Pills
Male Condoms Other
Sterilization Implants IUDs Injectables Pills
Male Condoms Otherm
illio
ns o
f use
rs
mill
ions
of u
sers
mill
ions
of u
sers
mill
ions
of u
sers
+4M+17.9M
+31.3M
+29.5M
+3M
+.99M
+10.9M
+3.4M
+18.3M
+27.9M
+22.5M+4.8M
+2.3M+10.4M+3.2M
+13.9M+18.9M
-3.7M
-2.9M
+6.4M+1M
+3M
+17.2M
+8.2M-1.6M
+.1M+5.8M+.9M
FIGURE 21. CHANGE IN NUMBER OF USERS PER METHOD, 2016-2020
69 FP2020 FOCUS COUNTRIES: SCENARIO A
TABLE 44. METHOD MIX, 2016 - 202069 FP2020 FOCUS COUNTRIES: SCENARIO A
2016 2017 2018 2019 2020
Sterilization 38% 37% 37% 36% 35%
Implants 3% 4% 4% 4% 5%
IUDs 9% 9% 9% 9% 8%
Injectables 19% 19% 20% 21% 22%
Pills 15% 14% 14% 13% 13%
Male Condoms 15% 15% 15% 15% 16%
Other 1% 1% 1% 1% 2%
SCENARIO A69 FP2020 FOCUS COUNTRIES
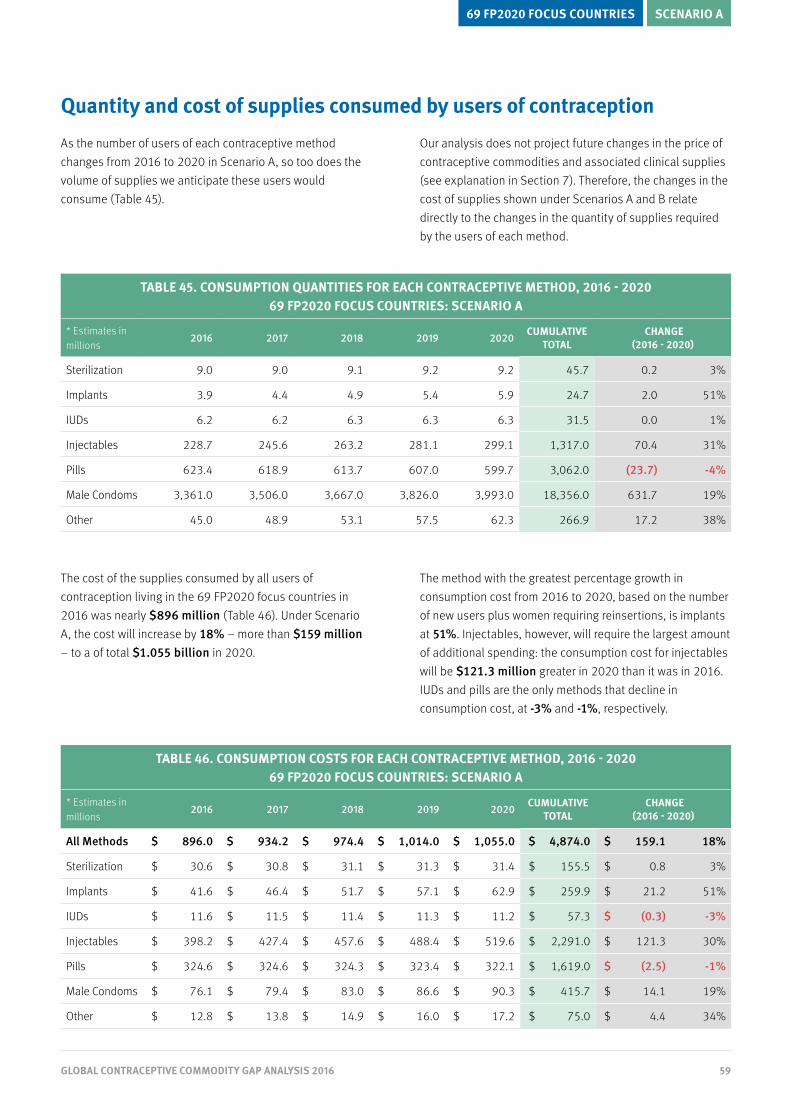
59GLOBAL CONTRACEPTIVE COMMODITY GAP ANALYSIS 2016
The cost of the supplies consumed by all users of contraception living in the 69 FP2020 focus countries in 2016 was nearly $896 million (Table 46). Under Scenario A, the cost will increase by 18% – more than $159 million – to a of total $1.055 billion in 2020.
The method with the greatest percentage growth in consumption cost from 2016 to 2020, based on the number of new users plus women requiring reinsertions, is implants at 51%. Injectables, however, will require the largest amount of additional spending: the consumption cost for injectables will be $121.3 million greater in 2020 than it was in 2016. IUDs and pills are the only methods that decline in consumption cost, at -3% and -1%, respectively.
Quantity and cost of supplies consumed by users of contraception
As the number of users of each contraceptive method changes from 2016 to 2020 in Scenario A, so too does the volume of supplies we anticipate these users would consume (Table 45).
Our analysis does not project future changes in the price of contraceptive commodities and associated clinical supplies (see explanation in Section 7). Therefore, the changes in the cost of supplies shown under Scenarios A and B relate directly to the changes in the quantity of supplies required by the users of each method.
TABLE 45. CONSUMPTION QUANTITIES FOR EACH CONTRACEPTIVE METHOD, 2016 - 2020 69 FP2020 FOCUS COUNTRIES: SCENARIO A
* Estimates in millions
2016 2017 2018 2019 2020 CUMULATIVE TOTAL
CHANGE (2016 - 2020)
Sterilization 9.0 9.0 9.1 9.2 9.2 45.7 0.2 3%
Implants 3.9 4.4 4.9 5.4 5.9 24.7 2.0 51%
IUDs 6.2 6.2 6.3 6.3 6.3 31.5 0.0 1%
Injectables 228.7 245.6 263.2 281.1 299.1 1,317.0 70.4 31%
Pills 623.4 618.9 613.7 607.0 599.7 3,062.0 (23.7) -4%
Male Condoms 3,361.0 3,506.0 3,667.0 3,826.0 3,993.0 18,356.0 631.7 19%
Other 45.0 48.9 53.1 57.5 62.3 266.9 17.2 38%
TABLE 46. CONSUMPTION COSTS FOR EACH CONTRACEPTIVE METHOD, 2016 - 2020 69 FP2020 FOCUS COUNTRIES: SCENARIO A
* Estimates in millions
2016 2017 2018 2019 2020 CUMULATIVE TOTAL
CHANGE (2016 - 2020)
All Methods $ 896.0 $ 934.2 $ 974.4 $ 1,014.0 $ 1,055.0 $ 4,874.0 $ 159.1 18%
Sterilization $ 30.6 $ 30.8 $ 31.1 $ 31.3 $ 31.4 $ 155.5 $ 0.8 3%
Implants $ 41.6 $ 46.4 $ 51.7 $ 57.1 $ 62.9 $ 259.9 $ 21.2 51%
IUDs $ 11.6 $ 11.5 $ 11.4 $ 11.3 $ 11.2 $ 57.3 $ (0.3) -3%
Injectables $ 398.2 $ 427.4 $ 457.6 $ 488.4 $ 519.6 $ 2,291.0 $ 121.3 30%
Pills $ 324.6 $ 324.6 $ 324.3 $ 323.4 $ 322.1 $ 1,619.0 $ (2.5) -1%
Male Condoms $ 76.1 $ 79.4 $ 83.0 $ 86.6 $ 90.3 $ 415.7 $ 14.1 19%
Other $ 12.8 $ 13.8 $ 14.9 $ 16.0 $ 17.2 $ 75.0 $ 4.4 34%
SCENARIO A69 FP2020 FOCUS COUNTRIES

60GLOBAL CONTRACEPTIVE COMMODITY GAP ANALYSIS 2016
Sterilization
Under Scenario A, the number of women who rely on sterilization will increase from 114.4 million in 2016 to 117.4 million in 2020 (Table 47).
Its share of method mix will decline slightly, but more sterilization kits will be used in 2020 than in 2016, resulting in a 3% increase in the supplies consumption quantity. The consumption cost for sterilization kits will also rise by 3%, from $30.6 million in 2016 to $31.4 million in 2020.
Implants
Under Scenario A, the number of users of implants will increase by 58%, from 10 million in 2016 to 15.9 million in 2020 (Table 48).
The number of implants inserted will also increases, from 3.9 million in 2016 to 5.9 million in 2020. Accordingly, the consumption cost of implants will grow from $41.6 million in 2016 to $62.9 million in 2020.
TABLE 47. STERILIZATION 69 FP2020 FOCUS COUNTRIES: SCENARIO A
* Estimates in millions 2016 2017 2018 2019 2020 CUMULATIVE TOTAL
CHANGE 2016 - 2020
Number of users 114.4 115.1 116.2 116.8 117.4 3.0 3%
Method mix share 38% 37% 37% 36% 35%
Consumption quantity 9.0 9.0 9.1 9.2 9.2 45.7 0.2 3%
Consumption cost $ 30.6 $ 30.8 $ 31.1 $ 31.3 $ 31.4 $ 155.5 $ 0.8 3%
TABLE 48. IMPLANTS 69 FP2020 FOCUS COUNTRIES: SCENARIO A
* Estimates in millions 2016 2017 2018 2019 2020 CUMULATIVE TOTAL
CHANGE 2016 - 2020
Number of users 10.0 11.4 12.8 14.3 15.9 5.8 58%
Method mix share 3% 4% 4% 4% 5%
Consumption quantity 3.9 4.4 4.9 5.4 5.9 24.7 2.0 51%
Consumption cost $ 41.6 $ 46.4 $ 51.7 $ 57.1 $ 62.9 $ 259.9 $ 21.2 51%
SCENARIO A69 FP2020 FOCUS COUNTRIES

61GLOBAL CONTRACEPTIVE COMMODITY GAP ANALYSIS 2016
IUDs
Under Scenario A, there will be little change in the number of users of IUDs from 2016 to 2020. While the absolute number of users will grow by 130 thousand, the share of method mix will dip slightly, from 9% to 8% (Table 49).
In 2020, an estimated 6.3 million IUDs will be inserted at a supplies consumption cost of $11.2 million. This amount is slightly lower (-3%) than the cost in 2016 due to geographical shifts in consumption and differences among countries in average IUD unit prices.
Injectables
Under Scenario A, the number of women using injectables will grow by 31%, from 55.8 million in 2016 to 73.1 million in 2020 (Table 50). However, its share of the method mix will increase only slightly, from 19% to 22%.
The consumption quantity of injectables will jump 31%, from 228.7 million to nearly 300 million in 2020. This will result in a consumption cost that is $121.3 greater in 2020 than in was in 2016.
TABLE 49. IUDS 69 FP2020 FOCUS COUNTRIES: SCENARIO A
* Estimates in millions 2016 2017 2018 2019 2020 CUMULATIVE TOTAL
CHANGE 2016 - 2020
Number of users 27.6 27.7 27.8 27.8 27.8 0.1 0%
Method mix share 9% 9% 9% 9% 8%
Consumption quantity 6.2 6.2 6.3 6.3 6.3 31.5 0.0 1%
Consumption cost $ 11.6 $ 11.5 $ 11.4 $ 11.3 $ 11.2 $ 57.3 $ (0.3) -3%
TABLE 50. INJECTABLES 69 FP2020 FOCUS COUNTRIES: SCENARIO A
* Estimates in millions 2016 2017 2018 2019 2020 CUMULATIVE TOTAL
CHANGE 2016 - 2020
Number of users 55.8 60.0 64.3 68.7 73.1 17.2 31%
Method mix share 19% 19% 20% 21% 22%
Consumption quantity 228.7 245.6 263.2 281.1 299.1 1,317.0 70.4 31%
Consumption cost $ 398.2 $ 427.4 $ 457.6 $ 488.4 $ 519.6 $ 2,291.0 $ 121.3 30%
SCENARIO A69 FP2020 FOCUS COUNTRIES

62GLOBAL CONTRACEPTIVE COMMODITY GAP ANALYSIS 2016
Pills
Under Scenario A, the number of women using contraceptive pills decreases from 44.5 million in 2016 to 42.8 million in 2020 (Table 51).
The share of method mix decreases as well, from 15% to 13%. The consumption cost of pills decreases from $324.6 million in 2016 to $322.1 million in 2020.
Male Condoms
Under Scenario A, the number of women who rely on male condoms as their method of contraception grows from 43.6 million in 2016 to 51.8 million in 2020 (Table 52).
The increase in cost, however, is relatively modest: it is $14.1 million higher in 2020 than it is in 2016.
TABLE 51. PILLS 69 FP2020 FOCUS COUNTRIES: SCENARIO A
* Estimates in millions 2016 2017 2018 2019 2020 CUMULATIVE TOTAL
CHANGE 2016 - 2020
Number of users 44.5 44.2 43.8 43.3 42.8 (1.6) -4%
Method mix share 15% 14% 14% 13% 13%
Consumption quantity 623.4 618.9 613.7 607.0 599.7 3,062.0 (23.7) -4%
Consumption cost $ 324.6 $ 324.6 $ 324.3 $ 323.4 $ 322.1 $ 1,619.0 $ (2.5) -1%
TABLE 52. MALE CONDOMS 69 FP2020 FOCUS COUNTRIES: SCENARIO A
* Estimates in millions 2016 2017 2018 2019 2020 CUMULATIVE TOTAL
CHANGE 2016 - 2020
Number of users 43.6 45.5 47.6 49.6 51.8 8.2 19%
Method mix share 15% 15% 15% 15% 16%
Consumption quantity 3,361.0 3,506.0 3,667.0 3,826.0 3,993.0 18,356.0 631.7 19%
Consumption cost $ 76.1 $ 79.4 $ 83.0 $ 86.6 $ 90.3 $ 415.7 $ 14.1 19%
SCENARIO A69 FP2020 FOCUS COUNTRIES

63GLOBAL CONTRACEPTIVE COMMODITY GAP ANALYSIS 2016
TABLE 54. TOTAL SPENDING, COST, AND FUNDING GAPALL SOURCES (PUBLIC + PRIVATE SECTORS)
69 FP2020 FOCUS COUNTRIES: SCENARIO A
* Estimates in millions 2016 2017 2018 2019 2020 CUMULATIVE (2016 - 2020)
Total spending in 2014 $ 821.8 $ 821.8 $ 821.8 $ 821.8 $ 821.8 $ 4,108.0
Total cost each year $ 895.9 $ 934.2 $ 974.4 $ 1,014.0 $ 1,055.0 $ 4,874.0
Difference / funding gap $ (74.1) $ (112.4) $ (152.6) $ (192.2) $ (233.2) $ (766.0)
The funding gap
Our funding gap estimates are derived from the comparison of annual supply consumption costs to a baseline of spending on supplies in 2014 – the most recent year with sufficient data for this analysis (Table 53). The gaps represent the amount of additional funding required each year to meet the projected consumption cost.
Our analysis then shows the breakdown of the gap among donors, governments, and individuals. As stated previously in this report, the projected funding gaps for the subset of 69 countries likely underestimate the true cost of providing contraceptive supplies, as prices have not been adjusted for anticipated inflation and quantities do not include amounts that may be needed to maintain optimal inventory levels.
All sources / public + private sectors
Among the 69 FP2020 focus countries, $821.8 million was spent on contraceptive supplies in 2014. This represented 68% of total spending on supplies across the 135 LMI countries. In 2016, the supplies consumption cost across the 69 countries was nearly $896 million; unless spending increased between 2014 and 2016, a gap of $74.2 million would already have occurred (Table 54).
Under Scenario A, the consumption cost of supplies in the year 2020 will be $1.055 billion. Therefore, if the 69 countries continue in their current growth trajectories and patterns of change, the volume of supplies required by users in 2020 will cost $233 million more than was spent on supplies in 2014.
SCENARIO A69 FP2020 FOCUS COUNTRIES
TABLE 53. TOTAL SPENDING ON CONTRACEPTIVE SUPPLIES IN 2014
69 FP2020 FOCUS COUNTRIES
Total spending on supplies $ 821.800.000
Combined Public Sector $ 374.700.000 46%Donors only $ 248.400.000 30%
Governments only $ 126.300.000 15%
Individuals/Private Sector $ 447.100.000 54%
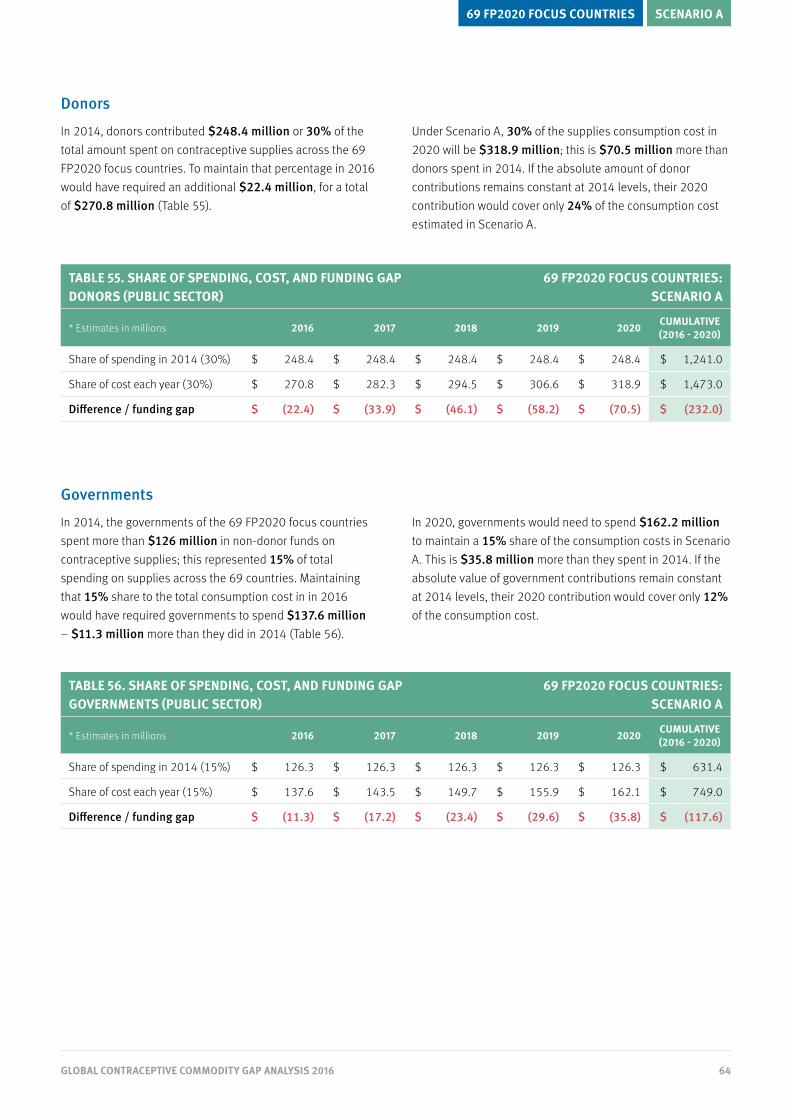
64GLOBAL CONTRACEPTIVE COMMODITY GAP ANALYSIS 2016
TABLE 55. SHARE OF SPENDING, COST, AND FUNDING GAPDONORS (PUBLIC SECTOR)
69 FP2020 FOCUS COUNTRIES: SCENARIO A
* Estimates in millions 2016 2017 2018 2019 2020 CUMULATIVE (2016 - 2020)
Share of spending in 2014 (30%) $ 248.4 $ 248.4 $ 248.4 $ 248.4 $ 248.4 $ 1,241.0
Share of cost each year (30%) $ 270.8 $ 282.3 $ 294.5 $ 306.6 $ 318.9 $ 1,473.0
Difference / funding gap $ (22.4) $ (33.9) $ (46.1) $ (58.2) $ (70.5) $ (232.0)
TABLE 56. SHARE OF SPENDING, COST, AND FUNDING GAPGOVERNMENTS (PUBLIC SECTOR)
69 FP2020 FOCUS COUNTRIES: SCENARIO A
* Estimates in millions 2016 2017 2018 2019 2020 CUMULATIVE (2016 - 2020)
Share of spending in 2014 (15%) $ 126.3 $ 126.3 $ 126.3 $ 126.3 $ 126.3 $ 631.4
Share of cost each year (15%) $ 137.6 $ 143.5 $ 149.7 $ 155.9 $ 162.1 $ 749.0
Difference / funding gap $ (11.3) $ (17.2) $ (23.4) $ (29.6) $ (35.8) $ (117.6)
Donors
In 2014, donors contributed $248.4 million or 30% of the total amount spent on contraceptive supplies across the 69 FP2020 focus countries. To maintain that percentage in 2016 would have required an additional $22.4 million, for a total of $270.8 million (Table 55).
Under Scenario A, 30% of the supplies consumption cost in 2020 will be $318.9 million; this is $70.5 million more than donors spent in 2014. If the absolute amount of donor contributions remains constant at 2014 levels, their 2020 contribution would cover only 24% of the consumption cost estimated in Scenario A.
Governments
In 2014, the governments of the 69 FP2020 focus countries spent more than $126 million in non-donor funds on contraceptive supplies; this represented 15% of total spending on supplies across the 69 countries. Maintaining that 15% share to the total consumption cost in in 2016 would have required governments to spend $137.6 million – $11.3 million more than they did in 2014 (Table 56).
In 2020, governments would need to spend $162.2 million to maintain a 15% share of the consumption costs in Scenario A. This is $35.8 million more than they spent in 2014. If the absolute value of government contributions remain constant at 2014 levels, their 2020 contribution would cover only 12% of the consumption cost.
SCENARIO A69 FP2020 FOCUS COUNTRIES

65GLOBAL CONTRACEPTIVE COMMODITY GAP ANALYSIS 2016
TABLE 57. SHARE OF SPENDING, COST, AND FUNDING GAPINDIVIDUALS (PRIVATE SECTOR)
69 FP2020 FOCUS COUNTRIES: SCENARIO A
* Estimates in millions 2016 2017 2018 2019 2020 CUMULATIVE (2016 - 2020)
Share of spending in 2014 (54%) $ 447.1 $ 447.1 $ 447.1 $ 447.1 $ 447.1 $ 2,235.0
Share of cost each year (54%) $ 487.4 $ 508.2 $ 530.1 $ 551.9 $ 574.0 $ 2,651.0
Difference / funding gap $ (40.3) $ (61.1) $ (83.0) $ (104.8) $ (126.9) $ (416.0)
TABLE 58. SHARE OF SPENDING, COST, AND FUNDING GAP PUBLIC SECTOR (DONORS + GOVERNMENTS)
69 FP2020 FOCUS COUNTRIES: SCENARIO A
* Estimates in millions 2016 2017 2018 2019 2020 CUMULATIVE (2016 - 2020)
Share of spending in 2014 (46%) $ 374.7 $ 374.7 $ 374.7 $ 374.7 $ 374.7 $ 1,873.0
Share of cost each year (46%) $ 408.5 $ 425.9 $ 444.2 $ 462.5 $ 481.0 $ 2,222.0
Difference / funding gap $ (33.8) $ (51.2) $ (69.5) $ (87.8) $ (106.3) $ (349.0)
Individuals / private sector
In 2014, individuals who obtained their supplies from the private sector, and a small number of employer-sponsored health schemes, spent more than $447 million on contraceptive supplies. This represented 54% of the total amount spent on supplies that year across the 69 FP2020 focus countries.
Under Scenario A, maintaining that 54% share in 2016 would have required $487.4 million – $40.3 million more than individuals and the private sector spent in 2014 (Table 57). To maintain a 54% share in 2020 will require $574 million – $126.9 million more than they spent in 2014. If spending on supplies by individuals remains static at 2014 levels, their contribution in 2020 would fall to only 42% of the consumption cost estimated in Scenario A.
Public sector / donors + governments
If we look at public sector spending as a whole, the combined contribution of donors and governments in 2014 ($374.7 million) accounted for 46% of the total amount spent on supplies across the 69 FP2020 countries. In 2016, 46% of the total supplies consumption cost was $408.5 million (Table 58). This is nearly 34 million more than the public sector spent on supplies in 2014.
In Scenario A, 46% of the supplies consumption cost in the year 2020 is over $481 million. This is $106 million more than the public sector spent on supplies in 2014.
SCENARIO A69 FP2020 FOCUS COUNTRIES

66GLOBAL CONTRACEPTIVE COMMODITY GAP ANALYSIS 2016
SCENARIO A69 FP2020 FOCUS COUNTRIES
Cost burden shift if public sector funding does not increase
If increases in public sector (donors and governments combined) spending are not forthcoming and the level of funding for supplies remains constant between 2014 and 2020, the relative contribution of the public sector to total costs would drop and a greater cost burden would fall to out-of-pocket spending by individuals.
Across the 69 FP2020 focus countries, the public sector’s $374.7 million contribution – which represents 46% of total spending on supplies in 2014 – would in 2020 cover only 36% of the supplies consumption cost under Scenario A. The balance of the cost – $680.3 million – would be borne by individuals spending out-of-pocket for supplies (Figure 22; Table 59)
FIGURE 22. SHIFTS IN THE DISTRIBUTION OF COST IN 2020 69 FP2020 FOCUS COUNTRIES: SCENARIO A
Total Cost in 2020: $ 1,055,000,000 Scaled distribution of total cost based on 2014 spending pattern
Total Cost in 2020: $ 1,055,000,000 Public sector funding frozen at 2014 level
All costs above that amount shi� to OOP spending by individuals
Public sectorContribution in 2014 $ 374.7m
Scaling up publicsector spendingto meet 2020 costs requires an additional $ 106.3m
IndividualsContribution
in 2014$ 447.1m
IndividualsRemainder of total
cost in 2020$ 680.3m
Scaling up individuals’OOP spending to meet
2020 costs requiresan additional $ 126.9m
Public sectorContribution in 2014 $ 374.7m
Total Cost in 2020: $ 1,259,000,000 Scaled distribution of total cost based on 2014 spending pattern
Total Cost in 2020: $ 1,259,000,000 Public sector funding frozen at 2014 level
All costs above that amount shi� to OOP spending by individuals
Public sectorContribution in 2014 $ 374.7m
Scaling up publicsector spendingto meet 2020 costs requires an additional $ 199.4m
IndividualsContribution
in 2014$ 447.1m
IndividualsRemainder of total
cost in 2020$ 884.5m
Scaling up individuals’OOP spending to meet
2020 costs requiresan additional $ 238m
Public sectorContribution in 2014 $ 374.7m
46%54%
36%
64%
30%
70%
46%54%
TABLE 59. COST BURDEN SHIFT IN 2020 IF PUBLIC SECTOR SPENDING STALLS AT 2014 LEVELS
69 LMI COUNTRIES: SCENARIO A
Scenario A
Total cost in 2020 $ 1,055,000,000
Public Sector Individuals
Contribution at 2014 level $ 374,700,000 $ 447,100,000
Scaled increase to meet 2020 costs - $ 126,900,000
Remainder of 2020 costs - $ 106,300,000
Total contribution to cost in 2020 $ 374,700,000 $ 680,300,000

67GLOBAL CONTRACEPTIVE COMMODITY GAP ANALYSIS 2016
The path to 2020 | Scenario B
Scenario B envisions the achievement of the FP2020 goal: to add, in the world’s 69 lowest-income countries, 120 million more users of contraception by the year 2020 than there were at the time of the London Summit on Family Planning in 2012.
Scenario B responds to the questions posed by donors, governments, advocates, and technical experts at the start of the CGA project: as the year 2020 draws near, what volume of supplies, and of which methods, will an unprecedented number of users of contraception consume? How much will these supplies cost? How do the projected totals compare to actual spending on supplies at the most recent measurable level? And how might the anticipated cost be distributed among donors, governments, and those individuals who obtain their supplies through the private sector?
In 2016 there were more than 300 million women using modern methods of contraception living in the 69 FP2020 focus countries (Table 60). Under Scenario B, this number grows to more than 390 million women in the year 2020. This is an increase of 30%, or nearly 90 million women, over four years.
TABLE 60. NUMBER OF USERS OF EACH CONTRACEPTIVE METHOD, 2016 - 202069 FP2020 FOCUS COUNTRIES: SCENARIO B
* Estimates in millions
2016 2017 2018 2019 2020 CHANGE (2016 - 2020)
All Methods 300.3 322.7 345.2 367.6 390.1 89.8 30%
Sterilization 114.4 121.6 125.4 129.2 132.8 18.3 16%
Implants 10.0 12.2 14.7 17.5 20.5 10.4 103%
IUDs 27.6 27.7 28.5 29.3 30.0 2.3 9%
Injectables 55.8 61.5 68.7 76.1 83.8 27.9 50%
Pills 44.5 45.7 47.2 48.4 49.3 4.8 11%
Male Condoms 43.6 48.9 54.7 60.4 66.1 22.5 52%
Other 4.0 4.8 5.6 6.5 7.3 3.2 80%
SCENARIO B69 FP2020 FOCUS COUNTRIES

68GLOBAL CONTRACEPTIVE COMMODITY GAP ANALYSIS 2016
SCENARIO B69 FP2020 FOCUS COUNTRIES
Under Scenario B, the method that shows the largest increase in the absolute number of users is injectables; an estimated 28 million users will be added by the year 2020 (Figure 23). The method with the next largest increase in absolute numbers is male condoms; the number of women who rely on this method will grow by 22.5 million, from 43.6 million in 2016 to 66.1 million in 2020.
The method with the largest percentage growth is implants: the number of users increases 103% from 2016 to 2020. IUDs show the most modest growth, increasing from 27.6 million in 2016 to 27.9 million in 2020. While the number of users of “other methods” grows by 79%, this category represents the smallest number of users in 2016. In 2020, there are 7.3 million users of “other” methods, representing just representing just 2% of the method mix.
Despite a relatively small percentage increase in users and a declining percentage of total method use, sterilization retains the largest share of the method mix: 38% in 2016 and 34% in 2020 (Table 61).
While all methods gained users in absolute terms, the other methods besides sterilization that decline in share of method mix are IUDs (from 9% in 2016 to 8% in 2020) and pills (from 15% in 2016 to 13% in 2020).
0
50
25
75
125
100
150
175
0
50
25
75
125
100
150
175
0
50
25
75
125
100
150
175
0
50
25
75
125
100
150
175
2016 2020 2016 2020
2016 2020 2016 2020
Sterilization Implants IUDs Injectables Pills
Male Condoms Other
Sterilization Implants IUDs Injectables Pills
Male Condoms Other
Sterilization Implants IUDs Injectables Pills
Male Condoms Other
Sterilization Implants IUDs Injectables Pills
Male Condoms Other
mill
ions
of u
sers
mill
ions
of u
sers
mill
ions
of u
sers
mill
ions
of u
sers
+4M+17.9M
+31.3M
+29.5M
+3M
+.99M
+10.9M
+3.4M
+18.3M
+27.9M
+22.5M+4.8M
+2.3M+10.4M+3.2M
+13.9M+18.9M
-3.7M
-2.9M
+6.4M+1M
+3M
+17.2M
+8.2M-1.6M
+.1M+5.8M+.9M
FIGURE 23. CHANGE IN NUMBER OF USERS PER METHOD, 2016-2020
69 FP2020 FOCUS COUNTRIES: SCENARIO B
TABLE 61. METHOD MIX, 2016 - 202069 FP2020 FOCUS COUNTRIES: SCENARIO B
2016 2017 2018 2019 2020
Sterilization 38% 38% 36% 35% 34%
Implants 3% 4% 4% 5% 5%
IUDs 9% 9% 8% 8% 8%
Injectables 19% 19% 20% 21% 21%
Pills 15% 14% 14% 13% 13%
Male Condoms 15% 15% 16% 16% 17%
Other 1% 2% 2% 2% 2%

69GLOBAL CONTRACEPTIVE COMMODITY GAP ANALYSIS 2016
SCENARIO B69 FP2020 FOCUS COUNTRIES
In 2016, the more than 300 million users of contraception living in the 69 FP2020 focus countries consumed supplies costing $896 million (Table 63).
If the FP2020 goal were to be achieved in the year 2020, a total of more than 390 million users of contraception would require $1.259 billion in supplies for personal consumption. This is a consumption cost increase of 41%, or $363 million, over four years.
The method that shows the greatest percentage growth in cost is implants, at 123%. The method showing the greatest increase in absolute cost is injectables, which has a consumption cost that is nearly $213 million higher in 2020 than in 2016.
Quantity and cost of supplies consumed by users of contraception
Just as the number of users of each method of contraception increases more steeply under Scenario B than Scenario A, the quantities of supplies required for user consumption are
also greater. These larger consumption quantities (Table 62) drive the higher consumption costs projected under Scenario B.
TABLE 62. CONSUMPTION QUANTITIES FOR EACH CONTRACEPTIVE METHOD, 2016 - 202069 FP2020 FOCUS COUNTRIES: SCENARIO B
* Estimates in millions
2016 2017 2018 2019 2020 CUMULATIVE TOTAL
CHANGE (2016 - 2020)
Sterilization 9.0 9.5 9.8 10.1 10.4 49.1 1.4 16%
Implants 3.9 5.8 6.7 7.7 8.8 33.1 4.9 124%
IUDs 6.2 8.0 8.0 8.1 8.2 38.7 1.9 31%
Injectables 228.7 252.6 282.9 314.3 346.3 1,425.0 117.6 51%
Pills 623.4 640.5 661.5 678.1 691.5 3,295.0 68.0 11%
Male Condoms 3,361.0 3,770.0 4,214.0 4,655.0 5,096.0 21,100.0 1,734.0 52%
Other 45.0 57.3 69.2 81.6 94.4 347.7 49.3 109%
TABLE 63. CONSUMPTION COSTS FOR EACH CONTRACEPTIVE METHOD, 2016 - 2020 69 FP2020 FOCUS COUNTRIES: SCENARIO B
* Estimates in millions
2016 2017 2018 2019 2020 CUMULATIVE TOTAL
CHANGE (2016 - 2020)
All Methods $ 896.0 $ 985.6 $ 1,076.0 $ 1,167.0 $ 1,259.0 $ 5,384.0 $ 363.2 41%
Sterilization $ 30.6 $ 32.5 $ 33.6 $ 34.6 $ 35.6 $ 167.2 $ 4.9 16%
Implants $ 41.6 $ 60.8 $ 70.9 $ 81.6 $ 92.9 $ 348.0 $ 51.2 123%
IUDs $ 11.6 $ 13.9 $ 14.5 $ 14.6 $ 14.8 $ 69.7 $ 3.2 28%
Injectables $ 398.2 $ 442.2 $ 496.9 $ 553.4 $ 611.2 $ 2,502.0 $ 212.9 53%
Pills $ 324.6 $ 335.0 $ 347.2 $ 357.7 $ 366.9 $ 1,731.0 $ 42.3 13%
Male Condoms $ 76.1 $ 85.1 $ 94.4 $ 103.6 $ 112.9 $ 472.3 $ 36.7 48%
Other $ 12.8 $ 15.7 $ 18.6 $ 21.6 $ 24.6 $ 93.5 $ 11.8 92%
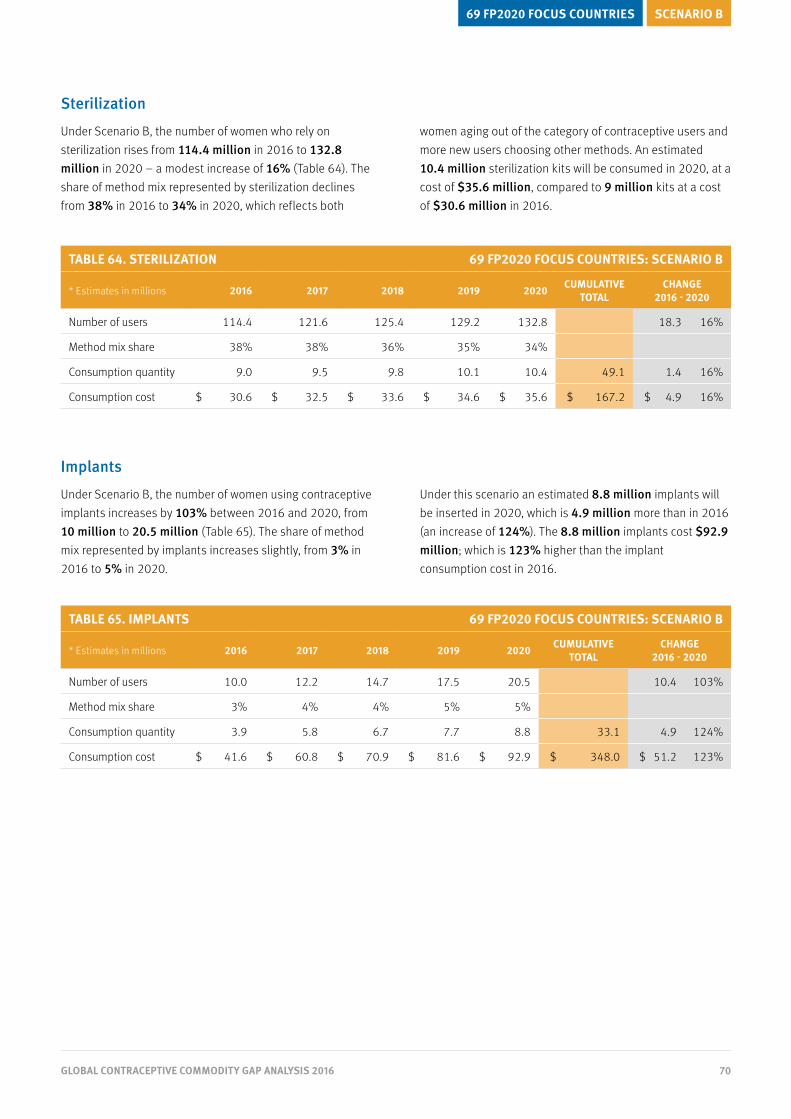
70GLOBAL CONTRACEPTIVE COMMODITY GAP ANALYSIS 2016
SCENARIO B69 FP2020 FOCUS COUNTRIES
Sterilization
Under Scenario B, the number of women who rely on sterilization rises from 114.4 million in 2016 to 132.8 million in 2020 – a modest increase of 16% (Table 64). The share of method mix represented by sterilization declines from 38% in 2016 to 34% in 2020, which reflects both
women aging out of the category of contraceptive users and more new users choosing other methods. An estimated 10.4 million sterilization kits will be consumed in 2020, at a cost of $35.6 million, compared to 9 million kits at a cost of $30.6 million in 2016.
Implants
Under Scenario B, the number of women using contraceptive implants increases by 103% between 2016 and 2020, from 10 million to 20.5 million (Table 65). The share of method mix represented by implants increases slightly, from 3% in 2016 to 5% in 2020.
Under this scenario an estimated 8.8 million implants will be inserted in 2020, which is 4.9 million more than in 2016 (an increase of 124%). The 8.8 million implants cost $92.9 million; which is 123% higher than the implant consumption cost in 2016.
TABLE 64. STERILIZATION 69 FP2020 FOCUS COUNTRIES: SCENARIO B
* Estimates in millions 2016 2017 2018 2019 2020 CUMULATIVE TOTAL
CHANGE 2016 - 2020
Number of users 114.4 121.6 125.4 129.2 132.8 18.3 16%
Method mix share 38% 38% 36% 35% 34%
Consumption quantity 9.0 9.5 9.8 10.1 10.4 49.1 1.4 16%
Consumption cost $ 30.6 $ 32.5 $ 33.6 $ 34.6 $ 35.6 $ 167.2 $ 4.9 16%
TABLE 65. IMPLANTS 69 FP2020 FOCUS COUNTRIES: SCENARIO B
* Estimates in millions 2016 2017 2018 2019 2020 CUMULATIVE TOTAL
CHANGE 2016 - 2020
Number of users 10.0 12.2 14.7 17.5 20.5 10.4 103%
Method mix share 3% 4% 4% 5% 5%
Consumption quantity 3.9 5.8 6.7 7.7 8.8 33.1 4.9 124%
Consumption cost $ 41.6 $ 60.8 $ 70.9 $ 81.6 $ 92.9 $ 348.0 $ 51.2 123%

71GLOBAL CONTRACEPTIVE COMMODITY GAP ANALYSIS 2016
IUDs
Under Scenario B, the number of users of IUDs grows from 27.6 million in 2016 to 30 million in 2020 (Table 66). The share of method mix represented by IUDs dips very slightly, from 9% to 8%.
In 2020 8.2 million IUDs will be inserted, up from 6.2 million in 2016. The consumption cost of IUDs in 2020 is $14.8 million; this is $3.2 million more than the cost in 2016 ($11.6 million).
Injectables
By 2020, the number of injectable users will grow by 50% to 83.8 million (Table 67). Under Scenario B, injectables will represent 21% of the method mix in 2020, compared to
19% in 2016. By 2020, the consumption cost of injectables will reach more than $611 million – nearly $213 million more than the consumption cost in 2016.
TABLE 66. IUDS 69 FP2020 FOCUS COUNTRIES: SCENARIO B
* Estimates in millions 2016 2017 2018 2019 2020 CUMULATIVE TOTAL
CHANGE 2016 - 2020
Number of users 27.6 27.7 28.5 29.3 30.0 2.3 9%
Method mix share 9% 9% 8% 8% 8%
Consumption quantity 6.2 8.0 8.0 8.1 8.2 38.7 1.9 31%
Consumption cost $ 11.6 $ 13.9 $ 14.5 $ 14.6 $ 14.8 $ 69.7 $ 3.2 28%
TABLE 67. INJECTABLES 69 FP2020 FOCUS COUNTRIES: SCENARIO B
* Estimates in millions 2016 2017 2018 2019 2020 CUMULATIVE TOTAL
CHANGE 2016 - 2020
Number of users 55.8 61.5 68.7 76.1 83.8 27.9 50%
Method mix share 19% 19% 20% 21% 21%
Consumption quantity 228.7 252.6 282.9 314.3 346.3 1,425.0 117.6 51%
Consumption cost $ 398.2 $ 442.2 $ 496.9 $ 553.4 $ 611.2 $ 2,502.0 $ 212.9 53%
SCENARIO B69 FP2020 FOCUS COUNTRIES

72GLOBAL CONTRACEPTIVE COMMODITY GAP ANALYSIS 2016
SCENARIO B69 FP2020 FOCUS COUNTRIES
Pills
Under Scenario B, the number of women using contraceptive pills will reach 49.3 million by 2020 — an increase of 11% over the number of pill users in 2016 (Table 68). Due to shifts in consumption patterns, however, pills will represent
a smaller share of method mix in 2020 (13%) than in 2016 (15%). Users will consume 691.5 million pill cycles in 2020, at a total cost of nearly $367 million.
Male condoms
Under Scenario B, the number of women relying on male condoms as their method of contraception will reach 66 million by the year 2020 — a 52% increase compared to 2016 (Table 69).
The quantities of male condoms themselves will exceed 5 billion, which is 52% higher than the quantities consumed in 2016. The consumption cost will be $112.9 million, which is 48% higher than the cost in 2016.
TABLE 68. PILLS 69 FP2020 FOCUS COUNTRIES: SCENARIO B
* Estimates in millions 2016 2017 2018 2019 2020 CUMULATIVE TOTAL
CHANGE 2016 - 2020
Number of users 44.5 45.7 47.2 48.4 49.3 4.8 11%
Method mix share 15% 14% 14% 13% 13%
Consumption quantity 623.4 640.5 661.5 678.1 691.5 3,295.0 68.0 11%
Consumption cost $ 324.6 $ 335.0 $ 347.2 $ 357.7 $ 366.9 $ 1,731.0 $ 42.3 13%
TABLE 69. MALE CONDOMS 69 FP2020 FOCUS COUNTRIES: SCENARIO B
* Estimates in millions 2016 2017 2018 2019 2020 CUMULATIVE TOTAL
CHANGE 2016 - 2020
Number of users 43.6 48.9 54.7 60.4 66.1 22.5 52%
Method mix share 15% 15% 16% 16% 17%
Consumption quantity 3,361.0 3,770.0 4,214.0 4,655.0 5,096.0 21,100.0 1,734.0 52%
Consumption cost $ 76.1 $ 85.1 $ 94.4 $ 103.6 $ 112.9 $ 472.3 $ 36.7 48%

73GLOBAL CONTRACEPTIVE COMMODITY GAP ANALYSIS 2016
The funding gap
In 2014 – the most recent year with sufficient data for all 69 FP2020 focus countries – total spending on contraceptive supplies from all sources amounted to $821.8 million (Table 70). Throughout this report, that amount has served as our baseline for quantifying the amount of additional funding required to purchase the quantities of supplies projected under Scenarios A and now B.
This amount comprises spending by donors (including direct spending, monetary contributions, in-kind contributions, basket funds, and loans), the governments of the 69
countries (using non-donor funds), and individuals who pay out-of-pocket to obtain supplies from the private sector. For the 69 FP2020 countries, we attribute 30% of the total amount spent to donors, 15% to governments, and 54% to individuals. By combining donor and government spending, we estimate 46% of the total was contributed by the public sector.
More detail on our spending analysis can be found in Section 2.
SCENARIO B69 FP2020 FOCUS COUNTRIES
TABLE 71. TOTAL SPENDING, COST, AND FUNDING GAPALL SOURCES (PUBLIC + PRIVATE SECTORS)
69 FP2020 FOCUS COUNTRIES: SCENARIO B
* Estimates in millions 2016 2017 2018 2019 2020 CUMULATIVE (2016 - 2020)
Total spending in 2014 $ 821.8 $ 821.8 $ 821.8 $ 821.8 $ 821.8 $ 4,108.0
Total cost each year $ 895.9 $ 985.6 $ 1,076.0 $ 1,167.0 $ 1,259.0 $ 5,384.0
Difference / funding gap $ (74.1) $ (163.8) $ (254.2) $ (345.2) $ (437.2) $ (1,276.0)
All sources / public + private sectors
If the FP2020 goal were achieved in the 69 focus countries, the supplies consumed by all users of contraception in the year 2020 would cost $1.259 billion (Table 71). This is
$437 million more than the total amount spent on supplies in 2014 from all sources of funding.
TABLE 70. TOTAL SPENDING ON CONTRACEPTIVE SUPPLIES IN 2014
69 FP2020 FOCUS COUNTRIES
Total spending on supplies $ 821,800,000
Combined Public Sector $ 374,700,000 46%Donors only $ 248,400,000 30%
Governments only $ 126,300,000 15%
Individuals/Private Sector $ 447,100,000 54%

74GLOBAL CONTRACEPTIVE COMMODITY GAP ANALYSIS 2016
SCENARIO B69 FP2020 FOCUS COUNTRIES
TABLE 72. SHARE OF SPENDING, COST, AND FUNDING GAPDONORS (PUBLIC SECTOR)
69 FP2020 FOCUS COUNTRIES: SCENARIO B
* Estimates in millions 2016 2017 2018 2019 2020 CUMULATIVE (2016 - 2020)
Share of spending in 2014 (30%) $ 248.4 $ 248.4 $ 248.4 $ 248.4 $ 248.4 $ 1,241.0
Share of cost each year (30%) $ 270.8 $ 297.9 $ 325.3 $ 352.8 $ 380.6 $ 1,627.0
Difference / funding gap $ (22.4) $ (49.5) $ (76.9) $ (104.4) $ (132.2) $ (386.0)
TABLE 73. SHARE OF SPENDING, COST, AND FUNDING GAPGOVERNMENTS (PUBLIC SECTOR)
69 FP2020 FOCUS COUNTRIES: SCENARIO B
* Estimates in millions 2016 2017 2018 2019 2020 CUMULATIVE (2016 - 2020)
Share of spending in 2014 (15%) $ 126.3 $ 126.3 $ 126.3 $ 126.3 $ 126.3 $ 631.4
Share of cost each year (15%) $ 137.6 $ 151.4 $ 165.4 $ 179.4 $ 193.5 $ 827.5
Difference / funding gap $ (11.3) $ (25.1) $ (39.1) $ (53.1) $ (67.2) $ (196.1)
Donors
In 2014, donors contributed $248.4 million or roughly 30% of the total amount spent on supplies. It is impossible to predict whether aggregate donor funding will increase or decrease as 2020 draws closer. If we assume that donors continue to contribute 30% of total spending, their share by 2020 will reach $380.6 million. That is $132 million more than donors spent on supplies in 2014 (Table 72).
On the other hand, if donor funding in absolute terms remained constant at 2014 levels, then by 2020, their $248.8 million contribution would account for only 20% of the total consumption cost under Scenario B. This assumes that governments and individuals would increase spending to fill the gap. If they couldn’t, the result would be fewer users of contraception. Women cannot use contraceptive supplies they don’t have.
Governments
In 2014, the governments of the 69 FP2020 focus countries spent $126.3 million of non-donor, domestically generated funds on contraceptive supplies. This was equivalent to 15% of total spending from all sources, and one-third of total public sector spending.
If the FP2020 goal were achieved, 15% of the supplies consumption cost in 2020 would be $193.5 million (Table
73). Simply maintaining their relative share of the consumption cost would require governments to spend an additional $67.2 million in 2020 alone. If governments instead continued to spend $126.3 million annually, their contribution to the total consumption cost in 2020 would fall to 10%.
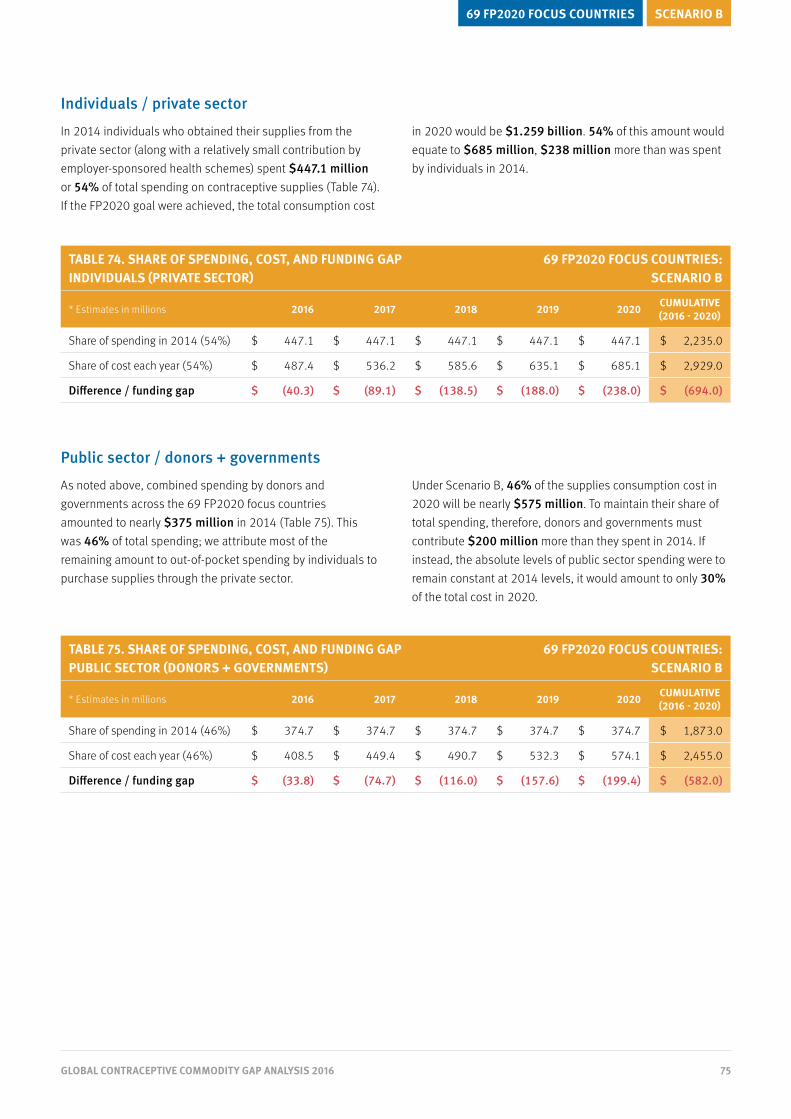
75GLOBAL CONTRACEPTIVE COMMODITY GAP ANALYSIS 2016
SCENARIO B69 FP2020 FOCUS COUNTRIES
TABLE 74. SHARE OF SPENDING, COST, AND FUNDING GAPINDIVIDUALS (PRIVATE SECTOR)
69 FP2020 FOCUS COUNTRIES: SCENARIO B
* Estimates in millions 2016 2017 2018 2019 2020 CUMULATIVE (2016 - 2020)
Share of spending in 2014 (54%) $ 447.1 $ 447.1 $ 447.1 $ 447.1 $ 447.1 $ 2,235.0
Share of cost each year (54%) $ 487.4 $ 536.2 $ 585.6 $ 635.1 $ 685.1 $ 2,929.0
Difference / funding gap $ (40.3) $ (89.1) $ (138.5) $ (188.0) $ (238.0) $ (694.0)
TABLE 75. SHARE OF SPENDING, COST, AND FUNDING GAPPUBLIC SECTOR (DONORS + GOVERNMENTS)
69 FP2020 FOCUS COUNTRIES: SCENARIO B
* Estimates in millions 2016 2017 2018 2019 2020 CUMULATIVE (2016 - 2020)
Share of spending in 2014 (46%) $ 374.7 $ 374.7 $ 374.7 $ 374.7 $ 374.7 $ 1,873.0
Share of cost each year (46%) $ 408.5 $ 449.4 $ 490.7 $ 532.3 $ 574.1 $ 2,455.0
Difference / funding gap $ (33.8) $ (74.7) $ (116.0) $ (157.6) $ (199.4) $ (582.0)
Individuals / private sector
In 2014 individuals who obtained their supplies from the private sector (along with a relatively small contribution by employer-sponsored health schemes) spent $447.1 million or 54% of total spending on contraceptive supplies (Table 74). If the FP2020 goal were achieved, the total consumption cost
in 2020 would be $1.259 billion. 54% of this amount would equate to $685 million, $238 million more than was spent by individuals in 2014.
Public sector / donors + governments
As noted above, combined spending by donors and governments across the 69 FP2020 focus countries amounted to nearly $375 million in 2014 (Table 75). This was 46% of total spending; we attribute most of the remaining amount to out-of-pocket spending by individuals to purchase supplies through the private sector.
Under Scenario B, 46% of the supplies consumption cost in 2020 will be nearly $575 million. To maintain their share of total spending, therefore, donors and governments must contribute $200 million more than they spent in 2014. If instead, the absolute levels of public sector spending were to remain constant at 2014 levels, it would amount to only 30% of the total cost in 2020.

76GLOBAL CONTRACEPTIVE COMMODITY GAP ANALYSIS 2016
SCENARIO B69 FP2020 FOCUS COUNTRIES
Cost burden shift if public sector funding does not increase
It is often assumed that out-of-pocket spending by individuals will compensate for funding shortfalls in the public sector. While this may be true to a certain extent, the potential magnitude of the gap under Scenario B calls into question the feasibility of this solution (Figure 24, Table 76).
If the public sector were to contribute the same percentage of total spending in 2020 that it did 2014 (46%), its share would amount to nearly $575 million. If, however, the public sector contributed in 2020 the same absolute amount that it did in 2014 ($374.7 million), it would leave nearly $200 million of its share of the consumption cost unfunded.
If this were to occur, the only way to fund the entire projected consumption cost in 2020 would be for out-of-pocket spending by individuals to comprise (a) the absolute amount individuals spent in 2014, or $447.1 million; (b) the increase necessary to maintain individuals’ 54% share of total spending, or $238 million; and (c) the amount of the public sector funding gap, or $199.4 million. In total, the cost burden on individuals in 2020 would be $884.5 million, which is nearly twice as much as individuals spent on contraceptive supplies in 2014.
FIGURE 24. SHIFTS IN THE DISTRIBUTION OF COST IN 2020 69 FP2020 FOCUS COUNTRIES: SCENARIO B
Total Cost in 2020: $ 1,055,000,000 Scaled distribution of total cost based on 2014 spending pattern
Total Cost in 2020: $ 1,055,000,000 Public sector funding frozen at 2014 level
All costs above that amount shi� to OOP spending by individuals
Public sectorContribution in 2014 $ 374.7m
Scaling up publicsector spendingto meet 2020 costs requires an additional $ 106.3m
IndividualsContribution
in 2014$ 447.1m
IndividualsRemainder of total
cost in 2020$ 680.3m
Scaling up individuals’OOP spending to meet
2020 costs requiresan additional $ 126.9m
Public sectorContribution in 2014 $ 374.7m
Total Cost in 2020: $ 1,259,000,000 Scaled distribution of total cost based on 2014 spending pattern
Total Cost in 2020: $ 1,259,000,000 Public sector funding frozen at 2014 level
All costs above that amount shi� to OOP spending by individuals
Public sectorContribution in 2014 $ 374.7m
Scaling up publicsector spendingto meet 2020 costs requires an additional $ 199.4m
IndividualsContribution
in 2014$ 447.1m
IndividualsRemainder of total
cost in 2020$ 884.5m
Scaling up individuals’OOP spending to meet
2020 costs requiresan additional $ 238m
Public sectorContribution in 2014 $ 374.7m
46%54%
36%
64%
30%
70%
46%54%
TABLE 76. COST BURDEN SHIFT IN 2020 IF PUBLIC SECTOR SPENDING STALLS AT 2014 LEVELS
69 FP2020 FOCUS COUNTRIES: SCENARIO B
Scenario B
Total cost in 2020 $ 1,259,000,000
Public Sector Individuals
Contribution at 2014 level $ 374,700,000 $ 447,100,000
Scaled increase to meet 2020 costs - $ 238,000,000
Remainder of 2020 costs - $ 199,400,000
Total contribution to cost in 2020 $ 374,700,000 $ 884,500,000

77GLOBAL CONTRACEPTIVE COMMODITY GAP ANALYSIS 2016
Conclusion
In 2001, the working group that would soon become the Reproductive Health Supplies Coalition published the landmark report Contraceptive Projections and the Donor Gap. The report foresaw that the demand for modern methods of contraception would increasingly outstrip the available funding for supplies, and called on donors to increase their support by 5.3% annually. The concept of a “donor gap” and findings from the report became linchpins of advocacy on behalf of contraceptive supply security.
The updated Contraceptive Projections and the Donor Gap report, published in 2009, revealed that the global community’s efforts in the intervening years were a success: the availability of contraceptive supplies had largely kept pace with demand. The 2009 report also warned that this demand would continue to grow, making further increases in funding a necessity.
RHSC’s Global Contraceptive Commodity Gap Analysis 2016 (CGA-2016) builds on the success of these earlier reports. Like its predecessors, it quantifies the gap between the amount spent on contraceptive supplies at the most recent measurable level and the amount of funding that will be needed in the future to meet increasing levels of demand. It also goes beyond the remit of the earlier reports in several key respects.
SECTION 6

78GLOBAL CONTRACEPTIVE COMMODITY GAP ANALYSIS 2016
Bridging gaps in understanding
As we conducted our stakeholder consultation and convened technical experts to discuss the various information needs the CGA-2016 might fill, we realized we needed to undertake two distinct but equally important tasks. The first task was to update the work of the previous RHSC gap analyses by producing a new set of estimates. The second task was to understand and negotiate the particular ways different stakeholder constituencies conceptualize a “gap.”
Some donors, for example, told us they want to know the “gap” between the amount currently spent on supplies and the cost of the supplies needed to meet the aspirational goal of increasing contraceptive use among all women; other donors want to know the “gap” between current spending and the cost of supplies at relatively conservative projected levels of use. Donors also want to know the “gap” between current spending and the projected cost of the supplies that will be required by public sector health systems in priority countries, as well as the “gap” between current spending and the projected amounts that will be requested by priority country governments for public sector procurement of supplies. Producing estimates that respond to each of these needs requires different analyses and a range of data sources and methodologies.
We learned that innovator manufacturers are often less interested in user or systemic demand than they are in what government and institutional procurers will order over the
next two to three years. Generic manufacturers often want to know the projected growth in demand for particular contraceptive methods for entire markets. Technical experts want to know if significant changes in demand for a particular method are occurring, and advocates want to know the cost of achieving goals (and whether donors, governments, and institutions are keeping their spending commitments).
By engaging the community of RHSC members, we learned that even deceptively simple terms like “demand” and “consumption” mean very different things in different contexts. In the context of political goals and demographic analysis, “demand” refers to the desire of individual women and girls to use modern contraception (regardless of which sector provides the supplies). In the context of institutional procurement and donor funding for supplies, “demand” refers to the volume of supplies a government needs to purchase for the public sector health system. “Consumption” may refer to the quantity of supplies dispensed to an individual client or the volume shipped to a government for distribution though the public sector health system.
Ultimately, the experts involved in producing the CGA-2016 had to agree upon a common lexicon to distinguish between the volume of supplies consumed by individual users, the volume of supplies requested by a government as part of its supply plan, and the volume of supplies ultimately procured and shipped to a country.
Transparency: an improving trend
RHSC used its strength as a global convening platform to bring experts together for frank discussions of the strengths and limitations of different data sources and methodologies. Transparency on the part of Avenir Health and the UN Population Division (on contraceptive use), the Guttmacher Institute (on commodity pricing), and UNFPA and NIDI (on spending by donors, NGOs, and governments) made it possible to blend data and sequence methodologies in order to produce a coherent over-arching analysis.
Greater transparency is a priority area for the next iteration of the CGA. Many quantification reports and procurement plans are not publically available. While quantification reports arguably provide the best estimates of what countries plan to procure in the immediate future, they are not always
shareable without government permission. As a result, the team from CHAI and JSI that produced the CGA procurement analysis was able to share only aggregate outputs from the 20 countries included.
In the next CGA, scheduled for publication in 2017, we hope to have greater visibility into country specific procurement plans. Such visibility is not only useful to assess potential funding gaps, it is the only way to assess the relative value of methodologies, since the accuracy of their predictions is, ultimately, an empirical question. As a community, we must be able to compare what countries eventually do order to what was predicted they would order. As long as the predictions remain obscured, the validity of the methodology remains a matter of faith, rather than evidence.

79GLOBAL CONTRACEPTIVE COMMODITY GAP ANALYSIS 2016
Moving forward
Along with a focus on improving the transparency and predictive value of our procurement analysis, the CGA-2017 will engage more technical experts and utilize additional data sources, particularly in regard to the private sector’s role in contraceptive supply security. More information is needed on contraceptives provided through employer-sponsored health services and health insurance schemes that cover contraceptive costs. We also need more refined data on contraceptive commodity prices at the commercial retail level. Better insight into these areas will help us more accurately estimate the amount of spending on contraceptive supplies contributed by individuals and corporations. This information, along with newly available data on public sector spending, will contribute to the updated spending analysis that will be part of the CGA-2017 report.
We also hope to develop a better understanding of the relationship between the quantity of supplies consumed by users of particular contraceptive methods and the quantity that must be procured at a systemic level to meet user demand. This is an important step towards closing the distance between our demographic and procurement analyses.
Since the completion of the CGA-2016 analysis, political changes have taken place in the United States that could have a profound impact on development assistance in general and funding for reproductive health in particular.
To estimate potential funding gaps in 2020, we considered only two possible spending scenarios: that spending on family planning supplies would hold steady at the absolute amount spent in 2014, or that each type of spender (donors, governments, and individuals) would fund the same respective share of the total cost that they did in 2014. We must now consider the very real possibility that donor funding for reproductive health will decrease. Should that happen, it could have a dramatic effect on the availability of family planning supplies and the number of women who can access contraception. Therefore, we must explore in a more nuanced way the implications of several new spending scenarios.
The CGA-2016 shows that individual women in the world’s lowest income countries spend more than donors and governments combined to purchase family planning supplies. The next iteration of the CGA will explore the ramifications of funding cuts by including a scenario in which there is an absolute decline in the amount of funding available for contraceptive supplies. If the global reproductive health community is truly committed to expanding access to contraception to those least able to afford it, we must step up as never before to ensure sufficient resources are available.

80GLOBAL CONTRACEPTIVE COMMODITY GAP ANALYSIS 2016
Notes on Methodologies and Data Sources
SECTION 7

81GLOBAL CONTRACEPTIVE COMMODITY GAP ANALYSIS 2016
Spending on Contraceptive Supplies
Provided by: Michelle Weinberger and John Stover, Avenir Health
Calculating the total amount spent on contraceptive commodities in 2014
› UNFPA Supplies was the source for the amount spent by donors and NGOs. The amount attributed to male condoms was adjusted to remove the amount dedicated to condoms used for HIV prevention (30% of the total were assumed to be for contraception). This information was available for 116 countries.
› The Contraceptive Security (CS) Indicators database was used as the source for government spending (internal) and for some donor spending (e.g. World Bank loans, basket funding used to purchase contraceptive supplies). This information was available for 49 countries (note: in some countries available data showed $0 in spending).
› NIDI data was used to determine the amount spent on commodities by donors, governments, NGOs, and corporations. Amounts were also adjusted to remove spending on condoms for HIV prevention (30% of condoms were assumed to be for contraception). This information was used for 46 countries (note: if CS Indicator data was available, this was used instead of NIDI estimates for the amount spent by governments).
› Private sector costs were calculated as follows:
› DHS data on source by method (for countries without data, regional averages were used) were used to calculate the volume of commodities consumed in 2014 that would have come via the private sector for each method.
› Next, the country specific unit prices (see below) were used to monetize these commodities. This was done using the prices data from Adding It Up, though these largely reflect the public sector. However, monetizing all commodities at a single cost per country allows for easy comparison. The actual expenditure may have been higher or lower, depending on actual costs incurred in the private sector.

82GLOBAL CONTRACEPTIVE COMMODITY GAP ANALYSIS 2016
Generating Scenarios A and B
Provided by: Michelle Weinberger and John Ross, Avenir Health
Generating Scenarios A and B
Scenario A was calculated for each country, using mCPR trends as follows:
› For FP2020 countries: Scenario A uses the mCPR trends projected to 2020 in line with the 2016 FP2020 Progress Report. These trends are based on the medium variant produced by the FPET model.
› For non-FP2020 countries: Scenario A uses the medium variant of mCPR (married) from UNPD’s model-based estimates. The married mCPR was converted to an all-women mCPR using a ratio from a country survey (when available), a regional ratio, or in some cases an assumption of no unmarried use (when the regional ratio was not appropriate).
› Calculation of users by method, commodities, and costs follow the approach shown in the figure on the following page.
Scenario B was calculated on the aggregate, not by country, as follows:
› For FP2020 countries: The total number of users needed in 2020 was calculated by adding 120 million to the baseline 2012 modern contraceptive user number; these users were then distributed by method using the average annual method mix calculated for the 69 countries. Finally, commodities and commodity costs were calculated using the average annual commodities per user, and cost per commodity by method calculated for the 69 countries. Since we do not know the distribution of additional users that would exist in each country if the “120m by 2020” goal was met, it was assumed that results would be proportional to what would happen if all countries saw very rapid growth.
› For non FP2020 countries: It was assumed there would be some ripple effect in the 66 remaining countries of the 135 LMI country set. If the 69 countries experienced acceleration in line with reaching the “120m x 2020” goal, it is possible that the remaining countries would also experience acceleration due to a “demonstration effect,” and/or the potential wider availability of commodities due to increased production and potential price reductions. However, given that these countries are less of a focus for the global family planning community, it was assumed that the ‘acceleration’ effect would be only half of that experienced in the FP2020 countries. Users by method, commodities, and costs were calculated as described above.

83GLOBAL CONTRACEPTIVE COMMODITY GAP ANALYSIS 2016
GENERAL APPROACH TO CALCULATING SCENARIO A(repeated each year then summed)
MCPR (MW)
MARRIED USERS
MARRIED USERS BY METHOD
TOTAL USERS BY METHOD
COMMODITIES BY METHOD
COST BY METHOD (AND TOTAL COST)
UNMARRIED USERS BY METHOD
UNMARRIED USERS TOTAL USERS
MCPR (AW)
For Scenario A: For FP2020 countries: both married and all-women (AW) mCPR
came from calculations of Core Indicator 2.
For non-FP2020 countries: married mCPR came from UNPD model-based estimates, and was converted into all-women mCPR using: (1) ratio from survey, (2) sub-regional ratio, (3) assuming no
unmarried use (if regional ratio cannot be applied). mCPR x MWRA
Annual method mixes (for married and unmarried) modeled for each year 2016-2020 based on country data and regional patterns in change.
Results presented in CGA, by year – totals for the 135 and 69 country sets.
mCPR x WRA
Projecting shifts in method mix
For the purposes of the CGA, we recognized that it was not only important to project future scenarios for the total number of modern contraceptive users, but also to project potential shifts to the methods these women will use. This is important because shifts in method mix have implications for both future commodity needs and total costs. For the purposes of this analysis, the same underlying changes in method mix were used across both scenarios.
› Baseline method mixes were established for each country, for married and unmarried users separately:
› For the married method mix, at least one survey with the married method mix was available for all countries in the analysis; the most recently available estimate were used. These were largely taken from UNPD’s World Contraceptive Use 2016 wall chart25; however, some data was updated to reflect newly available surveys.

84GLOBAL CONTRACEPTIVE COMMODITY GAP ANALYSIS 2016
› For the unmarried method mix, data was limited to DHS surveys, from which 59 countries had survey data available. For the remaining countries, the median method mix from the available data was used, split by SSA and non-SSA countries (there was not enough data to produce regional estimates).
› Method mixes were then projected forward, first from the date of the latest survey to 2014 (the baseline year for this analysis). They were then projected for each year from 2014 to 2016.
› For the married method mix, sub-regional annual changes in method mix were calculated from the last two surveys available in each country. The annual changes were applied to the previous year’s method mix, with some rules applied: for example, method use was not allowed to decline to zero.
› For the unmarried method mix, due to the more limited data available, average annual changes were calculated for just two sub-areas: SSA and non-SSA, to reflect different patterns of use and change seen in these geographies. The average annual changes were applied to the previous year’s method mix, applying the same rules used for married women.
Calculating commodities needed by users
Short-term methods: The number of commodities required per method type is based on estimates used in Adding It Up, which calculates the number of commodities needed per user per year. This is slightly lower than the CYP factor, because the CYP factor does not account for method failure.
For injectables, since each type of injectable has a different conversion factor, a weighted factor was created for each country using country-specific data on the volume of each type of injectable that was procured, again, based on analysis for Adding It Up. (Note: the factors used for other modern methods are not from Adding It Up. This was a calculated weighted average, assuming a mix of female condoms, other coital based methods, and diaphragms).
Long-acting methods: For implants and IUDs, calculations need to account for the fact that some women who received their method in a previous year will still be using the method. To better account for the potential of rapid scale up of methods, IUD and implant commodities were calculated as follows:
› Increase in users from previous year = 1 commodity/service each
› Remaining users= multiply by conversion factor to calculate resupply needed
› For each country, a country specific conversion factor was created, based on data from Adding It Up on the mix of types of IUDs and implants procured in each country. The factors are a weighted average of the CYP factors for each type of IUD (copper-T, IUS), and each type of implant (3,4, or 5 year) used in the country.
For sterilization, the total number of users was divided by the CYP factor (10 globally, 13 for Bangladesh, India and Pakistan) to estimate the total number of sterilizations that would happen in each year. The ‘commodity’ associated with this is a sterilization kit.
COMMODITY UNITS NEEDED PER USER
Condoms 77
Pills 14
Injectables: 1 mo 13
Injectables: 2 mo 6
Injectables: 3 mo 4
Emergency contraception 14
Other modern methods 24
Supply all additional users of the method
Resupply a portion of the baseline user number (based on conversion factor)
2016 2017
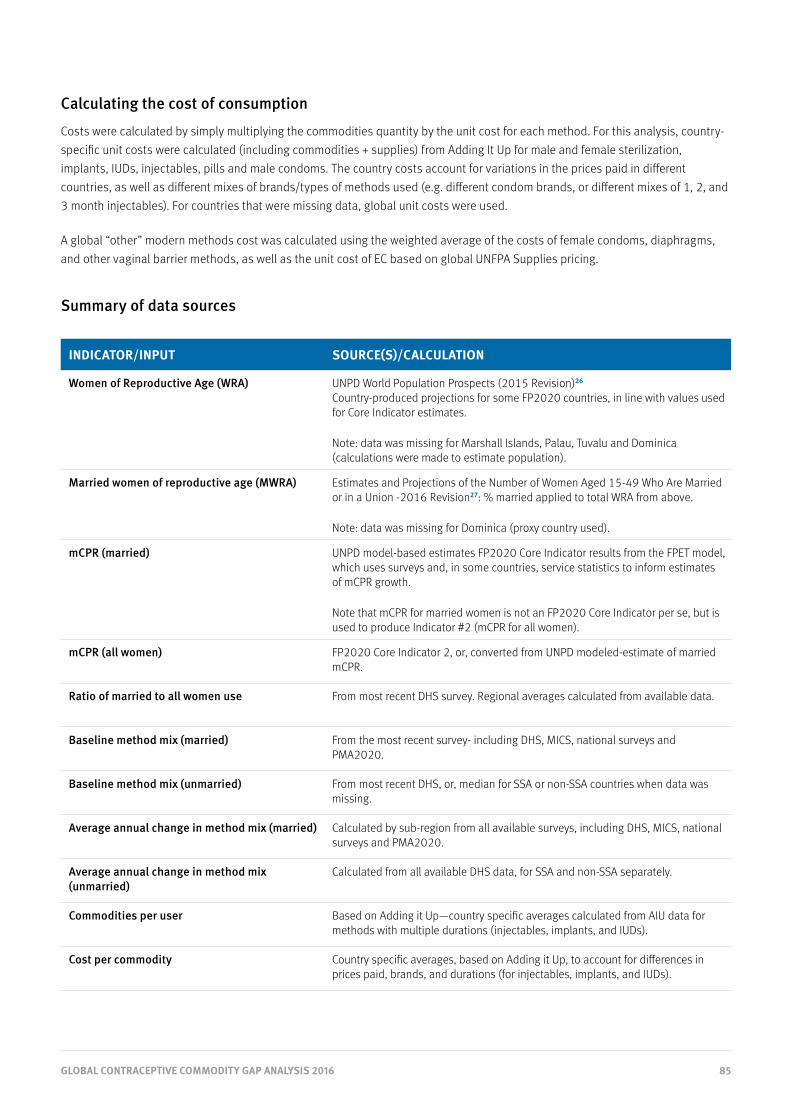
85GLOBAL CONTRACEPTIVE COMMODITY GAP ANALYSIS 2016
Calculating the cost of consumption
Costs were calculated by simply multiplying the commodities quantity by the unit cost for each method. For this analysis, country-specific unit costs were calculated (including commodities + supplies) from Adding It Up for male and female sterilization, implants, IUDs, injectables, pills and male condoms. The country costs account for variations in the prices paid in different countries, as well as different mixes of brands/types of methods used (e.g. different condom brands, or different mixes of 1, 2, and 3 month injectables). For countries that were missing data, global unit costs were used.
A global “other” modern methods cost was calculated using the weighted average of the costs of female condoms, diaphragms, and other vaginal barrier methods, as well as the unit cost of EC based on global UNFPA Supplies pricing.
Summary of data sources
INDICATOR/INPUT SOURCE(S)/CALCULATION
Women of Reproductive Age (WRA) UNPD World Population Prospects (2015 Revision)26
Country-produced projections for some FP2020 countries, in line with values used for Core Indicator estimates.
Note: data was missing for Marshall Islands, Palau, Tuvalu and Dominica (calculations were made to estimate population).
Married women of reproductive age (MWRA) Estimates and Projections of the Number of Women Aged 15-49 Who Are Married or in a Union -2016 Revision27: % married applied to total WRA from above.
Note: data was missing for Dominica (proxy country used).
mCPR (married) UNPD model-based estimates FP2020 Core Indicator results from the FPET model, which uses surveys and, in some countries, service statistics to inform estimates of mCPR growth.
Note that mCPR for married women is not an FP2020 Core Indicator per se, but is used to produce Indicator #2 (mCPR for all women).
mCPR (all women) FP2020 Core Indicator 2, or, converted from UNPD modeled-estimate of married mCPR.
Ratio of married to all women use From most recent DHS survey. Regional averages calculated from available data.
Baseline method mix (married) From the most recent survey- including DHS, MICS, national surveys and PMA2020.
Baseline method mix (unmarried) From most recent DHS, or, median for SSA or non-SSA countries when data was missing.
Average annual change in method mix (married) Calculated by sub-region from all available surveys, including DHS, MICS, national surveys and PMA2020.
Average annual change in method mix (unmarried)
Calculated from all available DHS data, for SSA and non-SSA separately.
Commodities per user Based on Adding it Up—country specific averages calculated from AIU data for methods with multiple durations (injectables, implants, and IUDs).
Cost per commodity Country specific averages, based on Adding it Up, to account for differences in prices paid, brands, and durations (for injectables, implants, and IUDs).

86GLOBAL CONTRACEPTIVE COMMODITY GAP ANALYSIS 2016
Public Sector Procurement Projections for 20 Countries
Provided by: Mindy Scibilia (CHAI), Alexis Heaton (JSI), Maggie Murphy (JSI)
Data Collection and Vetting
Given that country quantification results may not be well disseminated and may not be harmonized across countries, the CHAI and JSI team determined that to provide estimates for the period of 2016-2020, they would first need to collect and harmonize existing country quantification reports and then make assumptions, as needed, to extend the results forward to 2020. The CHAI-JSI team gathered available country quantification reports/documentation and supply planning databases (PipeLine) in a central location. The CHAI-JSI team then created a Microsoft Excel database to collect and organize the data. The table below provides a summary of some of the key contextual data points collected for each country in the database. The data collected represents the public sector needs in 100% of the countries, but only includes the non-governmental organization (NGO) sector in 40% of the countries, and the social marketing organization (SMO) sector in 15% of the countries. The private sector needs are not included in the data used for this analysis.
The team reviewed the information available for each country and used the following inclusion criteria to determine which countries and programs could be included in the analysis without additional follow-up:
› Availability of at least two years of forecast consumption data, one of which needs to be 2016.
› Stock on hand information as of the date of the quantification and a summary of procurement quantities for the period of the country supply plan. The team preferred to use the stock on hand as of the end date of the country supply plan if available.
› Maximum and minimum inventory control system parameters for each program.
If an existing country report did not meet the above criteria, then the report was excluded from the analysis. If a country report included several programs, but the above data points were not available for all programs, then the analysis only includes those programs for which all data points are available. The above inclusion criteria allowed the team to use a consistent and focused approach to the analysis; however it is important to work to expand the number of countries that can be included in the future. In order to do so, the team recommends working with key stakeholders to communicate with country-level stakeholders around standardizing and harmonizing the data points that are included in quantification reports/documentation.
Steps and Assumptions to Calculate Results
The team built a Microsoft Excel template to produce country-specific and aggregated results. The team used a four-step process to produce the final results of the analysis.
1. Forecast consumption (dispensed to user quantities): Use the existing country consumption forecast for each product to estimate the annual consumption through 2020. If the country did not forecast through 2020, then apply a linear trend to the existing forecast to estimate the annual consumption to 2020. For newly introduced products with large variations in annual consumption, products with exceptionally high percent growth over time, or for products with a negative consumption trend that was not anticipated to continue, the linear trend was adjusted to be a stable trend.
2. Determine the quantities of each product needed: Use the country procurement needs to estimate product-specific procurement volumes through 2020. If the country did not supply plan through 2020, the team created a supply plan from the date that the country supply plan ended (for example December 31, 2017) through December 31, 2020. The following country-specific parameters were used to supply plan forward: the consumption forecast, the stock on hand (actual or theoretical), and the maximum and minimum stock levels for each product.
87GLOBAL CONTRACEPTIVE COMMODITY GAP ANALYSIS 2016
3. Determine the cost of procurement for each product: Use the estimated procurement quantities, the USAID and UNFPA average unit cost for each product, and an estimated percentage of the cost for freight, to estimate the cost of procurement for each product. An average of the USAID and UNFPA unit costs for each product was used to harmonize the cost inputs and because these are the two major donors of contraceptives to the countries included in the analysis. The country-specific freight estimate was used when available and when not available an estimate of 12% was used as a default. Twelve percent freight cost is the mode for the countries for which we have this data point.
4. Determine the cost of supplies associated with each method: Use the estimated procurement quantities, the USAID and UNFPA average unit cost for each product, and the estimated cost of supplies required for provision of implants, IUDs, and injectables per the “Adding it Up”estimates from 2014.
5. Aggregate the country and program-specific results for an overall estimate for the group of countries: Aggregate the individual product consumption estimates, procurement quantities, and costs by method for all countries for the following methods: Implants, Injectables, IUDs, Emergency Contraceptive Pills, Female Condoms, Male Condoms, Oral Pills, Standard Days Method. Present cost outputs in three tables: Procurement-Commodity Costs, Procurement-Commodity and Freight Costs, Procurement-Commodity and Supplies Costs. Provide aggregated results for the group of 20 countries as well as results for the 11 Global Financing Facility (GFF) countries.
Notes about Data Collection and Vetting Process
The team did not review the quantification reports to assess the quality of the methodology used or to validate the final results. The team used the final country forecast and procurement quantities, since the country’s final agreed-upon forecast and procurement quantities represent what the country is planning to procure in the short term. In order to ensure that our analysis aligned as much as possible with the country-level estimates, the team only made adjustment/assumptions during the supply planning step of the process if needed to complete this step (step 2 above). A thorough assessment and review of the methodology used by each country and validation of the results would require more long-term support to country stakeholders involved in the quantification process.
Challenges with Using Country Quantification Report Data
There are several challenges with using this type of data to create consistent results across countries. The key challenges are:
› Lack of consistency in the format and information included in the quantification reports/documentation across countries.
› Types of data used for forecasting and the approach used to determine the final forecast were not always clearly detailed.
› Lack of clarity in the quantification report/documentation on what sectors are included in the public sector forecast, especially for countries where the NGOs are being heavily supplied by the public sector warehouses.
› Differences across countries in the number of years their consumption forecast covers and the number of years for which they created a supply plan. It is recommended that each country forecast consumption and supply plan for the next 24 months, but countries may have specific requirements/needs given internal budgeting cycles and program planning calendars.
› As stated above, the primary purpose of this exercise was to project procurement needs using country quantification results and not to validate how countries determined their procurement needs; however it was observed that some countries are not consistently following forecasting and supply planning best practices.

88GLOBAL CONTRACEPTIVE COMMODITY GAP ANALYSIS 2016
Key Considerations when Interpreting the Results
The estimates derived from the country quantification reports provide a reasonably good estimate of the funding that will be needed to procure family planning products for these 20 countries for the next four years at current consumption trends; however there are several caveats to consider.
› The results of the analysis are reflective of a specific point in time and are not meant to be interpreted as exact figures. The results represent an estimate of the procurement volumes and costs based on the most recent information available for each country; however countries are and should regularly update their consumption forecast and supply plans.
› The primary purpose of the country quantification process is to determine the procurement needs in the next 12-24 month period, and supply plans for a longer period are not intended to be used for procurement. The actual country-specific procurement needs through 2020 could change significantly based on actual consumption, new program plans that change forecast assumptions, changes in user preferences, introduction of new products, changes to inventory control parameters, procurement gaps in 2015/2016 leading to larger quantities needing to be procured in 2017 to fill the supply pipeline, etc.
› The cost estimates are based on an average UNFPA and USAID unit cost for each product and an estimate of freight costs was consistently added to each country. At the country-level, countries may be using different unit costs and may not be consistently taking into account freight costs in their cost estimates. Therefore, even though we used the actual commodity procurement estimates from country reports when available, our cost assumptions may not align exactly with the assumptions made in each country.
For the above reasons, the results are presented in country groups and not at the individual country level. Our recommendation is to consult the relevant in-country stakeholders as needed to get detailed country-specific procurement estimates.
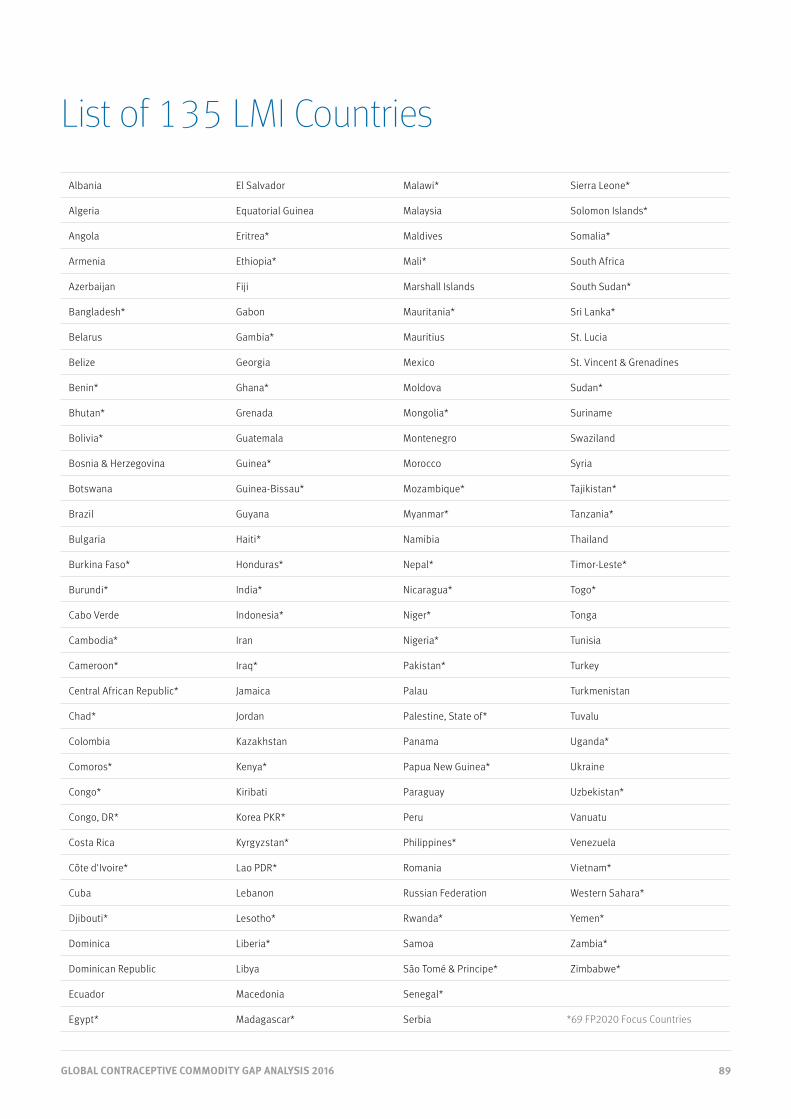
89GLOBAL CONTRACEPTIVE COMMODITY GAP ANALYSIS 2016
List of 135 LMI Countries
Albania El Salvador Malawi* Sierra Leone*
Algeria Equatorial Guinea Malaysia Solomon Islands*
Angola Eritrea* Maldives Somalia*
Armenia Ethiopia* Mali* South Africa
Azerbaijan Fiji Marshall Islands South Sudan*
Bangladesh* Gabon Mauritania* Sri Lanka*
Belarus Gambia* Mauritius St. Lucia
Belize Georgia Mexico St. Vincent & Grenadines
Benin* Ghana* Moldova Sudan*
Bhutan* Grenada Mongolia* Suriname
Bolivia* Guatemala Montenegro Swaziland
Bosnia & Herzegovina Guinea* Morocco Syria
Botswana Guinea-Bissau* Mozambique* Tajikistan*
Brazil Guyana Myanmar* Tanzania*
Bulgaria Haiti* Namibia Thailand
Burkina Faso* Honduras* Nepal* Timor-Leste*
Burundi* India* Nicaragua* Togo*
Cabo Verde Indonesia* Niger* Tonga
Cambodia* Iran Nigeria* Tunisia
Cameroon* Iraq* Pakistan* Turkey
Central African Republic* Jamaica Palau Turkmenistan
Chad* Jordan Palestine, State of* Tuvalu
Colombia Kazakhstan Panama Uganda*
Comoros* Kenya* Papua New Guinea* Ukraine
Congo* Kiribati Paraguay Uzbekistan*
Congo, DR* Korea PKR* Peru Vanuatu
Costa Rica Kyrgyzstan* Philippines* Venezuela
Côte d'Ivoire* Lao PDR* Romania Vietnam*
Cuba Lebanon Russian Federation Western Sahara*
Djibouti* Lesotho* Rwanda* Yemen*
Dominica Liberia* Samoa Zambia*
Dominican Republic Libya São Tomé & Principe* Zimbabwe*
Ecuador Macedonia Senegal*
Egypt* Madagascar* Serbia
*69 FP2020 Focus Countries
90GLOBAL CONTRACEPTIVE COMMODITY GAP ANALYSIS 2016
Endnotes1. See www.familyplanning2020.org for more information. FP2020 had 93 commitments as of November 2016.
2. See www.Track20.org for more information.
3. The Family Planning Estimation Tool (FPET) was designed to produce annual estimates of the contraceptive prevalence rate (CPR) and other indicators using statistical modeling that incorporates survey data and service statistics. For more information, see Technical Brief: Family Planning Estimation Tool at https//goo.gl/OKOim2.
4. United Nations, Department of Economic and Social Affairs, Population Division (2016). Model-Based Estimates and Projections of Family Planning Indictors 2016. New York: United Nations.
5. Jacqueline E. Darroch, Singh S., Weissman E. Adding it Up: The Costs and Benefits of Investing in Sexual and Reproductive Health in 2014 – Estimation Methodology. Guttmacher Institute, 2016.
6. See www.UNFPA.org for more information.
7. See www.NIDI.nl for more information.
8. See www.AvenirHealth.org for more information.
9. See www.ClintonHealthAccess.org for more information.
10. See www.JSI.com for more information.
11. All figures have been rounded to the nearest hundred-thousandth. Percentages may not add up to 100 due to rounding.
12. 135 countries categorized as low-income or middle-income by the World Bank as of July 2016. China, which the World Bank categorizes as middle-income, is not included in the scope of our analysis. The 135 LMI countries are shown on page # of this report.
13. The 69 FP2020 focus countries are shown on page 88 of this report.
14. The 20 countries included in the procurement analysis are Bangladesh, Burkina Faso, Cameroon, Cote d’Ivoire, Democratic Republic of Congo, Ethiopia, Ghana, Kenya, Lao PDR, Liberia, Malawi, Mauritania, Mozambique, Niger, Nigeria, Rwanda, Senegal, Tanzania, Togo, and Uganda.
15. Spending on contraceptive supplies in the year 2014 purchased the quantities that individual users consumed as well as additional quantities procured by institutional purchasers to keep public sector supply pipelines at optimal stock levels. Spending figures exclude the cost of freight.
16. Demographic and Health Surveys (DHS)
17. Multiple Indicator Cluster surveys (MICs)
18. See www.PMA2020.org for more information.

91GLOBAL CONTRACEPTIVE COMMODITY GAP ANALYSIS 2016
19. FP2020’s goal calls for 120 million additional users of contraception by the year 2020, compared to the number of users in 2012. 2012 is the year the London Summit on Family Planning, which launched the FP2020 initiative, took place.
20. See methodology on page 81
21. Jacqueline E. Darroch, Singh S., Weissman E. Adding it Up: The Costs and Benefits of Investing in Sexual and Reproductive Health in 2014. Guttmacher Institute, 2016
22. The figures $322 million and $541 million (for the 135 LMI countries) and $233 million and $437 million (for the 69 FP2020 focus countries) are the projected funding shortfalls for the year 2020 alone.
23. For more information on the InSupply Project, visit http://insupply.jsi.com.
24. The FP2020 goal is to increase the number of users of contraception by 120 million in the year 2020 (compared to the number of users of contraception in 2012) across 69 focus countries.
25. United Nations, Department of Economic and Social Affairs, Population Division (2016). World Contraceptive Use 2016 (POP/DB/CP/Rev2016).
26. United Nations, Department of Economic and Social Affairs, Population Division (2015). World Population Prospects: The 2015 Revision, Data Booklet. ST/ESA/SER.A/377
27. United Nations, Department of Economic and Social Affairs, Population Division (2016). Estimates and Projections of the Number of Women Aged 15-49 Who Are Married or in a Union: 2016 Revision. New York: United Nations.


The Reproductive Health Supplies Coalition
The Coalition is a global partnership of public, private, and non-governmental organizations dedicated to ensuring that everyone in low- and middle-income countries can access and use affordable, high-quality supplies for their better reproductive health. It brings together agencies and groups with critical roles in providing contraceptives and other reproductive health supplies. These include multilateral and bilateral organizations, private foundations, governments, civil society, and private sector representatives.
Rue Marie-Thérèse 211000 BrusselsBelgium
Tel: +32 2 210 0222Fax: +32 2 219 3363E-mail: [email protected]